1. Introduction
Complex networks can be defined as a set of elements called nodes that are interconnected with each other through links. The number of nodes is often too large, which makes the individual nature of each node and link somewhat complex. The meaning of both nodes and links can vary depending on the desired approach. Given this, the nodes of a complex network can be, for example, people, and the link between these people can be any situation where they have spoken to each other, or they can be dynamic systems with interconnections between them where the states of one system can influence those of the other system [
1,
2,
3,
4].
The intrinsic phenomena of complex networks, like the loss of connections, cannot be captured using fixed connections. The significance of dynamic complex networks lies in their practical relevance, as the interactions within these systems and their interconnected nodes are typically dynamic rather than static. There are interesting studies on complex networks with time-varying connections, especially [
5], in which the variations of the connections were considered bounds. Furthermore, in the study [
6], a complex network with variant connections was synchronized through impulse. However, both works are focused on continuous-time complex networks.
The interconnection of systems in our world occurs naturally. One example is the way that different lifeforms relate and interact with each other, matter itself is naturally interconnected, or even key aspects of modern life such as the internet are examples of these interconnections; this highlights the importance of studying complex networks, which have numerous valuable applications, including infectious disease modeling, autonomous vehicles, mobile robotics, and electric systems, among others [
1,
2,
3,
4].
As previously mentioned, nodes of a complex network can be described as systems with their own dynamics, and the network as a whole can also be viewed as a dynamic system. In control theory, the goal is for dynamic systems to have a desired behavior, and this is achieved through the design of controllers. There are many different types of algorithms to achieve this goal, some are developed using traditional methods based on mathematical models, while others are designed using modern methodologies such as those based on neural networks; the use of any particular methodology is based on the control design. A commonly used control algorithm for complex networks is PIN-type control, where only a limited number of nodes of the network are locally controlled. This type of control methodology is used since the alternative of controlling every single node locally can be impossible when dealing with a great number of nodes in a network or when controlling every node is deemed unnecessary. PIN-type control has been widely studied previously and has been improved by being combined with other control methodologies such as sliding mode control, inverse optimal control or neural networks. On the other hand, impulse control is a methodology that is not specific to complex networks where control signals are not applied continuously but rather in time instants defined by the application requirements. This type of control is well suited for the control of biomedical systems since treatment medication as well as vaccination schemes are typically administered in an impulse manner at determined time intervals [
1,
2,
3,
4].
Furthermore, infectious disease transmission is a complex phenomenon where numerous factors intervene such as the host and pathogen environment, exposed population, and population dynamics, among many other aspects [
7]. The goal of epidemiological mathematics is to model the implantation and expansion of pathogens in each population. The most frequently used model that describes the transmission of diseases by microparasites is the compartmental model where each individual of a closed community (where no immigration or emigration occurs) is classified into a compartment according to their health status in relation to the progression of the disease. In 1927, Kendrick and McCormick introduced the SIR model. Since then, numerous differential equation models have been analyzed and proposed that describe the spread of diseases caused by different infectious agents [
7]. Even though, as mentioned before, these types of compartmental models are used for closed communities, the reality is that the notion of closed or isolated communities is hard to imagine since we live in an interconnected world, both physically and digitally. In this context, this work considers personal interaction as a complex network where the interconnections are considered as the individuals that travel due to work, school, or any other everyday related activities that lead to the spread of infectious diseases under the complex network scheme. Also, every node in the network can represent an individual, a population, a country or even a continent. The previous statements reflect the current dynamics of infectious diseases in a globalized and increasingly globalized world. Furthermore, it is important to consider that the interconnections described previously are time-varying since the number of people and their travel habits vary; consequently, the connections of the complex network must be considered to be time-varying as well. It is also important to consider disturbances, uncertainties, and unmodeled dynamics that can be present in each node of the network that will undoubtedly modify the dynamics of each node [
7]. Although, in the case of infectious diseases, the trivial solution consists of providing treatment or vaccination for 100% of the population; in the scenario of an unexpected outbreak or an epidemic or pandemic scenario, such a solution becomes impossible. Therefore, in this work, a PIN-type control is proposed that determines which nodes are more relevant from a control standpoint without the need to introduce a control signal for every node, which in turn allows control over the evolution of infections in a fast and efficient manner. The mathematical analysis of this type of controller was presented in [
8] for the case of chaotic systems.
Recent research using complex networks to represent epidemiological models has proven that these techniques are highly precise when compared to classic methodologies. Some studies have introduced complex networks using an SIR model, and in some cases, they even consider vaccination schemes in the model. This article proposes use of the MSEIR model, where the disease spread occurs within a complex network, considering that the nodes represent interconnected populations. Control of the network is impulsive-type due to the proposed scheme where vaccines are applied every 120 days. The model is able to adapt to real-world data using an identifier designed with a neural network which improves its ability to predict the disease behavior [
8,
9,
10]. The proposed methodology requires a mathematical model of the complex network, which in turn requires a mathematical model of the node; in this case, the model is obtained through a neural identifier which is trained online using an extended Kalman filter that has proven to be an excellent training algorithm for neural identifiers. The use of this neural identifier allows for time variations in the interconnections of the network to be “compensated” for in addition to the unmodeled dynamics of each node, their parametric uncertainties, and their disturbances. In these types of environments, where real situations are represented, it is crucial to ensure that the generated output of the system is reliable in unexpected or nonlinear situations.
The main contribution of this work relies on designing a control law that does not require control in all the complex network nodes, as the proposed approach is not constrained to all nodes with the same dynamics. Moreover, the proposed methodology can deal with uncertainties in node dynamics due to the use of neural identifiers. Finally, the proposed methodology can be applied to complex networks with time-varying connections. To the best of our knowledge, there is no published work that can handle all these situations at the same time in the complex network literature.
This work is organized as follows: First, basic concepts in epidemiology and the MSEIR compartmental model are introduced along with a definition of each variable and parameter. An introduction is given to the basic concepts of complex networks as well as the use of a neural network for the dynamic modeling of each node in the complex network with the intent of considering uncertainties, disturbances, and unmodeled dynamics in the model. Next, the PIN-type control strategy is presented with the objective of reducing infection and controlling the spread of infectious diseases without the need to control all nodes in the network, allowing the spread of infectious diseases to be under control and making more efficient use of existing initial treatment or vaccination resources. Furthermore, simulation results are presented followed by an analysis of results and, lastly, the conclusions of this research work are presented.
2. MSEIR Model
Many different types of models have been used to capture infectious disease evolution, within a wide range of approaches. From the seminal paper [
11] compartment models have been adopted as a well-established methodology even when this kind of model suffers limitations about the kind of phenomena considered in compartment models linked to the fact that most of the mechanisms driving/influencing the progress of an epidemic are unknown. However, in order to show the applicability of the proposed scheme in this paper it is considered a compartmental model in order to obtain simulation results, considering that this network can be parametrized with real-world data from an epidemic scenario. In such cases, the use of the neural identifier is a beneficial methodology to consider all real-world phenomena that are not considered in compartmental models.
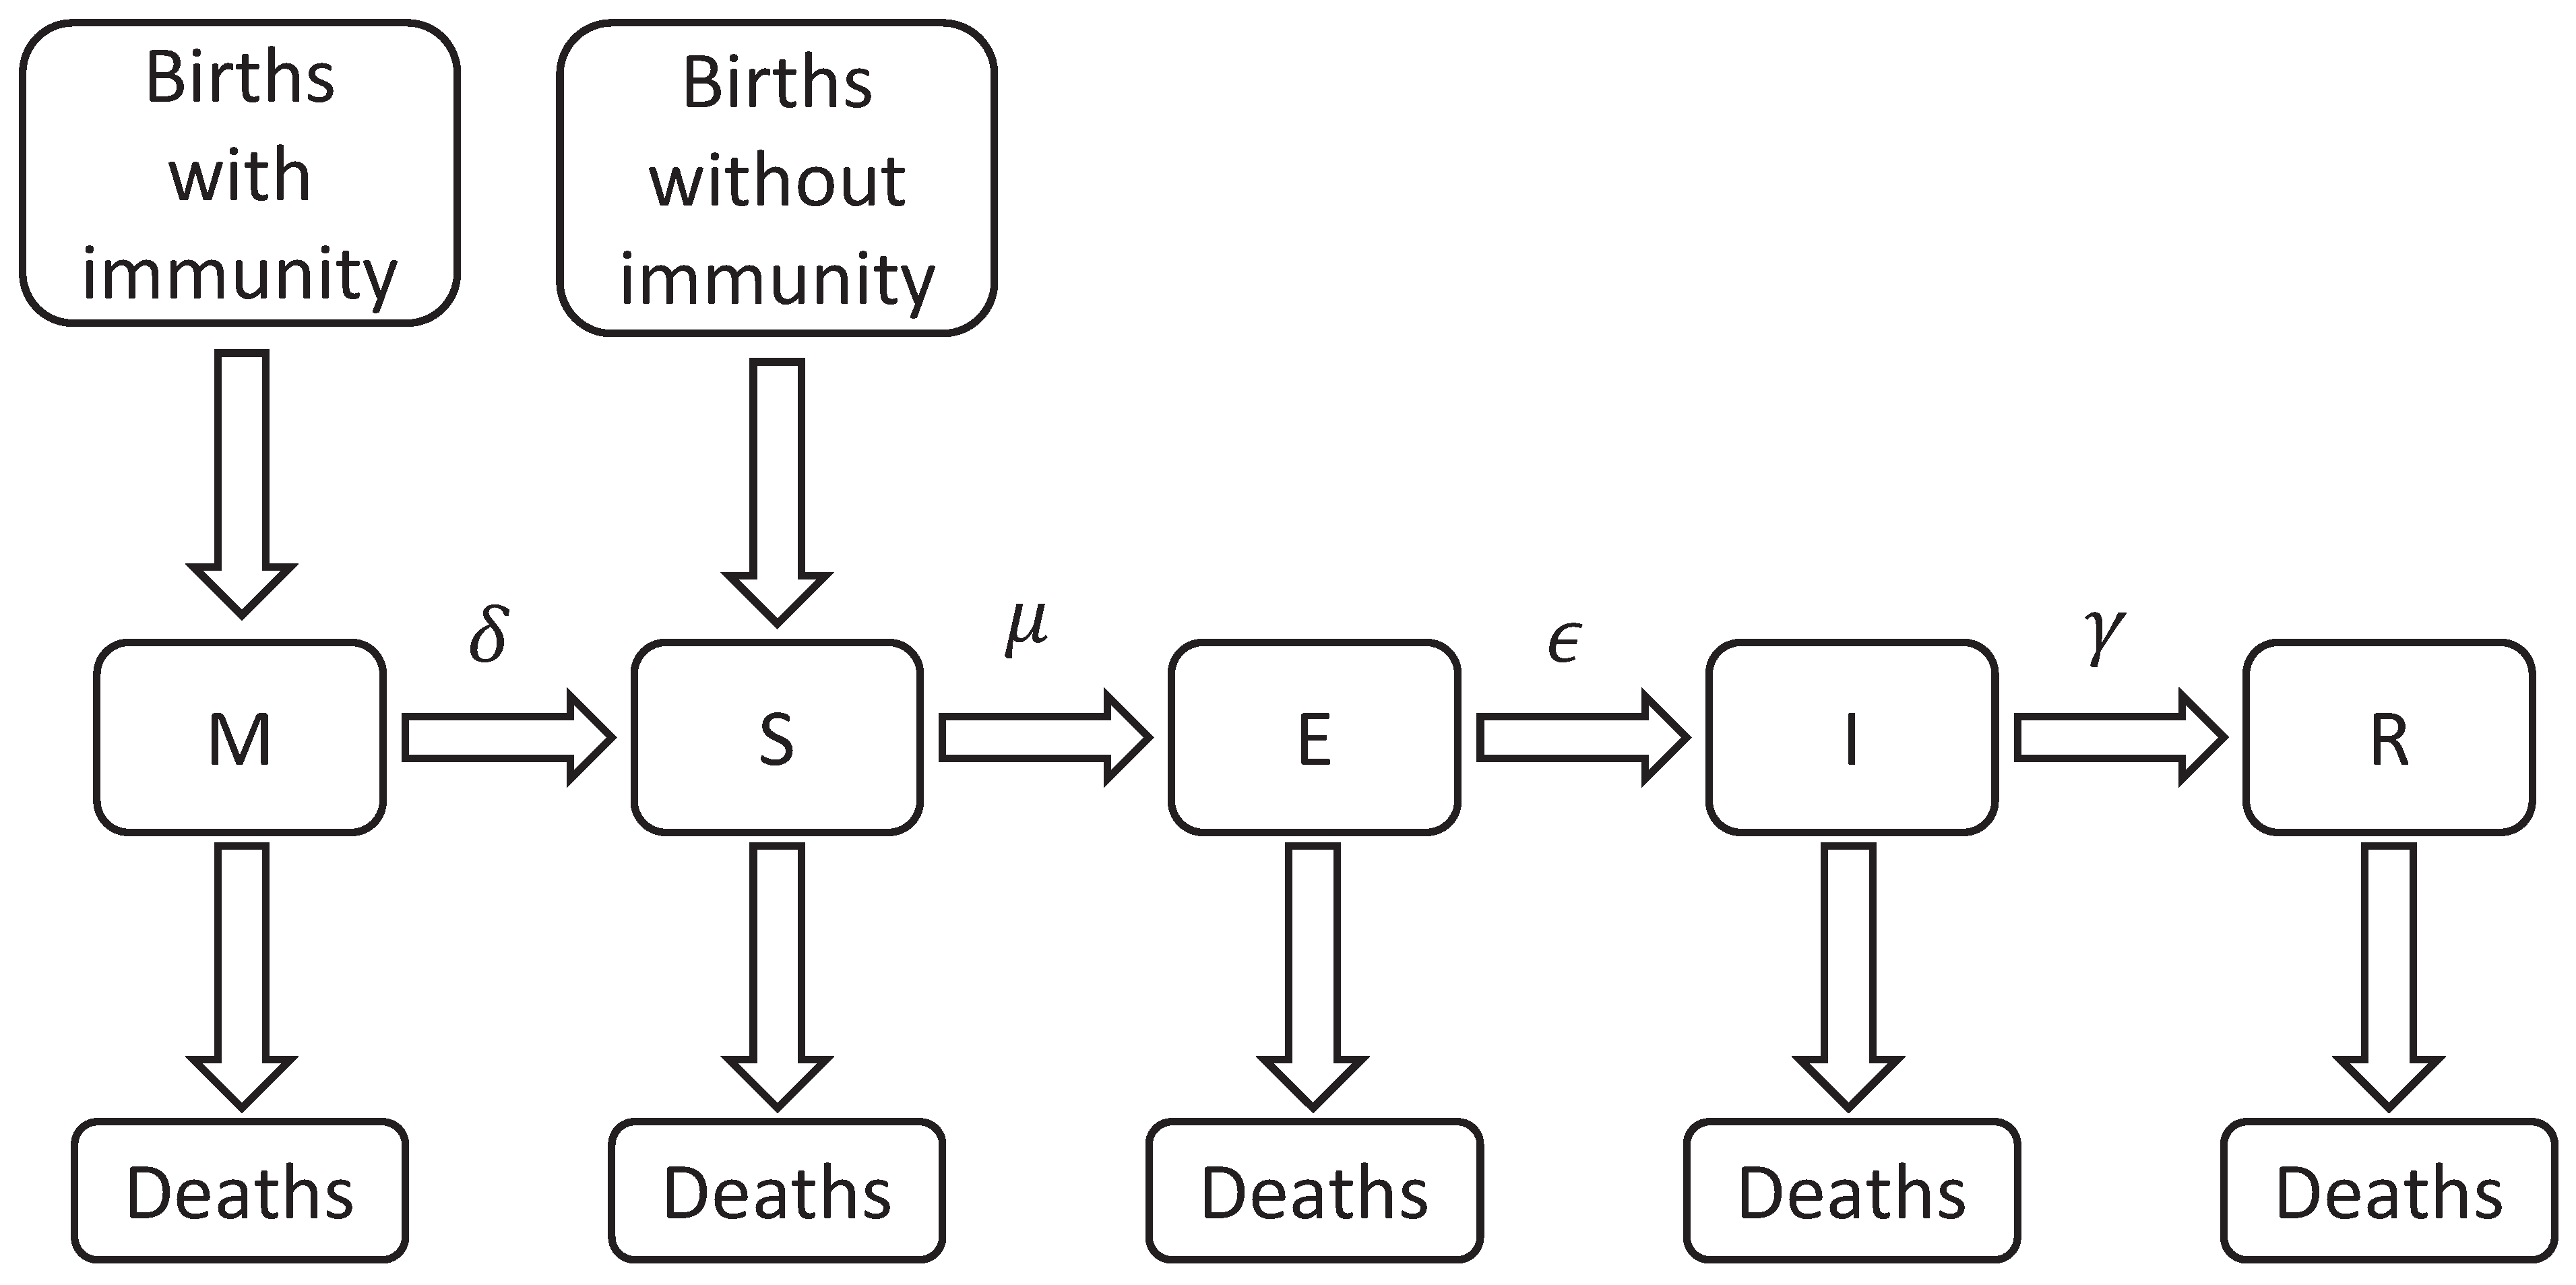
Compartmental models are generally composed of five compartments labeled with the letters
M,
S,
E,
I, and
R. The letter
M represents individuals with passive immunity, which is temporary for certain diseases and is acquired by newborns through antibodies transferred from the mother (
M). With the disappearance of these antibodies, the individuals move to the (
S) susceptible class. The compartment
S includes every individual that can be infected. When an individual from the
S class has adequate contact with an infected person (defined as any activity that results in the infection of the susceptible individual) it is moved to the (
E) exposed compartment. In this compartment, the individuals are in the latency phase, i.e., infected but still incapable of transmitting the disease. After this phase, the subject is moved to the (
I) infectious class and is now capable of infecting others. After this period, they are moved to the (
R) recovered compartment, becoming temporarily or permanently immune to the disease. Class
R also includes the individuals that die due to the disease itself [
7]. The acronyms used to refer to the different epidemiological models are based on flow patterns between the compartments: SI, SIS, SEI, SEIS, SIR, SIRS, SEIR, SEIRS, MSEIR, MSEIRS, etc.
In this work, it is assumed that a recovered individual gains lifelong immunity. The birth and death rates are represented by
b and are assumed to stay constant, keeping the total population (
) constant as well, this assumption is made only for academic proposes. The rate
increases the number of individuals in the susceptible class
S since newborns from susceptible mothers are also susceptible, these individuals are not a part of the
M class. Evidently, the remaining individuals fall into one of the other remaining classes where, as mentioned before, the class
M is where the passive immunity
individuals are located. The time it takes for individuals to transition between classes varies for each case, depending on their health conditions and individual life characteristics where
,
, and
represent the transfer out of
M,
S, and
E, respectively, and
is the rate of recovery from individuals in the infectious class
I as shown in
Figure 1.
According to [
12], the dynamic model of the compartmental system MSEIR is defined by the following set of ordinary differential equations
where, depending on the progression of the disease, time
t can be expressed in hours, days, weeks, months, or years. Furthermore, the value of each parameter of the model is defined by the type of infectious disease that is represented. Because of this, if we consider
, then it is possible to eliminate the equation for
S, considering
,
,
, and
, the following simplified model is obtained
Therefore, model (2) represents the dynamics of each node of the network, with its respective evolution and parameters. Now, the problem statement is presented:
4. Impulse PIN-Type Control
Epidemic diseases are a complex phenomenon in which numerous factors have effects, and due to their dynamic nature in terms of propagation, control theory methods are an area of science that provide us with interesting and useful alternatives for the distribution of vaccines or treatments. In these types of systems [
15], constant or impulsive controllers can be developed to control the spread of infectious diseases. For the case of constant control, vaccine application occurs in a constant period of time
, where 95% of the entire population needs to be vaccinated in order to fully eradicate the disease [
16], resulting in a high-cost solution. On the other hand, impulse control, as its name implies, applies a periodical vaccination to a portion p of the population for a very short period of time [
15,
16,
17,
18,
19], this is named as impulsive dynamical control [
13], modeled as follows:
In an impulse control scheme, control inputs are introduced at established time instances, where , is an open set with , , with , is continuous, is continuous and is the reset set with .
The dynamics of
are assumed to ensure that the solution of (8) is continuous with respect to both
t and
in time interval
. Equation (
8) is referred to as the continuous-time dynamic while (9) is the impulsive control law. The function
represents the solution of
subject to (8) and (9) for
with an initial value defined as
. Finally, the point
is the equilibrium of (8) and (9) if and only if
for all
and
. It should be noted that
is an equilibrium of (8) and (9) if and only if
and
.
where
and
are restricted to a class of admissible hybrid controls consisting of measurable functions such that
for all
and
,
,
,
with
,
in addition to
,
and
.
Then, the solution
of the closed-loop system (10) and (11) is globally asymptotically stable with the optimal hybrid feedback control law.
and (12), with
for
where
,
and
satisfying (10) and (11) for
,
.
Model (1) considers an impulsive controller (10) and (11) with state variables
M,
S,
E,
I, and
R with
and
, and a control law (13) and (14), as follows:
where
and
is in
to maintain a positive sign. Since the computed control is impulsive,
in (18) can be considered to be zero.
where
and
are the vaccination rates and treated individuals rates, respectively, at each recovery time
t for (19). Lastly, the control parameters are considered to be the following:
5. Numeric Results
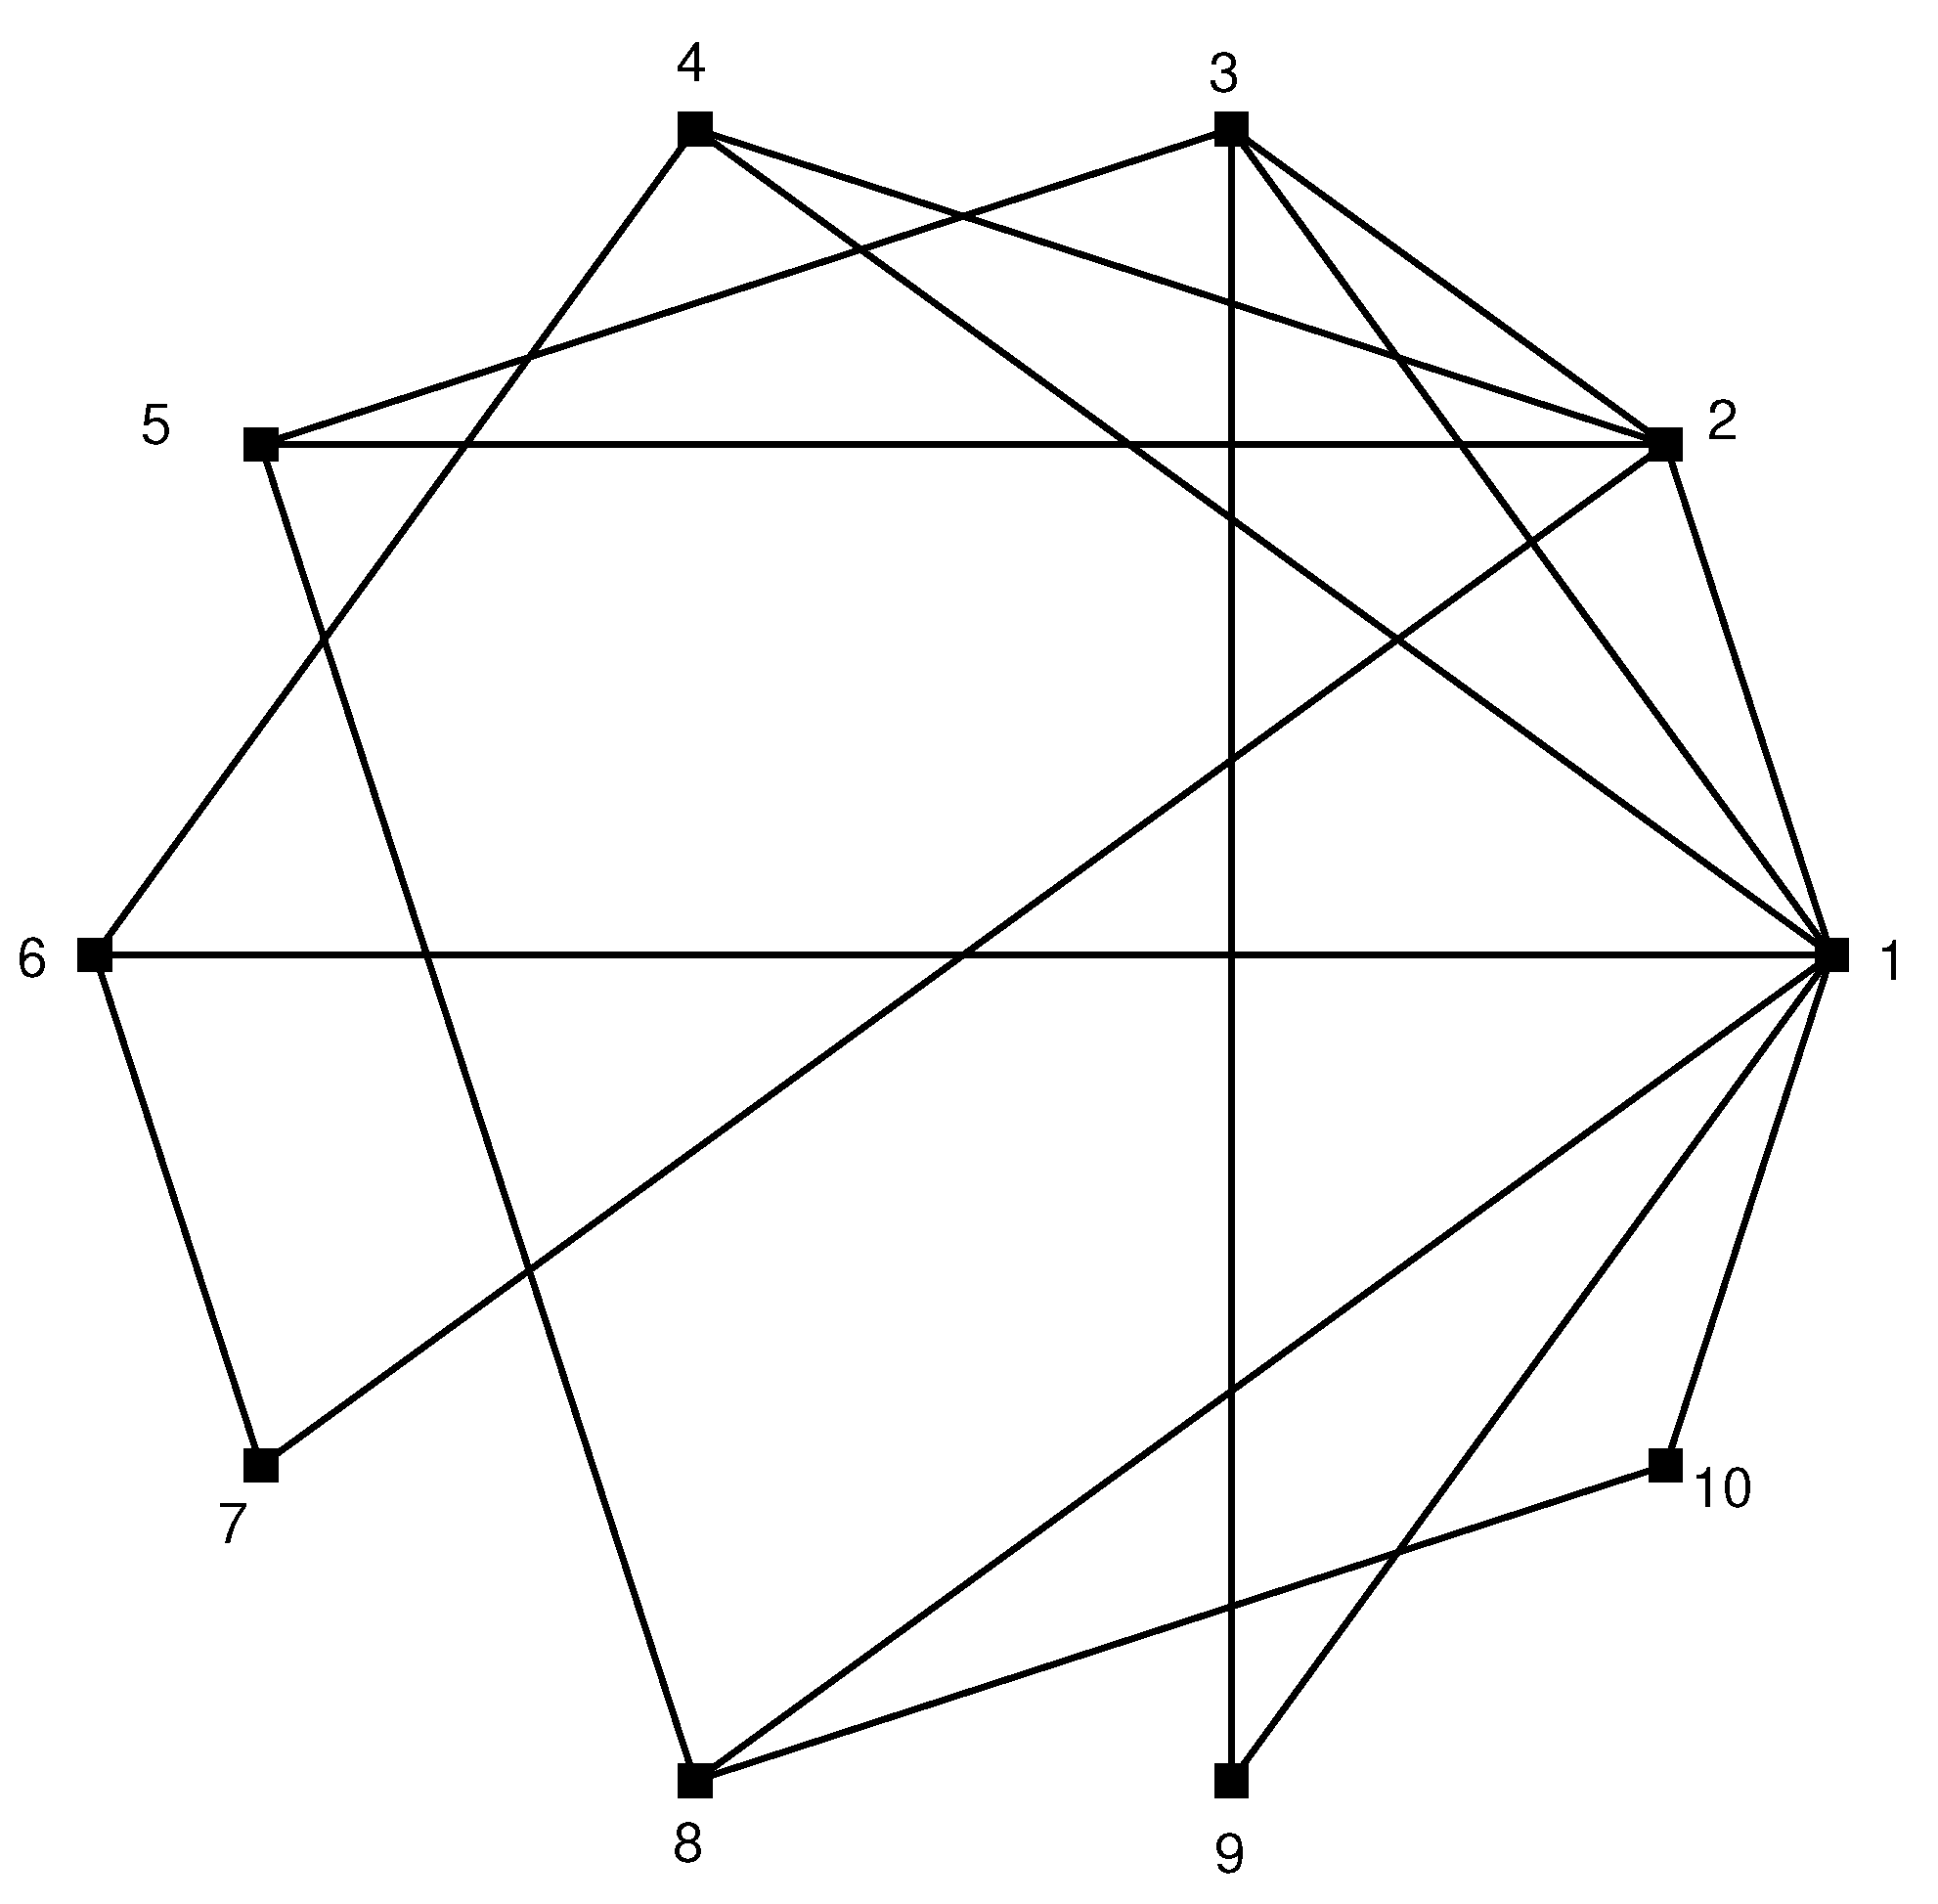
This section presents the simulation results for an epidemiological system using a complex network approach where each node represents a population whose dynamic evolutions are defined by the MSEIR model (2) with ten nodes and all nodes have a certain degree of connectivity as shown in
Figure 3; however, such connections are considered time-varying and are updated daily.
Results of the scheduled vaccination strategy are obtained using MATLAB©. An impulse controller is designed which is updated weekly based on expressions (19) and (20), starting on day 60 after the first infected individual and 365 days are simulated. The parameters for the controller are selected as
Matrix directly affects the vaccination strategy. and affect the node dynamics to be controlled by MSEIR. Simulations show that the dynamics of the MSEIR model are parameterized in the case of infection caused by the SARS COVID-19 virus. The parameters are selected as follows , , , and with the time unit given in days, considering a life expectancy of 76 years and under the assumption that 65% of the population of nodes 1 and 2 will be vaccinated during months 2 and 12 while also considering that the mother give immunity to their offspring during the first 6 months. The initial values for the simulation of the MSEIR model are selected as , , , N, and , and .
In the case of this network without a controller, the following behavior is detected:
As a result of the disease not being contained, the behavior of Class M stays constant while class S exhibits an ascending trend during simulation time. Also, the behavior of node three is more noticeable than other nodes, which can be expected since, in addition to being the largest node, it is also where the disease begins and starts to spread to the other nodes.
Class E presents a growth of exposed individuals since there is no control of the disease. As time advances the number of exposed individuals decreases.
The model parameters used in this work determine that the number of infected individuals tends to reduce substantially if the individuals remain in class E and the number of people in class, I remain low, although this might not be the case. The quantity of people in class R is high, but it is lower compared to the class R of the number of individuals who received treatment.
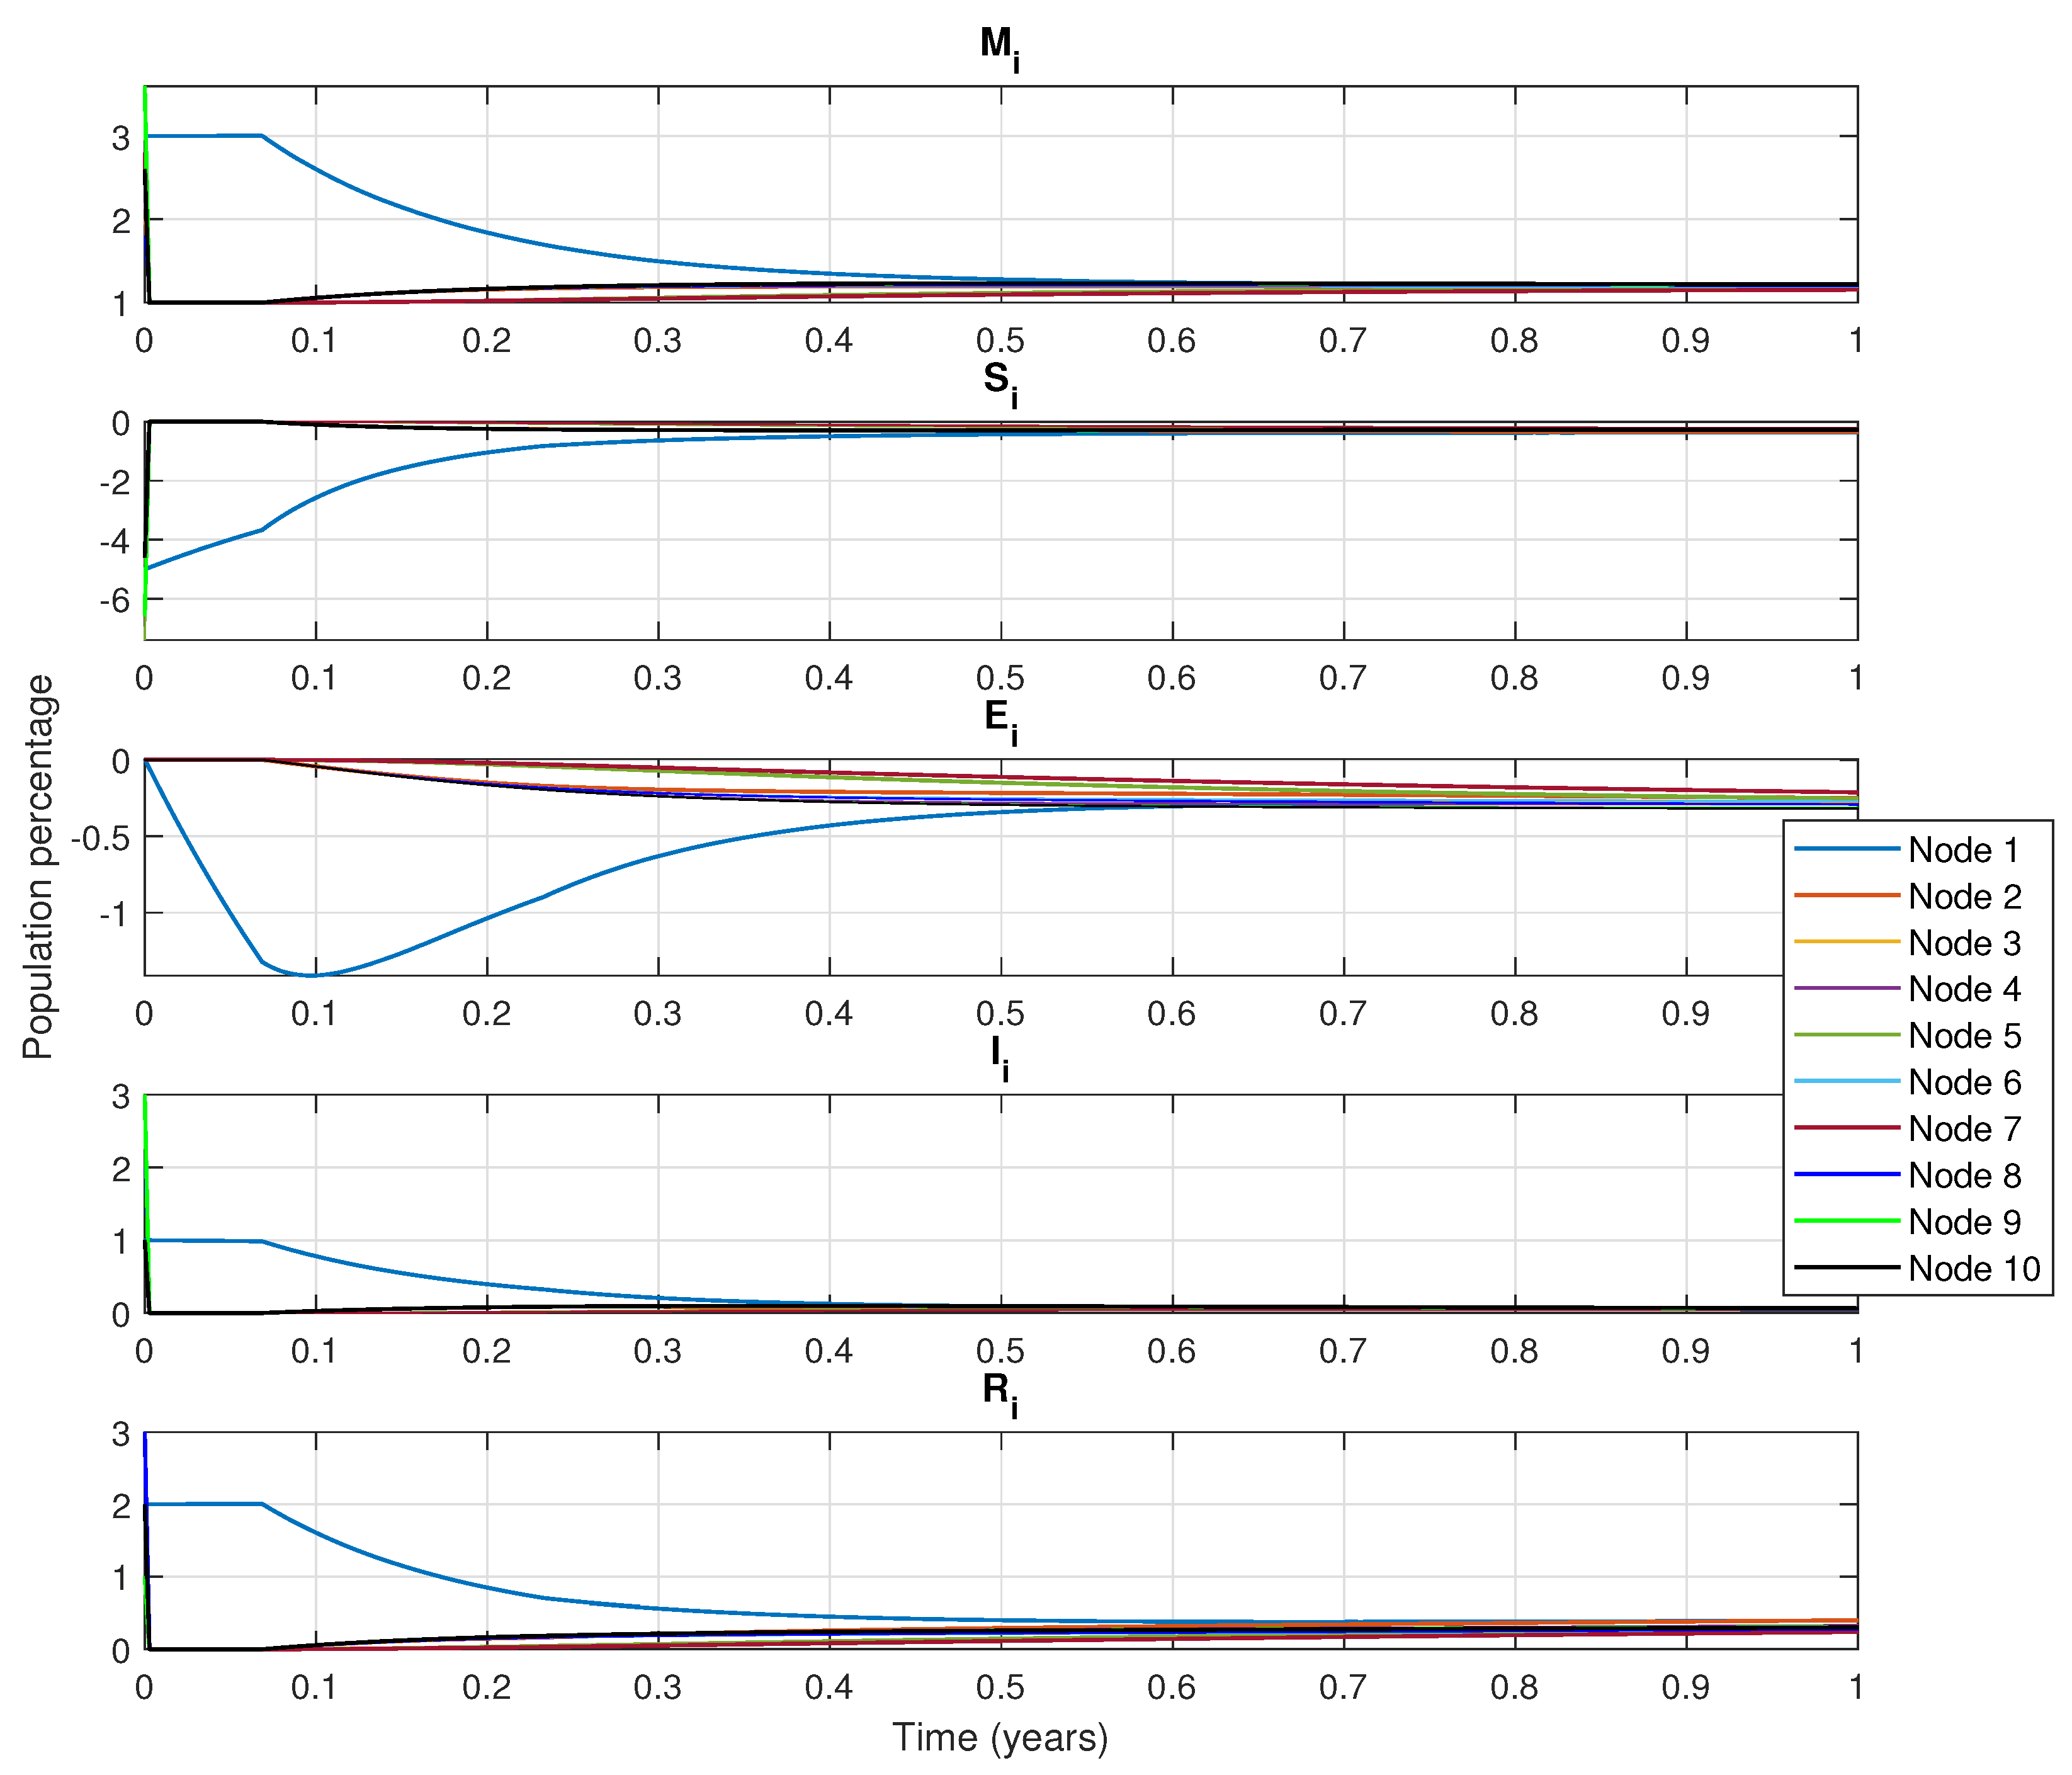
Figure 4 presents the simulation results of the network with a control algorithm. It is important to highlight that the dynamic population considers all the nodes. The disease originates from the node number three and spreads to the other nodes. Also, the control inputs (PIN nodes) are considered as node one and node two. Control measures start in node three since this node is the largest, with vaccines administered to a small portion of the population in order to decrease the infection rate.
Figure 4 shows the decline that in passive immunity (class
M) in node three. This occurs because vaccination targets the susceptible population, which includes women of reproductive age, where the reduced probability of infection is considered. In contrast, at node five the number of births increases over time. If the mother is unvaccinated, she may eventually contract the disease which can temporarily deliver passive immunity to her newborn.
Class
S, node three shows that the susceptible population is initially the largest as the propagation begins here. Once vaccination begins, the number of susceptible individuals starts to decrease considerably due to vaccination being applied until day 300, when individuals who were in class
S (susceptible) transition to class
E (exposed) or class
I (infected). Four other nodes remain susceptible for a period. The exposed population increases as contact between node three and other nodes allows the disease to spread. Class
E in node three increases first, but as the disease progresses the number of people exposed is reduced (
Figure 4).
For class I, because the spread of the disease starts in node three, this node presents the largest number of infected populations. Since nodes one and four have fewer connections, the disease spreads slower, producing fewer infected individuals. Over time, the number of infected individuals decreases significantly across all nodes as they move to the recovered class R. In class R, there is a strong inclination towards recuperation, particularly in node three. As a result, other nodes recover as well, although the control nodes experience a faster recovery. It is important to mention that class R includes both recovered individuals and those who have died from the disease. As simulation time progresses, the recuperated population remains constant across every node.
Figure 4 also shows the estimated vaccination treatment in the PIN nodes (nodes one and two) as well as the rest of the nodes that do not have control inputs. From this figure class
S tends to decrease while class
I remains constant with no increase once vaccinations begin.
6. Discussion
The simulation results obtained in
Section 3 are an academic example that illustrates the applicability of the proposed scheme for a complex network with a great number of nodes that require access to an appropriate computational equipment, which is out of the scope of this work. However, it is important to note that each node used in this scheme, represents a population that can be composed of thousands of individuals.
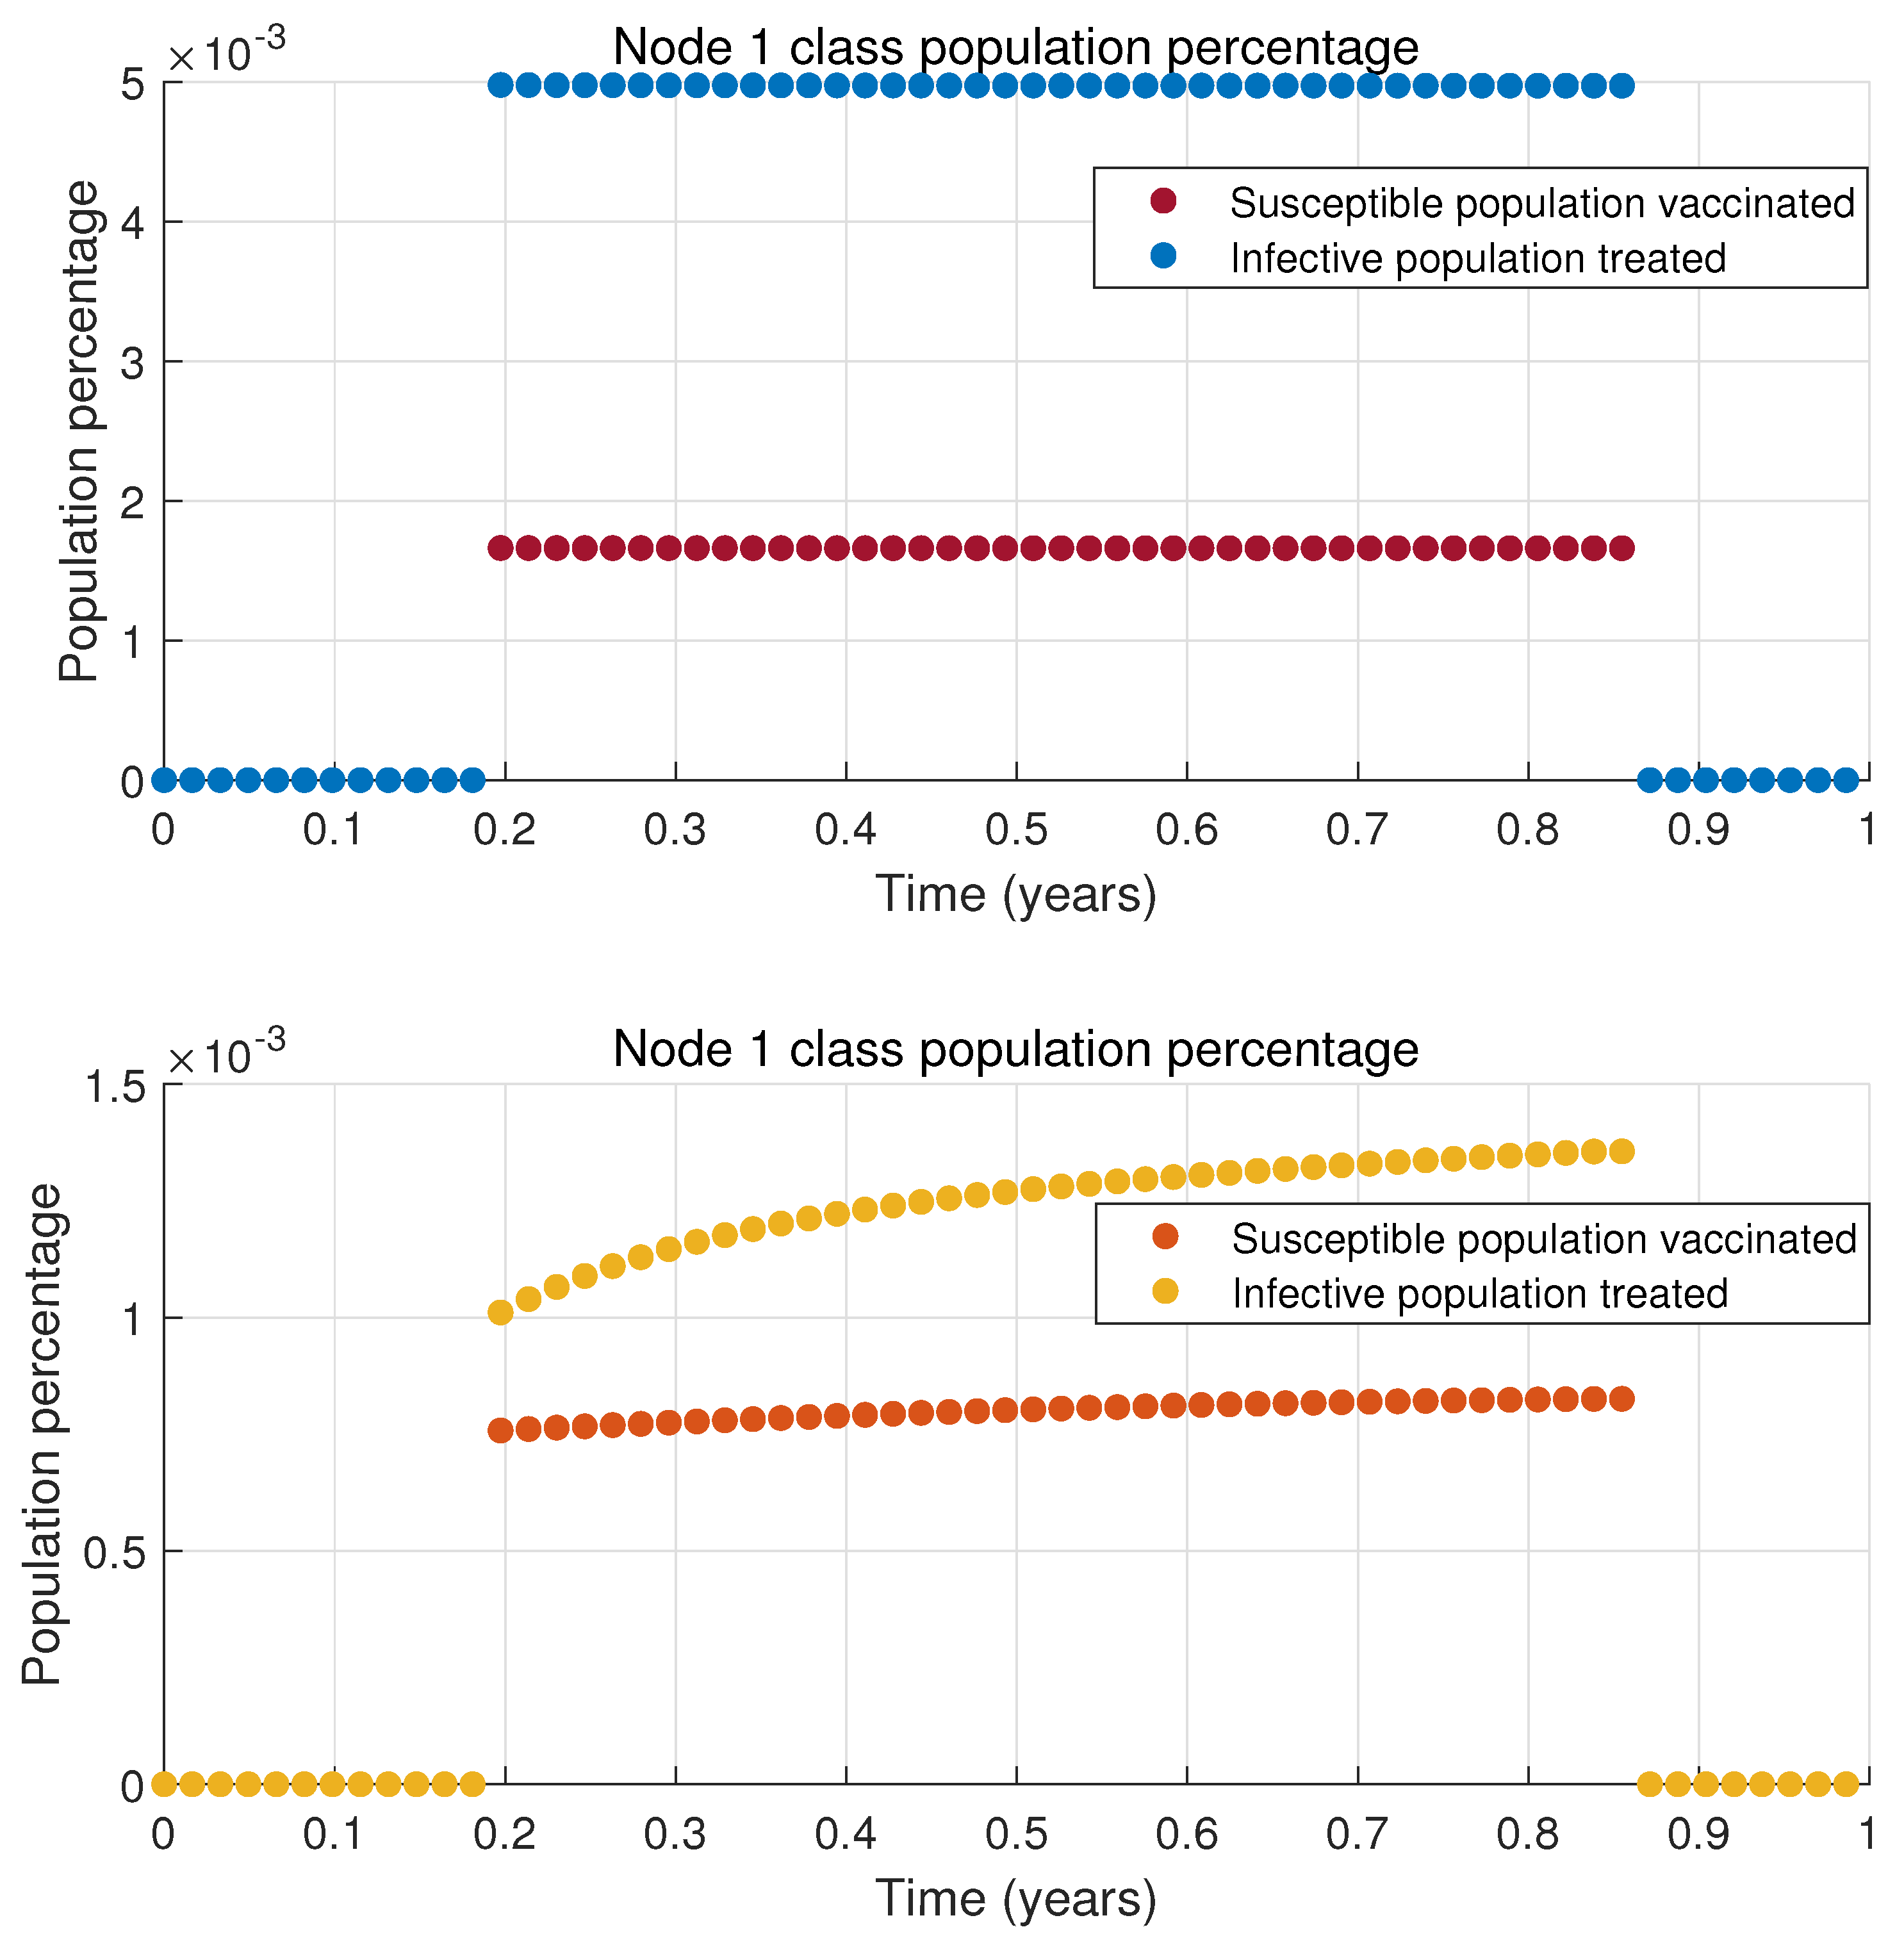
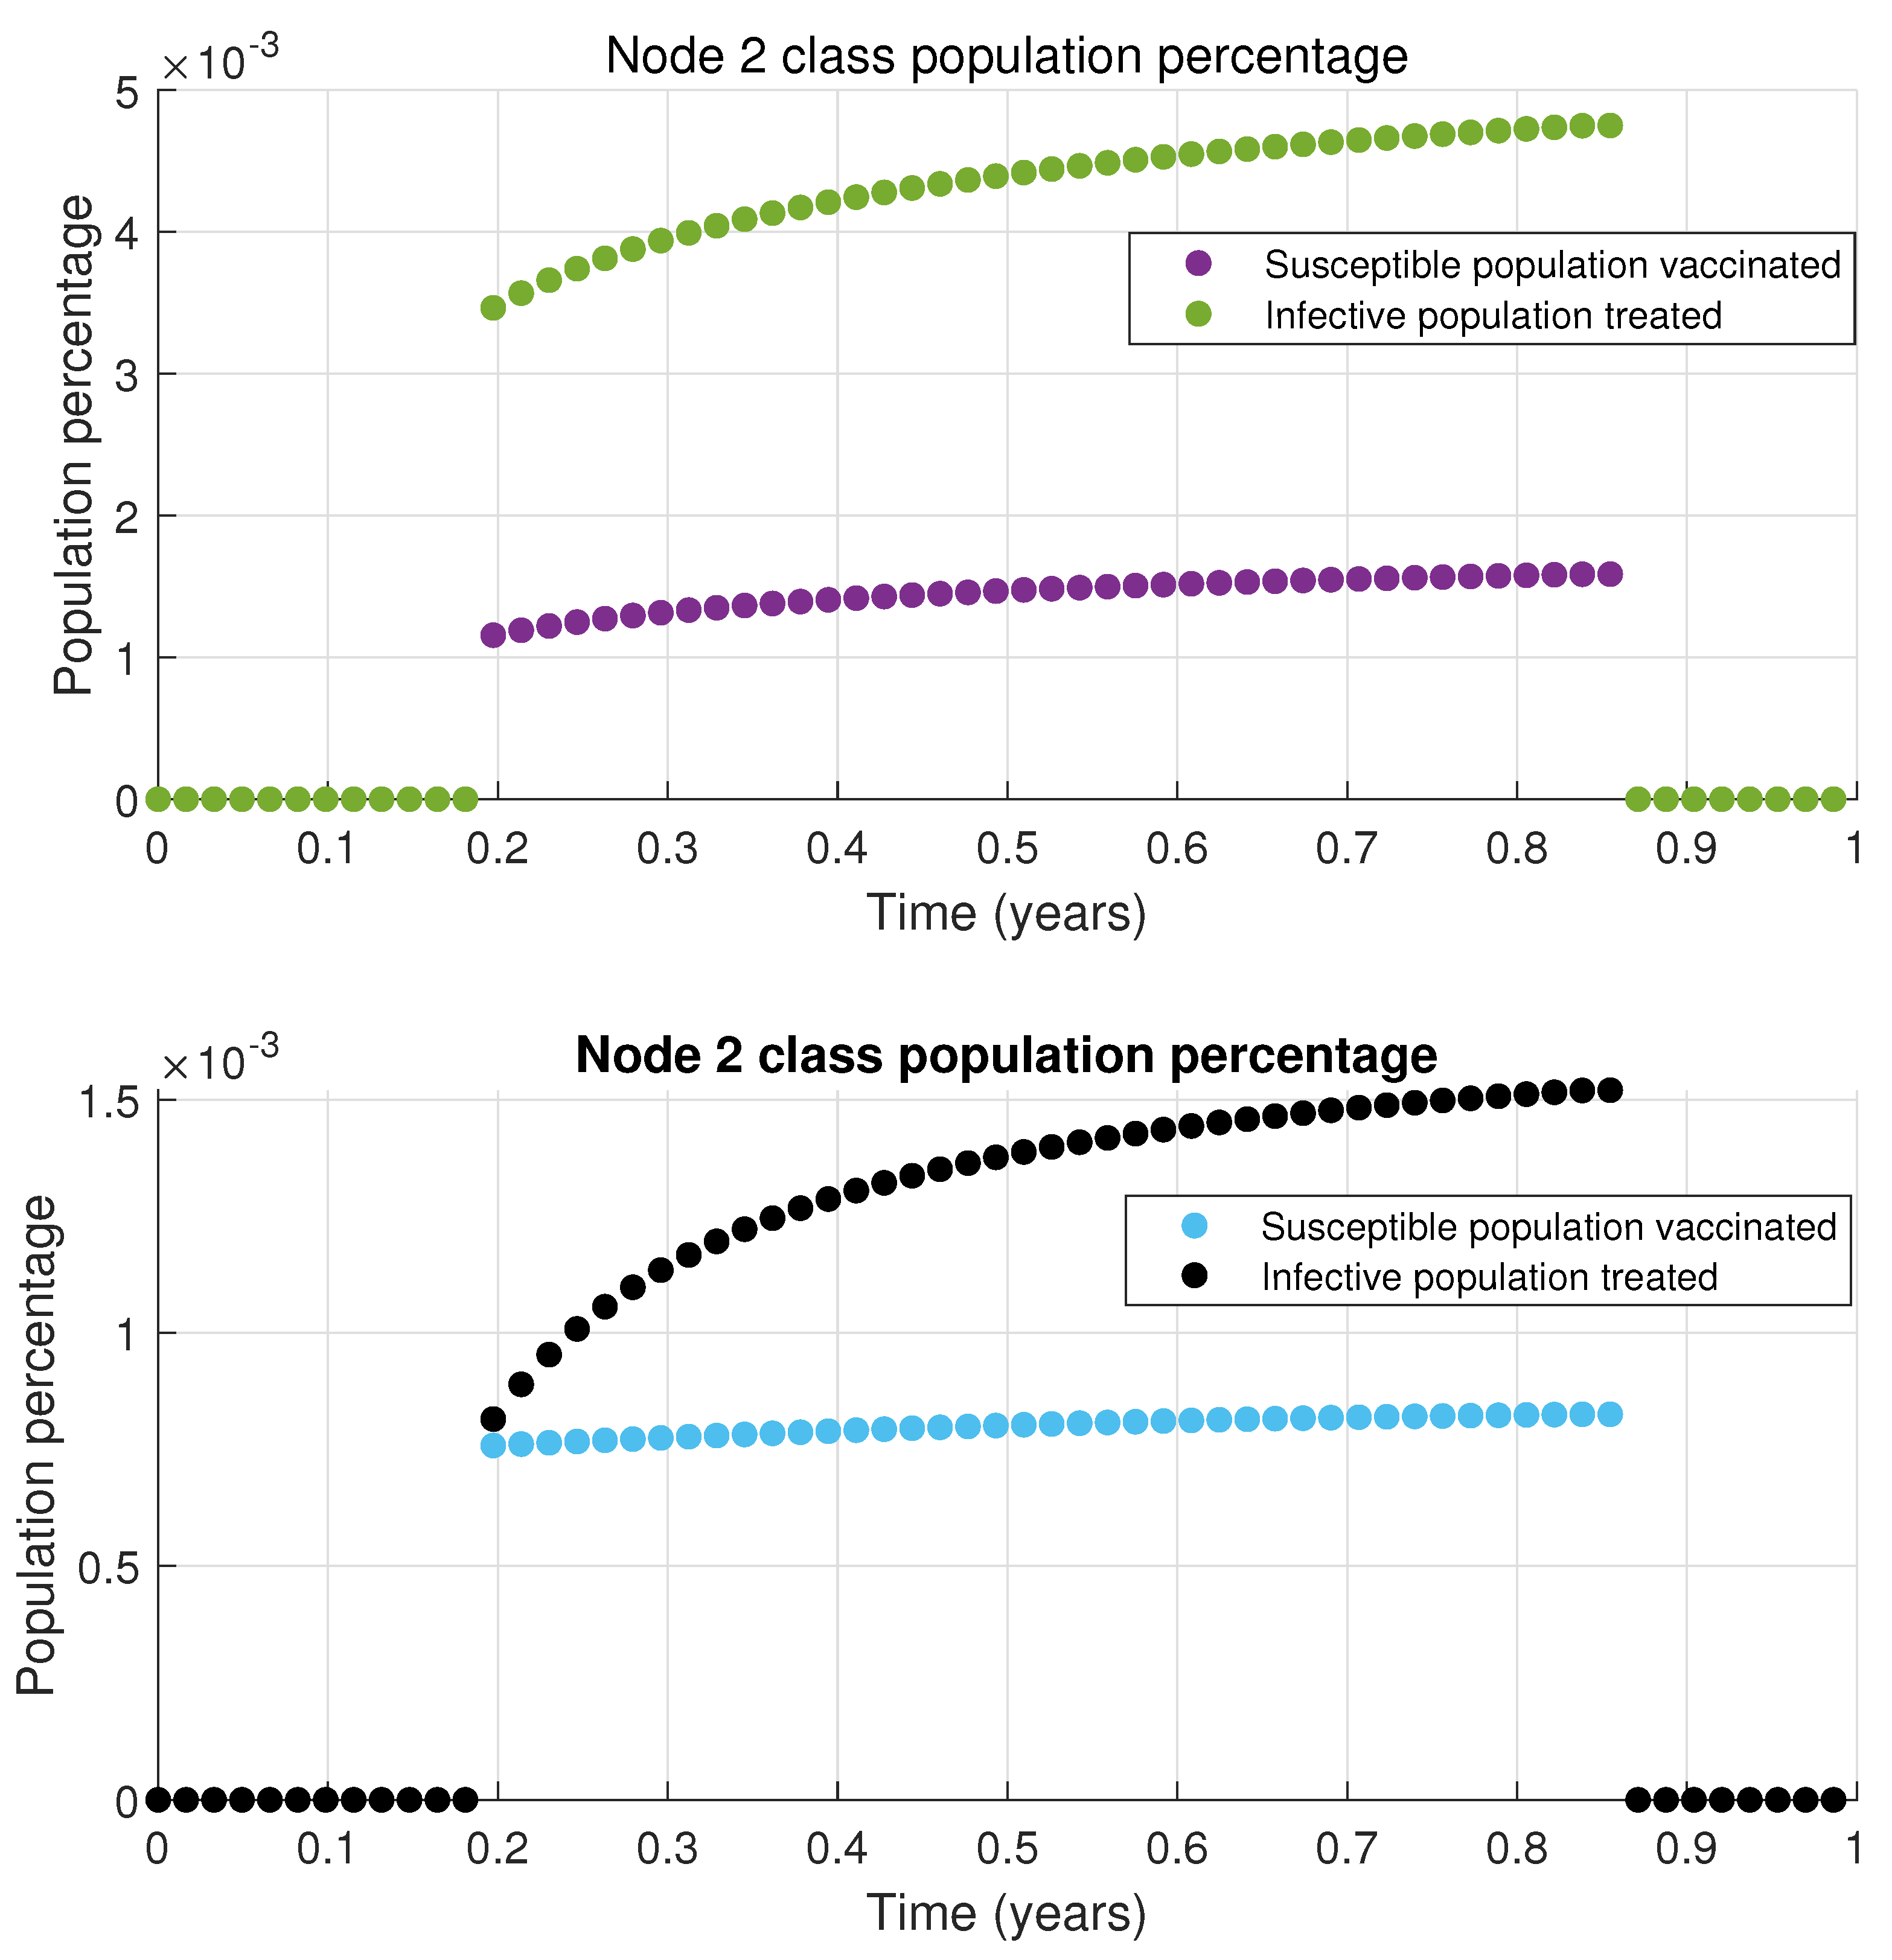
The results presented in
Figure 4 indicate that the infected population decreases to a low level. While it does not reach zero, it remains significantly lower than scenarios without treatment or vaccination. This outcome is achieved with only two out of the ten nodes in the network implementing time-varying connections and the dynamics of each node is defined by the MSEIR epidemiological model. The total vaccinated and treated population is relatively small, as only a limited percentage of the susceptible and infected populations receive vaccines or treatment in nodes 1 and 2; this is illustrated in
Figure 5 and
Figure 6, respectively. When this vaccinated and treated population is compared to the total population of the respective nodes, the proportion becomes even smaller.
This paper considers an important and timely topic by proposing an innovative control strategy to mitigate the spread of infectious diseases through a complex network approach with time-varying connections adding a novel computational dimension to epidemic modeling and providing a relevant and practical context. However, there are still open opportunities to improve the proposed methodology mainly from a theoretical point of view. As well as its application to different epidemic situations.
Comparison
In order to show the applicability of the proposed scheme, a comparative analysis of the proposed methodology against existing ones is included. It is important to note that, to be best of our knowledge, any comparison of existing methodologies is not suitable, since the methodology proposed in this paper is an impulsive PIN-control with nonlinear dynamics for each node; furthermore, the proposed methodology also considers time-varying connections, where the variation profile is considering unknown in the controller design. In this case, both the uncontrolled nodes and the time-varying connections are absorbed and compensated by the neural identifier which is used only for controlled (pinning) nodes. The proposed controller operates only with local information for each pinning node to control the entire complex network.
Table 1 includes a comparative analysis of four different complex networks parameterized as an infectious disease simulated by an MSEIR system, with 5, 10, 20, and 80 nodes under six different control schemes:
All node neural control for time-invariant connections (TICC)
All Node Neural Control for time-variant connections (TVCC)
Pinning Neural Control for time-invariant connections (TICC)
Pinning Proportional Control for time-invariant connections (TICC)
Pinning Proportional Control for time-variant connections (TVCC)
Most studies on the control of complex networks focus on time-invariant connections, and the use of PID control and its variations for achieving consensus in networked systems has been extensively explored. To enable a comparative analysis, this paper includes a proportional control approach, however, it is well known that such a type of controller is not robust to unknown time-variant connections compared to the approach proposed in this paper [
20,
21]. Also, this comparative analysis considers the case of control in all the nodes of the networks which is a relaxed scenery for a control methodology, such methodology is only included for comparison purposes since the main objective of this paper is to design a pinning control approach for time-varying connection dynamic complex network.
From the results included in
Table 1, it is possible to note that a traditional proportional controller is not capable of achieving the control objective (consensus of all network nodes to an infectious level
) with a pinning strategy. The best performance is obtained with an all-node control strategy; however, it requires a controller in all nodes, which is not our control objective. Finally, our control approach develops an adequate consensus performance with a limited set of control nodes, ensuring that the main goal of the controller is achieved with a reduced control strategy.
While these results are promising, the MSEIR model still requires validation and comparison with real population data from cities or towns. By analyzing time series data from various population areas, the behavior of the model can be assessed and verified. This aspect of the study is ongoing.


 ,
, 

