1. Introduction
In the current era of technology, artificial intelligence (AI) has become a central research field, significantly influencing numerous scientific disciplines. Simultaneously, agent-based modeling (ABM) has captured researchers’ attention as a promising framework for simulating and understanding complex phenomena. In this context, this study proposes a detailed exploration of the synergies between AI and ABM, conducting an extensive analysis of the existing scientific literature.
ABM is a powerful simulation technique that characterizes a complex dynamic system through its interacting entities [
1,
2,
3]. While ABM provides extensive flexibility for various applications, the complexity of real-world models necessitates the intensive use of computing resources and significant computational time. However, to mitigate computational costs, a metamodel can be constructed to provide insights at a less computationally demanding level. ABM has a range of applications that can be modeled, such as simulating emergency evacuation processes [
4,
5], specific transportation applications [
6], modeling Grey economic systems [
7], financial process modeling [
8], analyzing financial contagion effects [
9], medicine [
10,
11], etc.
Although ABM and AI are two distinct fields, they can interconnect through collaboration and complement each other in various ways. Thus, a series of interconnected features can be identified, such as simulating intelligent behavior [
2,
12,
13], flexibility and adaptability [
2,
14], interconnection with AI technology [
15], decision-making and collective intelligence [
16], analysis and visualization of complexity [
5,
17], as well as innovation and exploration of emergent behaviors in complex systems. Firstly, ABM is considered a modeling method specific to economic cybernetics and complex adaptive systems [
17,
18]. On the other hand, the complexity of systems, given their dynamic and sometimes unpredictable nature, and the fact that a complex system is composed of a multitude of entities and agents that interact, result in a large volume of data. The most useful tools for analyzing this large volume of data [
19], given the current technological and digital era, are provided by AI algorithms and techniques. The combination of these actions can be achieved through modeling applications offered by ABM and AI algorithms. In this case, ABM focuses on simulating the individual behavior of agents or individual entities and their interactions within the complex system, while AI develops algorithms and models that mimic and reproduce intelligent behavior through machine learning techniques. AI, especially in machine learning, focuses on developing models capable of learning and adapting to new data. By completing this process with ABM, its characteristic flexibility in modeling complex systems and adaptability to real-time changes are recognized. In essence, ABM and AI can complement each other in addressing complex problems, bringing together the advantages of simulating agent-level details and those of automated learning in an integrated and synergistic manner.
ABM is a simulation and modeling method that is specific to cybernetics [
20]. Cybernetics is an interdisciplinary science that provides a framework for understanding various processes and systems in different fields. AI, as a field of study, offers machine learning algorithms that can be used in managing and analyzing large volumes of data and information, complementing and seamlessly integrating with the methods and frameworks provided by cybernetics. Integrating ABM with AI provides new perspectives for study and applicability in various fields such as sustainable agriculture [
21], marketing [
22], education [
23], biomedical systems [
24], agent behavior [
25], management [
26], etc.
ABM has the capacity to simulate agent behavior, while the AI approach analyzes and understands complex patterns, learning from real-time data. Thus, the interconnection between the two bridges the gap with the aim of contributing to more informed and efficient decision-making, leading to the development of more flexible and resilient systems/models. Additionally, AI is employed to analyze large volumes of data, and in conjunction with modeling individual and collective behavior through ABM, it enables more accurate forecasting and rapid identification of specific trends [
27,
28,
29].
Turgut and Bozdag [
25], in their study, provided a detailed presentation of the relationship between ML technology and agent-based approaches. Based on their analysis, they concluded that the main framework researchers can employ to address specific challenges identified individually in both methods is to use ML models to simulate agent behavior in their ABMs.
Hu et al. [
30] conducted a study in which they examined challenges arising from agent behavior governed by rules derived from their bounded rationality and data scarcity. The authors addressed this challenge by incorporating domain expert knowledge with machine learning techniques.
Other investigations focus on the applicability and interconnection between ABM and AI in the medical field. For example, in their research, Sivakumar et al. [
24] provided examples of how ABM and ML are integrated into various contexts covering spatial scales, including multicellular biology. The primary aim of their research was to use published studies as a guide to identify suitable approaches to machine learning based on specific types of ABM applications, considering the scale of the biological system and the characteristics of the available data.
Another study combines ABM with AI by constructing a metamodel that integrates ABM with random forest regression and neural networks. This approach has highlighted the benefit of reducing the number of required ABM simulations to validate a model [
1].
Models and agent-based simulations are commonly encountered in various fields, providing a means to study systemic patterns resulting from individual behavior and interactions. Achieving the behavioral accuracy required for predictive models represents one of the significant challenges of ABM, and the use of learning algorithms can contribute to enhancing this accuracy in behavioral modeling [
31].
The primary purpose of this study is to conduct a comprehensive bibliometric analysis of the utilization of AI in ABM applications. By exploring the existing scholarly literature, the aim is to identify patterns, trends, and the interconnected landscape between these two dynamic fields. This investigation seeks to provide insights into the evolution, challenges, and opportunities at the intersection of AI and ABM, offering a foundation for future research directions in this interdisciplinary domain. Additionally, our study can make a significant contribution by highlighting novelties in the field, identifying key research directions, and providing a comprehensive perspective on the relationship between AI and ABM. As Donthu et al. [
32] suggest, the bibliometric analysis best fits the situations in which one aims to present the state of intellectual structure and emerging trends in a research field. The methodology involves a meticulous bibliometric approach, leveraging a well-established database, namely WoS [
33]. Selection criteria include articles related to ABM and AI, with a focus on titles, abstracts, and keywords. The chosen data set is then refined through language and document type filters, ensuring a targeted and relevant sample. The bibliometric analysis utilizes the Bibliometrix platform in RStudio [
34] and VOSviewer software (version 1.6.20) [
35], employing techniques such as keyword co-occurrence clustering and network visualization to unveil patterns and connections within the literature.
This study innovatively combines bibliometric analysis with the exploration of AI and ABM, shedding light on the dynamics of these fields through a quantitative lens. The use of VOSviewer facilitates the visualization of co-occurrences, enabling a more nuanced interpretation of the relationships and interdependencies present in the literature. This approach adds a novel dimension to the examination of AI in ABM applications, offering a systematic and data-driven perspective on the evolution and interconnectedness of these domains. The value of this study lies in its contribution to the scholarly understanding of the synergies between AI and ABM. By offering a comprehensive bibliometric overview, the research provides a valuable resource for scholars, practitioners, and policymakers interested in the evolving landscape of these interconnected fields. The insights gained from this analysis can inform future research directions, guide strategic decision-making, and foster collaboration within the dynamic intersection of AI and ABM.
In addition, the above-mentioned aim, the present study tries to answer the following research questions:
RQ1: What are the most influential articles in the field of AI utilization in ABM?
RQ2: Who are the most notable authors in the realm of AI utilization in ABM?
RQ3: Which journals have been preferred for papers on AI utilization in ABM?
RQ4: What are the most impactful journals in the field of AI utilization in ABM?
RQ5: Which universities are at the forefront of AI research based on papers published in ABM?
RQ6: How has scientific production related to AI in ABM evolved over time?
RQ7: What are the characteristics of the collaboration network among authors who have published in the field of AI in ABM?
This paper is structured into several sections, as follows, aiming to provide a holistic overview of the utilization of AI in specific applications of ABM.
Section 2 presents the materials and methods underlying the bibliometric analysis. RStudio software, the Bibliometrix platform, and VOSviewer will be employed for the stated purpose.
Section 3 is dedicated to the analysis of the dataset, covering articles, sources, authors, and knowledge status in the field.
Section 4 introduces in-depth discussions based on the results obtained in
Section 3, as well as the exploration of potential research limitations. Our study concludes with
Section 5, presenting key findings and outlining future research directions.
2. Materials and Methods
Bibliometric analysis relies on statistical methodologies and specialized software tools to extract, process, and interpret data pertaining to scientific output. The primary aim of this approach is to present an unbiased overview of the progression within a research field, delineate the contributions made by authors or institutions, and pinpoint potential directions for future research. In our bibliometric analysis, we utilized the R Studio software, incorporating the bibliometrix package and the “biblioshiny()” function [
34]. The “biblioshiny()” function, as outlined in [
34,
36,
37], furnishes a diverse set of functionalities for our intended bibliometric analysis. It enables the extraction of bibliometric data from various sources like Scopus and WoS, generates key bibliometric indicators (e.g., publication count, H-index, citation count), facilitates comparative analyses, and supports the visualization of results through interactive graphics such as network maps, diagrams, and geographic maps. Additionally, it provides the capability to export these results for further use and dissemination. To guarantee transparency and structure in implementing the research [
38], we delineated the stages of the methodological process following the guidelines put forth by Zupic and Čarter [
39]. The authors have outlined a procedural workflow for executing scientific mapping studies within the realms of management and organization. From this point of view, the process we will follow in conducting the bibliometric analysis will be as presented below, adapted from Torres Silva et al. [
38] and Zupic and Čarter [
39].
Step 1. Study design: The data selection process is a crucial step in refining the dataset for further exploration. Each stage aims to obtain a set of articles relevant to our study on ABM applications and AI. The keywords used in
Table 1 were chosen to cover key aspects of this study domain, ensuring precise and specific coverage. Our study explores the interaction between two distinct research fields: AI and agent-based models, and the chosen keywords reflect the interdisciplinary complexity of our topic. Additionally, the selected keywords stem from our main research question: How can AI be utilized in ABM applications?
Step 2. Synthesis of Bibliometric Data: Regarding this step in the process, the bibliometric database WoS was chosen, and various queries were conducted based on the following keywords: “agent-based modeling”, “agent-based modelling”, “agent-based model”, “agent-based models”, “artificial intelligence”, “machine learning”, and “deep learning”. These key concepts were searched in the title, abstract, and keywords of articles, covering the period from 2000 to 2022. The 22-year period chosen for our study acknowledges the swift and substantial evolution witnessed in the field of AI during the past two decades. Our selected time frame encapsulates the era when AI emerged as a prominent domain for research and development [
40]. Additionally, significant technological progress, changes in research methodologies, and the advent of new paradigms have prominently characterized recent decades [
41]. These factors, which have influenced our decision regarding the time frame, are also underscored in the 2020 technical report issued by the European Commission [
42]. Subsequently, only article-type queries written in English as an internationally recognized language were retained. This stage will be extensively described in the interpretation of
Table 1.
Regarding the dataset extraction, it shall be stated that the WoS platform offers, based on subscription, personalized access to data. As a result, as Liu [
43] and Liu [
44] observed, the results of the bibliometric analysis are highly dependent on the user’s access to the ten indexes offered by the WoS. In this context, the authors recommend that the bibliometric papers clearly state the access the users had to the index offered by WoS [
43,
44].
Furthermore, the choice for the WoS platform has been substantiated by the fact—also highlighted in the scientific literature—that it offers extensive coverage of a broad array of disciplines while being recognized as a platform with a strong reputation by the scientific community [
45,
46,
47]. Nevertheless, WoS is one of the few platforms on which both Bibliometrix and VOSviewer offer a data reading option for the datasets extracted based on the search criteria [
34,
48,
49].
Moreover, it should be stated that the classification of the papers into the “article” category by the WoS platform follows the description provided by Donner [
50]. The author states that an article is considered a report of original research with no predefined length, which features the use of meta-analysis. Following the description provided by WoS regarding the inclusion of scientific papers in the article category, it should be noted that the platform mentions that research papers, brief communications, technical notes, chronologies, full papers, and case reports that were published in a journal and/or presented at a symposium/conference are included in this category, explicitly stating that proceedings papers are included in both the article and the proceedings papers category [
51]. Also, Donner [
50] highlights that, in the field of scientometrics, it is important to clearly differentiate among various types of documents when conducting the analysis, as each type of document generates a specific citation distribution that is highly connected to the purpose and content of the document type.
Step 3. Analysis: The third stage involved using the bibliometric software Biblioshiny from RStudio’s Bibliometrix package. The data extracted from WoS was downloaded in BibTeX format, and the cleaning stage was verified in RStudio v2023.09.1+494.pro2, Bibliometrix R (version 4.3.2). No additional exclusions were necessary at this stage.
Step 4. Visualization: In the visualization stage, graphical methods were used to prepare the analysis of sources, authors, and the literature.
Step 5. Interpretation: In the final stage, we utilize the graphical representations from step 4 and describe and interpret the results.
Table 1 summarizes the queries and steps we conducted to build the database. We utilized the WoS [
33] platform to retrieve papers related to ABM and AI. The analysis unfolds in several stages, emphasizing a meticulous process for identifying pertinent works. Titles, abstracts, and keywords are employed to encompass diverse aspects of each paper. The initial step defines the keywords identified in the titles.
Table 1 delineates the methodological steps taken in the data selection process during the exploration phase on the WoS. This systematic approach aims to refine the dataset progressively, ensuring relevance to our study on applications of ABM and AI.
Step 1. Title exploration: This stage focuses on identifying articles with titles relevant to ABM and AI, providing an initial delimitation of the dataset. Queries #1 and #2 focus on titles containing keywords related to ABM and AI, respectively. Following these queries, 5135 articles with terms specific to ABM in the title and 211,005 articles with terms specific to AI in the title were identified. Query #3 combines these aspects, refining the search.
Step 2. Abstract exploration: This stage adds relevance by identifying articles with key terms in the abstract and amplifying details about their content. Queries #4 and #5 target abstracts with specific keywords. A total of 11,173 articles with terms specific to ABM in the abstract were obtained, along with a substantial number of 470,238 articles with terms specific to AI in the abstract. Query #6 combines ABM and AI criteria from the abstracts.
Step 3. Keyword exploration: Identifying keyword-based articles consolidates the selection of papers that specifically address the key concepts of the research. Queries #7 and #8 concentrate on keywords associated with ABM and AI. Query #9 combines these keyword criteria. This query focuses on articles that contain both ABM and AI-specific keywords in the keywords section. A total of 134 articles were identified based on this query, providing insights into publications that simultaneously address both ABM and AI in their keyword content. This step further refines the dataset, capturing articles that explicitly mention both key aspects in their keywords.
Step 4. Title/Abstract/Keywords exploration: This stage combines relevant selection criteria to obtain a narrower and more focused subset of articles. Query #10 consolidates the AI-specific keywords from previous queries. A total of 344 articles with specific terms related to AI were identified, consolidating the criteria from previous steps.
Step 5. Language restriction: By limiting it to the English language, we ensure that the included articles are accessible and easily comparable, having a broader international circulation. Query #11 limits results to English publications from the refined set. The results were narrowed down to 340 articles written in English.
Step 6. Document type restriction: This restriction ensures that the analysis focuses on articles, excluding other types of documents that may contain irrelevant information for this study’s purpose. Query #12 narrows down the dataset to articles. A total of 226 articles were selected to be consistent with the scope of our study.
Step 7. Year published restriction: This stage ensures a focus on articles published during the relevant period for this study, preemptively eliminating materials that could negatively influence the results. Queries #13 and #14 exclude publications from the years 2023 and 2024, respectively. A total of 46 articles were removed, leaving our final database with 180 articles that will be used in the analysis.
This methodical process ensures that the dataset used for our bibliometric analysis is both comprehensive and relevant to the intersection of ABM and AI. The sequential queries help filter articles based on titles, abstracts, keywords, language, document type, and publication years, contributing to the robustness and specificity of our bibliometric study.
The resulting dataset, comprising 180 articles related to AI utilization in ABM, is close to the recommendations from the field related to the size of the data sample [
52]. Furthermore, as the purpose of the dataset collection step was to extract all the papers indexed in WoS pertaining to AI utilization in ABM, no further actions were needed to be taken for expanding the dataset as, in this paper, we are not working with small or fractional parts of research output. As Rogers et al. [
52] suggested, in cases where the bibliometric analysis uses an approach that relies on small or fractional parts of the researcher’s output, one should pay more attention to the size of the dataset, as there might be cases in which the extracted dataset does not accurately represent the average.
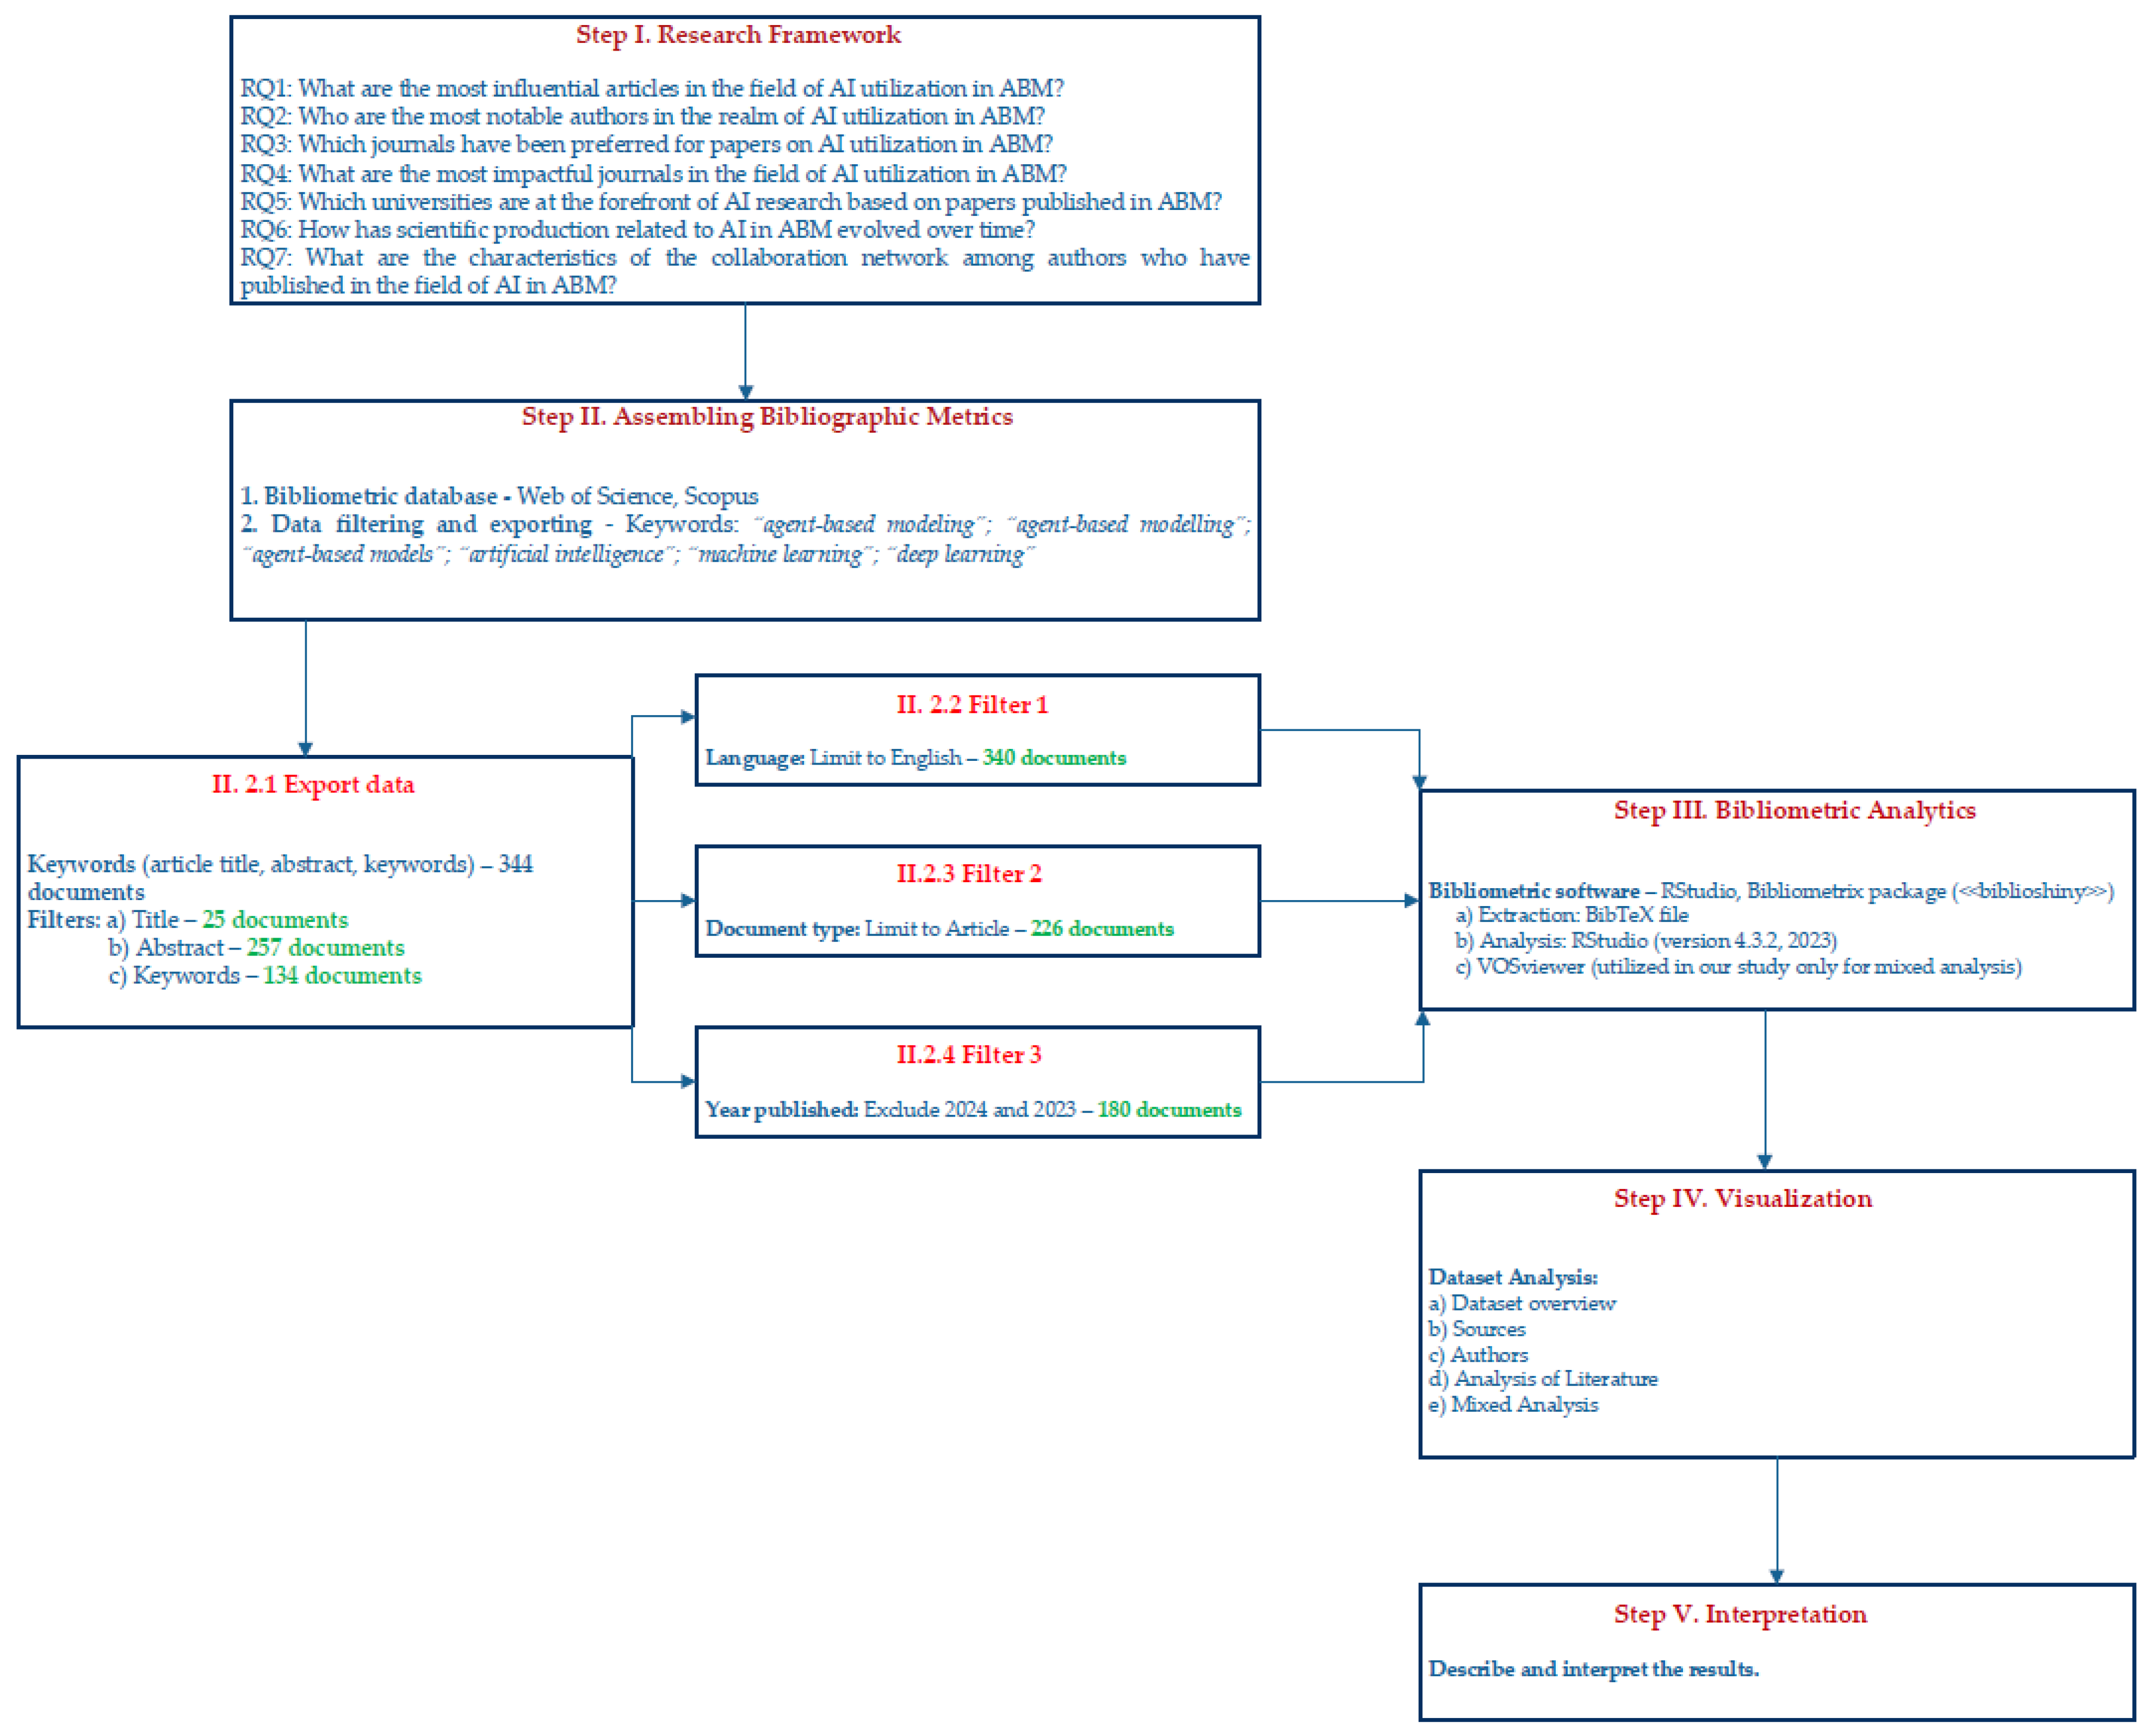
To ensure understanding and clarity of the methodological steps undertaken,
Figure 1 describes each step that we will apply in our study. Considering the research questions outlined in this study’s introduction, the initial step in constructing the methodological flow involves outlining the research framework. Subsequently, the queries from
Table 1 are employed to extract the database, and the RStudio software is utilized to generate the graphs that will be visualized and interpreted.
In the section related to mixed analysis, the interconnections between various analyzed elements, such as authors and keywords from our bibliometric dataset, have been discussed. For this purpose, we used the VOSviewer software, a specialized tool for analyzing and visualizing networks in bibliometric data [
53]. VOSviewer, initially created in 2010 by Nees Jan van Eck and Ludo Waltman [
54] at Leiden University’s Centre for Science and Technology Studies (CWTS), is a software tool designed for generating maps using network data and for visualizing and exploring these maps. The application allows users to create graphical visualizations of networks, highlighting the connections between the analyzed elements. Additionally, it is useful for identifying and highlighting clusters or groups of elements that are closely related within the dataset. VOSviewer is widely used in the academic community [
55,
56,
57,
58] to understand and graphically represent scientific information networks, facilitating the identification of trends, connections, and patterns in the literature.
3. Dataset Analysis
The analyzed papers were sourced from the WoS database and pertain to the fields of ABM and AI. Subsequent sections delve into discussions regarding their origins, authors, citations, literature analysis, and a mixed analysis.
3.1. Dataset Overview
Table 2 summarizes the main information in the utilized database. The bibliometric analysis spans an extended timeframe, ranging from 2000 to 2022, providing insights into the evolution of research over at least two decades. Data from 146 different sources were analyzed, indicating the diversity of resources and information used in the bibliographic research. The analysis contains a total of 180 documents, with an average publication age of approximately 18.26 years, suggesting the inclusion of older documents with enduring influence and relevance. Each analyzed document received an average of 16.02 citations, serving as a measure of its impact and recognition within the scientific community. The average citations per year per document stand at 5.14, offering a perspective on the frequency of citations each year. The analysis involved a total of 8862 bibliographic references, highlighting the breadth of information sources and connections to other works in the respective field. All this information provides a robust foundation for understanding the context and impact of the conducted bibliometric research.
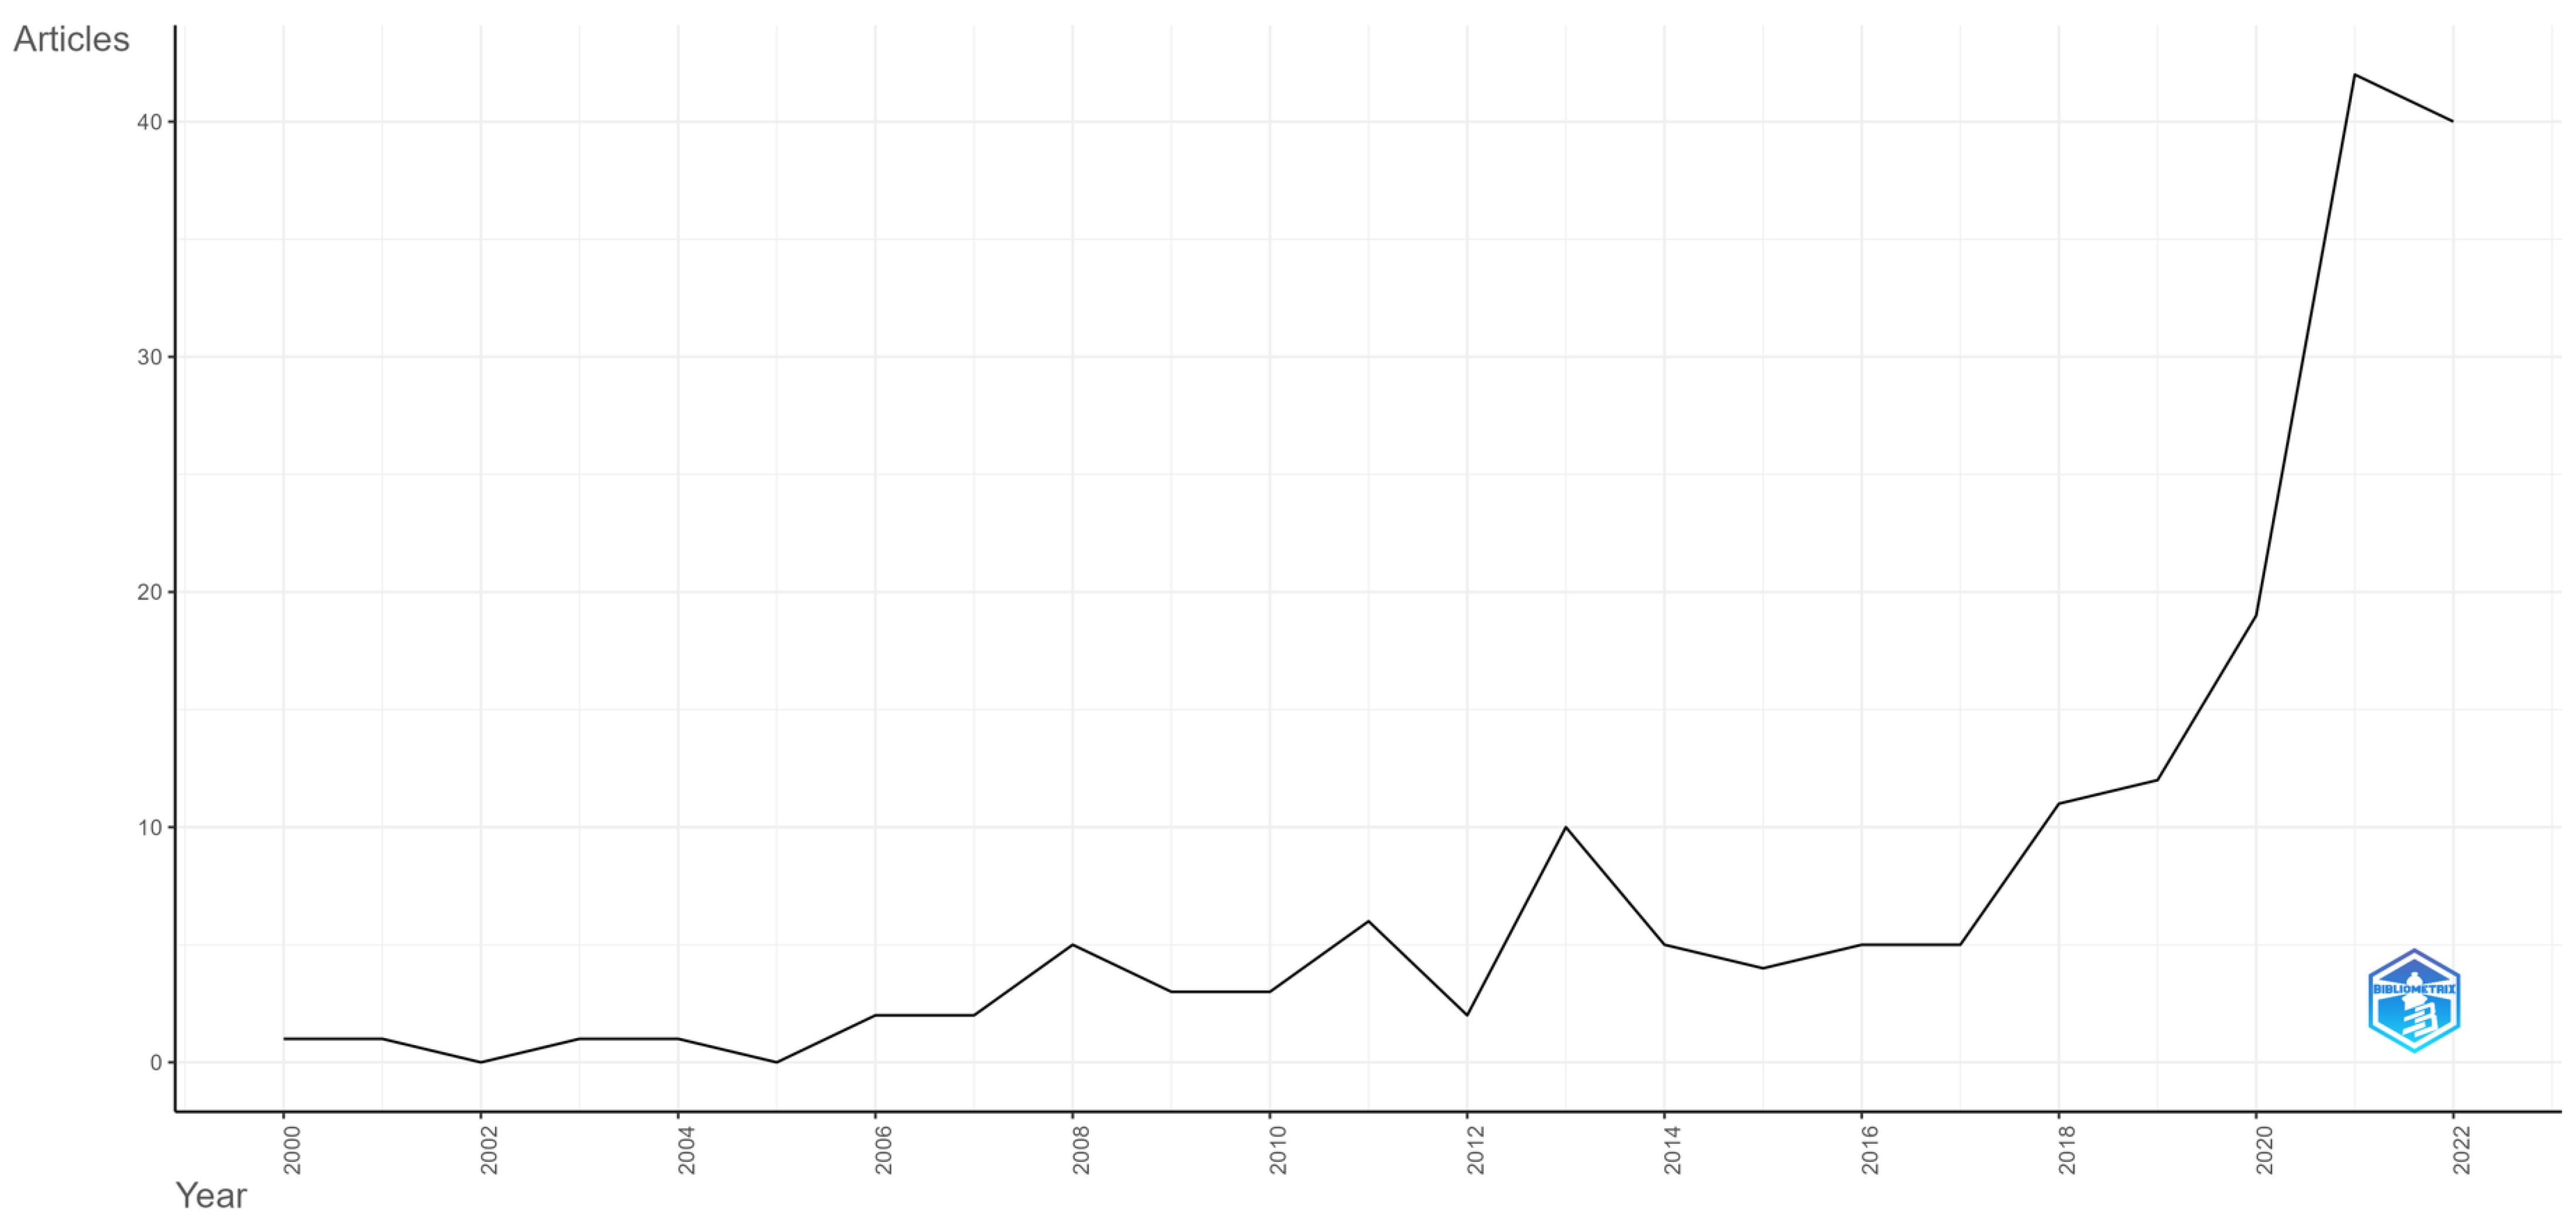
The annual evolution of scientific production regarding the use of AI in ABM applications in
Figure 2 shows a significant upward trend in recent years.
It is observed that, during the period 2000–2005, there is a low fluctuation, with certain years where scientific production is minimal or nonexistent. From 2006 to 2008, there was a significant increase, with production doubling or tripling from year to year. In the following years, 2009–2015, there is a certain stability, with moderate variations in annual production. From 2016 onward, constant growth is noted, with a significant accentuation in 2019 and 2020. The years 2021 and 2022 stand out as the most prolific, with a significant explosion in scientific production, reaching a peak in 2021 with 42 papers and maintaining a high level in 2022 with 40 papers. This evolution indicates an intensification of interest and activity in the analyzed field in recent years, with a strong concentration, especially in 2021 and 2022.
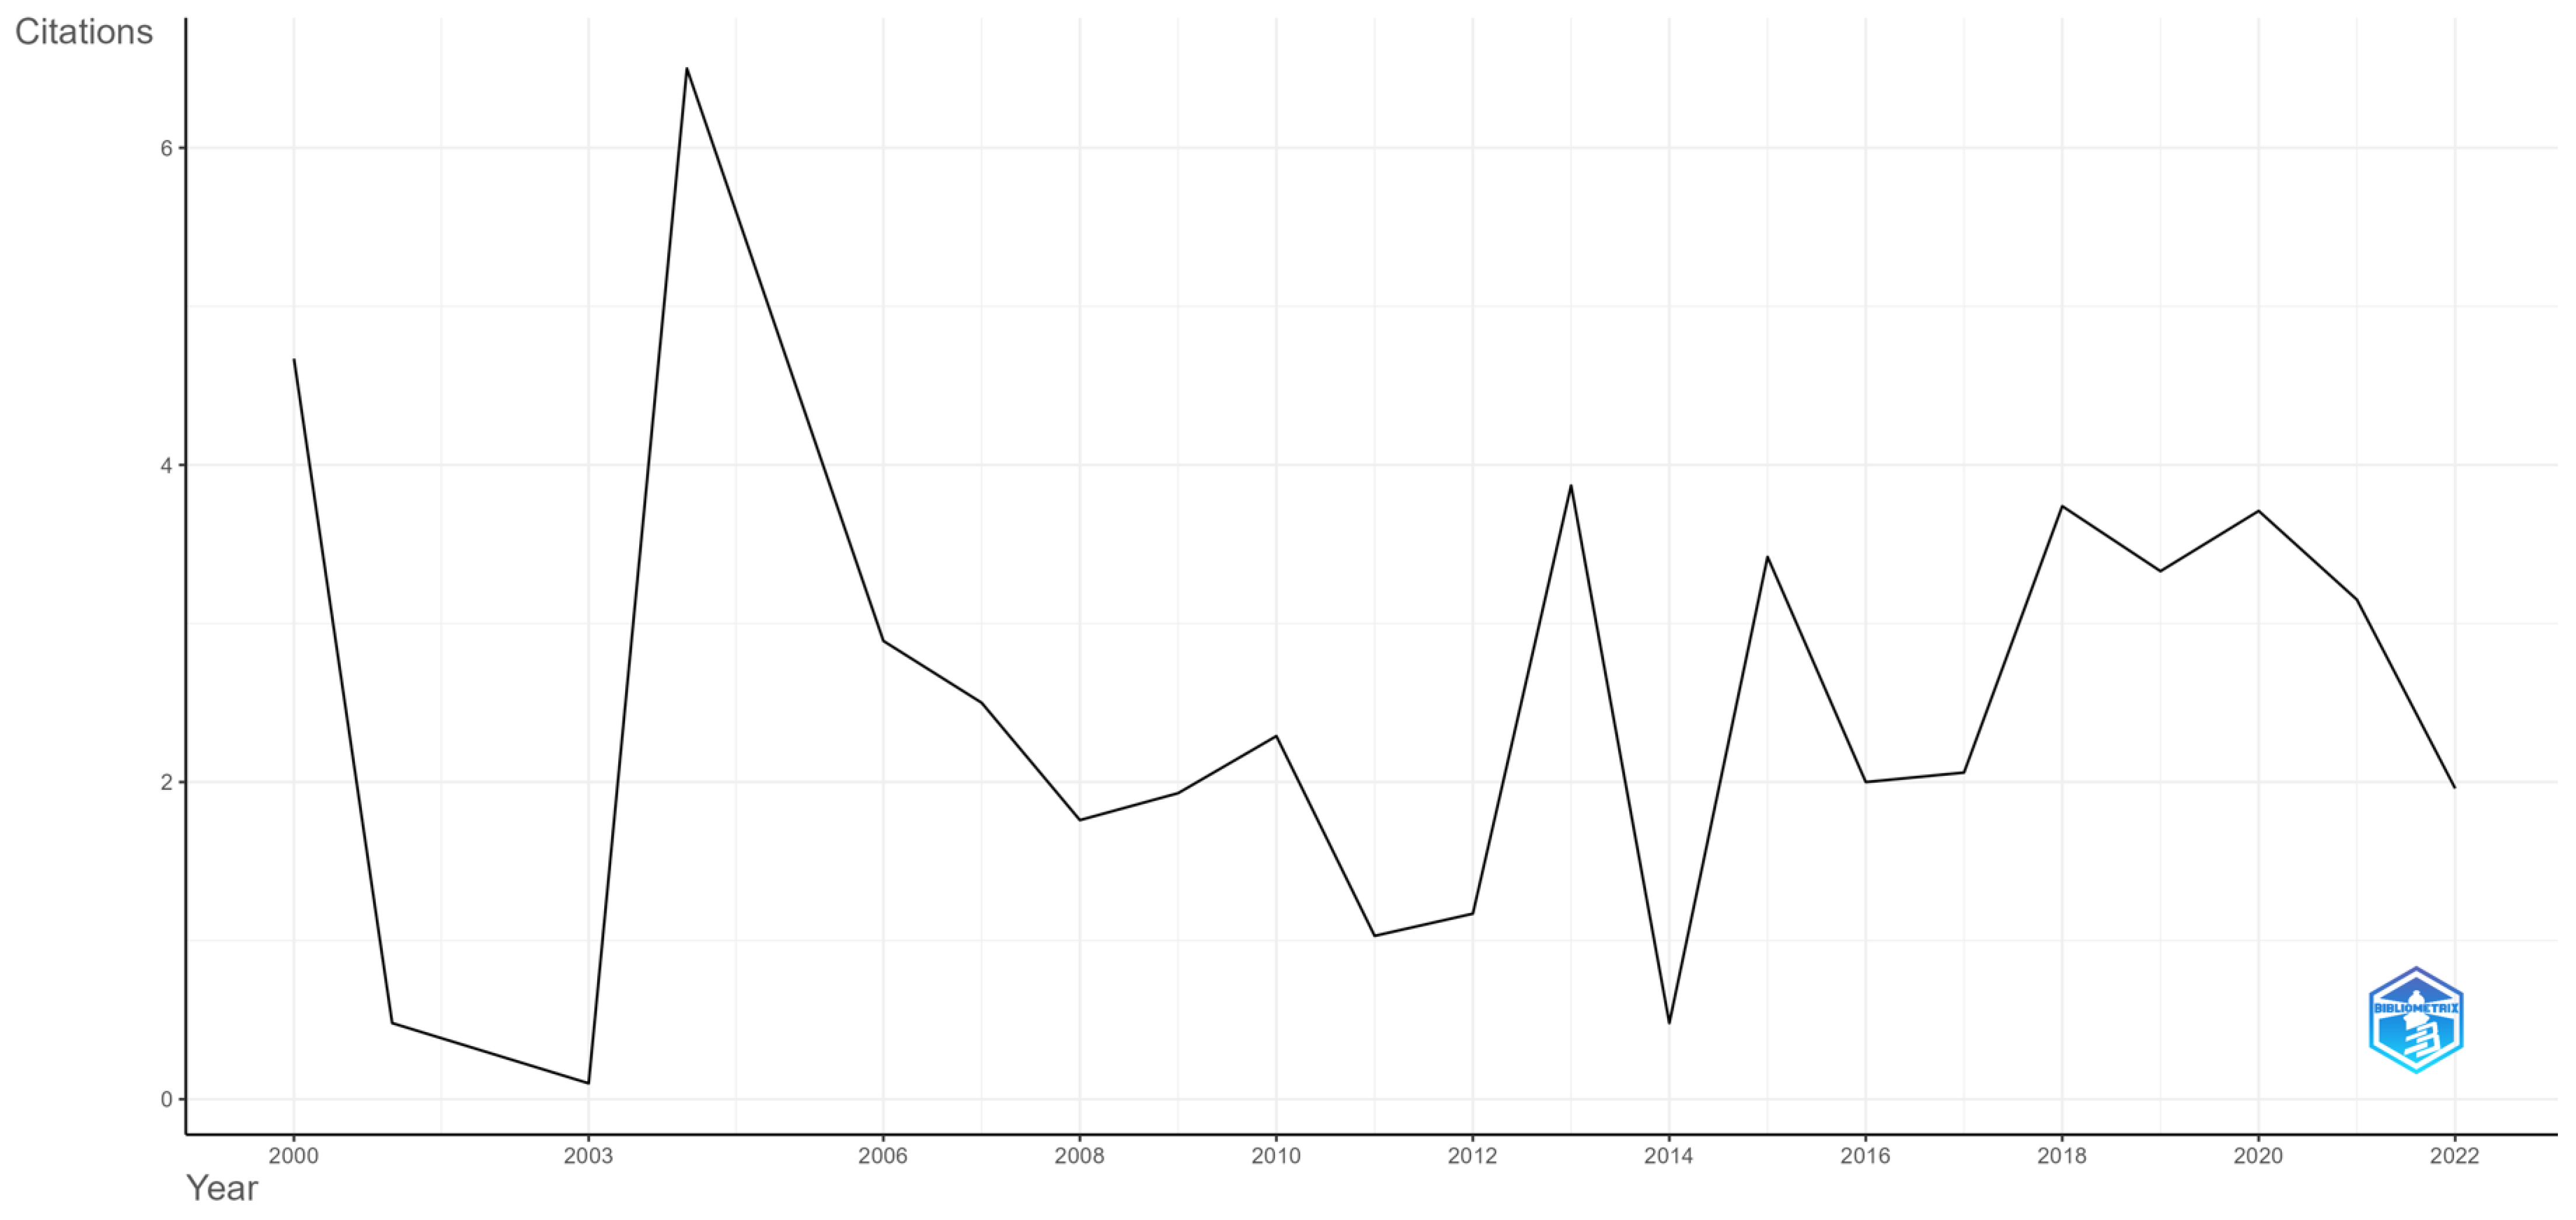
The evolution of the number of citations indicates a significant growth trend in the first two decades of bibliometric analysis, with an initial fluctuation in the first five years of the analysis, according to
Figure 3. Starting in 2006, a steady increase was observed, reaching a peak in 2021 with an average of 42 papers cited 3.15 times per year. The year 2022 maintains a high level, with 40 papers cited on average 1.96 times per year. This evolution suggests an intensification of interest and activity in the analyzed field, with a strong focus, particularly in 2021 and 2022.
According to
Table 3, the database used contains 471 additional keywords and 649 author’s keywords, indicating a rich and diverse range of terms associated with the documents. This suggests a wide variety of subjects and topics covered in the research literature.
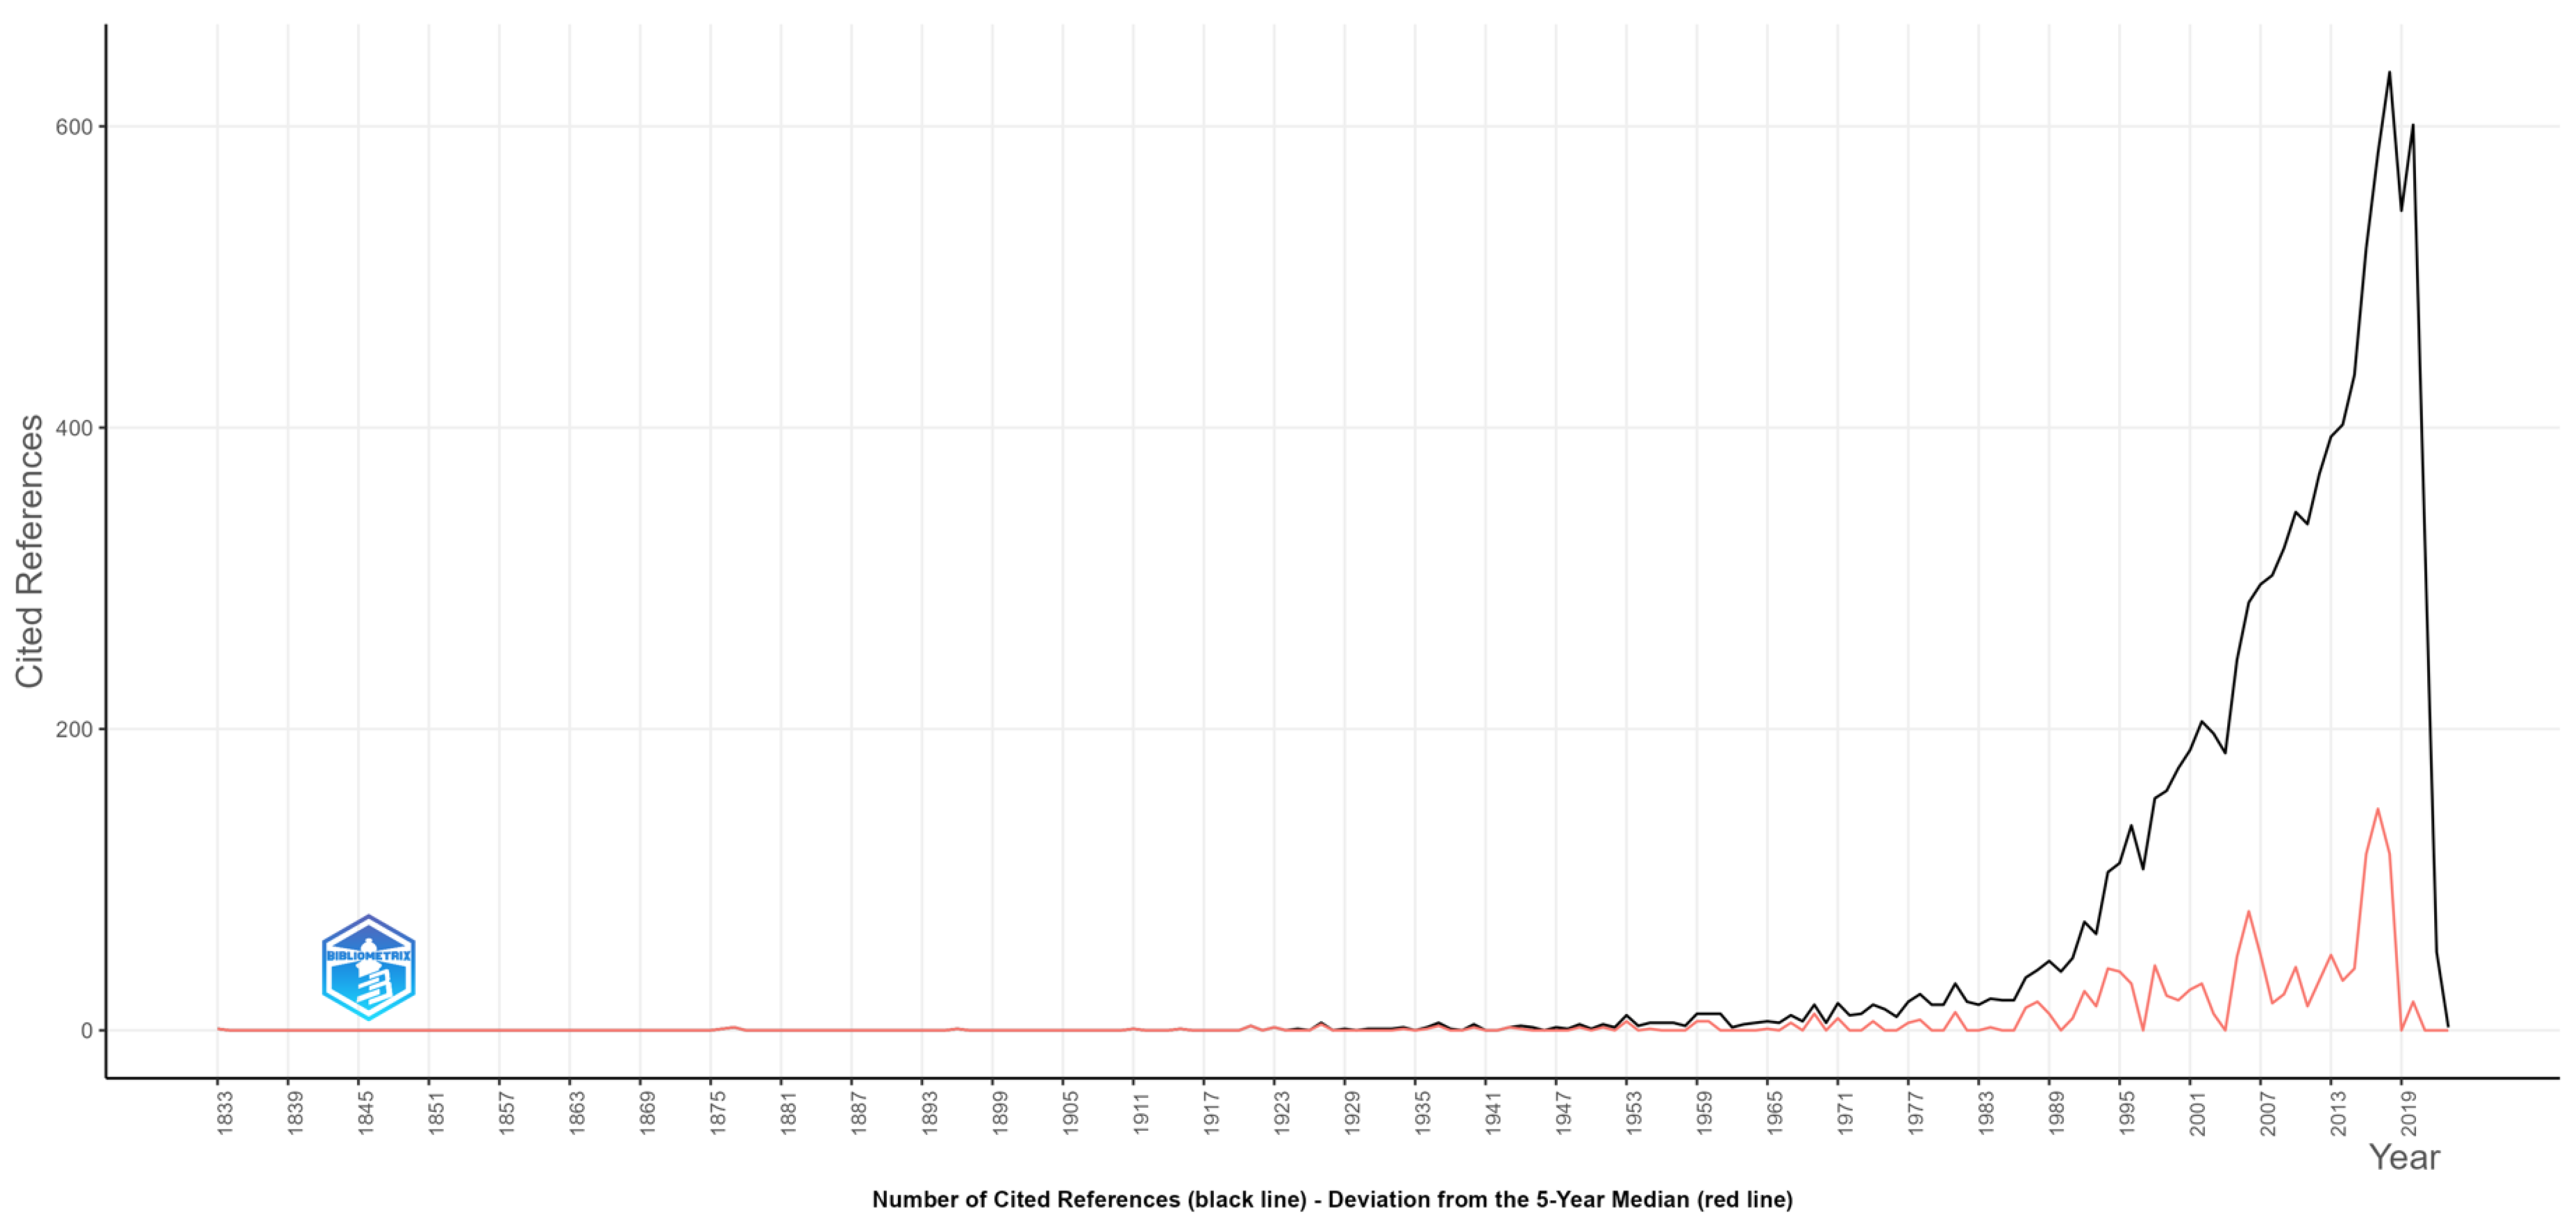
Bornmann and Marx [
59] proposed a specific new form of cited reference analysis. This new form was named Reference Publication Year Spectroscopy (RPYS) [
60]. The most frequent applications of RPYS include discovering seminal papers and the historical roots of papers published in a journal, on a specific topic, or by a researcher. In other words, a graphical representation of the RPYs against the number of cited references shows early peaks where historical roots can be identified.
References to spectroscopy indicate a significant evolution in citations over time, with certain periods of stability and remarkable growth. As observed in
Figure 4, in the early decades of the 19th century, citations were minimal but gradually began to increase in the 1870s. In the 1920s, we observed a slight growth followed by fluctuations in the interwar period. After the 1950s, the number of citations steadily increased, peaking in the 1980s and 1990s. In the 21st century, despite ongoing significant activity, there has been a notable decline in recent years. This evolution may suggest changes in the interest and relevance of research in the field of spectroscopy.
According to
Table 4, the dataset involves contributions from a total of 573 authors. Out of these, 16 authors have produced single-authored documents, while the majority, 557 authors, have contributed to multi-authored documents. This diversity in authorship suggests a collaborative and varied research landscape within the analyzed publications.
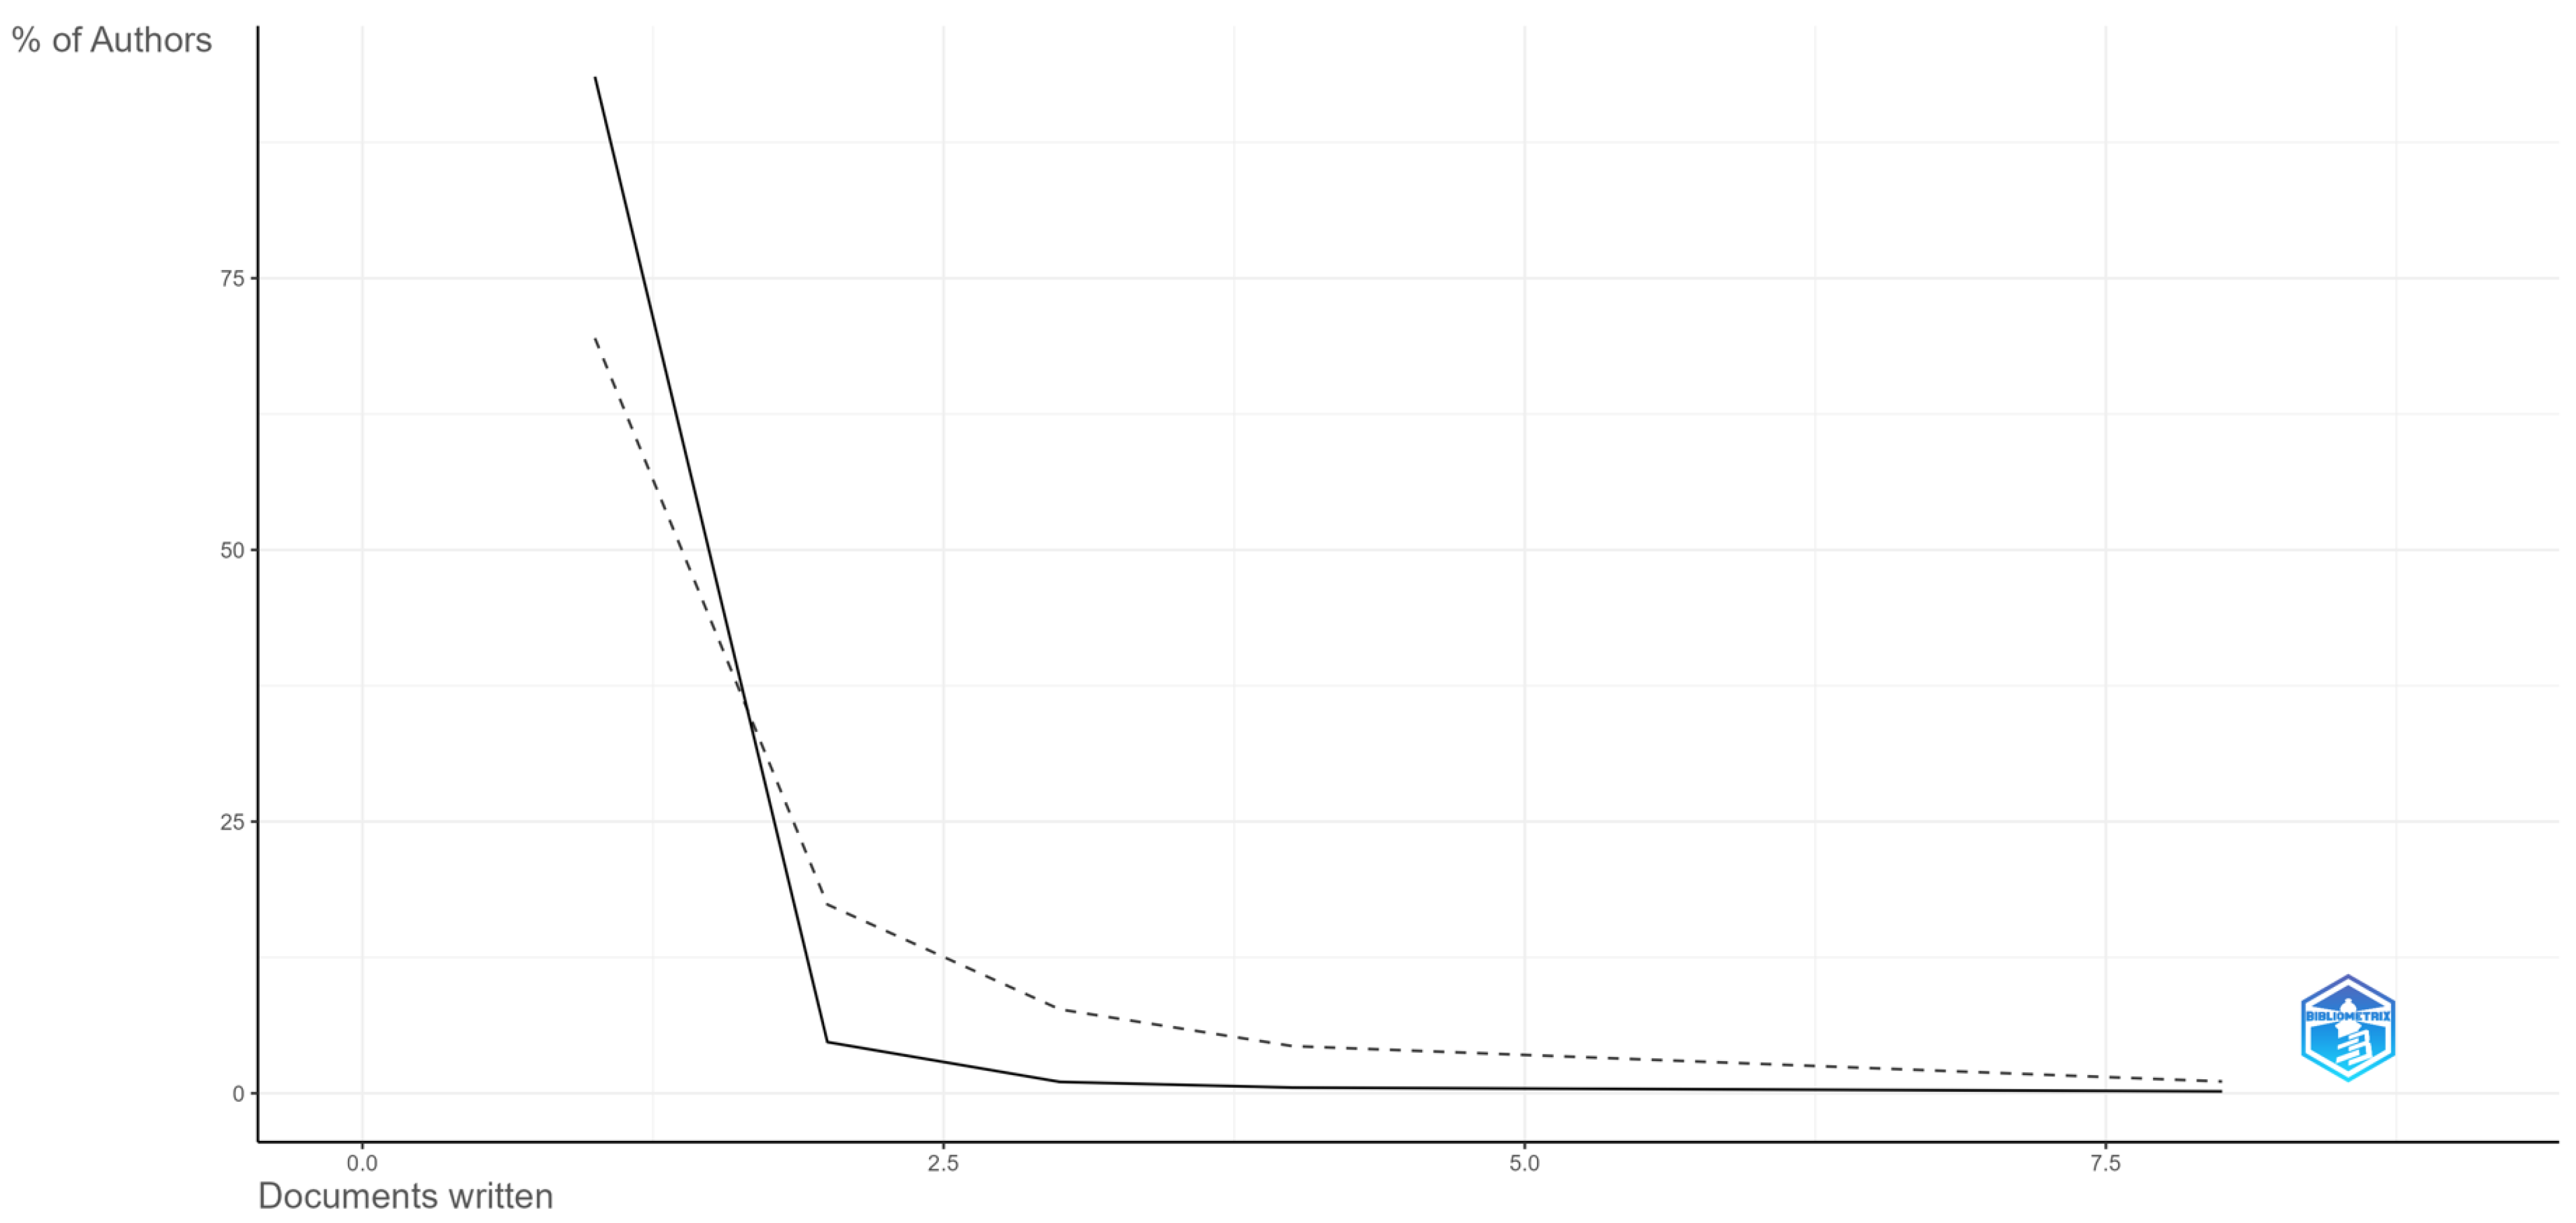
Lotka’s Law is a bibliometric principle used to analyze author productivity based on the distribution of the number of documents written by authors [
61]. According to
Figure 5, the majority of authors have written only one document, constituting approximately 93.5% of the total. The solid lines represent authors who have produced a significant number of works in the researched field, indicating prolific authors or those with a substantial contribution to the literature. On the other hand, the dashed lines represent authors who have contributed fewer works, indicating researchers with less activity in this field. There are 27 authors who have written two documents, making up about 4.7% of the authors. This distribution follows Lotka’s Law, which suggests that a small percentage of authors contribute the majority of documents, while a larger proportion of authors contribute fewer documents [
62].
Table 5 provides information about author collaboration in this study. The number of single-authored documents is 16, with an average of approximately 3.49 co-authors per document. The collaboration index is 31.11, indicating a significant level of collaboration among authors in the production of documents.
3.2. Sources
Regarding the bibliometric analysis of sources, Bibliometrix offers the possibility to conduct analyses based on the most relevant sources, most locally cited sources, Bradford’s Law, sources’ local impact, and sources’ production over time.
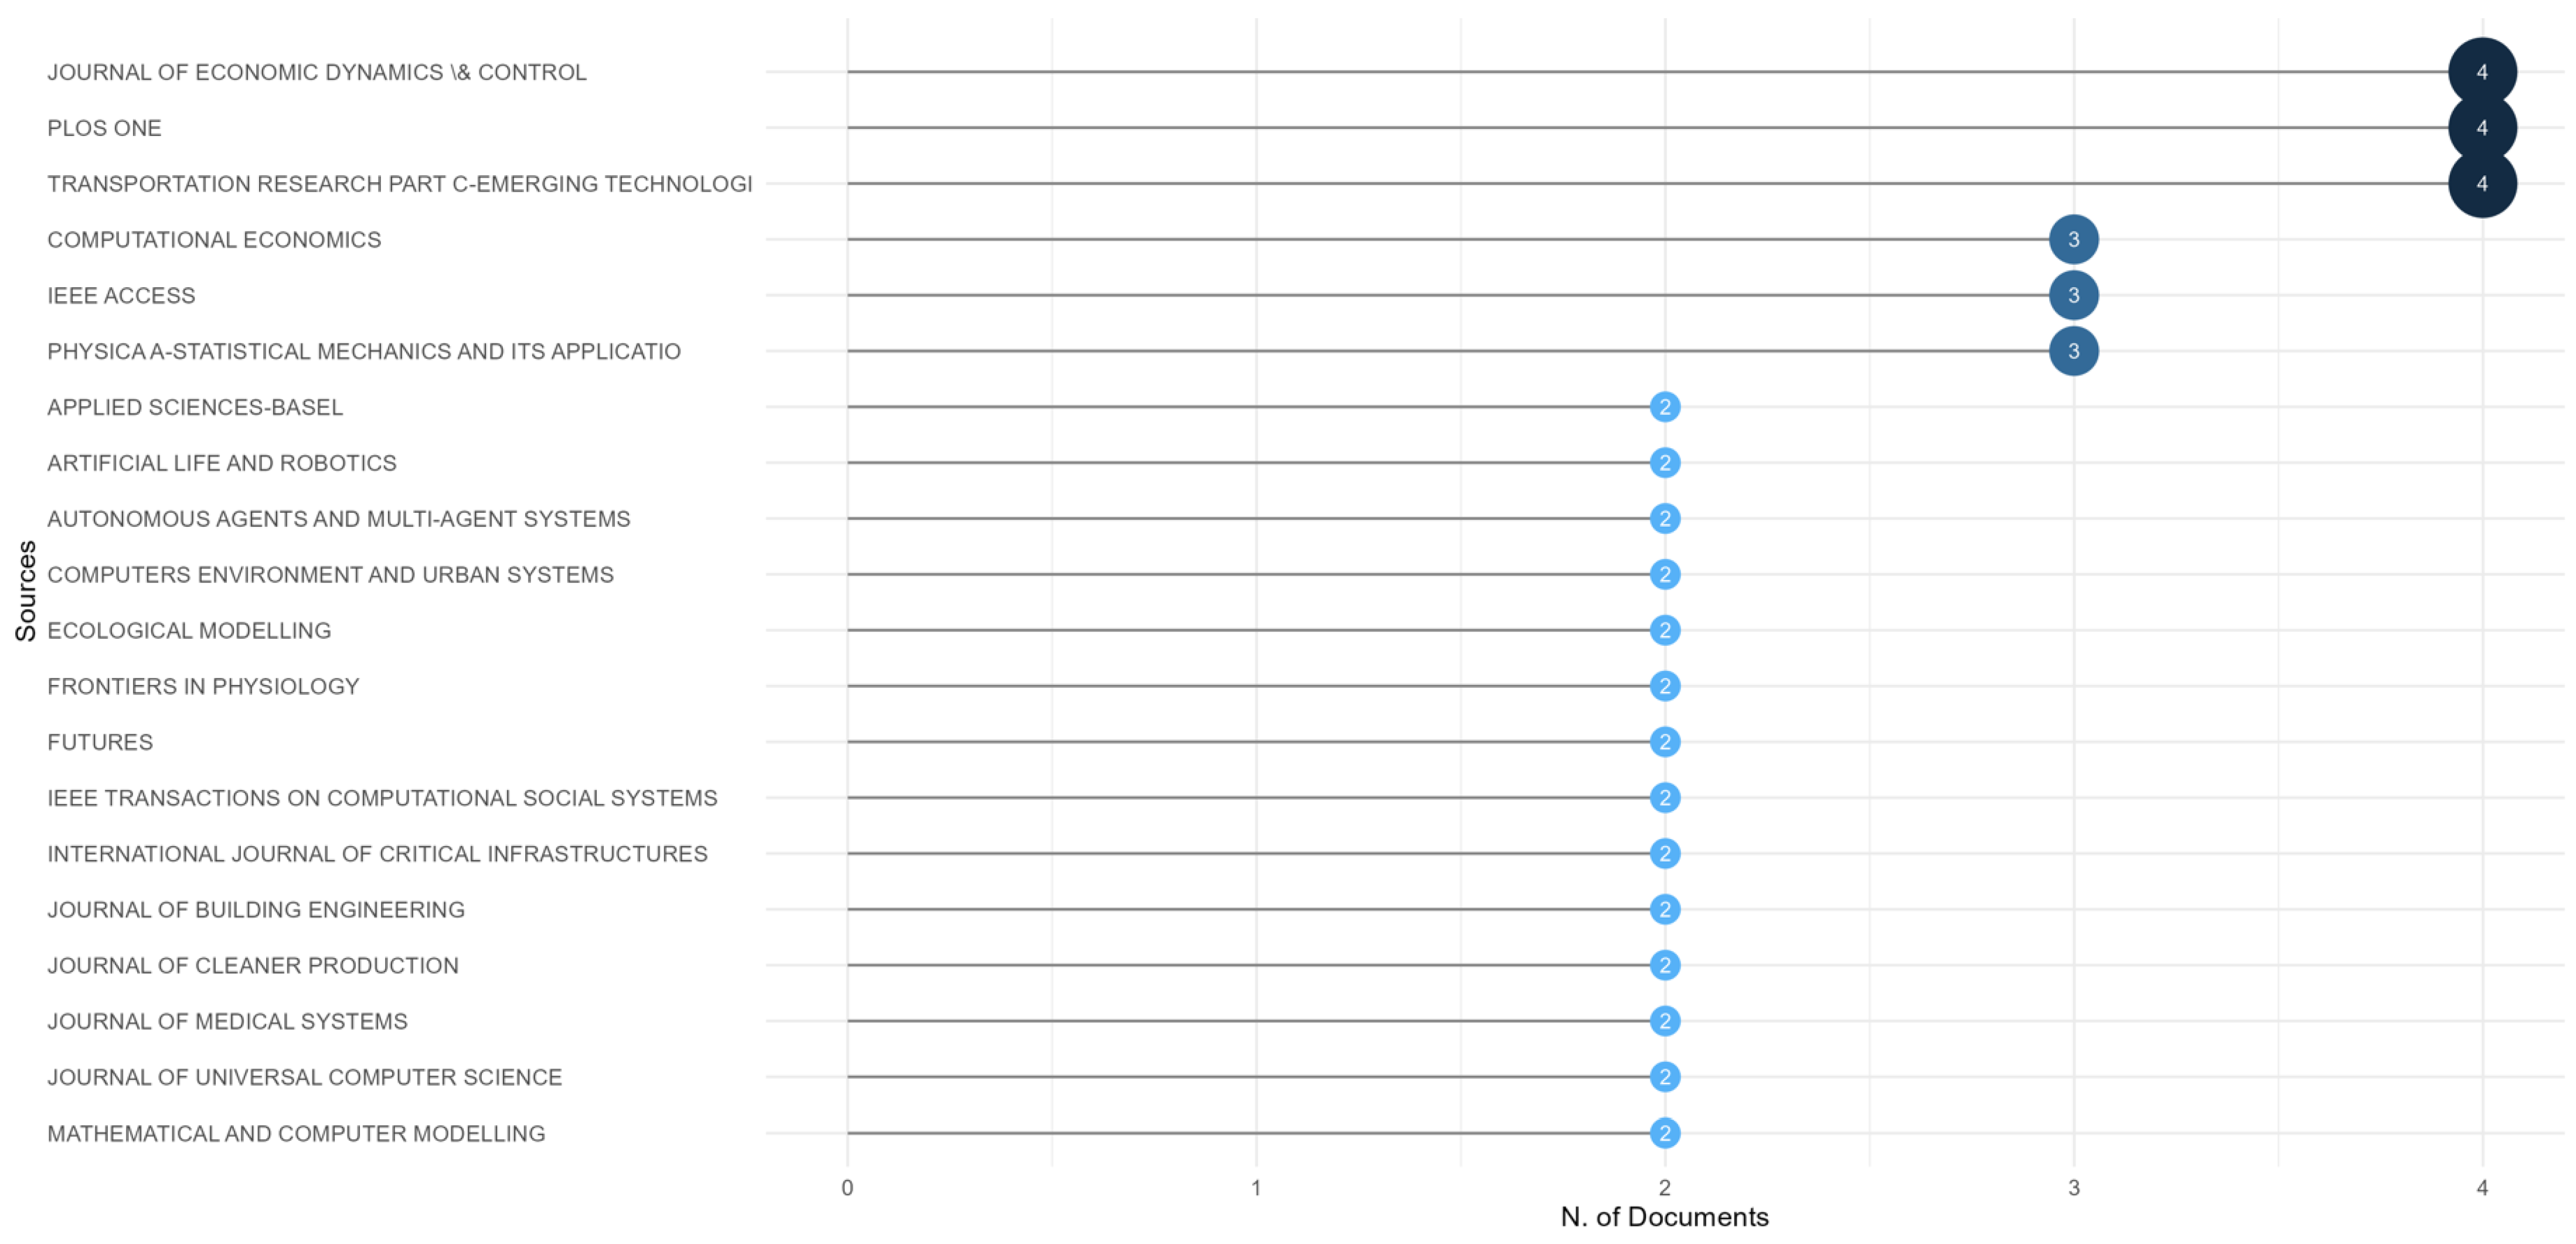
Figure 6 presents the analysis of the top 20 most relevant journals.
The analysis of the top 20 most relevant journals in the context of our research provides insights into the key journals contributing to the field, indicating the diversity and significance of research across various platforms. The top 20 most relevant journals span a diverse range of disciplines, indicating the interdisciplinary nature of research in AI and ABM applications. Journals such as Journal of Economic Dynamics & Control, PLOS ONE, and Transportation Research Part C-Emerging Technologies appear to be prominent contributors. The variety of journals with multiple articles suggests a broad exploration of AI applications in ABM, covering economic dynamics, control, emerging technologies, computational economics, and more. This diversity signifies a comprehensive examination of the subject matter. Journals like Journal of Economic Dynamics & Control and PLOS ONE are notable for having a higher number of articles, indicating a sustained interest and significant contributions in these outlets. Journals such as IEEE Transactions on Computational Social Systems highlight engagement with cutting-edge platforms, showcasing an awareness of emerging technologies and social aspects in computational systems. The presence of journals like Ecological Modelling and Frontiers in Physiology indicates a cross-disciplinary exploration, showcasing the broader impact of AI and ABM beyond traditional domains.
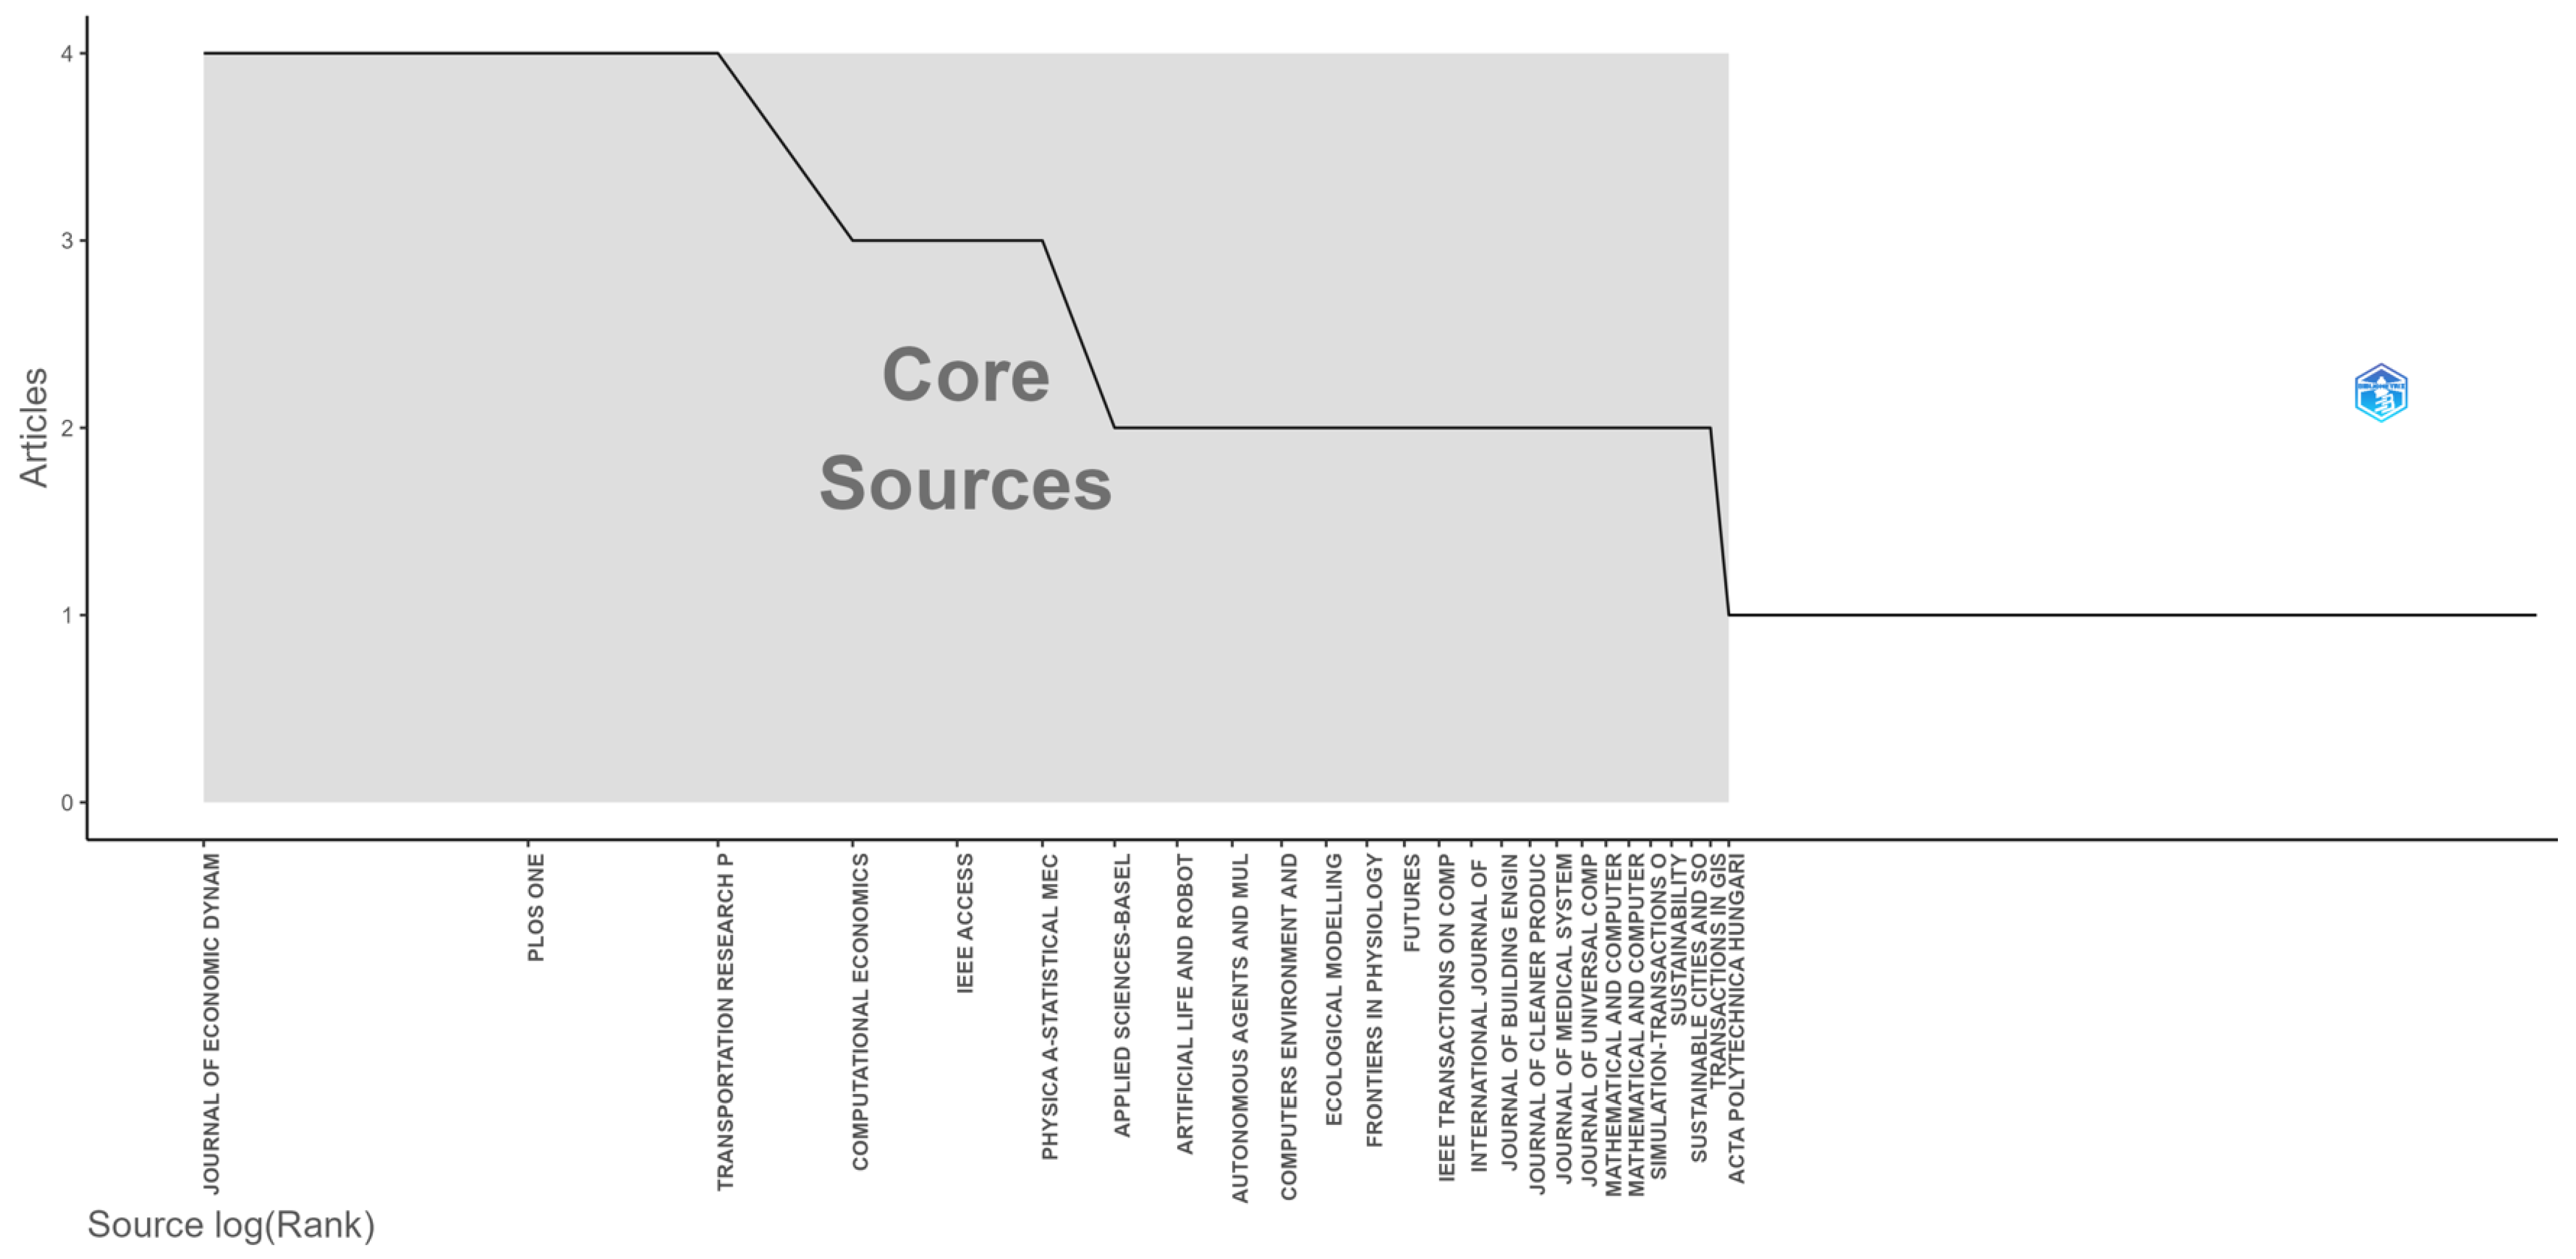
Bradford’s Law on Source Clustering categorizes journals into different zones based on the distribution of articles (
Figure 7).
Journals in Zone 1 have the highest productivity and contribute significantly to the research field. Notable journals include “Journal of Economic Dynamics and Control”, “PLOS ONE”, and “Transportation Research Part C-Emerging Technologies”. These journals have a high frequency of articles, indicating a concentrated focus on the chosen research topic. Journals in Zone 2 have moderate productivity, contributing less than the top journals but still making a substantial impact. Examples include “Administrative Sciences”, “Advances in Complex Systems”, and “Applied Energy”. This zone represents a middle ground in terms of research output. Journals in zone 3 have lower productivity compared to zones 1 and 2. They cover a wide range of topics and may not be as central to the core research focus. Examples include International Journal of Health Geographics, Sensors, and SoftwareX.
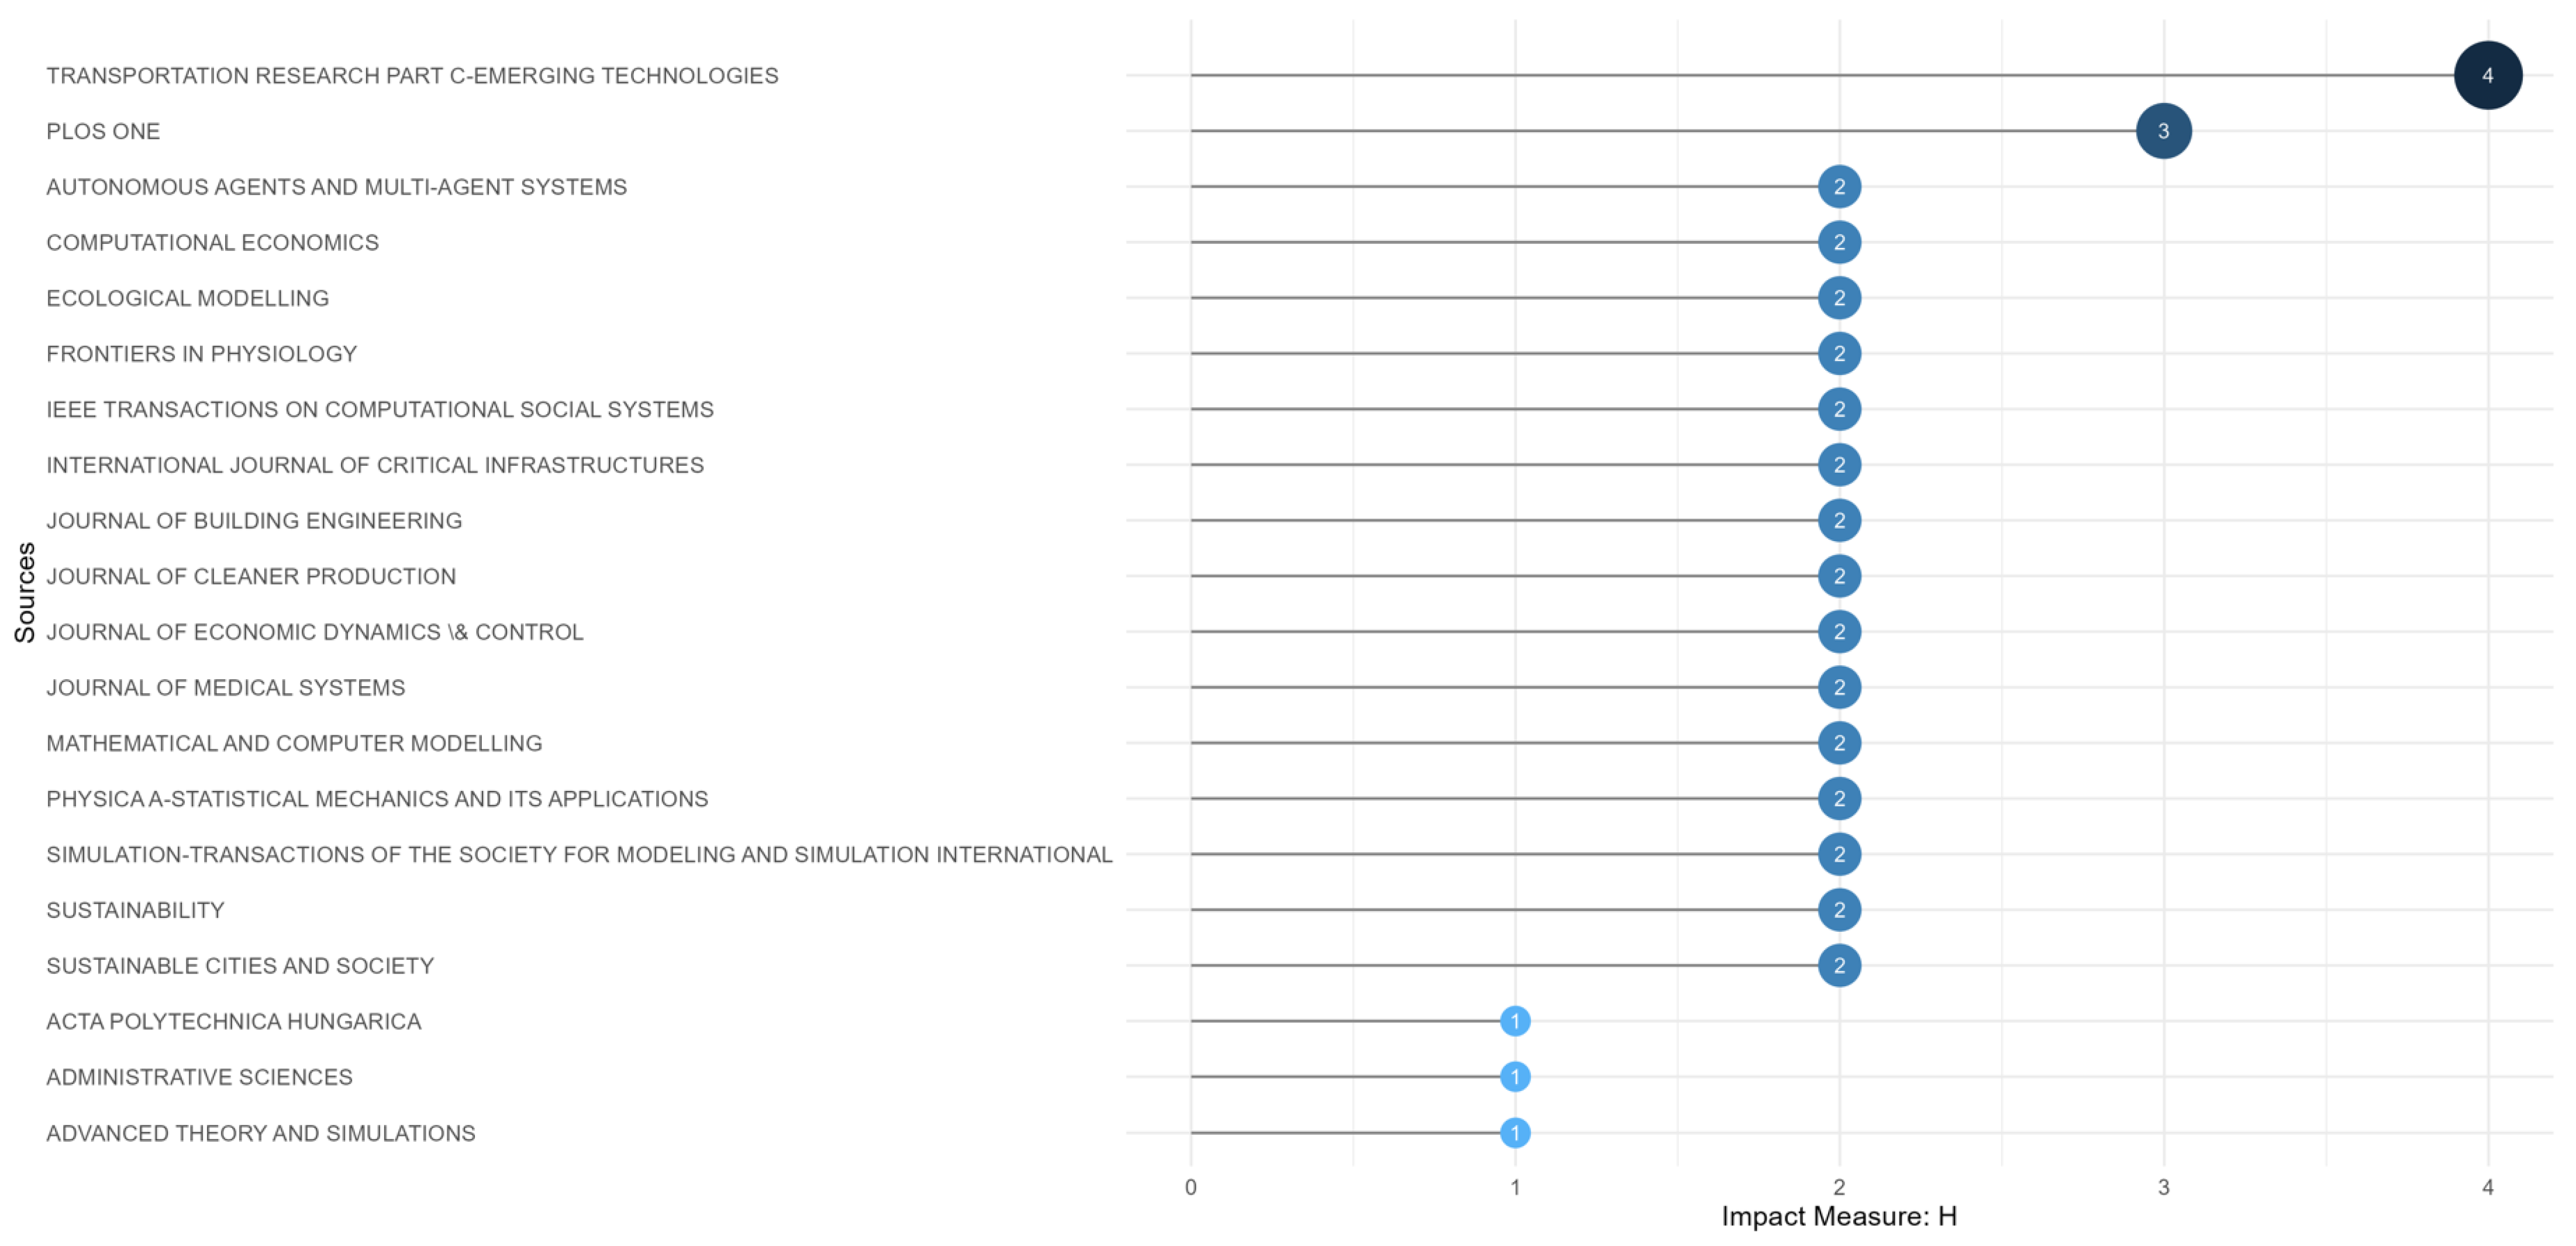
Source Local Impact, based on the H-index, highlights the relative impact of various sources (journals) based on the H-index. The H-index represents the number of articles from a source that have at least H citations each. As seen in
Figure 8, for example, the journal
Transportation Research Part C-Emerging Technologies has an H-index of 4, meaning there are 4 articles with at least 4 citations each.
PLOS ONE has an H-index of 3, indicating there are 3 articles with at least 3 citations each. This analysis provides a quick overview of the relative impact of each source, considering both the number of articles and citations. A higher H-index suggests a more significant influence in the scientific community.
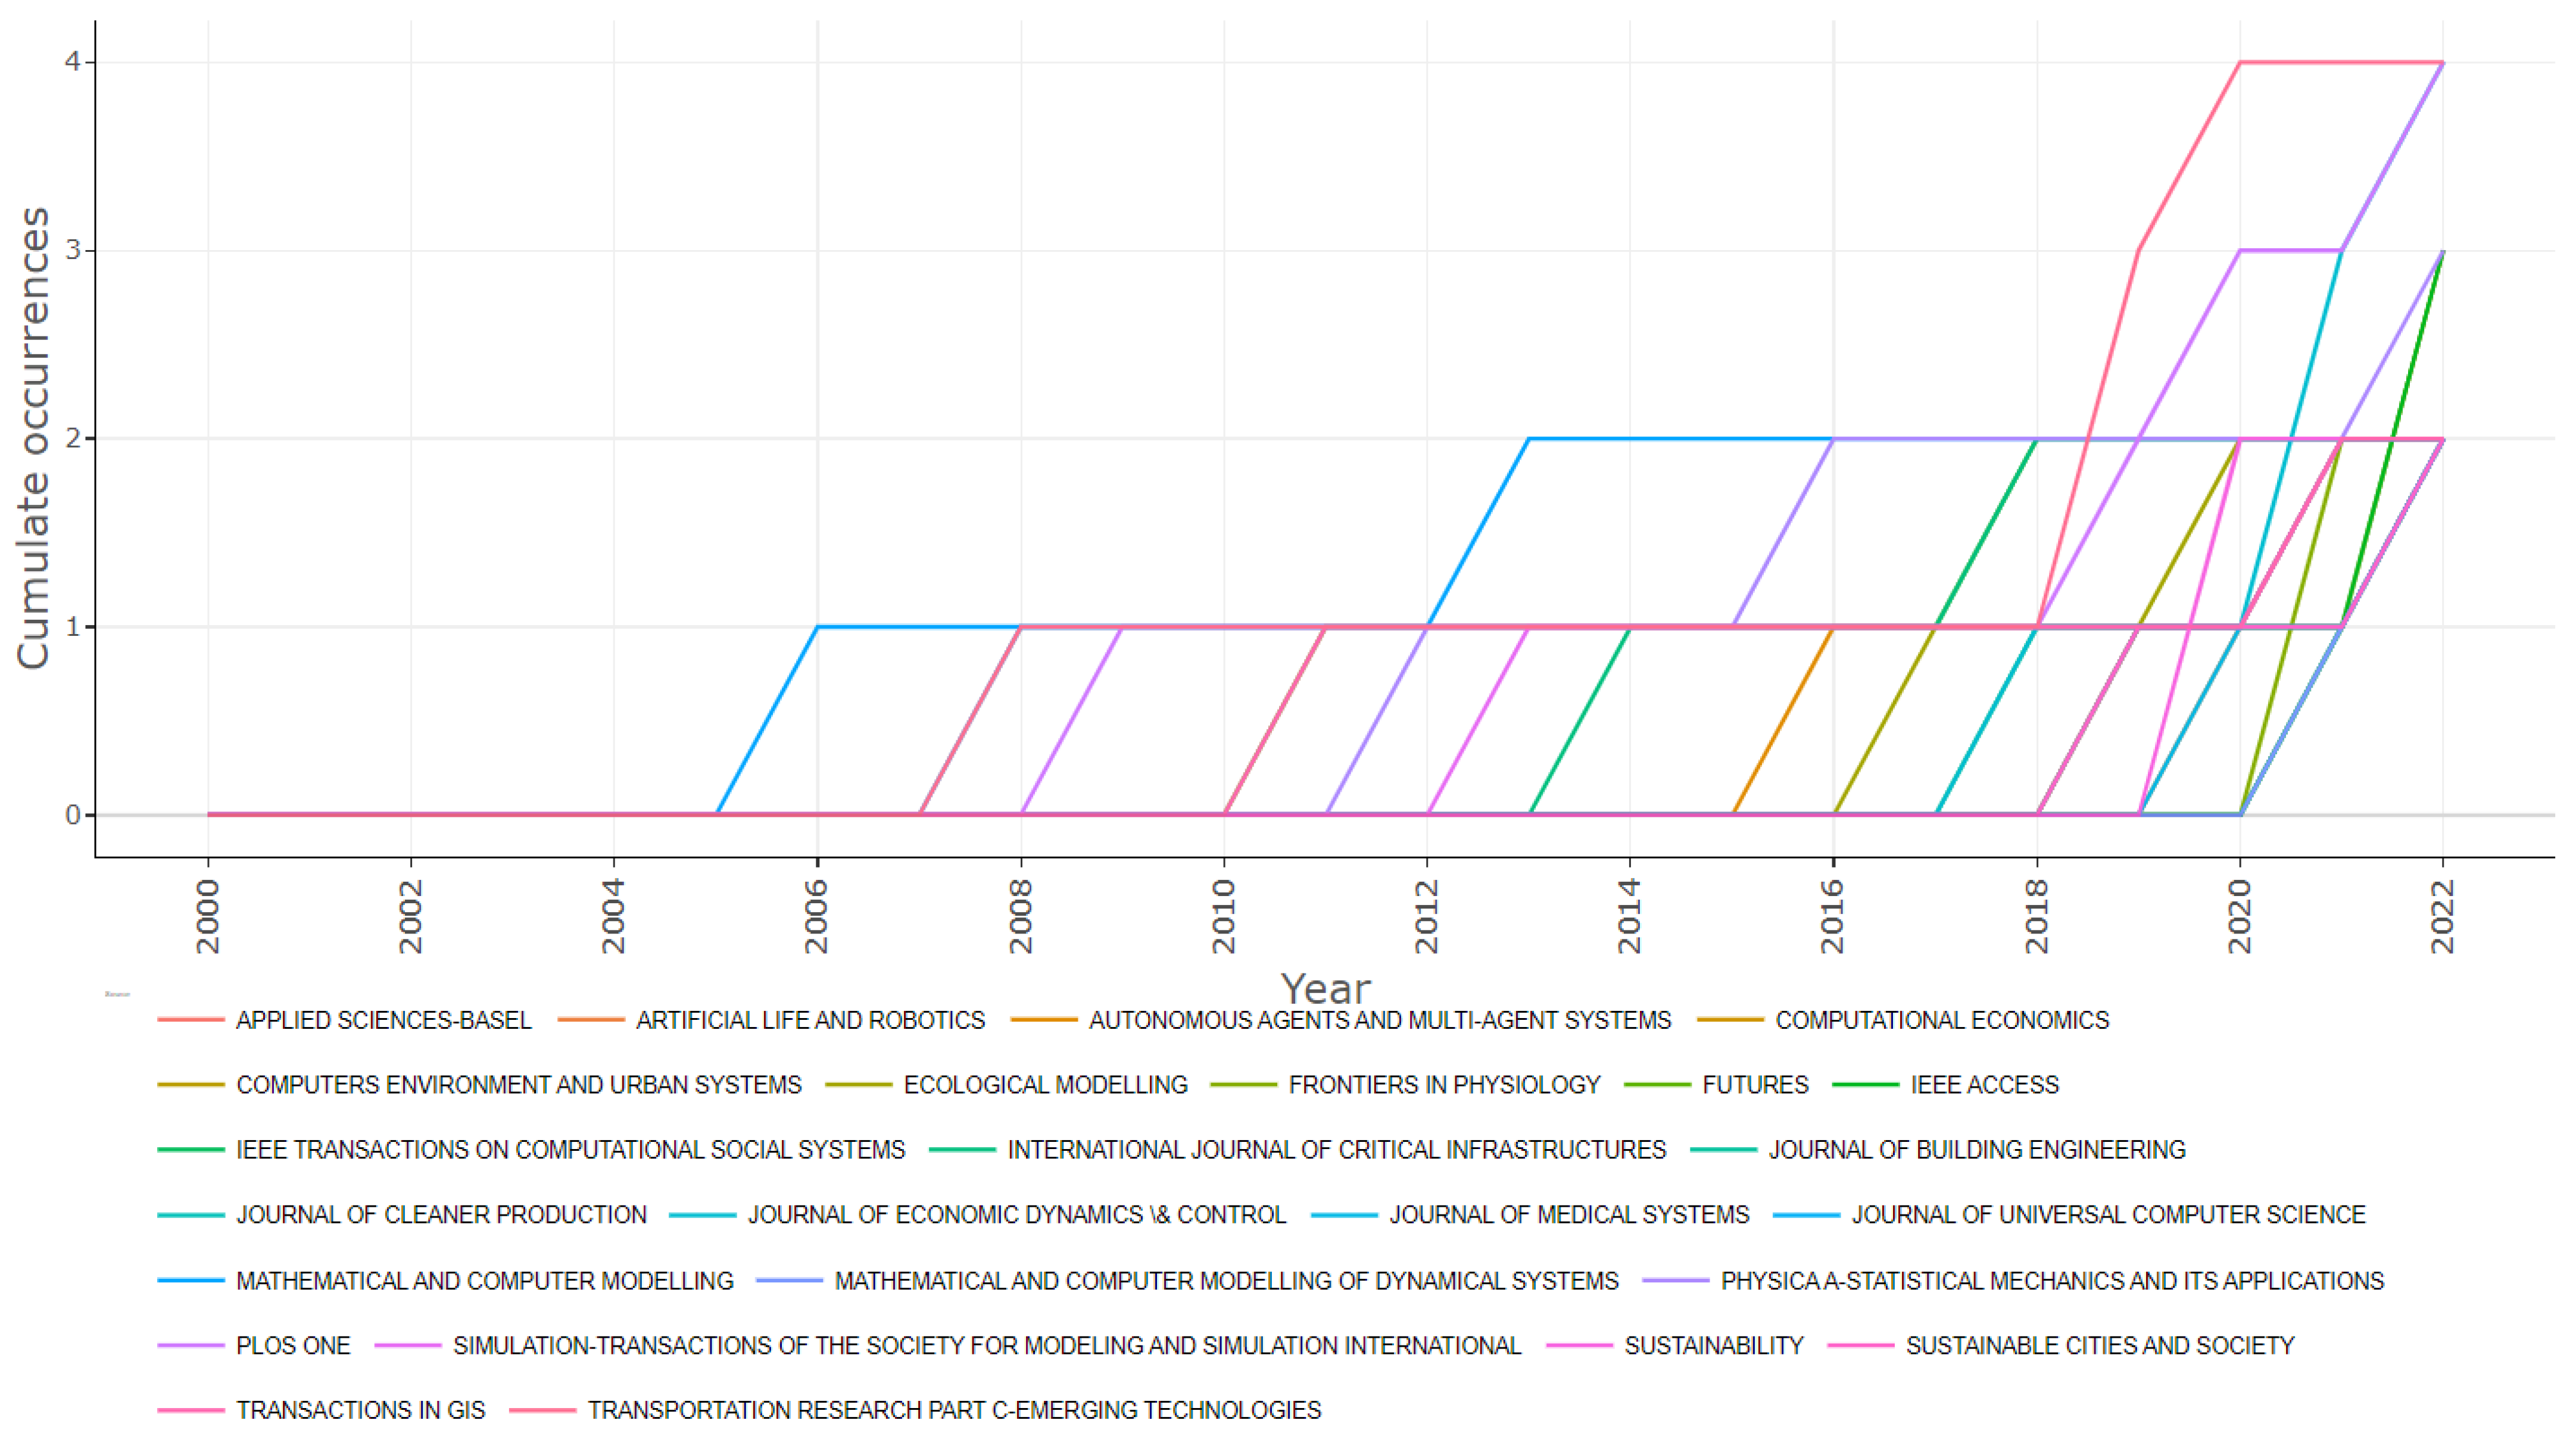
The Sources’ Production over Time analyzes the evolution of the number of articles published in various journals over the years. In this context, we can focus on several notable observations (
Figure 9):
Journal of Economic Dynamics & Control, PLOS ONE, and Transportation Research Part C-Emerging Technologies have shown consistent growth in production since 2008 and have maintained a significant level in recent years;
The year 2012 marked a significant increase in article production for many of the listed sources, such as Physica A-Statistical Mechanics and its Applications, Applied Sciences-Based, and IEEE Transactions on Computational Social Systems;
A significant number of sources have recorded steady growth in recent years, including Sustainability, Sustainable Cities and Society, and the Journal of Building Engineering;
After 2020, most sources seem to maintain a high level of production, suggesting a continued interest in the fields covered by these journals.
3.3. Authors
When it comes to author analysis, the most relevant authors will be examined, including the top 20 authors’ production over time, the top 20 most relevant affiliations, and the top 20 most relevant corresponding author’s countries.
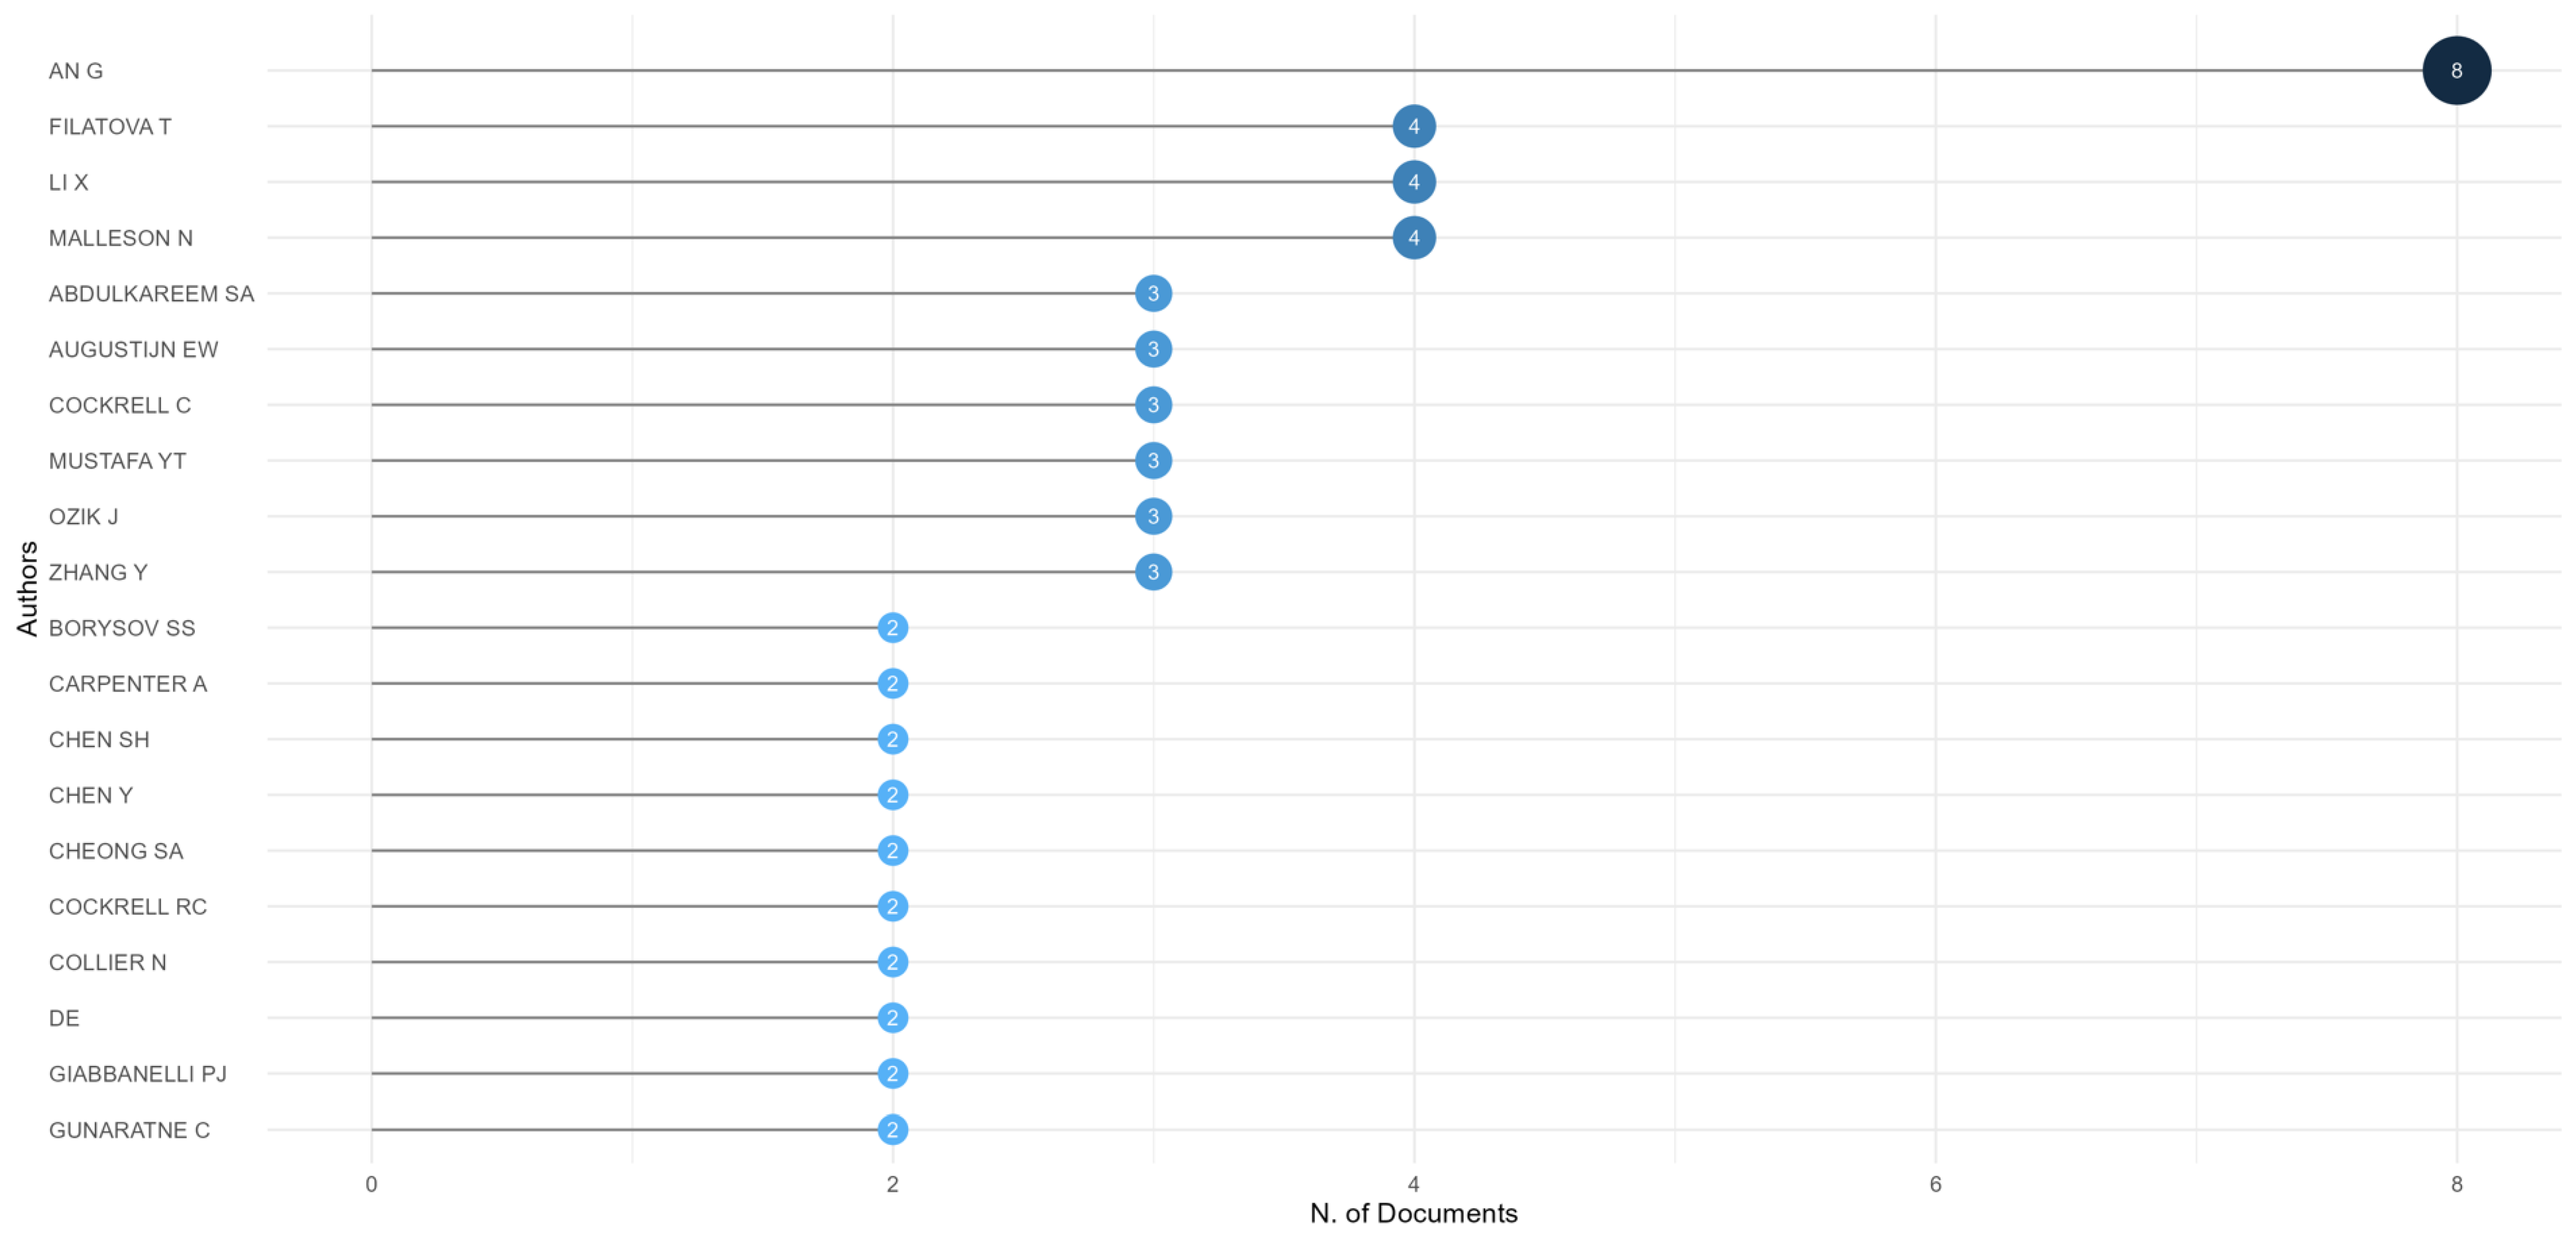
Regarding the top 20 relevant authors, according to
Figure 10, An G. stands out with 8 articles, followed by Filatova T., Li X., and Malleson N. with 4 articles each.
In
Figure 11, we display the publication frequency of various authors across different years. For example, Abdulkareem S.A. has published three articles, one in each of the years 2018, 2019, and 2020. The author has received 13 citations, with a yearly citation average of 2.16. Additionally, author An G. has published 8 articles, one of which was cited in 2019 a total of 30 times, averaging 2 citations per year. In 2017, there was an article with 20 citations, and in 2018, there was another article with 19 citations. Similarly, in 2019, another article had a total of 13 citations. In 2021, An G. published 4 articles, accumulating a total of 16 citations, with an average yearly citation of 5.33.
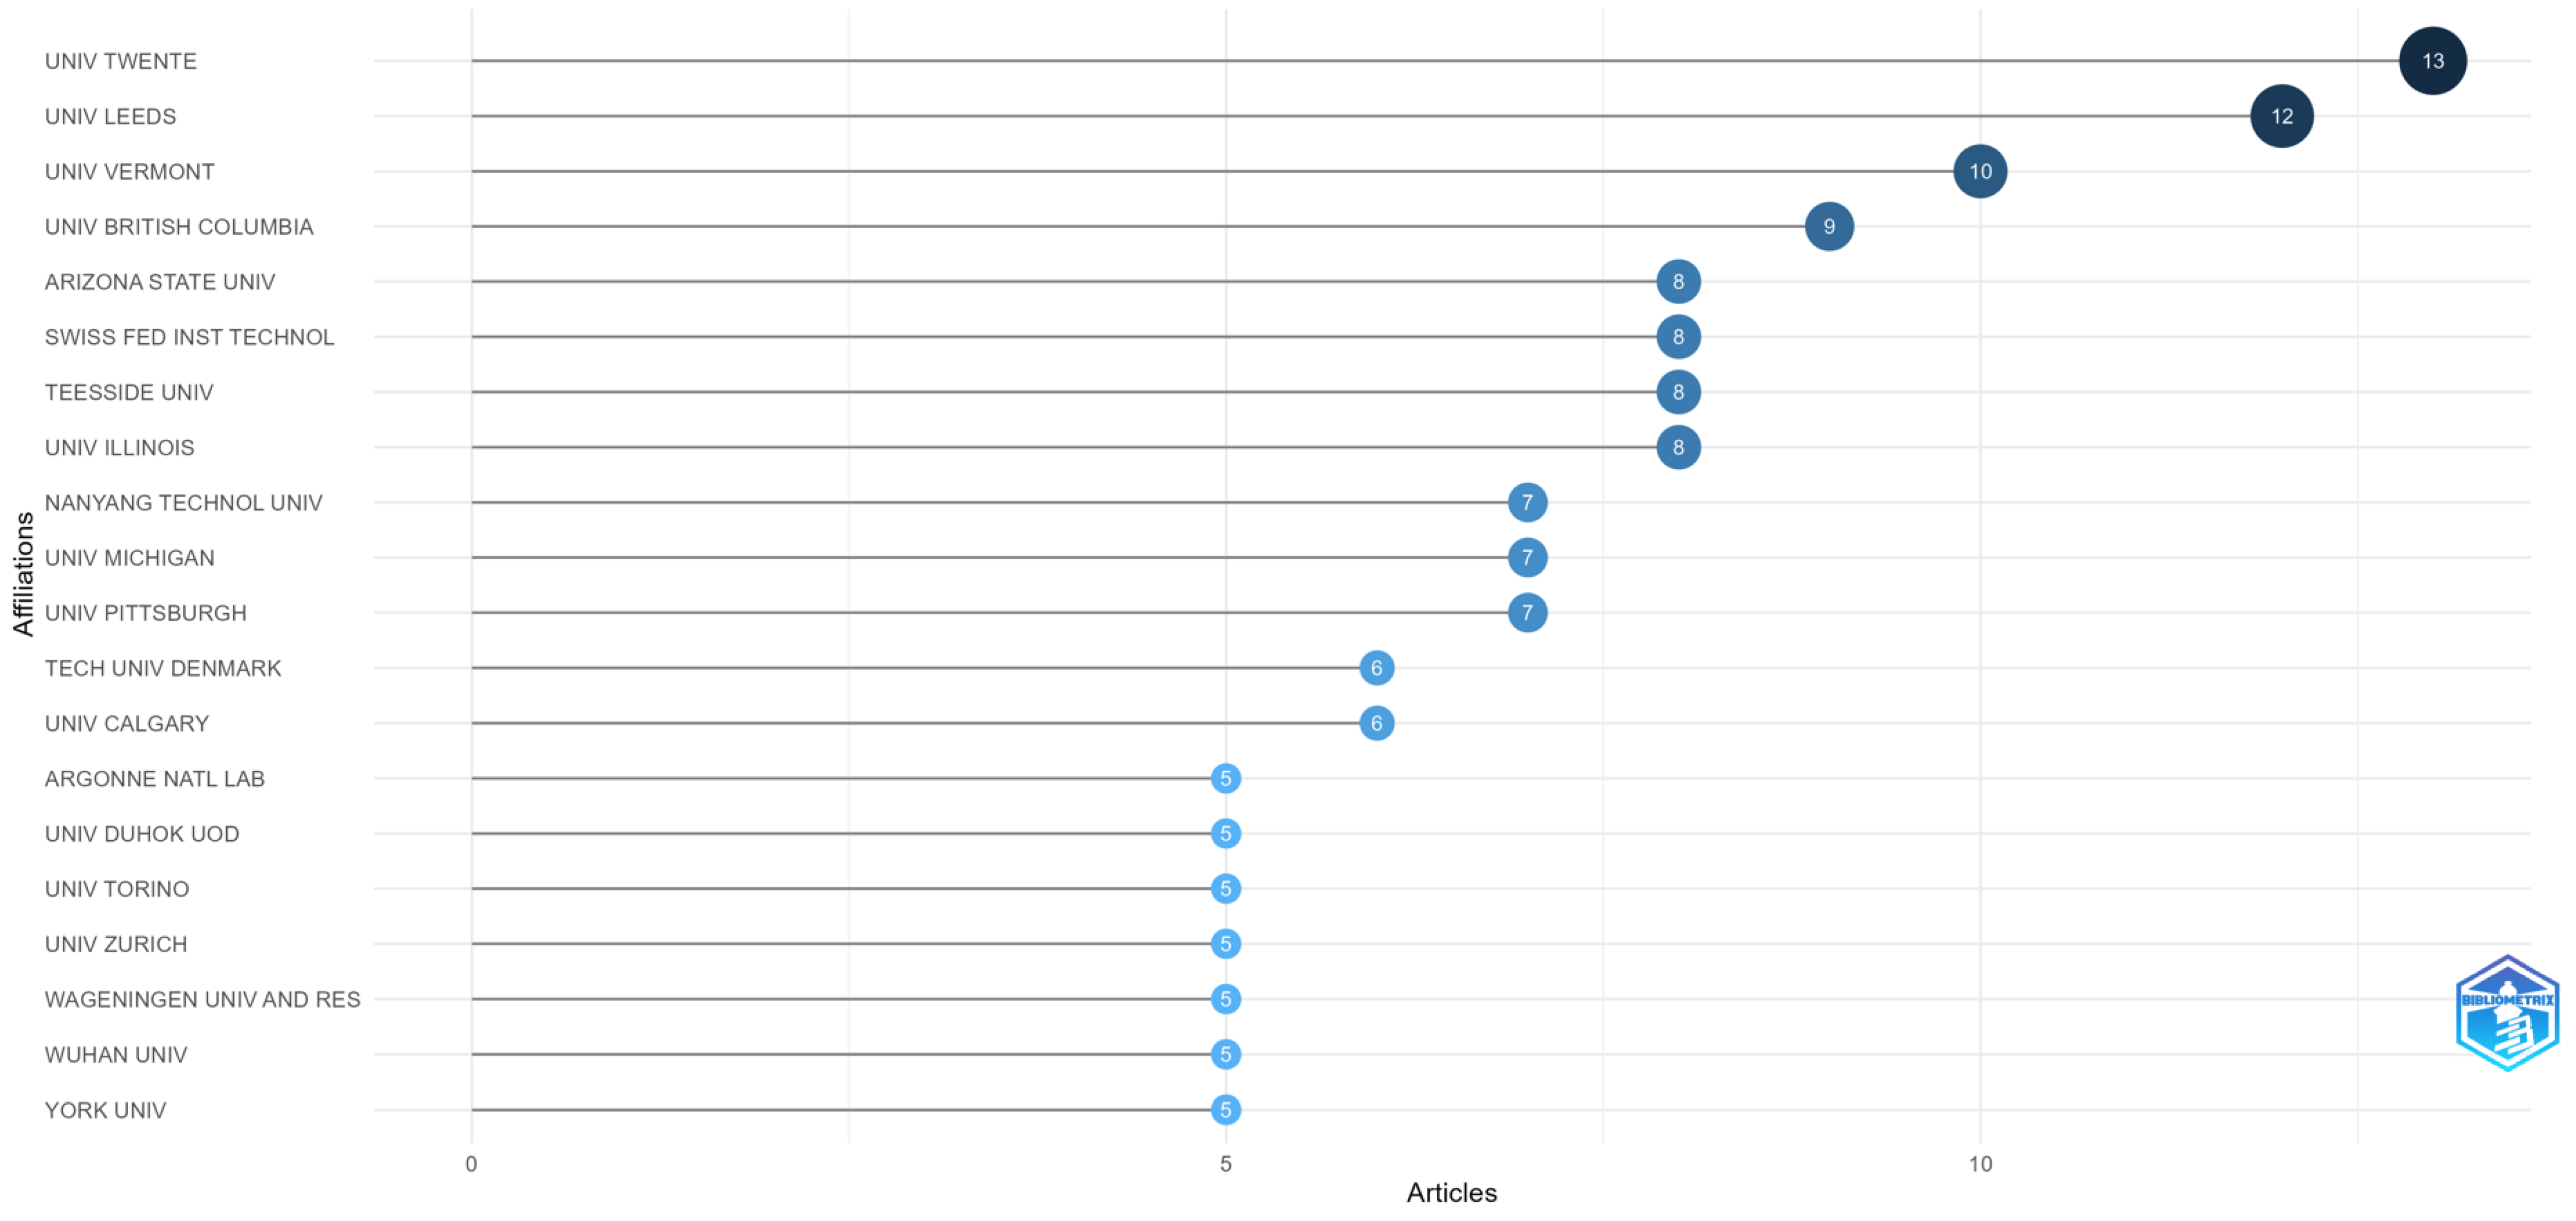
In the context of our study, the most relevant affiliations, based on the number of articles, are represented in
Figure 12. These affiliations have shown significant productivity in the fields of AI and ABM, contributing to the breadth and depth of research on the subject.
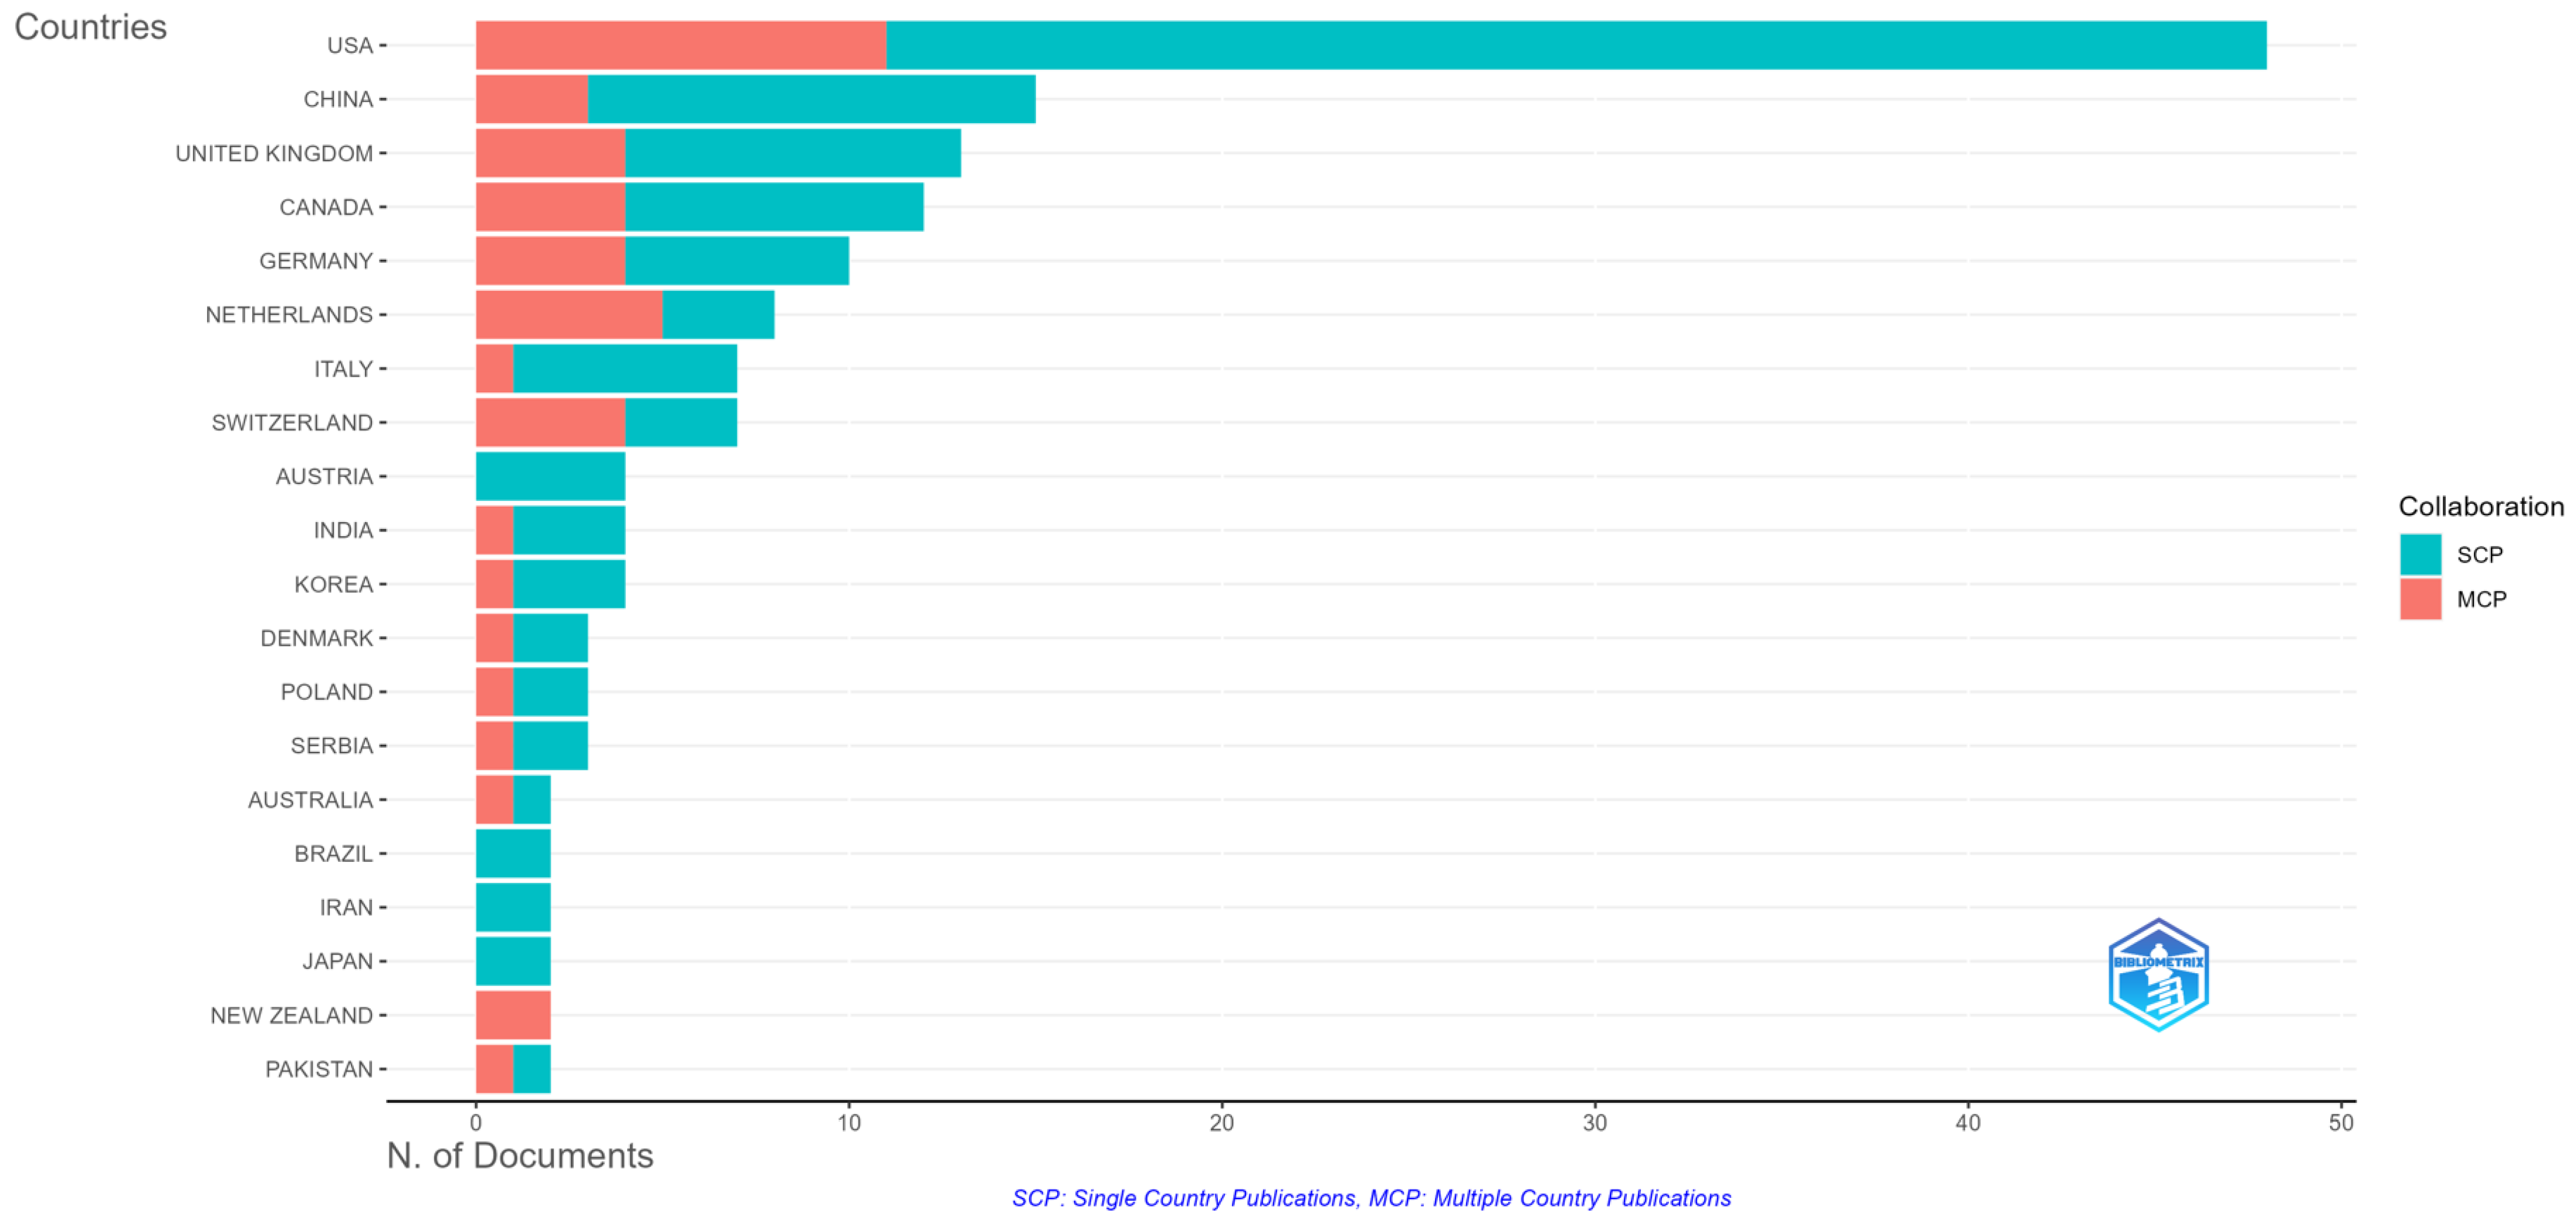
In the context of our research, focusing on the use of AI in ABM applications, the most relevant countries, based on the number of articles and various metrics, are represented in
Figure 13.
These countries, particularly the USA, China, UK, Canada, and Germany, have demonstrated notable contributions to research in the fields of AI and ABM. The SCP (single country publications) and MCP (multiple country publications) metrics provide insights into the collaborative nature of publications, and the frequency and MCP ratio offer additional perspectives on the distribution and collaboration patterns.
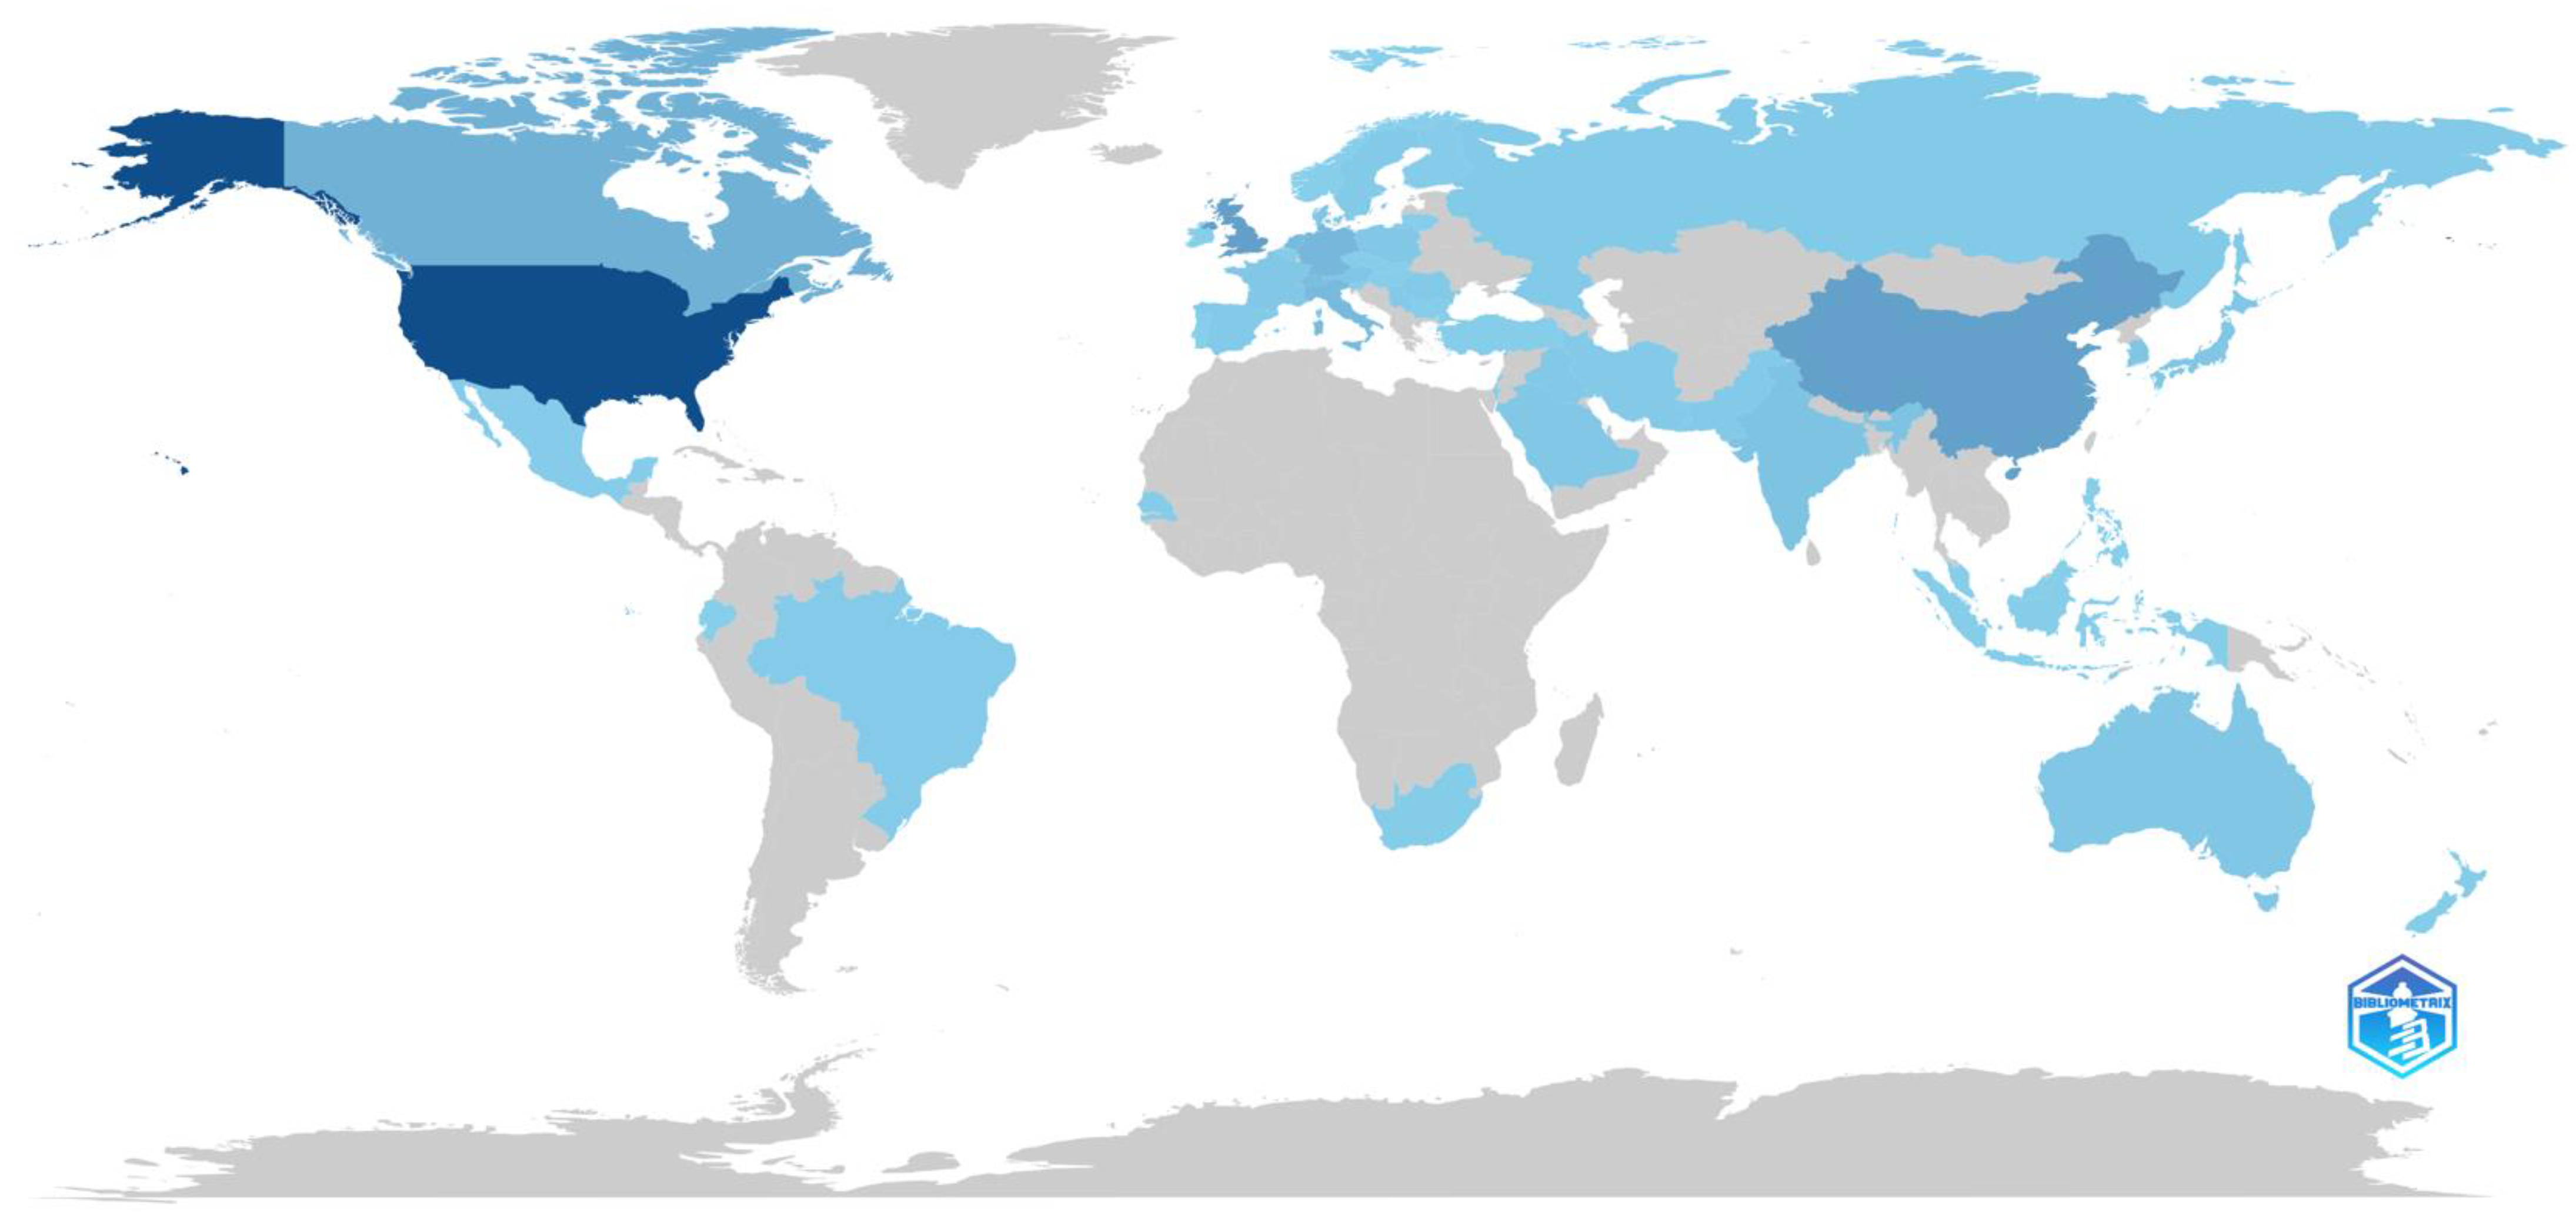
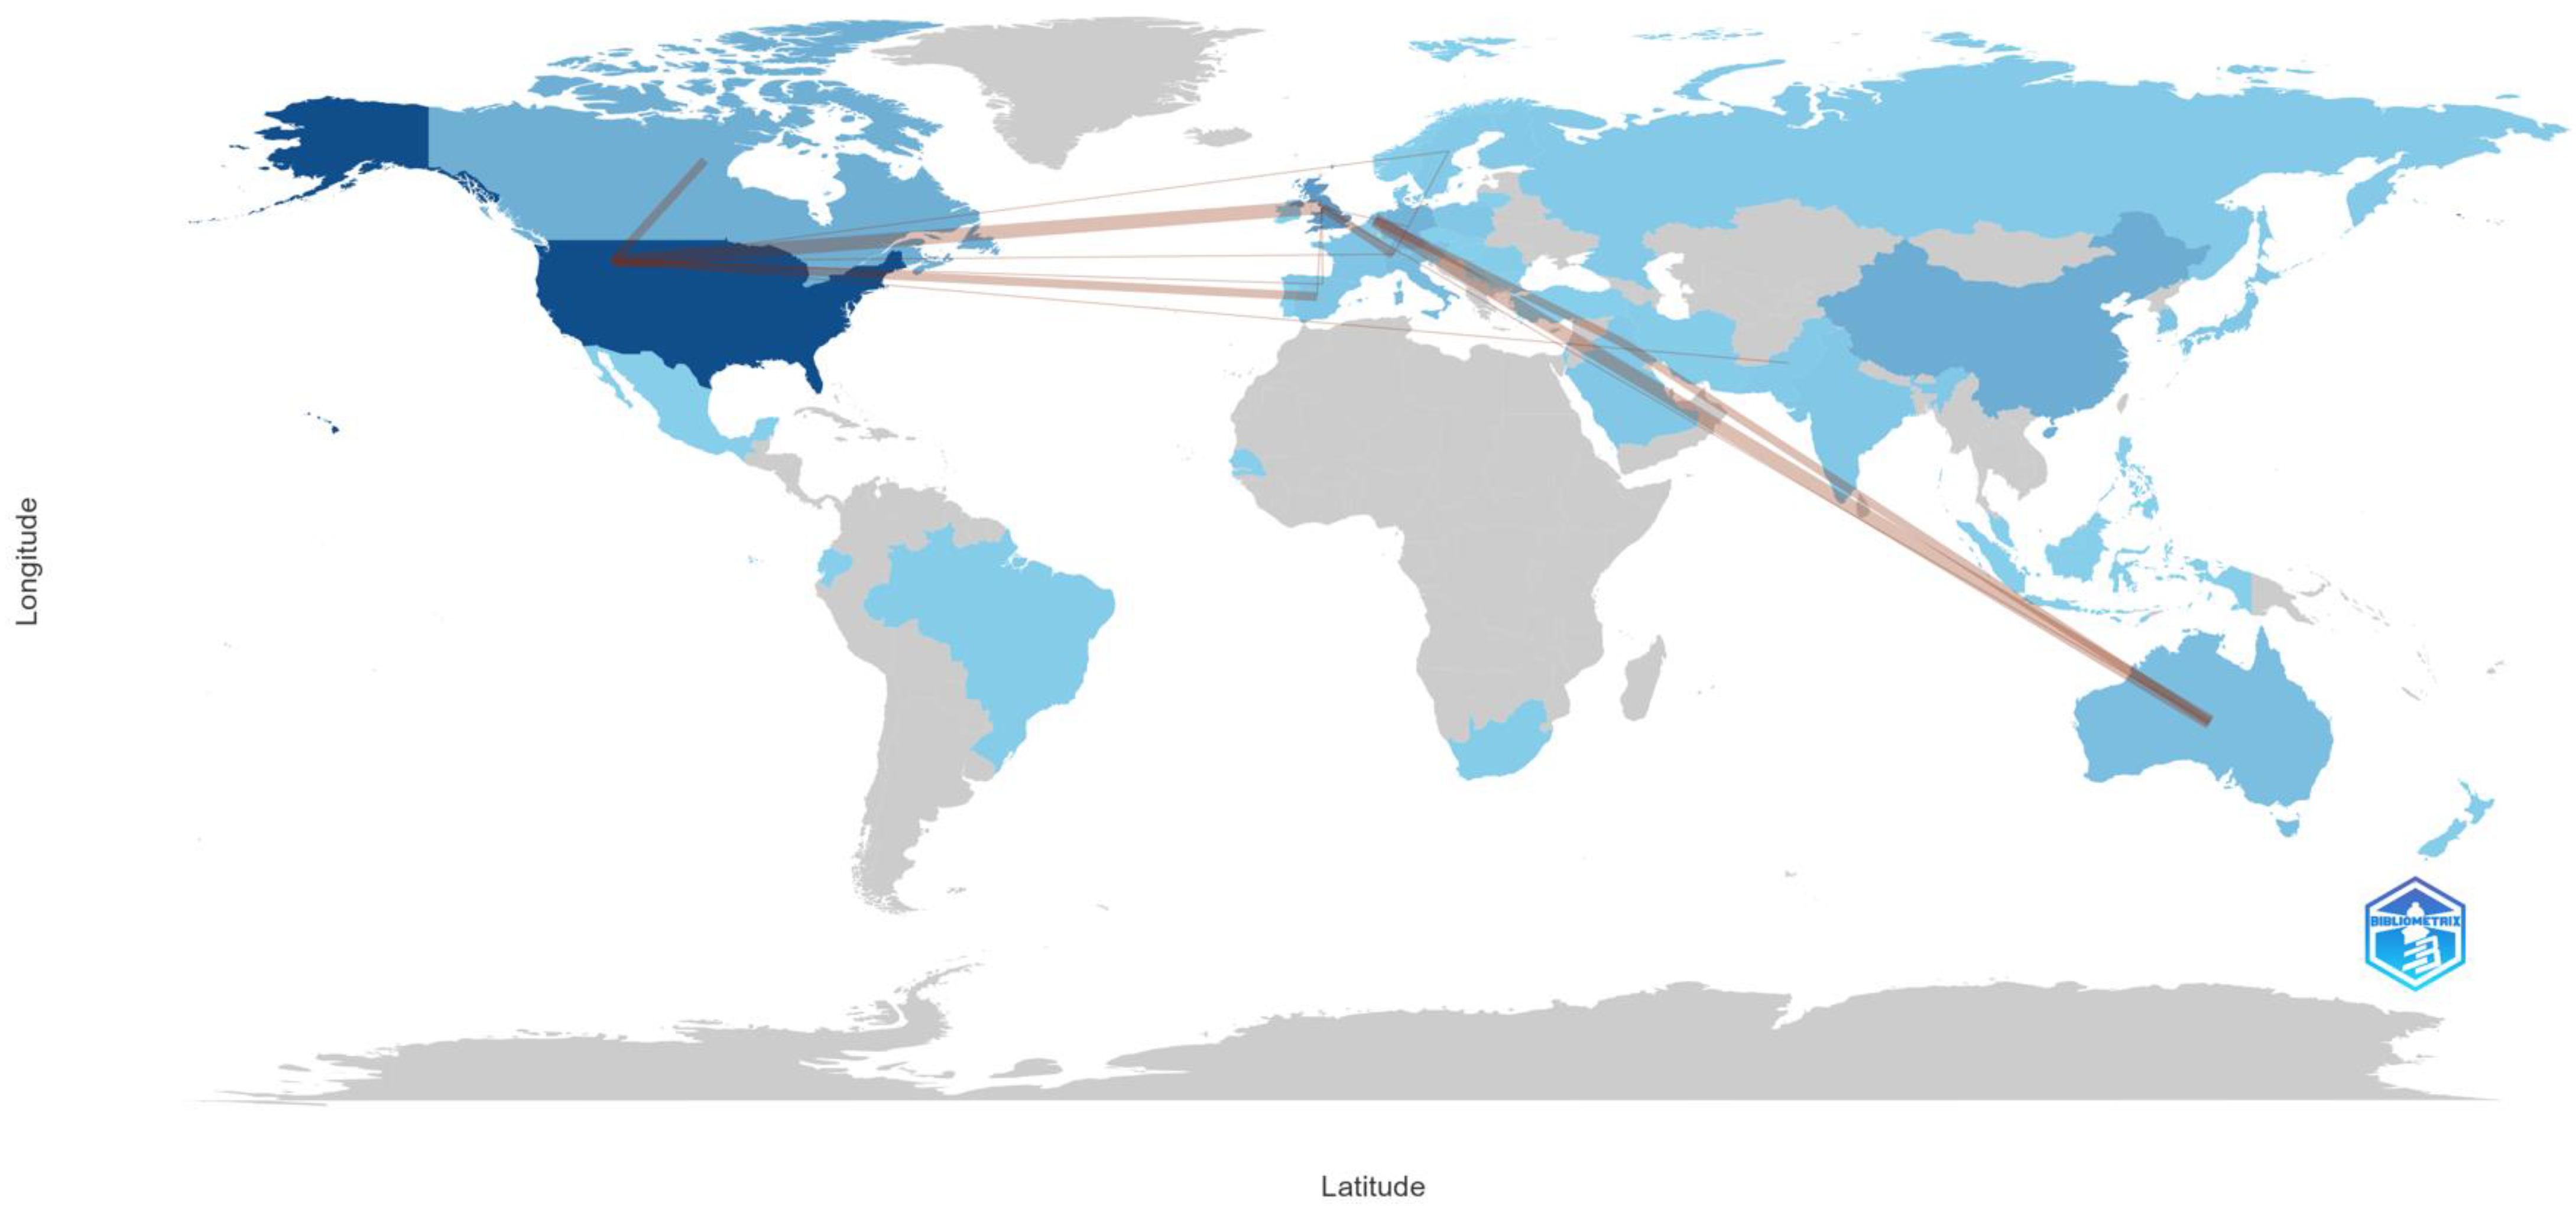
The map in
Figure 14 illustrates the distribution of scientific production across various countries. The intensity of the blue color on the map corresponds to the volume of scientific production for each country. A darker shade of blue indicates a higher number of publications, while a lighter shade represents a lower number of publications. In this visual representation, the color gradient serves as a quick reference to assess the relative research output across different countries. It is evident that certain countries dominate the research landscape, while others make more modest contributions. Additionally, regional trends and relationships between regions can be observed based on the frequency of scientific production. Furthermore, it is notable that the USA dominates scientific production, indicating a significant contribution to global research.
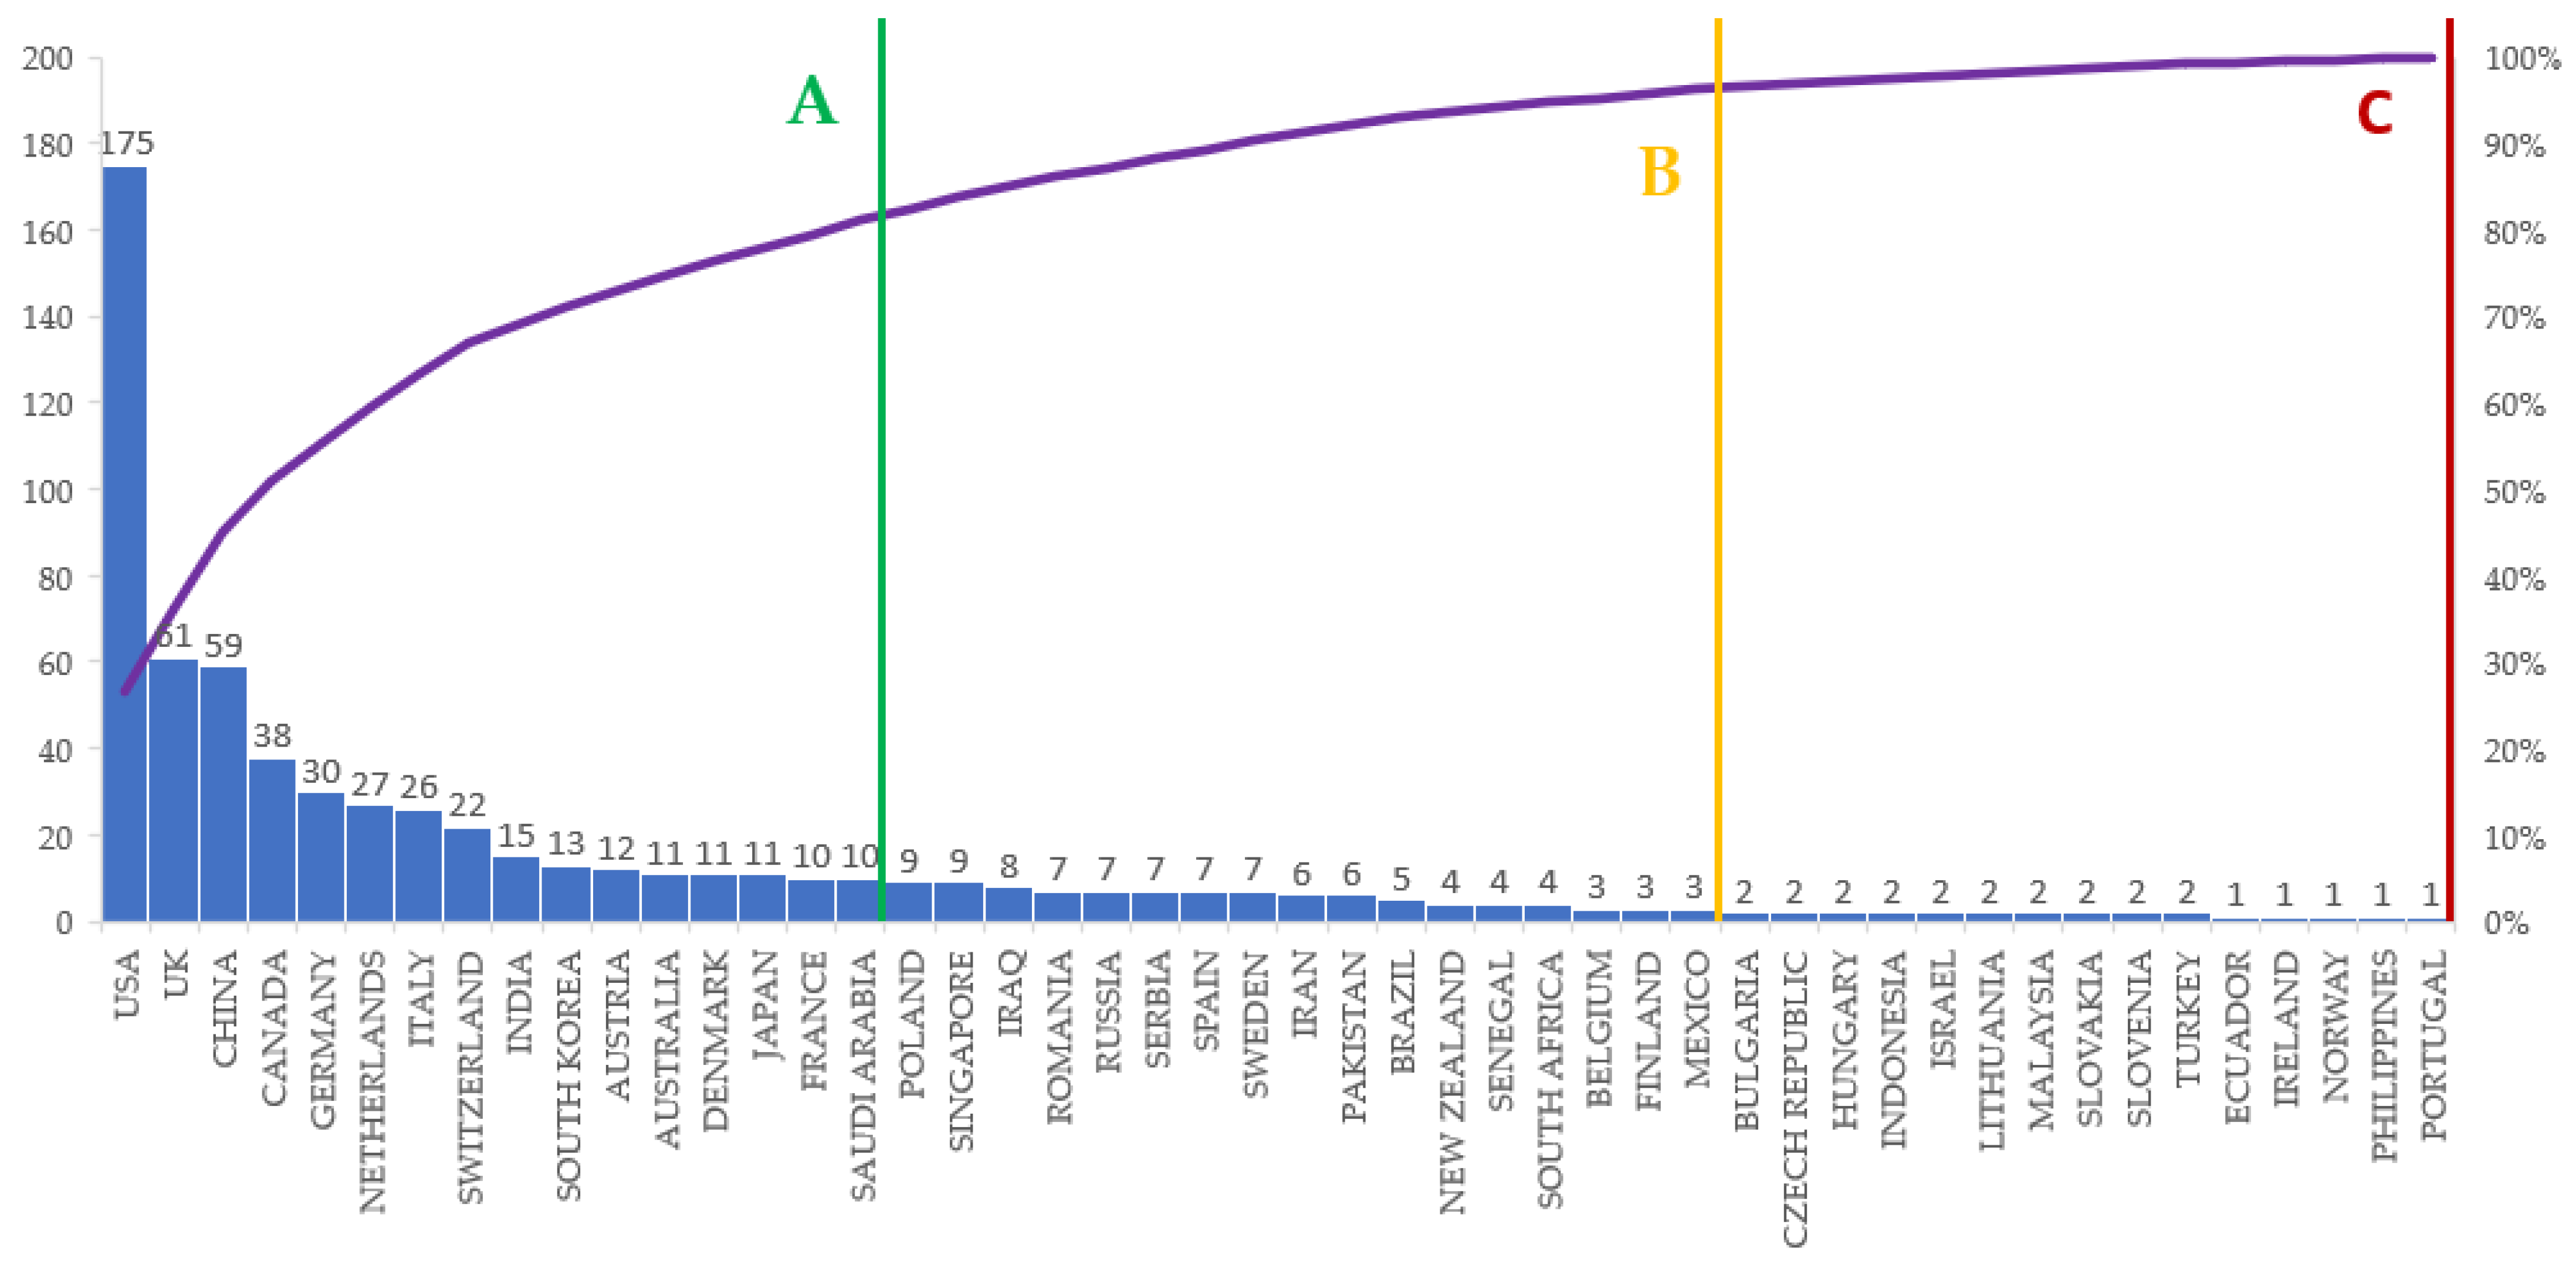
In order to analyze and classify the data underlying
Figure 13, a Pareto ABC Diagram was created. This method is based on Pareto’s Principle, which states that, in many situations, approximately 80% of results come from 20% of causes [
63]. In the context of Pareto ABC analysis, this means that a small number of elements contribute significantly to the total, while the majority of elements contribute less. The primary objective of ABC analysis is to prioritize stringent control for class A items, implement less rigorous control for class B items, and exert minimal control for class C items [
64]. According to the representation in
Figure 15, class A represents 81% of the contribution to global scientific production. This category includes countries such as the USA, UK, China, Canada, Germany, and Saudi Arabia, and they are the most important countries in this field. Special attention should be given to collaborations, resource exchange, and partnerships to maintain and enhance their impact. Class B contributes 15%, including countries like Poland, Singapore, Spain, Belgium, and Mexico. Although these countries do not have as significant a contribution as those in class A, they remain important for the diversity and amplification of scientific research. Collaborations and information exchange with these countries can bring substantial benefits, even if not as substantial as those in class A. Class C has a contribution of approximately 4% and includes countries such as Bulgaria, Norway, or Portugal. These countries have a smaller contribution to global scientific production but can still play an important role regionally or in specific research areas. Cooperation with these countries could bring benefits in developing more specialized research fields or improving regional collaborations.
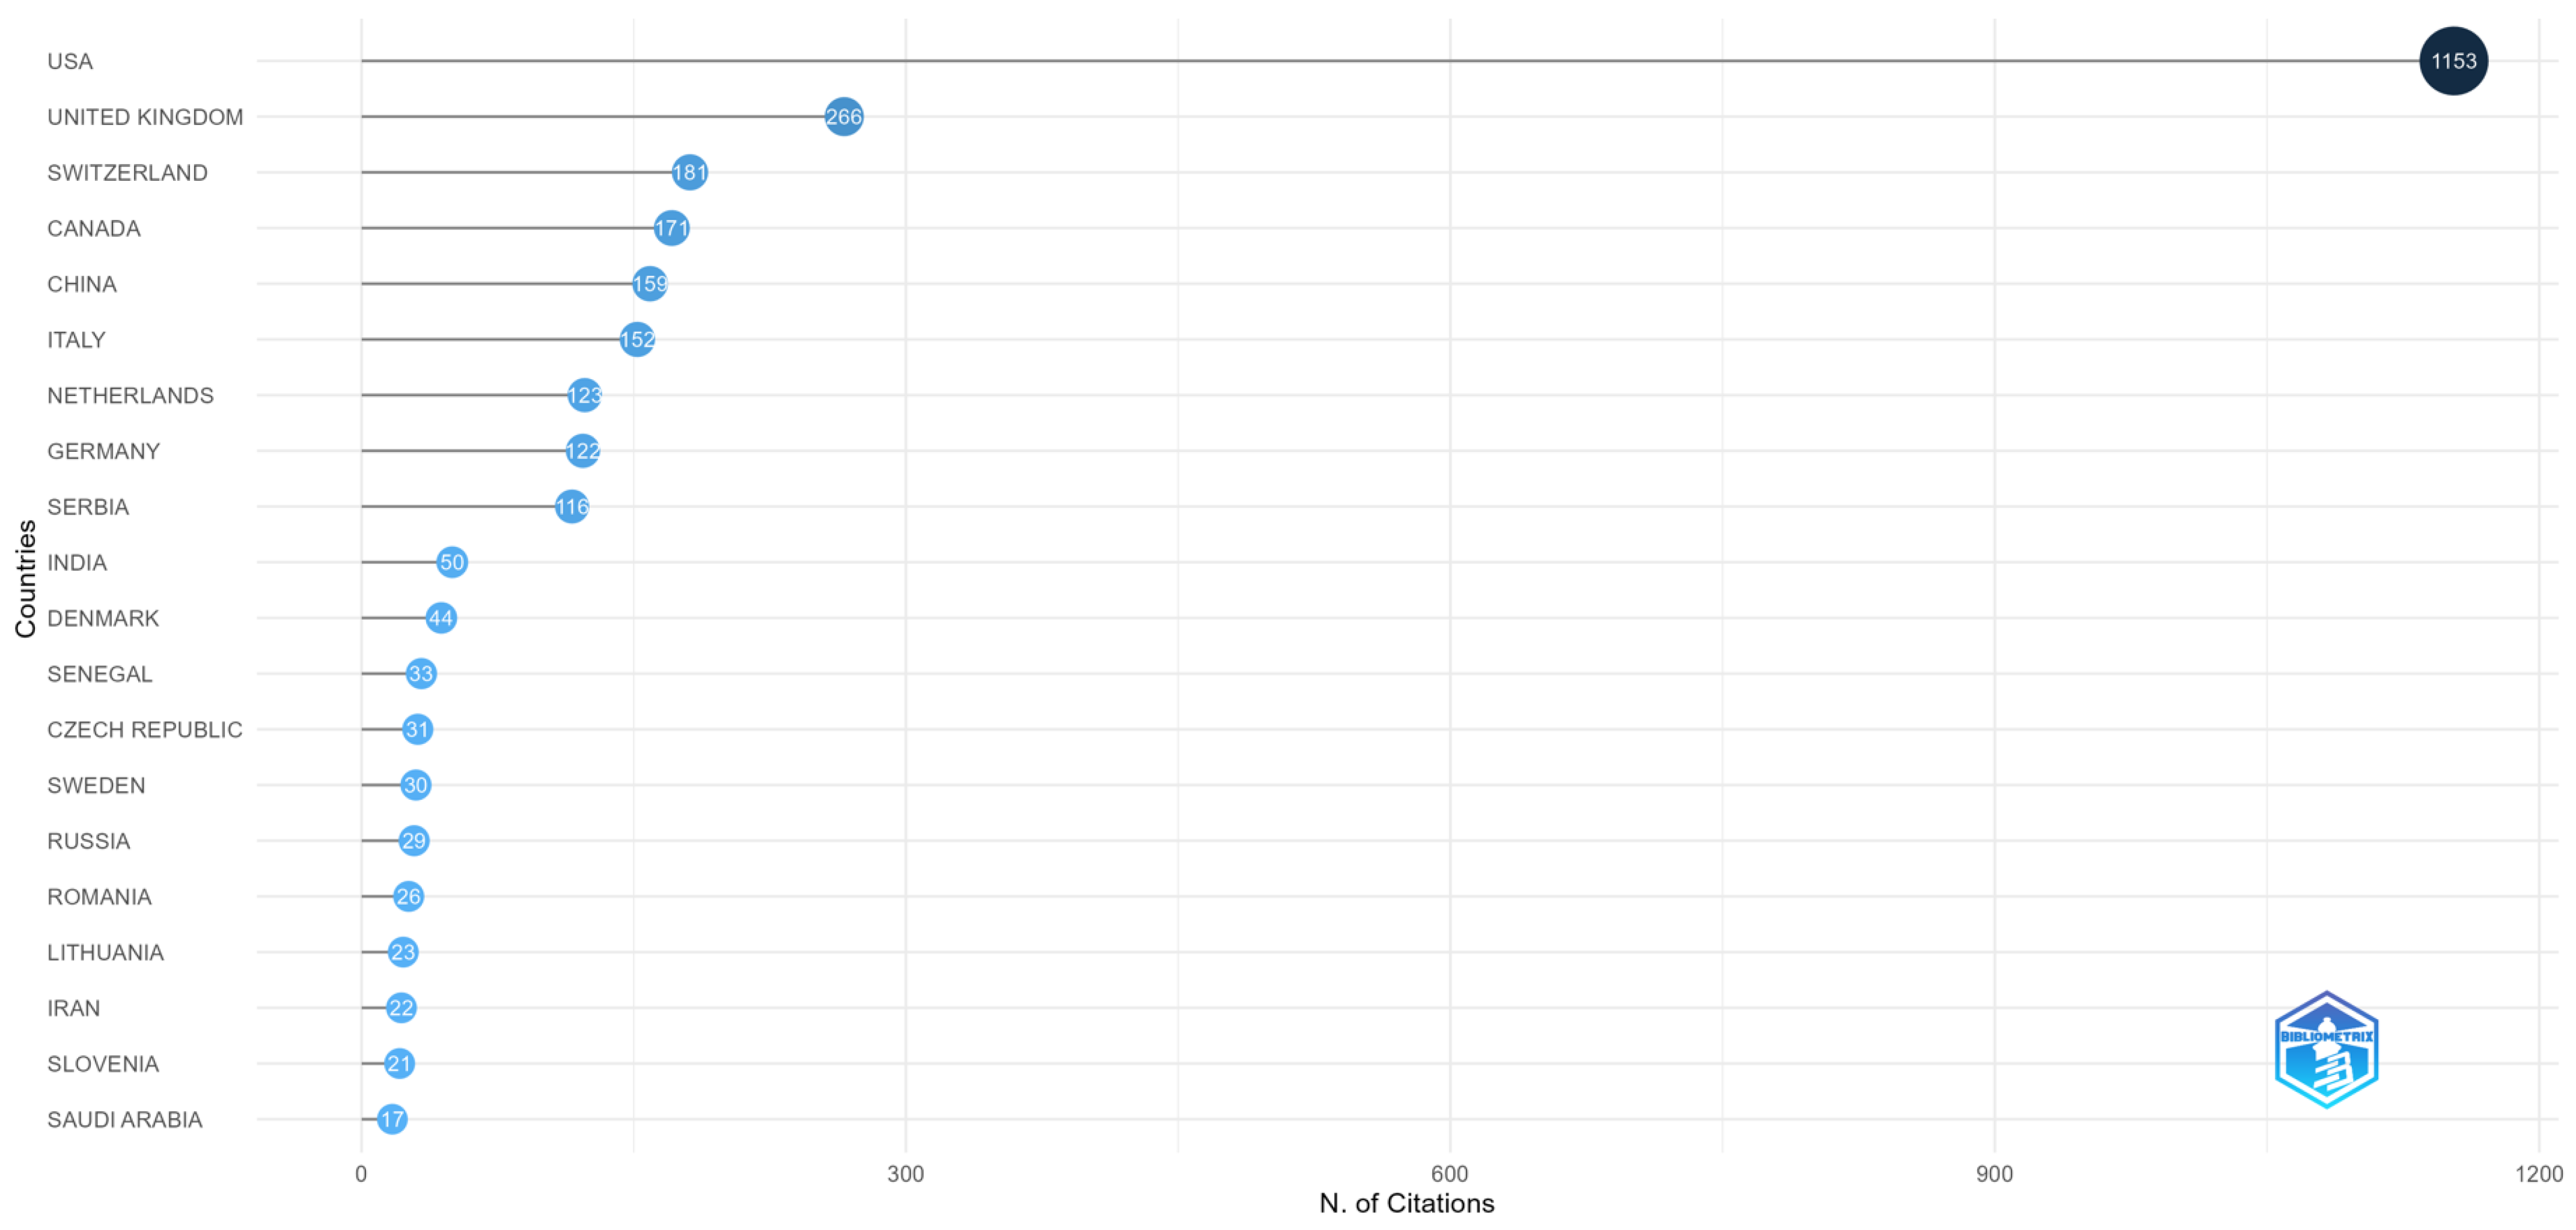
In
Figure 16, the top 20 countries are represented based on the total number of citations. Thus, it is observed that the USA has the highest total number of citations (1153) and the highest average citations per article (24.00), indicating a robust and impactful scientific production. The United Kingdom follows with a total of 266 citations and an average of 20.50 citations per article. Switzerland has fewer total citations (181) but a higher average (25.90) compared to other countries, suggesting a high impact per article. Countries like Serbia and Senegal have a relatively small number of articles but a high average number of citations per article, indicating that their research has a significant impact despite the smaller volume.
The map of collaborations between countries can be interpreted by analyzing the frequency of collaborations between different pairs of countries. Specifically, it is important to observe which countries collaborate most frequently and in what contexts. According to
Figure 17, the following observations can be made:
Collaborations between European countries are evident, with multiple connections between Belgium, Finland, France, Germany, the Netherlands, Spain, and Switzerland;
The USA has frequent collaborations with Canada, the United Kingdom, and Switzerland;
Asian countries, such as China and Korea, have connections among themselves and with European countries;
Regarding region-to-region collaborations, countries from a specific region collaborate with each other, such as Finland with Sweden and Denmark or China with Japan and Korea;
From the perspective of interspecific collaboration, there are collaborations between countries with different geographical and cultural perspectives, such as Australia and Iraq or Brazil and China;
Intense collaborations are represented by higher frequencies. For example, the USA collaborates frequently with the United Kingdom and Switzerland.
This collaboration map can suggest common research areas or interests between countries, highlighting networks of researchers and international partnerships.
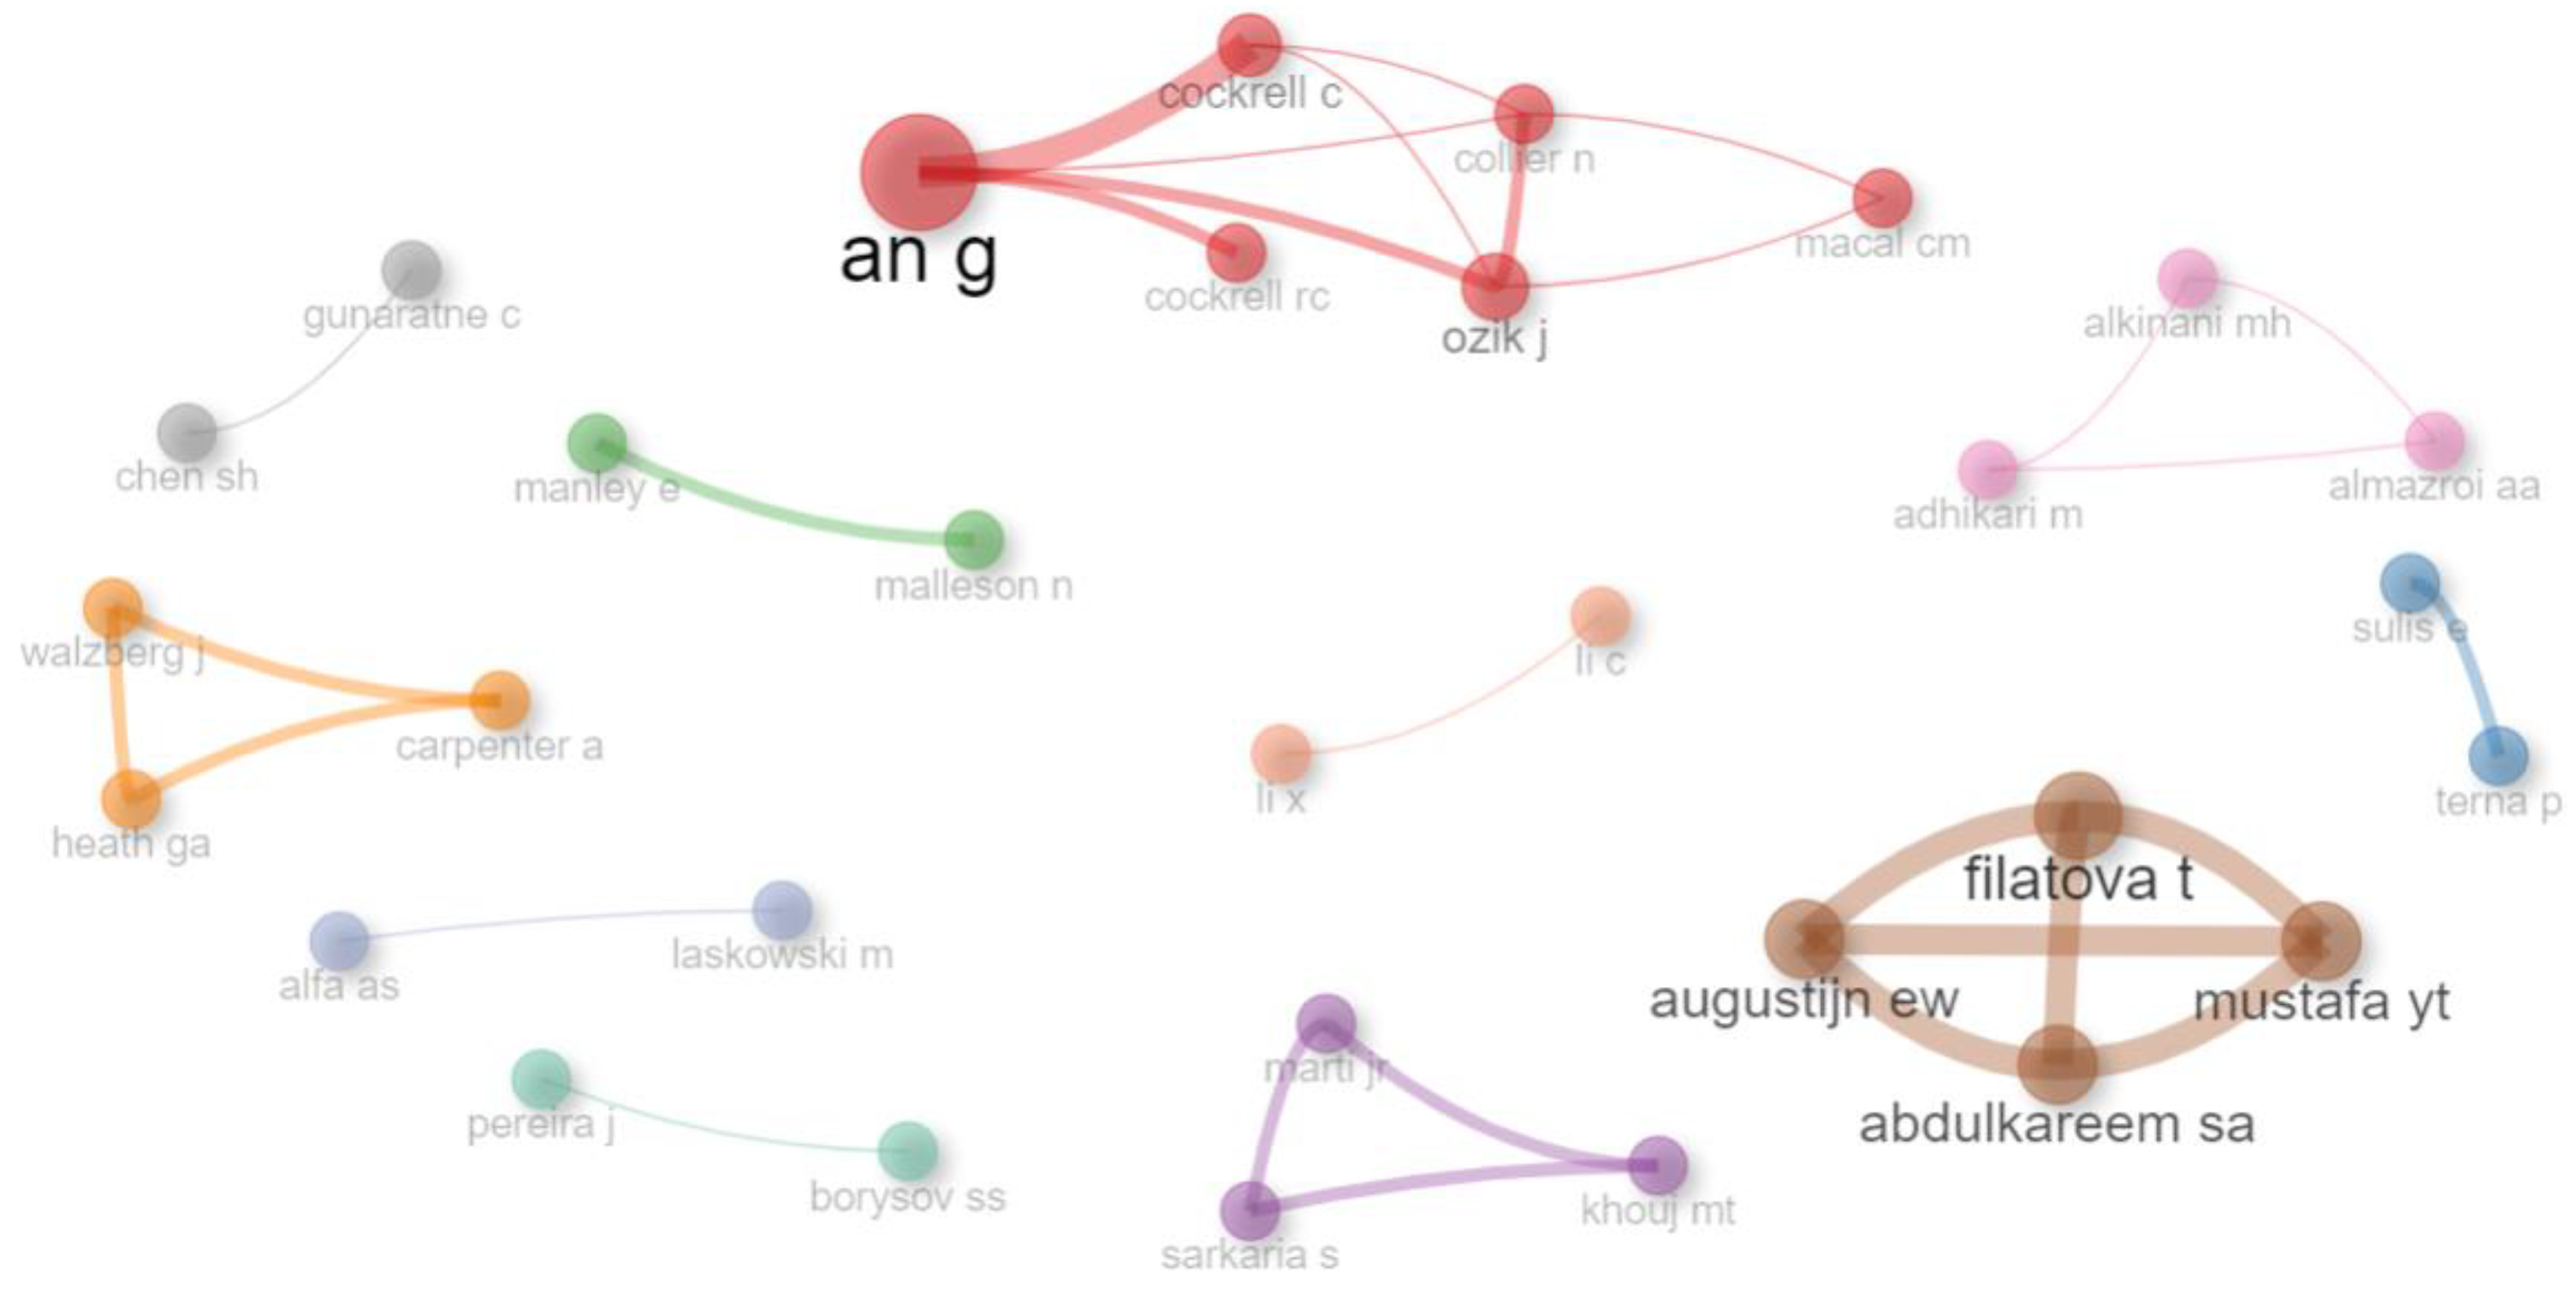
Regarding the author collaboration network,
Figure 18 represents the network with the top 50 authors who have collaborated. The lines or connections between nodes represent collaborations, and the more internal the collaboration, the more connections there are between two authors. Larger nodes represent authors who have made a more significant contribution. Our network has been divided into 11 clusters, each of them having a different color, indicating intensive collaborations within these groups.
3.4. Analysis of Literature
Regarding the state of knowledge in the field, the following analyses provide an overview of the scientific landscape and previous contributions in the analyzed domain. In the context of our research, the current state of knowledge indicates a dynamic intersection between two evolving domains: AI and ABM. This exploration reflects a contemporary interest in leveraging advanced AI techniques within ABM, opening up potential new directions for modeling and simulation across various fields. This convergence marks a frontier where traditional ABM methodologies meet advanced AI technologies, promising a more realistic, adaptable model with enhanced predictive capabilities. The synergy between AI and ABM holds the potential to address complex systems with greater fidelity, enabling researchers to simulate and understand intricate real-world scenarios with increased precision. As researchers delve into this interdisciplinary realm, challenges and opportunities emerge. Original contributions in this direction may involve refining existing AI algorithms for ABM contexts, adapting ABM paradigms to harness the learning capabilities of AI, and identifying novel applications that can benefit from this amalgamation. For instance, Taghikhah et al. [
28] address the challenges associated with explaining the structure and performance of agent-based models (ABM) in the quantitative social sciences. The authors propose an innovative approach that utilizes AI for both constructing models from data and enhancing the way we communicate these models to stakeholders. While machine learning is actively employed for data preprocessing, this study introduces, for the first time, its use to facilitate the direct development of a simulation model from data. The proposed framework, ML-ABM, is designed to capture causality and feedback loops in complex and nonlinear systems while maintaining transparency for stakeholders [
28]. The authors argue that their approach not only leads to the creation of a behavioral ABM but also unveils the internal workings of empirical models, traditionally considered “black boxes”. They suggest that integrating AI into simulation practices can bring a new dimension to modeling and provide valuable insights for future applications.
Platas-López et al. [
65] explore the integration of Machine Learning (ML) techniques into ABM to enhance the design and analysis of models. The authors propose an extension of the Overview, Design Concepts, and Details (ODD) protocol to standardize the description of ML applications within ABM. The extension categorizes the use of ML based on various factors, facilitating transparent communication of ML workflows in ABM. The proposed approach is exemplified through a tax evasion model, highlighting improved precision with statistical significance.
On the other hand, the role of ABM can be an innovative approach in various fields. For instance, in transportation studies, it can provide an alternative to traditional equation-based models. Delcea and Chirita [
6] highlight that specific applications of ABM in transportation, including the aviation, maritime, road, and rail sectors, involve the study of airport operations, maritime efficiency, traffic congestion, evacuation scenarios, and public transportation systems.
3.4.1. Top 10 Most Cited Papers—Overview
In
Figure 19, the top 10 most globally cited documents are depicted. The highest number of global citations is observed for the author Bagstad, with 349, followed by Hare with 130 citations. These will be detailed further on.
In
Table 6, centralized information provides an overview of the impact and geographic distribution of research documents. Various metrics, such as the total citations per year and normalized citations, offer insights into the ongoing impact and relevance of these documents within the scientific community. For instance, Bagstad et al. [
66], the author with the highest citations for their study, have a total of 349 citations, with a TCY (Total Citations per Year) of 31.73 and a value of 8.19 for normalized total citations (NTC). Similarly, Hare and Deadman [
26] have a total of 130 citations for their study, with a value of 6.5 citations per year (TCY), but with a relatively small value for the NCT, namely 1.
While the TC and TCY indicators are easy to read and understand, we should further explain the calculus rules for the NTC metric in order to better understand the values listed on the right-column of
Table 6. The key point in determining the NTC is the year in which the paper has been published, as the NTC value is obtained by dividing the TC value by the average citations per document recorded in the extracted dataset for the year in which the paper has been published [
37]. Thus, for the year 2013 in which the paper authored by Bagstad et al. [
66] was published, the average citations per document were equal to 42.61. By dividing the value of TC obtained by Bagstad et al. [
66], namely 349 citations, by 42.61, the 8.19 value for the NTC is obtained. Thus, it can be stated that the paper authored by Bagstad et al. [
66] has gained approximately 8.19 times more citations than the average of the citations received in the same year by the other papers included in the dataset. As for the papers authored by Hare and Deadman [
26] and O’Sullivan and Haklay [
67], as both papers have been published in years (2004, respectively, 2000), for which in the database the mentioned papers are the only published papers, the value they have received for the TC equals the average value of the citations obtained by all the papers in the database published in the same year, making the NTC equal to 1.
3.4.2. Top 10 Most Cited Papers—Review
In order to build an overview of the impact and ongoing relevance of research in the global scientific community,
Table 7 has been compiled. Centralization provides a comprehensive view of the impact and geographic distribution of the most globally cited research documents. Relevant information about each document is provided, including the total number of citations, citations per year, and normalized citations. Additionally, the authors’ region of origin and the total number of authors for each document are highlighted.
3.4.3. Words Analysis
The analysis of keywords used in scientific articles provides an efficient way to investigate the language and content of scientific documents, yielding valuable insights in the field of research. This analysis can offer significant information about trends and characteristics within a specific domain or subdomain. The study of keywords can assist in understanding key concepts and the terminology employed in the field, proving helpful when clarification or definition of specific terms is needed. Furthermore, by examining groups of keywords that frequently appear together in documents, thematic clusters or groups of terms often associated with each other can be identified. This can provide an overview of subdomains or main themes within a field. Additionally, keywords associated with a high number of citations may indicate topics of great relevance and impact in the scientific community. This can aid in identifying works and subjects that have had a significant impact in the field.
Table 8 presents the top 10 most frequently occurring words in the “keywords plus” section of the analyzed documents. We can observe that the term “simulation” appears most frequently, suggesting a prevalent focus on simulated scenarios, experiments, or models in the research. The term “model” is also highly recurrent, indicating a substantial emphasis on the creation and analysis of various models within the documents. The term “systems” is frequently used, suggesting that research often involves the study, development, or analysis of complex systems. The most frequently occurring words in the keywords plus section reflect a strong emphasis on simulation, modeling, system analysis, and the study of dynamic behaviors within various frameworks. The inclusion of terms like networks, optimization, and evolution indicates additional specific areas of interest in the analyzed research.
Also,
Table 9 provides an overview of the top 10 most frequently used words in the authors’ keywords across the analyzed documents. The recurring terms reflect the prevalent themes and focuses within the research. The list includes words such as “Machine learning”, “Agent-based modeling”, “Artificial intelligence”, and “Simulation”, indicating a strong emphasis on these concepts in the scholarly work. These keywords collectively suggest a significant interest in the application of machine learning and AI techniques, particularly within the context of ABM and simulation. The repetition of terms like “Deep learning” and “Learning” further underscores the importance of advanced learning methodologies in the studies. Overall, the word frequency analysis provides a consolidated view of the key themes and areas of focus within the body of research, offering insights into the prevalent topics and methodologies in the field.
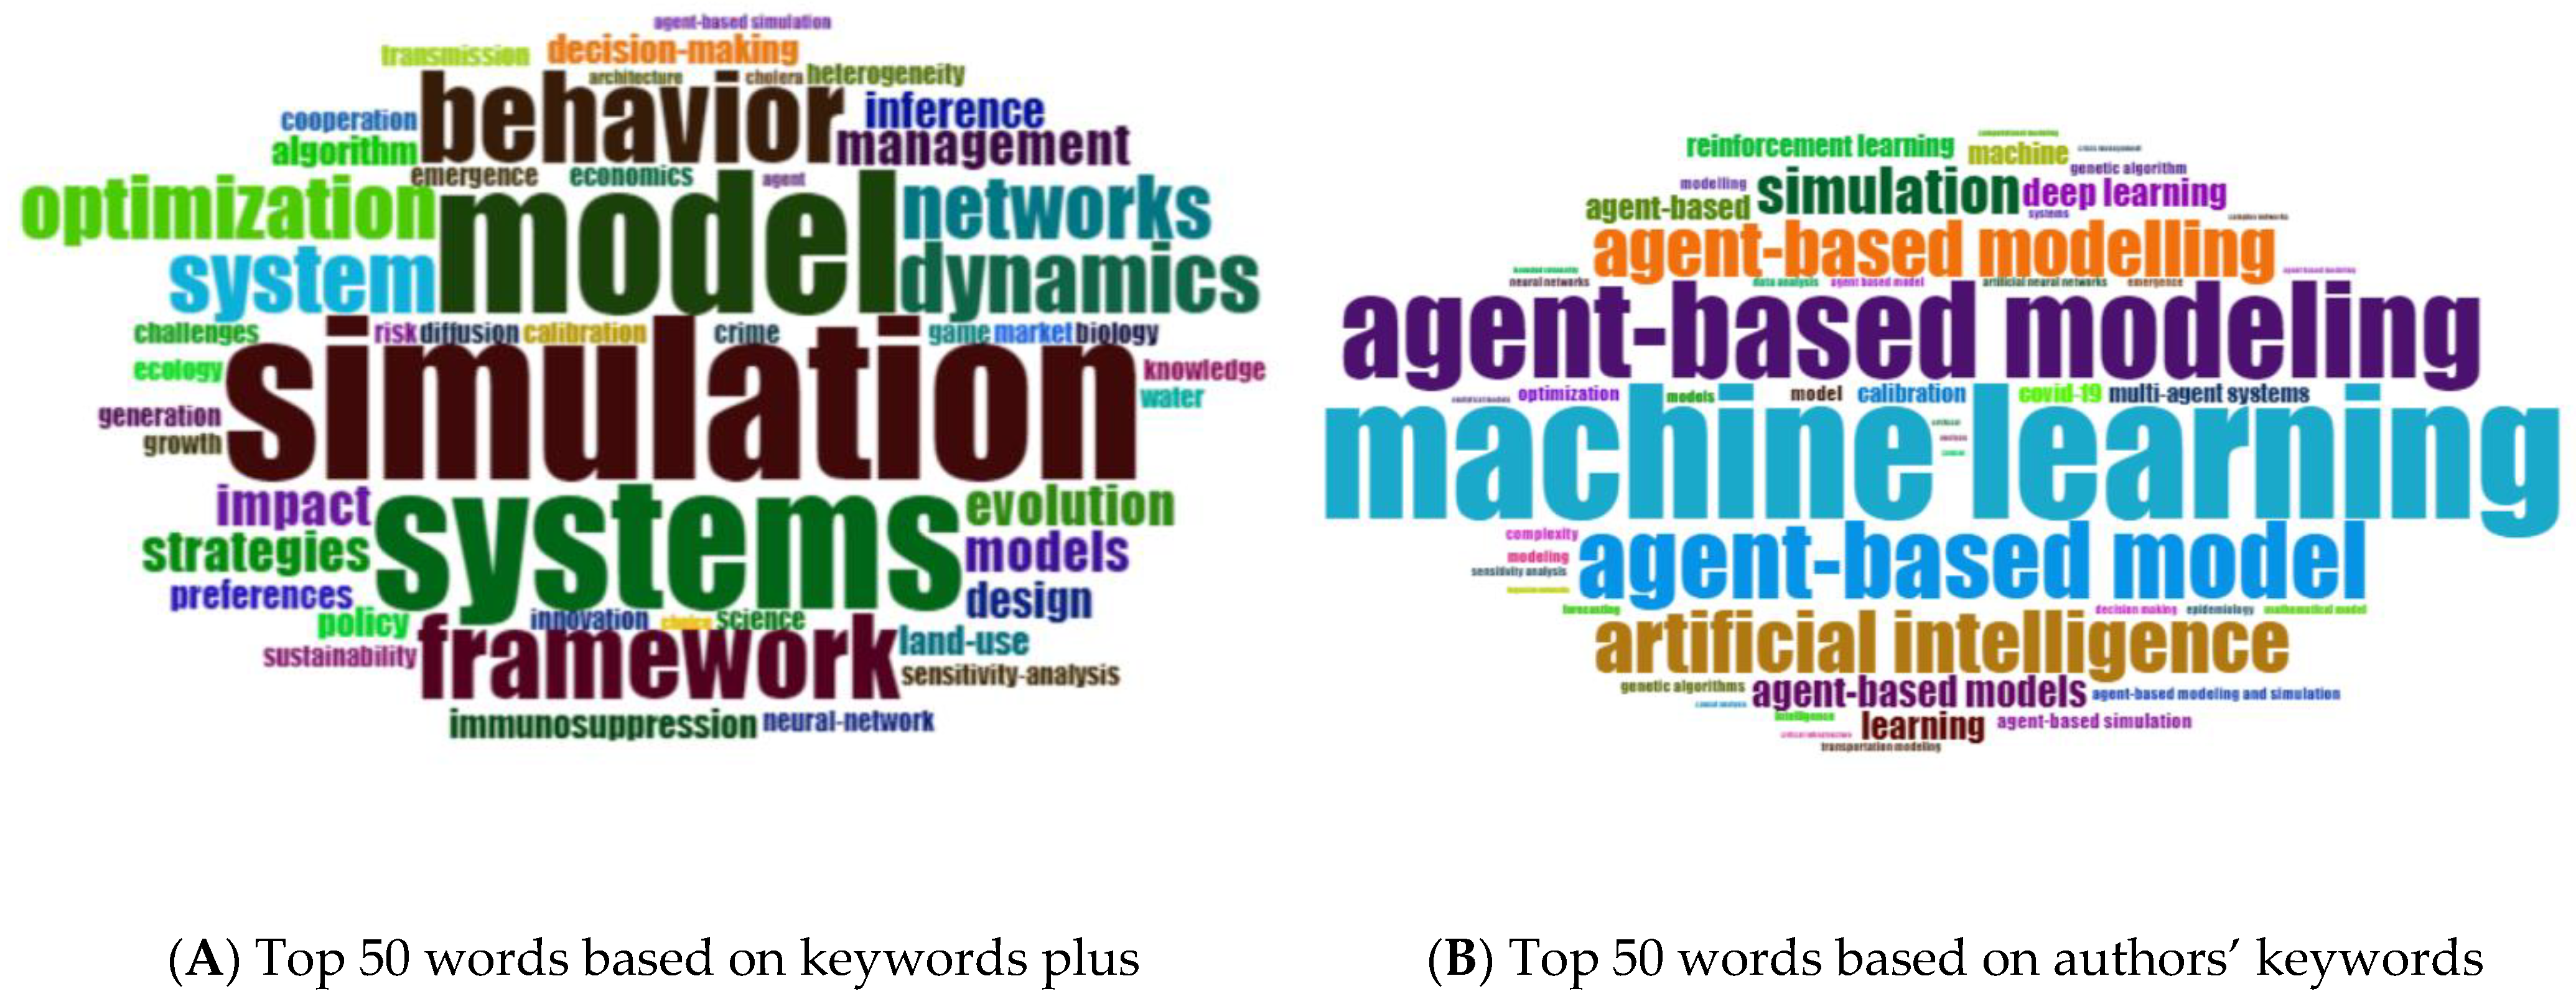
Additionally, a word cloud for the top 50 words based on keywords plus the author’s keywords was generated in
Figure 20.
The word cloud based on keywords plus reveals prominent terms within the research landscape. The most frequently occurring terms include “simulation”, “model”, “systems” “behavior”, and “framework”, indicating a focus on simulation modeling and system behavior in the research. Additionally, terms like “optimization”, “evolution” and “impact” suggest an interest in optimizing systems and understanding their evolutionary impact. The presence of terms such as “management”, “strategies”, and “design” highlights a concern for effective management strategies and design considerations. The word cloud also reflects a diverse range of topics, including “immunosuppression”, “land-use”, “policy”, and “preferences”, indicating a multidisciplinary approach. Terms like “calibration”, “inference”, and “algorithm” suggest a methodological focus on refining models and making informed inferences. Furthermore, the inclusion of terms like “crime”, “diffusion” and “ecology” suggests an application of simulation modeling in various domains, including social sciences and environmental studies. The word cloud provides a snapshot of the key thematic areas and methodological approaches prevalent in the research, offering insights into the diversity and depth of the studies covered.
The word cloud generated from the author’s keywords provides insights into the key themes and methodologies prevalent in the research landscape. The most frequently occurring terms include “machine learning”, “agent-based modeling”, “artificial intelligence”, and “simulation”, indicating a strong emphasis on these areas in the scholarly work. The prominence of terms such as “deep learning”, “reinforcement learning”, and “calibration” suggests a focus on advanced learning techniques and refining models for accuracy. The presence of terms like “COVID-19”, “epidemiology”, and “forecasting” highlights a significant focus on applying these methodologies to address contemporary challenges. Additionally, terms like “multi-agent systems”, “genetic algorithms”, and “transportation modeling” reflect a diverse set of research areas, demonstrating the interdisciplinary nature of the studies covered. The word "cloud" also reveals a strong emphasis on specific modeling techniques, including “agent-based simulation”, “complexity”, and “genetic algorithm”, underscoring the importance of these methods in the research community. Terms such as “sensitivity analysis”, “neural networks”, and “mathematical model” indicate a methodological focus on assessing model sensitivity and employing mathematical approaches in the research. Overall, the word cloud based on the author’s keywords provides a comprehensive overview of the major themes, methodologies, and application areas within the academic research covered by the analyzed documents.
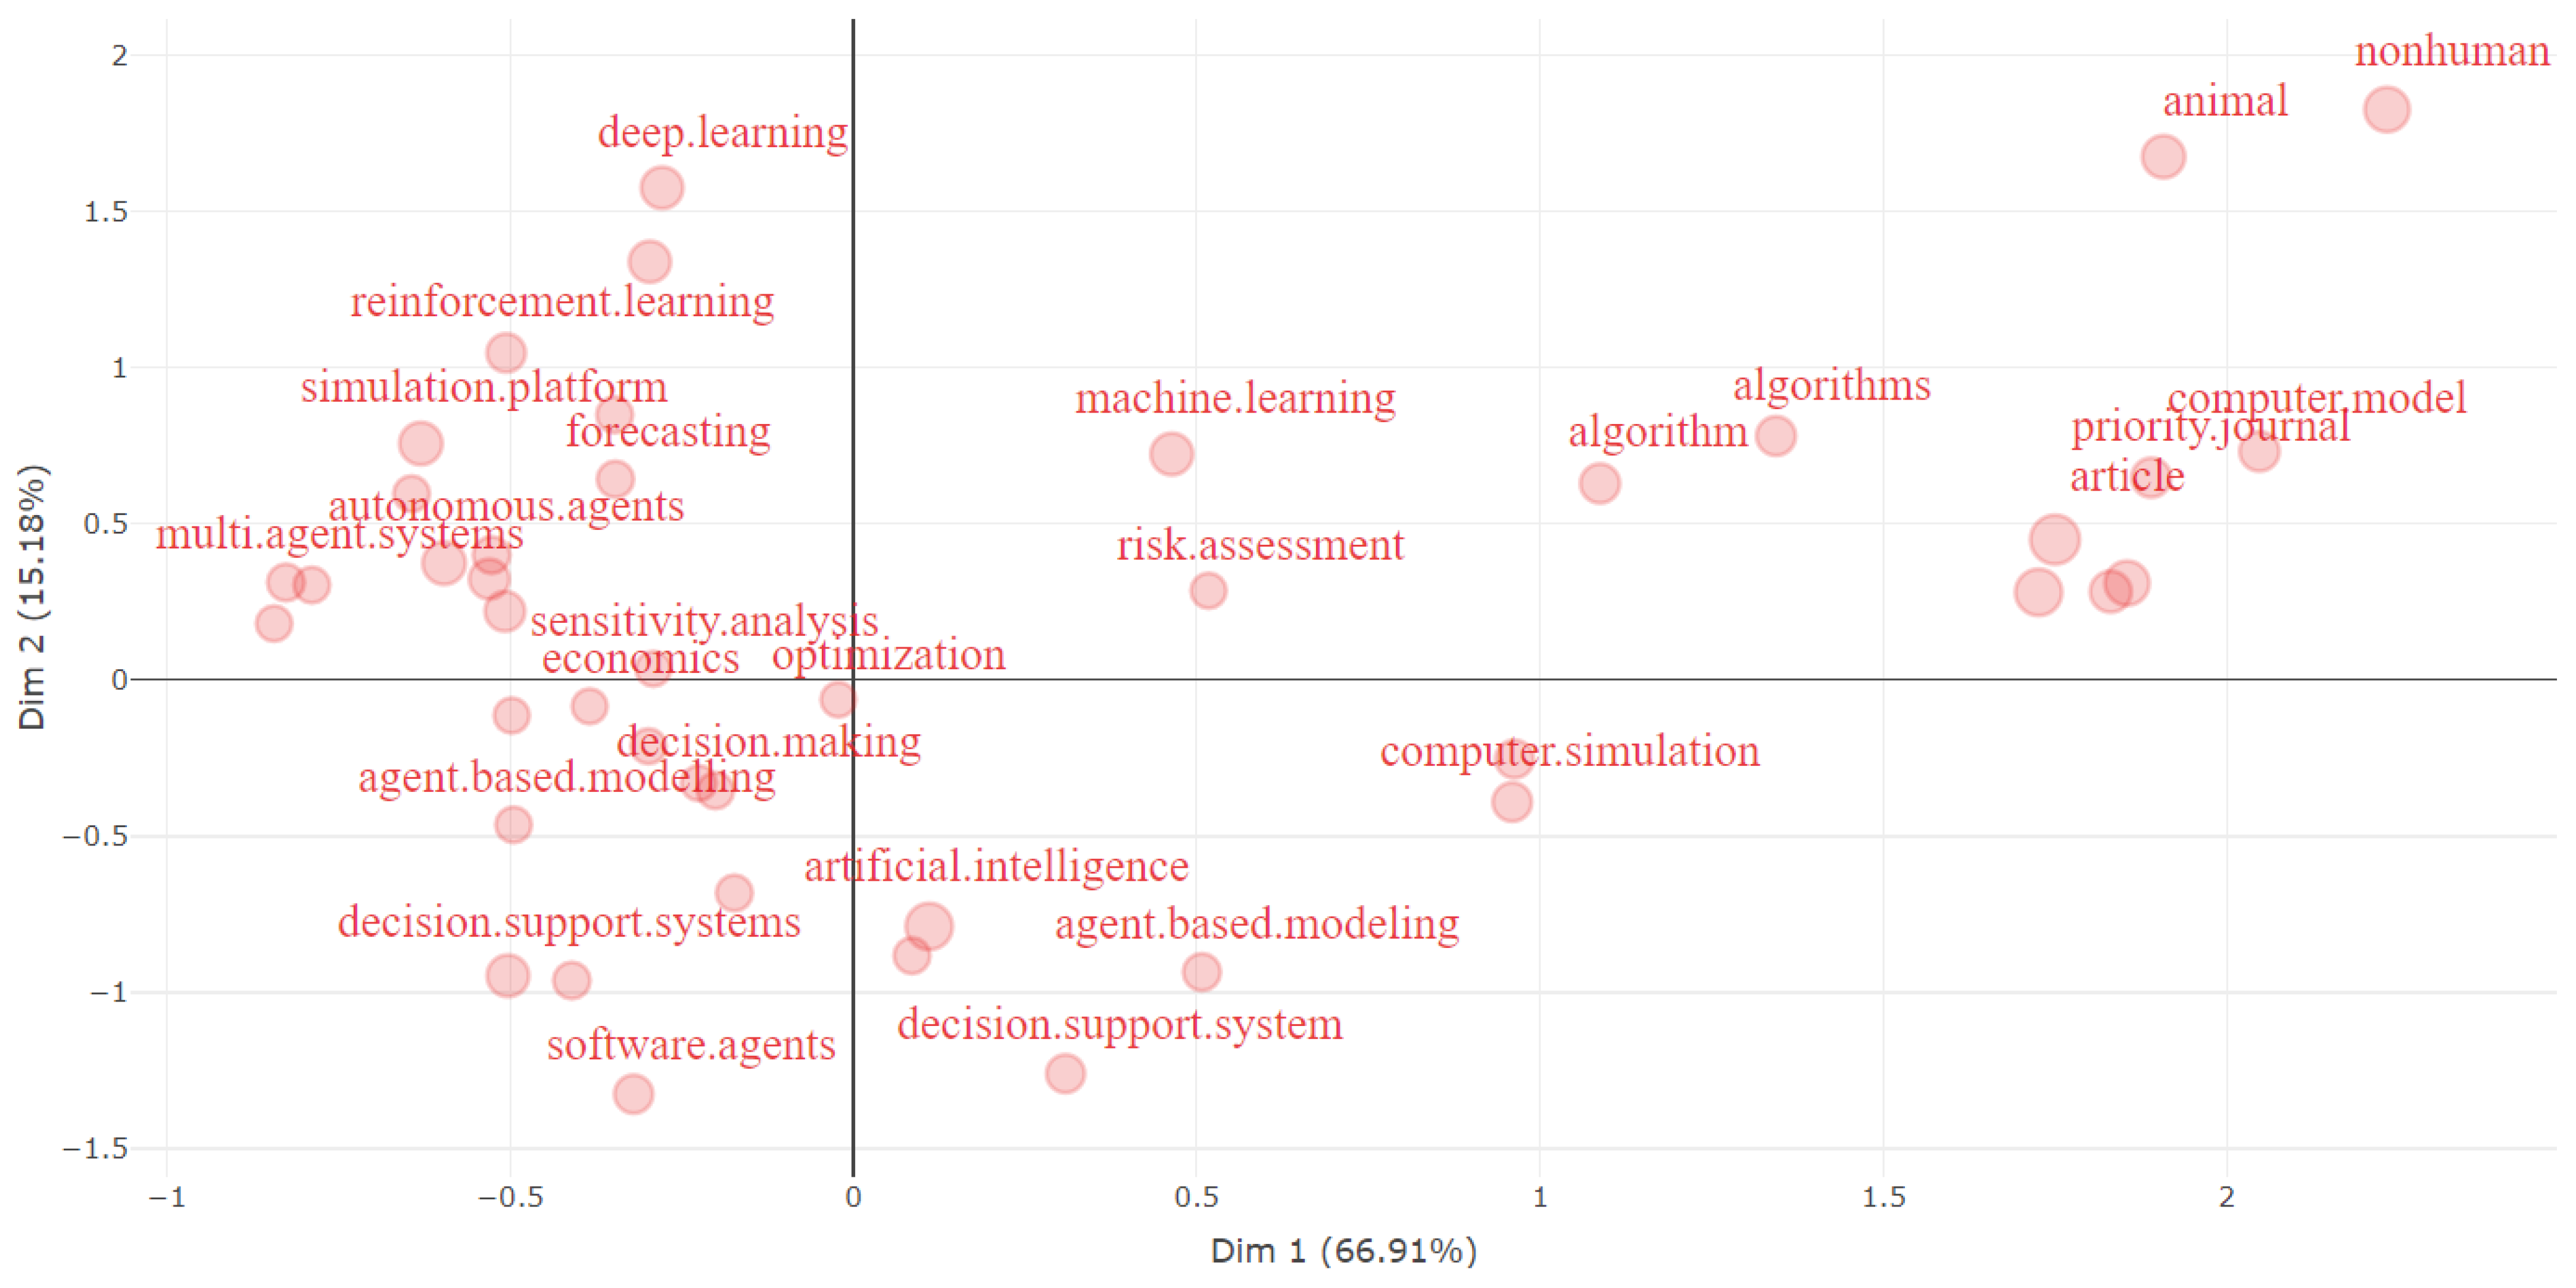
To analyze the relationships between categorical variables, such as the keywords in our analysis, the Multiple Correspondences Analysis (MCA) technique was employed to conduct a Factorial Analysis of Mixed Data (FAMD) [
77]. This technique identifies associations between categories and provides a visual representation of these associations. In
Figure 21, we observe that in the first quadrant, keywords such as “agent-based modeling”, “decision making”, “software agents”, and “decision support systems” are prominent. Articles associated with this quadrant are characterized by involvement in ABM, decision-making, and the use of decision support systems. In this quadrant, research could explore the use of agent-based models in decision-making processes and the development of decision support systems. In the second quadrant, keywords like “deep learning”, “reinforcement learning”, “multi-agent systems”, “sensitivity analysis”, “economics”, and “forecasting” are prevalent. Studies in this quadrant may address ways to improve system performance through technologies such as deep learning and reinforcement learning, with implications for economics and forecasting. Articles in the third quadrant focus on “machine learning”, “computer models”, “risk assessment”, and “algorithms”. Articles in this quadrant may delve into the development and application of computer models, the use of machine learning in various contexts, risk assessment, and algorithm development. Finally, the fourth quadrant encompasses articles addressing “decision support systems”, “computer modeling”, and “AI”. Research in this quadrant could explore the implementation and enhancement of decision support systems, the utilization of computerized models, and advancements in the field of AI.
Table 10 represents the results of a dimensionality reduction analysis (factor analysis technique) for a set of words. The values in the “Dim.1” and “Dim.2” columns represent the coordinates of each word in a two-dimensional space, while the “cluster” column indicates the assigned cluster for each word. The words are grouped into a single cluster (cluster 1), suggesting a commonality or similarity among them in the analyzed context. Words with similar coordinates in this space are likely to have similar associations or patterns in the analyzed data. The positive or negative values in each dimension indicate the direction of the association. For instance, words like “networks”, “algorithm”, “machine learning”, and “risk assessment” have positive coordinates in both dimensions, suggesting they share common associations.
3.5. Mixed Analysis
In this section, we will conduct a mixed analysis by integrating information from multiple perspectives with the aim of providing a comprehensive view of the scientific landscape in our research field.
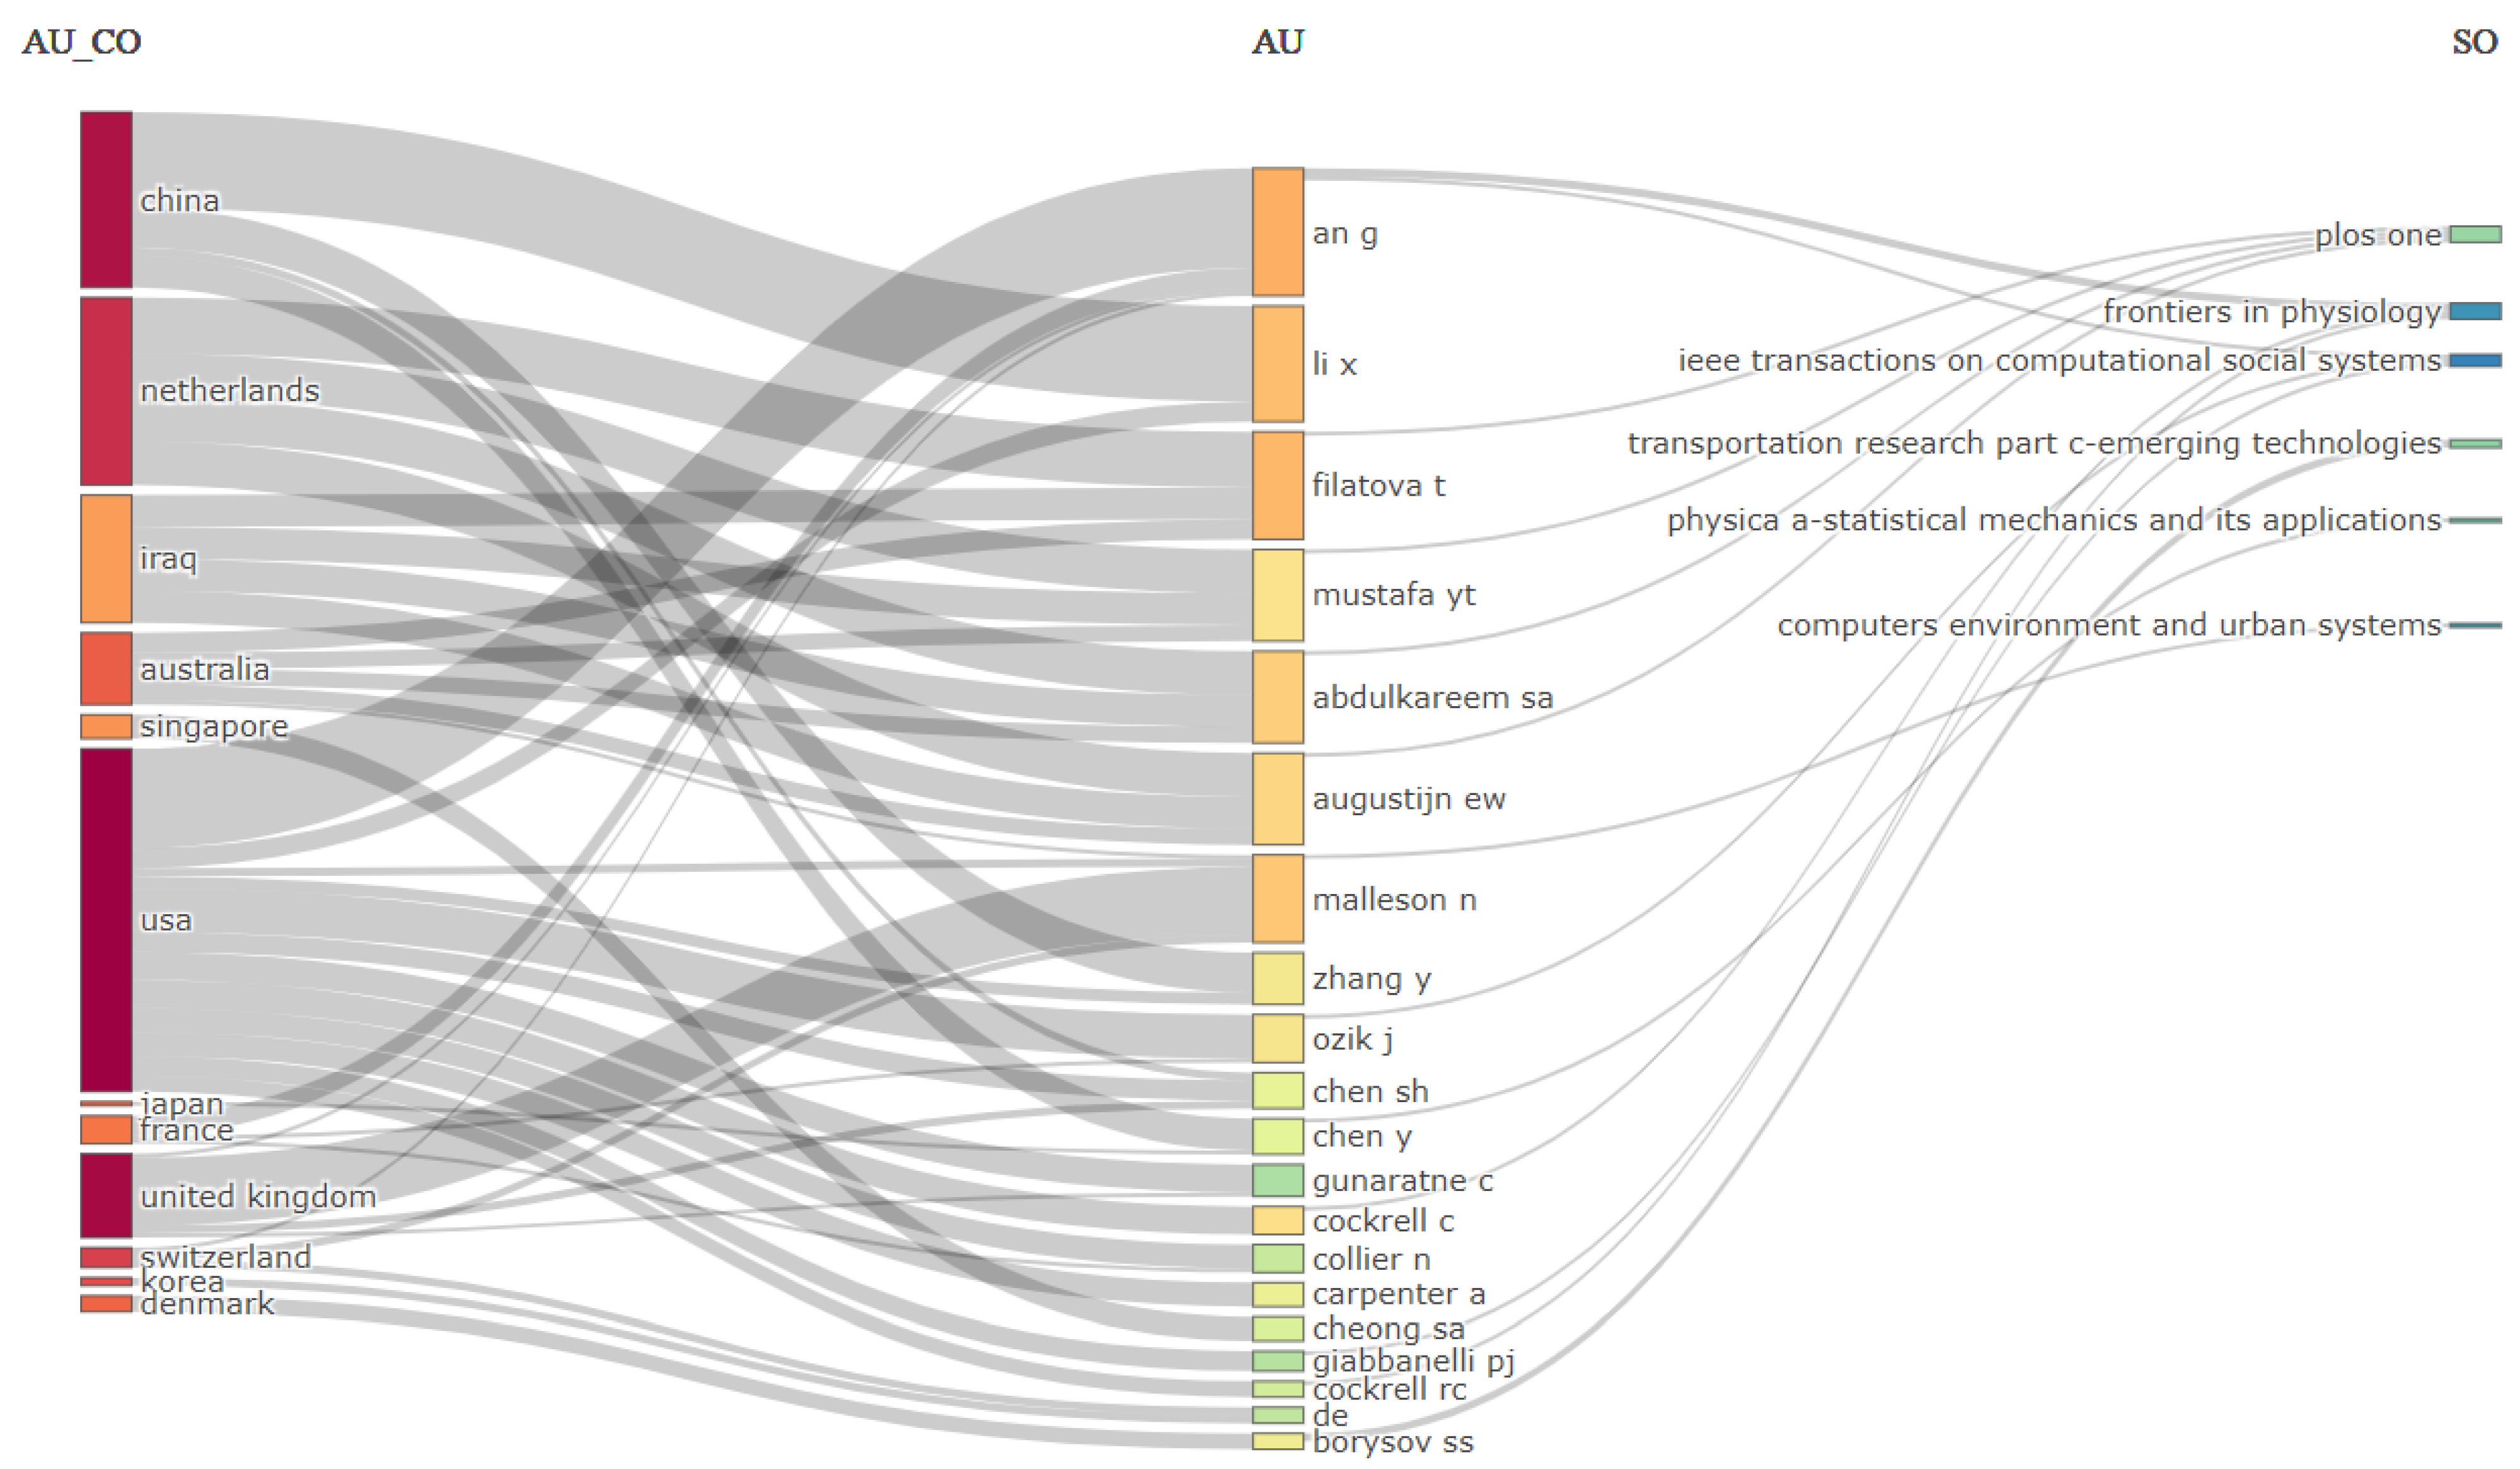
To achieve this, we employed the Three-fields plot from Bibliometrix. In
Figure 22, we generated a Three-fields plot (countries, authors, journals). The first part of the plot illustrates how scientific contributions are distributed based on the countries of origin. This allows us to observe whether certain countries dominate in a specific field or if there is a balanced distribution. The second part of the plot focuses on the authors involved in research, providing insights into collaborations among authors and their influence in a given field. The third section highlights the distribution of results across scientific journals, potentially revealing the top journals where most works in the analyzed field are published.
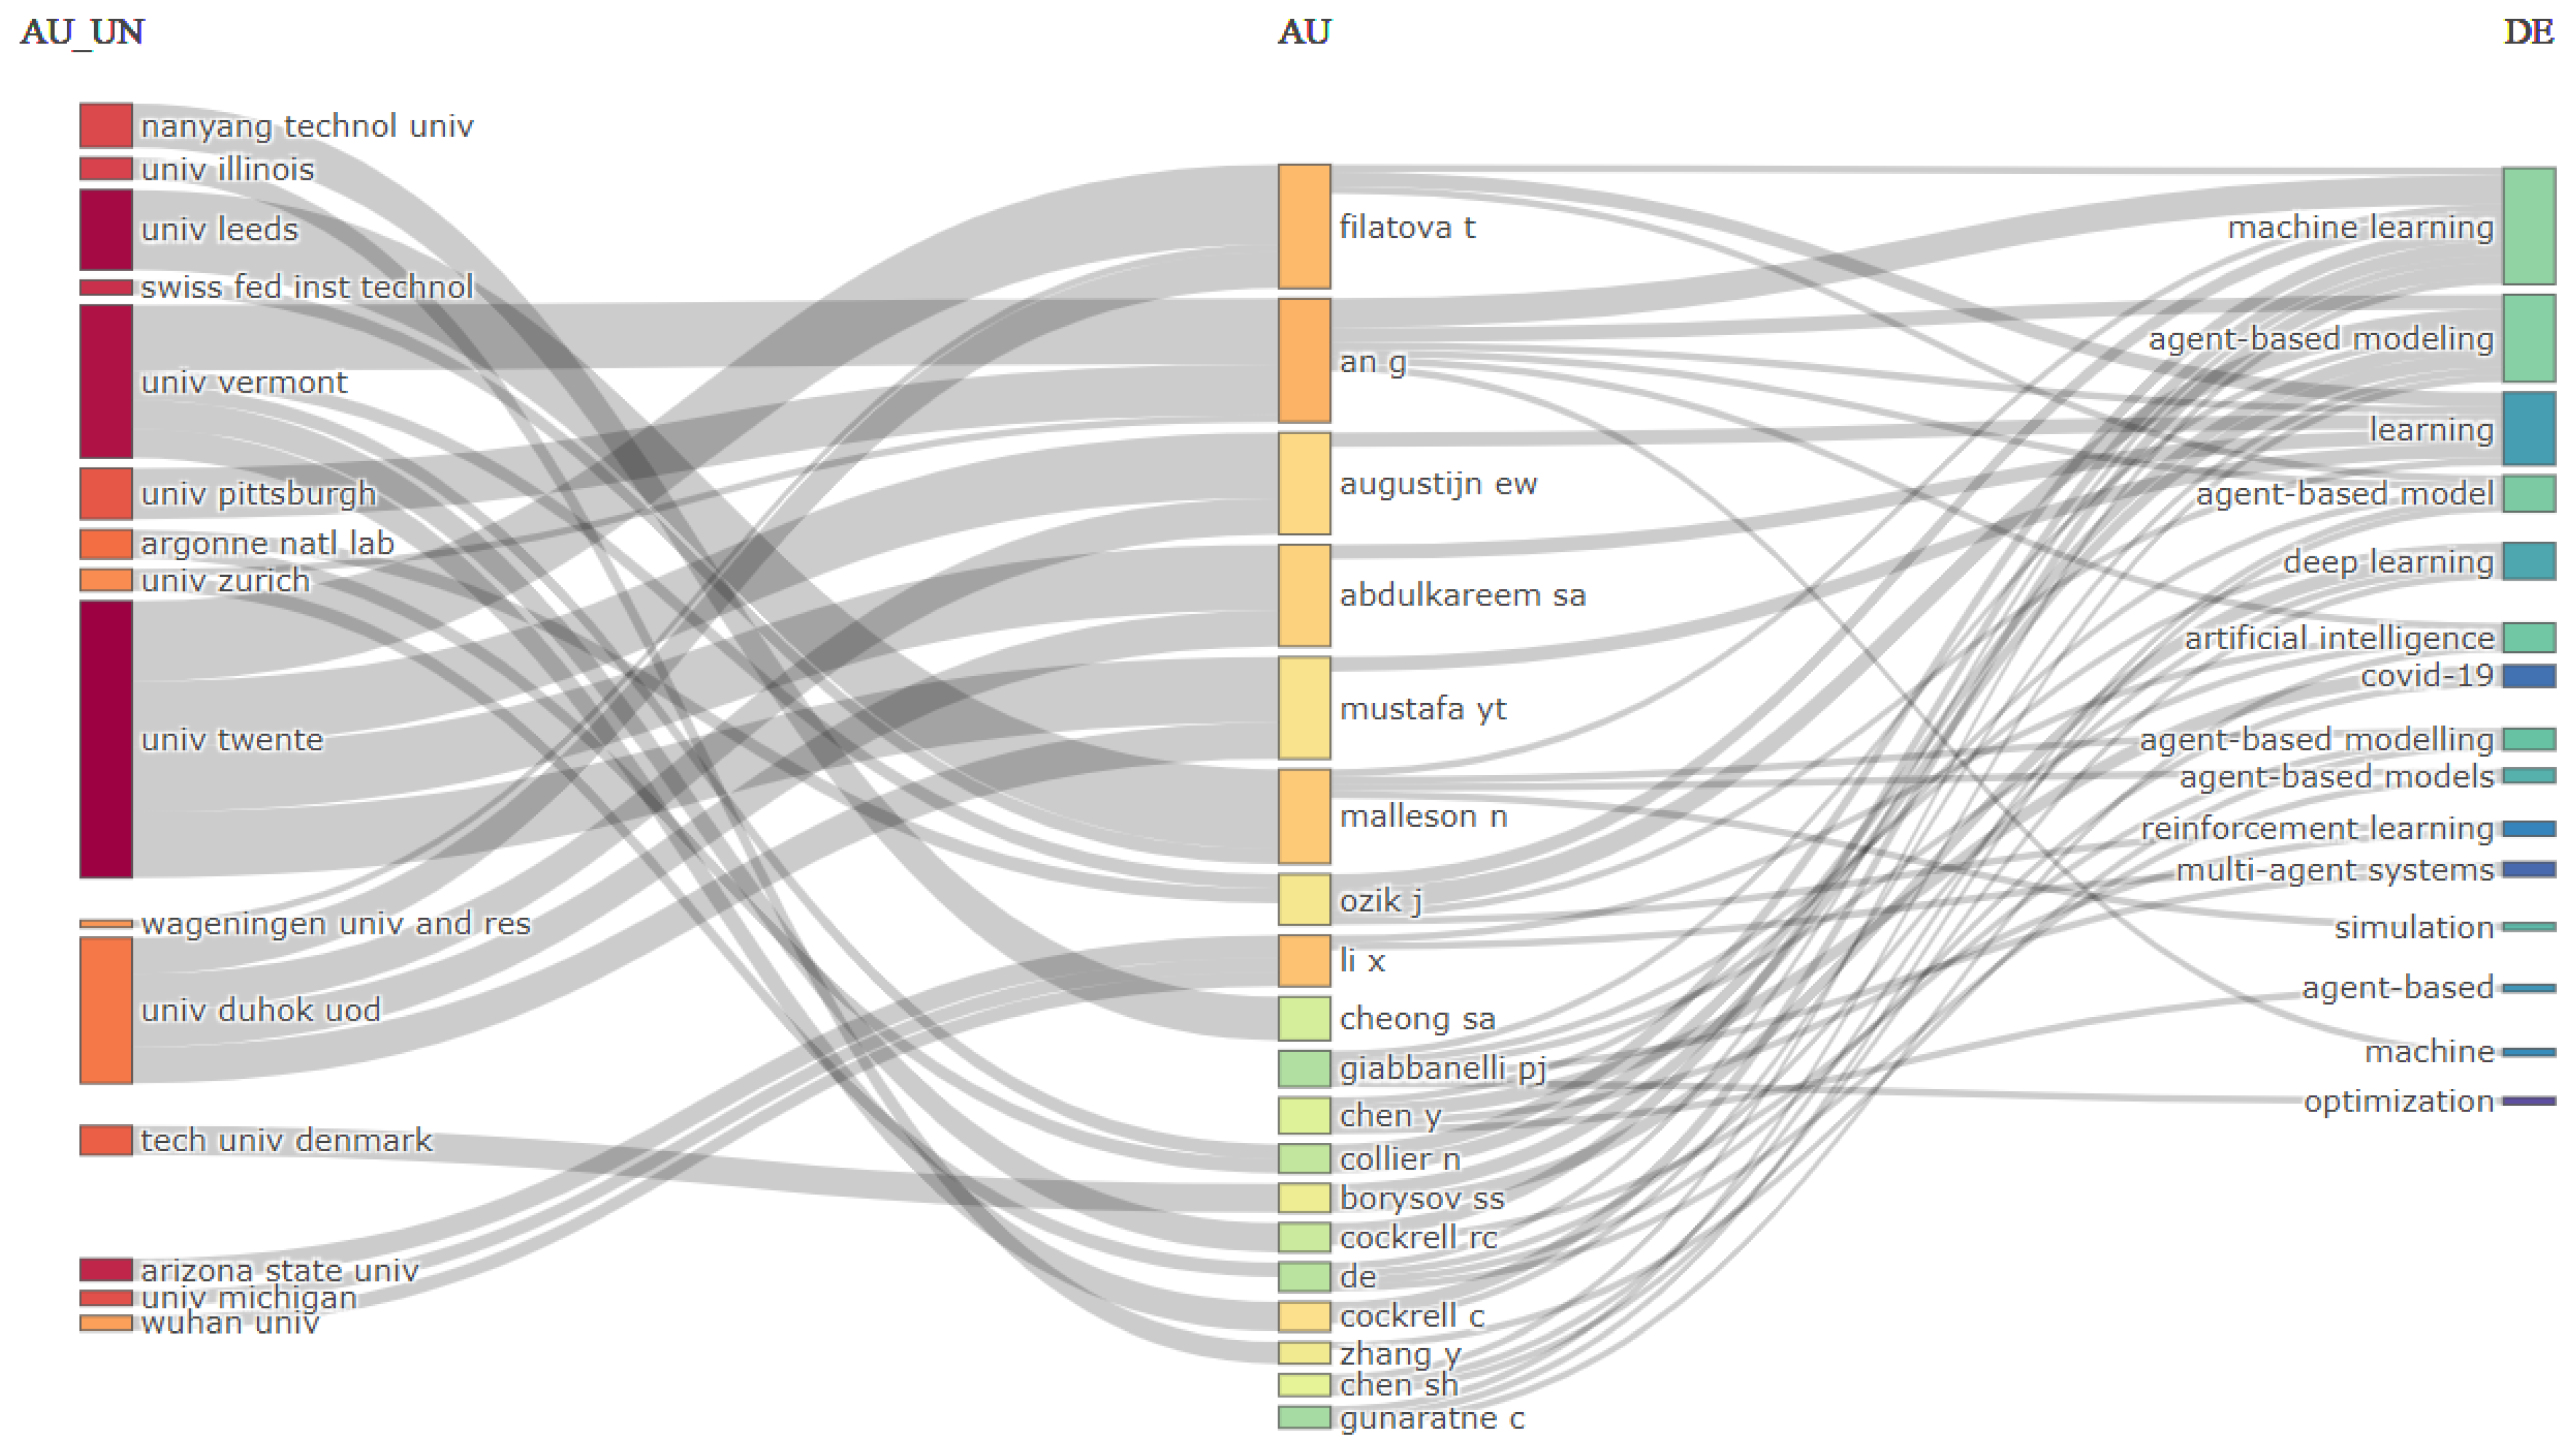
Additionally, in
Figure 23, a Three-fields plot (affiliations, authors, keywords) was generated.
The first section illustrates how authors’ affiliations are distributed in the scientific space, allowing us to observe if certain institutions dominate in specific fields. The second part of the plot focuses on the authors themselves, providing information on how they are connected based on their affiliations. The last section highlights the keywords associated with the research field, offering insights into emerging research trends and directions.
VOSviewer is a powerful tool for visualizing networks in bibliometric data [
78,
79]. From the analysis conducted in
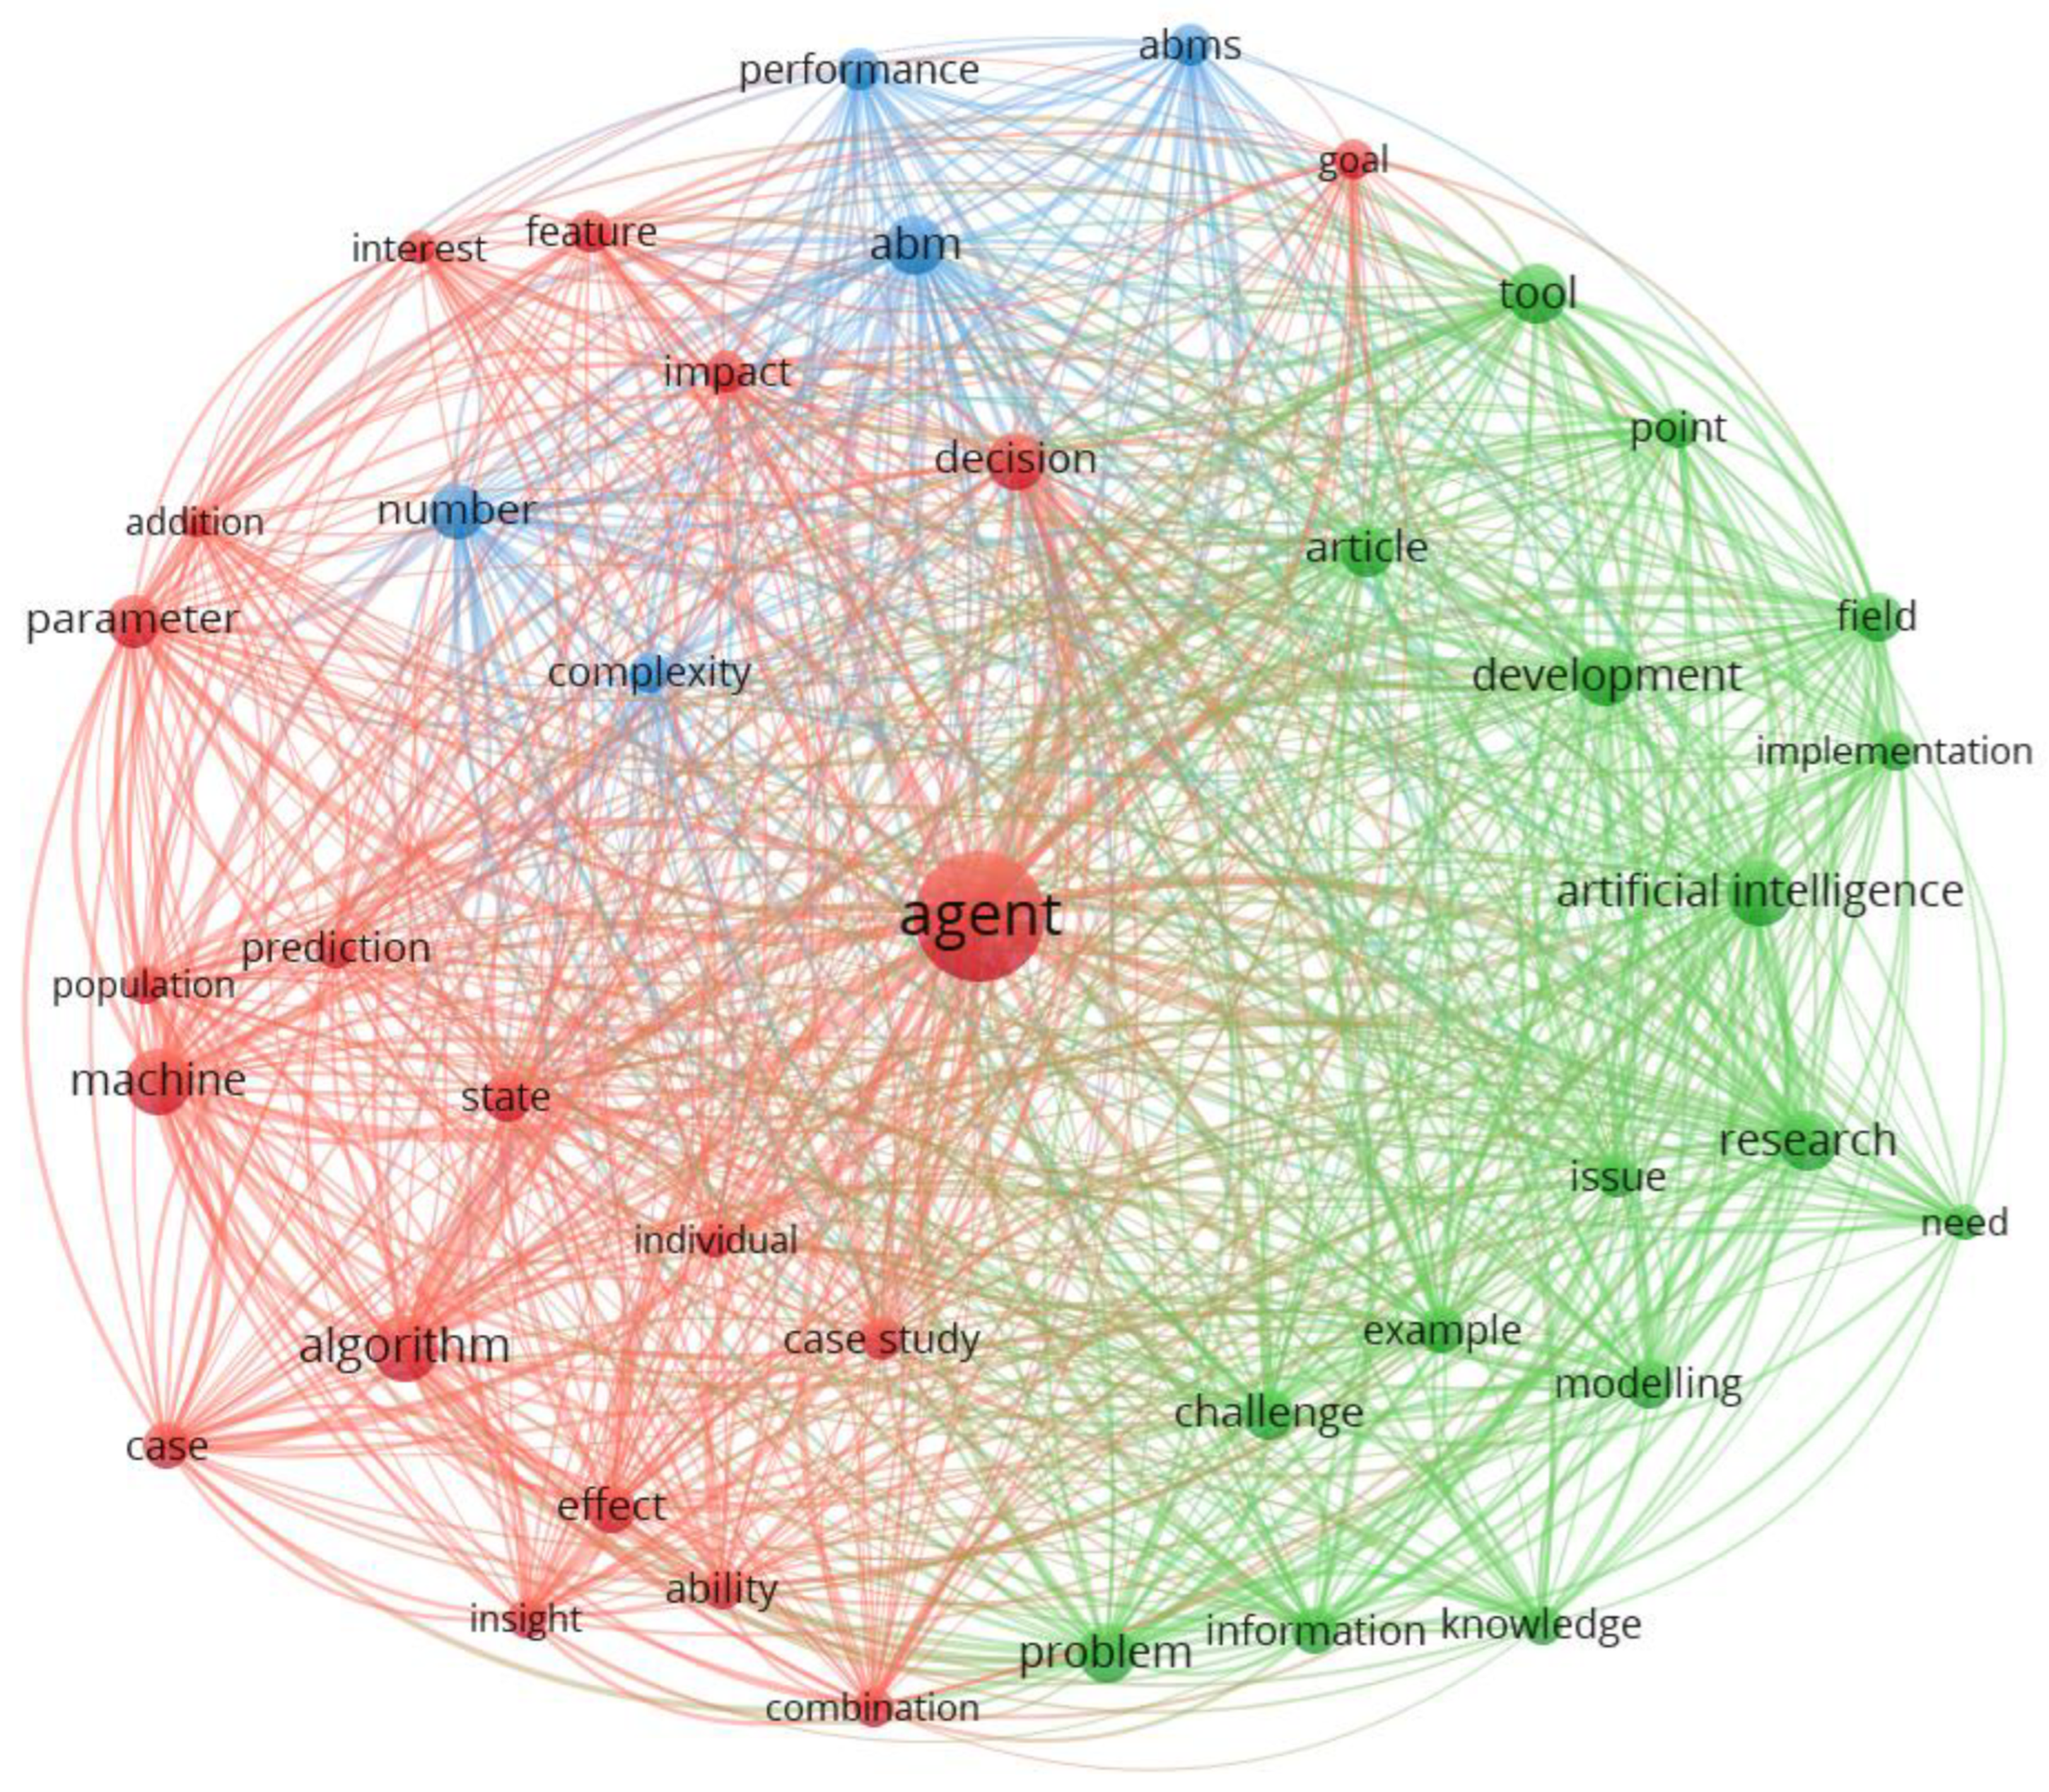
Figure 24, we can observe if there are certain patterns, connections, and relevant trends associated with the specific research field. Each color highlighted in
Figure 24 represents a cluster, having their explanation in
Table 11.
In
Table 11, the formed clusters are described. Regarding Cluster 1 (red), among the representative keywords, we find “agent”, “algorithm”, “machine”, “prediction”, “decision”, “parameter”, “effect”, and “case study”. Thus, this cluster highlights specific aspects of ABM, such as algorithms, agent abilities, and the effects and impact of predictions on the population or individuals. Special attention is given to “agents”, “machines”, and “algorithms” in this cluster. Cluster 2 (blue) features representative words such as “AI”, “modeling”, “development”, “knowledge”, “issue”, “need”, etc. This cluster focuses on aspects related to AI in the context of ABM. Cluster 2 addresses the challenges, development, and implementation of AI in this field, highlighting the resolution of needs and associated problems through AI. As for Cluster 3 (green), it includes keywords such as “ABM”, “complexity”, and “performance”. This cluster centers around concepts such as complexity, performance, number, and agent-based models (ABMs). It may also reflect an interest in analyzing how these models behave in complex contexts.
4. Discussion
Our research focuses on constructing a holistic landscape of the interconnections between ABM and artificial intelligence. To create this comprehensive landscape, bibliometric analyses were conducted on the temporal evolution, citations, collaborations, and geographical distribution in the fields of AI and ABM. Thus, we examined the significant growth in interest and activity, the contemporary research explosion, temporal trends and fluctuations, sustainability of impact, diversity, and interdisciplinary nature of journals, as well as the dominance of countries and regional collaborations regarding scientific production.
Regarding the temporal evolution of research, our results reveal a significant increase in scientific production, especially post-2006. The peaks in 2021 and 2022 suggest heightened interest and increased activity, indicating a contemporary surge in exploring AI in ABM. However, fluctuations in the 2000s and stability from 2009 to 2015 raise questions about the influencing factors. Possible causes could include technological advances, global events, or shifts in research focus (RQ6).
From the perspective of citation trends, the consistent growth in citations per year per document signifies sustained impact and recognition. The 2021 peak implies an accumulation of influence, suggesting significant contributions during that period. The continued high level of citations in 2022 underscores the ongoing relevance of recent studies. Understanding the factors behind these citation patterns could provide insights into influential works and emerging trends. Our bibliometric analysis highlights that the study of Bagstad et al. [
66] is the most influential article, considering it has the highest number of citations. The authors have developed a systemic approach to quantifying the flow of ecosystem services using a formalized approach in the form of a class of agent-based models developed within the Artificial Intelligence for Ecosystem Services project (RQ1). Thus, we can observe the interest of researchers and specialists in the development of service flows in this area. By using the same criteria regarding the total number of citations globally, the bibliometric analysis has highlighted authors Bagstad et al. [
66], Hare and Deadman [
26], O’Sullivan and Haklay [
67], Teodorović [
68], and Lamperti [
69], ranking as the top 5 authors based on the total number of citations (RQ2).
The application of Reference Publication Year Spectroscopy (RPYS) to analyze cited references over time reveals historical trends in ABM and AI. The recent decline may indicate a shift in research focus or a reevaluation of seminal works. Further exploration is necessary to understand the implications of these changes and their impact on the current state of the field.
Additionally, Lotka’s Law, in line with our article analysis, indicates a small percentage of authors contributing to the majority of research in this field. This is supported by the ABC-Pareto analysis. The diversity of journals and their interdisciplinary nature indicate extensive exploration of AI applications in ABM. According to our analysis of the top 20 most relevant journals in the context of our study, we have identified that these 20 journals cover a diverse range of disciplines, highlighting the interdisciplinary nature of AI and ABM applications. Journals such as the Journal of Economic Dynamics & Control, PLOS ONE, and Transportation Research Part C-Emerging Technologies appear to be prominent contributors. The variety of journals with multiple articles suggests a broad exploration of AI applications in ABM, covering economic dynamics, control, emerging technologies, computational economics, and more. This diversity signifies a comprehensive examination of the subject. The presence of journals such as Ecological Modelling and Frontiers in Physiology indicates interdisciplinary exploration, highlighting the extended impact of AI and ABM beyond traditional domains (RQ3, RQ4). Identifying key journals and grouping them according to Bradford’s Law provides valuable insights into publishing trends and can guide researchers seeking impactful platforms. Furthermore, our analysis highlighted that universities such as Twente, Leeds, Vermont, British Columbia, and Arizona State are at the forefront of research in the field of artificial intelligence, based on articles published in ABM (RQ5).
The dominance of certain countries in scientific production emphasizes the global landscape of AI in ABM research. The collaboration map between countries can be interpreted by analyzing the frequency of collaborations between different pairs of countries. Specifically, it is important to observe which countries collaborate most frequently and in what contexts. Our results have highlighted collaborations among European countries, with multiple connections between Belgium, Finland, France, Germany, the Netherlands, Spain, and Switzerland. Additionally, Asian countries such as China and Korea have connections both among themselves and with European countries. An interesting observation from the perspective of interspecific collaborations is that our results have revealed collaborations between countries with different geographical and cultural perspectives, such as Australia and Iraq or Brazil and China. The most intense collaborations were observed with the USA, which frequently collaborates with the United Kingdom and Switzerland (RQ7). The collaboration map highlights regional, cultural, and interdisciplinary partnerships, offering opportunities for enhanced cooperation and knowledge exchange.
Interpreting the results of cluster analysis for keyword co-occurrences in VOSviewer in connection with the data extracted from WoS, it can be observed that the Red cluster highlights a broad interest in concepts such as “Agent”, “Algorithm”, “Machine”, and “Prediction”, suggesting a focus on the technical and technological aspects of AI and algorithms. The Blue cluster reveals terms like “Artificial Intelligence” and “Modelling”, reflecting a particular interest in the development and implementation of AI. The Green cluster indicates an interest in “ABMs” and “Performance”. This might suggest that the scientific community is united in exploring agent-based models and evaluating their performance. These findings underscore the complexity and diversity of approaches in scientific literature, also highlighting how crucial it is to understand the specific context of each data source in interpreting the results. It is essential to consider these differences when comparing and synthesizing results from different sources.
5. Conclusions
The present research highlights an innovative perspective on the interaction between ABM and AI. Through detailed bibliometric analyses, we have not only emphasized the significant increase in interest and activity in these fields but also the contemporary explosion in their research. This holistic approach has revealed temporal trends, the sustainability of impact, diversity, and interdisciplinarity of the involved journals, as well as the dominance of certain countries and regional collaborations in scientific production.
The results of our study shed light on the interconnections between ABM and AI, with the bibliometric analysis conducted providing a comprehensive view of the temporal evolution, citations, collaborations, and geographical distribution in the fields of AI and ABM. The bibliometric analyses allowed us to examine the significant increase in interest and activity, the contemporary research explosion, temporal trends and fluctuations, sustainability of impact, diversity, and interdisciplinary nature of journals, as well as the dominance of countries and regional collaborations in scientific production.
The utility of this research lies in providing a comprehensive map of the scientific landscape of the interconnections between ABM and AI, offering researchers and professionals a robust framework for understanding the evolution of these domains and identifying relevant research directions.
The significance of this work resides in its ability to synthesize temporal, regional, and thematic perspectives of research, contributing to shaping a comprehensive framework. It not only reflects the current state of the field but also opens doors to new horizons of exploration and development. Our results reinforce the idea that researchers, practitioners, and decision-makers should more extensively implement AI algorithms in ABM, as it can contribute to improving the accuracy and relevance of the results, as demonstrated in their articles and by Turgut et al. [
25], Hu et al. [
30], Taghikhah et al. [
28], Zhang et al. [
15], and Sivakumar et al. [
24].
Our paper makes a significant contribution to the existing research in the area by highlighting and exploring the complex interactions between ABM and AI. In contrast to previous research, which predominantly focused on specific aspects, our study provides a comprehensive overview of temporal evolution, collaborations, and geographical distribution, bringing forth significant trends and key interconnections. Also, our bibliometric analysis and keyword cluster study offer a detailed perspective on how the scientific community approaches these topics across various data sources, revealing the intricacies and diversity of ABM and AI research.
However, potential limitations of our research include a citation lag that may impact the accuracy of impact assessments, particularly for more recent works. The interdisciplinary nature of AI in ABM may pose challenges in accurately categorizing publications, requiring careful consideration of classification criteria. While the analysis provides a global perspective, regional variations in priorities and research challenges may not be fully captured. A more detailed examination of specific regions could provide additional insights. Additionally, a limitation of our study, which could also serve as a future research direction, is the examination of funding sources and collaborations to provide another perspective on the dynamics of research in the fields of AI and ABM, including the role of industry-academia partnerships and international collaborations.
Future research directions could focus on a deeper analysis of how recent technological advancements influence the evolution of agent-based models and the utilization of artificial intelligence. Evaluating how anticipated technological progress can shape and steer research in ABM and AI is another future objective we have in mind. Additionally, investigating how global events, such as major socio-economic changes or global crises, can impact the research directions in ABM and AI. Furthermore, a more detailed exploration of how ABM and AI interact in specific domains, such as economics, ecology, or medicine, will highlight the unique challenges and opportunities in each field. Moreover, despite the significant contributions made by research in the fields of AI and ABM, it is crucial to be aware of the ethical and societal implications of this integration. Future research should conduct a more in-depth assessment of these aspects, and researchers should pay special attention to ensuring a robust ethical framework in the development and application of agent-based models involving artificial intelligence.


