Abstract
Electric and autonomous aircraft (EAA) are set to disrupt current cargo-shipping models. To maximize the benefits of this technology, investors and logistics managers need information on target commodities, service location establishment, and the distribution of origin–destination pairs within EAA’s range limitations. This research introduces a three-phase data-mining and geographic information system (GIS) algorithm to support data-driven decision-making under uncertainty. Analysts can modify and expand this workflow to scrutinize origin–destination commodity flow datasets representing various locations. The algorithm identifies four commodity categories contributing to more than one-third of the value transported by aircraft across the contiguous United States, yet only 5% of the weight. The workflow highlights 8 out of 129 regional locations that moved more than 20% of the weight of those four commodity categories. A distance band of 400 miles among these eight locations accounts for more than 80% of the transported weight. This study addresses a literature gap, identifying opportunities for supply chain redesign using EAA. The presented methodology can guide planners and investors in identifying prime target markets for emerging EAA technologies using regional datasets.
1. Introduction
Efficient and reliable freight movement is fundamental to successful supply chain management. Emerging technologies like electrified autonomous trucks (EATs) and electrified autonomous aircraft (EAA) hold potential to disrupt traditional logistics paradigms. While EATs share roadways with other vehicles, EAA can bypass ground traffic and take more direct routes, providing a door-to-door service via vertical takeoff and landing (VTOL) on redesigned roofs or vertiports of distribution centers, sorting facilities, and retail stores [1].
From the supply perspective, ongoing truck driver shortages, railroad strike threats, fuel price hikes, and the scarcity of good-condition roadways have prompted shippers to explore alternatives [2]. Factors such as traffic congestion, deteriorating roads and bridges, and weather events escalate the cost of truck shipments [3]. Analysts forecast that the number of vehicles on the road will more than double between 2020 and 2050 [4], making it unsustainable to add more trucks to already-congested roadways [5].
From the demand perspective, air transport, considered the safest and most secure mode of transportation [6], is especially suitable for high-value, low-weight, and time-sensitive goods [7]. All EAA manufacturers prioritize safety over all other aspects [8]. The growth of e-commerce and the push for same-day and next-day deliveries will also accelerate the demand for air transport. Analysts forecast that the demand for shipments delivered by air will more than double between 2019 and 2039 [9].
Electrified autonomous aircraft (EAA) play a crucial role in urban air mobility (UAM) and regional air mobility (RAM) initiatives, providing “last mile” and “middle mile” transport services, respectively [1]. Environmental stewardship and sustainability also contribute to EAA utilization, as they can help reduce the adverse effects of traffic congestion [10] and protect the environment from dangerous cargo spills [11]. However, commercial EAA services face uncertainties due to current federal regulations restricting their use [12]. Nevertheless, the goal of this research is to provide data-driven answers to the following research questions:
- Which commodities are best suited for air transport?
- What should EAA deployments focus on to meet the highest demand?
- What is the distribution of origin–destination pairs that fall within EAA flight range capabilities?
This research contributes a practical data-mining workflow with algorithms that logistical planners and investors can leverage to analyze available commodity flow data for any region of interest. Using comprehensive commodity flow data from the United States, the authors illustrate the developed workflow, highlighting its utility in answering the research questions.
The organization of the rest of this paper is as follows: Section 2 reviews literature on middle-mile deliveries using EAAs. Section 3 outlines the developed data-mining algorithms to address the research questions. Section 4 discusses the analysis results and their implications for stakeholders like supply chain managers, shippers, and urban planners. Section 5 concludes the research and proposes future work to evaluate the sensitivity of mode shifts relative to adoption time horizons for EAAs and EATs.
2. Literature Review
Though ‘last-mile’ is a frequently used term in transport logistics, ‘middle-mile’, denoting cargo movement between intermediary facilities, is less prevalent [13]. Amazon cautions that inefficiencies in the middle-mile can significantly affect last-mile deliveries to end customers [14]. The United States Department of Transportation’s (USDOT’s) national freight strategic plan anticipates a faster growth rate in overall transport demand for low-weight, high-value commodities than for high-weight, low-value commodities [15]. Such a trend could trigger shifts from trucks to air modes, particularly if significant reductions in operating costs and safety risks can occur through electrification and automation [16,17]. This has resulted in increasing interest in heavy-lift EAAs for middle-mile services [18].
Recent studies identify reductions in delivery time, cost efficiency, and increased flexibility as primary reasons for cargo EAA adoption [19]. For instance, FedEx is exploring cargo EAAs as potential skyway conveyor belt equivalents among hubs, ramps, and stations [20]. Similarly, UPS has announced plans to utilize EAA for expedited deliveries of time-sensitive commodities [21]. Maersk, the world’s largest container shipping line, announced that it will launch an air cargo business to reduce the effects of supply chain disruptions from port logjams, COVID-19 lockdowns, and the crisis in Ukraine [22].
Autonomous trucks can provide a much-needed solution to an industry that has grappled with high driver turnover for nearly five decades [23,24]. Despite these prospects, the trucking industry faces challenges such as poor roadway conditions, traffic congestion, accidents, weather events, and pressure to decrease pollutive emissions [3,25]. Therefore, the cost reduction and ongoing performance enhancement of EAA will encourage companies to expand their markets for next-day and same-day deliveries using cargo EAAs [26]. For instance, Amazon aims to extend its one-day or same-day service beyond the 72% of the U.S. population it currently serves [1]. Despite these commercial developments, a recent literature review found a lack of studies on the potential utilities and challenges of cargo EAAs [19].
Much of the literature focuses on short-range EAA applications like monitoring transportation assets [27], providing on-demand air mobility for passengers [28], managing healthcare logistics [29], and conducting direct urban package deliveries [30]. However, the literature offers minimal analysis on the potential utility of EAAs for middle-mile deliveries over extended distances.
The literature has explored the broader influences and impacts of EAA adoption in the logistics sector. Huang et al. (2022) found that safety is a main hindrance in the adoption of new transportation technologies [31]. Raj and Sah (2019) found that technological advancements and government regulations are the most influential factors in EAA adoption [32]. Kwon et al. (2017) applied text mining to study the social impacts and acceptance of EAA deployments [33]. Goodchild and Toy (2018) studied how EAA deployments could affect carbon dioxide emissions [34]. Reiche et al. (2021) examined how weather might affect EAA delivery services [35]. Bauranov and Rakas (2021) provided some recommendations for urban airspace design to address concerns of noise, safety, capacity, and privacy [36]. Table 1 summarizes the key contributions of these papers and lists the gaps identified relative to the contributions of this study.

Table 1.
Key contributions and gaps in the literature.
Anticipating profitable markets for EAA cargo services, numerous aircraft manufacturers have garnered billions in investment to commercialize their designs [37,38]. Joint research by Deloitte Consulting LLP and the Aerospace Industries Association revealed that the U.S. market for Advanced Air Mobility (AAM) could equal 30% of the U.S. commercial aerospace market in 2019 by 2035, reaching USD 115 billion [39]. Similarly, Morgan Stanley believes that the global market for autonomous aircraft will reach USD 1.5 trillion by 2040 [40]. However, obstacles to current adoption include factors such as public acceptance [41], affordability [41], environmental impact [42], safety [43], integration with the Internet of Things [44], and the buildout of support infrastructures such as vertiports and fast-charging facilities [39]. Manufacturers continue to investigate various aircraft design and electrification options to address the potential urban transportation market [45]. Furthermore, there are still many unresolved risks for the safe integration of EAAs into the national airspace system [46].
The existing literature offers limited insights on optimizing middle-mile cargo EAA operations for supply chain improvement. Significant alterations to supply chain design can result from disruptive technologies, necessitating new skills and processes [47]. Previous studies have assessed the impact of other disruptive technologies such as blockchain, 3D printing, IoT, and AI on the supply chain [48]. This study aims to bridge this gap by pinpointing opportunities to bolster supply chain efficiency and reliability using EAAs.
3. Methodology
The methodology to answer the research questions included a three-stage data mining and GIS workflow. Each stage applied data filters to (1) identify truck and air commodity demand clusters and their intersections, (2) recognize the regional demand distribution for the selected commodity clusters, and (3) determine a truncated distribution of geodesic distance bands suitable for cargo EAAs among the selected regions. Figure 1 illustrates the three stages as “What”, “Where”, and “How” in terms of what commodities to target, where to initiate service, and how to select the origin–destination pairs from the subset based on distance constraints, respectively.
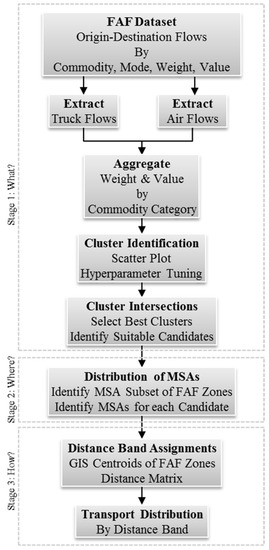
Figure 1.
Three-stage data-mining workflow.
The data-mining methodology depends on the availability of a robust dataset of commodity flows by air and truck. The author selected the Freight Analysis Framework (FAF) dataset as it is the most comprehensive source of multimodal freight movements available within the United States. This dataset combines data from various sectors, including agriculture, extraction, utility, construction, and service [49]. Each row of the FAF version 5.5 dataset lists a commodity category moved between pre-defined zones by mode, weight in thousand-ton units, and value in million U.S. dollar (USD) units. The next three subsections describe each phase of the analytical workflow. The dataset had 2.4 million records.
3.1. Demand Cluster Intersection
The first stage of the workflow answered the research question, “Which commodities have the best propensity for transport by air?”. Initially, it identified significant value and weight associations in clusters of commodity categories transported by air and using trucks. Then, the algorithm empirically detected intersecting commodity categories among the selected clusters for truck and air transport.
The analysis compared results from three mature unsupervised machine learning (UML) methods: k-means, Louvain, and density-based spatial clustering of applications with noise (DBSCAN). The algorithm labeled the clusters for visual display in a scatterplot of the value-weight feature space. Table 2 summarizes the theory of operations of the three clustering algorithms, their hyperparameters, and a reference that explains their operation in greater detail.
Table 2.
Unsupervised machine learning algorithms compared for cluster detection.
The scatter plot visualization helped with tuning the hyperparameters by providing feedback to the analyst.
In preparation for the cluster identification, the workflow extracted commodity flows from the FAF dataset by truck and then aggregated the weight and value by each commodity category. The workflow repeated the process for commodity flows by air. The output of this workflow stage comprised high-value, low-weight clusters common to trucks and air transport.
3.2. Regional Demand Distribution
This stage of the methodology addressed the second research question, “Where would EAA deployments likely serve the largest demands?”. The zones defined in the FAF dataset encompassed areas that are metropolitan statistical areas (MSAs) and areas outside of MSAs, such as the remainder of a state, or entire states. The objective involved selecting MSAs as location candidates because of their high population density, significance to trade, and spatial localization. The empirical strategy to distinguish MSAs from other FAF zones was to detect where their metadata description contained the words “area” or “part”. Consequently, the procedure identified 83 MSAs among the 129 FAF zones in the contiguous United States (CONUS).
A pivot table algorithm compiled the MSA arrival and departure weights for each commodity category selected in the previous stage. A histogram of the pivot table output then presented the MSA distribution by weight moved. The distribution identified single MSAs that moved the most weight using trucks as target locations to serve the highest demands.
3.3. Distance Band Truncation
This stage of the methodology addressed the third research question, “What is the distance distribution of origin–destination pairs that would be within EAA flight range capabilities?”. Without knowledge of future EAA port locations, the distance distribution of ports between FAF zone pairs spans the distance between the closest and furthest borders of the FAF zone pair. Hence, the geodesic distance between centroids of FAF zones provided an estimate for the mean distance between pairs of FAF zones. Subsequently, the workflow first located the centroids of each FAF zone by using a geographic information system (GIS) tool and then generated a distance matrix of all the pairwise combination of centroids. Hence, the matrix contained distances between the 16,512 (1292 − 129) centroid pairs, based on the ESRI 102005 “Contiguous Equidistant Projection” coordinate reference system. The GIS tool naturally produced zero for flight distances within a FAF zone, which was undesirable. The remedy was to estimate the nominal flight distance within a FAF zone as half the diagonal of a square with area equal to that of the FAF zone. The algorithm estimated the length of a side of the square by taking the square root of the area of the FAF zone.
To determine the area of the FAF zone, a GIS algorithm dissolved all CONUS counties within a FAF zone with the land and water areas. The algorithm used the GIS shapefile from the USCB TIGER® database, which contains both the land and water areas of all U.S. counties [52]. The algorithm used the USCB 2017 commodity flow survey geographies database, which contained a FAF zone identifier for each U.S. County [53]. The workflow merged the TIGER® shapefile with data from the FAF geographies database by using the federal information processing (FIP) code for each county as the merge key. The CFS07_DDESTGEO field of the FAF geographies database matched the FAF zone codes except for 16 of them, which the author discovered by iterating the merging procedure and identifying missing values. Table 3 summarizes the FAF zone code revisions needed to complete the merge. Figure 2 illustrates the final GIS dissolve that resulted in 83 MSAs and 46 other FAF zones, along with their geospatial centroids. The assorted colors in the figure serve only to help more clearly distinguish between the regions and, particularly, adjacent regions.
Table 3.
Mismatched FAF zone codes in the CFSG database.
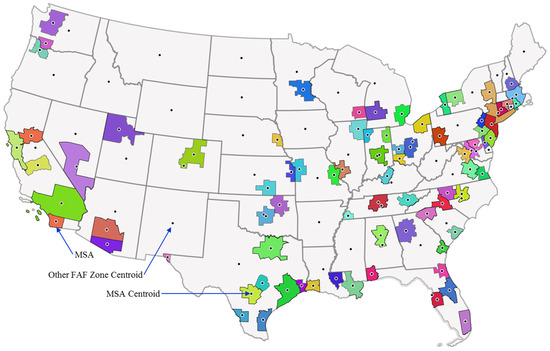
Figure 2.
MSAs, other FAF Zones, and their centroids.
4. Results and Discussions
The subsections of this section reflect those of the methodology section to align the results of each data filter stage of the data-mining workflow.
4.1. Demand Cluster Intersection
Figure 3 shows the results from the three clustering algorithms. The first and second rows of the figure are weight–value scatter plots for air and trucks, respectively. In the air analysis, Louvain and k-means discerned similar points in cluster 5 (C5) and cluster 2 (C2), respectively, except for one noticeable outlier in the top right of the chart. For trucks, Louvain and k-means agreed on some points within cluster 3 (C3) and cluster 1 (C1), respectively. DBSCAN tended to isolate the outlier and cluster the remaining points together. Overall, k-means clustering provided the most logically attractive groupings of high-value, low-weight and low-value, high-weight commodities.
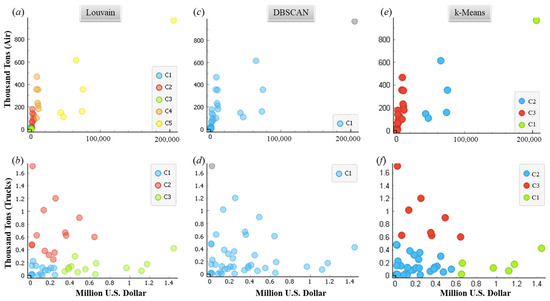
Figure 3.
Comparison of clustering results for Louvain (a,b), DBSCAN (c,d), and k-means (e,f).
Figure 4 points to the commodity categories in the k-means high-value, low-weight clusters that have the best propensity for air transport. The selected commodity categories were mixed goods, electronics, machinery, and pharmaceuticals due to their high market value that EAAs can capture from trucks. The remaining unselected commodity categories were both lower in value and much less frequently transported by air.
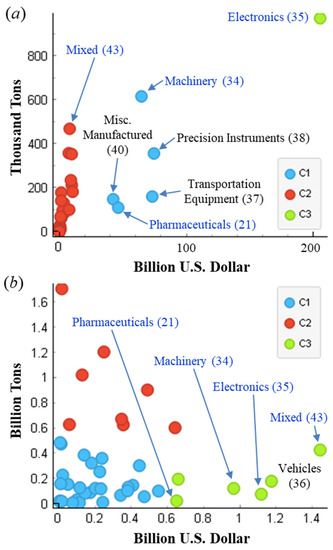
Figure 4.
K-means clustered high-value, low-weight commodity categories transported by (a) air and (b) using trucks.
The selected commodity categories represent time-sensitive and high-value items. The selected commodity categories represent time-sensitive and high-value items. The time urgency of orders for these items could significantly influence the distribution of EAA usages. For example, the machinery category includes replacement parts to keep manufacturing lines moving; the mixed goods category includes fresh supplies for restaurants; and the pharmaceutical category includes urgently needed medical items. Electronics emerged as a high-value outlier in both air and truck transport, with a more extreme disparity in air transport. Figure 5 ranks the commodity categories transported by value proportion and maps the intersection of each high-value, low-weight cluster for trucks (cluster 3) and air (clusters 1 and 3). There is a point of diminishing returns in value proportion for commodity categories outside of each high-value, low-weight cluster.
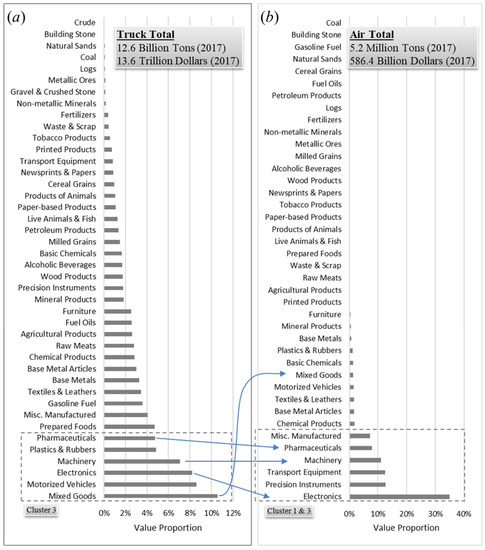
Figure 5.
Commodity category distribution by value proportion carried using (a) trucks and (b) by air.
Electronics, machinery, and pharmaceuticals were common categories in both high-value clusters for truck and air. The commodity category of mixed goods was the highest in value proportion moved using trucks. This indicates its potential for mode shift to cargo EAAs even though it is mapped outside of the high-value, low-weight cluster for air transport.
Table 4 presents a summary of the representative composition of each selected commodity category [54]. Table 5 summarizes the weight, value, and rank of the four selected commodities that have the highest propensity for mode shift to cargo EAAs. To provide a perspective on the weight, a typical North American semi-trailer truck (18-wheeler/big rig) carries 45,000 pounds (22.5 tons) of cargo [55]. The table shows that the four commodity categories moved among all FAF zones in 2017 required the equivalent of 28,268,257 (28 million) semi-trailer trucks (truckload equivalent). Based on growth estimates from the NFSP, truck transport will increase 35% by 2040 [15]. The four selected commodities comprised 30.7% of the value proportion of all commodities moved in the CONUS but only 5% of the weight.
Table 4.
Representative content of the selected commodity categories.
Table 5.
Commodity categories selected for spatial demand analysis.
4.2. Regional Demand Distribution
Figure 6 shows the MSA distribution by weight moved in thousand tons (KTons) for each of the four commodity categories selected in the previous stage of the data-mining workflow. Each colored box represents an MSA. The figure presents the outlier MSAs for the movement of commodity categories using trucks. Trucks in the Los Angeles (LA), California (CA), MSA transported the majority of the top three commodity categories by a significant margin.
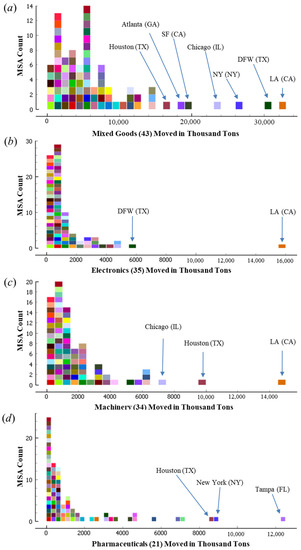
Figure 6.
MSA weight distribution of (a) mixed goods, (b) electronics, (c) machinery, and (d) pharmaceuticals.
Trucks in the Texas (TX) MSAs of Dallas–Fort Worth (DFW) and Houston moved the next largest amount of the four commodity categories. Table 6 summarizes the weight of the four commodity categories moved in the top eight MSAs. The four selected commodity categories moved in the eight MSAs accounted for 20.1% of the weight moved in the CONUS. Electronics was the largest proportion by weight (28%) moved using trucks among the top eight MSAs. Additionally, electronics is by far the top commodity category moved by air. Therefore, it has the greatest propensity for mode shift from trucks, especially for time-sensitive orders that could benefit from the faster delivery times offered by EAA. This mode shift could potentially lead to significant changes in the logistics industry, including changes in delivery times, cost structures, and operational efficiencies. Future research should explore these potential impacts in more detail.
Table 6.
Commodity weight moved in the top MSAs.
4.3. Distance Band Truncation
Table 7 displays the truckload equivalents transported among the top eight MSAs in four distance bands for each of the four commodity categories selected. Movements across all distances (not shown in the table) required 8,604,968 truckload equivalents in 2017, which accounted for 30.4% of the truckloads in the CONUS. The number of truckload equivalents will raise by 35% by 2040 even though the proportion of truckloads will remain similar [15].
Table 7.
Truckload equivalent flows between the top MSAs.
Figure 7 shows the distribution of truckload equivalents across all distance bands. In summary, truck transport within 100 miles accounted for 39.3% of the truckload equivalents for the four selected commodity categories. The accumulated proportion (% Acc) moved was 80.5% within a 400-mile distance band. Hence, 400 miles represented a point of diminishing returns for transporting those commodities by air. Current projections based on the anticipated improvements of battery technology suggest that cargo EAAs will exceed those ranges well before 2050 [26].
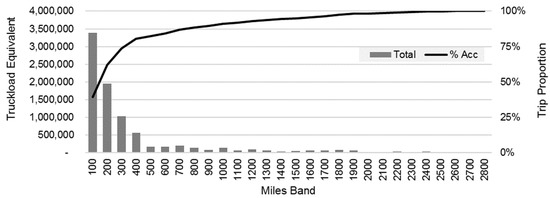
Figure 7.
Truckload equivalent and accumulated trip proportion for the selected commodities and MSAs.
In a comparison with the existing literature, the results of the data-driven approach to optimizing cargo shipping with EAA provide a unique contribution to the field. While previous studies have explored the potential of EAA in various contexts, as summarized earlier in Table 1, none have specifically focused on using a data mining and GIS workflow to optimize cargo shipping with EAA. The findings of this study align with a key observation by the USDOT’s national freight strategic plan, which anticipates a faster growth rate in overall transport demand for low-weight, high-value commodities than for high-weight, low-value commodities. The finding that a distance band of 400 miles among eight regional locations accounts for more than 80% of the transported weight provides a practical guide for planners and investors in identifying prime target markets for EAAs, a gap that previous studies did not address. While these findings are consistent with the broader literature on the potential of EAA for cargo shipping, this contribution of a data-driven approach to optimize cargo shipping with EAA is unique.
4.4. Limitations
EAA transport may not suit all goods within the identified commodity categories. As the EAA technology evolves, logisticians must reconsider factors such as bulkiness, packaging limitations, cost, and relative demand. Even though manufacturers aim to augment EAA payload, there will be a capacity limit, making it challenging to transport certain kinds of bulky goods with EAAs. On the other hand, as EAA technologies continue to evolve, and systems can manage larger autonomous fleets at all hours and at a lower cost, it will become more profitable to carry certain high-demand, high-value, and light-weight goods. The International Air Transport Association (IATA) suggests that smartphones, tablets, laptops, gaming electronics, pharmaceuticals, medical items, and urgently needed factory parts or tools are some examples of items that are suitable for air transport [56].
While this study provides valuable insights into identifying commodity categories and locations that would be economically desirable for transport by EAAs, further assessment is necessary to determine the specific types of goods within these categories that are suitable. Consequently, this study forms a foundation for logisticians to initiate a more detailed assessment of the types of goods within the identified commodity categories and locations that would be most economically desirable for transport by EAAs.
5. Conclusions
Predictions indicate that the emerging electrified autonomous aircraft (EAA) will reduce air cargo transportation costs and potentially expedite the delivery of time-sensitive orders, prompting major shippers to invest in customizing technology and infrastructure. This research established a three-stage data mining and GIS workflow that identified four commodity categories and eight metropolitan statistical areas (MSAs) that could yield the highest initial demand for air transport, thereby optimizing logistics operations. The workflow and algorithms revealed that transport within the current range capability of 400 miles accounted for 80.5% of the truckload equivalents of the four selected commodity categories transported among the eight MSAs.
Shifting from trucks to EAA transportation holds potential for achieving the United Nations’ sustainable development goals. This shift can bring about benefits such as emission reduction and improved infrastructure longevity. It can also decrease risks in dangerous cargo transportation. Additionally, it could potentially offer faster delivery times for time-sensitive orders. Overall, this represents a significant mode shift in the logistics industry. This shift could lead to EAAs replacing trucks or air delivery or creating another option for delivery. The potential changes to the logistics industry associated with this mode shift warrant further investigation. Applying this data mining and GIS workflow to similar datasets can identify potential markets and optimize logistics operations, promoting affordable and sustainable transportation. Future studies will explore the influence of economic factors, truck automation, and other vehicle technologies on the transition towards EAAs over various adoption timeframes.
Funding
This research was funded by the United States’ Department of Transportation, grant name Mountain Plains Consortium.
Institutional Review Board Statement
Not applicable.
Informed Consent Statement
Not applicable.
Data Availability Statement
The data used in this study are publicly available per the references to their sources.
Conflicts of Interest
The authors declare no conflict of interest.
References
- NASA. Regional Air Mobility: Leveraging Our National Investments to Energize the American Travel Experience; United States National Air and Space Administration (NASA): Washington, DC, USA, 2021.
- TRB. Innovations in Freight Data Workshop; Transportation Research Board (TRB), Freight Data Technical Standing Committee: Washington, DC, USA, 2021. [Google Scholar]
- ATRI. Analysis of the Opertional Costs of Trucking: 2020 Update; American Transportation Research Institute (ATRI): Arlington, VA, USA, 2020. [Google Scholar]
- Nagy, A.M.; Simon, V. Improving traffic prediction using congestion propagation patterns in smart cities. Adv. Eng. Inform. 2021, 50, 101343. [Google Scholar] [CrossRef]
- FHWA. Driving Automation Systems in Long-Haul Trucking and Bus Transit: Preliminary Analysis of Potential Workforce Impacts; United States Department of Transportation (USDOT), Federal Highway Administration (FHWA): Washington, DC, USA, 2021.
- NASEM. Evaluation of Transport Airplane Risk Assessment Methodology; The National Academies Press: Washington, DC, USA, 2022. [Google Scholar]
- ACI. Air Cargo Guide; Airports Council International (ACI) North America: Montreal, QC, Canada, 2019. [Google Scholar]
- Laarmann, L.; Thoma, A.; Misch, P.; Röth, T.; Braun, C.; Watkins, S.; Fard, M. Automotive safety approach for future eVTOL vehicles. CEAS Aeronaut. J. 2023, 14, 369–379. [Google Scholar] [CrossRef]
- Boeing. World Air Cargo Forecast 2020–2039; Boeing Company: Tokyo, Japan, 2021. [Google Scholar]
- Kellermann, R.; Biehle, T.; Fischer, L. Drones for parcel and passenger transportation: A literature review. Transp. Res. Interdiscip. Perspect. 2020, 4, 100088. [Google Scholar] [CrossRef]
- Bridgelall, R. Reducing risks by transporting dangerous cargo in drones. Sustainability 2022, 14, 13044. [Google Scholar] [CrossRef]
- Constantine, D. The Future of the Drone Economy; Levitte Capital LLC: Boca Raton, FL, USA, 2020. [Google Scholar]
- Waters, M. Unpacked: Is middle-mile delivery a logistics frontier or retail buzzword? Modern Retail, 1 December 2020. Available online: https://www.modernretail.co/retailers/middle-mile-delivery-logistics-frontier-or-retail-buzzword/ (accessed on 25 April 2022).
- Amazon. How Amazon’s Middle Mile Team Helps Packages Make the Journey to Your Doorstep. 22 April 2021. Available online: https://www.amazon.science/latest-news/how-amazons-middle-mile-team-helps-packages-make-the-journey-to-your-doorstep (accessed on 25 April 2022).
- USDOT. National Freight Strategic Plan; United States Department of Transportation (USDOT): Washington, DC, USA, 2020.
- Frachtenberg, E. Practical Drone Delivery. Computer 2019, 52, 53–57. [Google Scholar] [CrossRef]
- Graf, L.; Anner, F. Autonomous Vehicles as the Ultimate Efficiency Driver in Logistics; Wurst, C., Graf, L., Eds.; Springer: Cham, Switzerland, 2021. [Google Scholar]
- Pak, H. Use-Cases for Heavy Lift Unmanned Cargo Aircraft. In Automated Low-Altitude Air Delivery; Research Topics in Aerospace; Dauer, J.C., Ed.; Springer: Cham, Switzerland, 2022. [Google Scholar]
- Rejeb, A.; Rejeb, K.; Simske, S.J.; Treiblmaier, H. Drones for supply chain management and logistics: A review and research agenda. Int. J. Logist. Res. Appl. 2021, 26, 708–731. [Google Scholar] [CrossRef]
- FedEx. FedEx Plans to Test Autonomous Drone Cargo Delivery with Elroy Air. 30 March 2022. Available online: https://www.businesswire.com/news/home/20220330005335/en/FedEx-Plans-to-Test-Autonomous-Drone-Cargo-Delivery-with-Elroy-Air (accessed on 25 April 2022).
- UPS. UPS Flight forward Adds Innovative New Aircraft, Enhancing Capabilities and Network Sustainability. 7 April 2021. Available online: https://about.ups.com/us/en/newsroom/press-releases/innovation-driven/ups-flight-forward-adds-new-aircraft.html (accessed on 25 April 2022).
- Maersk. A.P. Moller—Maersk Launches Maersk Air Cargo in Response to Customers’ Global Air Cargo Needs. 8 April 2022. Available online: https://www.maersk.com/news/articles/2022/04/08/maersk-launches-air-cargo-to-strengthen-the-company-global-air-cargo-offerings (accessed on 23 April 2022).
- LeMay, S.; Keller, S.B. Fifty years inside the minds of truck drivers. Int. J. Phys. Distrib. Logist. Manag. 2019, 49, 626–643. [Google Scholar] [CrossRef]
- Engholm, A.; Kristoffersson, I.; Pernestal, A. Impacts of large-scale driverless truck adoption on the freight transport system. Transp. Res. Part A Policy Pract. 2021, 154, 227–254. [Google Scholar] [CrossRef]
- Battaglia, G.; Musolino, G.; Vitetta, A. Freight Demand Distribution in a Suburban Area: Calibration of an Acquisition Model with Floating Car Data. J. Adv. Transp. 2022, 2022, 1535090. [Google Scholar] [CrossRef]
- Schwab, A.; Thomas, A.; Bennett, J.; Robertson, E.; Cary, S. Electrification of Aircraft: Challenges, Barriers, and Potential Impacts; National Renewable Energy Laboratory (NREL): Golden, CO, USA, 2021. [Google Scholar]
- Ni, D.; Yu, G.; Rathinam, S. Unmanned Aircraft System and Its Applications in Transportation. J. Adv. Transp. 2017, 2017, 7156153. [Google Scholar] [CrossRef]
- Sun, X.; Wandelt, S.; Husemann, M.; Stumpf, E. Operational Considerations regarding On-Demand Air Mobility: A Literature Review and Research Challenges. J. Adv. Transp. 2021, 2021, 3591034. [Google Scholar] [CrossRef]
- Ozkan, O.; Atli, O. Transporting COVID-19 testing specimens by routing unmanned aerial vehicles with range and payload constraints: The case of Istanbul. Transp. Lett. 2021, 13, 482–491. [Google Scholar] [CrossRef]
- Wang, X.; Liu, Z.; Li, X. Optimal delivery route planning for a fleet of heterogeneous drones: A rescheduling-based genetic algorithm approach. Comput. Ind. Eng. 2023, 179, 109179. [Google Scholar] [CrossRef]
- Huang, K.; Kockelman, K.; Gurumurthy, K.M. Innovations impacting the future of transportation: An overview of connected, automated, shared, and electric technologies. Transp. Lett. 2022, 15, 490–509. [Google Scholar] [CrossRef]
- Raj, A.; Sah, B. Analyzing critical success factors for implementation of drones in the logistics sector using grey-DEMATEL based approach. Comput. Ind. Eng. 2019, 138, 106118. [Google Scholar] [CrossRef]
- Kwon, H.; Kim, J.; Park, Y. Applying LSA text mining technique in envisioning social impacts of emerging technologies: The case of drone technology. Technovation 2017, 60–61, 15–28. [Google Scholar] [CrossRef]
- Goodchild, A.; Toy, J. Delivery by drone: An evaluation of unmanned aerial vehicle technology in reducing CO2 emissions in the delivery service industry. Transp. Res. Part D Transp. Environ. 2018, 61, 58–67. [Google Scholar] [CrossRef]
- Reiche, C.; Cohen, A.P.; Fernando, C. An Initial Assessment of the Potential Weather Barriers of Urban Air Mobility. IEEE Trans. Intell. Transp. Syst. 2021, 22, 6018–6027. [Google Scholar] [CrossRef]
- Bauranov, A.; Rakas, J. Designing airspace for urban air mobility: A review of concepts and approaches. Prog. Aerosp. Sci. 2021, 125, 100726. [Google Scholar] [CrossRef]
- Cohen, A.P.; Shaheen, S.A.; Farrar, E.M. Urban Air Mobility: History, Ecosystem, Market Potential, and Challenges. IEEE Trans. Intell. Transp. Syst. 2021, 22, 6074–6087. [Google Scholar] [CrossRef]
- Garrow, L.A.; German, B.J.; Leonard, C.E. Urban air mobility: A comprehensive review and comparative analysis with autonomous and electric ground transportation for informing future research. Transp. Res. Part C-Emerg. Technol. 2021, 132, 103377. [Google Scholar] [CrossRef]
- Lineberger, R.; Silver, D.; Hussain, A. Advanced Air Mobility: Can the United States Afford to Lose the Race? AIA: Arlington, VA, USA, 2021. [Google Scholar]
- Morgan Stanley. Flying Cars: Investment Implications of Autonomous Urban Air Mobility; Morgan Stanley Research: New York, NY, USA, 2018. [Google Scholar]
- Aydin, B. Public acceptance of drones: Knowledge, attitudes, and practice. Technol. Soc. 2019, 59, 101180. [Google Scholar] [CrossRef]
- Park, J.; Kim, S.; Suh, K. A comparative analysis of the environmental benefits of drone-based delivery services in urban and rural areas. Sustainability 2018, 10, 888. [Google Scholar] [CrossRef]
- Cohen, A.; Shaheen, S. Urban Air Mobility: Opportunities and Obstacles. In International Encyclopedia of Transportation; UC Berkeley: Transportation Sustainability Research Center: Berkeley, CA, USA, 2021; pp. 702–709. [Google Scholar]
- Ahmed, U.; Lin, J.C.-W.; Srivastava, G. 5G-Empowered Drone Networks in Federated and Deep Reinforcement Learning Environments. IEEE Commun. Stand. Mag. 2021, 5, 55–61. [Google Scholar] [CrossRef]
- Piancastelli, L.; Sali, M.; Leon-Cardenas, C. Basic considerations and conceptual design of a VSTOL vehicle for urban transportation. Drones 2022, 6, 102. [Google Scholar] [CrossRef]
- NAS. Assessing the Risks of Integrating Unmanned Aircraft Systems into the National Airspace System; National Academies Press: Washington, DC, USA, 2018. [Google Scholar]
- Hughes, M.M.; Zhou, Z.; Zinn, W.; Knemeyer, A.M. Plastic response to disruptions: Significant redesign of supply chains. J. Bus. Logist. 2023, 44, 80–108. [Google Scholar] [CrossRef]
- Zinn, W.; Goldsby, T.J. Supply chain plasticity: Redesigning supply chains to meet major environmental change. J. Bus. Logist. 2019, 40, 184–186. [Google Scholar] [CrossRef]
- FHWA. Freight Analysis Framework Version 5 (FAF5). 22 November 2021. Available online: https://faf.ornl.gov/faf5/Default.aspx (accessed on 13 February 2022).
- Aggarwal, C.C. Data Mining; Springer International Publishing: New York, NY, USA, 2015; p. 734. [Google Scholar]
- Burkov, A. The Hundred-Page Machine Learning Book, 1st ed.; Andriy Burkov: Quebec City, QC, Canada, 2019. [Google Scholar]
- USCB. TIGER/Line Geodatabases. United States Census Bureau (USCB), 16 December 2021. Available online: https://www2.census.gov/geo/tiger/TIGER2021/COUNTY/ (accessed on 22 April 2022).
- USCB. Commodity Flow Survey Geographies. United States Census Bureau (USCB), 8 October 2021. Available online: https://www.census.gov/programs-surveys/cfs/technical-documentation/geographies.html (accessed on 28 April 2022).
- BTS and USCB. 2017 Commodity Flow Survey Standard Classification of Transported Goods (SCTG); Bureau of Transportation Statistics and U.S. Census Bureau: Washington, DC, USA, 2015.
- FreightWaves. How Much Weight Can a Big Rig Carry? FreightWaves: Chattanooga, TN, USA, 2020. [Google Scholar]
- IATA. The Value of Air Cargo: Air Cargo Makes It Happen; International Air Transport Association (IATA): Geneva, Switzerland, 2022. [Google Scholar]
Disclaimer/Publisher’s Note: The statements, opinions and data contained in all publications are solely those of the individual author(s) and contributor(s) and not of MDPI and/or the editor(s). MDPI and/or the editor(s) disclaim responsibility for any injury to people or property resulting from any ideas, methods, instructions or products referred to in the content. |
© 2023 by the author. Licensee MDPI, Basel, Switzerland. This article is an open access article distributed under the terms and conditions of the Creative Commons Attribution (CC BY) license (https://creativecommons.org/licenses/by/4.0/).