

Predicting Road Traffic Accidents—Artificial Neural Network Approach

 , ,
, ,  and
and
Abstract
1. Introduction
Literature Review
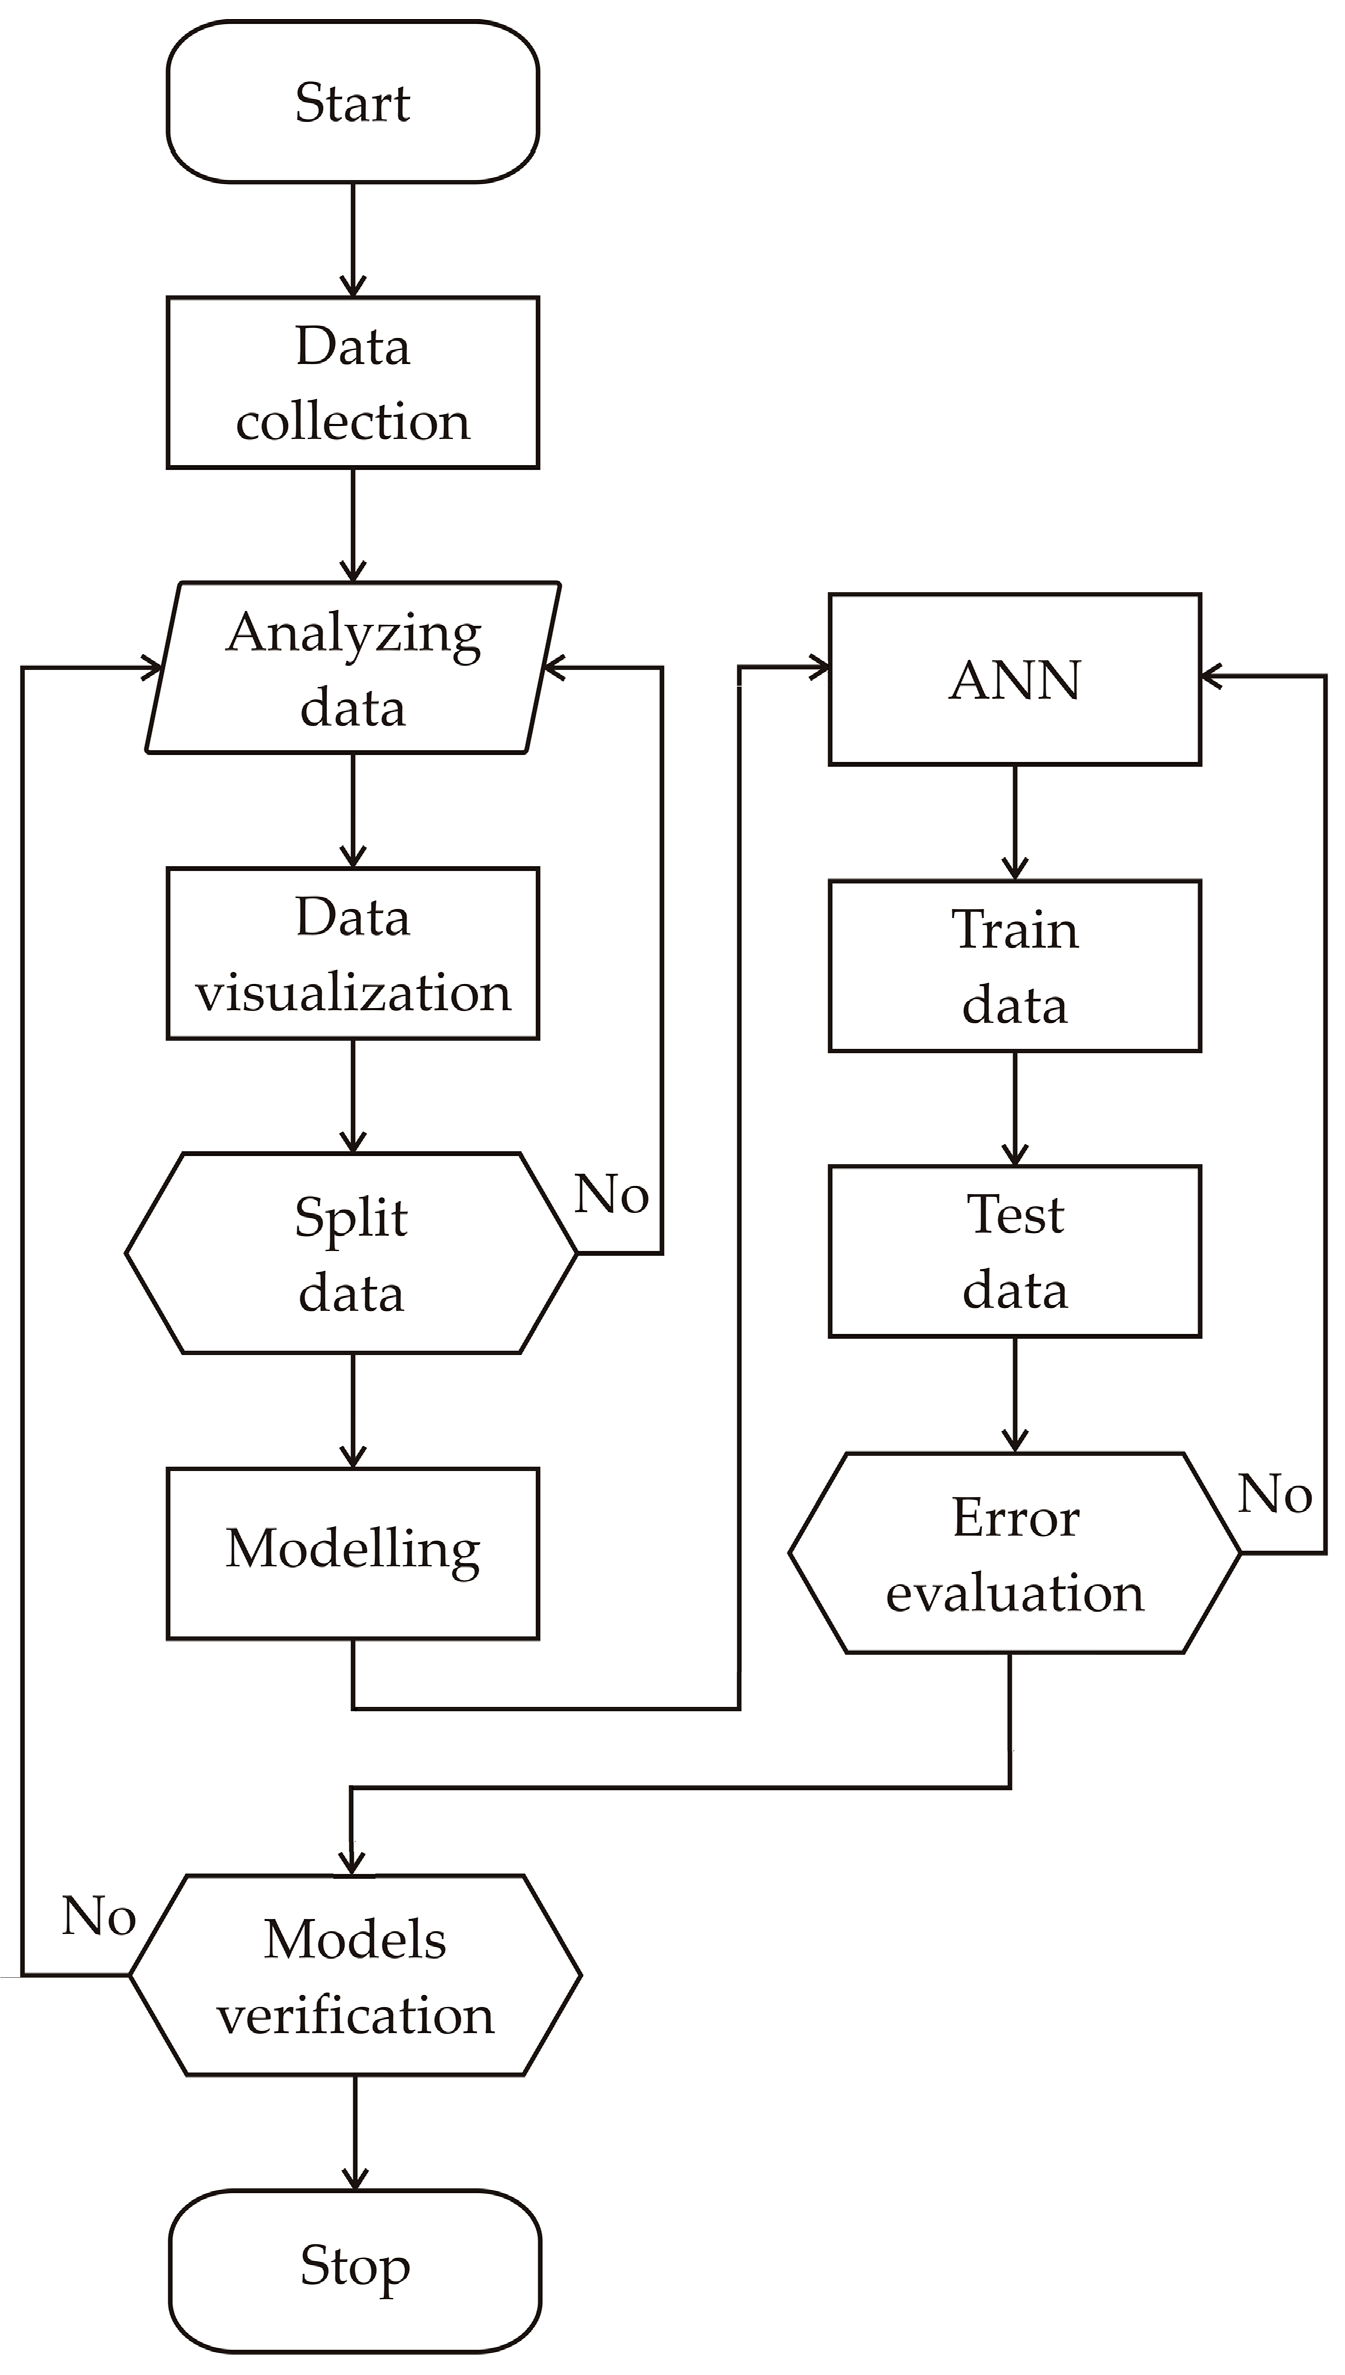
2. Methodology
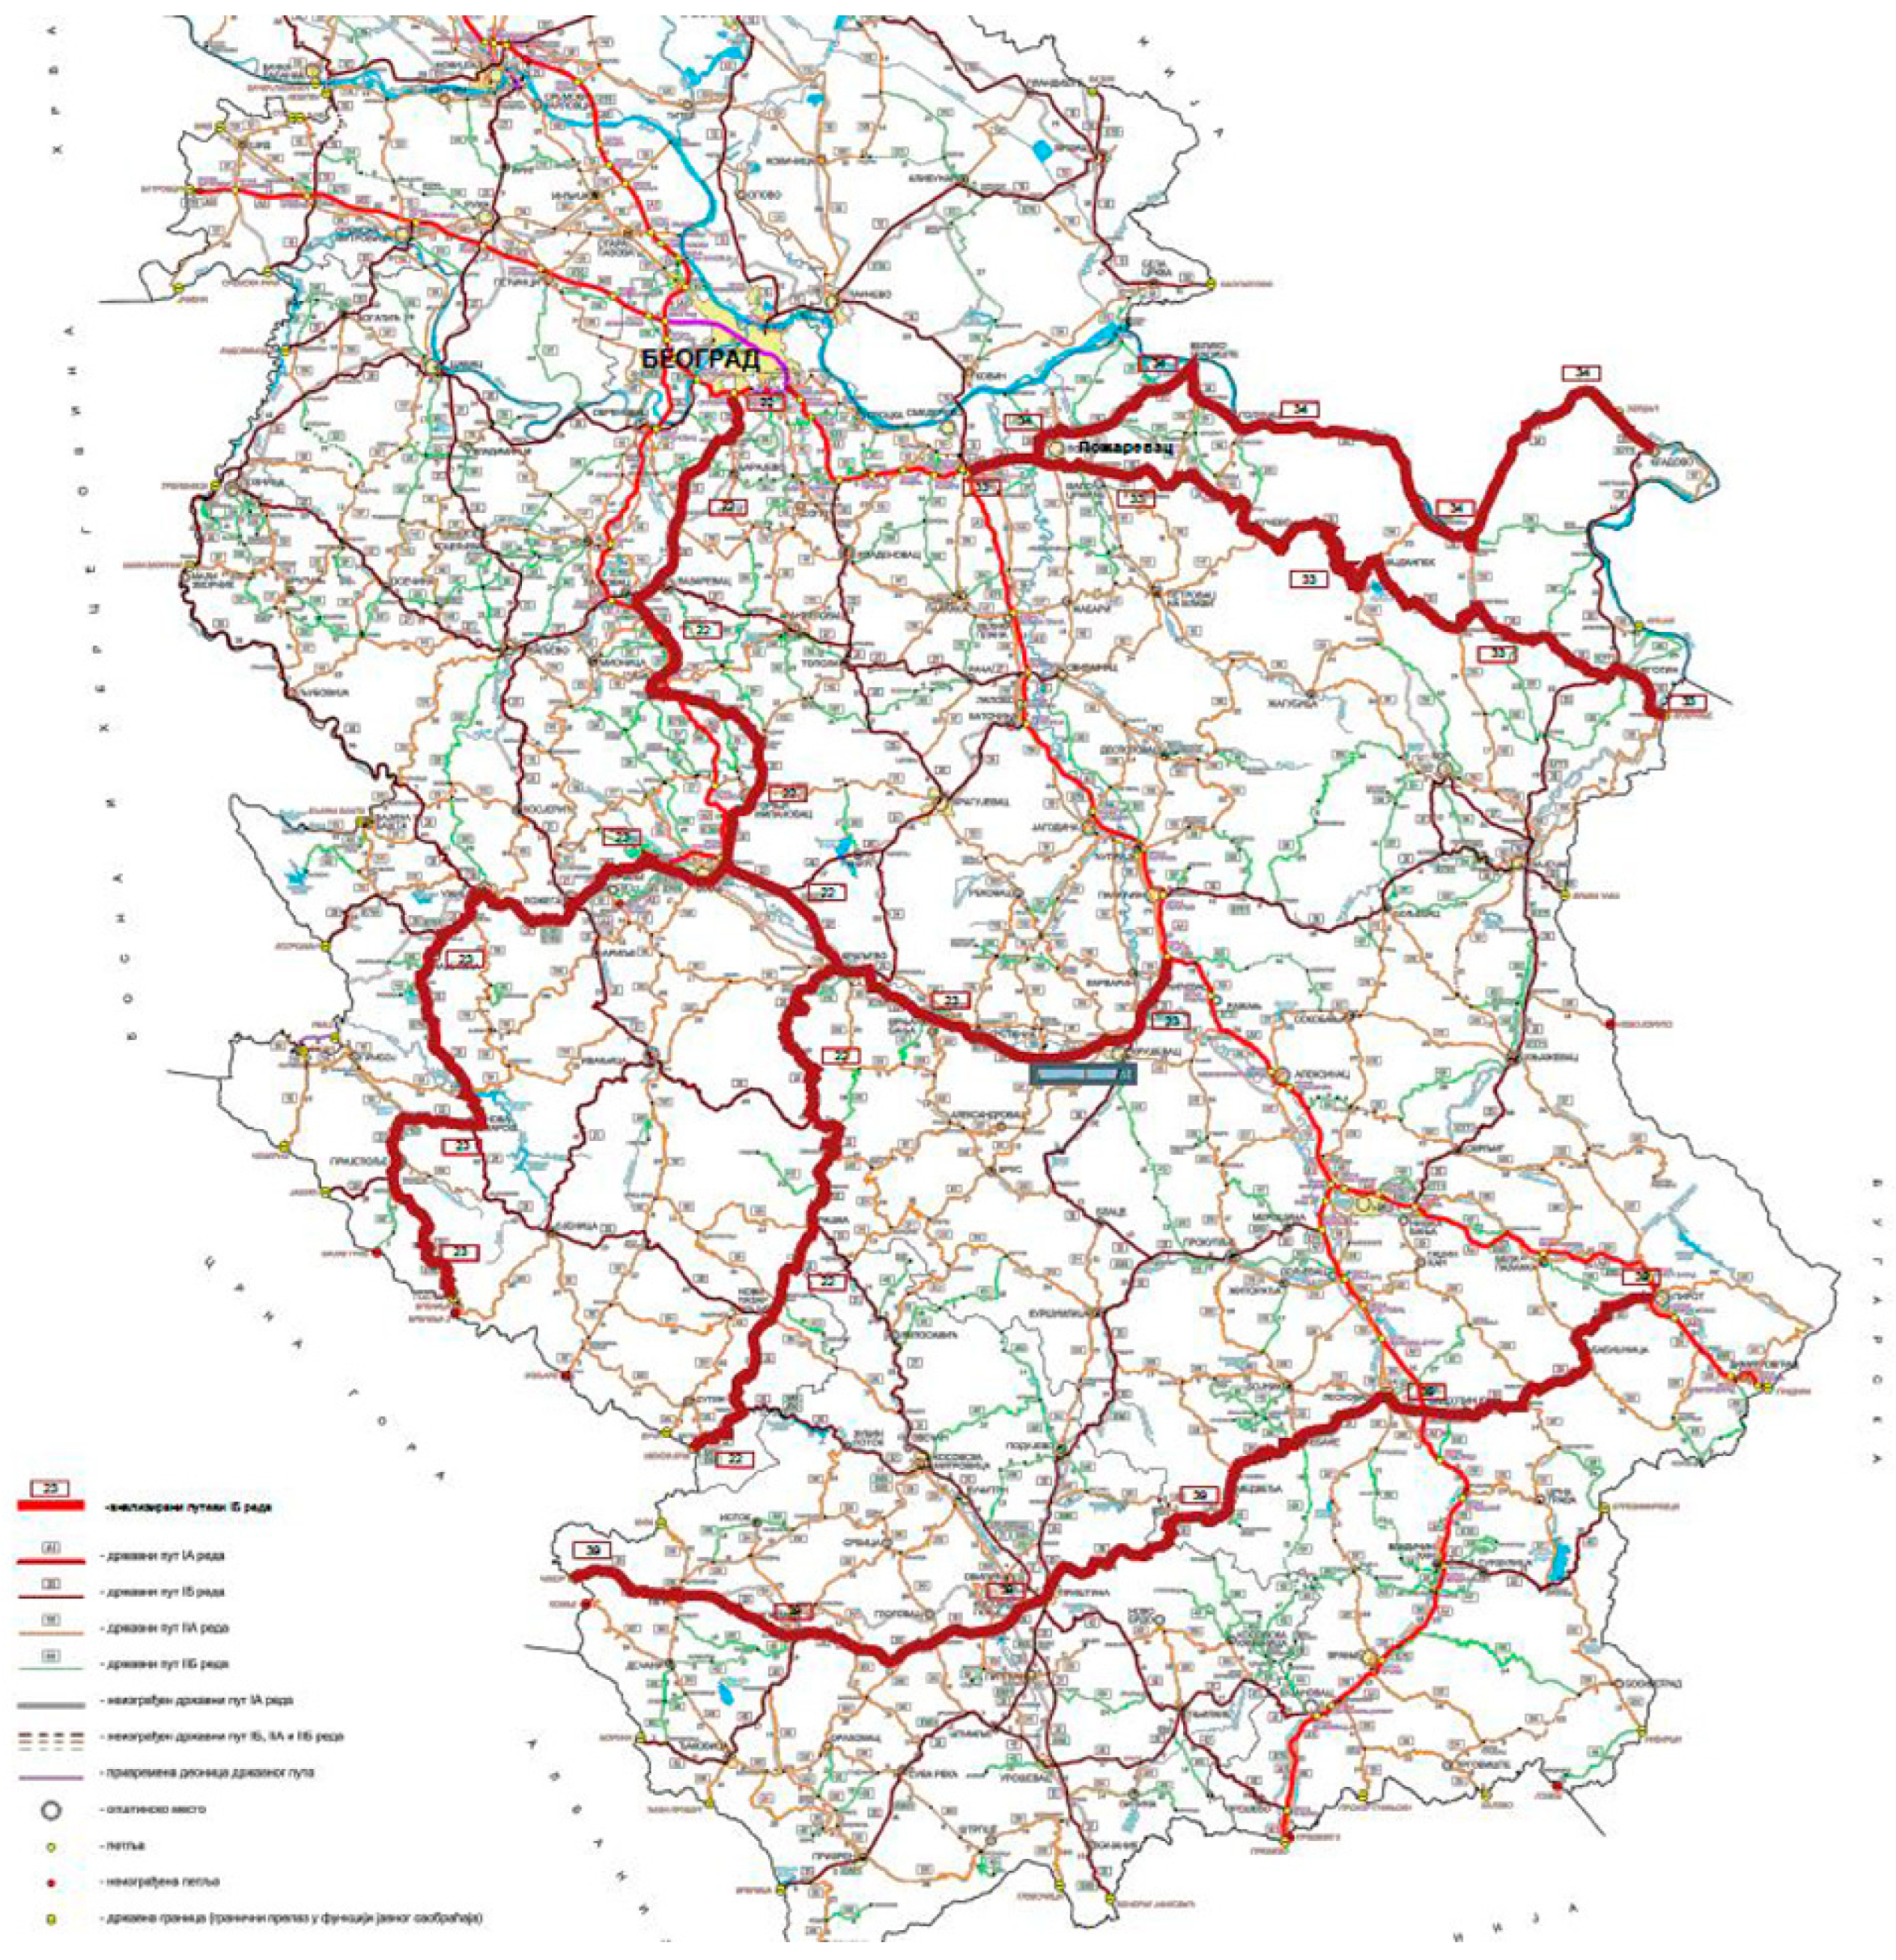
- Section Length (km)-SL,
- Annual average daily traffic volume -AADT (veh/day),
- Terrain type-TT (type 1-level, type 2-rolling, type 3-mountainous),
- Curvature (curve 1-minimal, curve 2-severe, curve 3-serpentine),
- Lane width (5–6 m, >6 m),
- Speed limit-SPL (100–130 km/h, 130 km/h for freeways).
2.1. Statistical Analysis
2.1.1. ANN Modeling
2.1.2. Global Sensitivity Analysis
2.1.3. The Accuracy of the Model
3. Results and Discussion
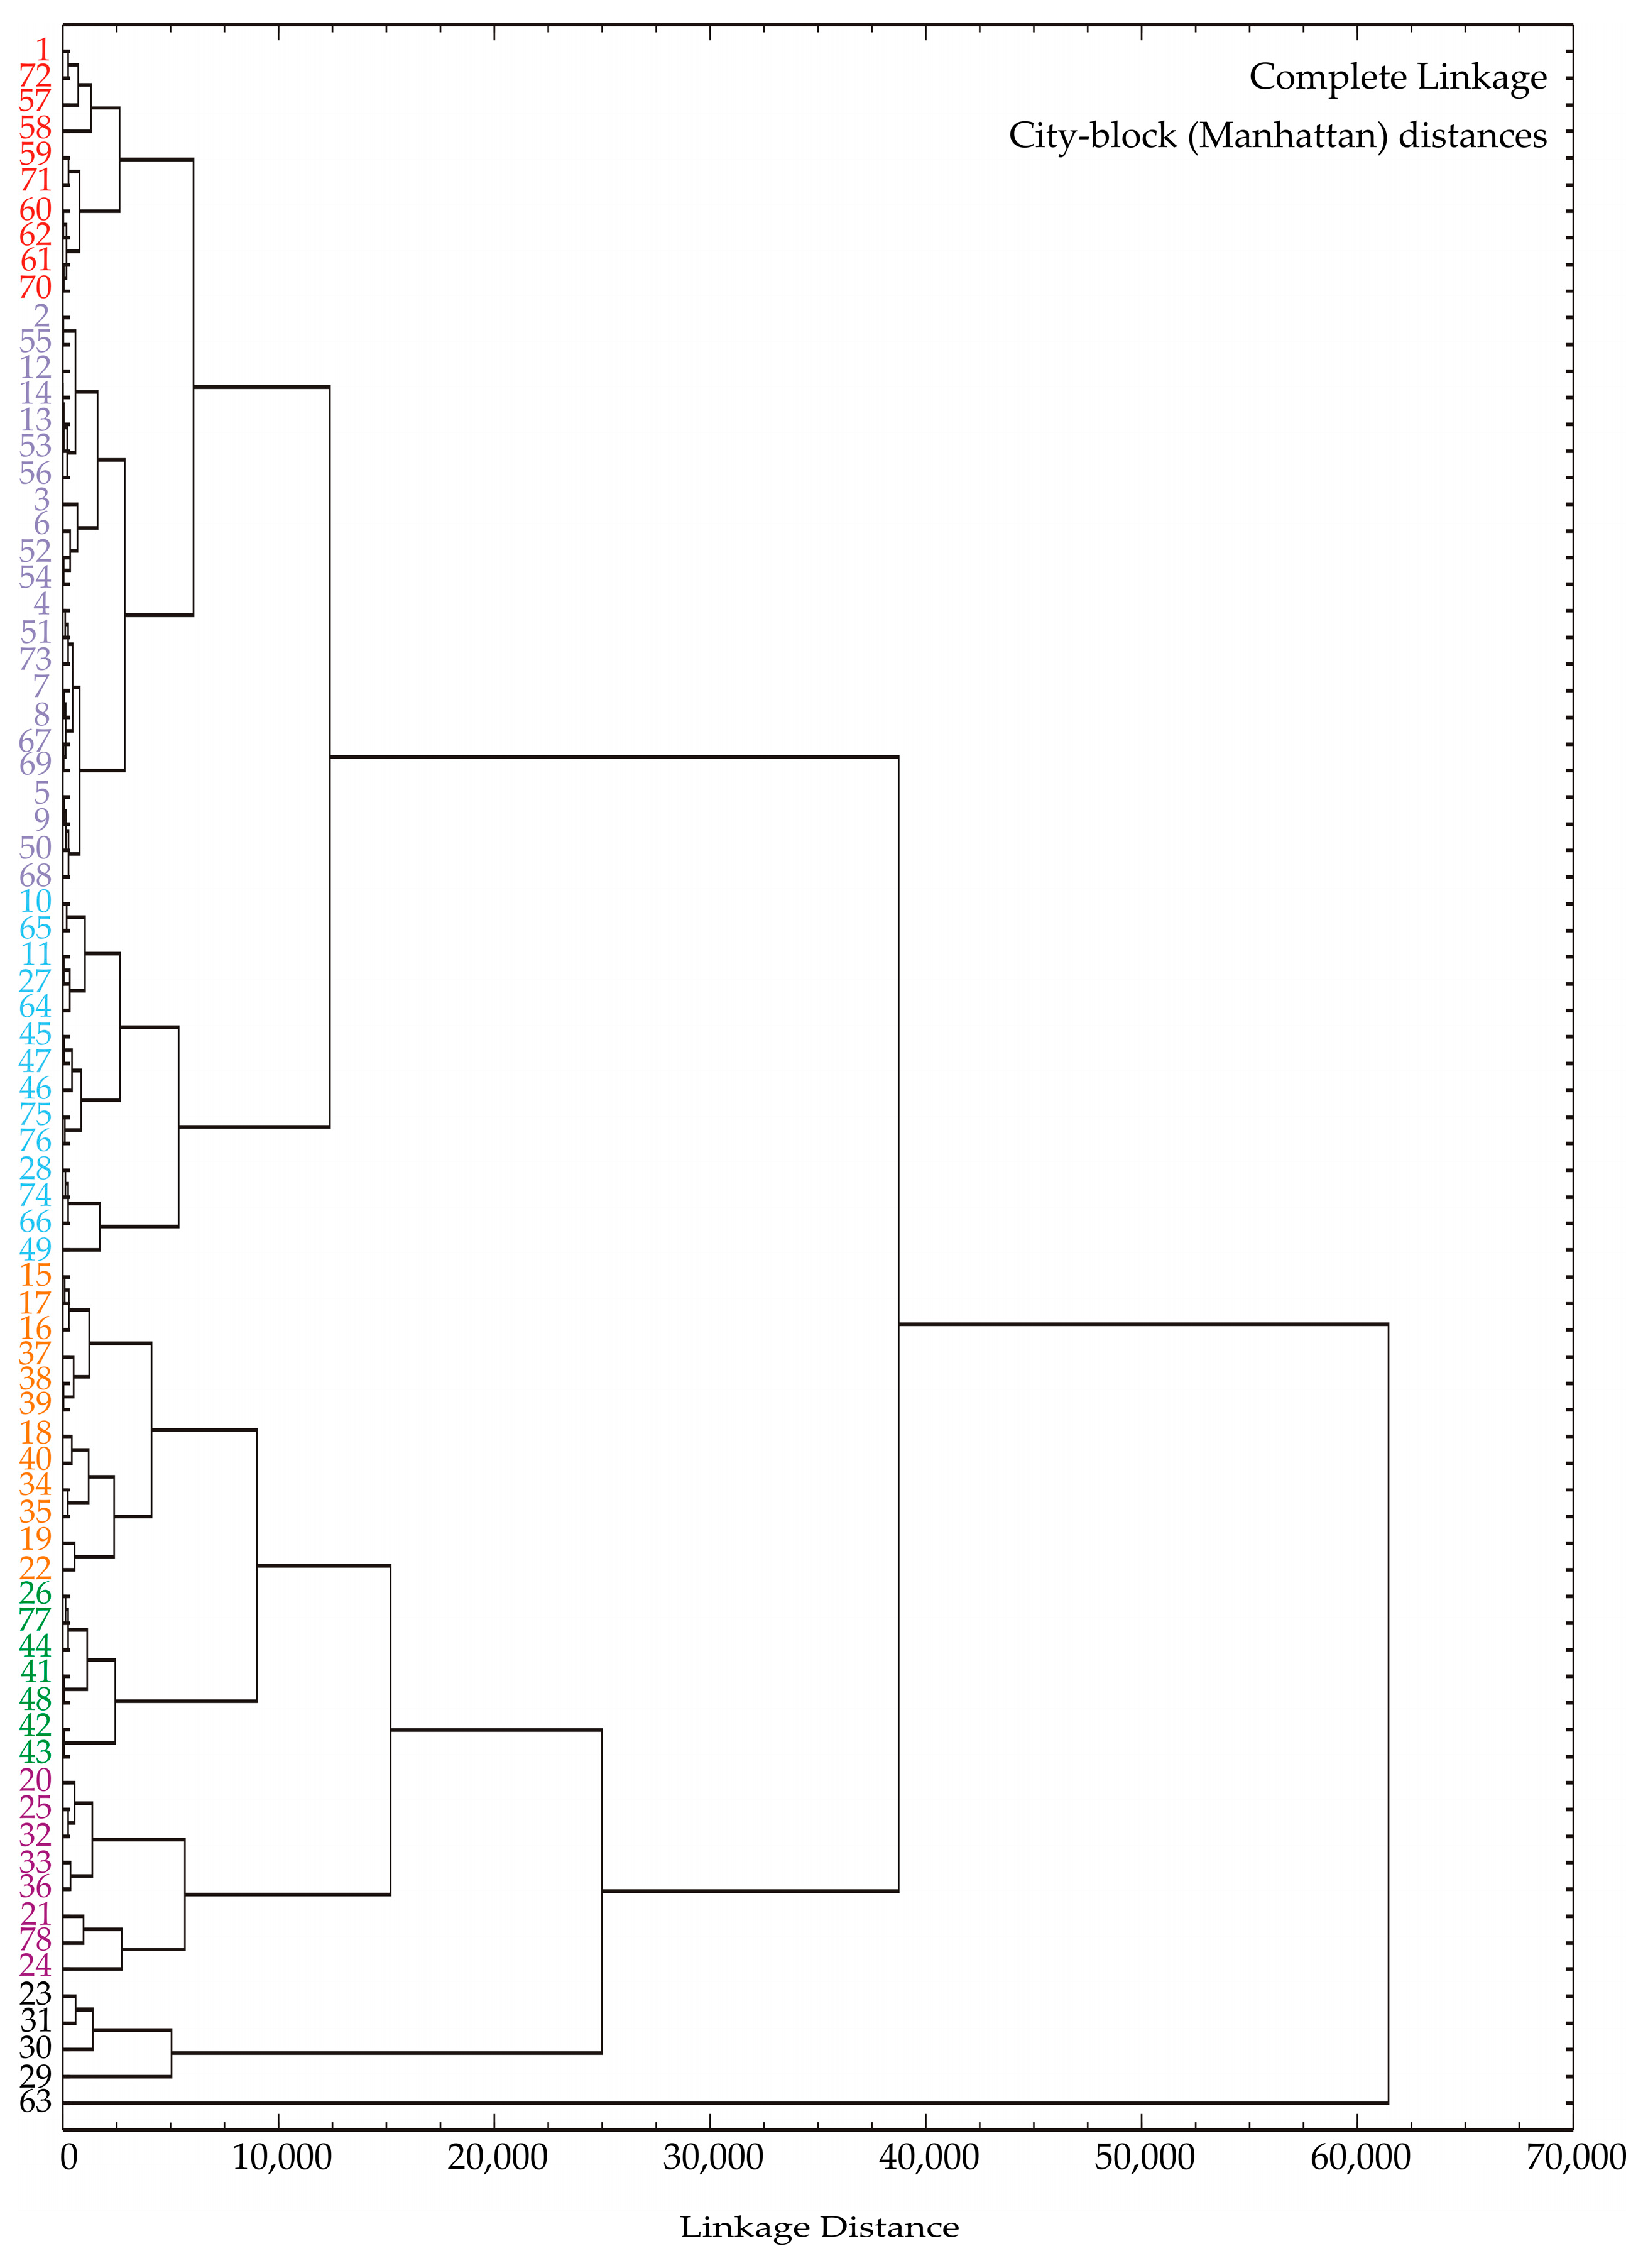
3.1. Cluster Analysis
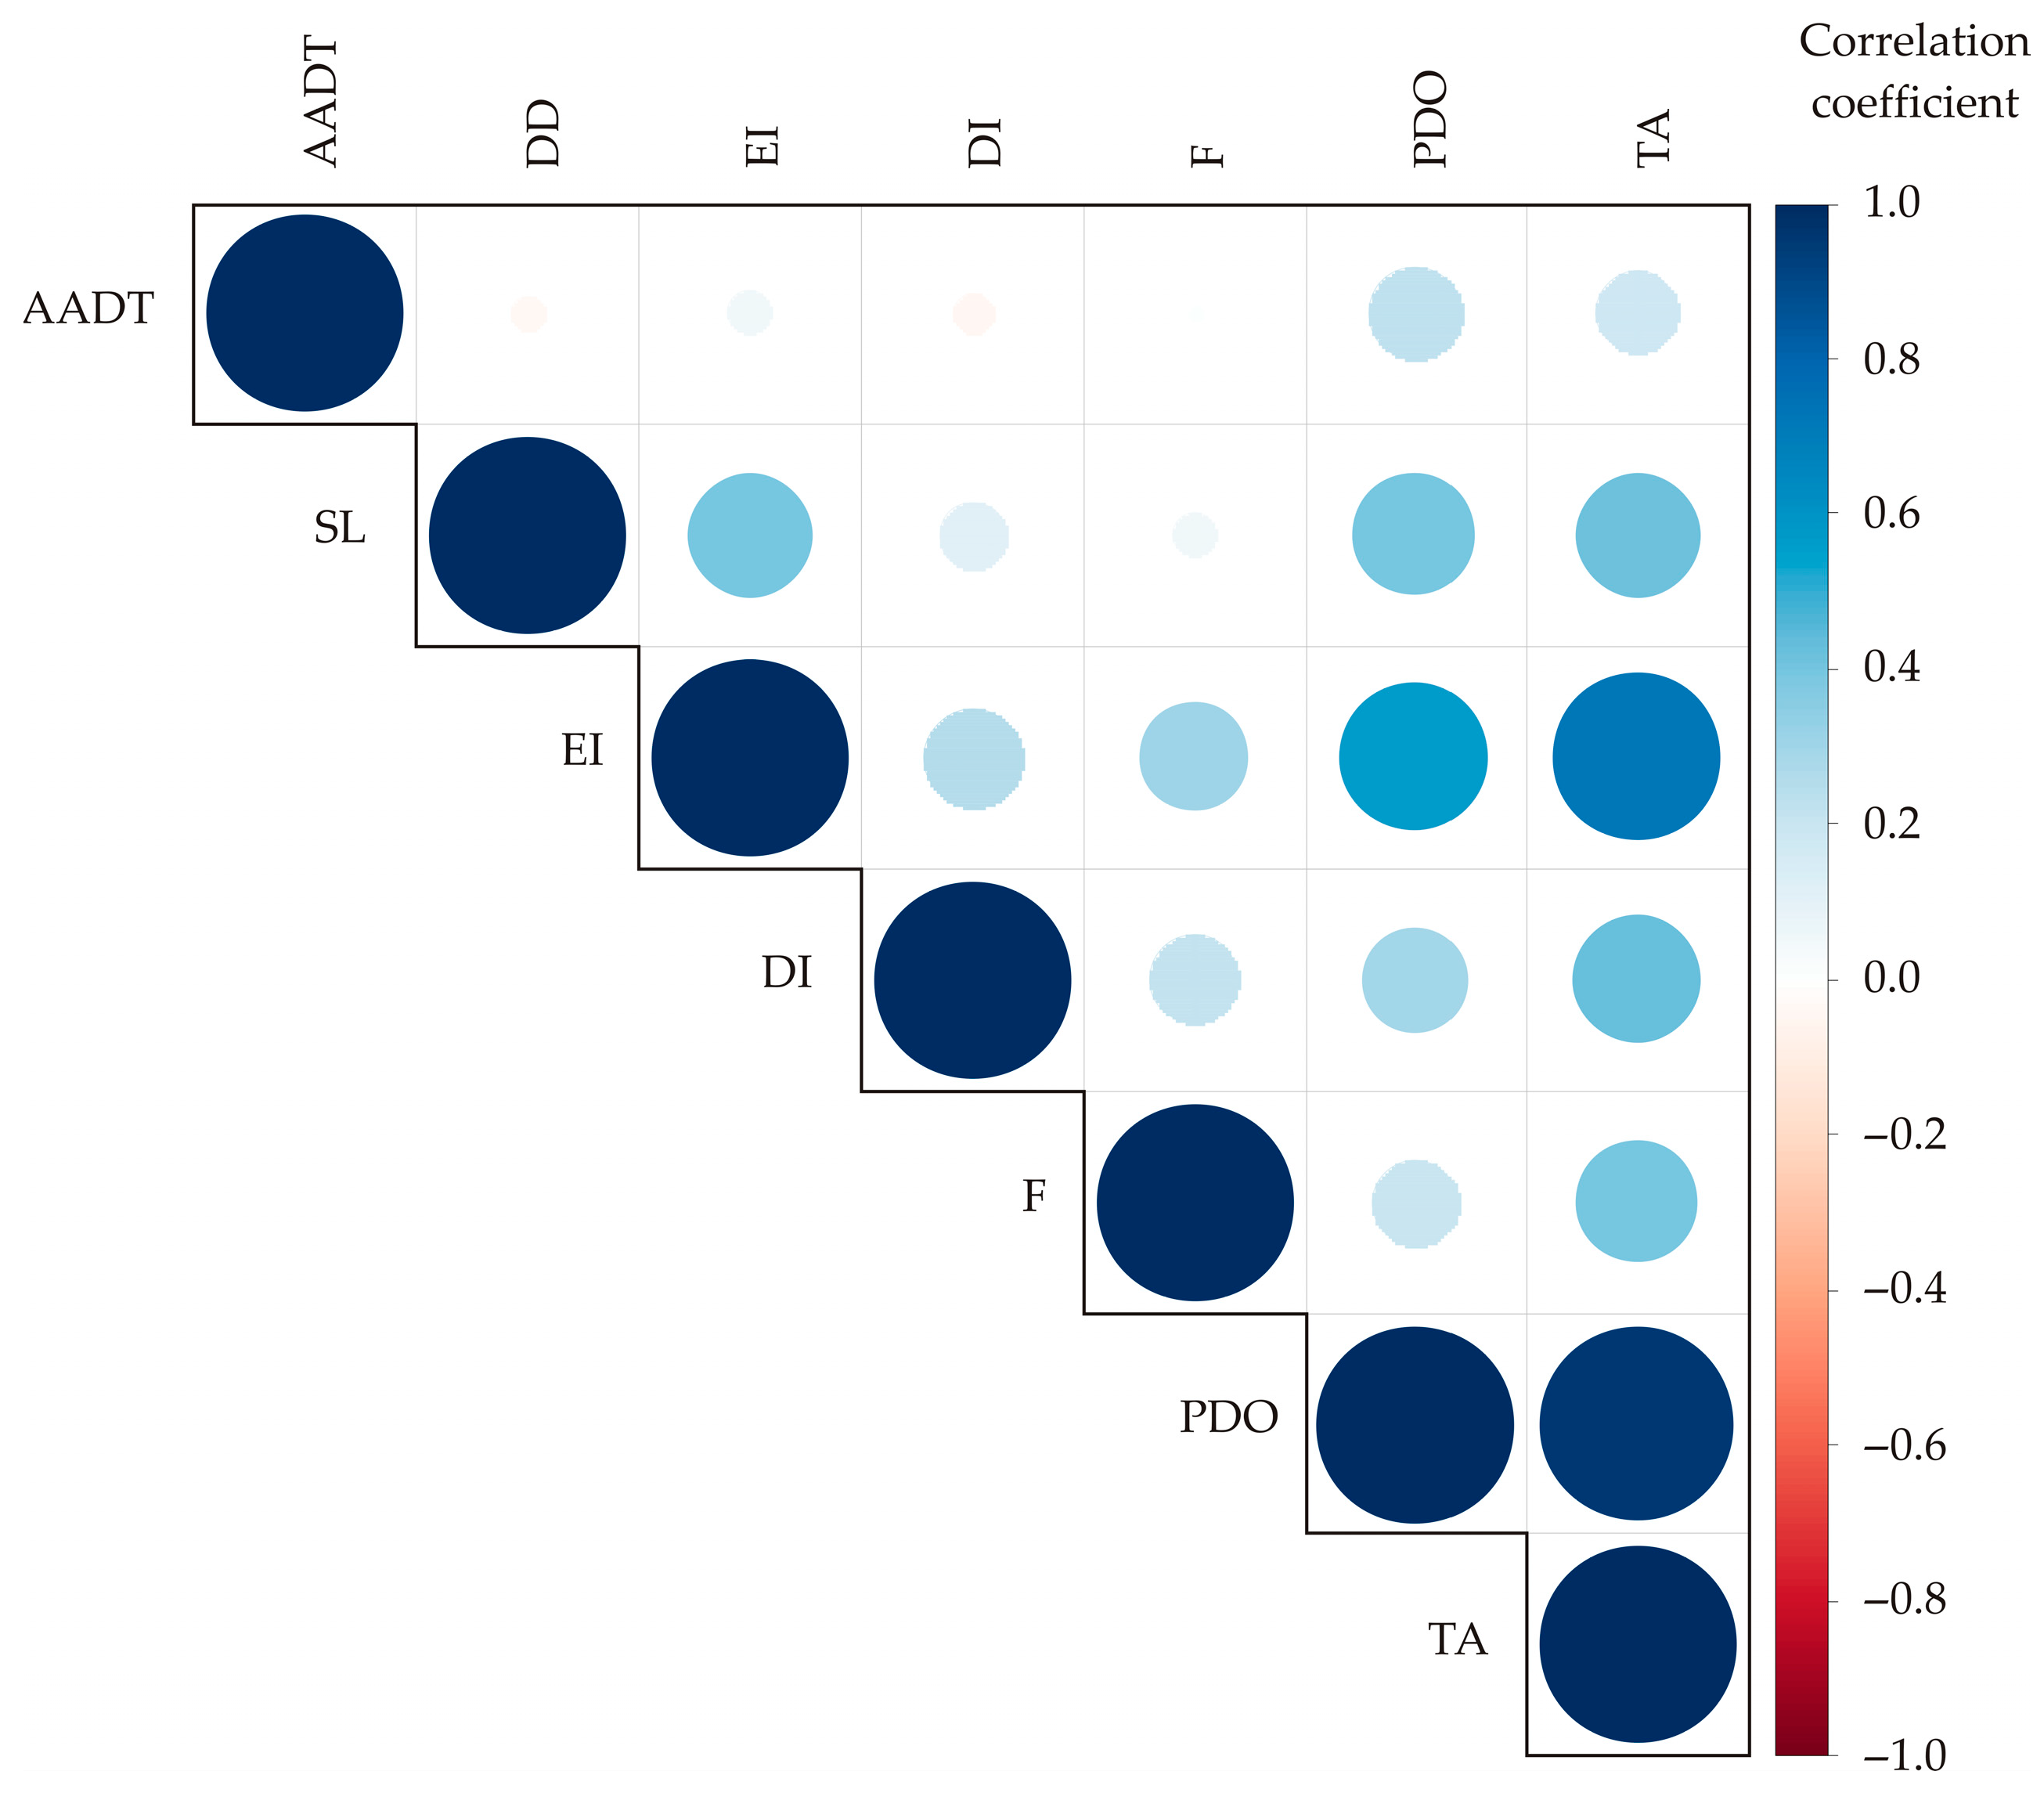
3.2. Color Correlation Analysis
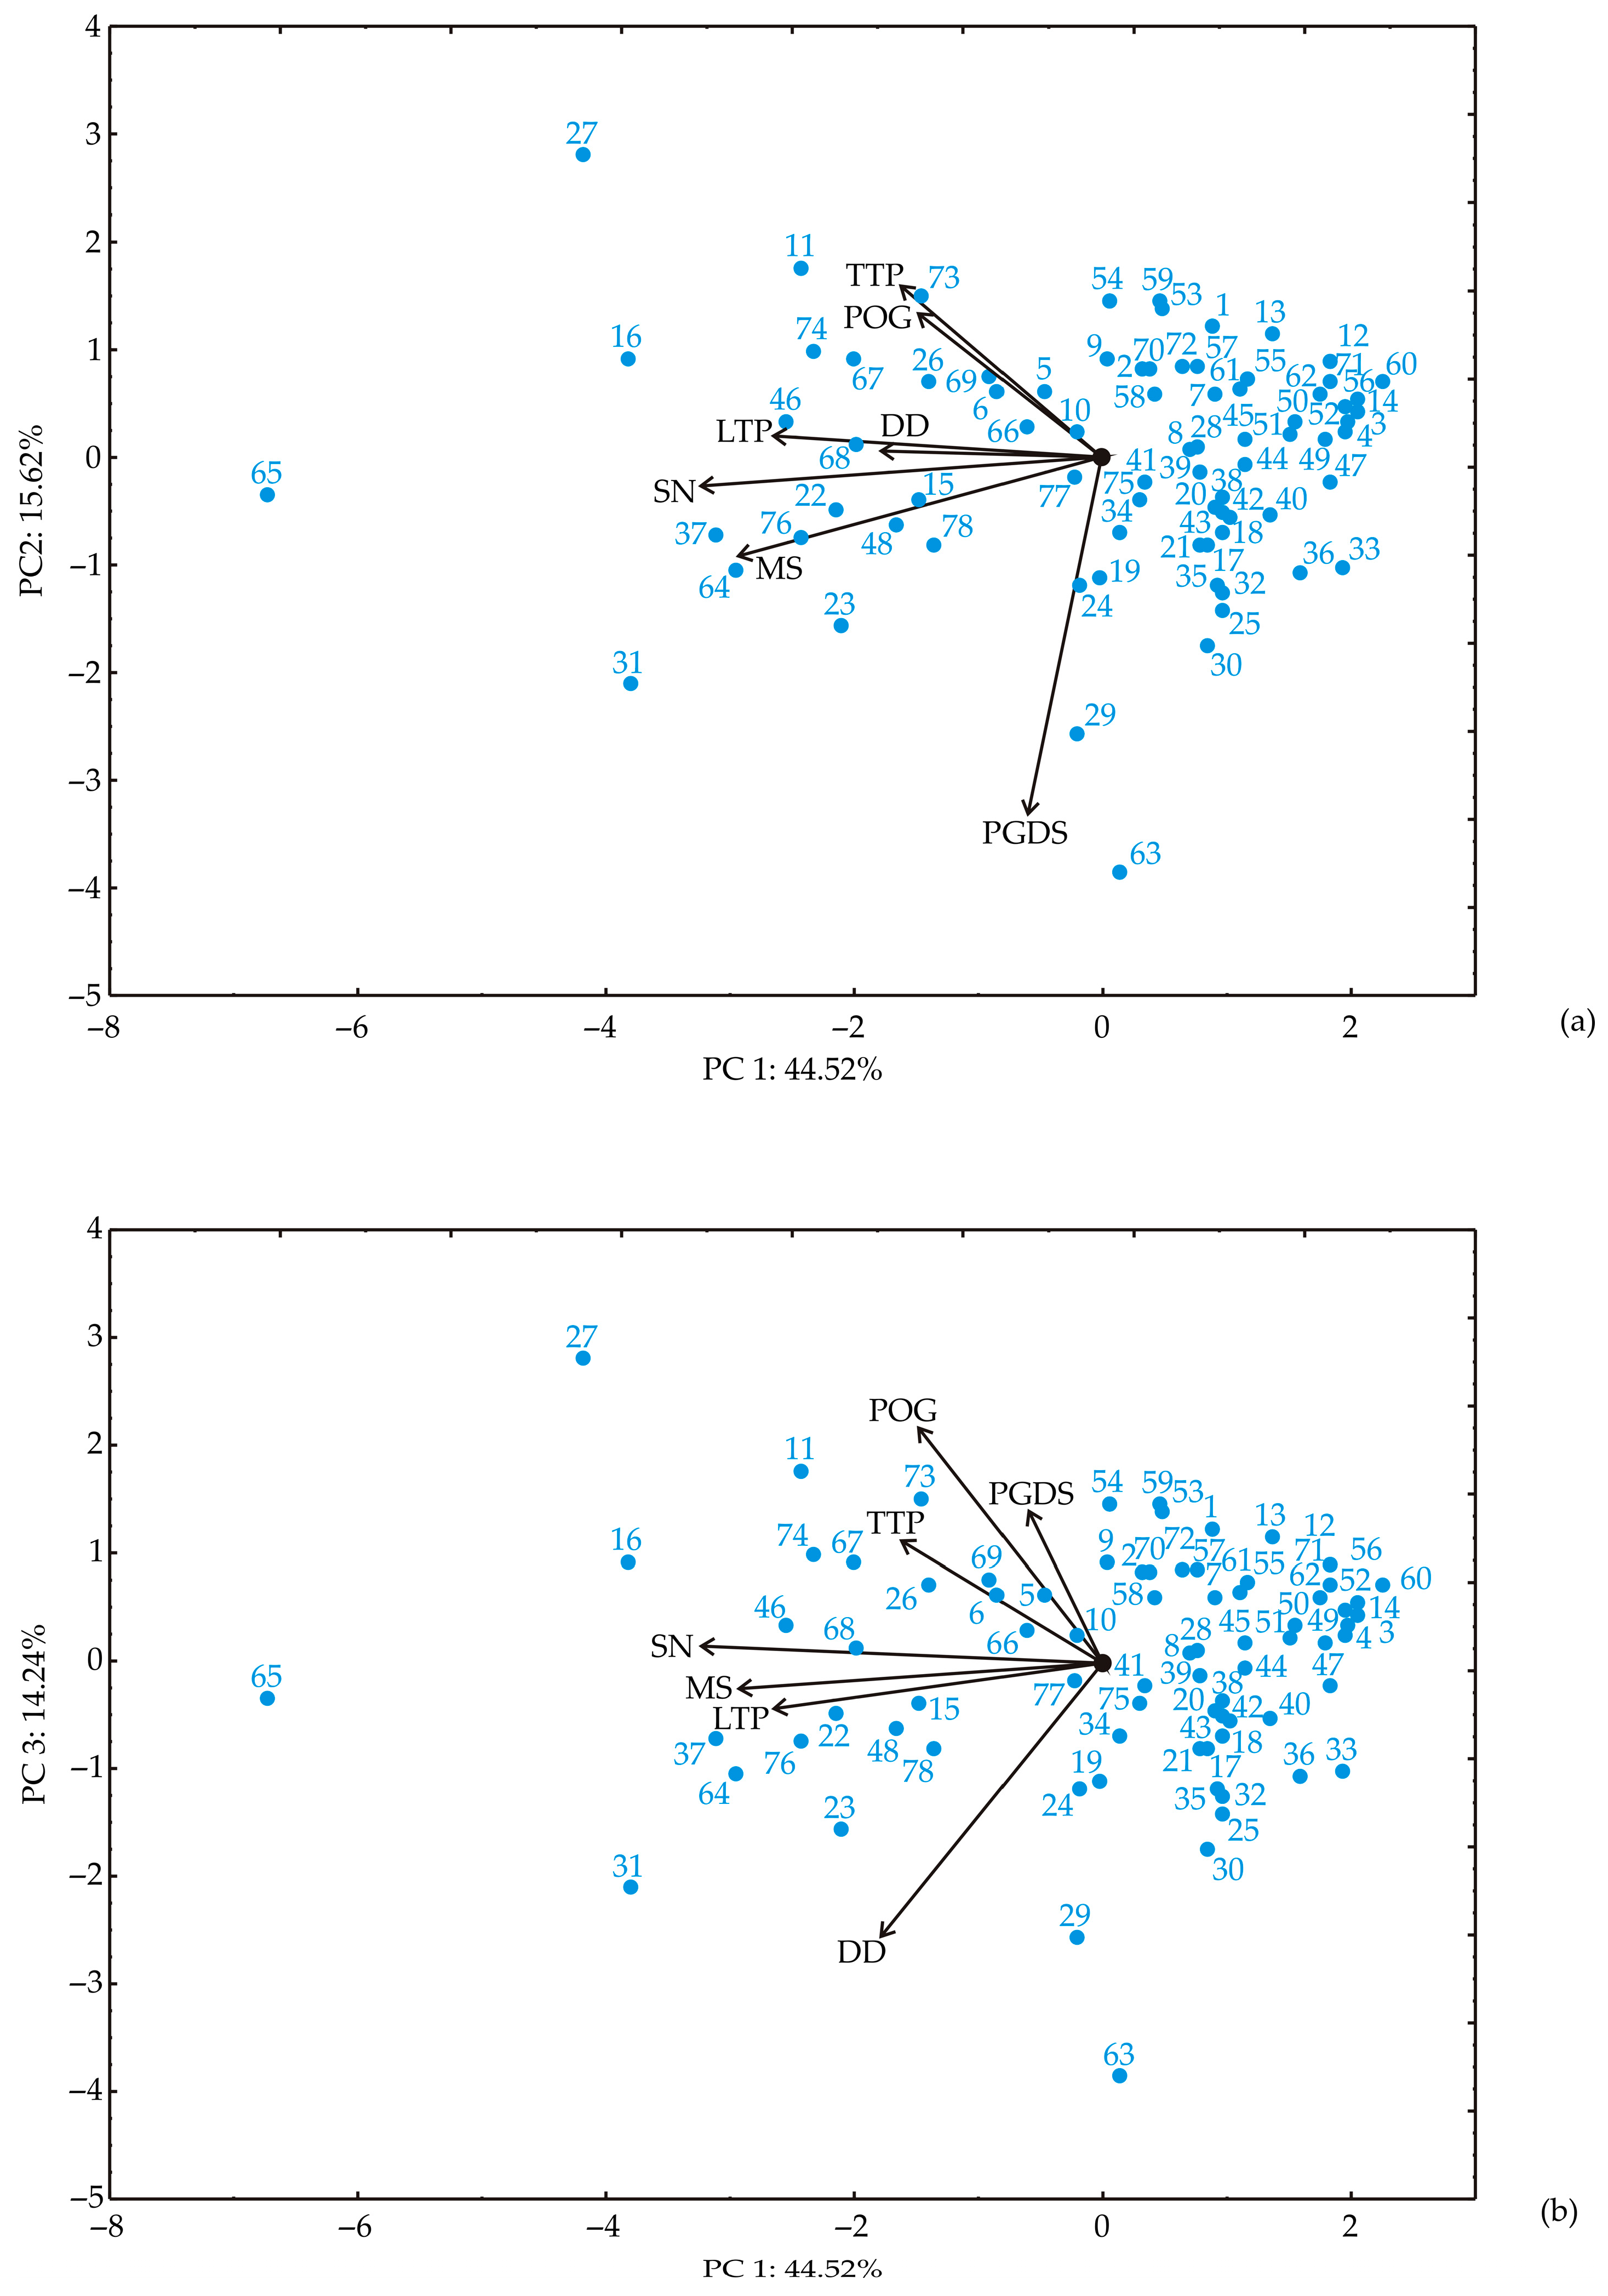
3.3. Principal Component Analysis
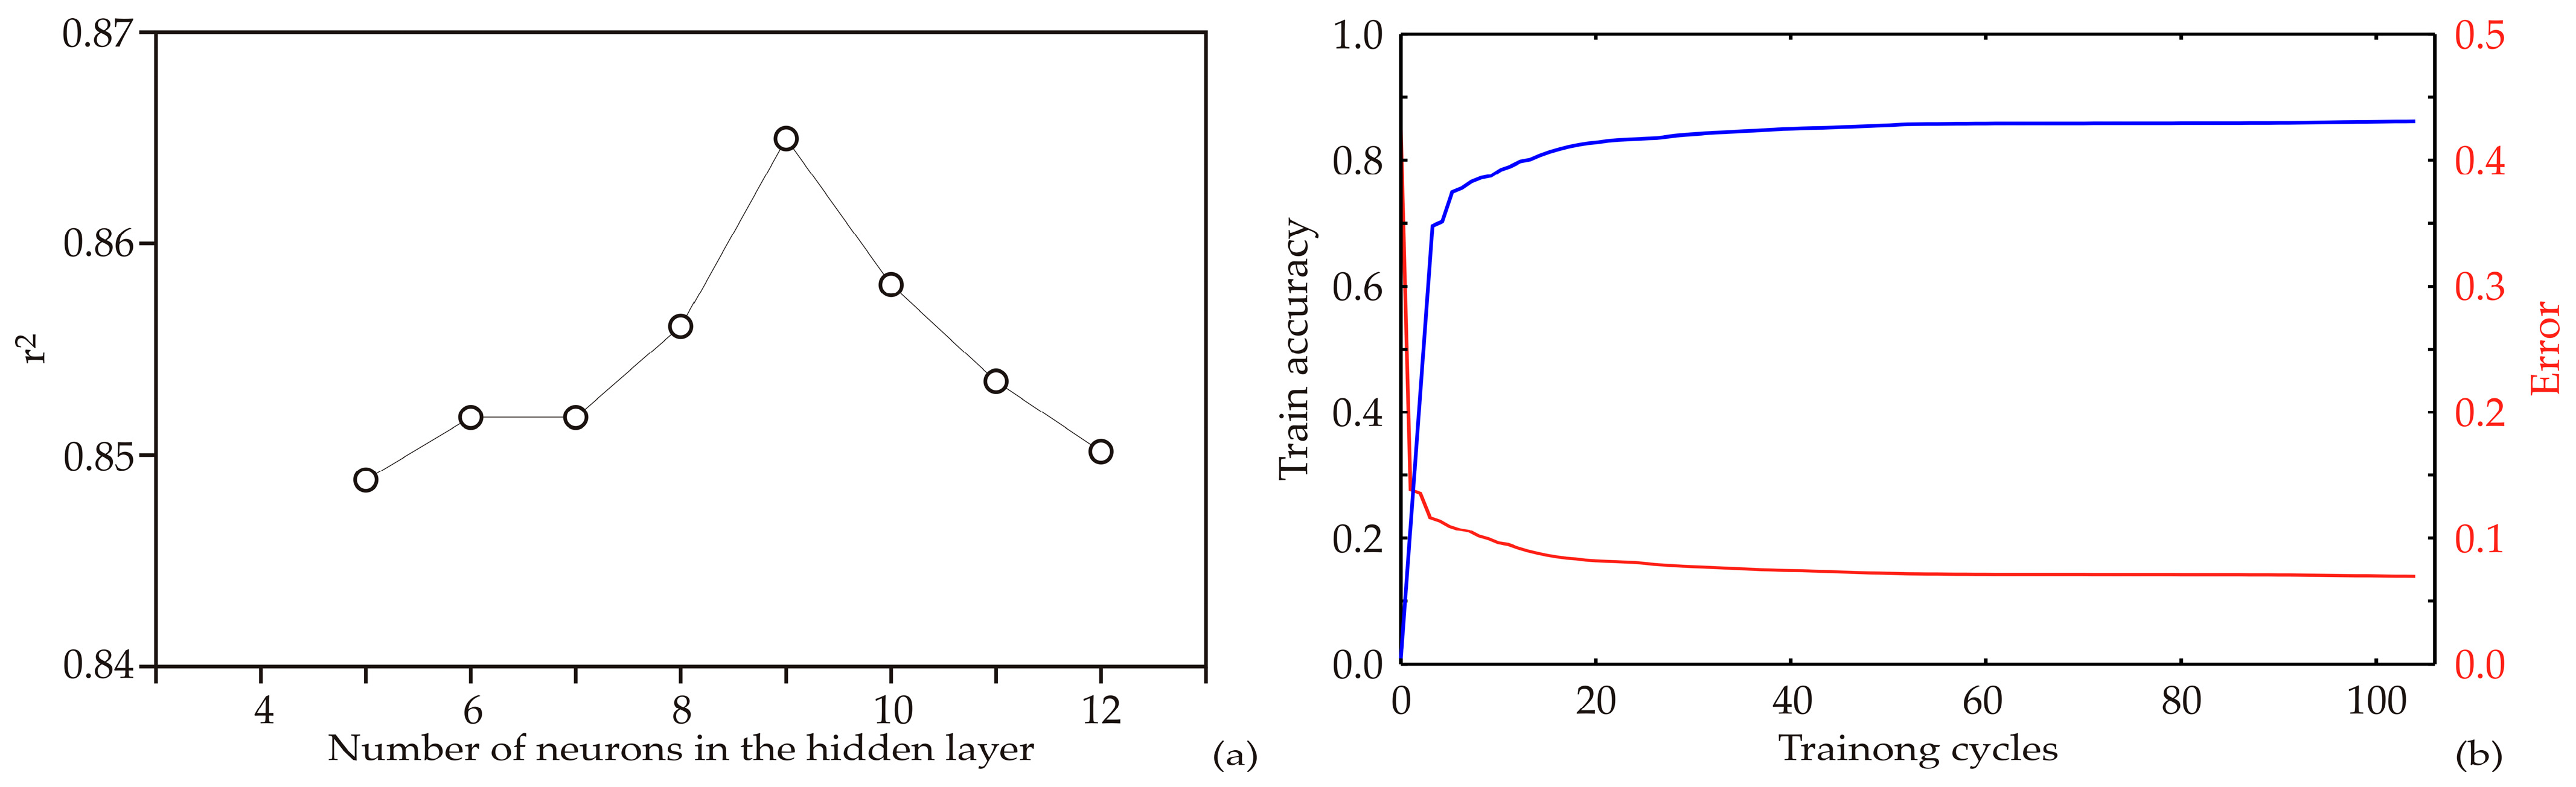
3.4. ANN Models
3.5. The Accuracy of the Model
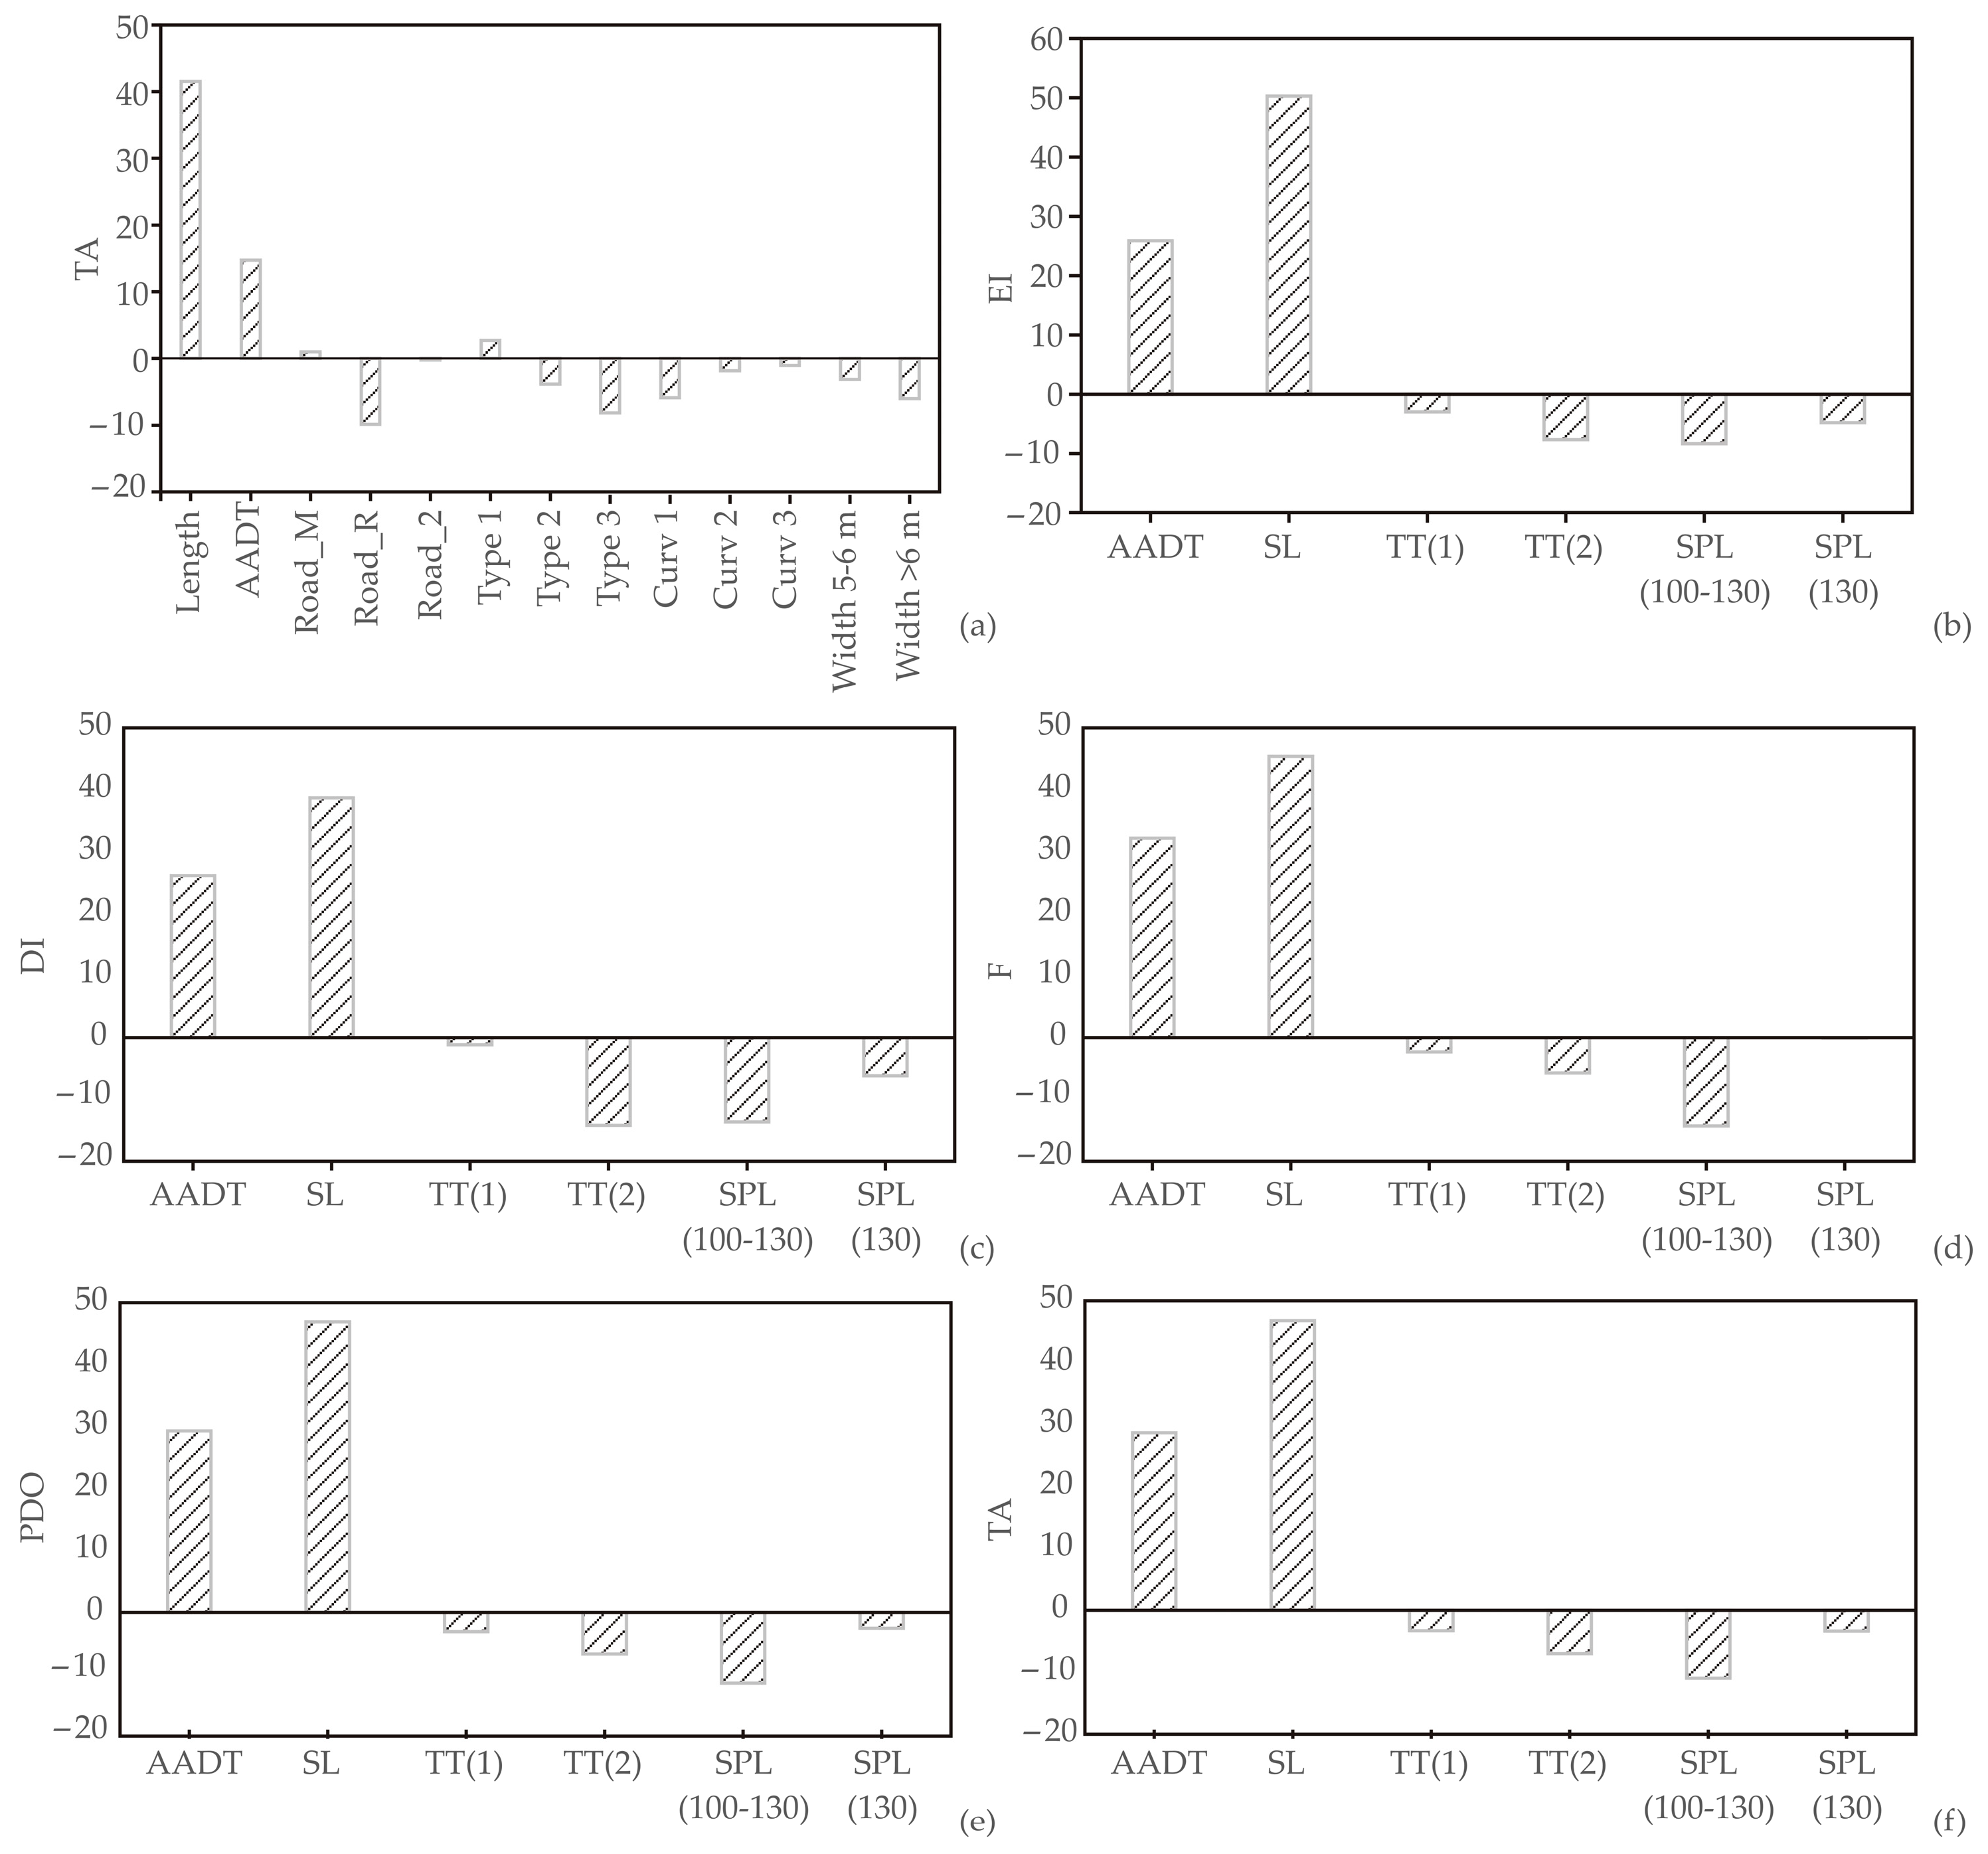
3.6. Global Sensitivity Analysis—Yoon’s Interpretation Method
4. Conclusions
Supplementary Materials
Author Contributions
Funding
Institutional Review Board Statement
Informed Consent Statement
Data Availability Statement
Conflicts of Interest
References
- WHO. World Health Organization—Road Traffic Injuries. 2023. Available online: https://www.who.int/news-room/fact-sheets/detail/road-traffic-injuries (accessed on 11 February 2023).
- Benos, L.; Tagarakis, A.C.; Dolias, G.; Berruto, R.; Kateris, D.; Bochtis, D. Machine learning in agriculture: A comprehensive updated review. Sensors 2021, 21, 3758. [Google Scholar] [CrossRef] [PubMed]
- Ma, H.; Ding, F.; Wang, Y. A novel multi-innovation gradient support vector machine regression method. ISA Trans. Press 2022, 130, 343–359. [Google Scholar] [CrossRef] [PubMed]
- Wang, C.; Peng, G.; De Baets, B. Embedding metric learning into an extreme learning machine for scene recognition. Expert Syst. Appl. 2022, 203, 117505. [Google Scholar] [CrossRef]
- Su, J.; Wang, Y.; Niu, X.; Shaa, S.; Yu, J. Prediction of ground surface settlement by shield tunneling using XGBoost and Bayesian optimization. Eng. Appl. Artif. Intel. 2022, 114, 105020. [Google Scholar] [CrossRef]
- Jawad, M.; Ghulam-e, M.; Muhammad, A. Accurate estimation of tool wear levels during milling, drilling and turning operations by designing novel hyperparameter tuned models based on LightGBM and stacking. Measurement 2022, 190, 110722. [Google Scholar]
- Dutta, J.; Roy, S. Occupancy Sense: Context-based indoor occupancy detection & prediction using CatBoost model. Appl. Soft Comput. 2022, 119, 108536. [Google Scholar]
- Mehdizadeh, A.; Cai, M.; Hu, Q.; Alamdar Yazdi, M.A.; Mohabbati-Kalejahi, N.; Vinel, A.; Rigdon, S.E.; Davis, K.C.; Megahed, F.M. A review of data analytic applications in road traffic safety. Part 1: Descriptive and predictive modeling. Sensors 2020, 20, 1107. [Google Scholar] [CrossRef]
- American Association of State Highway and Transportation Officials (AASHTO). Highway Safety Manual, 1st ed.; AASHTO: Washington, DC, USA, 2010; Volume 2. [Google Scholar]
- Glavić, D.; Mladenović, M.; Stevanović, A.; Tubić, V.; Milenković, M.; Vidas, M. Contribution to Accident Prediction Models Development for Rural Two-Lane Roads in Serbia. Promet 2016, 28, 415–424. [Google Scholar] [CrossRef]
- Vogt, A.; Bared, J. Accident Models for Two-Lane Rural Segments and Intersections. Transp. Res. Rec. 1998, 1635, 18–29. [Google Scholar] [CrossRef]
- Fitzpatrick, K.; Schneider, W.H.; Park, E.S. Comparisons of Crashes on Rural Two-Lane and Four-Lane Highways in Texas; Texas Department of Transportation: Austin, TX, USA, 2009.
- Geedipally, S.R.; Sunil, P.; Dominique, L. Examination of Methods to Estimate Crash Counts by Collision Type. J. Transp. Res. Board 2010, 2165, 12–20. [Google Scholar] [CrossRef]
- Cardoso, J.L. Design Consistency and Signing of Curves on Interurban Single Carriageway Roads; LNEC: Lisabon, Portugal, 2001. [Google Scholar]
- Harwood, D.; Council, F.; Hauer, E.; Hughes, W.; Vogt, A. Prediction of the Expected Safety Performance of Rural Two-Lane Highways; Federal Highway Administration: McLean, VA, USA, 2000.
- Pardillo-Mayora, J.M.; Llamas-Rubio, L. Relevant Variables for Crash Rate Prediction in Spain’s Two Lane Rural Roads. In Proceedings of the 82nd Transportation Research Board Annual Meeting, Washington, DC, USA, 12–16 January 2003. [Google Scholar]
- Cafiso, S.; Graziano, A.D.; Silvestro, G.D.; Cava, G.L.; Persaud, B. Development of comprehensive accident models for two-lane rural highways using exposure, geometry, consistency and context variables. Accid. Anal. Prev. 2010, 42, 1072–1079. [Google Scholar] [CrossRef] [PubMed]
- Williams, A.; Salifu, M. Crash prediction model for two-lane rural highways in the Ashanti region of Ghana. IATSS Res. 2011, 35, 34–40. [Google Scholar]
- Dinu, R.; Veeraragavan, A. Random parameter models for accident prediction on two-lane undivided highways in India. JSR 2011, 42, 39–42. [Google Scholar] [CrossRef]
- Turner, S.; Singh, R.; Nates, G. The Next Generation of Rural Road Crash Prediction Models: Final Report; NZ Transport Agency: Wellington, New Zealand, 2012.
- Deublein, M.; Schubert, M.; Adey, B.T.; Köhler, J.; Faber, M.H. Prediction of road accidents: A Bayesian hierarchical approach. Accid. Anal. Prev. 2013, 51, 274–291. [Google Scholar] [CrossRef] [PubMed]
- Afrin, T.; Yodo, N. A Long Short-Term Memory-based correlated traffic data prediction framework. Knowl.-Based Syst. 2022, 237, 107755. [Google Scholar] [CrossRef]
- Zhang, Z.; Yang, W.; Wushour, S. Traffic accident prediction based on LSTM-GBRT model. J. Control Sci. Eng. 2020, 2020, 4206919. [Google Scholar] [CrossRef]
- Liu, Y.; Wu, C.; Wen, J.; Xiao, X.; Chen, Z. A grey convolutional neural network model for traffic flow prediction under traffic accidents. Neurocomputing 2022, 500, 761–775. [Google Scholar] [CrossRef]
- Zheng, M.; Li, T.; Zhu, R.; Chen, J.; Ma, Z.; Tang, M.; Cui, Z.; Wang, Z. Traffic accident’s severity prediction: A deep-learning approach-based CNN network. IEEE Access 2019, 7, 39897–39910. [Google Scholar] [CrossRef]
- Wen, X.; Xie, Y.; Jiang, L.; Li, Y.; Ge, T. On the interpretability of machine learning methods in crash frequency modeling and crash modification factor development. Accid. Anal. Prev. 2022, 168, 106617. [Google Scholar] [CrossRef]
- Huang, H.; Abdel-Aty, M. Multilevel data and Bayesian analysis in traffic safety. Accid. Anal. Prev. 2010, 42, 1556–1565. [Google Scholar] [CrossRef]
- Hosseinpour, M.; Yahaya, A.S.; Farh, A. Exploring the effects of roadway characteristics on the frequency and severity of head-on crashes: Case studies from Malaysian Federal Roads. Accid. Anal. Prev. 2014, 62, 209–222. [Google Scholar] [CrossRef] [PubMed]
- Çodur, M.Y.; Tortum, A. An Artificial Neural Network Model for Highway Accident Prediction: A Case Study of Erzurum, Turkey. Promet 2015, 27, 217–225. [Google Scholar] [CrossRef]
- Xiong, X.; Chen, L.; Liang, J. Analysis of Roadway Traffic Accidents Based on Rough Sets and Bayesian Networks. Promet 2018, 30, 71–81. [Google Scholar] [CrossRef]
- Olmuş, H.; Erbaş, S. Analysis of Traffic Accidents Caused by Drivers by Using Log-Linear Models. Promet 2012, 24, 495–504. [Google Scholar] [CrossRef]
- Marković, N.; Pešić, D.; Antić, B.; Lazarević, M. Identifying contributing factors on occurrence traffic accidents applying in-depth studies and Bayesian neural networks. J. Road Traffic Eng. 2019, 65, 29–38. [Google Scholar] [CrossRef]
- Milenković, M.; Glavić, D.; Kocić, A.; Petković, M. Impact of road and traffic characteristics on the traffic accidents. J. Road Traffic Eng. 2017, 63, 5–12. [Google Scholar]
- Tubić, V.; Antić, B.; Graovac, D. Traffic accidents costs on state roads of the first order. J. Road Traffic Eng. 2019, 65, 35–43. [Google Scholar] [CrossRef]
- Marković, N.; Pešić, D.; Kovač, M.; Smailović, E. Determination the influence of road factors on the occurrence of traffic accidents with dead pedestrians on the territory of Belgrade by independent estimates. J. Road Traffic Eng. 2021, 67, 41–49. [Google Scholar]
- P.E. Roads of Serbia. Traffic Counting. 2022. Available online: https://www.putevi-srbije.rs/index.php/%D0%B1%D1%80%D0%BE%D1%98%D0%B0%D1%9A%D0%B5-%D1%81%D0%B0%D0%BE%D0%B1%D1%80%D0%B0%D1%9B%D0%B0%D1%98%D0%B0 (accessed on 10 January 2023).
- P.E. Roads of Republic of Srpska. Traffic Counting. 2022. Available online: https://www.putevirs.com/index.php?jezik=sr&idm=12&idpm=14&meni=%D0%91%D0%B5%D0%B7%D0%B1%D1%98%D0%B5%D0%B4%D0%BD%D0%BE%D1%81%D1%82%D1%81%D0%B0%D0%BE%D0%B1%D1%80%D0%B0%D1%9B%D0%B0%D1%98%D0%B0&stavka=%D0%91%D1%80%D0%BE%D1%98%D0%B0%D1%9A%D0%B5-%D1%81%D0%B0% (accessed on 5 January 2023).
- Road Traffic Safety Agency. Traffic Accident GIS Base. 2022. Available online: https://www.abs.gov.rs/%d1%81%d1%80/analize-i-istrazivanja/baza-podataka (accessed on 10 January 2023).
- Ministry of Internal Affairs of the Republic of Srpska. Number of Traffic Accidents and Casualties by Road Section; ICT Administration: Banja Luka, Bosnia and Herzegovina, 2021.
- Liu, S.; Chang, R.; Zuo, J.; Webber, R.J.; Xiong, F.; Dong, N. Application of artificial neural networks in construction management: Current status and future directions. Appl. Sci. 2021, 11, 9616. [Google Scholar] [CrossRef]
- Pang, Z.; Niu, F.; O’Neill, Z. Solar radiation prediction using recurrent neural network and artificial neural network: A case study with comparisons. Renew. Energy 2020, 156, 279–289. [Google Scholar] [CrossRef]
- Pezo, L.; Lončar, B.; Šovljanski, O.; Tomić, A.; Travičić, V.; Pezo, M.; Aćimović, M. Agricultural Parameters and Essential Oil Content Composition Prediction of Aniseed, Based on Growing Year, Locality and Fertilization Type—An Artificial Neural Network Approach. Life 2022, 12, 1722. [Google Scholar] [CrossRef]
- Brandić, I.; Pezo, L.; Bilandžija, N.; Peter, A.; Šurić, J.; Voća, N. Artificial neural network as a tool for estimation of the higher heating value of miscanthus based on ultimate analysis. Mathematics 2022, 10, 3732. [Google Scholar] [CrossRef]
- Ruškić, N.; Mirović, V.; Marić, M.; Pezo, L.; Lončar, B.; Nićetin, M.; Ćurčić, L. Model for Determining Noise Level Depending on Traffic Volume at Intersections. Sustainability 2022, 14, 12443. [Google Scholar] [CrossRef]
- Nise, N.S. Control Systems Engineering, 8th ed.; California State Polytecnic University, John Wiley & Sons Inc.: Hoboken, NJ, USA, 2019; ISBN 978-1-119-47422-7. [Google Scholar]
- Chakraborty, A.; Mukherjee, D.; Mitra, S. Development of pedestrian crash prediction model for a developing country using artificial neural network. Int. J. Inj. Control Saf. Promot. 2019, 26, 283–293. [Google Scholar] [CrossRef] [PubMed]
- Rezaie Moghaddam, F.; Afandizadeh, S.; Ziyadi, M. Prediction of accident severity using artificial neural networks. Int. J. Civ. Eng. 2011, 9, 41–48. [Google Scholar]
- Demir, H.; Demir, H.; Lončar, B.; Pezo, L.; Brandić, I.; Voća, N.; Yilmaz, F. Optimization of Caper Drying Using Response Surface Methodology and Artificial Neural Networks for Energy Efficiency Characteristics. Energies 2023, 16, 1687. [Google Scholar] [CrossRef]
- Rajković, D.; Jeromela, A.M.; Pezo, L.; Lončar, B.; Grahovac, N.; Špika, A.K. Artificial neural network and random forest regression models for modelling fatty acid and tocopherol content in oil of winter rapeseed. J. Food Compos. Anal. 2023, 115, 105020. [Google Scholar] [CrossRef]
- Kai, Z.; Xin, X.; Hong-Xing, L.; Yi-Peng, X.; Zhen-Chun, L.; Ping, J. Optimization method of first-arrival waveform inversion based on the L-BFGS algorithm. Appl. Geophys. 2021, 18, 515–524. [Google Scholar] [CrossRef]
- Puntarić, E.; Pezo, L.; Zgorelec, Ž.; Gunjača, J.; Kučić Grgić, D.; Voća, N. Prediction of the Production of Separated Municipal Solid Waste by Artificial Neural Networks in Croatia and the European Union. Sustainability 2022, 14, 10133. [Google Scholar] [CrossRef]
- Yoon, Y.; Swales, G.; Margavio, T.M. Comparison of Discriminant Analysis versus Artificial Neural Networks. J. Oper. Res. Soc. 2017, 44, 51–60. [Google Scholar] [CrossRef]
- Voća, N.; Pezo, L.; Jukić, Ž.; Lončar, B.; Šuput, D.; Krička, T. Estimation of the storage properties of rapeseeds using an artificial neural network. Ind. Crops Prod. 2022, 187, 115358. [Google Scholar] [CrossRef]
- Ćurčić, L.; Lončar, B.; Pezo, L.; Stojić, N.; Prokić, D.; Filipović, V.; Pucarević, M. Chemometric Approach to Pesticide Residue Analysis in Surface Water. Water 2022, 14, 4089. [Google Scholar] [CrossRef]
- Aćimović, M.; Zeremski, T.; Šovljanski, O.; Lončar, B.; Pezo, L.; Zheljazkov, V.D.; Pezo, M.; Šuput, D.; Kurunci, Z. Seasonal Variations in Essential Oil Composition of Immortelle Cultivated in Serbia. Horticulturae 2022, 8, 1183. [Google Scholar] [CrossRef]
- Sun, H.; Yang, G.Y. The combined measurement and correlation analysis of deaths in traffic accidents. J. Yanbian Univ. 2018, 44, 239–245. [Google Scholar]
- Sun, L.L.; Chen, T.; Zhao, J.; Wu, Q.; Zhao, H. Analysis of the influencing factors of traffic accident losses and their regional features in China-a study based on the panel data of 31 provinces from 2004 to 2015. Southwest Univ. 2019, 41, 114–123. [Google Scholar]
- Chen, J.; Wang, Q.; Huang, J. Motorcycle ban and traffic safety: Evidence from a quasi-experiment at Zhejiang, China. J. Adv. Transp. 2021, 2021, 7552180. [Google Scholar] [CrossRef]
- Soni, A.; Al-Sarayreh, M.; Reis, M.M.; Smith, J.; Tong, K.; Brightwell, G. Identification of cold spots using non-destructive hyperspectral imaging technology in model food processed by coaxially induced microwave pasteurization and sterilization. Foods 2020, 9, 837. [Google Scholar] [CrossRef] [PubMed]
- Najafi, Z.; Zare, K.; Mahmoudi, M.R.; Shokri, S.; Mosavi, A. Inference and Local Influence Assessment in a Multifactor Skew Normal Linear Mixed Model. Mathematics 2022, 10, 2820. [Google Scholar] [CrossRef]
- Kouziokas, G.N. Neural network-based road accident forecasting in transportation and public management. In Data Analytics: Paving the Way to Sustainable Urban Mobility: Proceedings of 4th Conference on Sustainable Urban Mobility (CSUM2018), Skiathos Island, Greece, 24–25 May 2018; Springer International Publishing: Berlin, Germany, 2019; pp. 98–103. [Google Scholar]
- Singh, G.; Pal, M.; Yadav, Y.; Singla, T. Deep neural network-based predictive modeling of road accidents. Neural Comput. Appl. 2020, 32, 12417–12426. [Google Scholar] [CrossRef]
- Beattie, J.R.; Esmonde-White, F.W. Exploration of principal component analysis: Deriving principal component analysis visually using spectra. Appl. Spectrosc. 2021, 75, 361–375. [Google Scholar] [CrossRef]
- Rupp, D.E.; Schmidt, J.; Woods, R.A.; Bidwell, V.J. Analytical assessment and parameter estimation of a low-dimensional groundwater model. J. Hydrol. 2009, 377, 143–154. [Google Scholar] [CrossRef]
- Šovljanski, O.; Tomić, A.; Pezo, L.; Ranitović, A.; Markov, S. Prediction of denitrification capacity of alkalotolerant bacterial isolates from soil—An artificial neural network model. J. Serb. Chem. Soc. 2020, 85, 1417–1427. [Google Scholar] [CrossRef]
- Chen, C.-F.; Chen, C.-H.; Chung, Y.-Y.; Chen, S.-L.; Chen, C.-C. Association between road length and driver fatigue on monotonous two-lane highways. Accid. Anal. Prev. 2016, 97, 118–125. [Google Scholar]
- Halim, Z.; Kalsoom, R.; Bashir, S.; Abbas, G. Artificial intelligence techniques for driving safety and vehicle crash prediction. Artif. Intell. Rev. 2016, 46, 351–387. [Google Scholar] [CrossRef]


| Mark | State | Road Type | Section | Total |
|---|---|---|---|---|
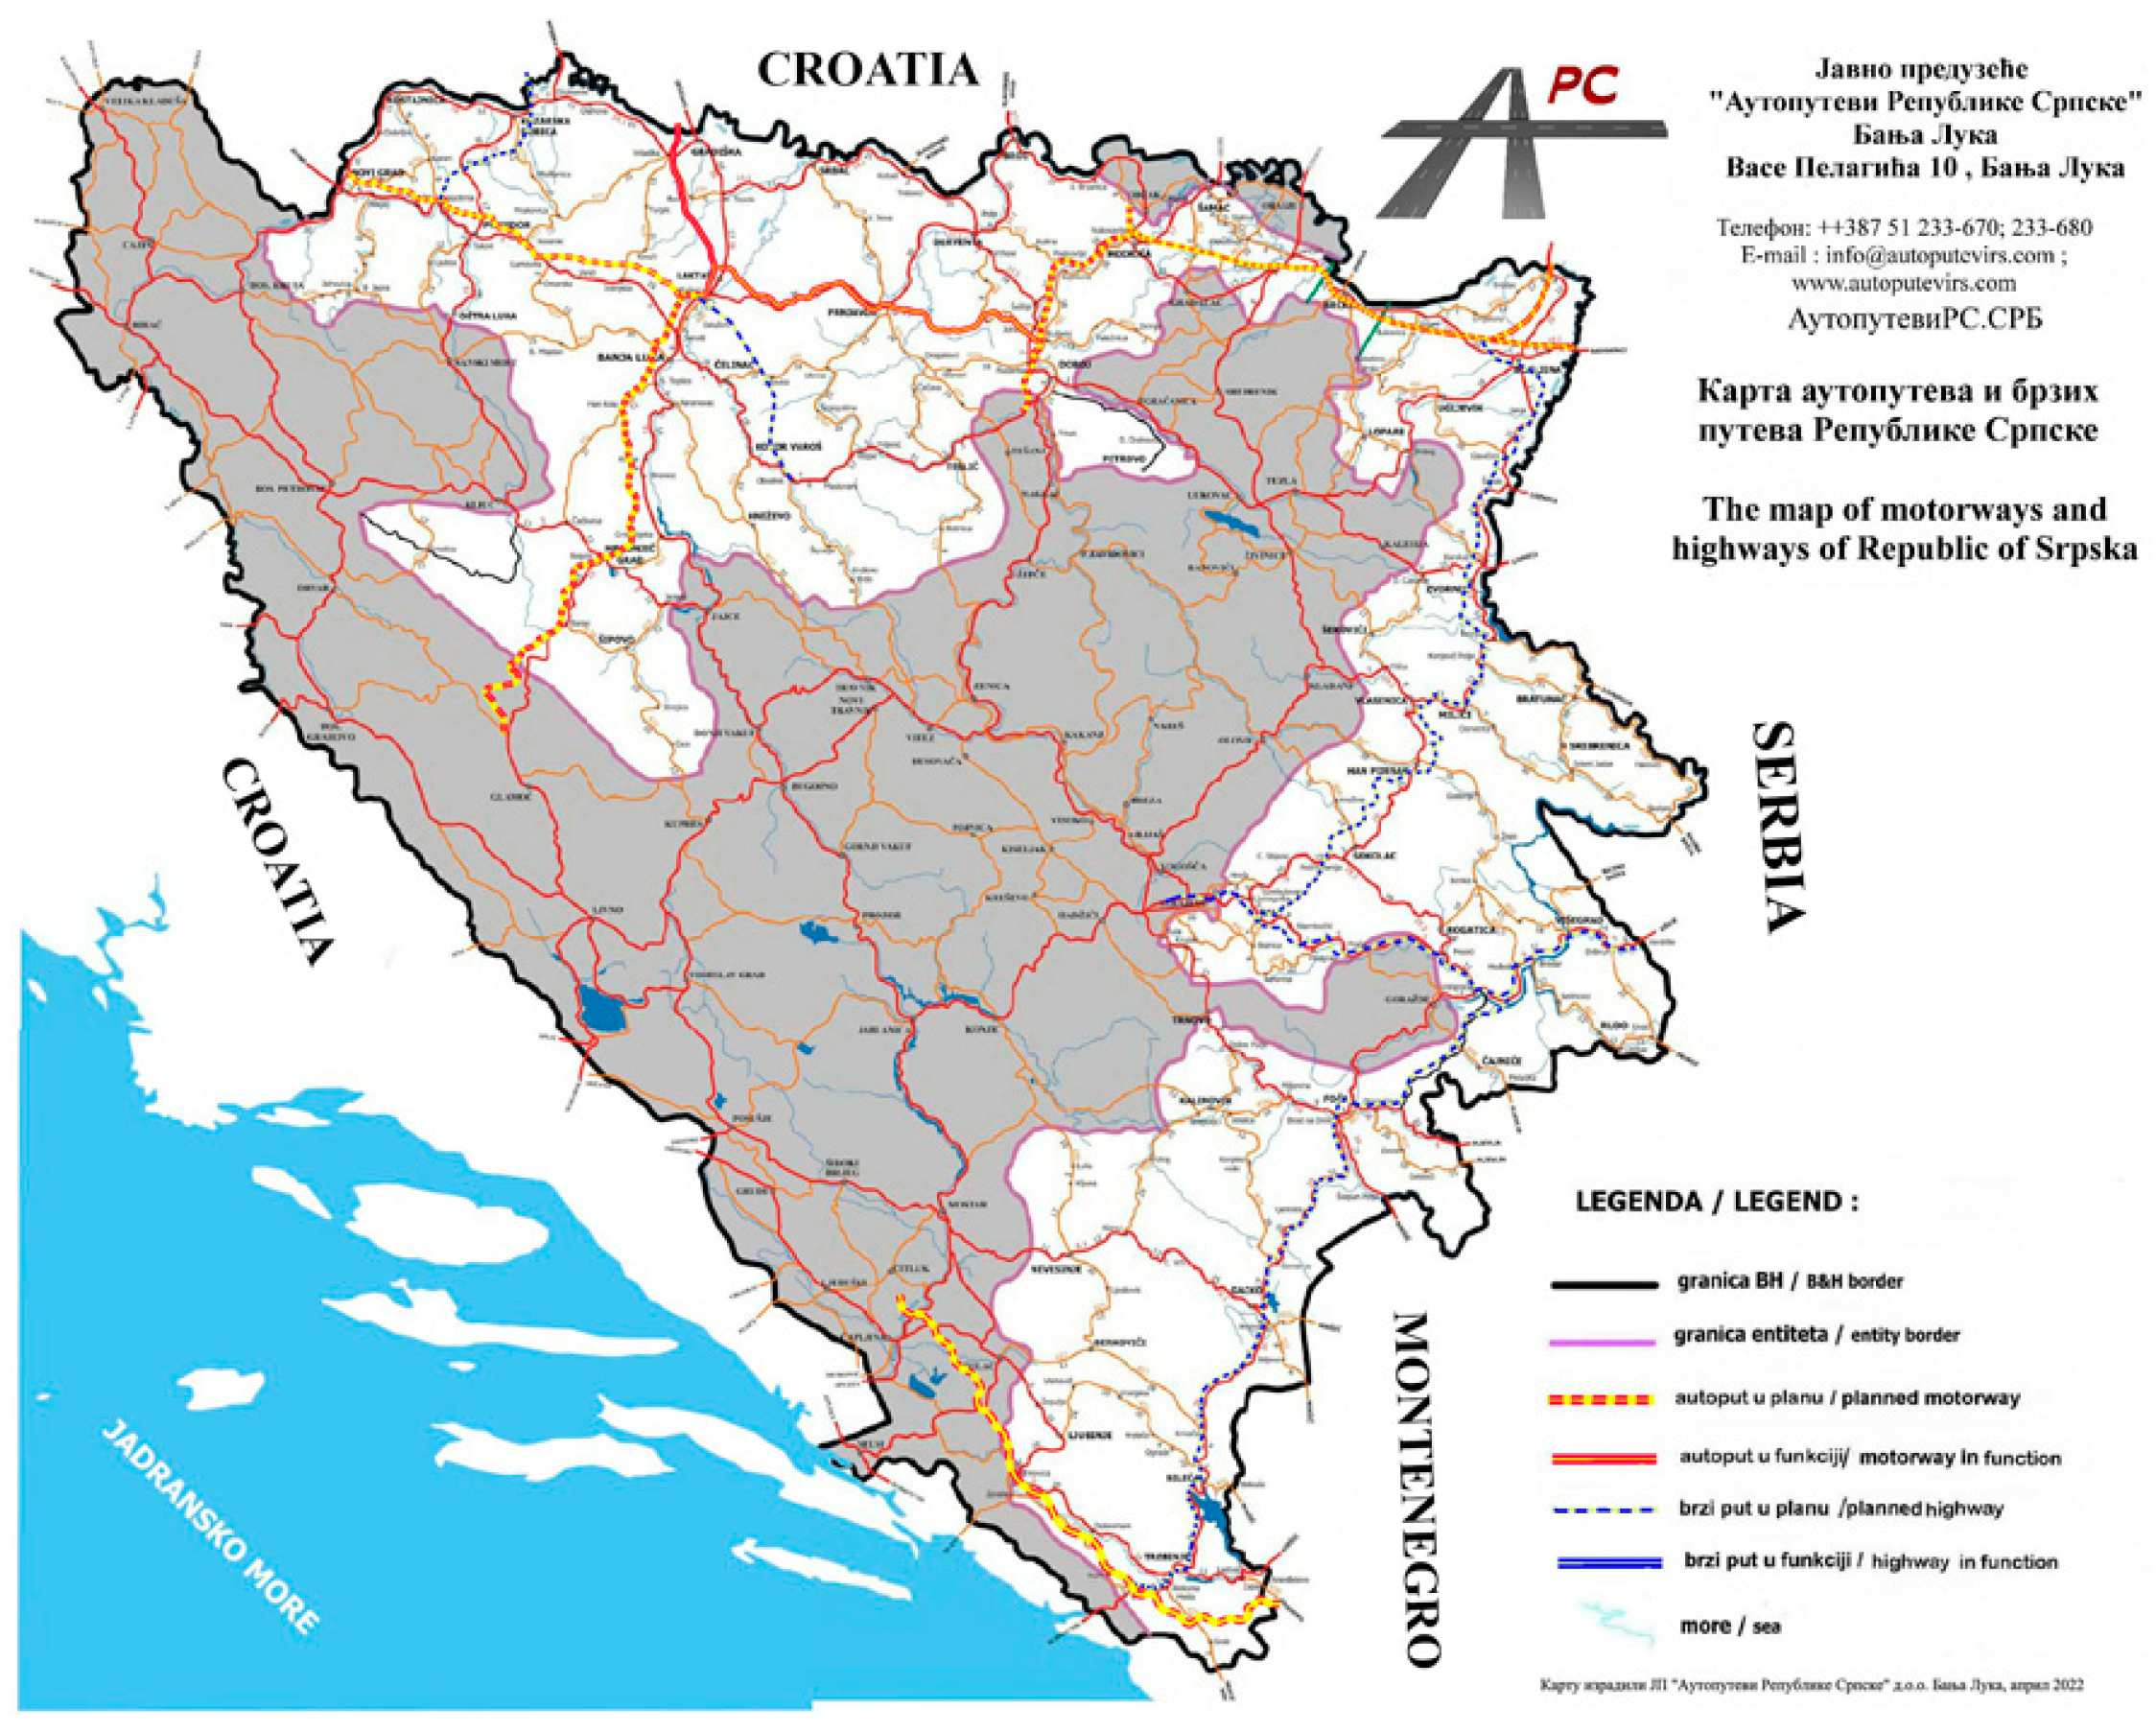
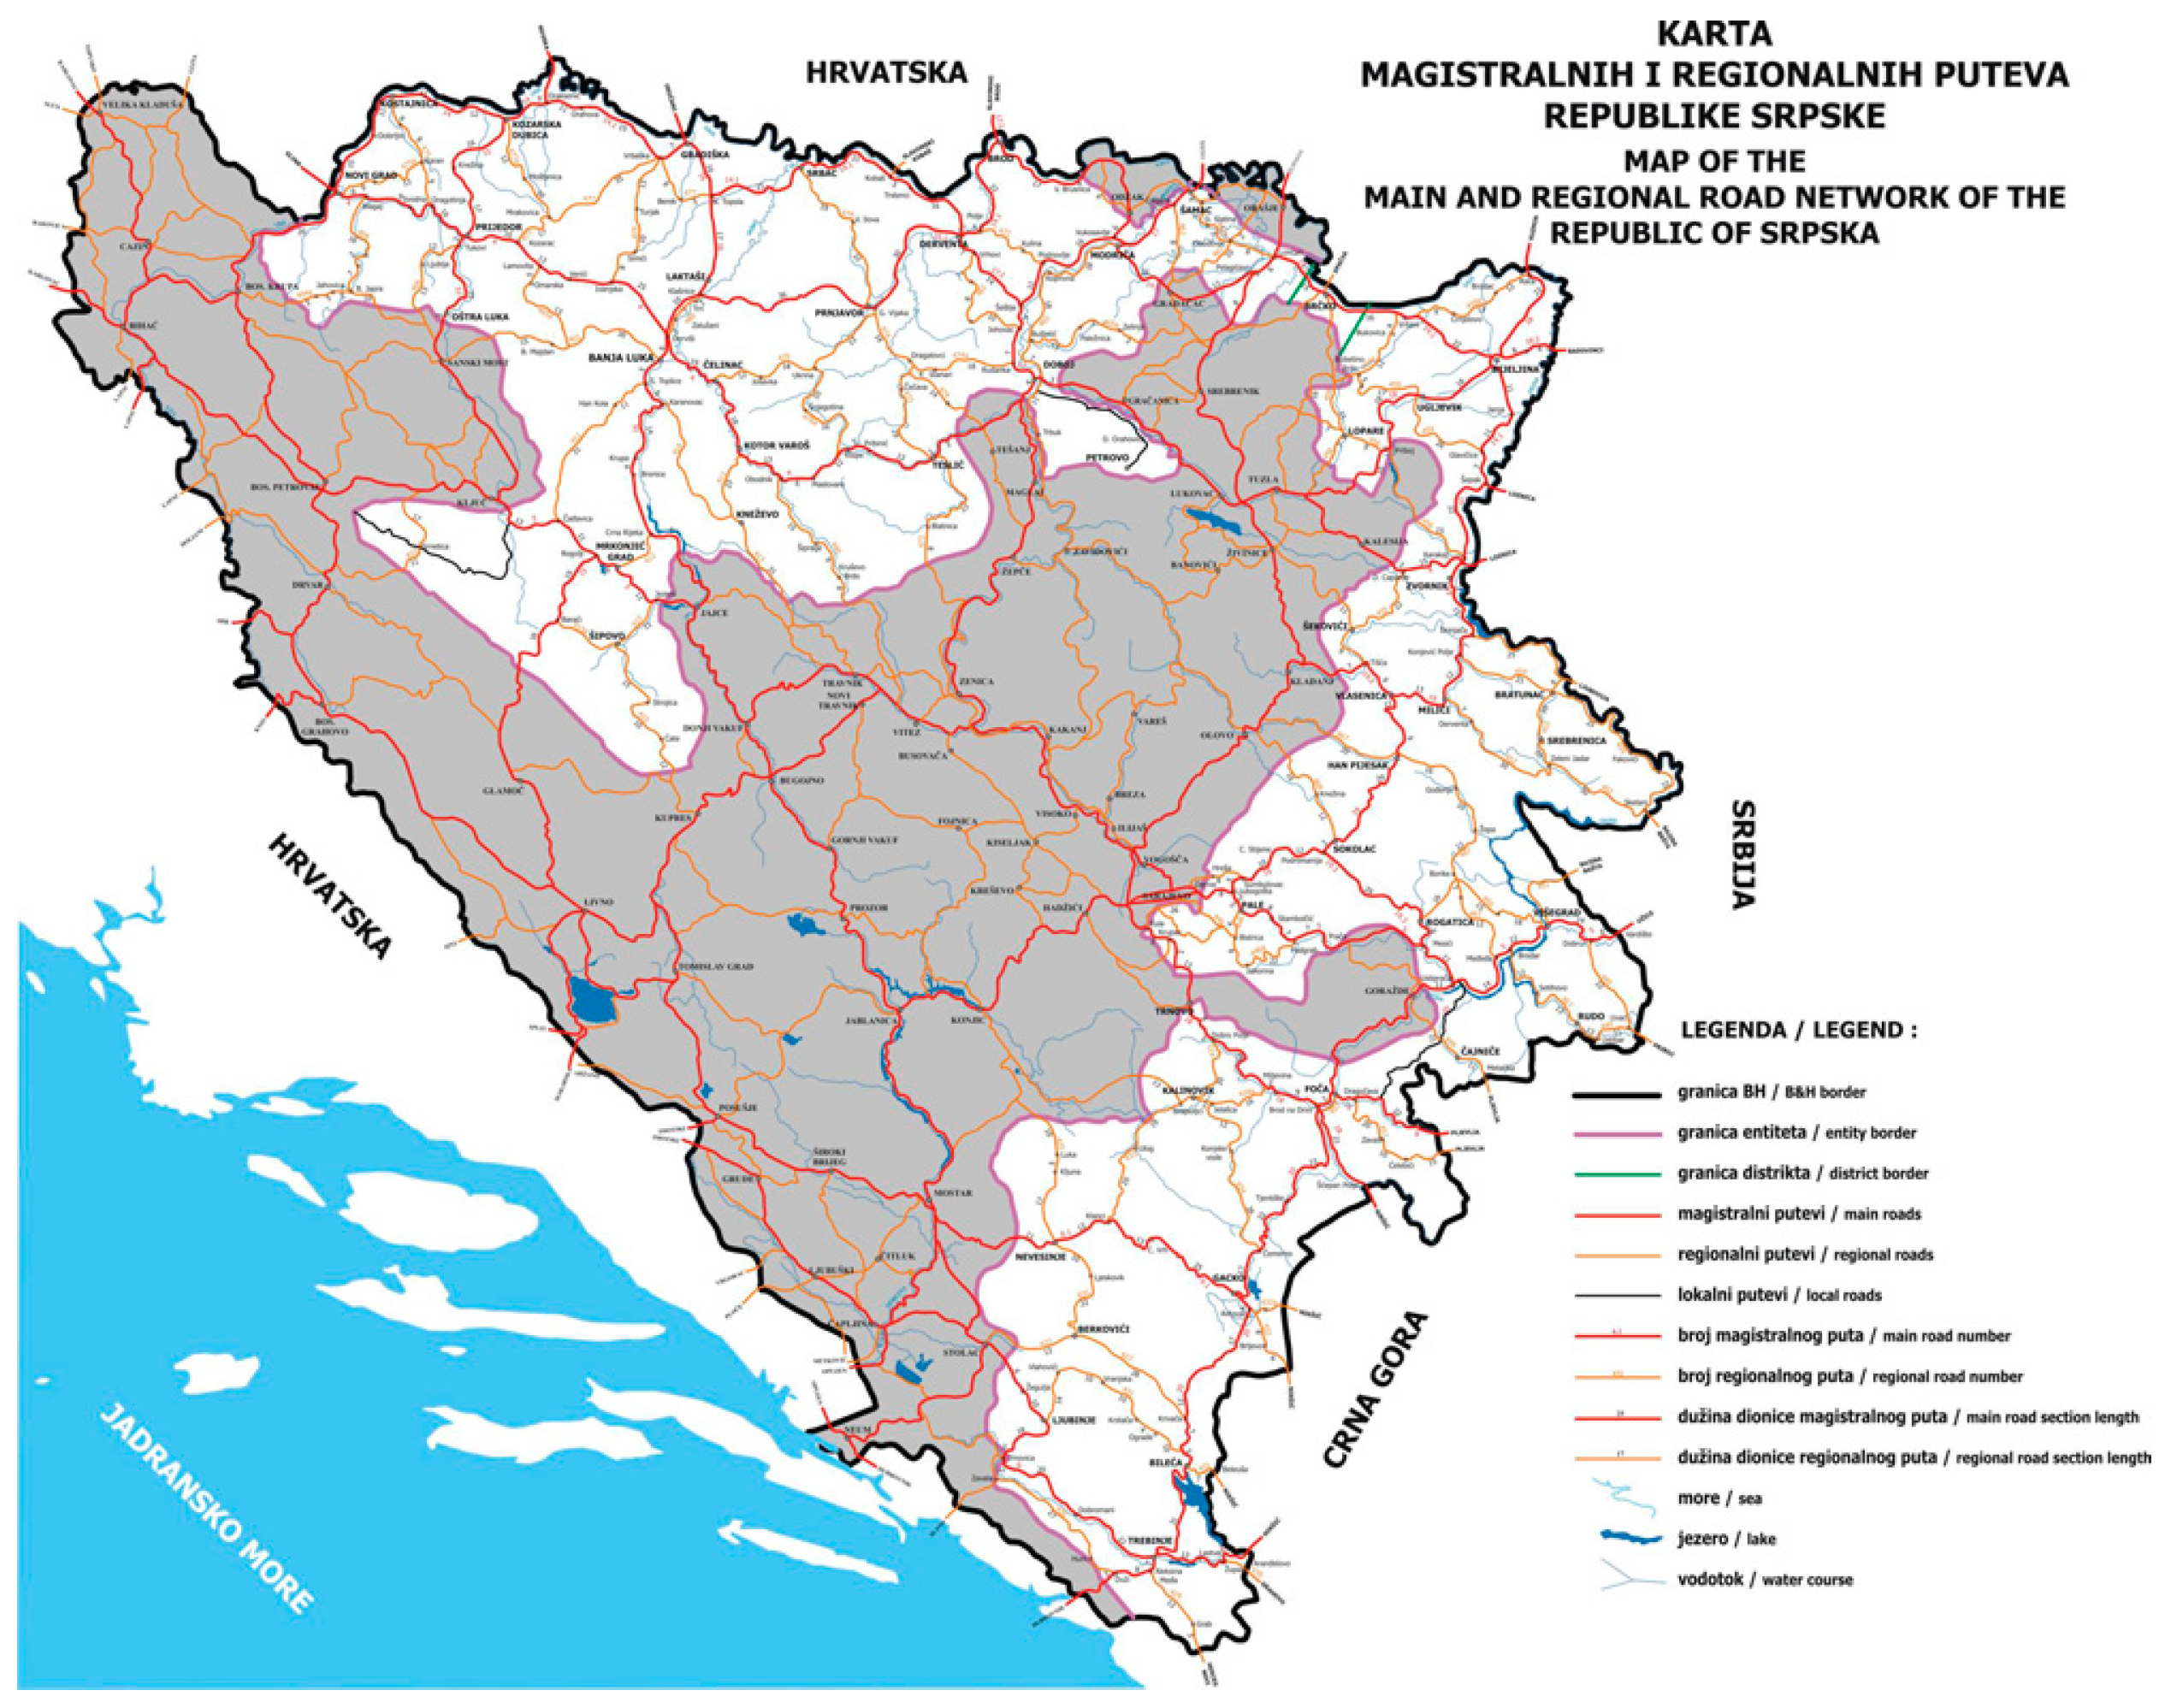
| Road 1 | Republic of Srpska | Two lane-state road (1st class) | 118 road sections | |
| Road 2 | Republic of Srpska | Two lane- state roads (2nd class), | 62 road sections | 180 sections |
| Road 3 | Serbia | Two lane | 113 road sections | |
| Road 4 | Serbia | High way | 78 road sections | 191 sections |
| SL (m) | AADT (veh/day) | TA | |
|---|---|---|---|
| Mean | 8184.53 | 5013.53 | 14.24 |
| SD | 10,582.75 | 4436.44 | 18.51 |
| Min | 0.20 | 109 | 0 |
| Max | 49,492 | 25,581 | 144 |
| Var | 1.1 × 10⁸ | 2.0 × 10⁷ | 342.70 |
| AADT | SL (km) | EI | DI | F | PDO | TA | |
|---|---|---|---|---|---|---|---|
| Mean | 18,547.60 | 10.51 | 1.96 | 0.91 | 0.38 | 7.67 | 10.92 |
| SD | 11,078.48 | 6.79 | 2.02 | 1.03 | 1.31 | 7.00 | 9.11 |
| Max | 66,985 | 29.50 | 7 | 4 | 11 | 41 | 50 |
| Min | 5574 | 1.50 | 0 | 0 | 0 | 0 | 0 |
| Var | 1.2 × 10⁸ | 46.16 | 4.09 | 1.07 | 1.72 | 48.95 | 83.01 |
| Neurons | |||||||||
|---|---|---|---|---|---|---|---|---|---|
| Parameter | 1 | 2 | 3 | 4 | 5 | 6 | 7 | 8 | 9 |
| Length | 0.274 | 2.072 | −0.249 | −0.103 | −8.458 | 0.064 | −2.904 | 0.852 | 2.426 |
| AADT | 0.159 | 1.330 | 0.723 | 2.080 | 1.626 | 0.811 | −6.403 | 1.489 | 1.611 |
| Road 1 | 0.080 | 1.097 | 0.834 | 0.524 | 2.091 | 0.086 | −2.348 | 1.025 | 0.835 |
| Road 2 | 0.073 | −2.166 | −0.155 | −0.025 | −1.491 | −0.156 | 5.360 | −0.037 | −0.561 |
| Road 3 | −0.819 | −1.005 | −0.972 | −0.916 | −0.517 | 0.177 | −1.274 | −1.692 | −1.515 |
| Terrain Type (1) | 0.154 | −0.569 | 0.238 | −0.499 | −1.722 | 0.012 | 0.839 | −0.121 | −0.756 |
| Terrain Type (2) | −0.601 | −0.146 | −0.545 | 0.557 | 0.823 | 0.347 | 0.564 | 0.632 | 0.691 |
| Terrain Type (3) | −0.095 | −1.388 | 0.104 | −0.503 | 1.061 | −0.224 | 0.319 | −1.139 | −1.167 |
| Curvature (1) | 0.102 | −0.472 | −0.683 | −0.882 | 1.176 | −0.340 | −0.619 | −0.533 | −0.480 |
| Curvatures (2) | 0.584 | 1.083 | 0.681 | 0.763 | 0.834 | 0.478 | 2.202 | 0.527 | 0.059 |
| Curvatures (3) | 0.065 | 0.496 | 0.255 | 0.256 | 0.247 | 0.001 | 0.095 | 0.610 | 0.717 |
| Width (5–6 m) | −0.279 | −0.362 | −0.331 | −0.305 | 0.040 | −0.032 | 0.563 | −0.725 | −0.721 |
| Width (>6 m) | −0.292 | −1.700 | 0.083 | −0.135 | 0.087 | 0.179 | 1.160 | 0.048 | −0.513 |
| Bias | −0.594 | −2.064 | −0.220 | −0.352 | 0.013 | 0.139 | 1.730 | −0.636 | −1.151 |
| Neurons | Bias | |||||||||
|---|---|---|---|---|---|---|---|---|---|---|
| Output | 1 | 2 | 3 | 4 | 5 | 6 | 7 | 8 | 9 | |
| TA | 0.291 | 0.869 | 0.406 | 0.843 | −2.006 | 0.219 | −1.170 | −0.031 | 0.297 | −2.428 |
| Neurons | ||||||||
|---|---|---|---|---|---|---|---|---|
| Parameter | 1 | 2 | 3 | 4 | 5 | 6 | 7 | 8 |
| AADT | −0.029 | 0.442 | 0.801 | 0.865 | 0.048 | 0.471 | 0.064 | −0.046 |
| SL | 2.161 | 1.255 | 2.952 | 2.485 | 1.875 | 1.673 | 1.297 | 0.285 |
| TT(1) | 0.522 | 0.425 | 0.727 | 0.207 | 0.741 | 0.230 | 0.668 | 0.269 |
| TT(2) | −0.576 | −0.489 | −1.047 | −0.248 | −0.509 | −0.242 | −0.545 | −0.241 |
| SPL (100–130 km/h) | 0.140 | −0.411 | −0.732 | −0.185 | −0.187 | −0.140 | −0.337 | −0.170 |
| SPL (130 km/h) | −0.088 | 0.449 | 0.361 | −0.031 | 0.470 | 0.017 | 0.318 | 0.079 |
| Bias | −0.043 | 0.004 | −0.312 | −0.031 | 0.191 | −0.031 | 0.090 | −0.033 |
| Neurons | Bias | ||||||||
|---|---|---|---|---|---|---|---|---|---|
| Outputs | 1 | 2 | 3 | 4 | 5 | 6 | 7 | 8 | |
| LTP | −0.246 | −0.750 | 2.059 | 1.273 | −0.928 | 0.343 | −1.130 | −0.886 | 0.367 |
| DI | 0.174 | 0.344 | 0.253 | 0.427 | −0.709 | −0.330 | −0.131 | 0.585 | −0.104 |
| F | −0.596 | 0.112 | 0.584 | 0.951 | −0.487 | 0.074 | −0.216 | 0.118 | −0.223 |
| PDO | −0.485 | −0.037 | 1.085 | 1.076 | −0.767 | 0.218 | −0.551 | −0.192 | −0.049 |
| TA | −0.430 | −0.103 | 1.224 | 1.133 | −0.882 | 0.189 | −0.611 | −0.232 | 0.021 |
| Cycle | Output | χ2 | RMSE | MBE | MPE | r2 |
|---|---|---|---|---|---|---|
| train | TA | 7.484 | 2.720 | 0.121 | 28.269 | 0.986 |
| test | TA | 2.849 | 1.660 | 0.240 | 22.522 | 0.988 |
| valid | TA | 0.922 | 0.944 | 0.153 | 18.041 | 0.977 |
| ANN1 | TA | 8.953 | 2.975 | 0.242 | 42.476 | 0.987 |
| Cycle | Outputs | Skew | Kurt | Mean | StDev | Var |
|---|---|---|---|---|---|---|
| train | TA | 0.947 | 7.076 | 0.121 | 2.725 | 7.427 |
| test | TA | 1.064 | 2.891 | 0.258 | 1.714 | 2.937 |
| valid | TA | 0.134 | 1.517 | 0.164 | 0.973 | 0.947 |
| ANN1 | TA | 0.977 | 9.151 | 0.144 | 2.299 | 5.283 |
| Cycle | Outputs | χ2 | RMSE | MBE | MPE | r2 |
|---|---|---|---|---|---|---|
| train | EI | 0.153 | 0.383 | 0.067 | 7.158 | 0.990 |
| DI | 0.040 | 0.200 | 0.025 | 4.016 | 0.998 | |
| F | 0.110 | 0.332 | 0.042 | 3.324 | 1.000 | |
| PDO | 0.819 | 0.906 | −0.107 | 18.294 | 0.980 | |
| TA | 1.825 | 1.343 | 0.016 | 17.860 | 0.983 | |
| test | EI | 0.063 | 0.235 | −0.069 | 4.587 | 0.976 |
| DI | 0.027 | 0.166 | −0.045 | 3.654 | 0.994 | |
| F | 0.005 | 0.067 | −0.008 | 1.813 | 0.985 | |
| PDO | 0.754 | 0.861 | −0.434 | 23.553 | 0.936 | |
| TA | 1.093 | 1.046 | −0.579 | 20.517 | 0.954 | |
| valid | EI | 0.155 | 0.368 | 0.068 | 7.608 | 0.986 |
| DI | 0.057 | 0.235 | 0.056 | 5.469 | 0.998 | |
| F | 0.008 | 0.087 | −0.003 | 3.671 | 0.994 | |
| PDO | 4.518 | 1.987 | 0.721 | 15.575 | 0.988 | |
| TA | 6.265 | 2.315 | 0.838 | 15.009 | 0.986 | |
| ANN2 | EI | 0.125 | 0.354 | 0.039 | 6.723 | 0.987 |
| DI | 0.041 | 0.201 | 0.017 | 4.240 | 0.998 | |
| F | 0.067 | 0.260 | 0.022 | 3.085 | 0.999 | |
| PDO | 1.485 | 1.203 | −0.004 | 18.815 | 0.984 | |
| TA | 2.460 | 1.545 | 0.063 | 17.820 | 0.985 |
| Cycle | Outputs | Skew | Kurt | Mean | StDev | Var |
|---|---|---|---|---|---|---|
| train | EI | 0.954 | 0.431 | 0.067 | 0.381 | 0.145 |
| DI | 1.186 | 1.273 | 0.025 | 0.200 | 0.040 | |
| F | 5.889 | 37.494 | 0.042 | 0.333 | 0.111 | |
| PDO | −0.161 | 0.657 | −0.107 | 0.910 | 0.828 | |
| TA | 0.334 | 0.550 | 0.016 | 1.358 | 1.843 | |
| test | EI | −0.265 | 0.668 | −0.069 | 0.232 | 0.054 |
| DI | 0.807 | −1.075 | −0.045 | 0.165 | 0.027 | |
| F | 1.433 | 2.234 | −0.008 | 0.069 | 0.005 | |
| PDO | −0.475 | −0.703 | −0.434 | 0.768 | 0.590 | |
| TA | −0.695 | −0.175 | −0.579 | 0.900 | 0.810 | |
| valid | EI | −0.208 | 0.013 | 0.068 | 0.374 | 0.140 |
| DI | 0.347 | −1.252 | 0.056 | 0.236 | 0.056 | |
| F | 0.583 | −1.325 | −0.003 | 0.090 | 0.008 | |
| PDO | 0.721 | 0.992 | 0.721 | 1.912 | 3.658 | |
| TA | 0.382 | 1.396 | 0.838 | 2.228 | 4.965 | |
| ANN2 | EI | 0.756 | 0.644 | 0.039 | 0.354 | 0.126 |
| DI | 0.941 | 0.338 | 0.017 | 0.202 | 0.041 | |
| F | 7.276 | 59.253 | 0.022 | 0.261 | 0.068 | |
| PDO | 1.198 | 4.305 | −0.004 | 1.210 | 1.465 | |
| TA | 0.804 | 2.374 | 0.063 | 1.554 | 2.414 |
Disclaimer/Publisher’s Note: The statements, opinions and data contained in all publications are solely those of the individual author(s) and contributor(s) and not of MDPI and/or the editor(s). MDPI and/or the editor(s) disclaim responsibility for any injury to people or property resulting from any ideas, methods, instructions or products referred to in the content. |
© 2023 by the authors. Licensee MDPI, Basel, Switzerland. This article is an open access article distributed under the terms and conditions of the Creative Commons Attribution (CC BY) license (https://creativecommons.org/licenses/by/4.0/).
Share and Cite
Gatarić, D.; Ruškić, N.; Aleksić, B.; Đurić, T.; Pezo, L.; Lončar, B.; Pezo, M. Predicting Road Traffic Accidents—Artificial Neural Network Approach. Algorithms 2023, 16, 257. https://doi.org/10.3390/a16050257
Gatarić D, Ruškić N, Aleksić B, Đurić T, Pezo L, Lončar B, Pezo M. Predicting Road Traffic Accidents—Artificial Neural Network Approach. Algorithms. 2023; 16(5):257. https://doi.org/10.3390/a16050257
Chicago/Turabian StyleGatarić, Dragan, Nenad Ruškić, Branko Aleksić, Tihomir Đurić, Lato Pezo, Biljana Lončar, and Milada Pezo. 2023. "Predicting Road Traffic Accidents—Artificial Neural Network Approach" Algorithms 16, no. 5: 257. https://doi.org/10.3390/a16050257
APA StyleGatarić, D., Ruškić, N., Aleksić, B., Đurić, T., Pezo, L., Lončar, B., & Pezo, M. (2023). Predicting Road Traffic Accidents—Artificial Neural Network Approach. Algorithms, 16(5), 257. https://doi.org/10.3390/a16050257