Article

Prediction of Freeway Traffic Breakdown Using Artificial Neural Networks

Department of Civil, Construction and Environmental Engineering, Iowa State University, Ames, IA 50011, USA
*
Author to whom correspondence should be addressed.
Algorithms 2023, 16(6), 298; https://doi.org/10.3390/a16060298
Submission received: 22 May 2023 / Revised: 9 June 2023 / Accepted: 12 June 2023 / Published: 15 June 2023
(This article belongs to the Special Issue Neural Network for Traffic Forecasting)

Abstract

:
Traffic breakdown is the transition of traffic flow from an uncongested state to a congested state. During peak hours, when a large number of on-ramp vehicles merge with mainline traffic, it can cause a significant drop in speed and subsequently lead to traffic breakdown. Therefore, ramp meters have been used to regulate the traffic flow from the ramps to maintain stable traffic flow on the mainline. However, existing traffic breakdown prediction models do not consider on-ramp traffic flow. In this paper, an algorithm based on artificial neural networks (ANN) is developed to predict the probability of a traffic breakdown occurrence on freeway segments with merging traffic, considering temporal and spatial correlations of the traffic conditions from the location of interest, the ramp, and the upstream and downstream segments. The feature selection analysis reveals that the traffic condition of the ramps has a significant impact on the occurrence of traffic breakdown on the mainline. Therefore, the traffic flow characteristics of the on-ramp, along with other significant features, are used to build the ANN model. The proposed ANN algorithm can predict the occurrence of traffic breakdowns on freeway segments with merging traffic with an accuracy of 96%. Furthermore, the model has been deployed at a different location, which yields a predictive accuracy of 97%. In traffic operations, the high probability of the occurrence of a traffic breakdown can be used as a trigger for the ramp meters.

1. Introduction

Traffic breakdown occurs when the speed of traffic rapidly decreases from free-flow to low speeds. When a breakdown occurs, vehicles are forced to rapidly decelerate, leading to delays and safety hazards [1]. This speed reduction can extend to kilometers [2]. It is a critical issue in urban areas where high volumes of vehicles often lead to breakdowns, cause traffic delays, and increase emissions. Thus, it is crucial for transportation engineers and traffic system operators to understand the causes of traffic breakdown and develop strategies to manage and mitigate it.
Researchers have conducted studies and analysis on traffic breakdown events. By analyzing the traffic flow before breakdown events, researchers have constructed probabilistic models linking the traffic flow and the probability of the occurrence of a breakdown event. As the available traffic data becomes more abundant, researchers have discovered that traffic breakdown occurrences are related not only to traffic flow rate but also to other factors. However, previous probabilistic models usually considered only one variable. With the advancements in machine learning techniques in recent years, researchers have started using neural networks to predict traffic breakdown events and have achieved high accuracy in predicting their occurrences. Given the advantages of neural networks, the model can incorporate multiple variables considering temporal and spatially correlated data. Currently, no research considers the impact of traffic flow from ramps on breakdown occurrences using neural networks.

2. Related Work

Previous studies have shown that the occurrence of traffic breakdowns is stochastic in nature [3,4,5,6,7]. Furthermore, a breakdown event can occur at different flow levels rather than at a predetermined threshold value (i.e., capacity). In particular, the probability of a breakdown occurrence follows an ‘S’ shape as a function of traffic flow [7]. Parametric [5,8] and nonparametric [9,10] methods have been adopted to represent the survival rate based on pre-breakdown flow rates.
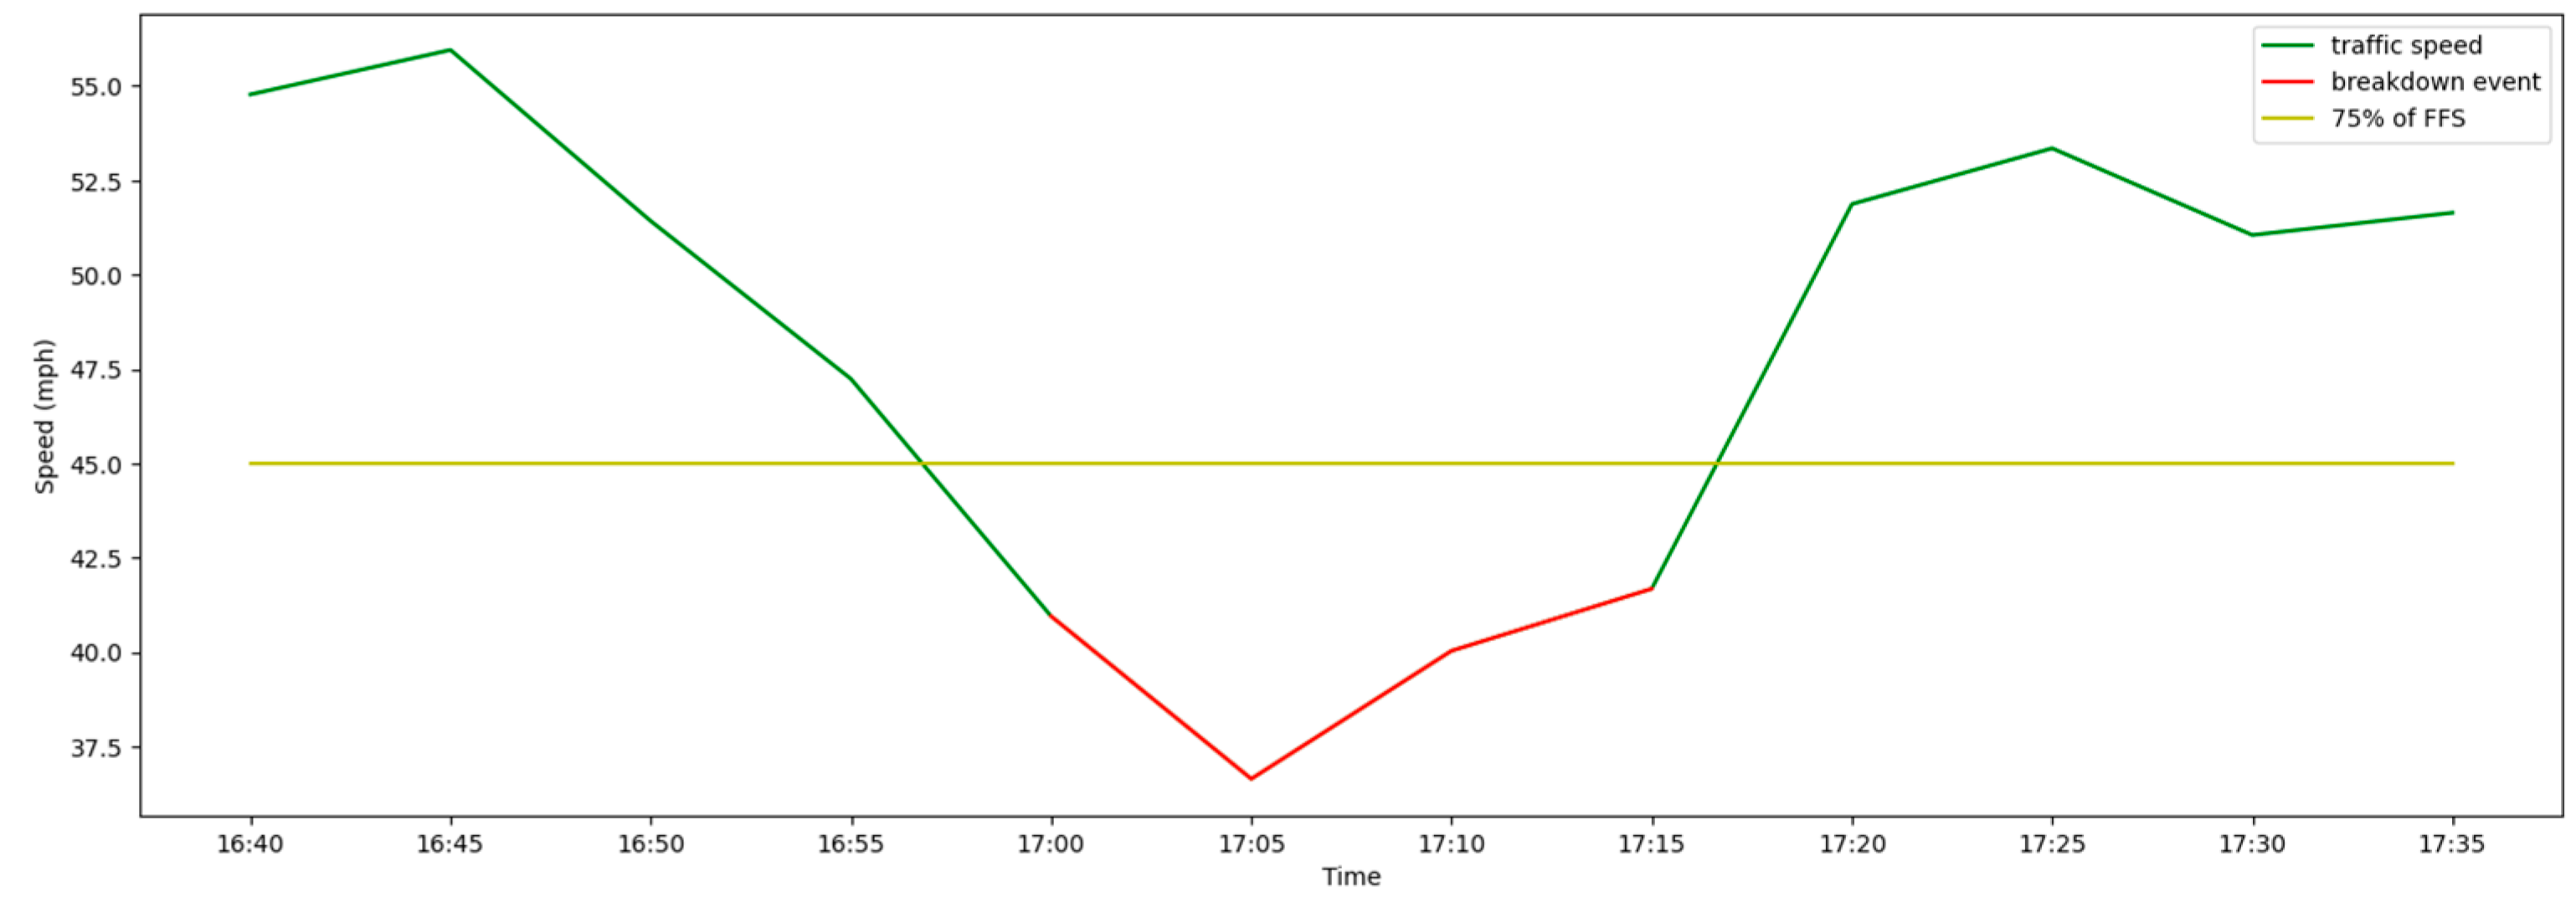
Due to the diversity in traffic design and traffic characteristics specific to each location, several methods have been used to identify breakdowns in previous research. First, a speed threshold was used to identify breakdown events in [6]. The threshold is determined for each study site based on geometric and traffic conditions. Dong and Mahmassani [5] defined the threshold speed as 10 mph below the free flow speed. Filipovska and Mahmassani [11] used a 20% threshold below the prevailing free flow speed. Second, traffic breakdowns were identified by sudden speed drops. For example, ref. [6] proposed using a speed drop of 6 miles per hour and below 45 miles per hour in consecutive time intervals of 5 min as a threshold to detect a breakdown event. The third method, known as the volume-occupancy correlation method, identifies breakdowns by requiring a correlation between traffic volume and occupancy that satisfies a minimum threshold over a sustainable period of time [12].
Once researchers have selected the breakdown identification method and gained access to additional data, they initiated the search for factors other than traffic volume that influence the occurrence of traffic breakdowns and found that in addition to flow rates, other factors, such as adverse weather conditions [13], incident [14] and merging behavior [15] have been found to influence probabilities of traffic breakdown. Maze et al. [13] investigated the relationship between weather, traffic density and capacity, and they found that in adverse weather conditions, drivers tend to increase their following distances and decrease their driving speeds, resulting in a decrease in throughput. This has also been supported in the research of Kamiska and Chalfen [16]. They highlighted the direct impact of vehicle spacing on speed by simulation. Specifically, when time headway increases from 1 s to 4 s, the average travel time will experience a 35.6% increase. By constructing a probability model of traffic breakdown, they found that, at the same levels of traffic flow, the probability of breakdown occurring on a rainy day is significantly higher than on a sunny day [4]. The other factor that has been shown to have an impact on breakdown events is incident. Wright et al. [14] analyzed the impact of traffic incidents on travel time reliability on freeways using historical incident data. The analysis revealed that an incident on the shoulders increases the probability of traffic breakdowns because they reduce the capacity of a freeway segment and generate a temporary bottleneck. Furthermore, in the merge segments of the freeways, the traffic condition is influenced by ramp traffic. Therefore, the merging behavior and the flow rate on the ramp can affect the characteristics of traffic breakdown such as the critical flow rate and the phenomenon of congestion [15].
Because the occurrence of traffic breakdown can be attributed to various factors, researchers have included multiple features in building breakdown prediction models. For example, speed and occupancy were used to construct a bivariate Weibull distribution to model the probability of breakdown [17]. In recent years, machine learning algorithms have been used to predict the occurrence of breakdowns and have achieved high accuracy [11,18]. In particular, Filipovska and Mahmassani [11] proposed a machine learning algorithm to predict the occurrence of traffic breakdowns considering spatial and temporal correlations in traffic data. They showed that the machine learning method outperformed the probabilistic models in terms of short-term breakdown prediction with an accuracy of 98% from the machine learning method, compared to 65% accuracy from the probabilistic model. Zechin and Cybis [18] predicted the occurrence of traffic breakdown by building a neural network to forecast speed. Then they used the Bayesian approximation to compute the probability of the breakdown event. Their model has an accuracy of 89% in predicting the occurrence of breakdowns and can evaluate the uncertainty of the predictions.
Compared to traditional probabilistic models, the advantage of machine learning lies in its ability to accommodate more features and assess the impact of each feature on model performance through self-learning. Machine learning algorithms have been used in various aspects of the field of transportation engineering. Lu et al. [19] combined the autoregressive integral moving average (ARIMA) and long-short-term memory (LSTM) neural network to predict the short-term traffic flow rate and achieve the average test error at 6.5%. Alqatawna et al. [20] used ANN to estimate traffic accident frequencies and have shown that the neural network can provide results close to the true value. Although a machine learning algorithm has been used to predict the occurrence of traffic breakdowns (e.g., [11]), previous research did not consider the traffic condition of the on-ramps when building breakdown prediction models. On-ramp traffic has been shown to have an impact on mainline traffic flow, especially when the inflow rate of ramps is high. Additionally, merging traffic tends to increase the probability of traffic breakdowns [15,21]. Consequently, dynamic ramp meters generally use the traffic density of the mainline as a trigger threshold to ensure that the density of the mainline remains within an acceptable range [22]. By stabilizing traffic flow, ramp meters reduce emissions. Bae et al. [23] compared traffic conditions before and after ramp meters were installed and demonstrated that hourly CO2 can have 7.3% reduction. However, due to the stochastic nature of traffic breakdown, the existing ramp meter design cannot account for the probability of a breakdown.
Therefore, in this paper, neural networks were used to predict the probability of breakdown events considering the spatial and temporal characteristics of the traffic conditions of upstream segments, downstream segments, and on-ramps. By incorporating ramp flows into the breakdown prediction model, the proposed approach sheds light on the new ramp meter design aimed at reducing the probability of flow breakdown on the mainline.
The remainder of the paper is organized as follows. The next section presents the data description and traffic breakdown identification method, followed by the methodologies of feature selection, machine learning model, hyperparameter, and performance measurements. Then, a discussion of the results of model performance is presented. The final section discusses concluding remarks and future research.

3. Data Description

3.1. Study Site

The study site consists of two sections. The first section is a 3-mile freeway section in Des Moines, IA, USA and has three stationary sensors installed along Interstate 235 (I-235). The second section contains one stationary sensor located along Interstate 80/35 (I-80/35) at mile marker 126. These sensors collect vehicle count, speed, and lane occupancy for mainline and ramp traffic at one-minute intervals. The locations of the stationary sensors in the first section are shown as red dots in Figure 1 and the sensor from the second section is shown as a blue dot. Utilizing the three sensors in the first section serves the purpose of developing and validating the model. For this section, traffic data is divided into training and testing sets based on time periods. In particular, the training subset consists of data from March to May 2022, while the validating subset comprises data from June and July 2022. The second section has purpose of evaluating the performance and effectiveness of the model in other locations except those that were originally utilized for generating model. To show the accuracy and applicability of the model to other locations, the traffic data from this section were collected from March 2023. The inductive capacity of a model can be effectively validated by testing it at a location that is not included in the training process. As traffic breakdown typically occurs during peak hours in the evening at these locations, this study focuses on peak hours in the evening (4 p.m. to 7 p.m.) during the week. Traffic data is aggregated into 5-min time intervals for subsequent analysis.

3.2. Identification of Traffic Breakdowns

This paper adopts the traffic categorization described in the Highway Capacity Manual (HCM) 2022 [24]. Specifically, the criteria considered are a sudden drop in speed of at least 25% below the free-flow speed for a sustained period of at least 15 min. For the study area, all sensors are located on urban freeways. According to the HCM, the free-flow speed can be estimated as 5 miles per hour above the posted speed limit.
A breakdown event is illustrated in Figure 2. The speeds in the 5-min time interval are plotted in the green curve. The yellow horizontal line shows 75% of the free flow speed, which is the threshold for the breakdown speed. If the average speed remains below this threshold for a continuous period of 15 min or more, it is defined as a breakdown event, as indicated by the red portion of the speed curve.

3.3. Temporal and Spatial Data

The stationary sensors installed on the highway collect traffic information from the corresponding road segments. Previous research has demonstrated the temporal and spatial correlation of traffic conditions in adjacent roadway segments [11,21]. Therefore, traffic data from upstream, downstream, and ramps, from current and previous time intervals, have been collected for each segment of the roadway. A universal symbol is used to represent the traffic data:
x t i
where:
  • x are traffic data such as flow rate (q), average speed (v), or average occupancy (o).
  • t is the timestamp. Since the data are aggregated into 5-min intervals, t − 1 indicates 5 min before the current timestamp t.
  • i indicates the segment of the road. The available values can be upstream (up), current (curr), downstream (down), or on-ramp (ramp).

3.4. Upsampling

To construct a model to predict the occurrence of a traffic breakdown in a road segment in the next time interval, binary indicators are assigned to each road segment and each time interval, indicating the occurrence of a traffic breakdown. Specifically, the time intervals during which traffic breakdown occurs are assigned as 1, while the time intervals during which traffic breakdown does not occur are designated as 0. As the purpose of this study is to predict the occurrence of a breakdown, the time intervals within the breakdown period, except for the one with the onset of a breakdown, are not used to construct the model.
The distribution of indicators in the training subset is imbalanced, as shown in Table 1. This is because only one time interval is labeled as 1 for each traffic breakdown event, while all other time intervals where the breakdown did not occur are labeled as 0. The presence of an imbalance in the distribution of labels can cause a model to prioritize majority labels over minority labels to achieve maximum accuracy. Ando and Huang [25] illustrated that neural networks tend to overfit when a model is used directly in an imbalanced data set. Incorporating feature selection prior to upsampling also improves the robustness of the model. Thus, to avoid overfitting problems, an upsampling mechanism is applied by randomly selecting data from the minority class and replicating it until the number of minority samples is equivalent to that of the majority class [26].

4. Methodology

4.1. Overview

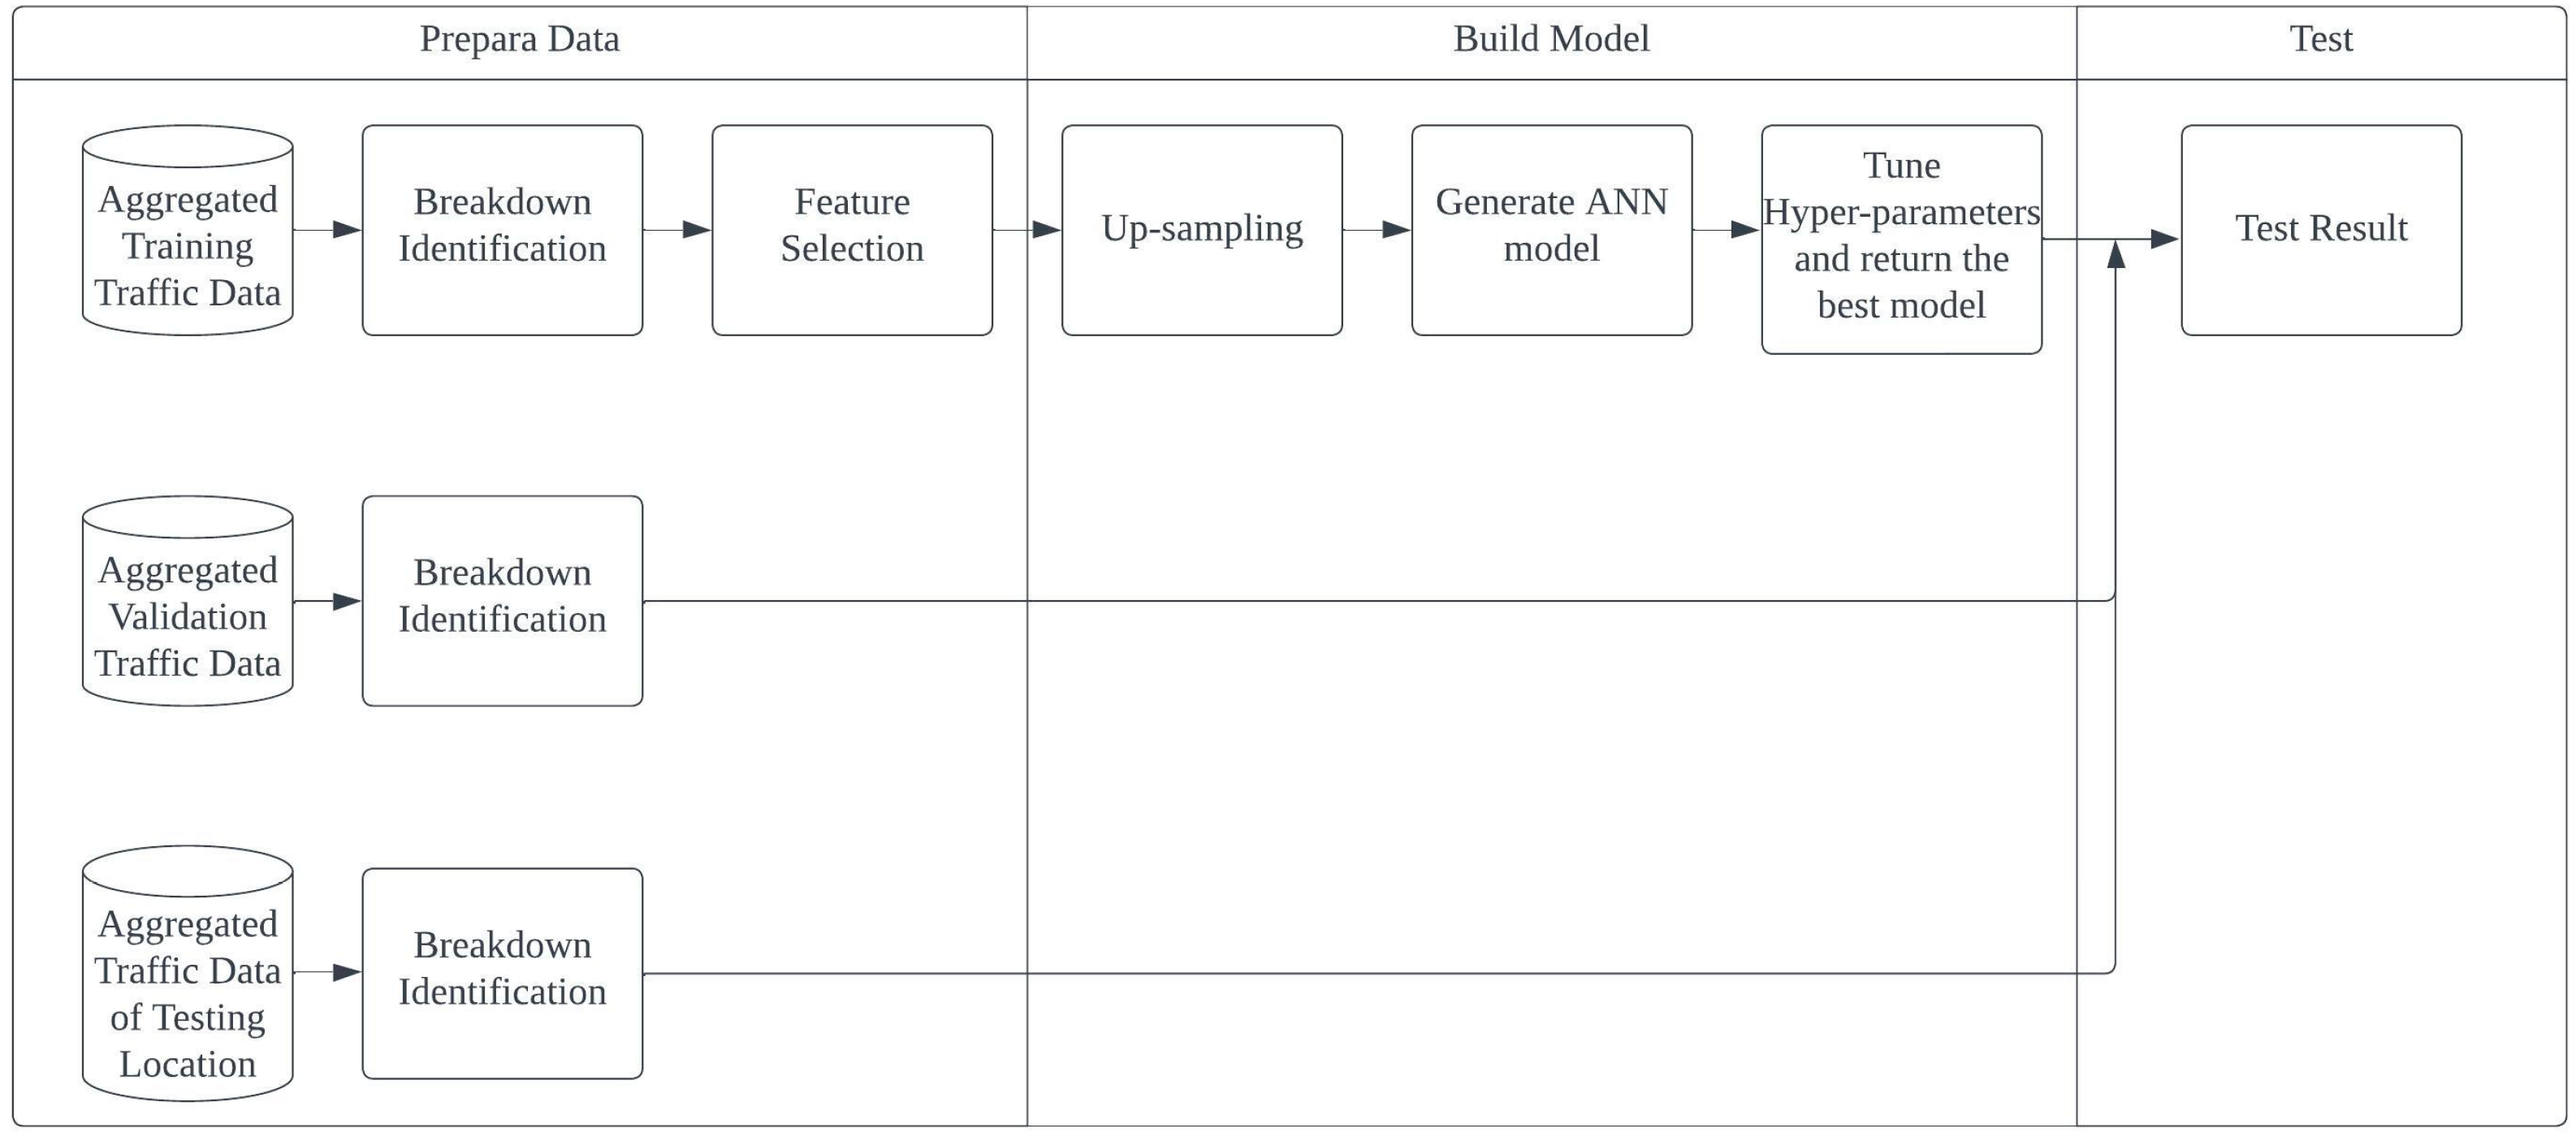
The research process is summarized in Figure 3. After data pre-processing, feature selection is performed to determine the variables to be included in the prediction model. Then, an artificial neural network model is constructed. The hyperparameters of the ANN model are tuned to achieve maximum training accuracy. Finally, the performance of the model is evaluated by applying the optimal model to the test dataset.

4.2. Feature Selection

To improve the accuracy of the model and reduce computational costs, this study uses the Boruta feature selection method to select the variables to be incorporated into the breakdown prediction model. Boruta is a feature selection algorithm that utilizes the random forest framework to identify significant features in a data set. Compared to traditional random forests, Boruta has the advantage of not requiring manually defining the threshold of feature importance [27]. Instead, it utilizes random forests to obtain an importance hit and selects variables with importance values higher than the hit. This approach is more effective, as it eliminates the subjective nature of manually setting a threshold and allows for a more objective and data-driven selection process. Boruta first creates shadow features that are randomized copies of the dataset and appends them to the original dataset. It then creates a random forest to obtain the importance of all features and compares the importance of the original features to the importance of the shadow ones. Original features of greater importance than the maximum importance of shadow features are considered significant. This approach provides robust feature selection results that can handle noisy and correlated data. In this paper, we employ not only the traffic data directly collected from the sensors, but also the differences between the features of the traffic data from consecutive time intervals (such as q t curr q t - 1 curr ) and adjacent segments (such as q t curr q t down ) to analyze the impact of the changes in traffic conditions on the occurrence of breakdown events.

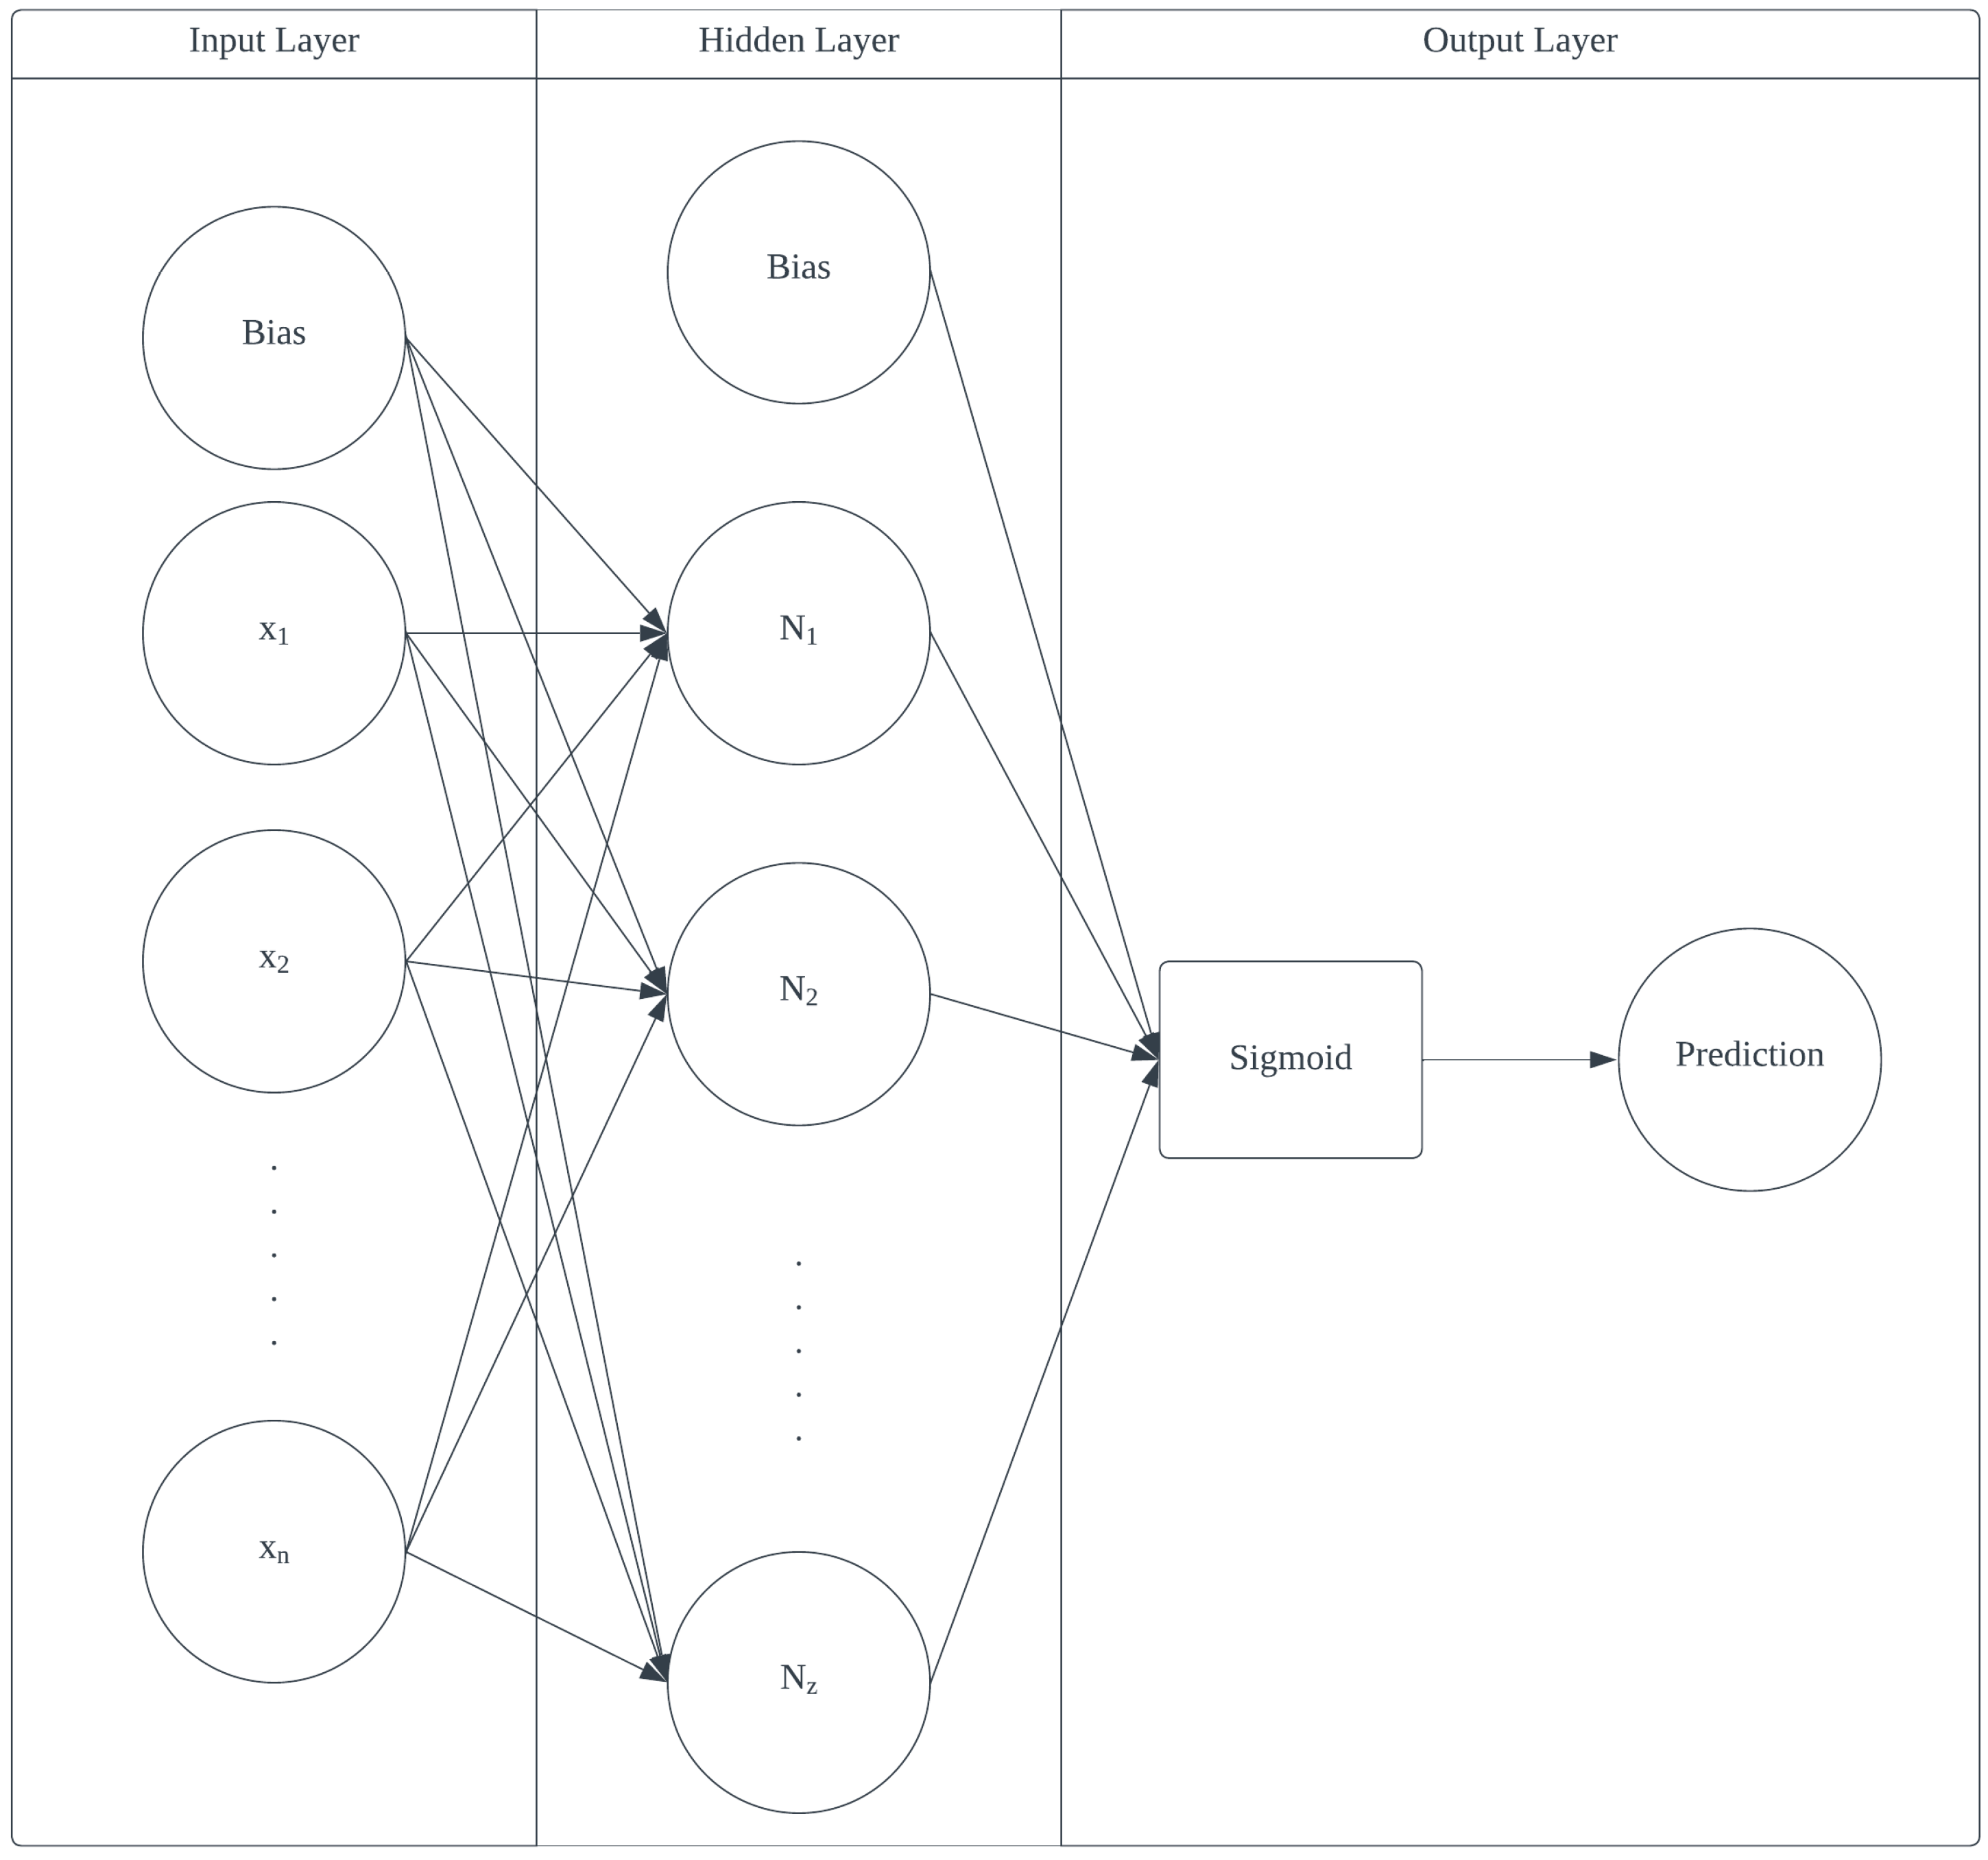
4.3. Artificial Neural Network (ANN)

A supervised feedforward artificial neural network (ANN) is adopted to predict the occurrence of a traffic breakdown in the next time interval. The typical structure of an ANN consists of an input layer, one or more hidden layers, and an output layer.
The input layer serves as the first stage of neural network processing to receive training data. Typically, this layer includes a bias neuron, which provides the network with the ability to horizontally shift the activation function. This enables the modeling of a diverse range of input-output relationships. As a result, the number of neurons in this layer is equal to the number of input features plus one.
The hidden layers consist of multiple neurons, each of which receives inputs from the previous layer and applies a non-linear activation function to generate its output. In the hidden layer, there is also a neuron that serves as a bias. Its function is similar to that of the bias in the input layer and introduces a shift in the data. The number of hidden layers can vary depending on the complexity of the problem, but usually should not exceed two. In this paper, we purposed an ANN model that contains one hidden layer with Rectified Linear Unit (ReLU) activation function. ReLU applies the function f(x) = max (x, 0) to the input x, resulting in an output of 0 for all negative inputs and an output equal to the input for all nonnegative inputs.
The primary function of the output layer is to produce the final output of the network, which is then compared with the desired output to compute the error signal. The number of neurons and the activation function in the output layer are determined by the problem-specific characteristics. As the intended model is for binary classification, the model architecture comprises a single neuron with sigmoid activation function. The sigmoid function is commonly utilized for binary classification purposes. The mathematical expression for the sigmoid function is as follows.
σ ( x ) = 1 1 + e x
The sigmoid function is an S-shaped curve and maps the input value from 0 to 1.
In the backpropagation algorithm, the error signal from the output layer is propagated backward through the network. The weights of the connections between neurons are iteratively adjusted to minimize the difference between the predicted and actual output. The proposed design of the ANN model is shown in Figure 4.

4.4. Hyperparameter Optimization

When constructing an ANN model, pre-defined model parameters, also known as hyperparameters, are provided. Hyperparameters are variables such as the number of layers, the number of neurons in the hidden layer, the batch size, and the number of training epochs. The selection of these parameters affects the performance of the ANN model. Therefore, this paper employed the grid search approach to systematically identify hyperparameters that yield optimal performance. Before conducting a grid search, it is necessary to define the hyperparameters. The grid search then utilizes the model with predefined values to explore the model hyperparameters that yield the optimal results through training and evaluation.
Candidate values of the hyperparameters are shown in Table 2. The horizon timestamp represents the number of time intervals before the occurrence of the breakdown. For example, when the value of the horizon timestamp is 1, the model only selects the traffic conditions from the previous 5 min before the breakdown to predict the probability of event occurrence. When the value is 2, the model will use the information from the previous 10 min.

4.5. Performance Measures

The confusion matrix is adopted to assess the accuracy of the classification model. The confusion matrix, as shown in Table 3, indicates the classification accuracy of a model using four metrics known as true positives, true negatives, false positives, and false negatives.
  • True Positive (TP): instances correctly identified as positive class.
  • True Negative (TN): instances correctly identified as the negative class.
  • False Positive (FP): instances incorrectly identified as positive class whereas the true label is negative.
  • False Negative (FN): instances incorrectly identified as negative class, whereas the true label is positive.
Using the confusion matrix, we can calculate the accuracies of each label and the overall accuracy, as follows.
  • The accuracy of the positive label can be calculated as TP/(TP + FP).
  • The accuracy of the negative label can be calculated as TN/(FN + TN).
  • The overall accuracy of the model can be calculated using (TP + TN)/(TP + FP + FN + TN).

5. Results and Discussion

5.1. Feature Selection

Table 4 presents the features selected by the Boruta feature selection method. It can be seen that Boruta only recommends speed and occupancy for the current location and does not include traffic volume. For ramps, the traffic flow rate, speed, and occupancy have been selected, indicating that the traffic condition of the on ramp has significant impacts on the probability of traffic breakdown. This suggests that to predict the occurrence of traffic breakdown in the merge section of the highways, it is necessary to consider the traffic conditions on the ramp in addition to those on the mainline. At the same time, this also suggests the potential of ramp metering to prevent traffic breakdown or alleviate its impact. The result of the feature selection also recommends the traffic flow rate of the upstream segment, the speed of the previous timestamp on the current segment, the speeds of the downstream segment, and the occupancy of the upstream and downstream segments. For changes in traffic flow parameters, Boruta chooses changes in flow and occupancy from the upstream, current, and downstream segments. These recommended features are used for the selection of hyperparameters and for the design of the ANN model.

5.2. Hyperparameters

Table 5 shows the hyperparameters determined by the grid search method, which searches exhaustively through a predetermined subset of the hyperparameter space of the ANN algorithm. In particular, the horizon timestamp indicates the number of previous time intervals used to predict the occurrence of a traffic breakdown in the next time interval. The training accuracy obtained by the grid search algorithm shows that the model trained with previous 3-time intervals provides the highest accuracy. This indicates that the occurrence of a traffic breakdown is highly correlated with changes in traffic state during the preceding 15 min.
The neural network model is built using these hyperparameters and the features recommended by the Boruta feature selection algorithm. The model has a one hidden layer with 20 neurons and is trained on 16 training samples in one pass with the previous three time intervals for each training.

5.3. Model Performance

The training and validation accuracies are presented in Table 6. Using optimized hyperparameters, the ANN can learn the training samples and predict the occurrence of a traffic breakdown with 100% accuracy on both the training and the validation datasets. For non-breakdown cases, the prediction accuracy is 94% on training data and 96% in validation data. The overall accuracies in the training and testing data sets are higher than 97% and 96%, respectively. The high accuracy of the validation results indicates that despite the distinct traffic patterns from different months for the training and validation sets, the neural network is capable of learning and predicting the occurrences of traffic breakdown utilizing temporal and spatial variations in the traffic data. Moreover, this result signifies that the neural network model does not experience an overfitting issue.
Table 7 presents the predicted results of the model for the testing location. By employing the same variables and model, both breakdown and non-breakdown events exhibit a high level of predictive accuracy. In particular, the accuracy of predicting breakdown and non-breakdown events is 87.5% and 97.9%, respectively. The high accuracy indicates that ANN can effectively predict the occurrence of traffic breakdowns by taking advantage of temporally and spatially distributed traffic data.

6. Conclusions

Traffic breakdown disrupts the stable flow of traffic on the freeway. Merging traffic on the ramp tends to reduce traffic speeds on the mainline, potentially leading to traffic breakdown. Therefore, an ANN-based model is proposed to predict the occurrence of traffic breakdowns on freeways considering the impact of adjacent road segments and ramps.
The ANN model uses spatial and temporal traffic data from mainline and on-ramps to predict the occurrence of traffic breakdowns. The Boruta feature selection method is used to select features to construct the ANN model. Specifically, the Boruta method recommends including on-ramp traffic volume, speed, and occupancy as input variables, as they are strongly associated with the occurrence of traffic breakdown on the mainline. When the training accuracy obtained from the grid search method is compared, the number of neurons in the hidden layer, the batch size, and the number of previous timestamps required for the model are determined and used in the final ANN model.
The results show that the proposed ANN model has the ability to predict the occurrence of a traffic breakdown event with high accuracy. The ANN model can be applied by transportation agencies for ramp meter activation, as the results of feature selection indicate that traffic from the on-ramps has a significant impact on the occurrence of traffic breakdown. Based on ANN-based prediction of traffic breakdown events, transportation agencies can use real-time traffic data and regulate ramp metering rate to mitigate the impact of the breakdown or prevent it from occurring. Therefore, this mechanism provides a new approach to designing ramp metering systems. Another potential application for the proposed model is the travel information system. By predicting the occurrence of traffic breakdowns, the travel information and navigation system can alter the routes of drivers. Furthermore, if the model predicts that traffic breakdown is occurring, this information can be provided to the safety service patrol, allowing them to deploy proactively to the location where the breakdown is likely to occur.

7. Limitation and Future Work

This study has several limitations. First, the methodology can only be applied to locations with stationary sensors. Other data forms, such as probe-based data, cannot be utilized directly. Second, the model parameters incorporate data from both upstream and downstream sensors. If the distance between adjacent sensors is too far, the correlation may decrease, resulting in loss of the prediction accuracy of the model. In addition, special events or incidents are not excluded from the dataset. These events can act as outliers in the model, and excluding them would improve the model performance. Lastly, if the research time period is extended to the entire year, it would be necessary to consider weather factors in both feature selection and model generation.
Future studies include investigating additional parameters, such as special events and weather factors, that have an impact on the occurrence of traffic breakdowns; constructing the mode using alternative data type; enhancing the existing neural network model or exploring alternative approaches to improve the accuracy of estimation; and extending the model to other locations to evaluate model performance in other scenarios. Ultimately, this work will provide an activation trigger for any ramp meter to alleviate traffic breakdown.

Author Contributions

Conceptualization, Y.Z. and J.D.-O.; methodology, Y.Z. and J.D.-O.; software, Y.Z.; validation, Y.Z.; formal analysis, Y.Z.; investigation, Y.Z. and J.D.-O.; data curation, Y.Z.; writing—original draft preparation, Y.Z.; writing—review and editing, J.D.-O.; project administration, J.D.-O.; funding acquisition, J.D.-O. All authors have read and agreed to the published version of the manuscript.

Funding

This research was funded by the ‘Dwight David Eisenhower Transportation Fellowship Program (DDETFP) Graduate Fellowship’ under award no. 693JJ32345077 and the ‘Iowa Department of Transportation’.

Data Availability Statement

Data supporting the reported results can be found on the Iowa Department of Transportation open data portal. https://public-iowadot.opendata.arcgis.com/ (accessed on 1 May 2023).

Conflicts of Interest

The authors declare no conflict of interest. The funders had no role in the design of the study; in the collection, analyses, or interpretation of data; in the writing of the manuscript; or in the decision to publish the results.

References

  1. Kerner, B.S. Criticism of generally accepted fundamentals and methodologies of traffic and transportation theory: A brief review. Phys. A Stat. Mech. Its Appl. 2013, 392, 5261–5282. [Google Scholar] [CrossRef]
  2. Kerner, B.S. Microscopic theory of traffic-flow instability governing traffic breakdown at highway bottlenecks: Growing wave of increase in speed in synchronized flow. Phys. Rev. E 2015, 92, 62827. [Google Scholar] [CrossRef] [PubMed] [Green Version]
  3. Chen, X.M.; Li, Z.; Li, L.; Shi, Q. A traffic breakdown model based on queueing theory. Networks Spat. Econ. 2014, 14, 485–504. [Google Scholar] [CrossRef]
  4. Kim, J.; Mahmassani, H.S.; Dong, J. Likelihood and duration of flow breakdown: Modeling the effect of weather. Transp. Res. Rec. 2010, 2188, 19–28. [Google Scholar] [CrossRef] [Green Version]
  5. Dong, J.; Mahmassani, H.S. Stochastic modeling of traffic flow breakdown phenomenon: Application to predicting travel time reliability. IEEE Trans. Intell. Transp. Syst. 2012, 13, 1803–1809. [Google Scholar] [CrossRef]
  6. Brilon, W.; Geistefeldt, J.; Regler, M. Reliability of freeway traffic flow: A stochastic concept of capacity. In Proceedings of the 16th International Symposium on Transportation and Traffic Theory, College Park, MD, USA, 19–21 July 2005; Citeseer: University Park, PA, USA, 2005; Volume 125143. [Google Scholar]
  7. Xu, T.; Hao, Y.; Peng, Z.; Sun, L. Modeling probabilistic traffic breakdown on congested freeway flow. Can. J. Civ. Eng. 2013, 40, 999–1008. [Google Scholar] [CrossRef]
  8. Dong, J.; Mahmassani, H.S. Flow breakdown and travel time reliability. Transp. Res. Rec. 2009, 2124, 203–212. [Google Scholar] [CrossRef]
  9. Dong, J.; Mahmassani, H.S. Flow breakdown, travel reliability and real-time information in route choice behavior. In Transportation and Traffic Theory 2009: Golden Jubilee: Papers Selected for Presentation at ISTTT18, a Peer Reviewed Series Since 1959; Springer: Berlin/Heidelberg, Germany, 2009; pp. 675–695. [Google Scholar]
  10. Kaplan, E.L.; Meier, P. Nonparametric estimation from incomplete observations. J. Am. Stat. Assoc. 1958, 53, 457–481. [Google Scholar] [CrossRef]
  11. Filipovska, M.; Mahmassani, H.S. Traffic flow breakdown prediction using machine learning approaches. Transp. Res. Rec. 2020, 2674, 560–570. [Google Scholar] [CrossRef]
  12. Kerner, B.S. The physics of traffic. Phys. World 1999, 12, 25. [Google Scholar] [CrossRef]
  13. Maze, T.H.; Agarwal, M.; Burchett, G. Whether weather matters to traffic demand, traffic safety, and traffic operations and flow. Transp. Res. Rec. 2006, 1948, 170–176. [Google Scholar] [CrossRef]
  14. Wright, B.; Zou, Y.; Wang, Y. Impact of traffic incidents on reliability of freeway travel times. Transp. Res. Rec. 2015, 2484, 90–98. [Google Scholar] [CrossRef]
  15. Kerner, B.S.; Klenov, S.L. Probabilistic breakdown phenomenon at on-ramp bottlenecks in three-phase traffic theory. Transp. Res. Rec. 2006, 1965, 70–78. [Google Scholar] [CrossRef]
  16. Kamińska, J.A.; Chalfen, M. The effect of distances between vehicles on time and speed in simulated traffic flow. Roads Bridg. Most. 2017, 16, 163–176. [Google Scholar]
  17. Chow, A.H.F.; Lu, X.-Y.; Qiu, T.Z. Empirical Analysis of Traffic Breakdown Probability Distribution with Respect to Speed and Occupancy; UC Berkeley Transportation Library: Berkeley, CA, USA, 2009. [Google Scholar]
  18. Zechin, D.; Cybis, H.B.B. Probabilistic traffic breakdown forecasting through Bayesian approximation using variational LSTMs. Transp. B Transp. Dyn. 2023, 11, 1–19. [Google Scholar] [CrossRef]
  19. Lu, S.; Zhang, Q.; Chen, G.; Seng, D. A combined method for short-term traffic flow prediction based on recurrent neural network. Alexandria Eng. J. 2021, 60, 87–94. [Google Scholar] [CrossRef]
  20. Alqatawna, A.; Álvarez, A.M.R.; García-Moreno, S.S.-C. Comparison of multivariate regression models and artificial neural networks for prediction highway traffic accidents in spain: A case study. Transp. Res. Procedia 2021, 58, 277–284. [Google Scholar] [CrossRef]
  21. Yang, M.; Li, Z.; Ke, Z.; Li, M. A deep reinforcement learning-based ramp metering control framework for improving traffic operation at freeway weaving sections. In Proceedings of the Transportation Research Board 98th Annual Meeting, Washington, DC, USA, 13–17 January 2019; pp. 13–17. [Google Scholar]
  22. Papageorgiou, M.; Kotsialos, A. Freeway ramp metering: An overview. IEEE Trans. Intell. Transp. Syst. 2002, 3, 271–281. [Google Scholar] [CrossRef]
  23. Bae, S.-H.; Heo, T.-Y.; Ryu, B.-Y. An evaluation of the ramp metering effectiveness in reducing carbon dioxide emissions. Simulation 2012, 88, 1368–1378. [Google Scholar] [CrossRef]
  24. National Academies of Sciences, Engineering, and Medicine. Highway Capacity Manual 7th Edition: A Guide for Multimodal Mobility Analysis; National Academies of Sciences, Engineering, and Medicine: Keck Center, NW, USA, 2022. [Google Scholar]
  25. Ando, S.; Huang, C.Y. Deep over-sampling framework for classifying imbalanced data. In Proceedings of the Machine Learning and Knowledge Discovery in Databases: European Conference, ECML PKDD 2017, Part I 10, Skopje, Macedonia, 18–22 September 2017; Springer: Berlin/Heidelberg, Germany, 2017; pp. 770–785. [Google Scholar]
  26. Visa, S.; Ralescu, A. Experiments in guided class rebalance based on class structure. In Proceedings of the Midwest Artificial Intelligence and Cognitive Science Conference MAICS 2004, Chicago, IL, USA, 16–18 April 2004; Citeseer: University Park, PA, USA, 2004. [Google Scholar]
  27. Kursa, M.B.; Rudnicki, W.R. Feature selection with the Boruta package. J. Stat. Softw. 2010, 36, 1–13. [Google Scholar] [CrossRef] [Green Version]
Figure 1. Study site and sensor location.
Algorithms 16 00298 g001
Figure 2. Traffic breakdown example (data collected at I-235 WB mile maker 7, on 5 February 2022).
Algorithms 16 00298 g002
Figure 3. Flow chart of the research process.
Algorithms 16 00298 g003
Figure 4. ANN model design.
Algorithms 16 00298 g004
Table 1. Distribution of breakdown event indicators in the training subset.
Original Data Count
Non-breakdown11,632
Breakdown34
Table 2. Hyperparameter candidates.
Neuron CountBatch SizeHorizon Timestamp
10161
20322
30643
Table 3. Confusion matrix.
Prediction LabelPositiveNegative
True Label
PositiveTPFP
NegativeFNTN
Table 4. Selected Features.
SymbolDescriptionSymbolDescription
v t c u r r Speed of the current segment k t u p Upstream occupancy
k t c u r r Occupancy of the current segment k t d o w n Downstream occupancy
r a m p   q t c u r r On-ramp flow rate Δ q t 1 c u r r q t c u r r q t 1 c u r r
r a m p   k t c u r r On-ramp occupancy Δ q t d o w n q t c u r r q t d o w n
r a m p   v t c u r r On-ramp speed Δ q t u p q t c u r r q t u p
q t u p Upstream flow rate Δ k t u p k t c u r r k t u p
v t 1 c u r r Speed of current segment in the previous time interval Δ k t d o w n k t c u r r k t d o w n
v t d o w n Downstream speed Δ k t 1 c u r r k t c u r r k t 1 c u r r
Table 5. Selected Hyperparameters.
Neuron CountBatch SizeHorizon Timestamp
20163
Table 6. Training and validation accuracy.
BreakdownNon-BreakdownOverall
Training Accuracy100%94.39%97.17%
Validation Accuracy100%96.40%96.41%
Table 7. Testing accuracy.
Predicted LabelBreakdownNon-BreakdownAccuracy
True Label
Breakdown14287.5%
Non-breakdown24111897.90%
Overall 97.75%
Disclaimer/Publisher’s Note: The statements, opinions and data contained in all publications are solely those of the individual author(s) and contributor(s) and not of MDPI and/or the editor(s). MDPI and/or the editor(s) disclaim responsibility for any injury to people or property resulting from any ideas, methods, instructions or products referred to in the content.

