1. Introduction
In today’s world of fast-growing technology and an inexhaustible amount of data, there is a great need to control and verify data validity due to the possibility of fraud. Therefore, the need for a reliable form of detection of such content is not surprising. Some of the ways in which deception manifests itself on the Internet are using identity deception, mimicking data and processes for the purpose of stealing credit card numbers or other private information, charging false invoices for services not performed, hacking sites, offering false excuses and promises, false advertising, spreading propaganda and false information, and other forms of fraud. Therefore, detecting deception, whether in face-to-face interaction or while communicating through a certain medium, is of great importance.
The great need to find a reliable method for deception detection is even more emphasized due to the fact that people tell approximately two lies per day [
1]. Lying is undoubtedly a skill that is deeply rooted in the human existence, and it has been perfected over the years to a level that is difficult to recognize by even the most experienced professionals. The question is what makes the distinction between truth and lies/deception, especially in the verbal aspect, and if it exists, what is the best way to determine it? Do most of the information lie in non-verbal behavior, or are there certain linguistic patterns that can serve as sufficiently precise indicators of deception? Is there a difference in deception during face-to-face and computer-mediated communication, whether synchronous or asynchronous, verbal or non-verbal?
Research so far has led to the conclusion that verbal behavior hides a deep amount of information that can be used in the detection of deception, almost more accurately than in the case of non-verbal analysis. Due to the inapplicability of the polygraph method to deception detection in computer-mediated communication, there is an increasing emphasis on research in methods for analyzing the syntactic and semantic properties of written text and finding indicators of deception in various forms of digital interaction. So far, the most commonly used methods of deception detection in the text are machine learning models. There is a great need for further research into syntactic, semantic, and other properties of natural languages in order to create software that will detect deception with high accuracy.
Current research covers deception detection in computer-mediated communication [
2,
3]; detection of fake reviews on social platforms [
4,
5]; deception detection collected from public trials [
6,
7]; the use of crowdsourcing platforms, such as Amazon Mechanical Turk, for generating deception datasets [
5,
8]; etc. In their work, Feng and colleagues [
5] also analyzed the deep syntax of the data using the principles of probabilistic context-free grammar (PCFG), independently and in combination with the aforementioned methods. In addition to the above, the LIWC tool was also used for deception detection by leveraging insight into the psycho-linguistic characteristics of the analyzed text.
In this paper, several different machine learning models were used and their performance in differentiating deceptive and true text was tested. Two sets of data were collected using the crowdsourcing platform Clickworker and the survey tool Qualtrics Survey. For data processing, n-grams, LIWC, and a combination of the two approaches were used. A selection of essential features for each model was carried out over the LIWC dimensions using the WEKA tool in order to obtain subsets of features with which the models provide the highest accuracy. Since two distinct datasets on two topics were created, they were used to train their own separate models. These models were then tested on their own data, but they were also cross-tested on the data they were not trained with. Furthermore, both datasets were combined to create a joint dataset on deceptive text, which was then used to test both models. The performance of the models was examined in order to gain insight into the possibility of model generalization and its applicability to different datasets. This gave insight into model parameters with the highest accuracy in predicting deception. The possibility of deception detection using natural language processing methods was also tested in order to ascertain which methods give the best performance in a generalization or applicability to other datasets than the ones they were trained upon; additionally, it was to decide which method gives the best predictions in general.
2. Theoretical Background
2.1. Lie and Deception
To deceive means “to lie, mislead or otherwise hide or distort the truth”. Although the term lie is often regarded similar to the term deception, there is a certain distinction between the two. Lying is just one of many forms of deception, which does not only mean uttering an untrue claim, but also manifests itself in “omitting the truth or more complicated covering-up the truth” commonly with the intention to mislead or deceive someone [
8]. The traditional definition states that to deceive means “to cause to believe what is false”, which naturally leads to the question of whether this includes the case of mistakenly or unintentionally deceiving another person, on which many have conflicting views [
9]. However, the majority believes that lying and deception necessarily manifest themselves with intent, so the definition itself has been modified to define deception as “intentionally causing to have a false belief that is known or believed to be false” [
9]. The definition also implies the success of the act of deception since otherwise, the goal of creating a “false belief” in another person is not fulfilled. This is precisely one of the differences between deception and lying, where lying does not necessarily mean convincing another person was done successfully; it only refers to “making a false statement with the intention of deceiving”.
A slightly broader, generally accepted definition of lying is the following: “A lie is a statement made by one who does not believe it with the intention that someone else shall be led to believe it” [
10]. According to the stated statement, four main conditions are defined that must be fulfilled in order for a certain statement to be identified as a lie: the person should make the statement (statement condition), the person making the statement should believe that the statement is false (untruthfulness condition), an untrue statement must be given to another person—the recipient of the statement (addressee condition)—and lastly, the person making the statement must lie with the intention to convince the recipient of the statement to believe the untruthful statement to be true (intention to deceive the addressee condition) [
9]. Here, too, there are debates regarding the very definition of “lying”, and they concern the intention with which a person lies; these debates lead to two opposing groups, namely the theories of Deceptionism and Non-Deceptionism. The former group believes that intention is necessary for lying while the latter believe the opposite. The theory of Deceptionism is further divided into Simple Deceptionism, Complex Deceptionism, and Moral Deceptionism. Simple Deceptionists believe that for lying, it is necessary to make an untrue statement with the intention of deceiving another person while Complex Deceptionists additionally believe that the intention to deceive must be manifested in the form of a breach of trust or belief. Moral Deceptionism state that lying not only requires making an untrue statement with the intention of deceiving, but also violating the moral rights of another person. On the other hand, the theory of Non-Deception dictates that lying is a necessary and sufficient condition to make an untrue claim, and it is further divided into the theory of Simple Non-Deceptionism and Complex Non-Deceptionism [
9].
Unlike lying, deception itself does not only involve verbal communication, but also manifests itself through various non-verbal signs, such as leading another person to the wrong conclusion by certain behavior, using non-linguistic conventional symbols or symbols that determine similarity (icons), etc. It is also possible to deceive someone with an exclamation, a question, a command, an omission of an important statement, and even silence [
9].
This leads to the conclusion that the statement condition does not apply to deception. In the same way, the condition of untruthfulness does not apply because it is possible to deceive someone by making a true statement that intentionally implies a falsehood (e.g., using true statements to create a false belief). Sarcasm and irony are also weapons of deception that violate the condition of untruthfulness, given that a person states an obvious truth with the intention of leading another person to the opposite (false) conclusion. In addition, the stated definition of deception [
9] does not define the subject of deception as a “person”, but refers to anything that is capable of having beliefs, like infants or animals, which violates the addressee condition, which is constant in the definition of a lie. This condition is also violated, for example, in the case when a person is being eavesdropped on, which they are aware of, and uses this fact to deceive the eavesdroppers (e.g., deceiving secret service agents) [
9]. An interesting case of deception, which is not manifested in lying, is when a person, by deliberately avoiding or not accepting the truth, deceives himself or herself.
2.2. Deception in Computer-Mediated Communication (CMC)
Deception happens every day and in all forms of interaction, through face-to-face communication or through certain media such as mobile phones, computers, television, etc. A common assumption is that detecting deception in face-to-face interaction is an easier task given that a person has much more information at their disposal, unlike verbal “online” communication, which lacks non-verbal signs such as gestures, body posture, facial expressions, etc. In addition, as mentioned in previous research in asynchronous computer-mediated communication, the sender has more time, which makes it “easier for senders to construct and/or harder for receivers to detect relative to face to-face interactions” [
3]. Nevertheless, in a study conducted on a group of people who participated in face-to-face interactions and computer-mediated communication, it was determined that human performance in detecting deception in computer-mediated communication exceeded that in face-to-face interaction and that the truth bias and deception rate in both cases did not differentiate [
11]. However, human prediction accuracy still did not exceed chance.
Zhou and colleagues [
2] believe that the sender in CMC distances himself from the message that “reduces their accountability and responsibility for what they say, and an indication of negative feelings associated with the act of deceiving”. Likewise, one of the important indicators of why people are better at detecting deception via computers is precisely the fact that they lack certain information about the other person, so they are much more suspicious and will suspect deception sooner.
Research in CMC examines the influence of Linguistic Style Matching (LSM) and Interpersonal Deception Theory (IDT) on the linguistic characteristics of conversations during honest and fake conversations [
2,
12]. The LSM theory explains how people in a conversation adapt each other’s linguistic style to match their partner’s. According to the LSM theory, deception in a conversation can be detected by analyzing the verbal characteristics of the interlocutor (who is unaware of the deception) and not exclusively those of the speaker (who is lying) given that their linguistic styles match [
12]. In the study conducted during synchronous computer-mediated communication, correlation was recorded in the linguistic style of the interlocutors. More precisely, the correlation was achieved when using first, second, and third person pronouns and negative emotions. An interesting conclusion was that the linguistic profiles of both interlocutors coincided to a greater extent during false communication compared to true communication, especially in a case when the speaker was motivated to lie [
12]. There is a possibility that speakers deliberately use LSM when trying to deceive in order to appear more credible to the partner, which is what the IDT theory deals with. IDT studies the context of the speaker (who is lying) and the interlocutor (who is not aware of the deception) and the changes in their linguistic styles through honest or false communication, with the difference that it understands these changes as strategic behavior that the speaker uses to facilitate the deception process [
13]. “Deceivers will display strategic modifications of behavior in response to a receiver’s suspicions, but may also display non-strategic (inadvertent) behavior, or leakage cues, indicating that deception is occurring ” [
2]. On the other hand, interlocutors in the case of non-strategic behavior may become suspicious and ask more questions, thus forcing the speaker to change his linguistic style and adapt to the interlocutor.
So far, the best known method of detecting deception precisely is the use of a polygraph, which provides insight into a series of autonomous and somatic psycho-physiological activities that are invisible to the human eye, but which strongly signal deception. The polygraph relies on the analysis of peripheral activities related to emotions and excitement while the traditional measures used are most often of a cardiovascular nature (i.e., changes in heart rate), electrodermal (changes in the electrical properties of the skin), and respiratory (i.e., rapid and uneven breathing) [
14]. Although a polygraph is one of the more accurate methods, it still provides rather limited insight into complex brain processes that may hide deeper and more precise indicators of deception, so it is not surprising that this area of research is on the rise. There are other methods of detecting fraud from behavior through observing a person using the usual human senses without physical contact; by interpreting subtle signals in behavior by analyzing gestures, linguistics, tone of voice, and handwriting; etc. [
14]. Although some of these approaches give quite satisfactory results, such as the polygraph, their limitation lies in their inapplicability to computer-mediated communication. It is for this reason that there exists an increasing interest in methods for analyzing the syntactic and semantic properties of written text and finding indicators of deception in various forms of digital interaction.
2.3. Tools and Methods in Deception Detection
2.3.1. Natural Language Processing
Natural language processing (NLP) is a multidisciplinary field of linguistics, computer science, and artificial intelligence that focuses on the processing and analysis of large amounts of natural language data with the aim of developing software that will understand the content and context of text and speech. By analyzing different aspects of language, such as syntax, semantics, pragmatics, and morphology, machine learning models learn the rules used to solve given problems. NLP is commonly applied for filtering spam and generally classifying it with search engines for automatic text correction, sentiment analysis of different products, classification of customer feedback, and automation of customer support as part of virtual assistants, but it is also for many other tasks, including fraud detection. NLP converts input text data into vectors of real numbers that machine learning models support. Some of the feature extraction methods for natural language analysis are:
The BOW (Bag of Words) approach extracts features from the text and represents them as the occurrence of words used in the text. The BOW analysis consists of the vocabulary of the used words and the measure of the occurrence of each individual word. It should be noted that the word structure and the order of words are ignored.
N-grams are strings of N symbols or words (tokens) in the analyzed document. Unlike BOW, n-grams preserve the order of tokens. Different types of n-grams are suitable for solving different types of problems, so it is necessary to test the models on a wider range of n-grams.
TF-IDF (Term Frequency—Inverse Document Frequency) specifies how important a certain word is for the analyzed document, but it is not as naive as BOW. In BOW, frequent words can easily dominate while less frequently used words that carry much more information lose their importance. TF-IDF, in addition to the frequency of word occurrence in the current document, also records the inverse frequency; that is, for each word, it calculates how rarely it appears in all documents. By combining the above, TF-IDF solves the problem of a dominance of frequent words in relation to less frequent but more important ones.
POS (Part of Speech) are categories of words with similar grammatical properties, such as nouns, adjectives, verbs, etc. This type of analysis assigns a corresponding category to each word.
Lemming and stemming are text normalization techniques used in natural language processing, and their main function is to reduce words to their canonical or root form. Lemming is a canonical dictionary-based approach and, unlike rooting, takes into account the meaning of words. Stemming is based on rules and is simpler to implement and is faster because it does not consider the context when shortening words, which is why it also does not give as good of a prediction accuracy as lemmatization.
Stop-words are words of a certain language that do not contribute much information to the sentence, and they have a highly frequent occurrence in the text. This is why they are often removed from the text when classifying or grouping using machine learning models. Removing them can greatly increase the prediction accuracy and reduce model training and testing time, but they should be chosen carefully to preserve the text meaning.
2.3.2. Machine Learning
Machine learning (ML) is a field of artificial intelligence that deals with the study of methods that independently learn from data and use it for the purpose of improving performance when solving given problems. The models are built on the training data and used to make predictions. Today, machine learning is used across all fields, such as medicine, computer vision, text classification/grouping, speech recognition, etc. The base steps of machine learning are data collection, data preprocessing, model selection, model training and model evaluation, parameter tuning, and prediction. The process of data collection and preprocessing is of great importance given that the models rely on the given data when making decisions. Due to the general lack of labeled data, these are also the most difficult tasks.
Machine learning models are one of the methods that can be used in deception detection. Prior to the actual model training, the data is filtered, cleaned, and analyzed using natural language processing methods, and then, it is transformed into a form that is acceptable to a certain machine learning model. The models used in this are based on logistic regression, naïve Bayes, SVM (Support Vector Machine), and Random forest:
Logistic regression is a statistical model of machine learning that is used for classification and belongs to supervised machine learning techniques. It outputs a probabilistic value between 0 and 1.
SVM is a machine learning model that is often used for classification, but it is also used for regression. It belongs to supervised machine learning techniques. Its task is to separate N-dimensional data into classes by selecting the best decision boundary (discriminant function).
Naive Bayes also belongs to supervised learning techniques. It is based on Bayes theorem, which naively assumes that the value of a certain variable/feature is independent of other variables/features.
The Random Forest model is used for the classification and regression problem. It is based on the construction of a large number of decision trees, each of which makes decisions on the outcome of the prediction. In the case of classification, the prediction with the majority of votes is selected while in the case of regression, the average value of all predictions is taken as the output of the model.
K-fold cross validation is used as a method of evaluating the obtained machine learning models. The parameter k determines the number of groups into which a given data set is divided to separate the training from the testing data. Specifically, one set is taken to test the model while the other k-1 datasets are used to train the model. The accuracy of the model is calculated by taking the average value of the model’s prediction through k iterations. This method provides a less optimistic but less biased assessment of model performance than other methods.
2.3.3. Linguistic Inquiry and Word Count (LIWC)
LIWC (Linguistic Inquiry and Word Count) is a software for text analysis designed for the purpose of studying natural language. It consists of two key components: the word processing component and the LIWC dictionary. The dictionary forms the core of the application itself, as it connects psychosocial with linguistic constructs and consists of over 12,000 words, root words, and phrases. Groups of words from the LIWC vocabulary that specify a particular domain are referred to as “categories” or “dimensions”. Each LIWC entry can belong to several LIWC categories and are mostly arranged hierarchically. Originally, the categories were cognitive and emotional while with the increasing understanding of the psychology of verbal behavior, the number and depth of categories increased [
15]. LIWC receives text records in various formats of input, which it then sequentially analyzes and compares with the dictionary. The software counts the words in a given text and calculates the percentage of total words represented in all LIWC subcategories.
The latest version of the LIWC-22 offers some improvements over previous versions. The dictionary has been upgraded to handle numbers, punctuation marks, short phrases, and regular expressions in order to extend the use of LIWC (for example, to the analysis of content from social networks (Facebook, Twitter, Instagram, Snapchat) where such linguistic style is often present). In LIWC-22, the psychometric abilities of the dictionary were improved, and several new categories were added [
16].
The construction of the LIWC began with the intention of analyzing verbal speech to extract psychological processes described through the use of style words and the content of what is written or spoken (content words). It was soon concluded that these are quite different categories with different psychometric properties. Style words, which are also called function words, “make up only 0.05% of the total set of words in the English language, and are contained in a total of 55% of all words that we hear, speak or read”. They represent the way people communicate and offer a greater insight into the psychosocial aspect of speech compared to content words, which describe only the content of communication [
17].
Function words have proven to be very successful in the analysis of the emotional and biological state, status, sincerity, and individual differences; therefore, the emphasis is placed precisely on their deeper analysis in order to give insight into psychological processes that other methods of text analysis simply cannot detect. On the other hand, LIWC is a probabilistic system that does not take context into account linguistic constructs such as irony, sarcasm, and idioms; therefore, absolute conclusions about human psychology by using only LIWC analysis cannot be drawn [
17].
Research proves LIWC to be successful in detecting deception. “Deceptive statements compared with truthful ones are moderately descriptive, distanced from self, and more negative” [
17]. Such a description is not surprising considering that more information carries a greater risk of uncovering the truth. By analyzing deception in synchronous computer-mediated communication, it was shown how the linguistic style of the sender (who lies) and the receiver (who is unaware of the deception) changes. Both respondents were using more words overall (especially sensory) and fewer 1st person pronouns during deception compared to honest interaction [
2,
3]. Thus, it is obvious that linguistic style hides patterns that are specific to true and false communication, which can to some extent be successfully detected using the LIWC approach. Since LIWC software lacks context analysis, it is recommended to combine it with other natural language processing methods. Based on previous research, LIWC, together with an analysis combined with n-grams, achieved satisfactory results [
4,
5]. Given the large number of dimensions that LIWC possesses, a selection of important features needs to be done in order to prevent overfitting and maximize the performance of the machine learning model.
2.3.4. WEKA
Weka (Waikato Environment for Knowledge Analysis) is a software that contains tools for visualization, data analysis, and predictive modeling. Implemented within Waikato University, New Zealand, Weka was originally a tool for analyzing data from the agricultural domain but is used today in various fields of research, especially for educational purposes. Weka provides support for certain data mining methods, data preprocessing, clustering, regression, classification, data visualization, and feature selection.
2.4. Related Work on Deception Detection
A notable work in deception detection during public trials included analyzing verbal and non-verbal behavior of suspects and witnesses [
6]. Videos of witnesses and suspects were collected during testimonies on public trials and were used to build a reliable machine learning model that can distinguish truth from lies by analyzing verbal and non-verbal characteristics and thus provide assistance in making key decisions in the judiciary. The models based on n-grams were tested individually on different sets of verbal and non-verbal features and in combination. A further analysis of a subset of features revealed that the model gives better results when it is trained on non-verbal features, mostly by analyzing facial expressions, which are then followed by unigrams. Human performance in deception detection was tested by analyzing text, sound, noiseless video, and video with sound, which achieved worse results compared to the used machine learning models.
In another study, three different approaches were used when analyzing data on false and true positive hotel reviews [
4]. Truthful reviews were collected from the TripAdvisor platform while fake reviews were generated using the Amazon Mechanical Turk platform, containing opinions created with the intention of deceiving another person. The text was analyzed using POS and n-gram techniques and psycho-linguistic analysis using LIWC software. The models were tested individually and in combination, and only those with the best performance were selected. Data processing led to the conclusion that bigrams generally give the best results while the combination of bigrams and psycho-linguistic analysis gives a slightly better result. In addition, all tested methods outperform humans on the same dataset. In the same paper, by comparing the features obtained using POS analysis, LIWC, and a combination of analysis with n-grams and LIWC, it was noted that people hardly fake spatial information. Through the analysis of POS, the authors came to the conclusion that some of the language structures that are most often used in honest (informative) reviews are nouns, adjectives, prepositions, conjunctions, and verbs while fake (imaginary) reviews mostly use verbs, adverbs, and pronouns. Verbs and adverbs are common features in both types of reviews, but with an important difference: in the informative text, the past participle is mostly used while in the imaginary text, a much wider range of different verb tenses is used.
Somewhat better results on the same TripAdvisor hotel reviews dataset were achieved with a deep syntax analysis (that is, by using features derived from the analysis of parsed trees obtained from probabilistic context-free grammar (PCFG)) [
5]. The mentioned approach is combined with shallow syntax (i.e., POS tags) but still gives the best results in combination with n-grams, proving that the analysis of deep syntax offers information not present in the learned POS features and that it can serve as a more reliable method when detecting deception. The models were tested on 4 different datasets, from the domain of fake reviews from the TripAdvisor and Yelp platforms and sets of essays collected through Amazon Mechanical Turk on the topics “abortion”, “best friend”, and “death penalty”.
The same set of essays was analyzed using LIWC software in the work of Mihalcea & Strapparava [
8], showing slightly less favorable results. In fake essays, references to other people (“you”, “others”, “people”) and words related to certainty are mostly present while in true essays the person confidently connects with the statements made using more references on oneself (“I”, “friends”, “self”) and presents several attitudes based on belief (“think”, “feel”, believe”) [
8]. In addition to TripAdvisor, the analysis of fake reviews was also conducted on social platforms, such as Twitter [
18].
The answer to the question of which machine learning model best differentiates the true from false data is not easy to come by given that each model works specifically concerning the specific problem and dataset on which it is trained and tested, which is also often conceptualized by the specific context by the researchers in the area [
19]. Zhou and colleagues in their research [
2] deal with the deception detection in asynchronous computer-mediated communication by examining four machine learning models on data collected through two experimental studies. The research is based on the detection of deception from the point of view of interaction, not individual analysis. A similar study was conducted in order to understand changes in the linguistic behavior of people participating in a deceptive or truthful discussion during synchronous computer-mediated communication [
3]. The research was conducted by dividing respondents into groups of two people who were given the task of talking to each other via e-mail and, thus, getting to know each other. All respondents were given several topics to discuss in such a way that one respondent (sender) was randomly selected from each group and assigned a task to deceive the person (recipient) by giving a false opinion on two of the five given topics. Likewise, the importance of motivation in deception was examined in such a way that the senders were randomly assigned the additional task of being highly or lowly motivated while lying. The data were analyzed using the LIWC software in order to extract statistically significant features related to false or true communication and to test the hypotheses based on LSM and IDT. Based on LSM and IDT, changes in the behavior of the interlocutor (recipient) were also analyzed in order to examine whether deception can be detected from changes in his behavior. It was also investigated the extent to which motivation changes the linguistic style of a person who lies/deceives in synchronous computer-mediated communication. The results show that senders statistically use more words during deception, more references to other people and less to themselves, and more emotional words. Motivated senders avoid causal terms like “because”, “hence”, and “effect” while unmotivated ones use more simple negations. According to LSM and IDT theories, recipients use more words and ask more questions during deception, especially when the sender is not motivated [
3].
Previous research focused on detecting deception using and combining a few machine learning algorithms and models, mostly Naïve Bayes and SVM and to a certain extent analysis on a small range of n-grams. This paper extends the state of the art by employing a wider set of machine learning algorithms and models and uses wider combinations of n-grams. Specifically, prior research was exclusively done on bigrams while this study uses n-grams ranging from unigrams to trigrams. Such an extended set of models, algorithms, and n-grams was further combined with a specific analysis using LIWC, examining its operation on different datasets. The study contributes to the discussion on models’ applicability in terms of generalization, where n-grams were found to be the most robust method for deception detection and the analysis using LIWC the least flexible. The best opportunity for generalization were noted with the use of combinations of n-grams and analysis using LIWC.
The literature review presented in this chapter is summarized in a table form as part of
Appendix A.
3. Methodology
3.1. Problem Statement: Creating a Reliable Deception Detector
Given that human capabilities for detecting lies are very limited, machine learning models that have proven to be the best tool for predicting deception in computer-mediated communication were used. However, the first problem that arose in model use was the lack of labeled input data with truthful and deceptive statements. In a majority of prior work, data were collected using crowdsourcing platforms [
4,
5,
8] while other research was done on “real” data collected through social experiments [
2,
3] by analyzing public trials [
6,
7] or by some other method.
Another problem was the choice of text processing methods and machine learning models that gave the best prediction. By analyzing the choice of machine learning models in previous research, it could be concluded that Naive Bayes and SVM classifiers have proven to be very successful in solving this type of a problem [
4,
5,
8], so they represent the choice of methods in this study as well. Logistic regression [
2] and Random forest [
6] were used somewhat less often, but they achieved acceptable results, so they were also included in the set of models for this study as additional methods. Due to the performance of computational linguistics methods used in previous research, in this study, data were analyzed using n-grams as opposed to POS analysis because it gave more precise results [
4,
5]. Another reason for choosing n-gram analysis lay in the fact that it worked very well in combination with other methods. In a previous study, the highest precision was achieved by combining n-grams and deep syntax analysis when analyzing four different datasets [
5] while or by combining LIWC analysis and bigrams [
4]. LIWC has also served as a relatively good deception detector in other studies [
3] because it provided insight into the psychological–lexical characteristics of words, which was not given with n-gram analysis. To increase model reliability, important LIWC features needed to be selected since the use of redundant features could greatly reduce the predictive power of machine learning models.
Based on the aforementioned research, in this paper, it was decided to use a combination of analysis with n-grams and LIWC with individual approaches as verification. Deep syntax analysis was not examined in this paper because of the complexity of extracting important features from the data parsed using PCFG and the complex choice of production rules. The complete process of the methods applied in this study is given in
Figure 1.
3.2. Data Collection and Cleansing
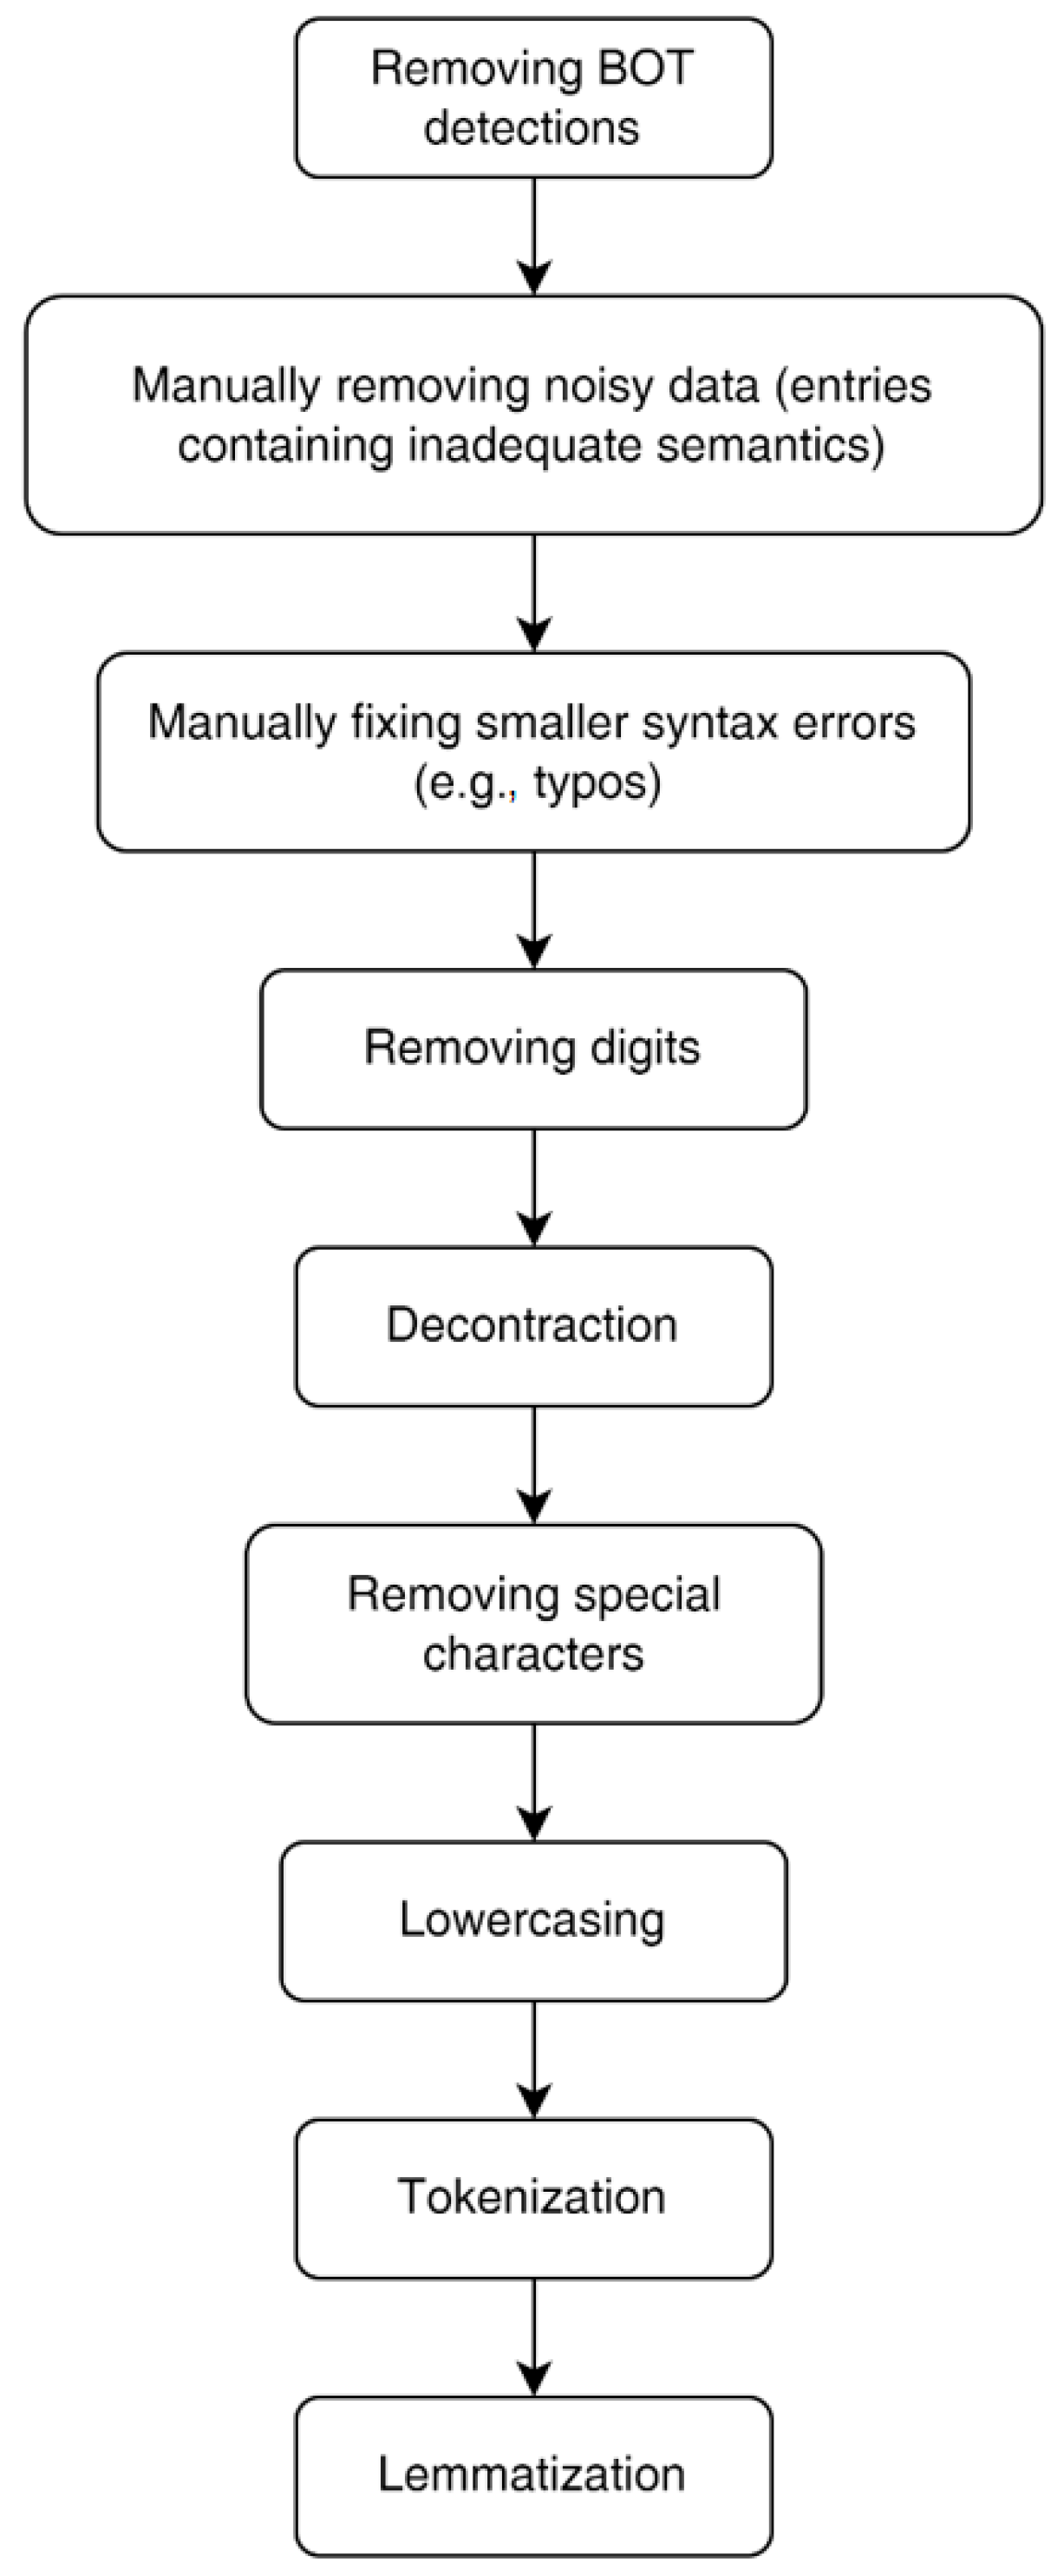
The Clickworker platform and the Qualtrics Survey were chosen in this study as tools to collect two separate datasets on the topics of “Climate Change” and “COVID-19”. The first topic concerned the issue of climate change and read: “What is your opinion on climate change? What do you think caused it and how will it impact our lives in the future?”. The second topic consisted of the question: “How did the COVID-19 pandemic impact your life? Share some of the challenges or new experiences during the COVID-19 pandemic”. 150 survey participants were selected, each of whom was paid $1.50 for completing a defined task, and the task itself was scheduled to last up to ten minutes. The selection of research participants was limited to residents of North America with English as a native language. The gender and age of the participants were not mandated. For each topic, the respondents had to answer ideally 4 to 5 sentences (the range was limited to 200–500 characters). The time limit was set to 30 days from the start of the survey.
All received responses had to be reviewed manually. Partial records were also taken into account, in which the participants gave their opinion on only one of the two topics offered. A total of 150 records were recorded, each record consisting of a true and a false answer to both topics. An additional 18 partial records were collected, all of which were related to the first topic “Climate change”. Bot detection excluded 11 records from both datasets. In the “Climate change” dataset (DS1), 25 records were manually labeled as invalid due to inadequate response syntax or semantics while in the second “COVID-19” dataset (DS2), 21 records were flagged as invalid. The final number of records in both datasets was 132 (DS1) and 118 (DS2), respectively, which made a total of 264 and 236 true and false answers. For 58 records, minor syntactic errors were manually corrected, but the semantics were maintained (
Table 1). Complete overview of the data cleaning process is given in
Figure 2.
The collected data were then pre-processed using natural language processing techniques and used to train and test machine learning models based on n-grams and psycho-linguistic analysis using LIWC.
3.3. Applying Natural Language Processing (NLP) and Creating Models
Data collection was followed by cleaning and pre-processing so that the models that would be subsequently applied analyze and predict more precisely. The first step consisted of removing special characters and numbers from the text, followed by decontraction (i.e., reduction of shortened and connected words to their long form). Word segmentation (tokenization) and lemmatization were performed to reduce the words to their normalized form. Stemming was not used because compared to lemmatization, it gives less favorable results, which was expected considering that it does not rely on a dictionary. The method of removing stop words was not used because they were an important factor in the prediction of deception. By comparing the performance of the models tested using TF-IDF vectorization and the classic BOW approach, the TF-IDF technique was chosen due to more accurate prediction.
Four different models were chosen: logistic regression, SVM, Naive Bayes, and Random Forest. The models were trained and tested individually and on combined data to gain insight into the possibility of mutual applicability of the models and the possibility of generalization by comparing the natural language processing approaches. The models were tested on a wider range and combination of n-grams and a varying number of features to identify the models with the highest prediction accuracy. The performance of models based on n-grams, LIWC analysis, and a combination of the two mentioned approaches were compared. All models were tested using 10-fold cross-validation. In the process, the most important features were selected from the LIWC analysis using the WEKA tool.
Feature Selection and LIWC
The models tested on all LIWC features did not give results comparable with those obtained by n-gram analysis, warranting them for feature selection. Important LIWC features for both datasets (DS1 and DS2) and the combined dataset (DS3) were selected with the use of the WEKA tool. Two different feature selection approaches were used: Attribute Correlation Evaluation and Attribute Subset Evaluation. The following three classes were selected:
The CorrelationAttributeEval class evaluated features by measuring the Pearson correlation coefficient between the features and the class. The Ranker search method was used to rank the attributes according to their evaluations.
The CfsSubsetEval class belonged to attribute subset evaluators and was based on the evaluation of feature subset values with regard to the degree of redundancy among features and the predictive ability of each individual feature. This approach prefered subsets of features that had a high correlation with the class and low correlation with each other. The search method used with CfsSubsetEval was BestFirst.
The WrapperSubsetEval class also belonged to the attribute subset evaluators and used a learning scheme to evaluate feature sets and their accuracy by cross-validation. The search method used in conjunction with WrapperSubsetEval was also BestFirst.
The models tested on the selected features did not achieve the expected precision, so it was decided to narrow down the set of selected features. The models were tested on different subsets of the selected set of features (only subsets of size 4 to 11 features were considered due to the time complexity of checking all existing combinations of sets larger than 11 features). After testing the models, it was concluded that the attribute subset evaluators selected the features with which the models provided the most accurate predictions, especially the WrapperSubsetEval class. The lists of the best subsets of selected LIWC features for each model, for both DS1 and DS2 datasets and the combined dataset DS3, can be found in
Appendix B.
Table 2 shows LIWC subcategories (features), the category to which it belongs, abbreviations, descriptions, the most frequently used examples belonging to that subcategory and internal consistency calculated using the alpha coefficient (Cronbach’s alpha), and the Kuder–Richards (KR-20) formula.
4. Results
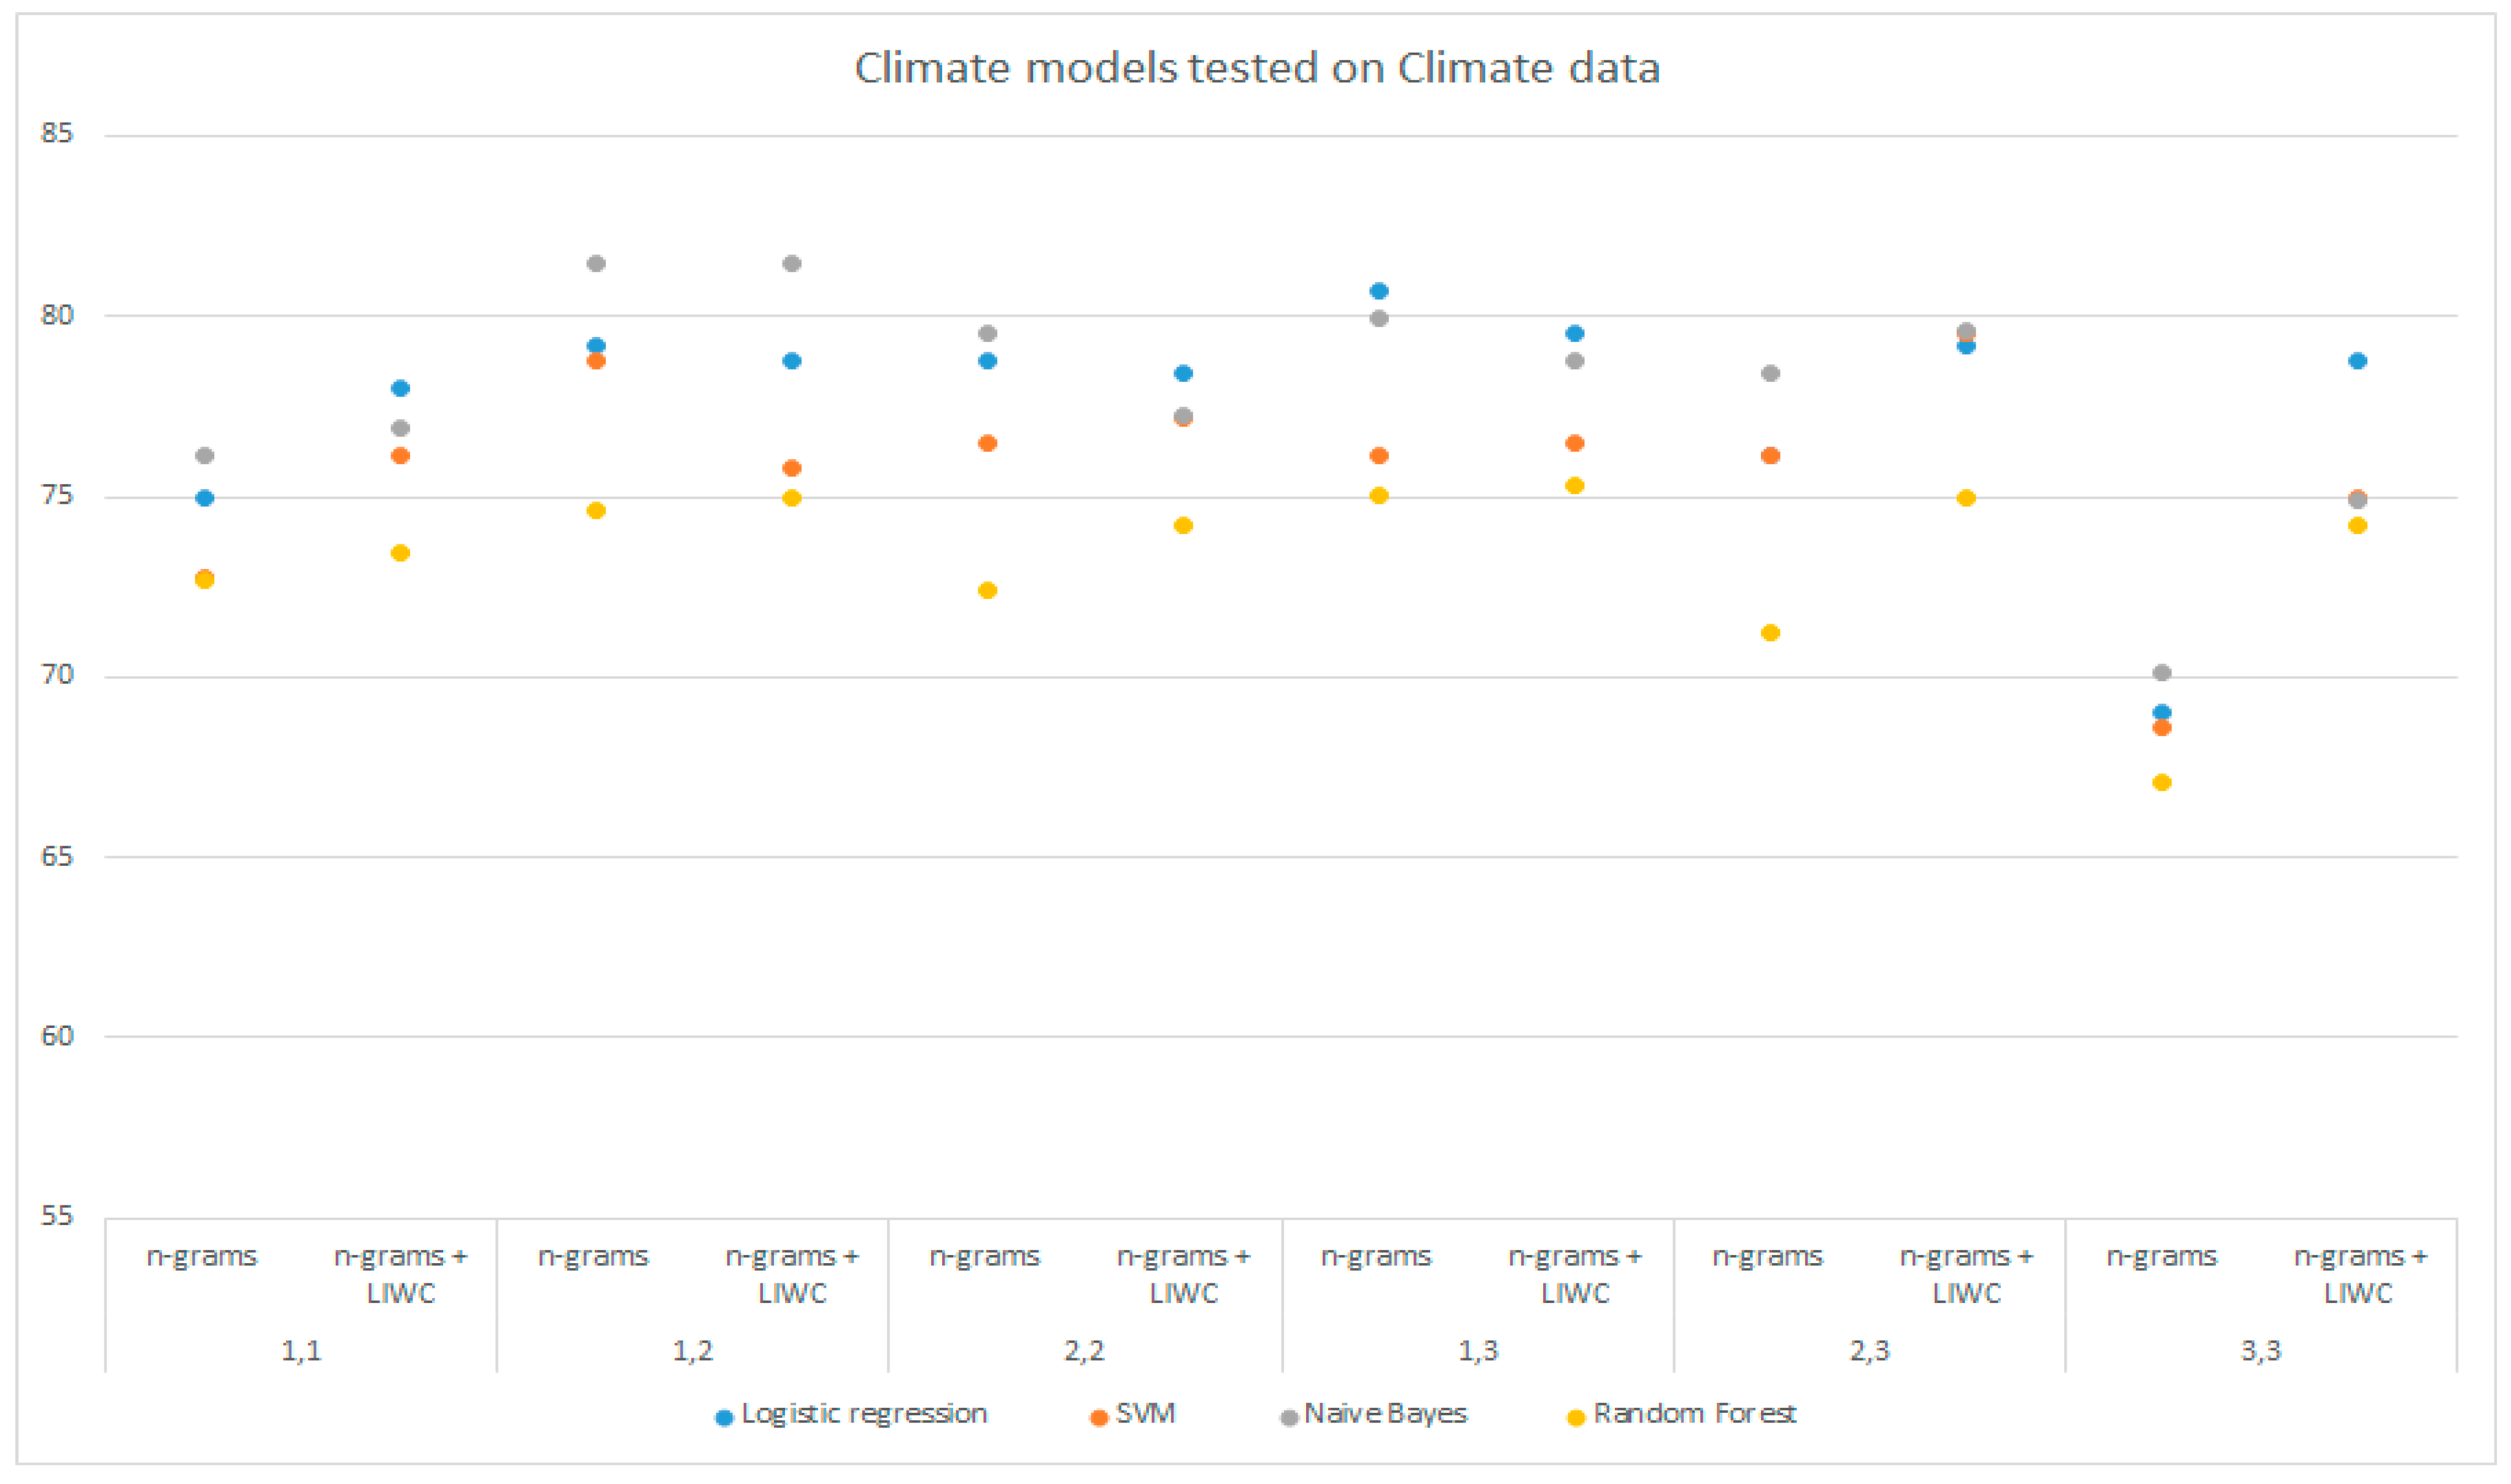
4.1. Model Testing on DS1 (Climate Change Dataset)
Four selected machine learning models were tested on the collected datasets (DS1 and DS2) and the combined dataset (DS3).
Table 3 shows the results obtained from the analysis using LIWC, n-grams, and the combination of n-gram analysis with LIWC (by combining LIWC with all n-gram sets ranging from unigrams to trigrams). The notation of n-gram records indicates their range (e.g., 1,2-g represents unigrams and bigrams). Accuracy, precision, and response were used to evaluate the performance of the models. For each model, maximum accuracies obtained by employing LIWC analysis (green), n-grams (blue), and the combined approach analysis (red) are indicated while the largest of the three values is in bold (the same notation applied to the highest response and precision obtained using all the models).
Analyzing the DS1 dataset with LIWC, the highest accuracy of 78.05% was achieved using random forest. A slightly better performance of the models was obtained using n-grams; more precisely, the maximum accuracy of 81.47% is given by the multinomial Naive Bayes model on unigrams and bigrams. The logistic regression follows with 80.68% accuracy in the analysis of unigrams, bigrams, and trigrams. Somewhat lower performance is given by the SVM and random forest models with an accuracy of 78.8% and 75.04% on the range of (1,2)-grams and (1,3)-grams. In addition, the accuracy of their predictions through other combinations of n-grams is lower than that obtained with analysis using LIWC for the same models while multinomial Naive Bayes and logistic regression gave better results during an analysis with n-grams compared to an analysis with LIWC.
Furthermore, when analyzing DS1 by combining the n-gram and LIWC techniques, the models mostly achieved better results compared to using the other two approaches. The best performance is again given by the multinomial Naive Bayes model tested on (1,2)-grams and LIWC with an accuracy of 81.47%, which was also achieved using exclusively n-gram analysis. This is followed by logistic regression with an accuracy of 79.56% tested on the range of n-grams from unigrams to trigrams, which is slightly lower performance compared to the same model when analyzing n-grams, which achieved the maximum accuracy of 80.68%.
By comparing the analysis of DS1 using n-grams and n-grams in combination with LIWC, improvements in model performance have been achieved using the combined approach. All models provide maximum accuracy using the combined approach of data analysis (except logistic regression), but the average accuracy of the model obtained by the analysis using the combined approach (77.04%) surpasses the one obtained by the analysis with n-grams exclusively (75.27%). The stated average values are given and further elaborated upon in
Section 4.5.
Table 4 shows models generally achieved much higher recall compared to precision. The maximum precision of 78.89% was achieved using logistic regression on (1,3)-gram analysis while the SVM analysis with LIWC achieved a response of 90.27%. The maximum precision of 78.89% was achieved using a logistic regression with (1,2)-gram analysis while the maximum response of 90.27% was obtained using SVM on LIWC analysis.
4.2. Model Testing on DS2 (COVID-19 Dataset)
Table 4 shows the results obtained by testing the selected machine learning models on the DS2 data set by analyzing LIWC, n-grams, and combining those two approaches. The logistic regression model achieved the highest accuracy of 74.62% in the analysis using LIWC while the multinomial Naive Bayes gave slightly worse results with 74.58%. SVM using the same approach achieved an accuracy of 73.32% while the random forest model tested using LIWC analysis gave the worst accuracy of 69.98%. Examining the model through combinations of n-grams, Naive Bayes tested on a combination of unigrams and bigrams leads with an accuracy of 73.86%. It is followed by SVM tested on bigrams with 72.05% and logistic regression tested on a set of bigrams and trigrams with the accuracy of 71.67%. All models tested with the LIWC analysis achieved higher accuracy than the maximum model performance obtained by the n-gram analysis. Using the combined analysis of n-grams and LIWC, the maximum accuracy of 76.39% on the analysis of unigrams and bigrams was achieved with the multinomial Bayes, followed by the SVM tested on bigrams with an accuracy of 76.34%. The logistic regression and random forest also gave satisfactory results of 75.05% on unigrams and 72.97% on bigrams.
The maximum recall of 78.18% was achieved by combining an analysis of (1,2)-grams and LIWC using multinomial Naive Bayes while the SVM model achieved the maximum precision of 77.35% with the combined analysis of bigrams and LIWC.
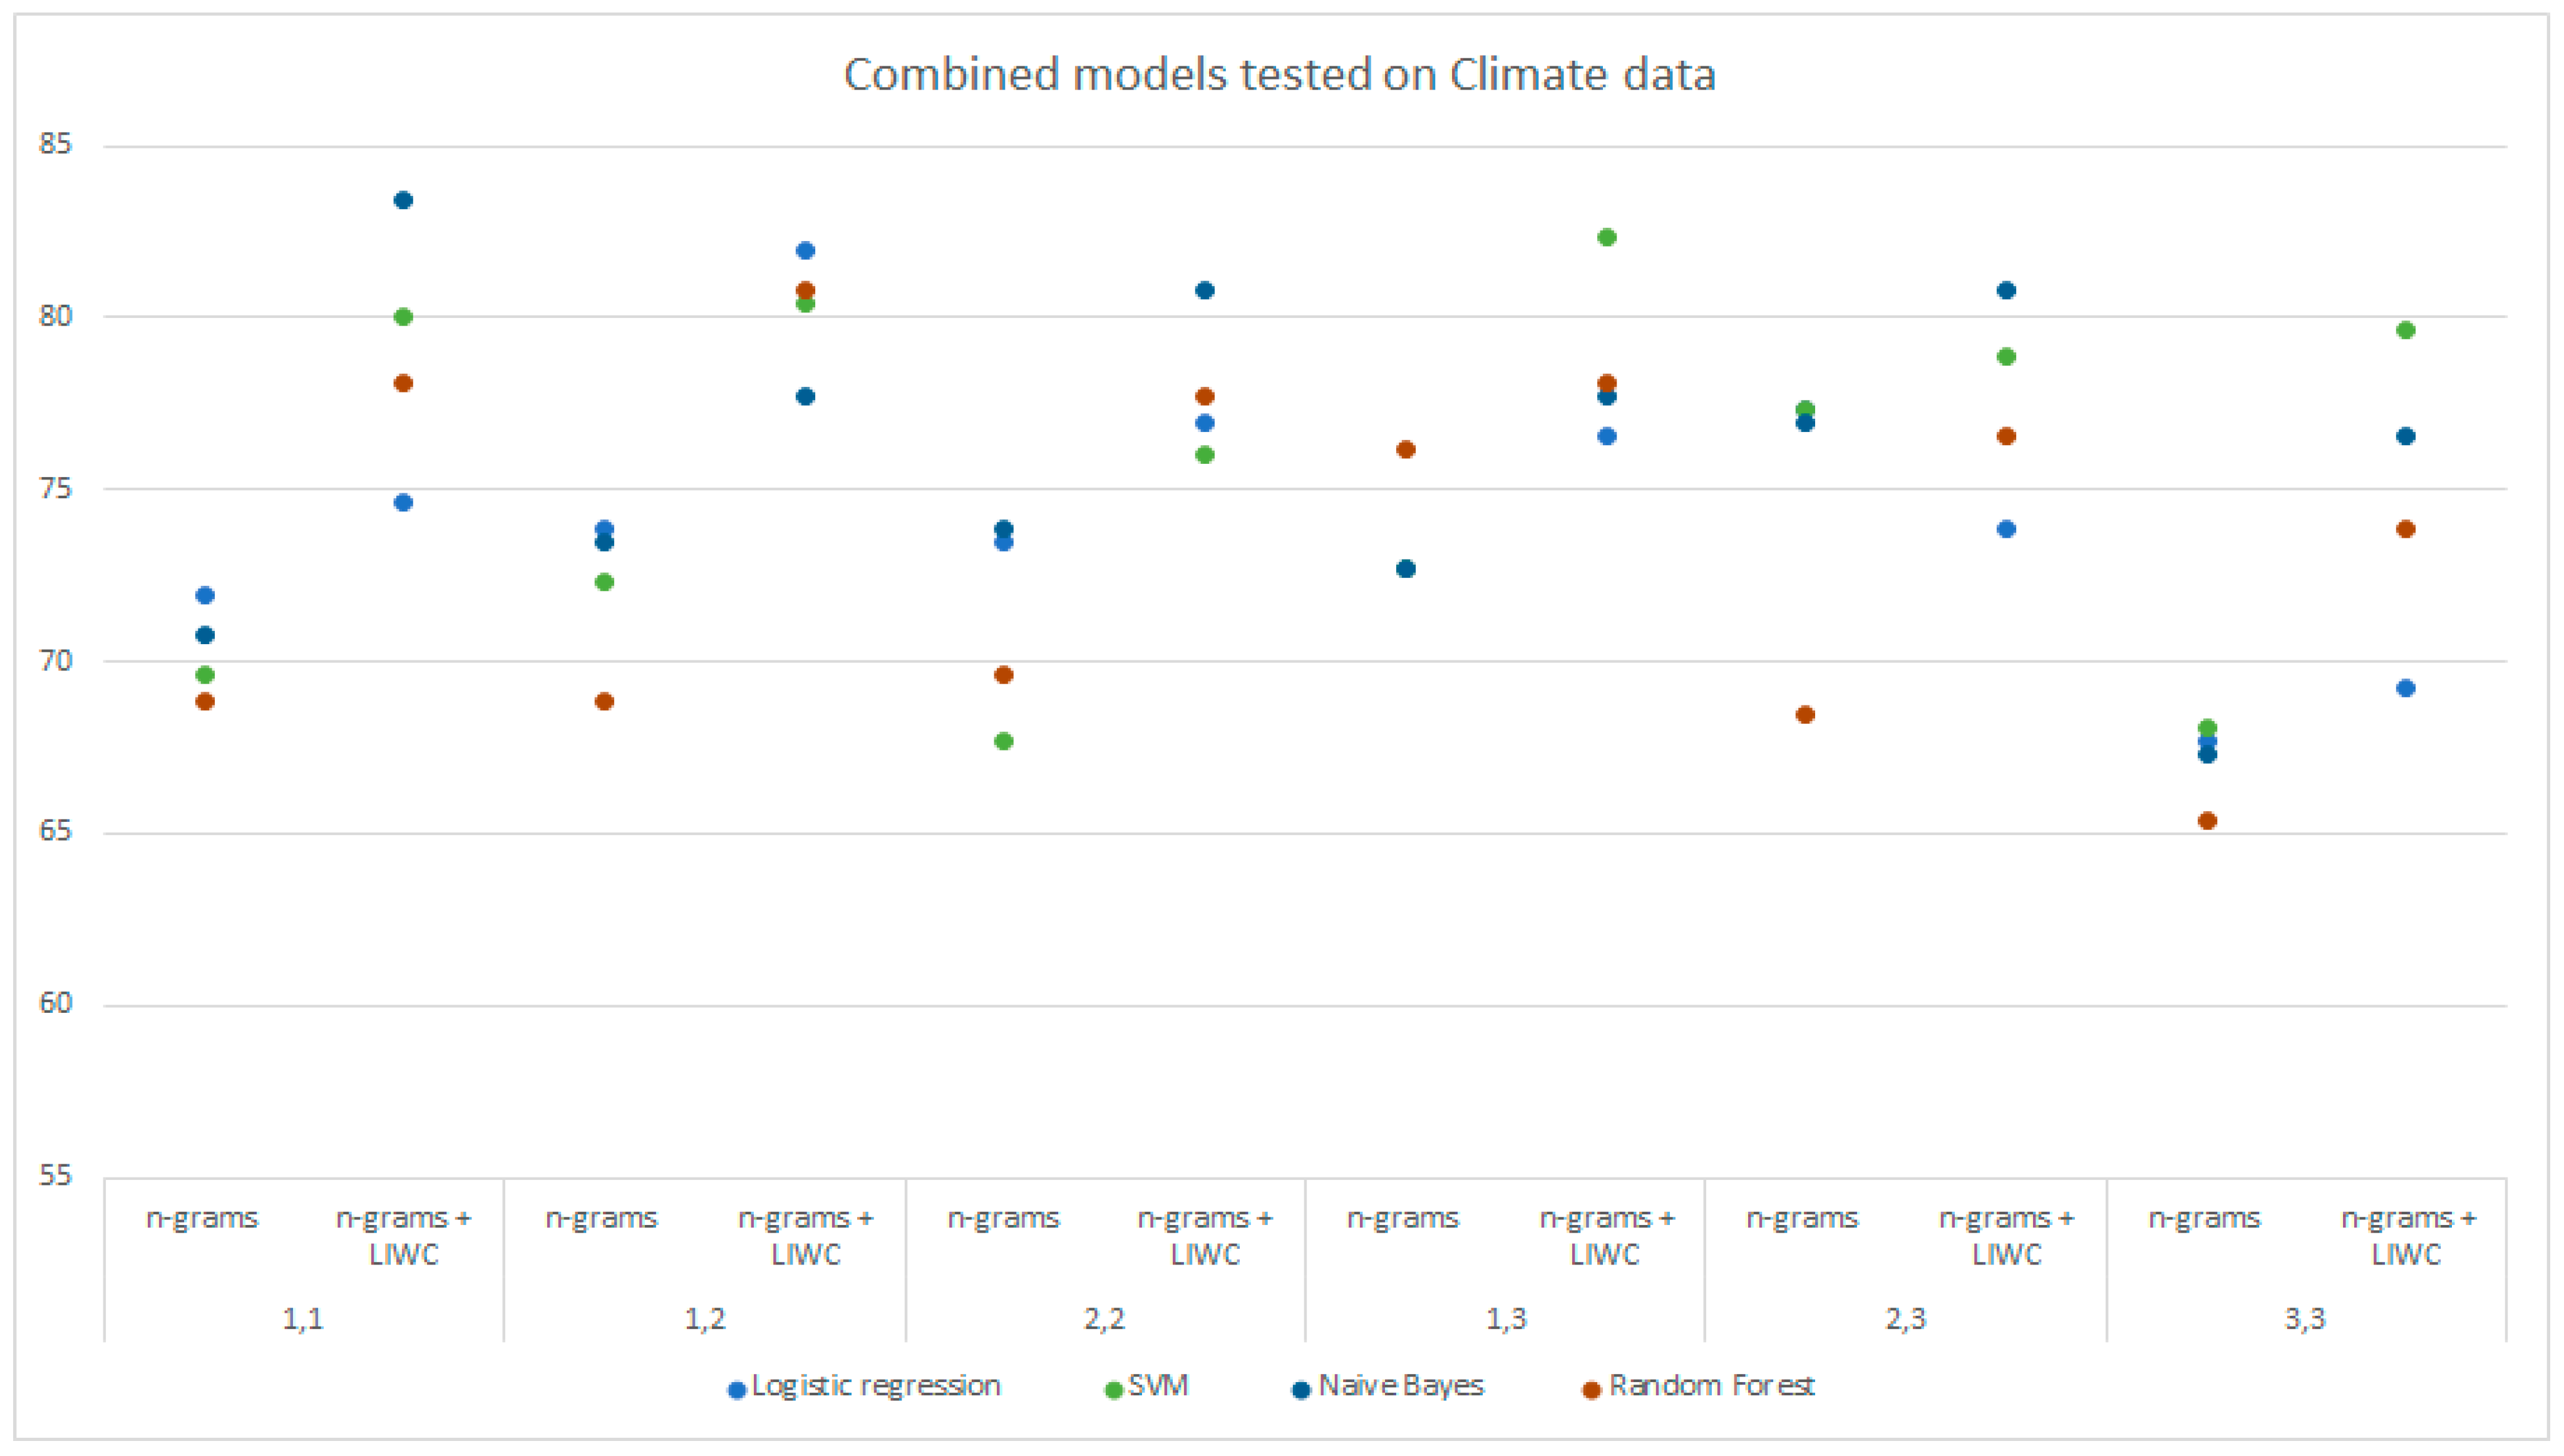
4.3. Model Testing on the Combined Dataset (Climate Change and COVID-19 Datasets Combined)
The combined dataset DS3 was also analyzed with LIWC, n-grams, and their combination and was tested using the four machine learning models (
Table 5). By testing the model on the features obtained with the LIWC analysis, the SVM model achieved the highest accuracy of 74.60%. It is followed by the logistic regression and random forest with 74.40% while multinomial Naive Bayes achieved an accuracy of 72.20%. When comparing the performance of the models achieved with the LIWC to the n-gram analysis, virtually all models classify better using the LIWC approach except for the multinomial Naive Bayes model, which achieved an accuracy of 74.00% by analyzing unigrams and bigrams, which is an increase of 1.8% compared to the LIWC analysis. The logistic regression and SVM achieved their maximum accuracy of 72.80% and 71.80% by testing on bigrams while the least favourable results were obtained with classification using the random forest model (69.60%). By combining analysis with n-grams and LIWC, the models achieved the best performance. SVM tested on bigrams with the maximum accuracy of 77.00%, followed by logistic regression with 76.20% and random forest with 75.40%. In this analysis, the multinomial Naive Bayes model (75.20%) achieved slightly worse results by analyzing data using the combined techniques (n-grams and LIWC). By comparing the results by testing the model on different sets of n-grams, it was found that the models mostly perform better using an analysis combining n-grams and LIWC as opposed to an analysis using LIWC only.
Likewise, the combined approach, compared to the n-gram analysis, gives better results for each set of n-grams. The highest overall accuracy of 77.00% was achieved by testing the SVM on the data analyzed with bigrams and LIWC, which is a 5.20% better result compared to an analysis with bigrams only. The mentioned model also achieved the highest precision (75.52%) compared to the other models. The maximum accuracy achieved using the logistic regression or random forest models is 76.20% and 75.40%, respectively. The multinomial Naïve Bayes achieved a slightly less favourable accuracy of 75.20%, which is still better compared to those obtained using only the n-gram analysis (74.00%) or LIWC (72.20%).
The maximum recall of 88.60% was achieved by using the logistic regression model on the dataset analyzed with (1,3)-grams and LIWC.
Testing DS3 Models Individually on DS1 (Climate Change Dataset) and DS2 (COVID-19 Dataset)
Models trained on the combined dataset DS3 were tested individually on the DS1 and DS2 datasets to gain insight into the possibility of model generalization and its applicability to different datasets than the one they originate from.
Table 6 shows a comparison of the accuracies of the models trained on DS1 and DS3 and tested on DS1 using the LIWC analysis, n-grams, and a combination of these techniques on all selected groups of n-grams. The above data are shown graphically in
Figure 3 and
Figure 4.
The logistic regression and SVM models trained on the combined dataset (DS3) and analyzed with LIWC achieved the highest accuracy of 81.45%, which is higher than for those models trained on the DS1 dataset. The other models also achieved better results by analyzing the data with LIWC. The models trained on DS3 and tested on the DS1 using the n-gram analysis and LIWC achieved better results compared to the n-gram analysis only for all selected sets of n-grams. The maximum accuracy of 83.46% was achieved with the multinomial Naive Bayes with unigram analysis and LIWC, followed by the SVM with 82.31% and the logistic regression with 81.92%. The random forest model also achieved the best prediction using the combined approach analysis (80.77%). Examining the results of the models trained on DS3 and tested on the DS1 dataset using the n-gram analysis, logistic regression, and SVM on (1,3)-grams achieved the highest accuracy (77.31%).
Compared to the models trained on DS1, the models trained on DS3, during testing on the DS1 dataset, achieved mostly less favorable results with the n-gram analysis. On the other hand, the n-gram analysis in combination with the LIWC achieved higher prediction maxima and slightly higher average results considering the performance of all models during training on the combined dataset (78.01%) compared to training models on SP1 data (77.04%).
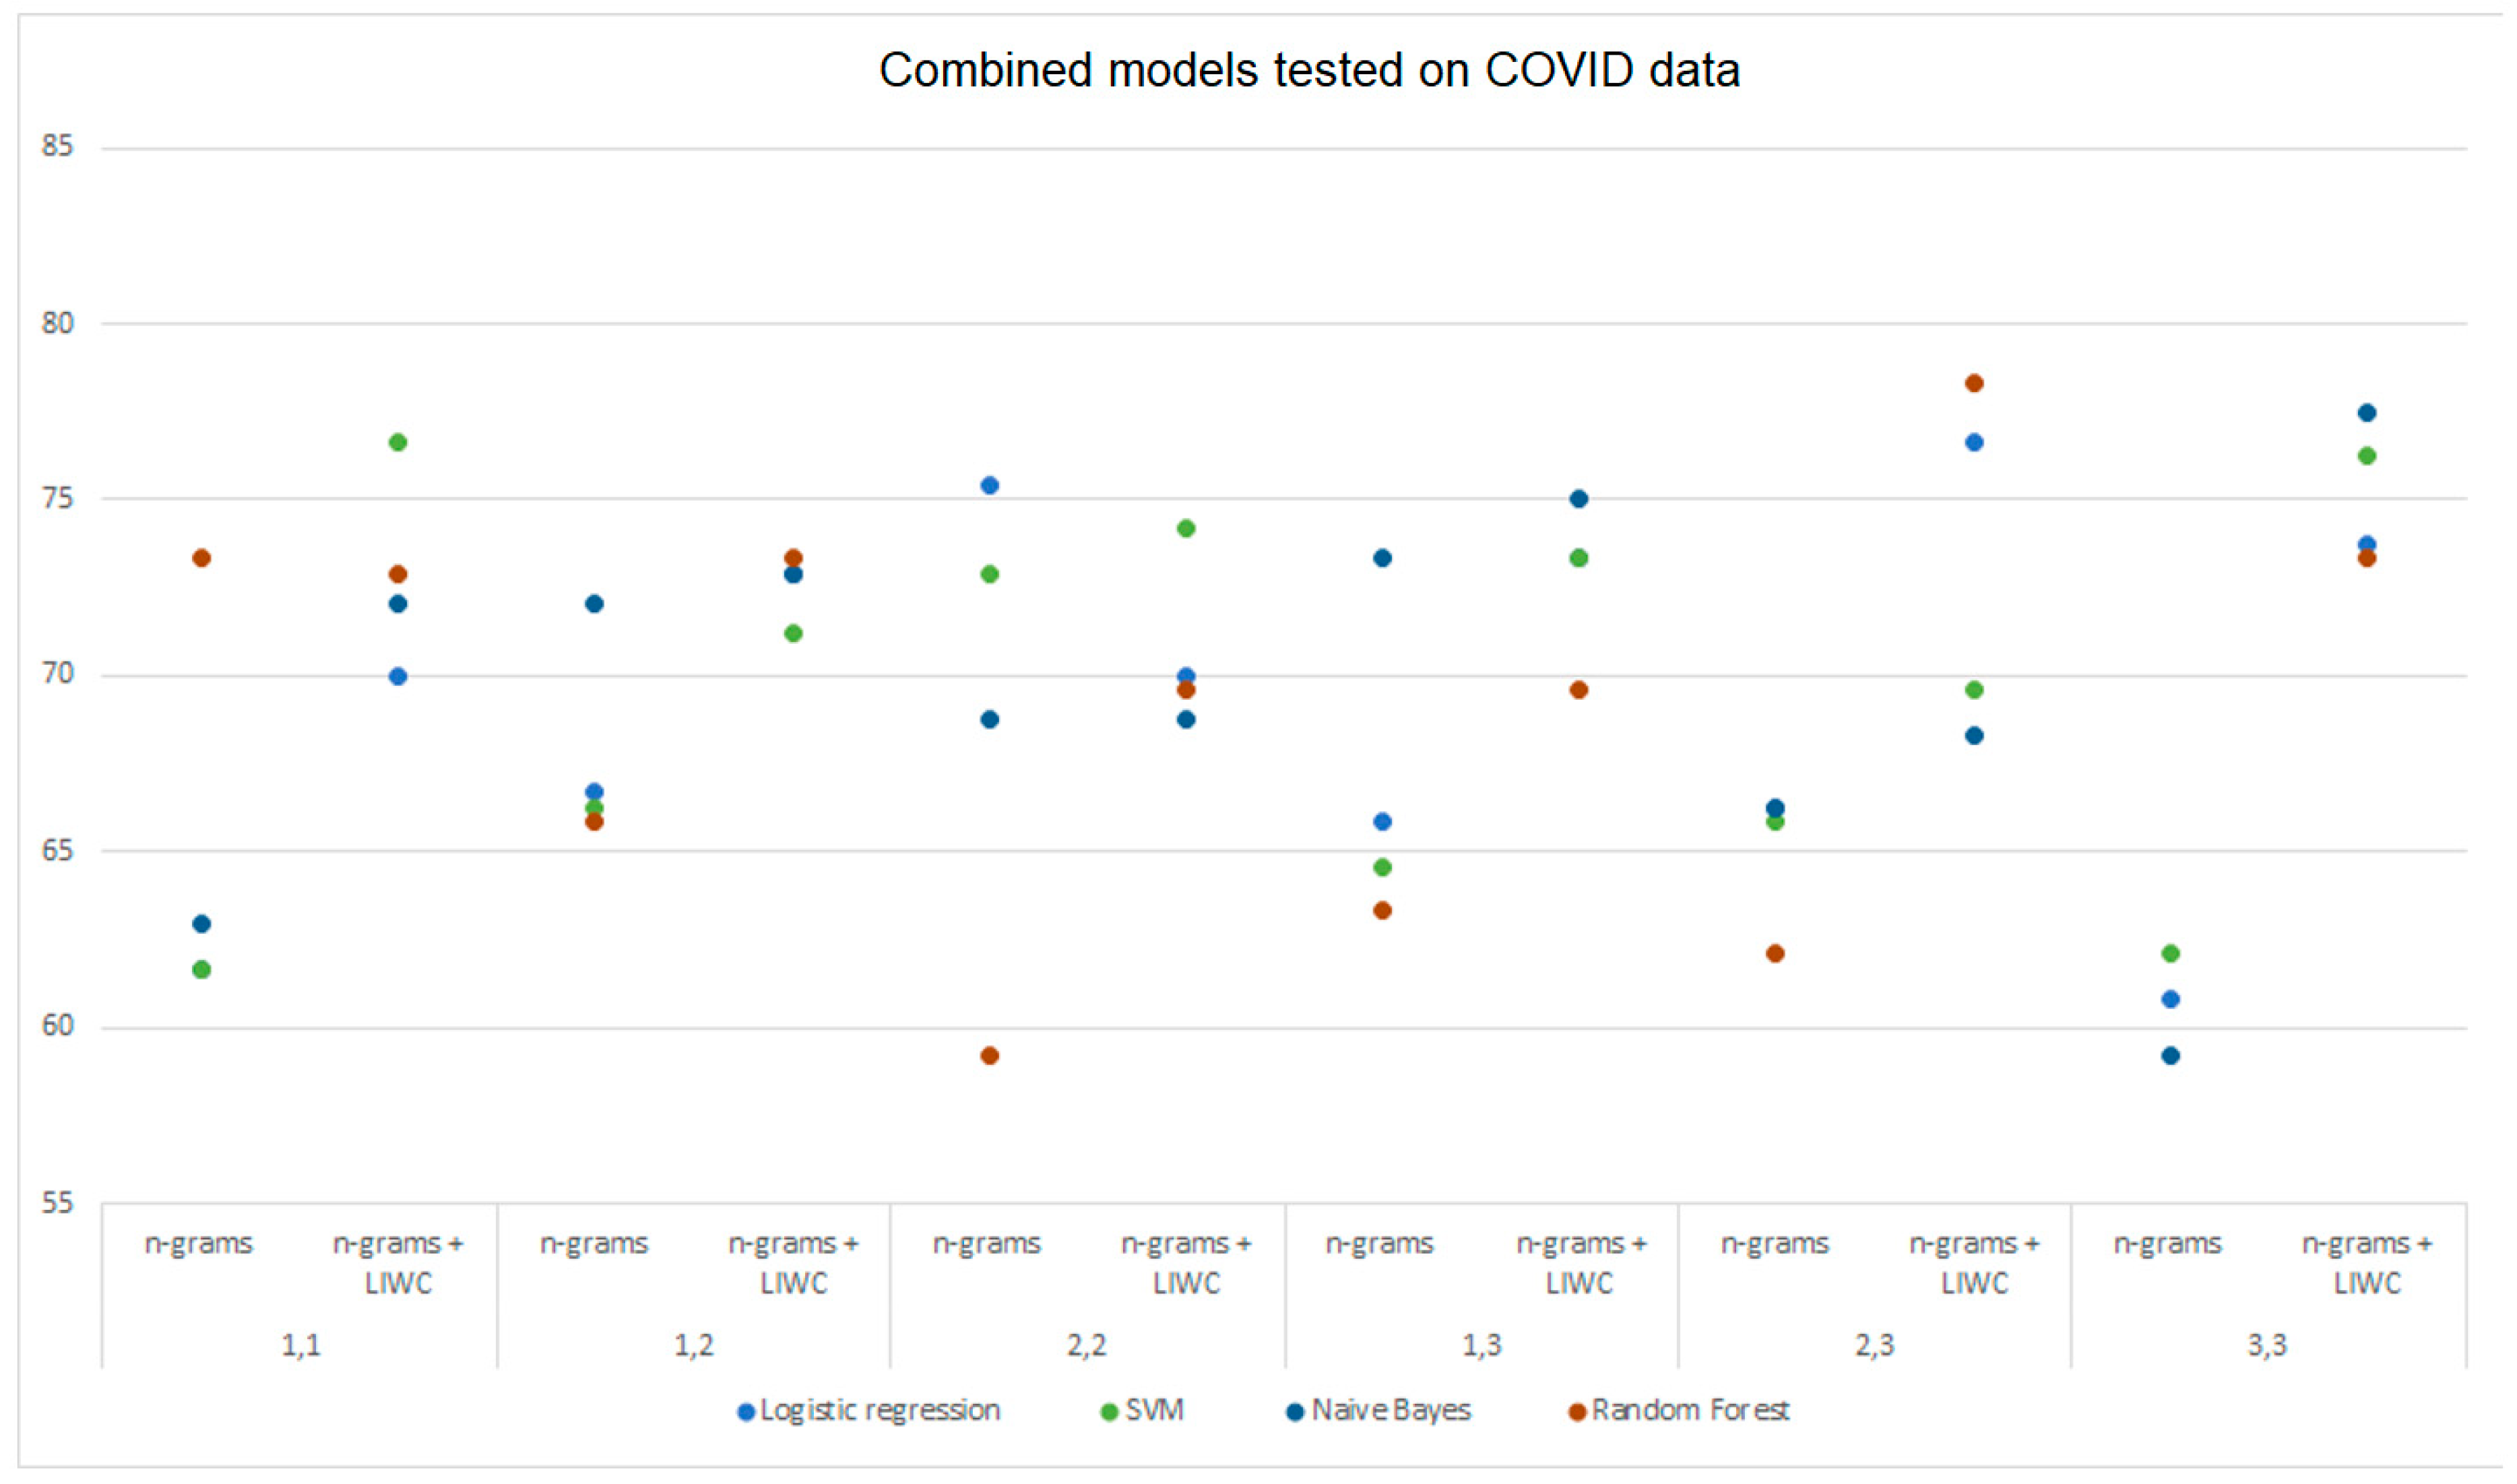
Models trained on DS3 and tested on the DS2 dataset with the LIWC analysis achieved generally less favorable results compared to the models trained and tested on the DS2 data (
Table 7). In addition, a similar trend can be noticed in the analysis with n-grams or n-grams in combination with LIWC, which mostly achieved less favorable results. However, comparing the results obtained from the n-gram analysis in relation to the analysis using the combined technique, it follows that the combined approach achieved a higher accuracy on almost all selected sets of n-grams (while testing the models trained on DS3 on dataset DS2). The maximum accuracy achieved by analyzing bigrams and trigrams using the logistic regression is 75.42% while the Naive Bayes and random forest achieve a maximum of 73.33% by analyzing (1,3)-grams and unigrams. The highest accuracy obtained using the combined approach analysis (78.33%) was achieved with a classification using the random forest model, followed by multinomial Naive Bayes with 77.50%.
Although the analysis with n-grams trained on DS3 on DS2 data during the testing of the models achieved slightly less favorable results than the analysis with the combined techniques, it also achieved slightly higher accuracy maxima than the analysis with LIWC while the average value across all selected sets of n-grams was somewhat lower. The DS3 models tested on the DS1 dataset achieved a higher maximum accuracy of predictions compared to the DS3 models tested on the same dataset by analyzing n-grams and LIWC.
Figure 5 and
Figure 6 graphically show the results obtained by analyzing n-grams and n-grams with LIWC for the models trained on DS2 and DS3, respectively, and tested on DS2 data. The difference in model performance when using different data processing techniques, which was previously mentioned, is clearly shown from the figures.
The accuracies obtained using the models trained on the combined DS3 data and tested individually on DS1 and DS2 datasets given in
Table 6 and
Table 7 are extracted and compared for each model and shown in
Table 8. For each column, representing the performance of a specific model on a specific dataset, the maximum value achieved using the n-gram analysis and LIWC is indicated in red, the maximum accuracy obtained with the n-gram analysis is indicated in blue, and the highest accuracy achieved with the LIWC analysis is indicated in green. Yellow horizontal lines indicate those results that exceed the average obtained using a specific model on a given dataset through all combinations of n-grams (trend by model). Yellow vertical lines indicate accuracies higher than the average obtained using all models on a certain dataset (trend by method) for each individual set of n-grams. Predictions that exceed the average defined by the trend by models and the trend by methods are colored in red.
The SVM and Naive Bayes models achieved the highest number of above-average predictions according to the trend by models and methods (11/24) (considering only the n-grams and analysis using a combined approach). The logistic regression gives slightly less favorable performance (9/24) while when examining the generalization possibilities, the random forest model ended as the least favorable with only 6/24 above-average predictions according to the trend by models and methods. When analyzing using LIWC, the logistic regression and SVM achieved the best above-average predictions by testing DS3 models on the DS1 data (81.54%), which is higher than the average results obtained by training and testing the same models on the DS1 dataset (77.45%). Logistic regression also achieved above-average results by testing models trained on DS3 on the DS2 dataset using the LIWC analysis, which are higher than the average results obtained by training and testing models on DS2 (73.13%).
4.4. Comparing Models
4.4.1. Comparing Model Performance across Datasets
In
Table 8, the accuracies of the selected machine learning models obtained from testing the three collected datasets DS1, DS2, and DS3 using LIWC, n-grams, and the combining n-gram analysis with LIWC. For each model and each dataset in the table, the maximum achieved with the n-gram analysis is marked in blue while the maximum obtained by the combined technique analysis is marked in red. The maximum accuracy given by the LIWC analysis is marked in green. For each model, the average accuracy obtained by analysis with LIWC, n-grams and the combined approach was calculated for each of the given datasets (trend by model). In
Table 9, values that exceed the average accuracy for a specific model (trend by models) or for a specific data processing method (trend by methods) are colored in yellow while values that exceed both trends are colored in red.
Statistically, multinomial Naïve Bayes (22/36) achieved the most above-average results per model with the n-gram analysis and with the combination of n-gram analysis and LIWC while the logistic regression competes with 21/36 above-average predictions. By classifying using the random forest model, 20/36 above-average values were obtained while the SVM achieved 19/36.
Analyzing the results with n-grams and a combined approach on each dataset and for each set of n-grams, the logistic regression achieved most of the above-average values (33/36), followed by Naive Bayes with 25/36 and SVM with 22/36. The least favorable results were achieved with the random forest model with only 5/36 above-average predictions obtained for each dataset and n-gram.
Considering the overall trends by models and methods by analyzing n-grams and n-grams and LIWC, the logistic regression model also achieved the maximum compared to the other models with a total of 20/36 above-average predictions for both the model and the method.
By comparing the performance of the models on the results obtained from the LIWC analysis, the logistic regression model statistically achieved the best results with the above-average predictions given for each of the three datasets, DS1, DS2, and DS3, while the other models predicted somewhat less favorable with 2/3 above-average predictions. Statistically, the datasets on which the LIWC analysis achieved the most above-average results using all models are DS2 and DS3 with 3/4 above-average predictions.
4.4.2. Applicability of Models Trained on DS1 (Climate Change Dataset) to DS2 (COVID-19 Dataset)
Machine learning models trained on the DS1 were tested on the DS2 dataset in order to test the applicability of the trained models to deception data on another topic (
Table 10). The table shows accuracies obtained using the machine learning models for each of the selected data processing methods. The data is also presented graphically in
Figure 7. For each model, the maximum achieved accuracy obtained with the LIWC analysis (green), n-gram analysis (blue), and combined analysis with n-grams and LIWC (red) is indicated. The maximum of the three listed values is bold for each model.
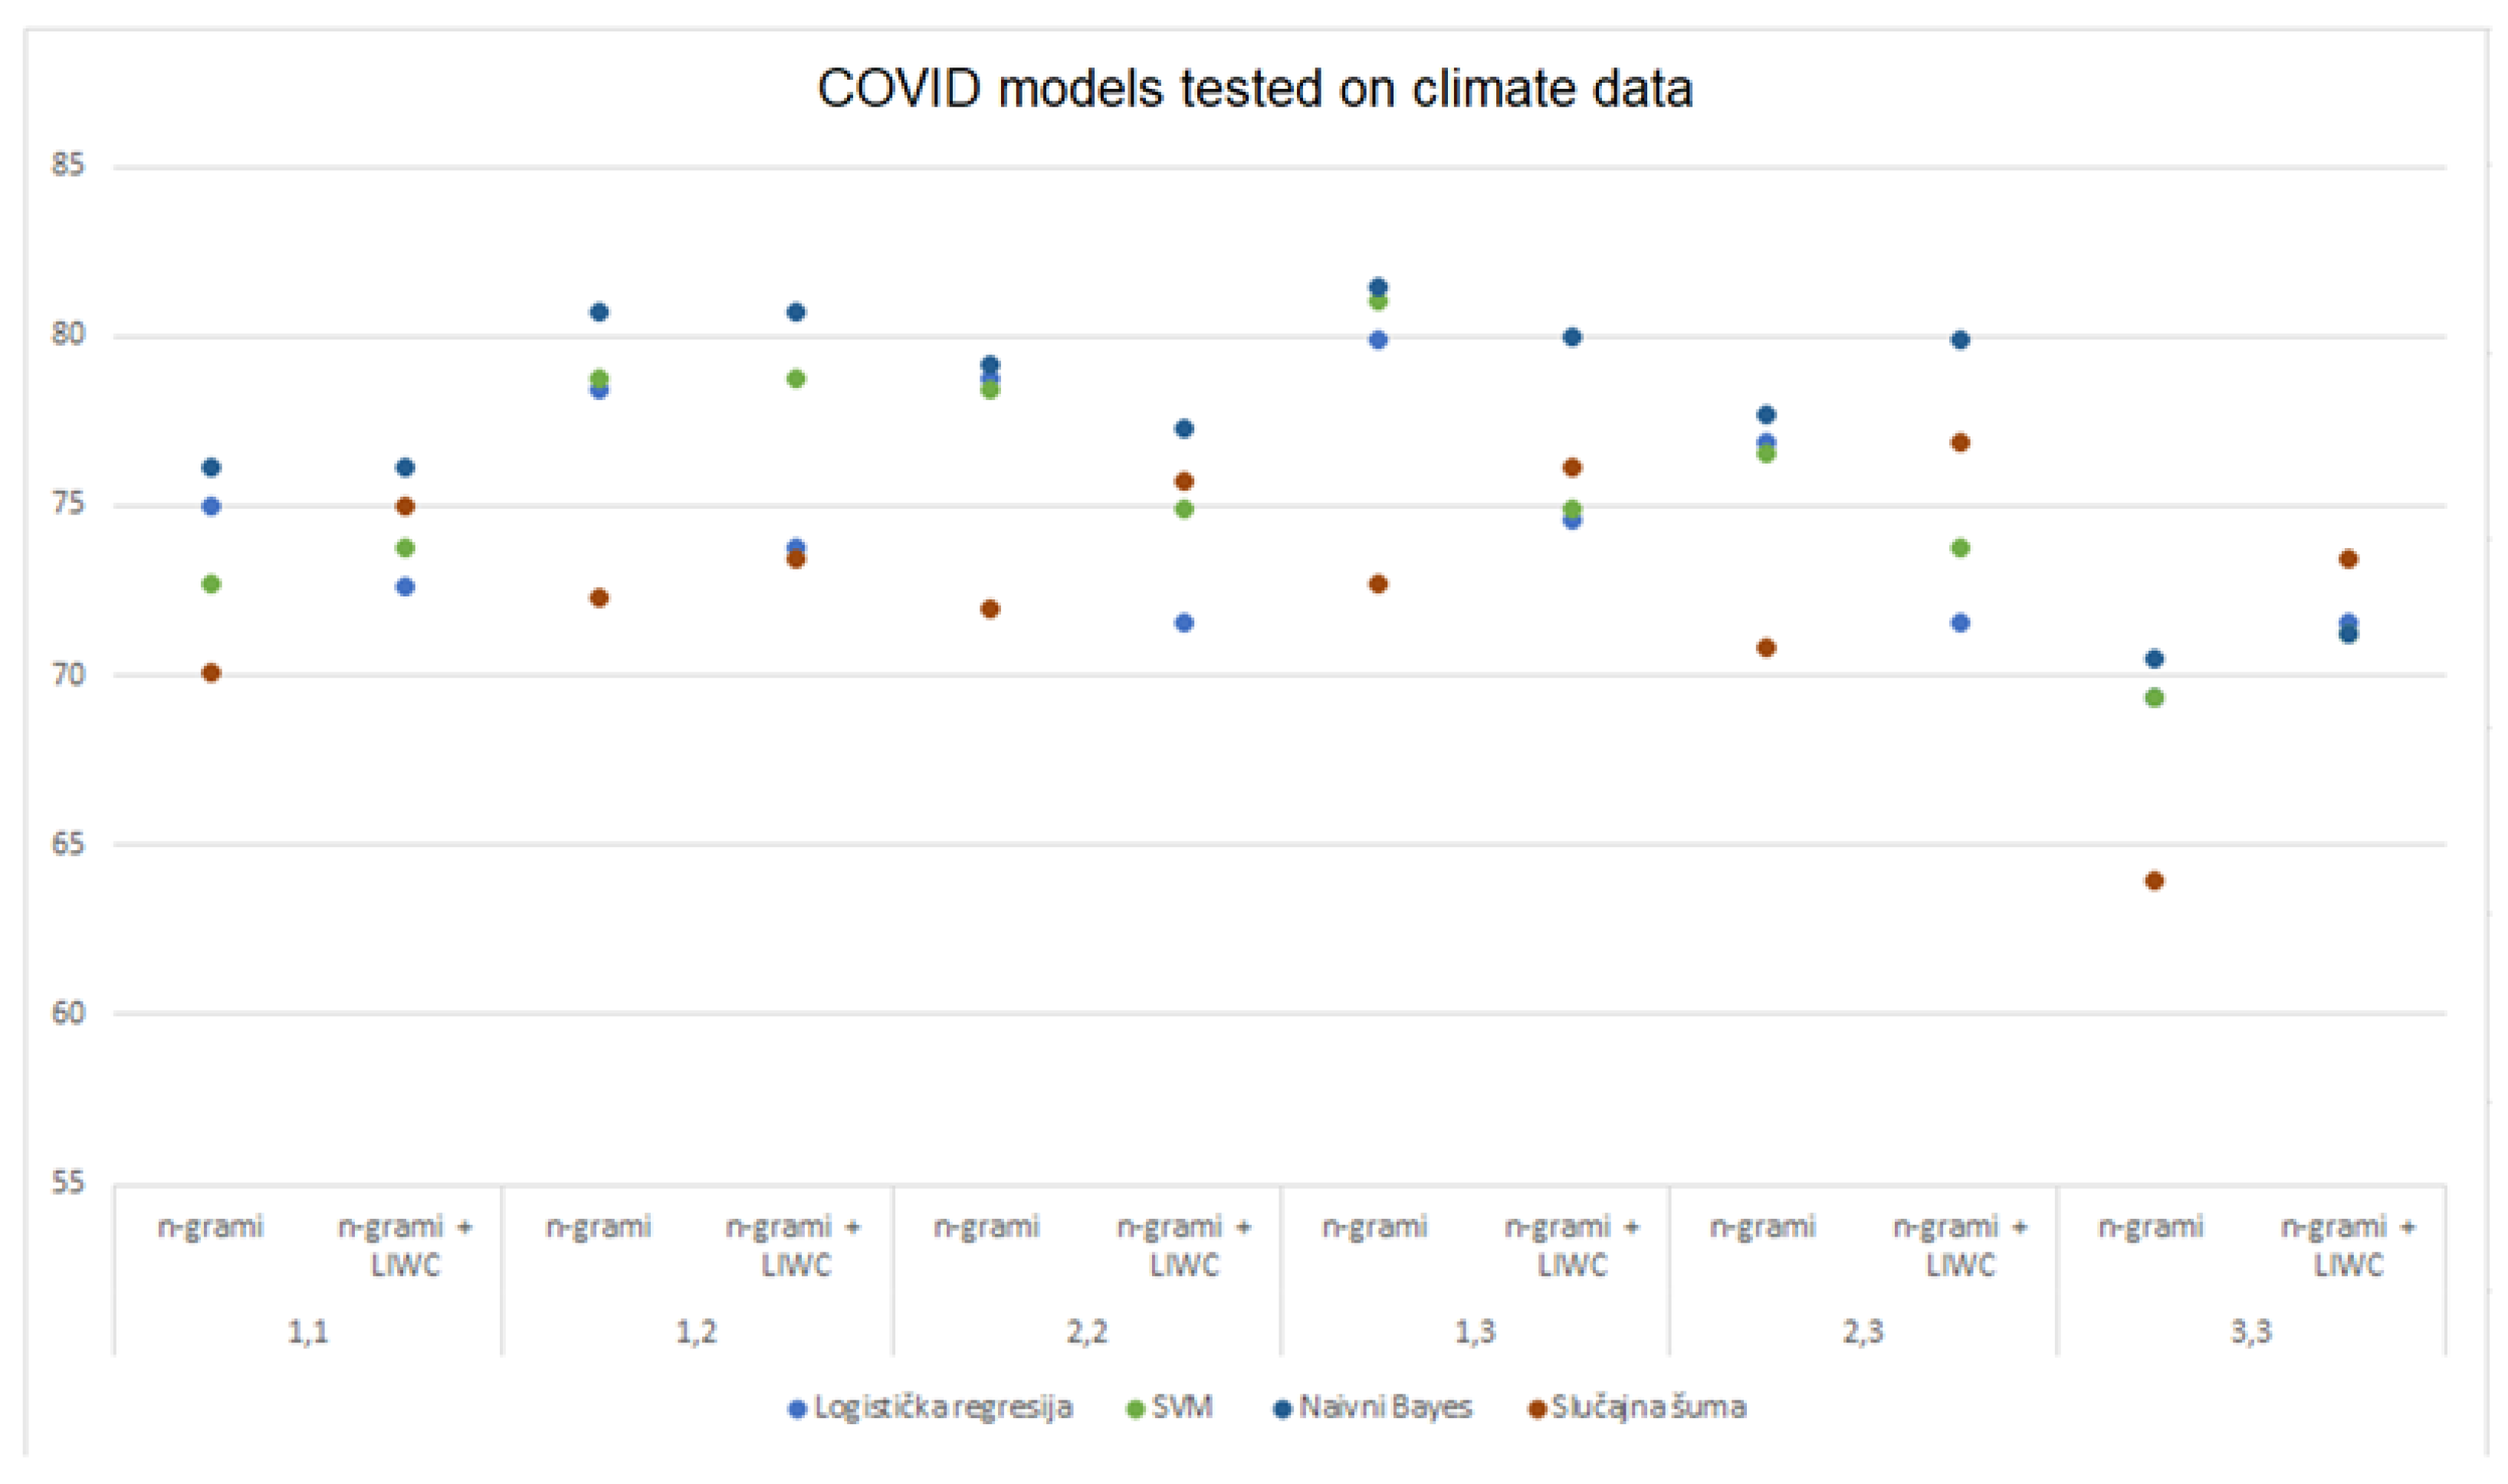
Considering the performance of models trained on DS1 and tested on the DS2 data, the maximum prediction was achieved with the multinomial Naive Bayes (73.82%) with the analysis using the combined approach. The random forest model gave the most accurate results (71.30%) analyzing n-grams. The results obtained with the LIWC analysis are generally less favorable than those obtained using other data processing approaches. When using models trained on DS1 and tested on DS2 data, a drop in the model’s performance was recorded with all three approaches compared to training and testing the models on the DS1 data.
4.4.3. Applicability of Models Trained on DS2 (COVID-19 Dataset) to DS1 (Climate Change Dataset)
Table 11 shows the accuracies of all models trained on DS2 and tested on the DS2 and DS1 datasets for each of the selected data processing methods (also
Figure 8). For each model, the highest value obtained with the LIWC analysis is indicated in green, the maximum value obtained with the n-gram analysis in blue, and the maximum obtained using the combined approach analysis is indicated in red. At the same time, for each model, the largest of the three listed values is bold. By testing the performance of the models trained on DS2 and tested on the DS1 data set, the best results were achieved with the multinomial Naive Bayes models (81.44%), SVM (81.05%) and logistic regression (79.90%) by analyzing (1,3)-grams, while the analysis using combined approach achieved the maximum only using random forest (76.88%). By comparing the accuracy of models trained on DS2 and tested on DS1 dataset compared to DS2, an improvement in model performance was observed using n-gram analysis across all selected sets of n-grams. Also, the analysis with the combined approach achieved more favorable results on almost all sets of n-grams, while LIWC achieved slightly less favorable results.
4.5. Statistics and Trends
4.5.1. Overview of the Trends by Model
In order to get a better insight into the performance of the used machine learning models, average values of each model obtained by testing on three selected datasets using LIWC analysis, n-grams and by combining n-gram analysis with LIWC was extracted (
Table 12). The same was done with the models trained on the combined dataset DS3, and tested individually on the DS1 and DS3 datasets, which is shown in
Table 13.
The average accuracy of all models obtained with the analysis using a combination of n-grams and LIWC is higher than that of the one using only the n-gram analysis for each of the three datasets, DS1, DS2, and DS3. The analysis based on LIWC alone also achieves higher accuracy compared to the average results obtained by testing all models on different sets of n-grams. The average accuracy of predictions obtained for all models using the LIWC analysis generally gave less favorable results compared to the analysis with a combined approach (n-grams and LIWC) on datasets DS2 and DS3 and a maximum average accuracy of 77.45% when tested on dataset DS1.
Table 13 compares average prediction accuracies obtained using all selected models and natural language processing techniques by training the model on the combined dataset, DS3, and testing individually on datasets DS1 and DS2. In this case as well, the analysis with n-grams on average gives less favorable results compared to the other data processing techniques used. The highest average accuracy for both datasets was achieved with the n-gram analysis combined with LIWC while the LIWC analysis also gives favorable results when tested on both datasets.
The maximum average accuracies, considering the results of all DS3 models tested on the DS1 and DS2 datasets, were achieved using the analysis combining n-gram and LIWC and are 78.01% and 72.90%, respectively.
4.5.2. Overview of the Trends by Methods
The average accuracy of all models trained and tested on the collected datasets obtained with the analysis with LIWC, n-grams, or the analysis by combining these techniques for all selected sets of n-grams are shown in
Table 14.
Analysis combining n-grams and LIWC achieved better average results for almost all selected sets of n-grams compared to the analysis using n-grams only. Consequently, the overall average accuracy obtained by this approach is also higher than the average results obtained by the n-gram analysis for each of the three datasets, DS1, DS2, and DS3. Considering the average accuracies obtained for all sets of n-grams, the analysis with n-grams and LIWC achieves the maximum on DS2 using the analysis of unigrams and bigrams (74.12%) and with the analysis of bigrams on DS3 (75.60%). Dataset DS1 was best classified using unigrams and bigrams (78.51%).
By comparing the average accuracies obtained using all machine learning models on all selected sets of n-grams and LIWC, the analysis using a combination of (1,2)-grams and LIWC gives the most accurate results (75.71%). This is followed by the analysis with 2-g and LIWC and (2,3)-grams and LIWC with the average accuracy of 75.29% and 75.19%, respectively, on all models and datasets.
Table 14 also shows that the models trained and tested on DS1 data give the best predictions compared to other datasets for each of the chosen data processing methods.
Average model accuracies were also calculated for models trained on the combined dataset DS3 and tested individually on DS1 or DS2 data, which is shown in
Table 15. The overall average results obtained by testing the DS3 model on DS1 or DS2 data are also shown.
In this case as well, the combined analysis with n-grams and LIWC achieved the highest average maximum for both datasets. When testing the DS3 models on DS1 data, the average maximum of 80.19% was obtained by analyzing unigrams and bigrams and LIWC. While testing these models on the DS2 data using the same method, the maximum average accuracy of the models was achieved by analyzing LIWC and trigrams (75, 21%). Considering the overall average obtained by the testing models trained on DS3 and tested on DS1 and DS2 datasets, the best average accuracy was achieved using bigram and LIWC (76.40%). The second best results were achieved by analyzing unigrams and LIWC (75.98%) and (1,3)-grams and LIWC (75.73%). Analyses exclusively with LIWC or n-grams achieved worse average results on all models compared to the combined analysis.
Models trained on DS3 and tested on DS1 data achieved better results than those models tested on DS2 dataset for each of the data processing methods used.
5. Discussion
5.1. Datasets and Models
The best classifications of datasets DS1, DS2, and DS3, considering the average accuracies obtained using all the models presented in
Table 12, were achieved with the LIWC analysis and by combining n-grams and LIWC. The above two methods also generalize best according to testing the combined dataset DS3 individually on the DS1 and DS2 data (
Table 13).
The climate change dataset (DS1) proved to be more applicable to deception detection compared to the COVID-19 dataset (DS2) and the combined dataset (DS3). Machine learning models achieved the best average results on DS1 using all data processing approaches (
Table 14). While examining the possibility of generalization by training models on the combined dataset (DS3) and testing on individual datasets (DS1 and DS2), models also achieved better performance tested on DS1 compared to the DS2 dataset. Consequently, models both trained and tested on the combined set achieved better average results compared to the training and testing on dataset DS2. It appears that DS2 data offers less information that can be used in deception detection compared to other datasets. Given that DS2 (dataset for COVID-19) is based on answers related to partly more current and potentially more personal experiences, there is a possibility that participants lied more successfully on a topic that is closer to them and more subjective; therefore, the very distinction of lies using the selected data analysis methods became more difficult. In addition, there is a possibility that for the same reason participants were more motivated to lie more convincingly considering the scope of experience they have about COVID-19 and consequently achieved a higher success rate of deception. On the other hand, data collected on the topic of climate change are potentially more objective, which leads to weaker results when trying to deceive.
During training and testing of the machine learning models on the DS2 dataset, it was noted that the analysis with LIWC (73.13%) or the combined approach (73.33%) achieves better average results than those obtained exclusively with n-grams (67.34%) (
Table 12). The analysis using the combined approach on the same dataset also achieves better average results on all sets of n-grams compared to the analysis exclusively with n-grams (
Table 14). On the other hand, during the training and testing models on data DS1, there was no such significant difference in the average accuracy of predictions using LIWC (77.45%) and the combined approach analysis (77.04%) compared to the n-gram analysis (75.27%), but the average results achieved using these methods are still more favorable than those obtained with the n-gram analysis (
Table 12). Given the above, it follows that n-grams better detect patterns related to deception by analyzing the DS1 compared to the DS2 dataset.
A statistical consideration of the number of above-average predictions that exceed those defined by trends by models (
Table 12 and
Table 13) and trends by methods (
Table 14 and
Table 15) shows that logistic regression proved to be the most reliable model with the most above-average values compared to other methods (
Table 9). It also showed good performance in combination with the LIWC analysis, where it achieved the highest number of above-average predictions compared to other models tested with the LIWC analysis on the same datasets. The random forest model achieved the least favorable above-average results while training and testing on the same datasets (
Table 9). Examining the possibility of a generalization of the models by training them on DS3 and testing on DS1 and DS2 datasets, the highest number of above-average predictions (in relation to the trend by models and trend by methods) was achieved using the SVM and multinomial Naive Bayes models while the random forest showed the lowest rate of above-average predictions. At this point, it is difficult to conclude as to which model is generally most applicable to the problem of deception detection given that all models have shown different performances on different datasets using different data analysis methods.
It is important to note that the procedure for selecting important LIWC features is limited to testing the models on all combinations of subsets up to the size of 11 features obtained using the WEKA tool (due to the factorial time complexity). The feature selection adopted in this study potentially needs to be improved by testing the model performance on feature subsets larger than 11 features or by applying another feature selection method.
5.2. Generalization
The models trained on the DS3 dataset, when tested on DS1, achieved a less favorable average accuracy with the n-gram analysis (71.54%) compared to the models trained and tested on DS1 (75.27%). Conversely, by testing the models based on DS3 on the dataset DS1 with the analysis using a combined approach, better average results (78.01%) were obtained compared to training and testing the models on the DS1 data using the same processing technique (77.04%) (
Table 12 and
Table 13). The same trend applies to the LIWC analysis, which also achieved better results. For model DS2, the analysis with LIWC or a combination of n-grams and LIWC generalizes better compared to an analysis exclusively with n-grams since it achieves better performance during training models on several different datasets from different domains.
On the other hand, by testing the models obtained based on the DS3 dataset on the data DS2, an average drop in performance was recorded using all models and all data analyzing methods compared to both training and testing the models on the dataset DS2, but by combining the analysis with n-grams and LIWC, all models achieved higher maximums accuracies. The LIWC analysis on all models gives an average accuracy of 71.08%, which is 2.05% less than in the case of training the model on DS2 data. The analysis with n-grams recorded an average drop in the accuracy of predictions of 1.92%, and the smallest average drop was achieved with the analysis with a combined approach (0.43%) (
Table 12 and
Table 13), which, on the other hand, for certain n-grams, achieved higher maxima in relation to the models trained on the DS2 dataset (
Table 7). Although the average accuracy when training all models on the combined DS3 dataset slightly drops, it again follows that combining the analysis with n-grams and LIWC has somewhat greater generalization power compared to exclusively using the n-gram analysis. In addition, the analysis with the combined approach, unlike the analysis with n-grams, achieved better average results on almost all sets of n-grams during the testing of the models based on the DS3 dataset on the DS1 and DS2 data (
Table 15). The biggest difference in the performance of the models obtained with the n-gram analysis and the combined approach of analysis is visible during the testing of models based on the DS3 on the DS2 data by analyzing trigrams where the combined approach achieves a 16.24% higher accuracy.
5.3. Model Applicability
Examining the possibility of mutual applicability by testing the models obtained based on the datasets DS1 and DS2 on the datasets DS2 and DS1, it was concluded that the n-gram analysis gives the best average predictions compared to other data analyzing methods. When testing models based on the DS2 on the DS1 data, the n-gram analysis even achieves an increase in the average accuracy of all models compared to training and testing the models on the DS1 data (7.77%). The LIWC analysis, on the other hand, shows the least applicability to other datasets. As a result of the stated claims, the analysis by combining n-grams and LIWC achieves less favorable applicability than the analysis with n-grams, but it is still better than the analysis with LIWC. It can be concluded that n-grams are the most robust analysis method that allows the greatest flexibility when applying models trained on one dataset to another.
6. Conclusions
Deception detection has turned out to be quite a demanding problem considering the various inherent limitations. The first problem encountered is finding validly labeled true and false data. Given that there is no absolutely reliable method of verifying the veracity of the same information, such a problem was approached in this study with caution, taking into account the amount of motivation and sincerity the people demonstrate when answering the defined survey questions during the data collection procedure.
Machine learning models proved to be successful when working on these collected datasets, which once again confirmed the existence of hidden linguistic features of deception present in verbal communication. Natural language processing methods achieved satisfactory results while LIWC analysis and the combined analysis of n-grams and LIWC proved to be the most successful in deception detection. By examining the possibility of generalization, the mentioned methods also achieved better performance compared to the analysis with n-grams, especially on trigrams, where the analysis using a combined approach achieved significantly better prediction compared to the analysis exclusively with n-grams. Such detected generalization is in line with the recent research efforts leading to conclusions that “deceptive text is more formulaic and less varied than truthful text”, however more research in this area is warranted [
20]. However, during the testing of the mutual applicability of the models, the n-gram analysis proved to be a more robust method. While testing the performance of the models obtained based on the DS1 dataset on the DS2 data, the n-gram analysis achieved better results compared to training and testing the models on own data (DS1). On the other hand, the LIWC analysis proved to be the most inflexible when it came to its applicability to other datasets.
Machine learning models with LIWC can be used independently in the detection of deception with certain limitations, such as the fact that they are much less applicable to the datasets on which they have not been trained. The combined approach with n-grams and LIWC in most cases allows for even more successful differentiation between truth and lies. Therefore, machine learning models and the approach to deception detection should be carefully selected depending on the specifics of the given problem, such as the need for applicability to other datasets or the possibility of generalization.
In addition to the scientific value of this study, the approach has practical advantages. Unlike state-of-the-art deep learning models, which can be computationally intensive and time-consuming, our approach requires less computational resources and is faster. This makes it more accessible and feasible for researchers and practitioners who may not have access to high-performance computing resources or who need to process large amounts of data quickly. Moreover, the efficiency of our approach does not compromise its effectiveness in detecting deception. By combining psycho-linguistic analysis and n-grams, our study achieves high classification accuracy, especially on trigrams, which is comparable to state-of-the-art models. Therefore, our approach not only provides a more practical solution, but also delivers comparable results to more resource-intensive methods.
Furthermore, our study highlights the importance of considering the subjectivity of the data when analyzing it for deception, which is a crucial factor in the effectiveness of any machine learning model. By exploring the use of a psycho-linguistic analysis, our study also demonstrates the potential benefits of incorporating linguistic features beyond just n-grams, which could inspire further research in this area.
Author Contributions
Conceptualization, I.B. and B.B.; Methodology, I.B. and B.B; Software, B.B.; Validation, I.B., B.B. and M.B.B.; Formal Analysis, B.B.; Investigation, I.B. and B.B.; Resources, I.B.; Data Curation, B.B.; Writing—Original Draft Preparation, B.B.; Writing—Review & Editing, B.B., I.B. and M.B.B.; Visualization, B.B.; Supervision, I.B.; Project Administration, I.B.; Funding Acquisition, I.B. All authors have read and agreed to the published version of the manuscript.
Funding
This research received no external funding.
Data Availability Statement
The data presented in this study are available on request from the corresponding author. The data are not publicly available due to the duration of the review process, after which they will be made available as a public repository.
Conflicts of Interest
The authors declare no conflict of interest.
Appendix A
| Reference | Main Findings |
|---|
| DePaulo et al., 1996 [1] | Individuals lie frequently, with most of the lies being minor and aimed at protecting the self or others. |
| Zhou et al., 2004 [2] | SVM and NB classifiers performed the best in detecting deception in computer-mediated communication. |
| Hancock et al., 2005 [3] | Deceptive and truthful messages can be distinguished using linguistic features such as words, syntax, and punctuation. |
| Ott et al., 2011 [4] | An algorithm that combines lexical, syntactic, and discourse features can accurately identify deceptive opinion spam. |
| Feng et al., 2012 [5] | A method that uses syntax-based features can achieve high accuracy in detecting deceptive language. |
| Pérez-Rosas et al., 2015 [6] | Linguistic cues can help identify deception in real-life trial data, and combining different types of features can lead to better performance. |
| Poesio and Fornaciari, 2018 [7] | A combination of lexical, syntactic, and semantic features can achieve high accuracy in identifying deceptive text. |
| Mihalcea and Strapparava, 2009 [8] | Lexical, syntactic, and discourse features can be used to automatically recognize the deceptive language. |
| Mahon, 2016 [9] | The concepts of lying and deception are complex, and different definitions have been proposed. |
| Van Swol et al., 2015 [11] | People are more likely to detect deception in face-to-face communication than in computer-mediated communication. |
| Hancock et al., 2008 [12] | Deception involves more cognitive effort than truth-telling, and deception can be detected using linguistic features. |
| Burgoon and Buller, 2015 [13] | This theory proposes that deception is a process that involves both the deceiver and the receiver, and that communication is a strategic game. |
| Alowibdi et al., 2015 [18] | A machine learning approach can effectively detect deceptive tweets. |
| Barsever et al., 2020 [19] | BERT-based models can be effectively used for lie detection. |
| Fornaciari et al., 2021 [20] | The BERTective model integrates contextual information and language models for improved deception detection. |
Appendix B
| | LR | SVM | NB | RF |
|---|
DS1:
Climate change | Allnone | Allnone | Allnone | Allnone |
| Culture | Culture | Culture | Culture |
| I | I | I | I |
| They | They | They | They |
| BigWords | Negate | Negate | Negate |
| Clout | Insight | Insight | Insight |
| Conj | Politic | Conj | Politic |
| curiosity | WPS | WPS | WPS |
| DS2: COVID-19 | Family | Family | Family | Family |
| Exclam | Exclam | Exclam | Exclam |
| Apostro | Apostro | Apostro | Apostro |
| WPS | WPS | WPS | WPS |
| Allnone | Allnone | Allnone | Allnone |
| Comma | Comma | Comma | Comma |
| BigWords | BigWords | Negate | BigWords |
| Negate | | Work | Negate |
| Cause | | | Cause |
| Socrefs | | | Socrefs |
| Time | | | Time |
| netspeak | | | netspeak |
DS3:
Climate change + COVID-19 | Tone | Tone | WC | Tone |
| WPS BigWords They | WPS | You | WPS |
| Conj | BigWords | They | BigWords |
| Negate Allnone Insight Prosocial Family | They | Negate | They |
| Politic | Conj | Allnone | Conj |
| Work Curiosity Motion Comma Exclam | Negate | Insight | Negate |
| | Allnone | Family | Allnone |
| | Insight Prosocial Family | | Insight |
| | Politic | | Prosocial |
| | Work | | Family |
| | Curiosity | | Politic |
| | | | Work |
| | | | Curiosity |
| | | | Motion |
| | | | Comma |
| | | | Exclam |
References
- DePaulo, B.M.; Kirkendol, S.E.; Kashy, D.A.; Wyer, M.M.; Epstein, J.A. Lying in Everyday Life. J. Pers. Soc. Psychol. 1996, 70, 979–995. [Google Scholar] [CrossRef] [PubMed]
- Zhou, L.; Burgoon, J.K.; Twitchell, D.P.; Qin, T.; Nunamaker, J.F. A comparison of classification methods for predicting deception in computer-mediated communication. J. Manag. Inf. Syst. 2004, 20, 139–166. [Google Scholar] [CrossRef]
- Hancock, J.T.; Curry, L.; Goorha, S.; Woodworth, M. Automated linguistic analysis of deceptive and truthful synchronous computer-mediated communication. In Proceedings of the 38th Annual Hawaii International Conference on System Sciences, Big Island, HI, USA, 3–6 June 2005; p. 22. [Google Scholar] [CrossRef]
- Ott, M.; Choi, Y.; Cardie, C.; Hancock, J.T. Finding deceptive opinion spam by any stretch of the imagination. In Proceedings of the 49th Annual Meeting of the Association for Computational Linguistics: Human Language Technologies, Portland, OR, USA, 19–24 June 2011; Volume 1, pp. 309–319. [Google Scholar]
- Feng, S.; Banerjee, R.; Choi, Y. Syntactic stylometry for deception detection. In Proceedings of the 50th Annual Meeting of the Association for Computational Linguistics, Jeju Island, Republic of Korea, 8–14 July 2012; Volume 2, pp. 171–175. [Google Scholar]
- Pérez-Rosas, V.; Abouelenien, M.; Mihalcea, R.; Burzo, M. Deception detection using real-life trial data. In Proceedings of the 2015 ACM on International Conference on Multimodal Interaction, Washington, DC, USA, 9–13 November 2015; pp. 59–66. [Google Scholar] [CrossRef]
- Poesio, M.; Fornaciari, T. Detecting Deception in Text Using NLP Methods. Available online: https://research.signal-ai.com/assets/Deception_Detection_with_NLP.pdf (accessed on 25 April 2023).
- Mihalcea, R.; Strapparava, C. The lie detector: Explorations in the automatic recognition of deceptive language. In Proceedings of the ACL-IJCNLP 2009 Conference, Suntec, Singapore, 4 August 2009; pp. 309–312. [Google Scholar]
- Mahon, J.E. The Definition of Lying and Deception. In The Stanford Encyclopedia of Philosophy (Winter 2016 Edition); Zalta, E.N., Ed.; Stanford University: Stanford, CA, USA, 2016. [Google Scholar]
- Isenberg, A. Aesthetics and the theory of criticism: Selected essays of Arnold Isenberg; University of Chicago Press: Chicago, NY, USA, 1973; p. 322. ISBN 978-0226385129. [Google Scholar]
- Van Swol, L.M.; Braun, M.T.; Kolb, M.R. Deception, Detection, Demeanor, and Truth Bias in Face-To-Face and Computer-Mediated Communication. Commun. Res. 2015, 42, 1116–1142. [Google Scholar] [CrossRef]
- Hancock, J.T.; Curry, L.E.; Goorha, S.; Woodworth, M. On lying and being lied to: A linguistic analysis of deception in computer-mediated communication. Discourse Process. 2008, 45, 1–23. [Google Scholar] [CrossRef]
- Burgoon, J.K.; Buller, D.B. Interpersonal Deception Theory. Commun. Theory 1996, 6, 203–242. [Google Scholar] [CrossRef]
- National Research Council. The Polygraph and Lie Detection; National Research Council: Washington, DC, USA, 2002. [Google Scholar] [CrossRef]
- Pennebaker, J.W.; Chung, C.K.; Ireland, M.; Gonzales, A.; Booth, R.J. The Development and Psychometric Properties of LIWC2007. Psychol. Sci. Univ. Tex. Austin Dev. 2007, 1, 1–22. [Google Scholar] [CrossRef]
- Boyd, R.; Ashokkumar, A.; Seraj, S.; Pennebaker, J. The Development and Psychometric Properties of LIWC-22. Available online: https://www.livc.app (accessed on 25 April 2023).
- Tausczik, Y.R.; Pennebaker, J.W. The psychological meaning of words: LIWC and computerized text analysis methods. J. Lang. Soc. Psychol. 2010, 29, 24–54. [Google Scholar] [CrossRef]
- Alowibdi, J.S.; Buy, U.A.; Yu, P.S.; Ghani, S.; Mokbel, M. Deception detection in Twitter. Soc. Netw. Anal. Min. 2015, 5, 32. [Google Scholar] [CrossRef]
- Barsever, D.; Singh, S.; Neftci, E. Building a Better Lie Detector with BERT: The Difference between Truth and Lies. In Proceedings of the 2020 International Joint Conference on Neural Networks (IJCNN), Glasgow, UK, 19–24 July 2020. [Google Scholar] [CrossRef]
- Fornaciari, T.; Bianchi, F.; Poesio, M.; Hovy, D. BERTective: Language models and contextual information for deception detection. In Proceedings of the 16th Conference of the European Chapter of the Association for Computational Linguistics, Online, 19–23 April 2021. [Google Scholar] [CrossRef]
Figure 1.
Block diagram of the proposed solution.
Figure 1.
Block diagram of the proposed solution.
Figure 2.
Block diagram of the data pre-processing process.
Figure 2.
Block diagram of the data pre-processing process.
Figure 3.
Models trained and tested on DS1 (climate change dataset).
Figure 3.
Models trained and tested on DS1 (climate change dataset).
Figure 4.
Models trained on DS3 (combined dataset) and tested on DS1 (climate change dataset).
Figure 4.
Models trained on DS3 (combined dataset) and tested on DS1 (climate change dataset).
Figure 5.
Models trained and tested on DS2 (COVID-19 dataset).
Figure 5.
Models trained and tested on DS2 (COVID-19 dataset).
Figure 6.
Models trained on DS3 (combined dataset) and tested on DS2 (COVID-19 dataset).
Figure 6.
Models trained on DS3 (combined dataset) and tested on DS2 (COVID-19 dataset).
Figure 7.
Models trained on DS1 (climate change dataset) and tested on DS2 (COVID-19 dataset).
Figure 7.
Models trained on DS1 (climate change dataset) and tested on DS2 (COVID-19 dataset).
Figure 8.
Models trained on DS2 (COVID-19 dataset) and tested on DS1 (climate dataset).
Figure 8.
Models trained on DS2 (COVID-19 dataset) and tested on DS1 (climate dataset).
Table 1.
Statistical overview of the records obtained through the Clickworker platform.
Table 1.
Statistical overview of the records obtained through the Clickworker platform.
| | DS1: Climate Change | DS2: COVID-19 |
|---|
| The initial number of records | 168 | 150 |
| Number of invalid records | 25 | 21 |
| Number of BOT detections | 11 | 11 |
| The final number of records (including corrected) | 132 | 118 |
Table 2.
LIWC-22 dimensions and reliability [
16].
Table 2.
LIWC-22 dimensions and reliability [
16].
| Category | Abbrev. | Description/Most Frequently Used Examples | Words/
Entries in
Category | Internal
Consistency:
Cronbach’s α | Internal
Consistency:
KR-20 |
|---|
| Summary Variables | | | | | |
| Word count | WC | Total word count | - | - | - |
| Clout | Clout | Language of leadership, status | - | - | - |
| Authentic | Authentic | Perceived honesty, genuineness | - | - | - |
| Emotional tone | Tone | Degree or positive (negative) tone | - | - | - |
| Words per sentence | WPS | Average words per sentence | - | - | - |
| Big words | BigWords | Percent words 7 letters or longer | - | - | - |
| Linguistic Dimensions | Linguistic | | 4933 | 0.36 | 1.00 |
| 1st person singular | i | I, me, my, myself | 6/74 | 0.49 | 0.85 |
| 2nd person | you | you, your, u, yourself | 14/59 | 0.37 | 0.82 |
| 3rd person plural | they | they, their, them, themsel | 7/20 | 0.36 | 0.69 |
| Negations | negate | not, no, never, nothing | 8/247 | 0.49 | 0.92 |
| Conjunctions | conj | and, but, so, as | 49/65 | 0.11 | 0.89 |
| Psychological Processes |
| All-or-none | allnone | all, no, never, always | 35 | 0.37 | 0.88 |
| Cognitive processes | cogproc | but, not, if, or, know | 1365 | 0.67 | 0.99 |
| Insight | insight | know, how, think, feel | 383 | 0.43 | 0.96 |
| Causation | cause | how, because, make, why | 169 | 0.21 | 0.90 |
| Prosocial behavior | prosocial | care, help, thank, please | 242 | 0.49 | 0.89 |
| Social referents | socrefs | you, we, he, she | 1232 | 0.35 | 0.97 |
| Family | family | parent, mother, father, baby | 194 | 0.48 | 0.89 |
| Expanded Dictionary |
| Culture | Culture | car, united states, govern, phone | 772 | 0.67 | 0.92 |
| Politics | politic | united states, govern, congress,
senat | 339 | 0.75 | 0.91 |
| Work | work | work, school, working, class | 547 | 0.74 | 0.95 |
| Motives |
| Risk | risk | secur, protect, pain, risk | 128 | 0.28 | 0.86 |
| Curiosity | curiosity | scien, look for, research, wonder | 76 | 0.26 | 0.79 |
| Motion | motion | go, come, went, came | 485 | 0.42 | 0.97 |
| Time orientation |
| Time | time | when, now, then, day | 464 | 0.50 | 0.97 |
| Netspeak | netspeak | :), u, lol, haha | 439 | 0.73 | 0.96 |
Table 3.
Performance of selected machine learning models achieved by applying natural language processing techniques to the climate change dataset (DS1).
Table 3.
Performance of selected machine learning models achieved by applying natural language processing techniques to the climate change dataset (DS1).
| | LR | SVM | NB | RF |
|---|
| Accuracy | Precision | Recall | Accuracy | Precision | Recall | Accuracy | Precision | Recall | Accuracy | Precision | Recall |
|---|
| | LIWC | 78.02 | 76.83 | 80.99 | 77.24 | 72.58 | 90.27 | 76.47 | 73.41 | 85.71 | 78.05 | 74.89 | 78.08 |
| 1,1 | n-grams | 75.00 | 73.11 | 80.44 | 72.74 | 71.05 | 78.13 | 76.15 | 73.84 | 82.64 | 72.71 | 74.67 | 71.17 |
| n-grams + LIWC | 78.02 | 78.19 | 78.68 | 76.14 | 78.02 | 73.46 | 76.91 | 75.80 | 81.15 | 73.43 | 72.57 | 75.71 |
| 1,2 | n-grams | 79.16 | 76.96 | 83.52 | 78.80 | 76.31 | 83.52 | 81.47 | 78.77 | 86.48 | 74.62 | 74.05 | 73.41 |
| n-grams + LIWC | 78.80 | 78.32 | 80.22 | 75.77 | 76.97 | 74.18 | 81.47 | 77.48 | 88.74 | 74.96 | 74.00 | 77.20 |
| 2,2 | n-grams | 78.79 | 76.72 | 81.98 | 76.52 | 75.02 | 79.67 | 79.56 | 77.67 | 82.69 | 72.38 | 70.80 | 69.73 |
| n-grams + LIWC | 78.40 | 77.53 | 80.99 | 77.21 | 76.96 | 77.14 | 77.26 | 75.83 | 81.98 | 74.22 | 73.21 | 76.54 |
| 1,3 | n-grams | 80.68 | 78.89 | 83.52 | 76.13 | 74.82 | 78.96 | 79.94 | 77.94 | 83.57 | 75.04 | 73.31 | 72.53 |
| n-grams + LIWC | 79.56 | 78.33 | 82.53 | 76.52 | 76.84 | 75.66 | 78.77 | 76.16 | 85.05 | 75.34 | 74.22 | 77.97 |
| 2,3 | n-grams | 76.14 | 74.19 | 79.62 | 76.14 | 75.61 | 77.36 | 78.42 | 75.97 | 83.46 | 71.25 | 75.01 | 68.30 |
| n-grams + LIWC | 79.16 | 78.12 | 81.76 | 79.52 | 77.11 | 83.96 | 79.57 | 76.50 | 83.46 | 74.97 | 73.86 | 77.25 |
| 3,3 | n-grams | 68.99 | 67.07 | 74.34 | 68.59 | 67.79 | 72.75 | 70.11 | 69.69 | 72.03 | 67.08 | 64.05 | 65.99 |
| n-grams + LIWC | 78.80 | 77.59 | 81.76 | 74.96 | 73.67 | 77.97 | 74.92 | 74.21 | 76.48 | 74.20 | 73.11 | 77.31 |
Table 4.
Performance of selected machine learning models achieved by applying natural language processing techniques to the COVID-19 dataset (DS2).
Table 4.
Performance of selected machine learning models achieved by applying natural language processing techniques to the COVID-19 dataset (DS2).
| | LR | SVM | NB | RF |
|---|
| Accuracy | Precision | Recall | Accuracy | Precision | Recall | Accuracy | Precision | Recall | Accuracy | Precision | Recall |
|---|
| | LIWC | 74.62 | 75.13 | 76.36 | 73.32 | 72.37 | 77.27 | 74.58 | 74.75 | 75.53 | 69.98 | 70.88 | 69.32 |
| 1,1 | n-grams | 67.69 | 67.70 | 69.77 | 70.76 | 70.29 | 74.70 | 69.62 | 71.49 | 66.36 | 66.09 | 67.53 | 62.05 |
| n-grams + LIWC | 75.05 | 75.72 | 77.27 | 73.37 | 73.98 | 73.94 | 72.55 | 75.45 | 69.77 | 71.68 | 67.82 | 69.70 |
| 1,2 | n-grams | 69.22 | 68.64 | 72.27 | 66.59 | 65.30 | 70.53 | 73.86 | 72.60 | 78.11 | 63.95 | 67.00 | 70.53 |
| n-grams + LIWC | 73.79 | 74.05 | 75.53 | 74.64 | 75.23 | 75.61 | 76.39 | 76.17 | 78.18 | 71.67 | 72.51 | 71.44 |
| 2,2 | n-grams | 69.17 | 69.97 | 72.35 | 72.05 | 72.68 | 70.68 | 70.04 | 69.90 | 73.94 | 67.45 | 70.20 | 62.95 |
| n-grams + LIWC | 73.80 | 73.81 | 76.36 | 76.34 | 77.35 | 77.20 | 70.87 | 69.59 | 74.77 | 72.97 | 72.54 | 70.61 |
| 1,3 | n-grams | 70.49 | 70.35 | 73.11 | 65.69 | 64.46 | 69.62 | 71.29 | 69.67 | 77.27 | 64.84 | 65.00 | 65.53 |
| n-grams + LIWC | 74.64 | 75.16 | 76.44 | 74.64 | 75.59 | 74.77 | 73.82 | 73.22 | 76.52 | 71.25 | 70.29 | 69.70 |
| 2,3 | n-grams | 71.67 | 71.34 | 74.85 | 68.71 | 67.01 | 68.68 | 70.91 | 70.43 | 70.40 | 70.43 | 70.83 | 67.20 |
| n-grams + LIWC | 74.66 | 74.88 | 77.20 | 74.64 | 74.17 | 77.20 | 69.20 | 67.82 | 75.76 | 72.93 | 70.79 | 73.03 |
| 3,3 | n-grams | 59.33 | 58.80 | 63.03 | 58.89 | 59.44 | 58.71 | 59.73 | 59.68 | 61.21 | 57.59 | 55.78 | 76.52 |
| n-grams + LIWC | 73.77 | 74.52 | 75.53 | 72.48 | 73.29 | 73.71 | 65.20 | 64.04 | 69.47 | 69.98 | 70.81 | 75.53 |
Table 5.
Performance of selected machine learning models achieved by applying natural language processing techniques on the combined climate change and COVID-19 datasets (DS3).
Table 5.
Performance of selected machine learning models achieved by applying natural language processing techniques on the combined climate change and COVID-19 datasets (DS3).
| | LR | SVM | NB | RF |
|---|
| Accuracy | Precision | Recall | Accuracy | Precision | Recall | Accuracy | Precision | Recall | Accuracy | Precision | Recall |
|---|
| | LIWC | 74.40 | 73.90 | 76.40 | 74.60 | 73.94 | 77.60 | 72.20 | 70.34 | 78.00 | 74.20 | 74.09 | 71.60 |
| 1,1 | n-grams | 70.40 | 69.57 | 72.80 | 69.00 | 68.71 | 71.20 | 72.20 | 72.72 | 71.20 | 69.00 | 67.18 | 69.20 |
| n-grams + LIWC | 75.00 | 74.89 | 76.80 | 73.80 | 72.97 | 77.20 | 72.20 | 72.06 | 72.80 | 71.60 | 71.89 | 70.40 |
| 1,2 | n-grams | 72.00 | 70.71 | 76.00 | 70.60 | 69.83 | 73.60 | 74.00 | 69.79 | 72.80 | 69.20 | 66.36 | 66.40 |
| n-grams + LIWC | 75.60 | 75.20 | 77.60 | 76.60 | 74.98 | 80.40 | 73.40 | 72.74 | 75.20 | 75.40 | 71.43 | 70.00 |
| 2,2 | n-grams | 72.80 | 72.29 | 75.60 | 71.80 | 71.05 | 75.20 | 72.80 | 73.06 | 73.20 | 69.60 | 70.51 | 69.20 |
| n-grams + LIWC | 76.20 | 75.19 | 79.20 | 77.00 | 75.52 | 80.80 | 75.20 | 74.10 | 78.40 | 74.00 | 73.48 | 75.20 |
| 1,3 | n-grams | 71.60 | 70.70 | 74.40 | 70.40 | 70.34 | 71.60 | 73.40 | 72.39 | 76.00 | 68.60 | 70.93 | 70.40 |
| n-grams + LIWC | 75.60 | 75.12 | 88.60 | 74.20 | 73.12 | 77.20 | 74.00 | 73.20 | 76.40 | 73.20 | 72.20 | 73.60 |
| 2,3 | n-grams | 70.20 | 69.46 | 73.60 | 70.20 | 69.09 | 74.00 | 71.40 | 70.43 | 74.40 | 67.20 | 68.75 | 72.80 |
| n-grams + LIWC | 75.20 | 74.32 | 78.00 | 76.00 | 74.54 | 80.00 | 72.00 | 71.19 | 74.40 | 74.40 | 73.34 | 71.60 |
| 3,3 | n-grams | 65.80 | 65.08 | 69.60 | 64.80 | 63.40 | 71.20 | 65.00 | 64.59 | 68.00 | 63.20 | 60.49 | 85.20 |
| n-grams + LIWC | 74.20 | 73.29 | 76.80 | 73.20 | 72.83 | 74.80 | 70.40 | 69.02 | 74.80 | 75.00 | 73.86 | 73.20 |
Table 6.
Performance comparison of models trained and tested on DS1 (climate change dataset) with the models trained on DS3 (combined dataset) and tested on DS1.
Table 6.
Performance comparison of models trained and tested on DS1 (climate change dataset) with the models trained on DS3 (combined dataset) and tested on DS1.
| | | DS1 Models Tested on DS1 | DS3 Models Tested on DS1 |
| | LR | SVM | NB | RF | LR | SVM | NB | RF |
| LIWC | 78.02 | 77.24 | 76.47 | 78.05 | 81.54 | 81.54 | 77.31 | 71.38 |
| 1,1 | n-grams | 75.00 | 72.74 | 76.15 | 72.71 | 71.92 | 69.62 | 70.77 | 68.85 |
| n-grams + LIWC | 78.02 | 76.14 | 76.91 | 73.43 | 74.62 | 80.00 | 83.46 | 78.08 |
| 1,2 | n-grams | 79.16 | 78.80 | 81.47 | 74.62 | 73.85 | 72.31 | 73.46 | 68.85 |
| n-grams + LIWC | 78.80 | 75.77 | 81.47 | 74.96 | 81.92 | 80.38 | 77.69 | 80.77 |
| 2,2 | n-grams | 78.79 | 76.52 | 79.56 | 72.38 | 73.46 | 67.69 | 73.85 | 69.62 |
| n-grams + LIWC | 78.40 | 77.21 | 77.26 | 74.22 | 76.92 | 76.00 | 80.77 | 77.69 |
| 1,3 | n-grams | 80.68 | 76.13 | 79.94 | 75.04 | 72.69 | 72.69 | 72.69 | 76.15 |
| n-grams + LIWC | 79.56 | 76.52 | 78.77 | 75.34 | 76.54 | 82.31 | 77.69 | 78.08 |
| 2,3 | n-grams | 76.14 | 76.14 | 78.42 | 71.25 | 77.31 | 77.31 | 76.92 | 68.46 |
| n-grams + LIWC | 79.16 | 79.52 | 79.57 | 74.97 | 73.85 | 78.85 | 80.77 | 76.54 |
| 3,3 | n-grams | 68.99 | 68.59 | 70.11 | 67.08 | 67.69 | 68.08 | 67.31 | 65.38 |
| n-grams + LIWC | 78.80 | 74.96 | 74.92 | 74.20 | 69.23 | 79.62 | 76.54 | 73.85 |
Table 7.
Performance comparison of models trained and tested on DS2 (COVID-19 dataset) with the models trained on DS3 (combined dataset) and tested on DS2.
Table 7.
Performance comparison of models trained and tested on DS2 (COVID-19 dataset) with the models trained on DS3 (combined dataset) and tested on DS2.
| | | DS2 Models Tested on DS2 | DS3 Models Tested on DS2 |
| | LR | SVM | NB | RF | LR | SVM | NB | RF |
| LIWC | 74.62 | 73.32 | 74.58 | 69.98 | 72.04 | 70.38 | 71.58 | 70.33 |
| 1,1 | n-grams | 67.69 | 70.76 | 69.62 | 66.09 | 61.67 | 61.67 | 62.92 | 73.33 |
| n-grams + LIWC | 75.05 | 73.37 | 72.55 | 71.68 | 70.00 | 76.67 | 72.08 | 72.92 |
| 1,2 | n-grams | 69.22 | 66.59 | 73.86 | 63.95 | 66.67 | 66.25 | 72.08 | 65.83 |
| n-grams + LIWC | 73.79 | 74.64 | 76.39 | 71.67 | 72.92 | 71.25 | 72.92 | 73.33 |
| 2,2 | n-grams | 69.17 | 72.05 | 70.04 | 67.45 | 75.42 | 72.92 | 68.75 | 59.17 |
| n-grams + LIWC | 73.80 | 76.34 | 70.87 | 72.97 | 70.00 | 74.17 | 68.75 | 69.58 |
| 1,3 | n-grams | 70.49 | 65.69 | 71.29 | 64.84 | 65.83 | 64.58 | 73.33 | 63.33 |
| n-grams + LIWC | 74.64 | 74.64 | 73.82 | 71.25 | 73.33 | 73.33 | 75.00 | 69.58 |
| 2,3 | n-grams | 71.67 | 68.71 | 70.91 | 70.43 | 66.25 | 65.83 | 66.25 | 62.08 |
| n-grams + LIWC | 74.66 | 74.64 | 69.20 | 72.93 | 76.67 | 69.58 | 68.33 | 78.33 |
| 3,3 | n-grams | 59.33 | 58.89 | 59.73 | 57.59 | 60.83 | 62.08 | 59.17 | 53.75 |
| n-grams + LIWC | 73.77 | 72.48 | 65.20 | 69.98 | 73.75 | 76.25 | 77.50 | 73.33 |
Table 8.
Accuracy comparison of DS3 (combined dataset) models tested on DS1 (climate change dataset) and DS2 (COVID-19 dataset) using selected data processing techniques.
Table 8.
Accuracy comparison of DS3 (combined dataset) models tested on DS1 (climate change dataset) and DS2 (COVID-19 dataset) using selected data processing techniques.
| | | LR | SVM | NB | RF |
| | | DS3 Models Tested on
Dataset DS1 | DS3 Models Tested on
Dataset DS2 | DS3 Models Tested on
Dataset DS1 | DS3 Models Tested on Dataset DS2 | DS3 Models Tested on Dataset DS1 | DS3 Models Tested on Dataset DS2 | DS3 Models Tested on Dataset DS1 | DS3 Models Tested on Dataset DS2 |
| LIWC | 81.54 | 72.04 | 81.54 | 70.38 | 77.31 | 71.58 | 71.38 | 70.33 |
| 1,1 | n-grams | 71.92 | 61.67 | 69.62 | 61.67 | 70.77 | 62.92 | 68.85 | 73.33 |
| n-grams + LIWC | 74.62 | 70 | 80 | 76.67 | 83.46 | 72.08 | 78.08 | 72.92 |
| 1,2 | n-grams | 73.85 | 66.67 | 72.31 | 66.25 | 73.46 | 72.08 | 68.85 | 65.83 |
| n-grams + LIWC | 81.92 | 72.92 | 80.38 | 71.25 | 77.69 | 72.92 | 80.77 | 73.33 |
| 2,2 | n-grams | 73.46 | 75.42 | 67.69 | 72.92 | 73.85 | 68.75 | 69.62 | 59.17 |
| n-grams + LIWC | 76.92 | 70 | 76 | 74.17 | 80.77 | 68.75 | 77.69 | 69.58 |
| 1,3 | n-grams | 72.69 | 65.83 | 72.69 | 64.58 | 72.69 | 73.33 | 76.15 | 63.33 |
| n-grams + LIWC | 76.54 | 73.33 | 82.31 | 73.33 | 77.69 | 75 | 78.08 | 69.58 |
| 2,3 | n-grams | 77.31 | 66.25 | 77.31 | 65.83 | 76.92 | 66.25 | 68.46 | 62.08 |
| n-grams + LIWC | 73.85 | 76.67 | 78.85 | 69.58 | 80.77 | 68.33 | 76.54 | 78.33 |
| 3,3 | n-grams | 67.69 | 60.83 | 68.08 | 62.08 | 67.31 | 59.17 | 65.38 | 53.75 |
| n-grams + LIWC | 69.23 | 73.75 | 79.62 | 76.25 | 76.54 | 77.5 | 73.85 | 73.33 |
Table 9.
Comparison of model accuracies on DS1 (climate change dataset), DS2 (COVID-19 dataset), and DS3 (combined dataset) using the selected data processing techniques.
Table 9.
Comparison of model accuracies on DS1 (climate change dataset), DS2 (COVID-19 dataset), and DS3 (combined dataset) using the selected data processing techniques.
| | | LR | SVM | NB | RF |
| | DS1 | DS2 | DS3 | DS1 | DS2 | DS3 | DS1 | DS2 | DS3 | DS1 | DS2 | DS3 |
| LIWC | 78.02 | 74.62 | 74.40 | 77.24 | 73.32 | 74.60 | 76.47 | 74.58 | 72.20 | 78.05 | 69.98 | 74.20 |
| 1,1 | n-grams | 75.00 | 67.69 | 70.40 | 72.74 | 70.76 | 69.00 | 76.15 | 69.62 | 72.20 | 72.71 | 66.09 | 69.00 |
| n-grams + LIWC | 78.02 | 75.05 | 75.00 | 76.14 | 73.37 | 73.80 | 76.91 | 72.55 | 72.20 | 73.43 | 71.68 | 71.60 |
| 1,2 | n-grams | 79.16 | 69.22 | 72.00 | 78.80 | 66.59 | 70.60 | 81.47 | 73.86 | 74.00 | 74.62 | 63.95 | 69.20 |
| n-grams + LIWC | 78.80 | 73.79 | 75.60 | 75.77 | 74.64 | 76.60 | 81.47 | 76.39 | 73.40 | 74.96 | 71.67 | 75.40 |
| 2,2 | n-grams | 78.79 | 69.17 | 72.80 | 76.52 | 72.05 | 71.80 | 79.56 | 70.04 | 72.80 | 72.38 | 67.45 | 69.60 |
| n-grams + LIWC | 78.40 | 73.80 | 76.20 | 77.21 | 76.34 | 77.00 | 77.26 | 70.87 | 75.20 | 74.22 | 72.97 | 74.00 |
| 1,3 | n-grams | 80.68 | 70.49 | 71.60 | 76.13 | 65.69 | 70.40 | 79.94 | 71.29 | 73.40 | 75.04 | 64.84 | 68.60 |
| n-grams + LIWC | 79.56 | 74.64 | 75.60 | 76.52 | 74.64 | 74.20 | 78.77 | 73.82 | 74.00 | 75.34 | 71.25 | 73.20 |
| 2,3 | n-grams | 76.14 | 71.67 | 70.20 | 76.14 | 68.71 | 70.20 | 78.42 | 70.91 | 71.40 | 71.25 | 70.43 | 67.20 |
| n-grams + LIWC | 79.16 | 74.66 | 75.20 | 79.52 | 74.64 | 76.00 | 79.57 | 69.20 | 72.00 | 74.97 | 72.93 | 74.40 |
| 3,3 | n-grams | 68.99 | 59.33 | 65.80 | 68.59 | 58.89 | 64.80 | 70.11 | 59.73 | 65.00 | 67.08 | 57.59 | 63.20 |
| n-grams + LIWC | 78.80 | 73.77 | 74.20 | 74.96 | 72.48 | 73.20 | 74.92 | 65.20 | 70.40 | 74.20 | 69.98 | 75.00 |
Table 10.
Performance comparison of models trained on DS1 (climate change dataset) and tested on DS1 and DS2 (COVID-19 dataset).
Table 10.
Performance comparison of models trained on DS1 (climate change dataset) and tested on DS1 and DS2 (COVID-19 dataset).
| | | DS1 Models Tested on Dataset DS1 | DS1 Models Tested on Dataset DS2 |
| | LR | SVM | NB | RF | LR | SVM | NB | RF |
| LIWC | 78.02 | 77.24 | 76.47 | 78.05 | 67.34 | 64.37 | 64.38 | 63.08 |
| 1,1 | n-grams | 75.00 | 72.74 | 76.15 | 72.71 | 67.92 | 69.57 | 67.95 | 65.67 |
| n-grams + LIWC | 78.02 | 76.14 | 76.91 | 73.43 | 69.89 | 67.79 | 71.72 | 70.74 |
| 1,2 | n-grams | 79.16 | 78.80 | 81.47 | 74.62 | 69.66 | 70.00 | 72.21 | 65.40 |
| n-grams + LIWC | 78.80 | 75.77 | 81.47 | 74.96 | 70.29 | 67.79 | 73.44 | 67.84 |
| 2,2 | n-grams | 78.79 | 76.52 | 79.56 | 72.38 | 69.58 | 68.28 | 71.70 | 71.30 |
| n-grams + LIWC | 78.40 | 77.21 | 77.26 | 74.22 | 67.34 | 68.61 | 67.88 | 65.25 |
| 1,3 | n-grams | 80.68 | 76.13 | 79.94 | 75.04 | 69.66 | 70.49 | 73.04 | 65.67 |
| n-grams + LIWC | 79.56 | 76.52 | 78.77 | 75.34 | 69.86 | 68.62 | 73.82 | 69.93 |
| 2,3 | n-grams | 76.14 | 76.14 | 78.42 | 71.25 | 70.02 | 68.73 | 70.04 | 64.47 |
| n-grams + LIWC | 79.16 | 79.52 | 79.57 | 74.97 | 68.59 | 68.99 | 68.30 | 66.12 |
| 3,3 | n-grams | 68.99 | 68.59 | 70.11 | 67.08 | 59.75 | 60.18 | 61.92 | 57.59 |
| n-grams + LIWC | 78.80 | 74.96 | 74.92 | 74.20 | 67.74 | 67.32 | 64.80 | 66.03 |
Table 11.
Performance comparison of models trained on DS2 (COVID-19 dataset) and tested on DS2 and DS1 (Climate change dataset).
Table 11.
Performance comparison of models trained on DS2 (COVID-19 dataset) and tested on DS2 and DS1 (Climate change dataset).
| | | DS2 Models Tested on Dataset DS2 | DS2 Models Tested on Dataset DS1 |
| | LR | SVM | NB | RF | LR | SVM | NB | RF |
| LIWC | 74.62 | 73.32 | 74.58 | 69.98 | 66.99 | 65.47 | 65.57 | 64.02 |
| 1,1 | n-grams | 67.69 | 70.76 | 69.62 | 66.09 | 75.00 | 72.74 | 76.15 | 70.11 |
| n-grams + LIWC | 75.05 | 73.37 | 72.55 | 71.68 | 72.66 | 73.79 | 76.18 | 74.97 |
| 1,2 | n-grams | 69.22 | 66.59 | 73.86 | 63.95 | 78.40 | 78.79 | 80.68 | 72.29 |
| n-grams + LIWC | 73.79 | 74.64 | 76.39 | 71.67 | 73.79 | 78.73 | 80.71 | 73.43 |
| 2,2 | n-grams | 69.17 | 72.05 | 70.04 | 67.45 | 78.77 | 78.40 | 79.17 | 71.94 |
| n-grams + LIWC | 73.80 | 76.34 | 70.87 | 72.97 | 71.54 | 74.91 | 77.28 | 75.71 |
| 1,3 | n-grams | 70.49 | 65.69 | 71.29 | 64.84 | 79.90 | 81.05 | 81.44 | 72.71 |
| n-grams + LIWC | 74.64 | 74.64 | 73.82 | 71.25 | 74.57 | 74.94 | 79.96 | 76.11 |
| 2,3 | n-grams | 71.67 | 68.71 | 70.91 | 70.43 | 76.88 | 76.54 | 77.66 | 70.80 |
| n-grams + LIWC | 74.66 | 74.64 | 69.20 | 72.93 | 71.54 | 73.76 | 79.93 | 76.88 |
| 3,3 | n-grams | 59.33 | 58.89 | 59.73 | 57.59 | 69.36 | 69.34 | 70.50 | 64.00 |
| n-grams + LIWC | 73.77 | 72.48 | 65.20 | 69.98 | 71.54 | 71.21 | 71.27 | 73.46 |
Table 12.
Overview of trends by model for the 3 datasets collected (yellow color: maximum average accuracy obtained for each individual model and dataset; red color: maximum average accuracy obtained using all models on each individual dataset).
Table 12.
Overview of trends by model for the 3 datasets collected (yellow color: maximum average accuracy obtained for each individual model and dataset; red color: maximum average accuracy obtained using all models on each individual dataset).
| | LR | SVM | NB | RF | All Models |
|---|
| | DS1 | DS2 | DS3 | DS1 | DS2 | DS3 | DS1 | DS2 | DS3 | DS1 | DS2 | DS3 | DS1 | DS2 | DS3 |
|---|
| LIWC | 78.02 | 74.62 | 74.4 | 77.24 | 73.32 | 74.6 | 76.47 | 74.58 | 72.20 | 78.05 | 69.98 | 74.20 | 77.45 | 73.13 | 73.85 |
| n-grams | 76.46 | 67.93 | 70.47 | 74.82 | 67.12 | 69.47 | 77.61 | 69.24 | 71.47 | 72.18 | 65.06 | 67.80 | 75.27 | 67.34 | 69.80 |
| n-grams + LIWC | 78.79 | 74.29 | 75.30 | 76.69 | 74.35 | 75.13 | 78.15 | 71.34 | 72.87 | 74.52 | 71.75 | 73.93 | 77.04 | 73.33 | 74.31 |
Table 13.
Overview of trends by model for combined dataset DS3 tested individually on datasets DS1 and DS2 (yellow color: maximum average accuracy obtained for each individual model and dataset; red color: maximum average accuracy obtained using all models on each individual dataset).
Table 13.
Overview of trends by model for combined dataset DS3 tested individually on datasets DS1 and DS2 (yellow color: maximum average accuracy obtained for each individual model and dataset; red color: maximum average accuracy obtained using all models on each individual dataset).
| | LR | SVM | NB | RF | All Models |
|---|
| | DS3 Models Tested on DS1 Data | DS3 Models Tested on DS2 Data | DS3 Models Tested on DS1 Data | DS3 Models Tested on DS2 Data | DS3 Models Tested on DS1 Data | DS3 Models Tested on DS2 Data | DS3 Models Tested on DS1 Data | DS3 Models Tested on DS2 Data | DS3 Models Tested on DS1 Data | DS3 Models Tested on DS2 Data |
|---|
| LIWC | 81.54 | 72.04 | 81.54 | 70.38 | 77.31 | 71.58 | 71.38 | 70.33 | 77.94 | 71.08 |
| n-grams | 72.82 | 66.11 | 71.28 | 65.56 | 72.50 | 67.08 | 69.55 | 62.92 | 71.54 | 65.42 |
| n-grams + LIWC | 75.51 | 72.78 | 79.53 | 73.54 | 79.49 | 72.43 | 77.50 | 72.85 | 78.01 | 72.90 |
Table 14.
Overview of trends by methods on 3 selected datasets (colored values indicate the maximum accuracy obtained using a particular data processing method on each of the given datasets).
Table 14.
Overview of trends by methods on 3 selected datasets (colored values indicate the maximum accuracy obtained using a particular data processing method on each of the given datasets).
| | | All Models |
| | DS1 | DS2 | DS3 | The Average Accuracy Obtained by Training and
Testing Models on Datasets DS1, DS2 and DS3 |
| LIWC | 77.45 | 73.13 | 73.85 | 74.81 |
| 1,1 | n-grams | 74.15 | 68.54 | 70.15 | 70.95 |
| n-grams + LIWC | 76.13 | 73.16 | 73.15 | 74.15 |
| 1,2 | n-grams | 78.51 | 68.41 | 71.45 | 72.79 |
| n-grams + LIWC | 77.75 | 74.12 | 75.25 | 75.71 |
| 2,2 | n-grams | 76.81 | 69.68 | 71.75 | 72.75 |
| n-grams + LIWC | 76.77 | 73.50 | 75.60 | 75.29 |
| 1,3 | n-grams | 77.95 | 68.08 | 71.00 | 72.34 |
| n-grams + LIWC | 77.55 | 73.59 | 74.25 | 75.13 |
| 2,3 | n-grams | 75.49 | 70.43 | 69.75 | 71.89 |
| n-grams + LIWC | 78.31 | 72.86 | 74.40 | 75.19 |
| 3,3 | n-grams | 68.69 | 58.89 | 64.70 | 64.09 |
| n-grams + LIWC | 75.72 | 70.36 | 73.20 | 73.09 |
Table 15.
Overview of trends by method for models trained on combined dataset (DS3) and tested individually on DS1 and DS2 data (colored values indicate maximum accuracy obtained using a particular data processing method on each of the given datasets).
Table 15.
Overview of trends by method for models trained on combined dataset (DS3) and tested individually on DS1 and DS2 data (colored values indicate maximum accuracy obtained using a particular data processing method on each of the given datasets).
| | | All Models |
| | | DS3 Models Tested on Dataset DS1 | DS3 Models Tested on Dataset DS2 | The Average Accuracy
Obtained by Training and Testing Models on Datasets DS1, DS2 and DS3 |
| LIWC | 77.94 | 71.08 | 74.51 |
| 1,1 | n-grams | 70.29 | 64.90 | 67.59 |
| n-grams + LIWC | 79.04 | 72.92 | 75.98 |
| 1,2 | n-grams | 72.12 | 67.71 | 69.91 |
| n-grams + LIWC | 80.19 | 72.61 | 76.40 |
| 2,2 | n-grams | 71.16 | 69.07 | 70.11 |
| n-grams + LIWC | 77.85 | 70.63 | 74.24 |
| 1,3 | n-grams | 73.56 | 66.77 | 70.16 |
| n-grams + LIWC | 78.66 | 72.81 | 75.73 |
| 2,3 | n-grams | 75.00 | 65.10 | 70.05 |
| n-grams + LIWC | 77.50 | 73.23 | 75.37 |
| 3,3 | n-grams | 67.12 | 58.96 | 63.04 |
| n-grams + LIWC | 74.81 | 75.21 | 75.01 |
| Disclaimer/Publisher’s Note: The statements, opinions and data contained in all publications are solely those of the individual author(s) and contributor(s) and not of MDPI and/or the editor(s). MDPI and/or the editor(s) disclaim responsibility for any injury to people or property resulting from any ideas, methods, instructions or products referred to in the content. |
© 2023 by the authors. Licensee MDPI, Basel, Switzerland. This article is an open access article distributed under the terms and conditions of the Creative Commons Attribution (CC BY) license (https://creativecommons.org/licenses/by/4.0/).


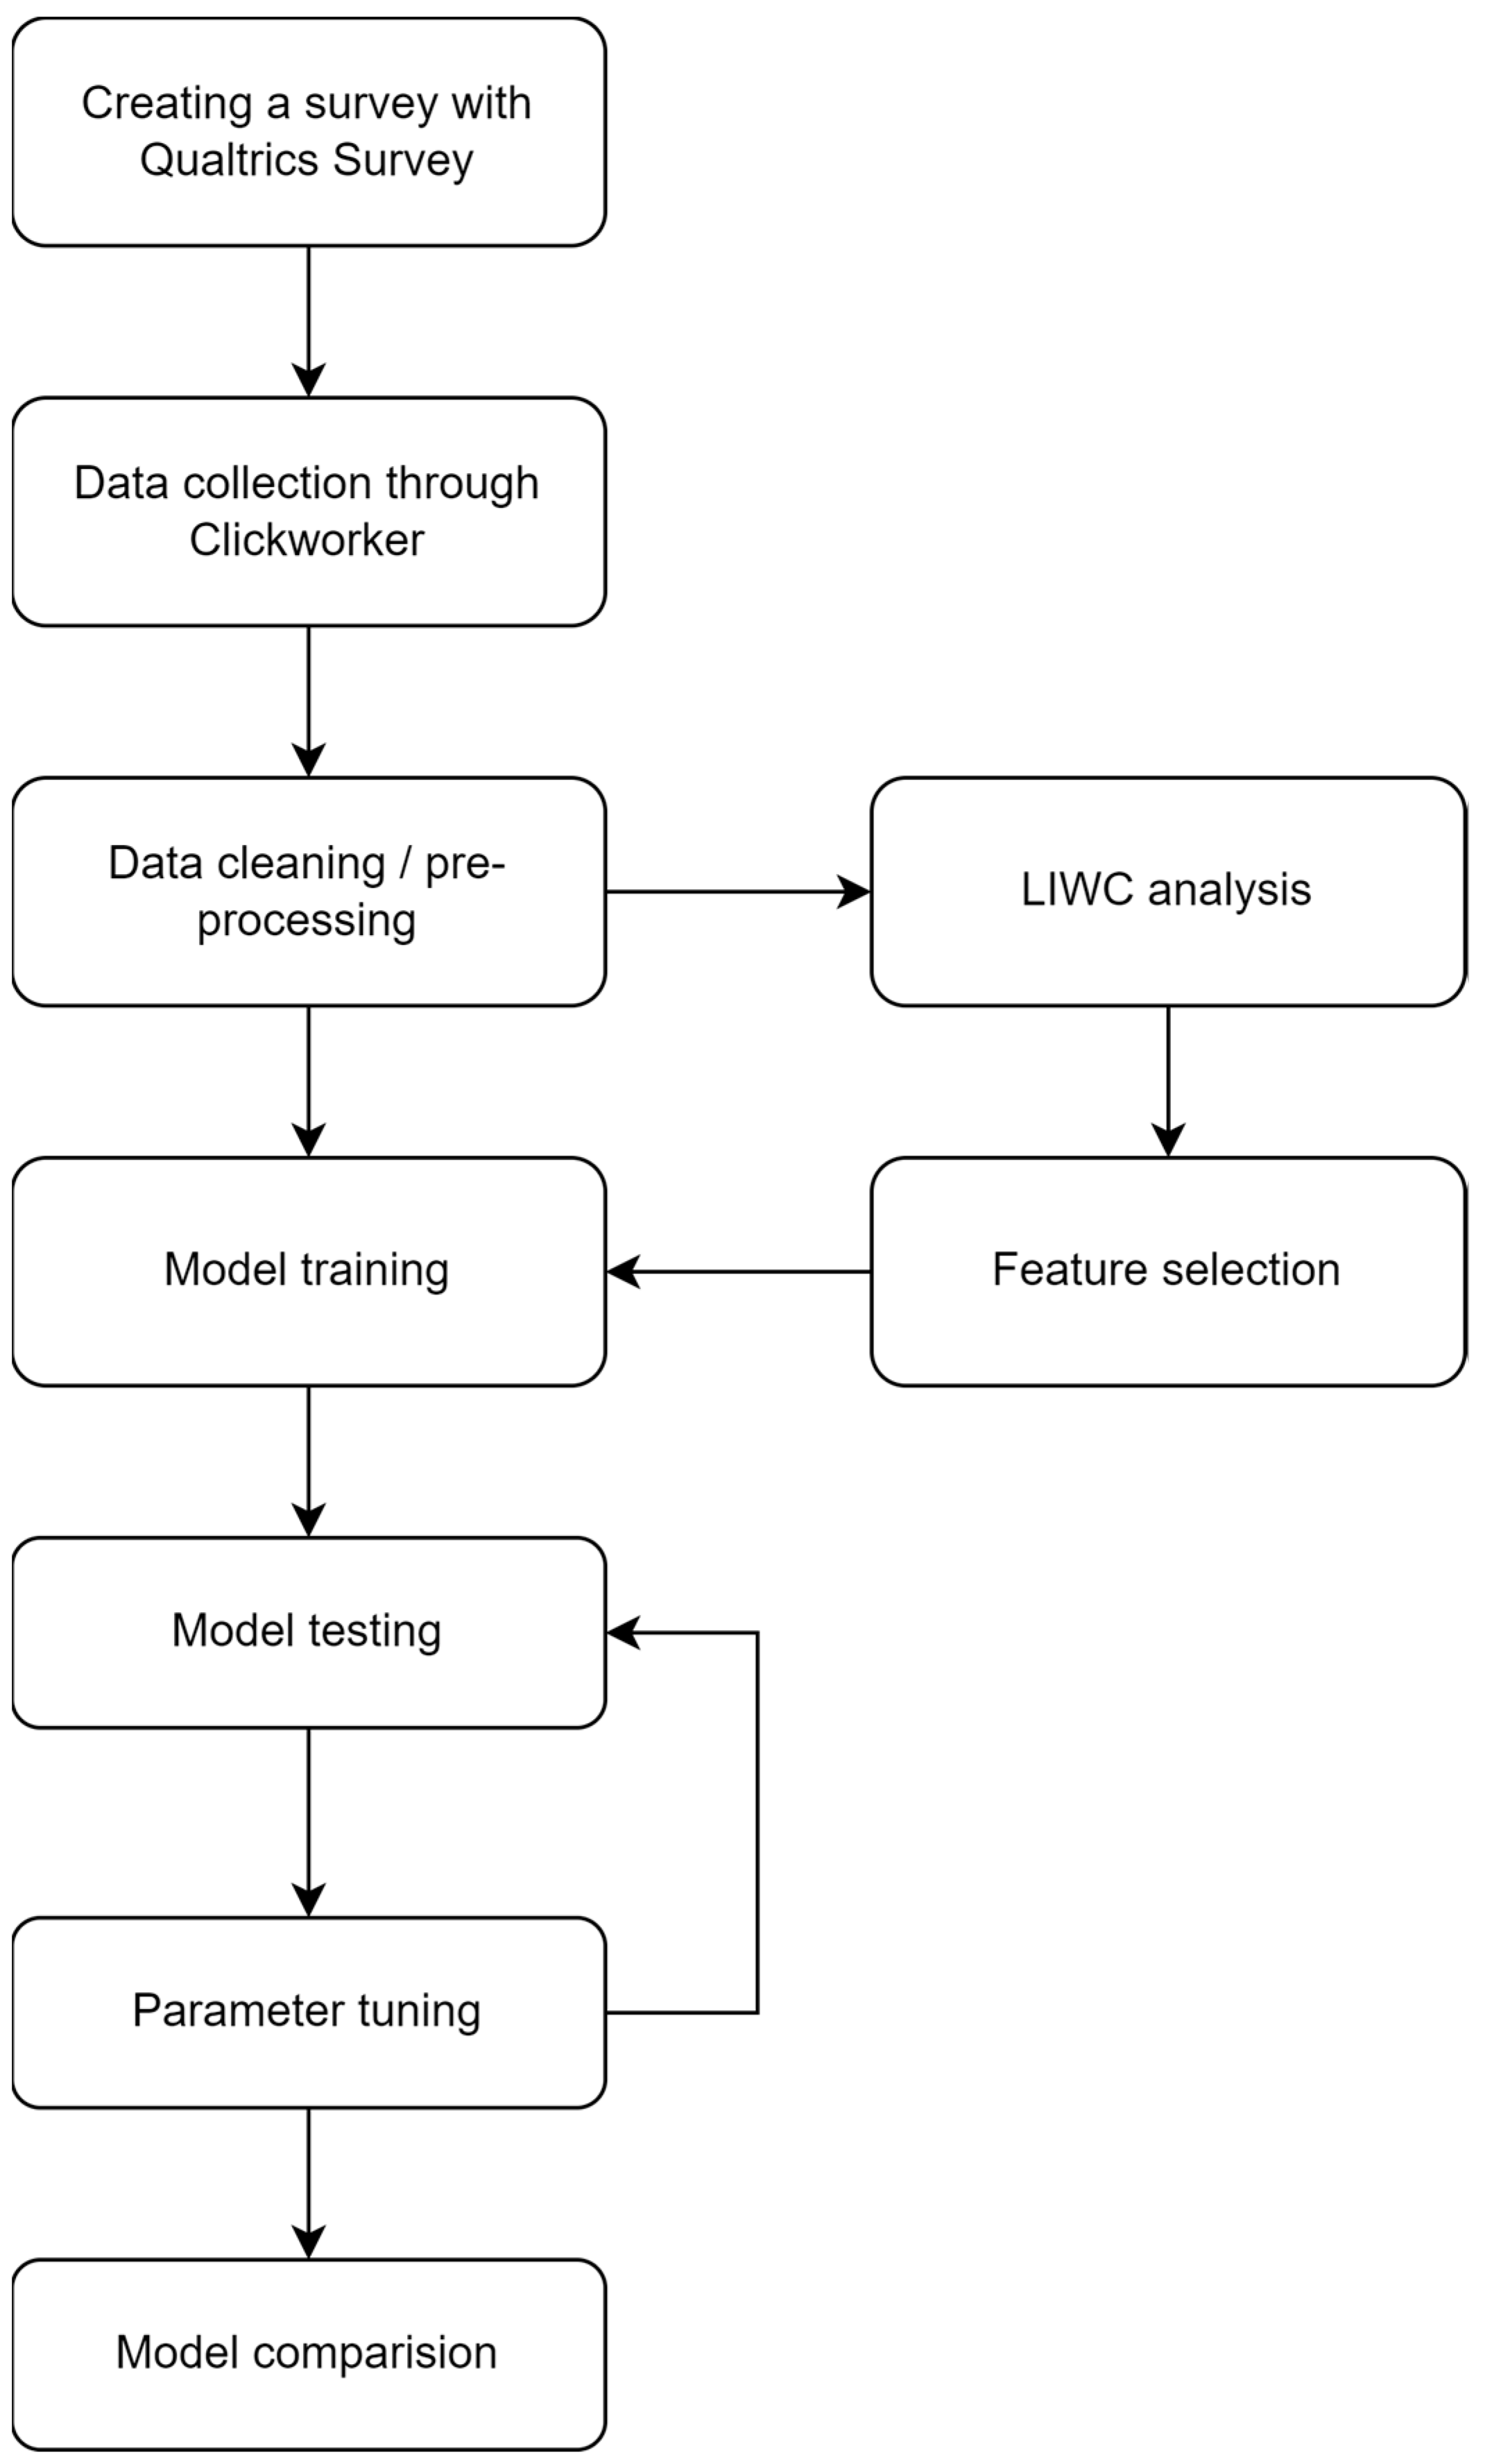
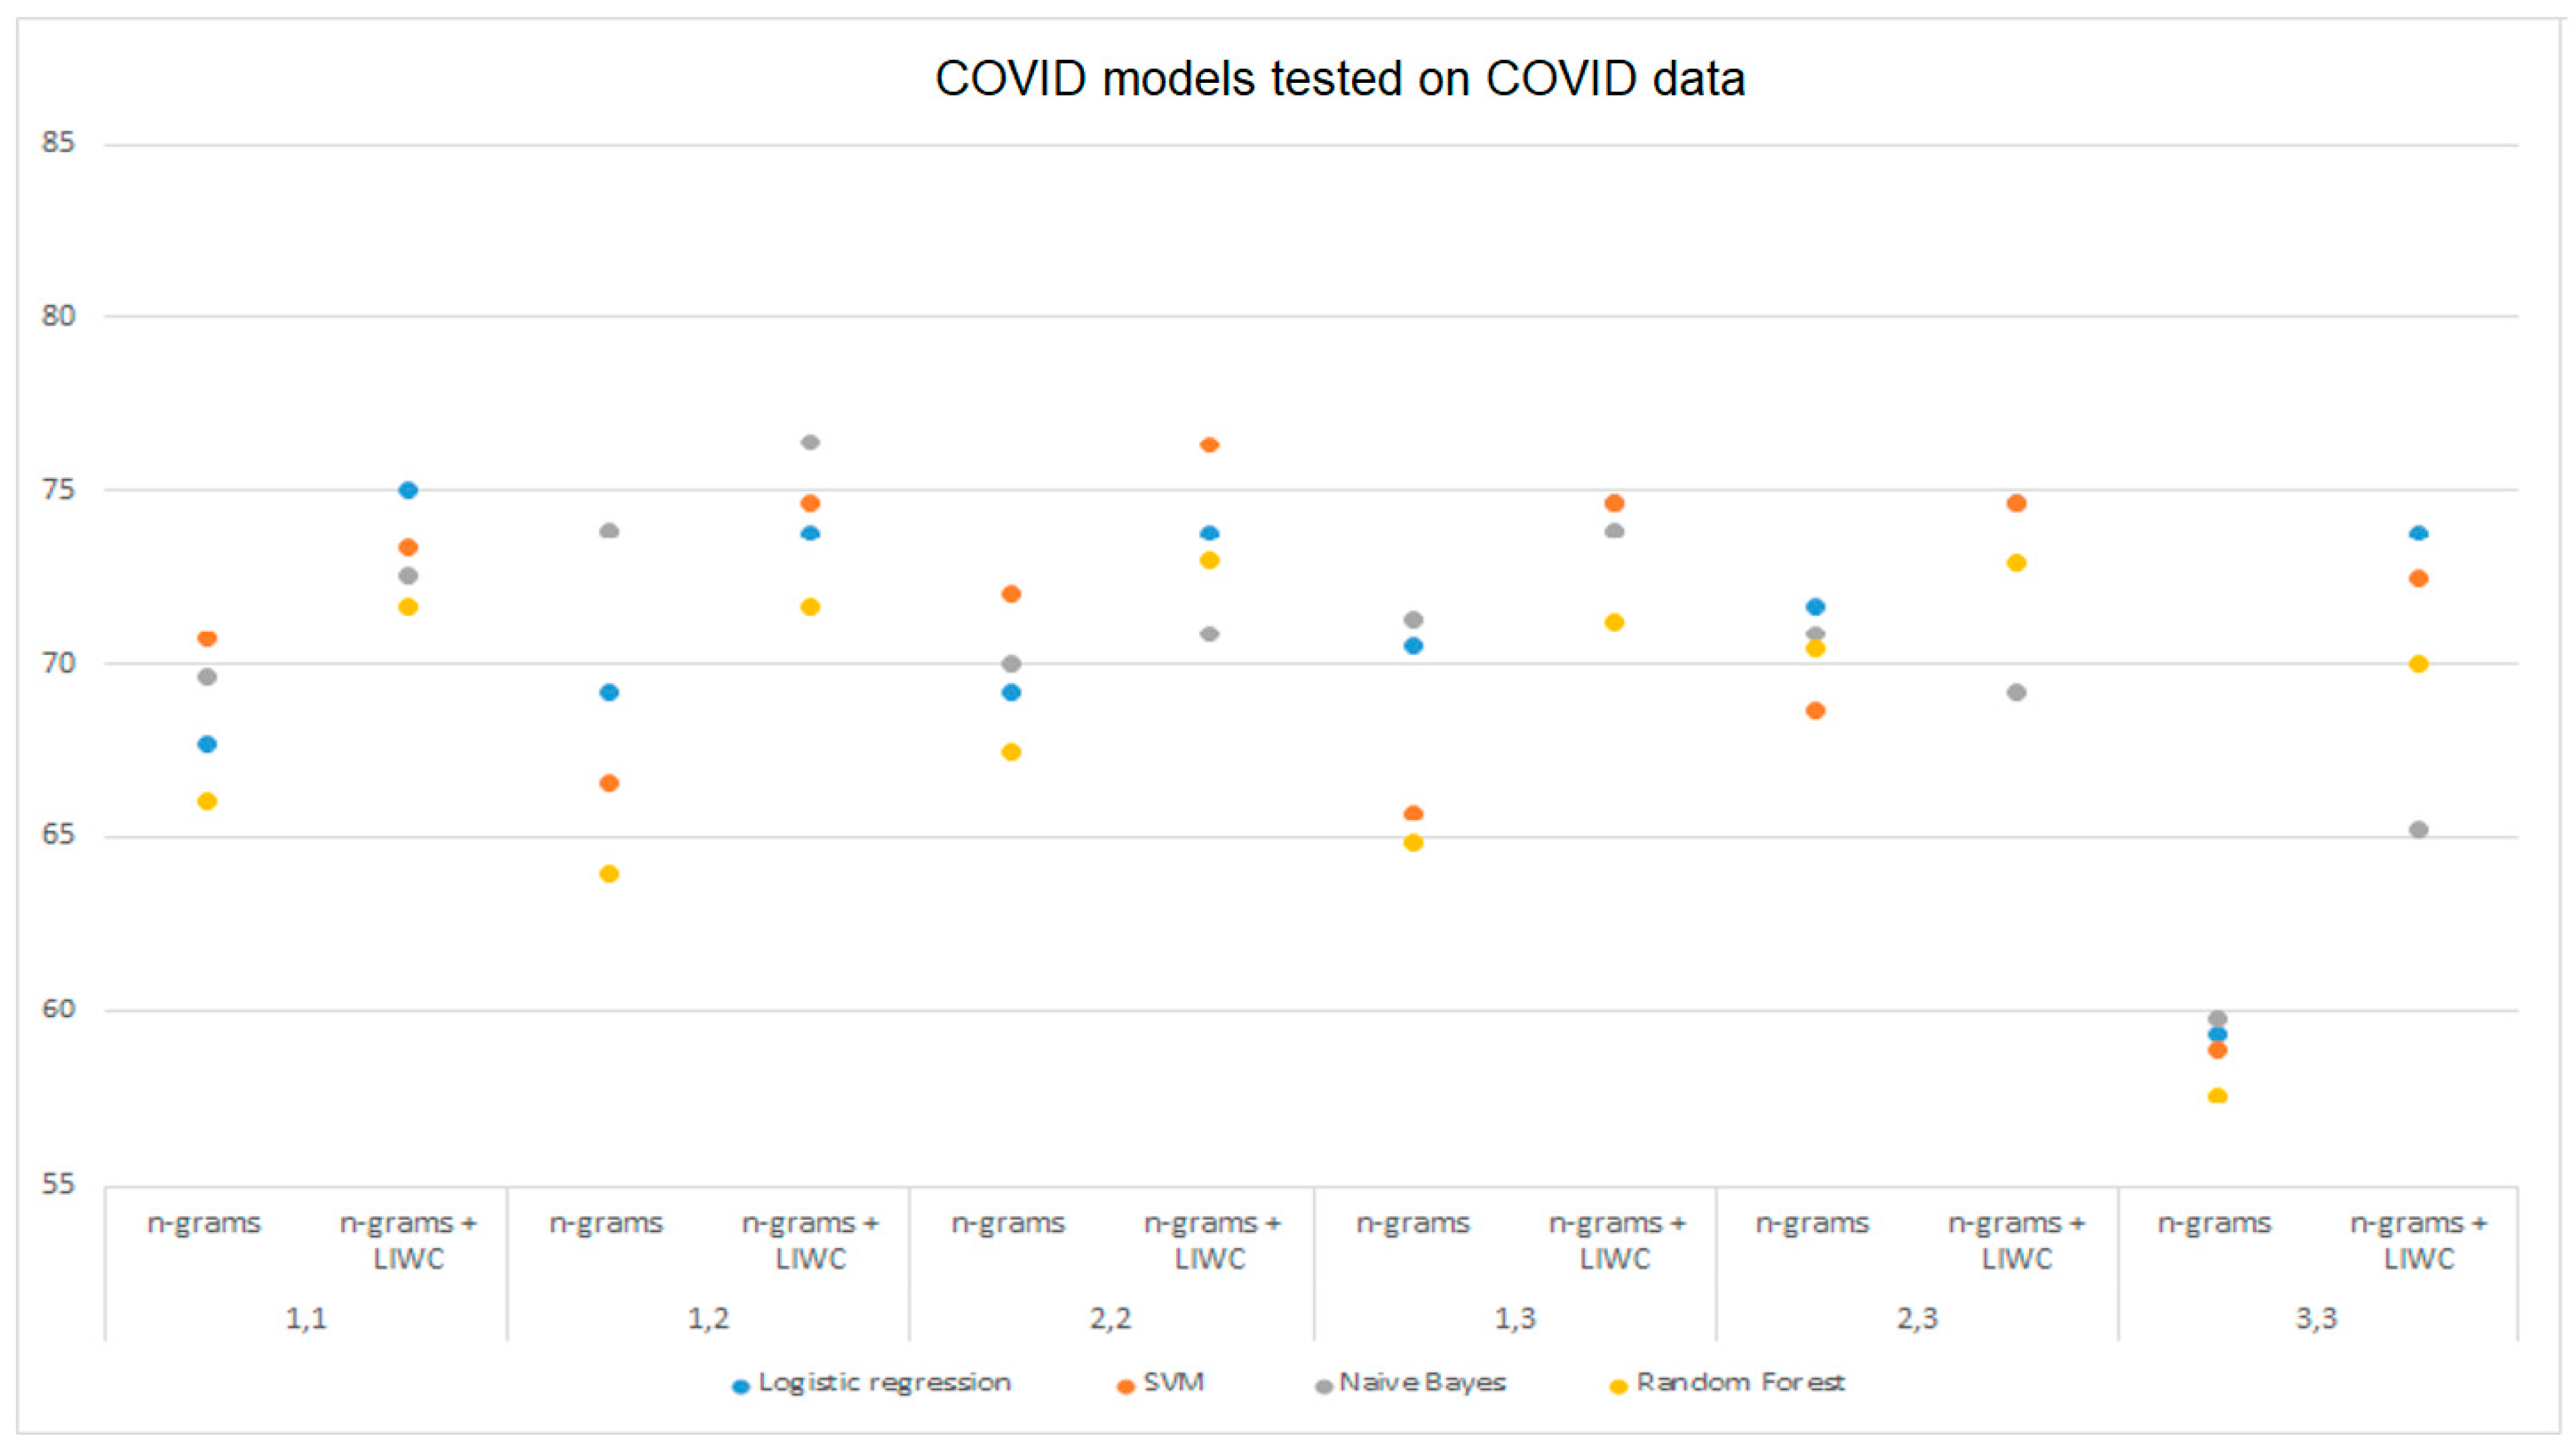
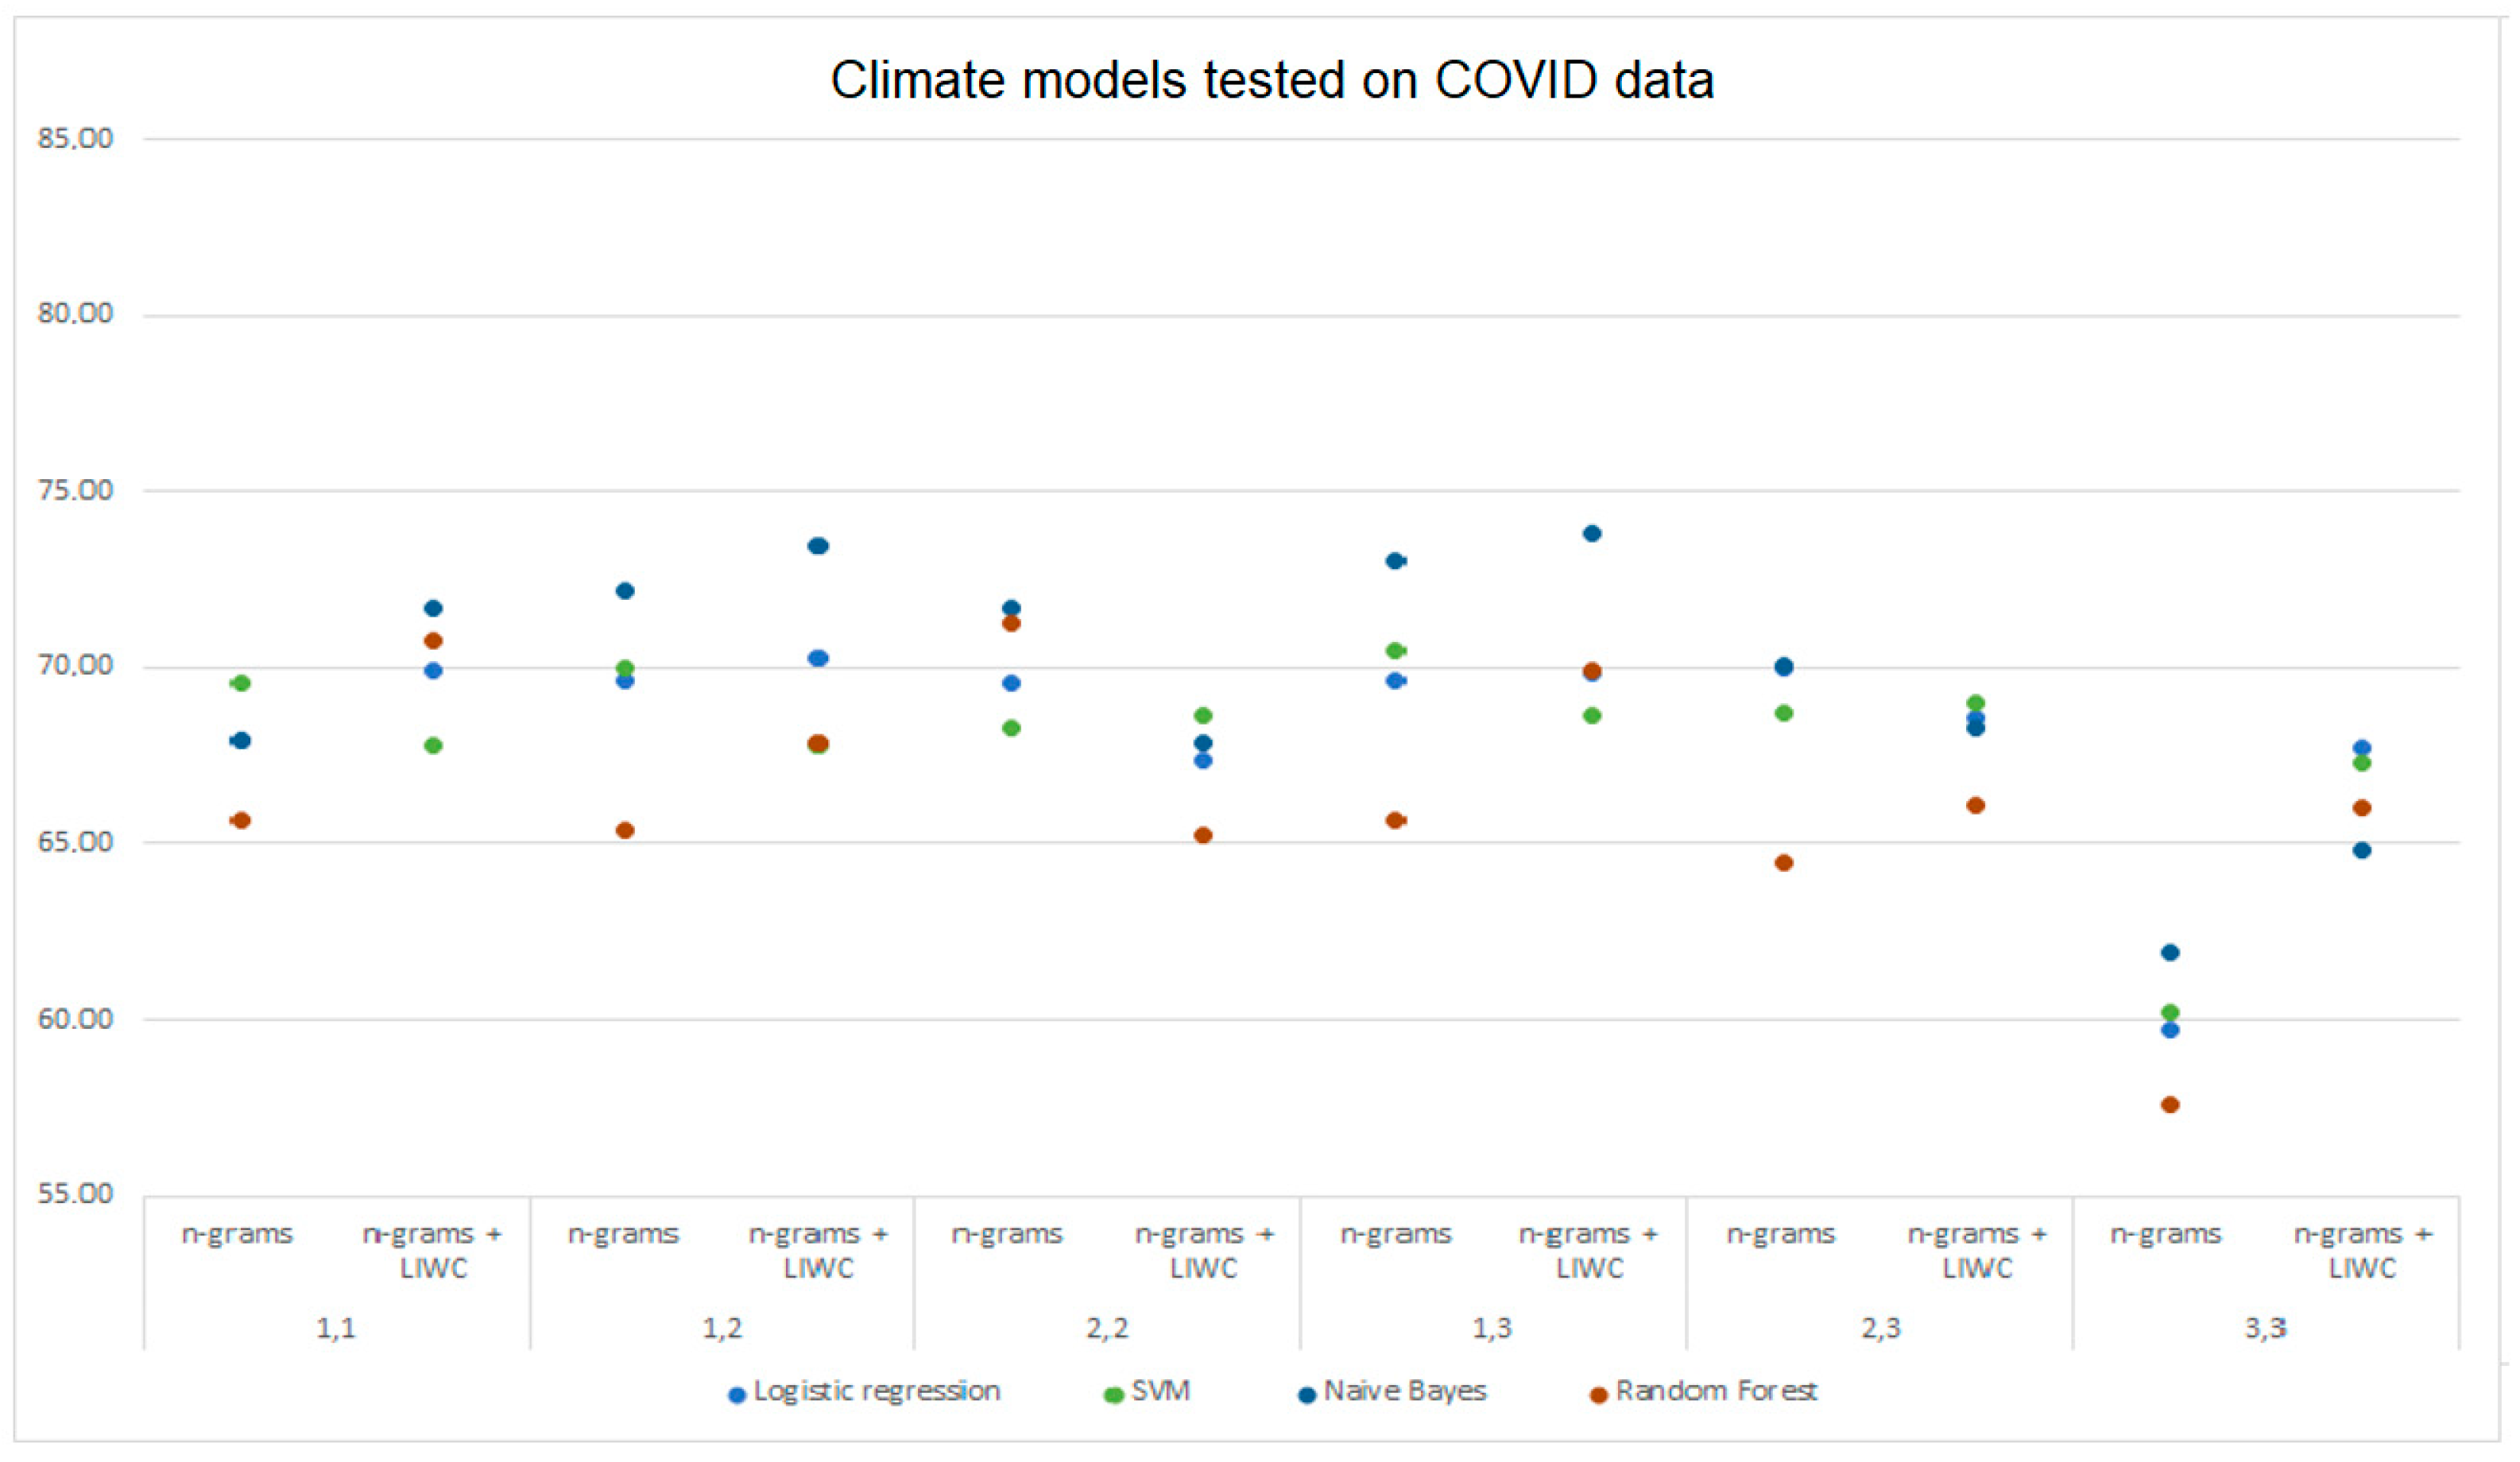