1. Introduction
The clustering of text documents with previously unknown topics according to semantic groups is one of the most important problems of information searching and knowledge extraction from big data.
It should be noted that the existing methods and algorithms for extracting information and knowledge from text documents do not always bring the desired results, and the relevance of outputs from search queries is not very high in many cases. This is related to the problems of adequacy in the presentation of text documents due to a lack of structuredness in the form of a formalized mathematical object suitable for further processing (such as a vector). It is also related to the algorithms used for their further processing, e.g., algorithms for clustering according to various thematic groups; search query classification into certain classes; and identifying meanings, objects, entities, etc.
The clustering of text documents is traditionally divided into two main stages. In the first stage, a vector presentation of texts is created using certain rules; the second stage is related to their clustering based on selecting a certain metric of similarity between objects in the vector space. It should be noted that text clustering accuracy largely depends on the model used for their vector presentation.
Currently, there are many various models for the vector presentation of text documents based on both lexical and semantical approaches to natural language processing, whereby the use of which is aimed at improving clustering accuracy.
The vectorization of text documents is usually implemented using the TF-IDF model (TF—term frequency, IDF—inverse document frequency). This model uses the normalized or standardized occurrence frequency of words and terms (n-grams) from the vocabulary of a text corpus (or associative-semantic class objects) and inverse document frequencies. Other methods of weighting words and terms can also be used, as well as embedding models and models that use semantic bonds between words in the form of graphs to represent documents (graph embeddings), etc.
To solve the problem of increasing the clustering accuracy and completeness, we should use methods based not only on lexical similarity, but also on semantic contiguity or associativity.
The semantic approach involves creating graphs of semantic networks for texts and determining the following parameters: the average number of neighbors (node degree); the clustering coefficients of network nodes reflecting their connectivity; the average shortest path length; the network diameter (expected number of neighbors for a node in the center of a circle that is four edges in diameter); network centralization; network heterogeneity; and many others. The numeric values of these parameters can form a vector that describes both the properties of individual objects in the semantic network for a given text, and the entire network in general.
The clustering of texts speeds up solving the information search problem: in the first stage, it is possible to assess the relevance not by using the entire set of text vectors, but by using a vector that indicates the cluster center position (centroid), whereas in the second stage, we already consider the relevance using a set of texts belonging to this cluster. A further successful solution of the knowledge extraction problem or that of the search for hidden patterns depends on how accurately the problem of text clustering has been solved.
Several problems arise during vector clustering. These problems are related to the choice of primary clusters, the clustering quality dependence on the text length, the determination of the total number of clusters, the lack of a bond between texts that are close in meaning but have different vocabularies, etc.
When solving the clustering problem for information searching and knowledge extraction, we should take into account not only the language vocabulary and semantics, but also many other features: the emotional overtones of the text, the lack of a strict word order in a sentence in inflected languages, etc. Texts with the same set of terms can significantly differ in meaning.
Ensuring the required completeness and accuracy of clustering is a difficult problem, and its solution does not provide any acceptable results in most cases. The results obtained from test sets that are used to study texts are very often not fully confirmed in real applications.
Creating a new generation of fast and accurate algorithms for information searching and knowledge extraction from text documents through increasing the accuracy of their clustering according to semantic groups is an important and relevant scientific and practical task, because in many cases information search quality depends mainly on the text clustering accuracy.
In our opinion, such clustering models and algorithms can be created based on the joint use of both lexical and semantic characteristics of text documents using the structural properties of graphs that describe the semantic relationships between semantic units in text documents.
If we use such properties, we can create a clustering algorithm that does not indicate the number of clusters or the value of the empirical metric of text differences/similarities, which allows us to include them into different clusters, in advance. The value of such a metric is determined through the analysis of the statistical distribution parameters, such as the cosine values of angles between vectors obtained based on the lexical and semantic characteristics of text documents.
Such clustering algorithms can be considered to be statistical.
This paper is structured as follows. In
Section 1, we present a review of publications on the topic of our study in order to specify the range of tasks and problems that should be solved when developing text analytics methods.
In
Section 2, we consider models of vector presentation of text documents based on lexical (taking into account the occurrence frequency of terms in a document) and semantic (taking into account the degree of nodes in document semantic networks) approaches to their presentation. In addition, we show how we can visualize different variants of the TF-IDF corpus of texts in order to select the best options for solving the clustering problem using the UMAP algorithm that implements a non-linear dimensionality reduction in the original dataset through embedding it into a space of a lower dimension.
In
Section 3, we discuss the construction of the model suggested by us for determining the difference metrics between vectors of text documents based on their lexico-semantic bond in order to use it for solving the clustering problem.
In
Section 4, we describe the text document clustering algorithm developed based on the lexico-semantic bond and statistical distribution properties of similarity metrics for vectors describing these documents. This allows us to explore the possibilities of applying the model of the lexico-semantic bond of texts in various algorithms, rather than only in traditionally used ones.
In
Section 5, we analyze the application of the model developed for the lexico-semantic presentation of text documents in various clustering algorithms. In addition, we carry out a comparative analysis of the results of the well-known affinity propagation algorithm and the text document clustering algorithm developed by us based on their lexico-semantic bond and statistical distribution properties of similarity metrics for text document vectors.
In
Section 6, we briefly present the obtained results and conclusions that can be drawn based on the analysis of them.
2. Review of Publications on the Subject of Research
In [
1], the issues of processing text documents that affect the accuracy of clustering are studied. In this case, dimensionality reduction methods are implemented using TF-IDF based on the frequency occurrence of words and singular value decomposition (SVD) dimensionality reduction tools. The authors test preprocessing methods and evaluate data dimensionality reduction for document clustering using the k-means algorithm.
Paper [
2] presents a scalable, fast, and efficient clustering algorithm based on the use of bivariate n-gram frequent elements to reduce the large data dimension by filtering them based on the frequency characteristics of the occurrence of terms in documents. The article shows that the proposed clustering algorithm works better under the condition of removing stop words from text datasets compared to without removing them.
Paper [
3] considers the question of the frequency of terms in news clustering. The authors believe that the TF-IDF representation of texts is biased, since the most important terms can be attributed to noise, which will lead to a decrease in the “weight indicators” of these terms when calculating the value of the similarity metric between text vectors. According to the authors of this work, news clustering without using the most important but rarely used terms in the text is ineffective.
Paper [
4] studies approaches to an improvement in the results of clustering text documents and, in particular, clustering news articles from the Internet using text n-grams during keyword extraction. The paper compares this approach with the approach previously used by the authors for clustering with the representation of vectors based on the frequencies of occurrences of only single words (i.e., without using n-grams to represent vectors). Experiments have shown that a significant improvement in clustering results can be achieved by adjusting the value of n and the weights between the n-gram keyword and its associated n-grams.
In [
5], a new method for clustering news documents is proposed. The authors believe that clustering based only on the distance between a pair of documents using the cosine metric is not good enough. To improve the accuracy of clustering, this study proposes a method for measuring the similarity of text vectors with refinement of the values of their elements (for example, due to various options for TF-IDF representation of texts) and subsequent clustering using the k-means algorithm. Experimental results show a significant improvement in the accuracy of clustering due to the application of the proposed method.
Recently, the EM algorithm (expectation–maximization algorithm) [
6,
7], which, like k-means, is iterative, has gained popularity. The EM iteration alternates between performing an expectation (E) step, which creates a function for the expectation of the log-likelihood evaluated using the current estimate for the parameters, and a maximization (M) step, which computes parameters maximizing the expected log-likelihood found on the E step. These estimates are used to determine the latent variable distribution in the next step E. The EM algorithm computes the probabilities of feature membership in a cluster based on one or more probability distributions, rather than assigning features to clusters to maximize differences in mean values for continuous variables.
Paper [
8] considers a news clustering method based on the proximity of pieces of news’ digital characteristics that was designed to simplify the processing of information in the database. The numerical characteristics may include, for example, the TF-IDF vector of the document and the sentiment of the text. News documents are placed at the vertices of the graph, and after identifying their category, they are associated with other vertices that have this category. The link weight can be set based on the value of the similarity metric of digital characteristics (for example, the cosine of the angle between text vectors). News clustering in this model is based on expanding the matrix of links between nodes. To achieve this, the authors propose using the MCL (Markov CLuster) clustering algorithm, which implements a random walk on a graph.
An approach close to the topic of our study is described in [
9]. This paper presents a technique for the complex analysis of a news text based on a combination of statistical algorithms for extracting keywords and algorithms for forming the semantic coherence of text blocks. Particular attention is paid to the peculiarities of the structure of the news text. As part of the study into the problem of the thematic clustering of news texts, the authors consider the operation of the k-means algorithm, the minimum spanning tree, and a number of others.
In [
10], the clustering of sparse high-dimensional data is studied. The authors propose a new generative sparse Poisson latent block model (SPLBM) based on the Poisson distribution, which, according to the authors, can be used for the elements of document–term matrices. SPLBM is a statistical model that solves the problem of data sparseness. As a consequence, the clustering algorithm based on this model, in addition to searching for homogeneous data blocks (i.e., blocks with similar statistical characteristics), filters out data that are homogeneous but related to “noise” due to sparseness. Experiments on datasets of various sizes and structures show that the clustering algorithm based on the SPLBM model performs well in clustering complex imbalanced datasets.
In [
11], three algorithms for clustering text documents were studied (1) based on the choice of informative features; (2) based on the length feature weight (LFW), which depends on the frequency of occurrence of features in other documents; and (3) based on a dynamic reduction in the size of the document metrics matrices. The following algorithms are proposed to be used for the selection of informative features in each document: the genetic algorithm (GA), the harmonic search algorithm (HS), and the particle swarm optimization algorithm (PSO). At the same time, a new method of dynamic dimension reduction (DDR) is proposed, which makes it possible to reduce the number of features used in solving the clustering problem, which allows one to increase the performance of the applied clustering algorithms.
The method of dynamic matrix size reduction was tested using the k-means algorithm. At the same time, the study considered seven test sets of text data of different sizes and complexity. An analysis of the experimental results shows that the use of optimization based on the length feature weight and dynamic dimension reduction gives optimal results of subsequent clustering for almost all tested datasets.
The authors of [
12] propose the idea of using document clustering based on the FBC (feature-based clustering) algorithm, since they believe that it will be easier to use the huge number of existing documents if they are combined into several topics. The FBC algorithm for clustering serial data uses the k-means algorithm. The structure of texts is considered as a sequence of words that have a certain type and certain characteristics (for example, the frequency of occurrence of words in texts). The article considers two types of sequence patterns: frequent word sequence (FWS) and maximum frequent sequence (MFS). The difference lies in the application of the maximum principle: the sum of MFS from a text document will be greater than the sum of its FWS. This approach was tested on news data. The study showed that the accuracy of the clustering result is affected by the value of the sequence selection value, the dataset, and the number of target clusters, and the best results are obtained when using the maximum frequency sequences as text characteristics.
In [
13], the authors studied how the characteristics of the semantic text graph differ depending on the genre of the text. According to the authors, the representation of the text in the form of a graph of words allows for effective analysis and identification of the key topological features of networks that characterize the genres of the text.
In [
14], the authors used the ICAN (incremental construction of an associative network) algorithm to create a semantic graph for each document separately, and not for the entire corpus (this method allows you to preserve the word order, which is important in semantic analysis). The ICAN algorithm models the development of human semantic memory, or rather, semantic associations between concepts. The output of the ICAN algorithm is a semantic graph with a set of nodes representing the concepts learned and a set of edges representing the semantic associations between them.
The ICAN algorithm is based on using the degrees of nodes of semantic graphs. The size of such a graph depends on the number of terms in the document and can be very large. It is possible to use characteristics other than node degree values, e.g., the node clustering factor (a measure of the degree to which nodes in a graph tend to cluster together; in most real-world networks, such as social networks, nodes tend to create cohesive groups characterized by a relatively high density). Document terms that are responsible for the document’s semantic meaning can also be grouped into compact groups that convey a certain meaning. In this regard, one can, for example, consider the results obtained to describe the behavior of the clustering coefficient in large networks [
15], as well as geometric models of the associative growth of small-world articles [
16], which allow one to model such characteristics of complex graphs such as order, size, degree distribution nodes, degree correlation, clustering coefficient, transitivity, and network diameter. These characteristics can also be used to find the semantic similarity of documents.
In [
17], the possibility of clustering texts and organizing a semantic information retrieval system based on associations is considered, and associative vector spaces are used as basic semantic structures. One of the main problems in creating semantic text processing systems is their formalized representation in the form of semantic structures convenient for computer processing that preserve the meaning of a text or document in a natural language. To solve this problem, authors use the semantic field model, which combines words of different parts of speech based on a common semantic attribute. The associativity of terms is chosen as a semantic feature in order to link keywords with dependent words. Associations are extracted from the direct meaning of the word, which allows one to replace them with a set of other words. In practical terms, this allows one to create a search query and obtain the desired result without knowing the exact keywords or terms of the subject area.
Paper [
18] discusses the issues of text clustering, which is suitable for extracting text data from sources such as electronic news articles, collections of research papers, blogs, news feeds in social networks, etc. This paper presents the hierarchical fuzzy relational eigenvector centrality-based clustering algorithm (HFRECCA). The algorithm is a combination of fuzzy clustering, hierarchical clustering, and page ranking algorithms. First, stop words and endings are removed from the texts. Then, a similarity matrix is created by calculating the distances between words. HFRECCA employs a hierarchical clustering method based on fuzzy relational eigenvectors.
In [
19], the authors consider the use of semantic analysis methods in the framework of recognizing the intentions of the authors of posts on Twitter. The authors of the paper propose a template-based lexico-semantic approach that uses domain ontology to create templates. These templates are applied to commercial tweets to extract customer intentions. The approach is aimed at the semantic description of the context. The purpose of the approach is to explore the possibilities of adding semantics to templates using Semantic Web technologies. The authors carry out natural language processing using WordNet [
20], OpenNLP, and OWL ontology. In this case, ontologies are used to extract the corresponding intentions of the client.
The review of papers shows that, despite the variety of existing methods and approaches to creating models and algorithms for clustering text documents, all of them are still far from perfect and have various disadvantages associated with the nature of unstructured [
21] text data.
In this paper, we want to present a model of lexico-semantic connection of texts, which uses both lexical and semantic approaches toward the formalization of texts in the form of mathematical objects to calculate the values of similarity metrics of documents and to develop an algorithm for their clustering. The clustering algorithm using this model is based on the statistical characteristics of distributions of document similarity features.
3. Models of Vector Presentation of Text Documents Using Lexical and Semantic Approaches
We can use TF-IDF presentations of texts as part of lexical and semantic approaches to the formalized presentation of texts as vectors.
With the lexical approach to creating TF-IDF, we can use the occurrence frequency of words (TF) and terms (n-grams) from the vocabulary of a text corpus (or associative-semantic class objects) and the inverse document frequency (IDF).
With the semantic approach to creating TF-IDF, we can use semantic bonds between words in the form of graphs for presenting documents (graph embeddings) and parameters such as the average number of neighbors (the degree of a node—a semantic unit of the text); the clustering coefficient (a parameter that renders the network connectivity in general); the average shortest path length; the network diameter; etc. Numeric values of these parameters can form a vector that describes both the properties of individual objects in the semantic network for a given text and those of the entire network in general.
To implement the semantic approach to creating TF-IDF, we can use, for instance, the ICAN algorithm (incremental construction of an associative network), which is based on updating the semantic graph when moving along it with a sliding window with a preset size [
22]. The semantic similarity between a word
and its neighbor
in the sliding window is calculated as the product of the bond weights along the shortest paths between them.
The ICAN graph [
14] can be constructed according to the following sequence of steps:
Step 1. Direct co-occurrence effect. Apply a sliding window of 11 terms for each term
in the processed document
d. The sliding window has the following structure: [
w1,
w2,
w3,
w4,
w5,
ti,
w6,
w7, w8,
w9, w10], where sliding window values include the term
itself and 10 other terms on the left (
w1,
w2,
w3,
w4,
w5) and on the right (
w6,
w7, w8,
w9,
w10) of term
. The size of such a sliding window was chosen to be 11 based on the research results of the ICAN algorithm described in [
14].
In this step, we searched for edges (bonds) between the term and other terms wj in the sliding window. If any edge (, ) does not exist (i.e., there is no bond between terms), the bond between terms is added to the semantic graph of document with weight ; otherwise, the weight of the bond between terms is set equal to .
Step 2. Second-order co-occurrence effect. Let each edge (, ) have weight (obtained in the first step). Then, for each node that is connected to with weight (edge weight ()) we should perform the following actions: if any edge (, ) does not exist in graph , we should add it to the semantic graph of document with weight ; otherwise, weight should be changed to , where is the scaling factor (). It should be noted that before the scaling factor reaches the value , it almost does not affect the modeling result.
Step 3. Occurrence without co-occurrence effect. Reduce the weight on all edges connecting with its neighbors by a fraction equal to 0.9 (i.e., 90% of the current value) and remove bonds that fall under the weight reduction threshold of 0.4 (i.e., 40%).
The process of the ICAN graph construction is described in Algorithm 1.
| Algorithm 1: ICAN graph construction |
| Input: | —document, —scaling coefficient (). |
| 1. | Define set of edges for the semantic graph. |
| 2. | Define edge weight function . |
| 3. | For each do |
| 4. | Define for the term a sliding window . |
| 5. | For each term from the sliding window ( do |
| 6. | Define the link between terms and as a pair . |
| 7. | . |
| 8. | If then . |
| 9. | For each term , such as , do |
| 10. | . |
| 11. | End loop |
| 12. | End loop |
| 13. | For each term , such as , do |
| 14. | . |
| 15. | End loop |
| 16. | End loop |
| 17. | Compute the set of vertices . |
| 18. | Return the constructed semantic graph |
The computational complexity of the ICAN algorithm is , where is the size of the window; is the number of documents in the corpus; and is the maximum number of words in the dictionaries of documents.
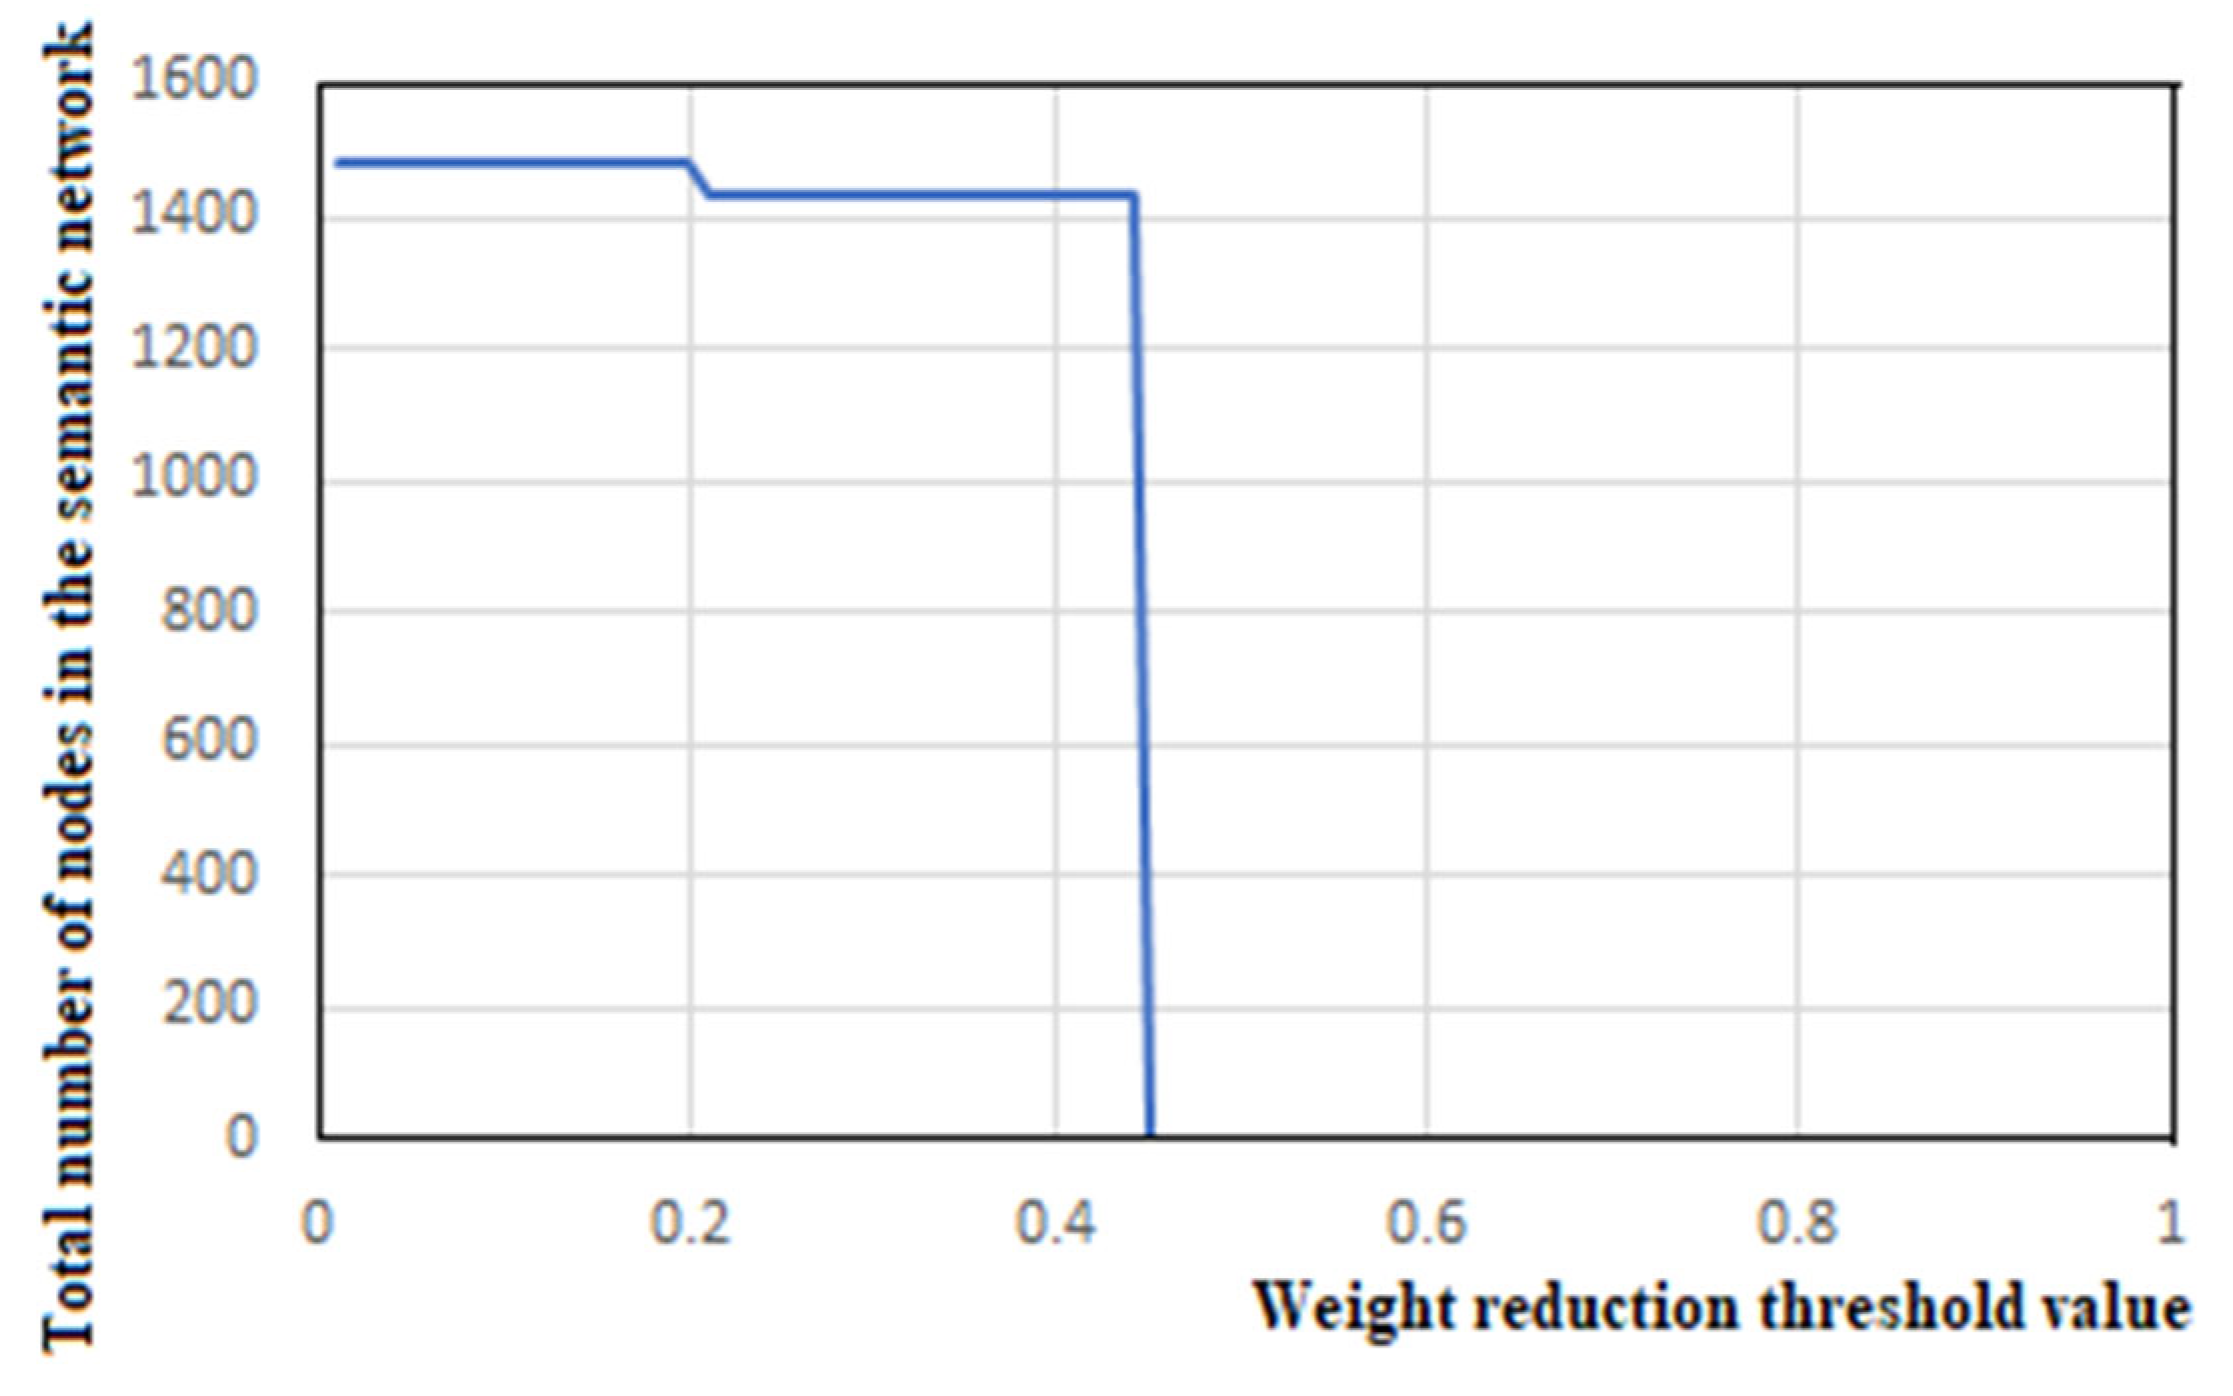
It should be noted that the choice of a weight reduction threshold is essential.
Figure 1 shows the dependence of the total number of nodes in the semantic network on the selected value of the weight reduction threshold for a small text of 50 words.
The transition to zero values (
Figure 1) of the node number virtually does not depend on the number of words in the source text and always occurs at transition threshold values of about 0.44 (
Figure 1). With transition threshold values from 0.01 to 0.44, the number of nodes in the resulting semantic network remains constant but individual for each network. It should be noted that there is a very large number of bonds in the semantic networks of text documents, e.g., for a text document of 50 words, this number is about 1500, whereas the maximum number of bonds for such a document, taking into account their possible bidirectionality and the absence of loops showing the bond of a node with itself, is equal to 49 × 50 = 2450.
The generated ICAN graph
g is edge-weighted and directed. Directed and weighted edges encode the degree and direction of semantic similarity between the concepts (nodes) under consideration.
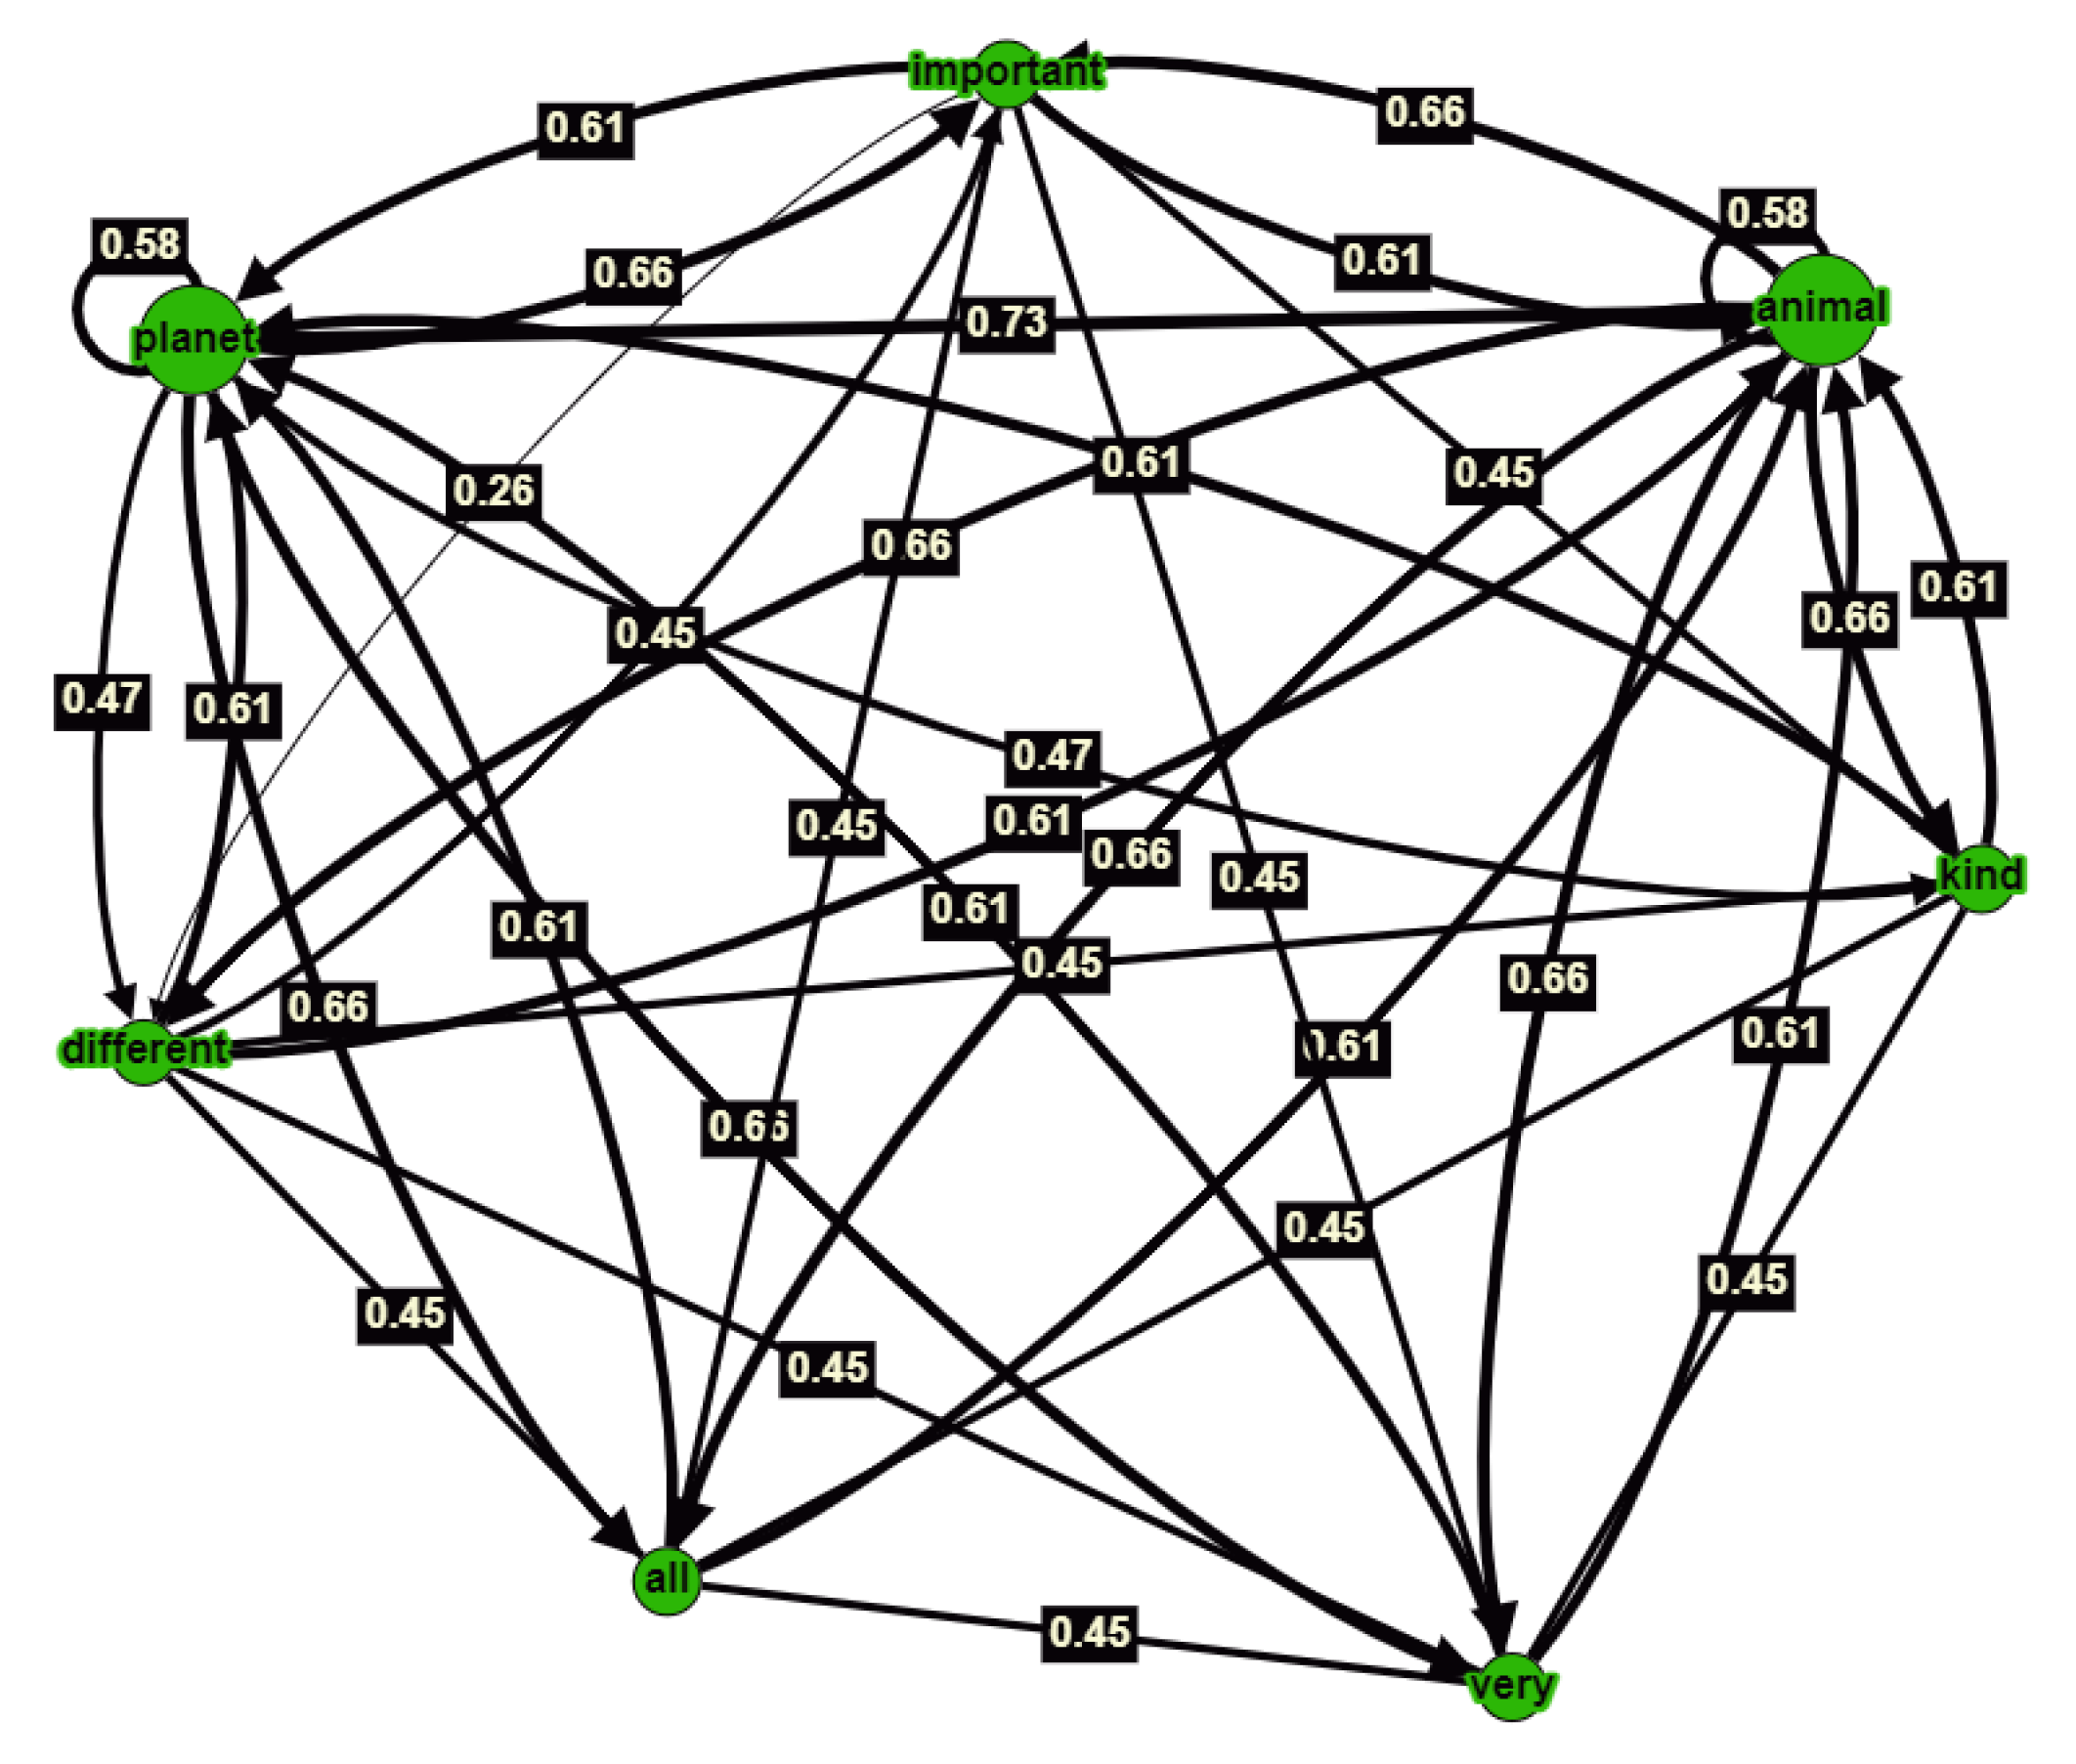
Figure 2 shows an example of creating a semantic graph algorithm for a small text using ICAN: “…there are different types of animals on our planet and all animals are very important for our planet…”. After the preprocessing (normalization) of the text, it is sent to the input of the ICAN algorithm. As can be seen from
Figure 2, we obtained a directed graph after the preprocessing of the text. The graph nodes show the words (terms) of the text under consideration. The edge weights show the strength of the bond between some terms that is associated with a node and other terms.
The presented example of applying the ICAN algorithm to the text shows that the result of its work is a semantic graph. The large nodes in
Figure 2 correspond to the words “animal” and “planet”, which are nouns in the sentence. The word “animal” is related to the word “planet” by a link having a weight greater than 0.7. From a grammatical point of view, the word “animal” is the subject (the main word) of this sentence and forms the basis of the meaning of this sentence, which was highlighted by the ICAN algorithm, and the word “are” is the predicate of this sentence. A complex sentence containing practically no verbs (except for the verb “are”) was specially chosen for analysis. This sentence was normalized and stop words were removed from it. As a result, seven keywords were selected in normal form and a graph was formed. Graph nodes corresponding to the words “important” (adjective), “kind” (noun), “different” (adjective), “all” (adverb), and “very” (adjective) have weights of connections between themselves approximately equal to 0.45 and are secondary (but important, because they reveal the meaning of the subject in the sentence) in relation to “animal”. In addition, there is a noun which is defined as the key object (complement word) in the sentence. This word is “planet”. According to the resulting graph, the relationship between “planet” and “animal” is greater than 0.6. Thus, the analysis carried out using the ICAN algorithm to highlight the main words in a sentence and establish links between them generally corresponds to the classical ideas about the grammatical analysis of sentences.
The discussion of the size of the sliding window when using the ICAN algorithm to create a semantic text graph is a separate issue. In the original paper [
22] devoted to the ICAN algorithm, the authors indicate that the best result is achieved using a sliding window of 11 terms. According to the authors of [
22], this is in good agreement with the studies presented in other works: in [
23], a window size of 10 is used, while in [
24], the window size varies from 8 to 14.
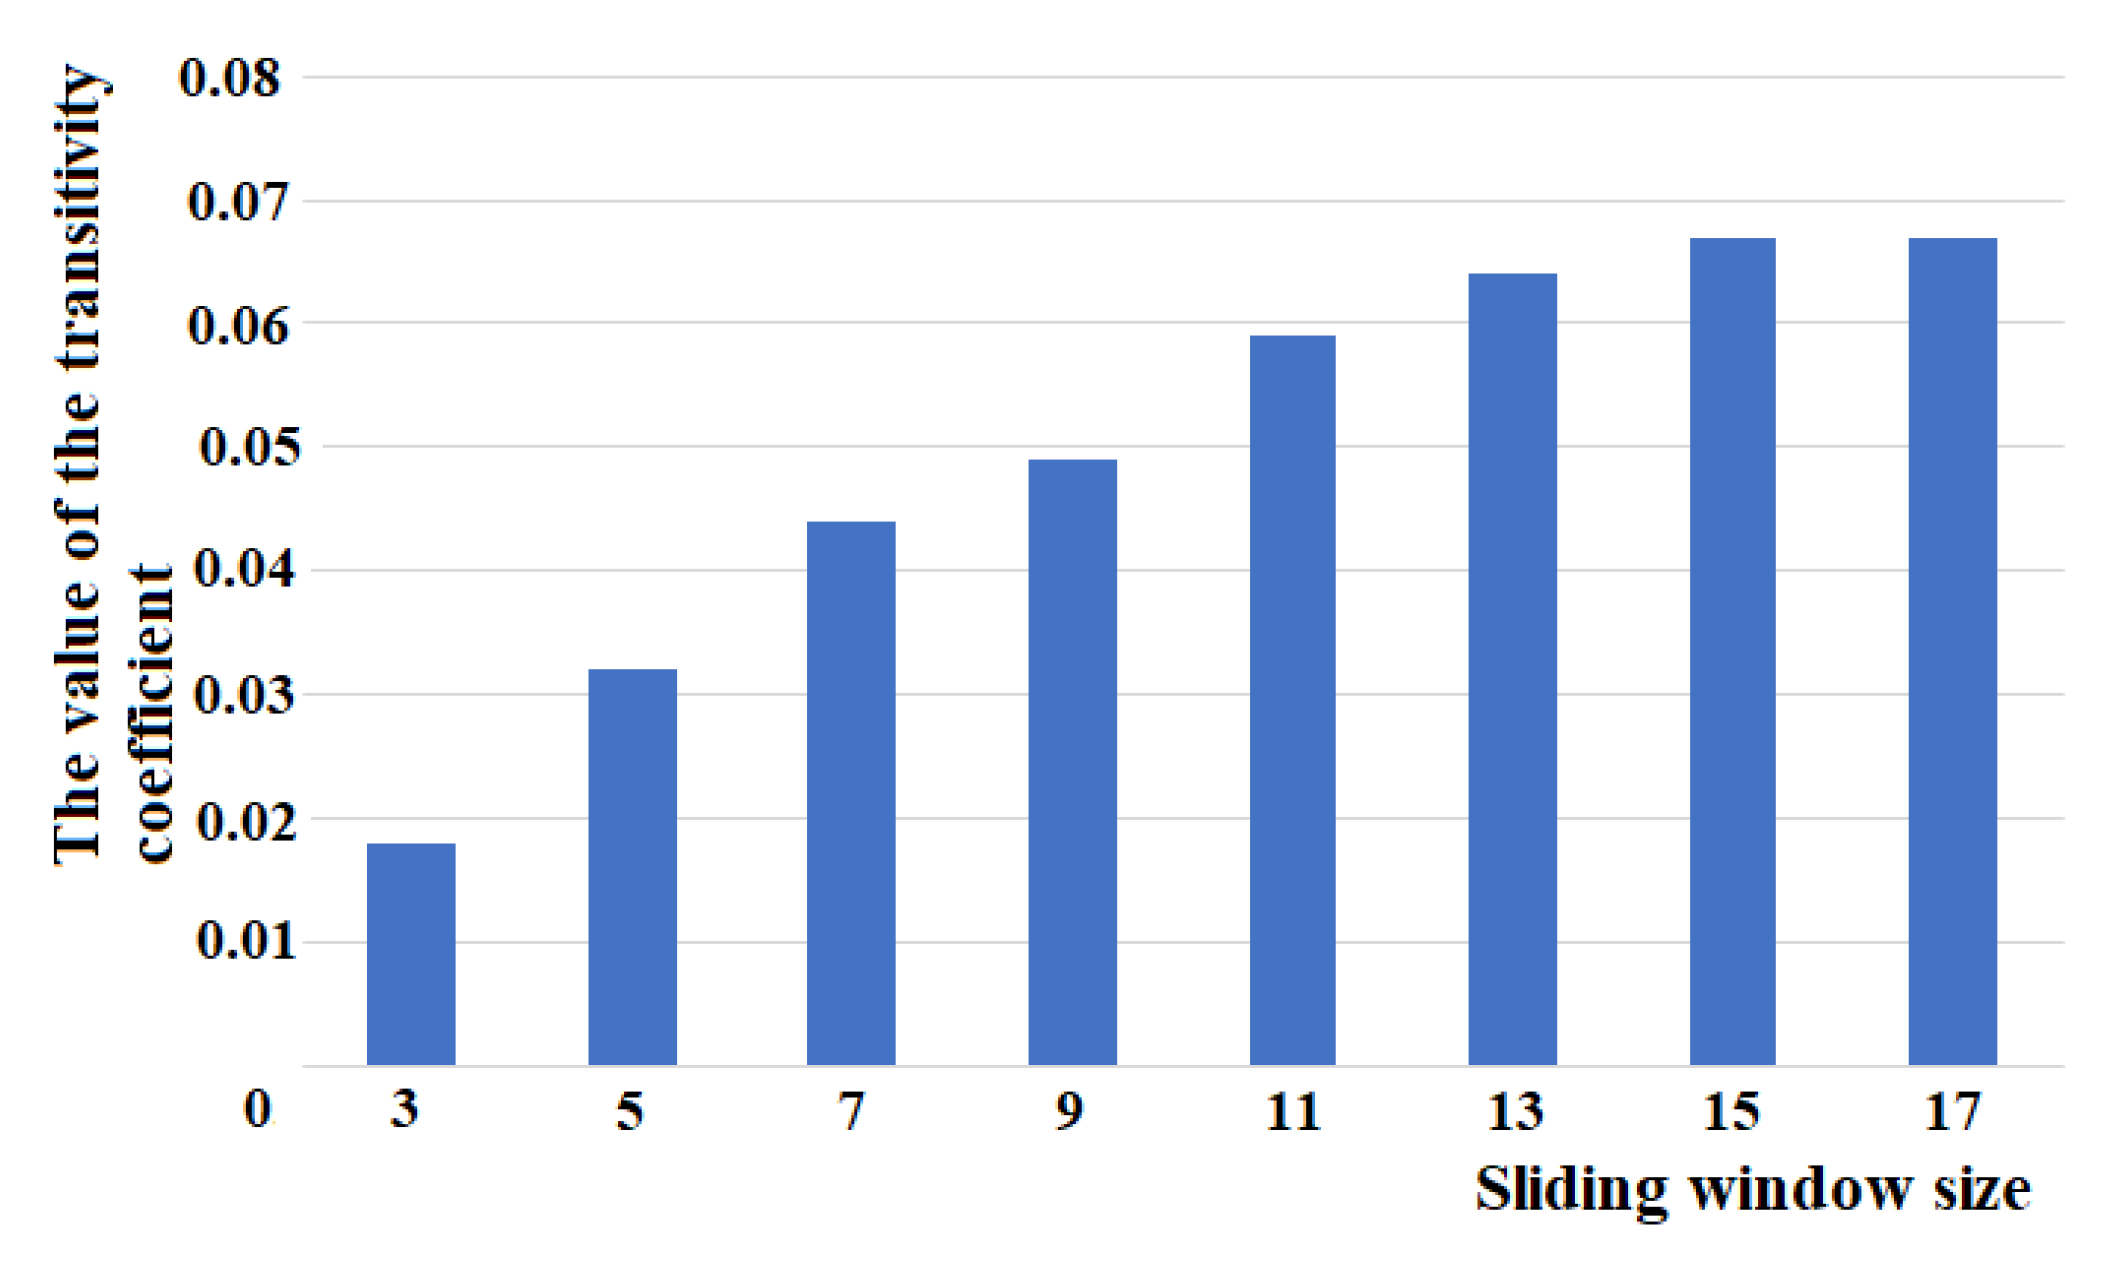
In order to select the optimal size of a sliding window, one can study the influence of its size, for example, on the value of the transitivity coefficient. This coefficient characterizes how interconnected the neighbors of a given graph vertex are. It can characterize the semantic closeness of the chains of words in a text. Our studies on the influence of the size of the sliding window on the average value of the transitivity coefficient of the directed graph of the semantic network of the text are shown in
Figure 3. To analyze this, we randomly selected a text consisting of 774 words from the corpus. After the normalization and removal of stop words, the text size was 558 words. This text was processed by the ICAN algorithm, which derived a semantic graph consisting of 387 nodes.
The results presented in
Figure 3 show that when the size of the sliding window is 11 nodes or more, the value of the transitivity coefficient changes very little. However, taking into account that the computational costs increase greatly with an increase in its size, the size of the sliding window can be chosen to be equal to 11.
When determining node degrees, we can use both incoming and outgoing bonds. In our opinion, both of them should be taken into account, since any types of bonds show the significance of a network node. Therefore, in our model, we have defined the node degree as the total weight of all bonds (incoming and outgoing ones) involving this node.
The node degrees in the semantic network of each document can be used to create the TF-IDF for the entire corpus and to calculate the matrix of the cosine metric values (or Euclidean distances) between text vectors. When calculating the values of TF in the node–document matrix, the degree of the node should be normalized. To achieve this, one can find the ratio of the sum of the degrees of a given node over the entire semantic network to the sum of the degrees of all nodes of the graph of the given text.
It should be noted that in order to construct the TF-IDF presentation of texts, we can use inverse and smoothed occurrence frequencies of text objects based on their lexical (taking into account the term occurrence frequency) or semantic (taking into account the node degree instead of the term occurrence frequency) analysis and the normalized or standardized occurrence frequency of documents in the text corpus.
The general formula for calculating TF-IDF is as follows (1):
where
and
can be calculated in various ways which can affect the accuracy of subsequent clustering. Here,
is the term;
is the document; and
is the corpus of documents.
We can use frequencies such as the following:
- 1
The occurrence frequency (2) of a term in the document or the node/term order in the document semantic network:
where
is the number of term occurrences (or node degrees) in the document;
is the total number of terms (or node degrees) in the document; and k is equal to the number of unique words or terms in the document;
- 2
The double normalized occurrence frequency (3) of a term in the document or the node/term degree in the document semantic network with a coefficient of 0.5:
where
is the number of term occurrences (or node degrees) in the document, and
is the number of occurrences of the most frequently occurring term in the document (or node degrees);
- 3
The inverse document (or node degree) frequency (4):
where
is the number of documents, and
is the number of documents where term/node
t appears;
- 4
The smoothed inverse document frequency (5):
where
is the number of documents, and
is the number of documents where term/node
appears;
- 5
The probabilistic inverse document frequency, as in Equation (6):
In the semantic approach, the occurrence frequency of terms is replaced by the node degree of the semantic graph in the document network (graph nodes are document terms). The inverse and smoothed inverse document frequencies are calculated in the same way as in the lexical approach, whereas is determined as the sum of degrees for a given node in the entire document; is the total number of node/term degrees in the document; and is the total number of degrees of the most frequently occurring node/term in the document.
The use of IDF allows one to reduce the weight of the frequently used words and terms and thus increase the value of the words and terms that most accurately convey the unique meaning of the document. The appearance of certain terms or words in the text is characterized by Zipf’s law. Applying a logarithm to the frequencies of occurrence of terms linearizes their distribution, but does not affect the relative ranking and gives small numerical values that are more convenient to use in calculations.
After calculating the TF-IDF matrices for a corpus of texts, we can perform a pairwise calculation of their cosine similarity (cosine of the angle between two vectors in node/term vector presentation) using the standard Equation (7):
where
is the value of the
i-th element of the first vector;
is the value of the
i-th element of the second vector; and
is the number of elements in the vector (number of terms in the vocabulary).
In addition, we can calculate the Euclidean distance (8):
The vector of each text document in the corpus has a large dimension; however, by using the cosine or Euclidean metrics, we can find the distances between all vector pairs and visualize them as points on a scaled plane, where the distances between them correspond to the calculated cosine or Euclidean metrics. We can assign a color to each point, depending on the text topic (documents with the same topic are marked with the same color). For this purpose, we can use the UMAP algorithm [
25,
26] that implements a non-linear reduction in the original dataset dimension by embedding it in a space of lower dimension (such as two-dimensional space in case of visualization). The following algorithm parameter values are used by default:
number of neighbors = 15,
minimum distance = 0.1,
random state = 0, and
metric = “Euclidean”.
Experimental studies show that when using some combinations of
and
, we can obtain a distribution of distances (cosine or Euclidean ones) between vectors with no compact location areas of vectors related to the same topic, and this reflects the difficulties of further clustering when using any algorithms (
Figure 4a). However, with another combination of
and
, we can obtain separated compact areas of colored dots, which suggests that these vectors can be clustered in a better way (
Figure 4b).
In order to conduct research and select the best combination of and using both lexical and semantic approaches to create TF-IDF, we used a test collection of documents labeled by experts in various topics. We collected a corpus of texts on 8 topics: “economics”, “IT and innovation”, “education”, “politics”, “industry”, “travel and tourism”, “agriculture”, and “health care and medicine” (8 topics and a total of 1600 texts including 251 to 900 words). The created corpus of texts can be used both to select the best combination of and using the lexical and semantic approaches and to study the statistical properties of the metrics distribution in the text vector space and to conduct clustering experiments.
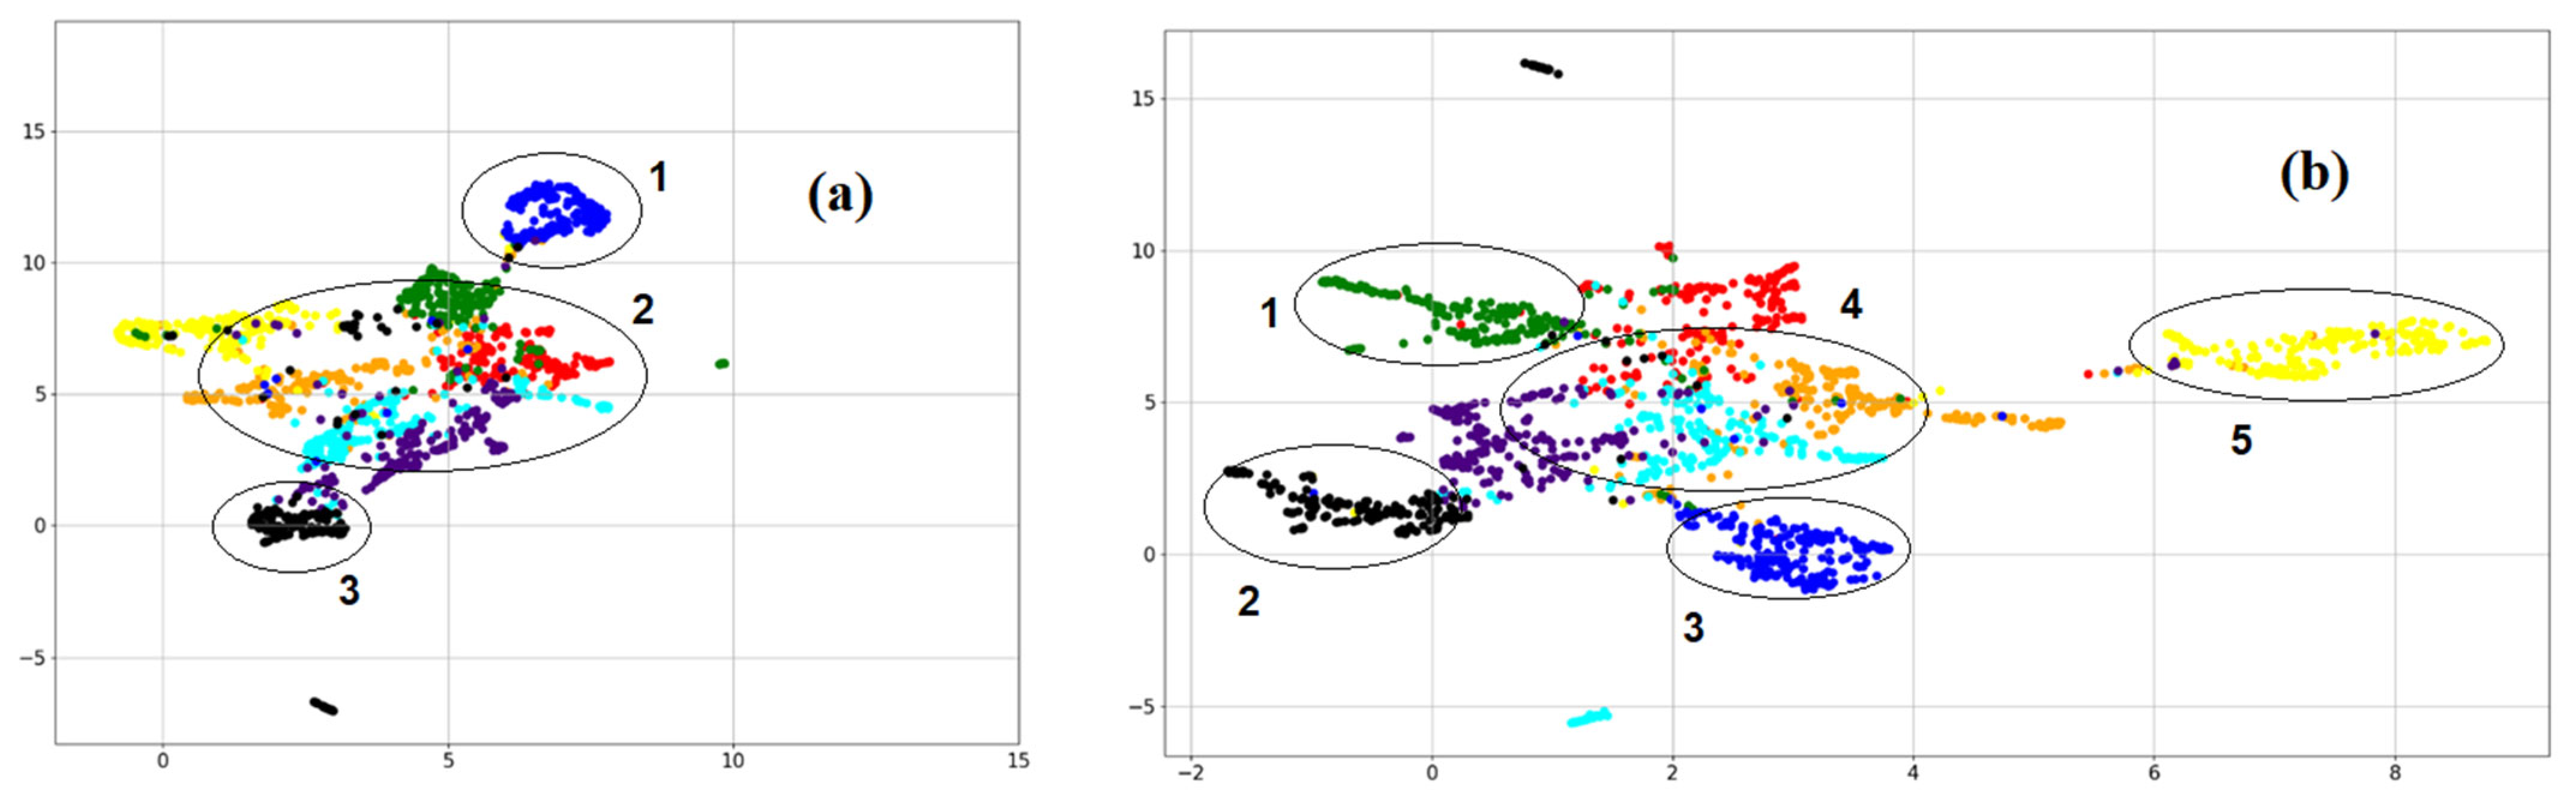
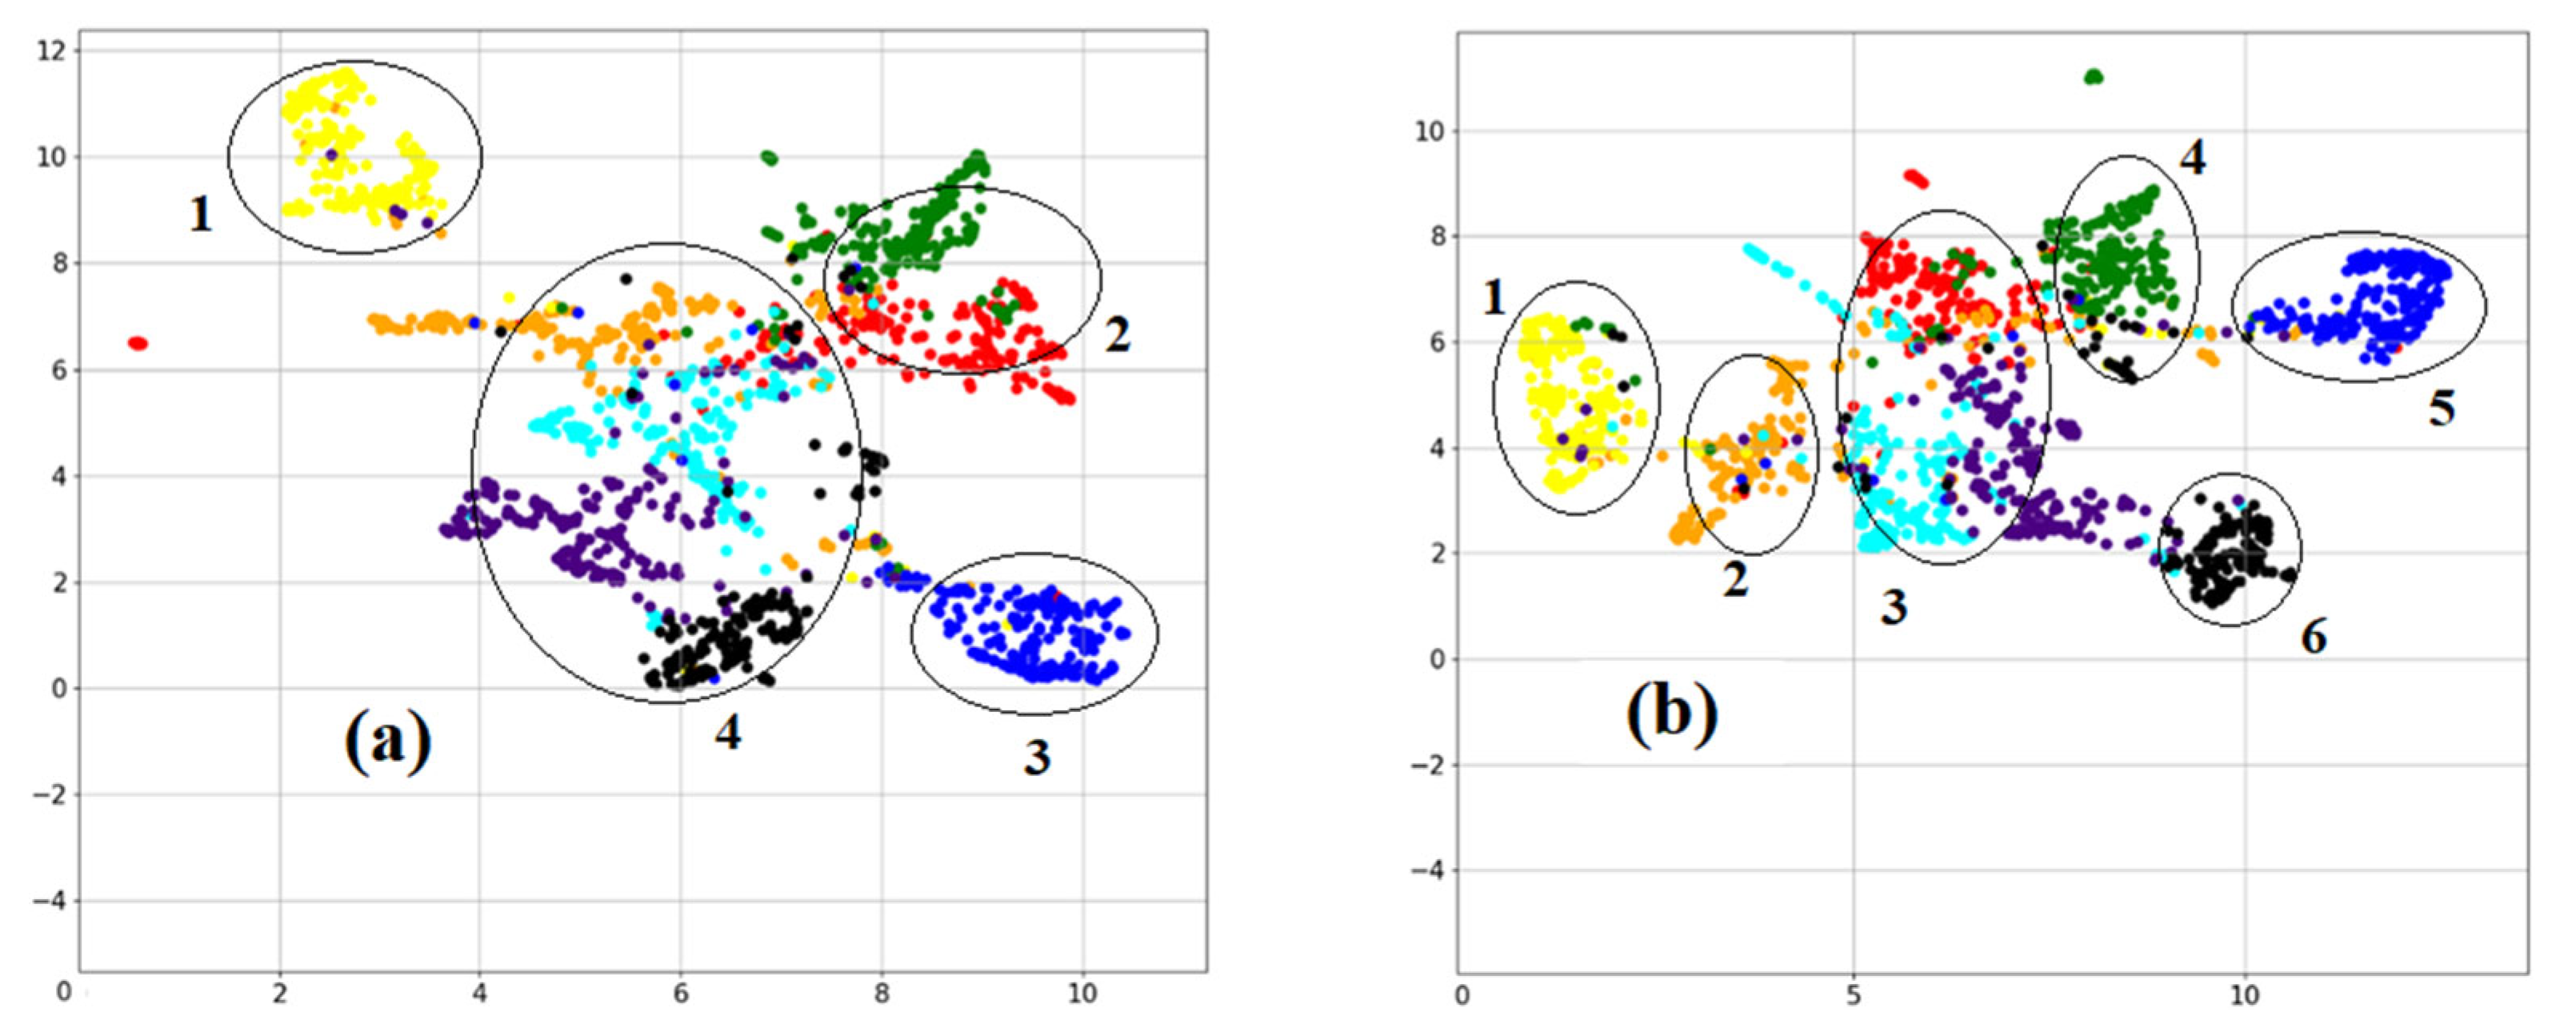
Figure 4 shows the visualization results using the UMAP algorithm for the cosine metrics in the text data corpus (based on the term occurrence frequency in documents).
Figure 4a shows the results obtained in the worst case where we used the double normalized frequency of in the document (3) and the inverse document frequency (4) when finding the cosine distances between text vectors.
Figure 4b shows the results obtained in the best case where we used the occurrence frequency of in the document (2) and the probabilistic inverse document frequency (6). This TF-IDF presentation shows the best result among all of the considered options for creating TF-IDF, because we can see a better visual division into clusters. In
Figure 4a we can clearly see Cluster 1 corresponding to the “travel and tourism” topic (dark blue dots) and Cluster 3 corresponding to the “health care and medicine” topic (black dots), whereas the “economics”, “IT and innovation”, “education”, “politics”, “industry”, and “agriculture” topics merge into a single cluster, Cluster 2; in
Figure 4b, we can see a better visual division into five clusters. The “politics” topic forms an isolated compact cluster, Cluster 1 (green dots); “health care and medicine” forms a compact cluster, Cluster 2 (black dots); “travel and tourism” (dark blue dots) forms a compact cluster, Cluster 3; and “education” forms a compact cluster, Cluster 5 (yellow dots), whereas “economics” (red dots), “IT and innovation” (orange dots), “industry” (light blue dots), and “agriculture” (purple dots) merge into a single cluster, Cluster 4.
Figure 5 shows the worst (
Figure 4a) and the best (
Figure 5b) visualization results using the UMAP algorithm for cosine metrics in a medium-length text corpus (based on node/term degrees in document semantic networks). The results in
Figure 5a were derived using the occurrence frequency of in the document (2) and the smoothed inverse document frequency (5), whereas the results in
Figure 5b were derived using the double normalized occurrence frequency of in the document (3) and the inverse document frequency (4). As you can see in
Figure 5, in the second case, we have a better separation of respective clusters (the cluster colors correspond to the same topics that are presented in
Figure 4).
The comparison of
Figure 4b and
Figure 5b shows that, in some cases, the semantic approach can provide a clearer separation of clusters (in
Figure 5b, five distinct clusters can be isolated, and they are circled with ovals, whereas in
Figure 4b, there are only four of them, and they are also circled with ovals).
It is also worth noting that in
Figure 4 and
Figure 5 we can see large overlap areas of some clusters. This is due to specifics of text documents, since a document can belong to several topics at once (e.g., “industry” and “economics”; “economics” and “agriculture”; etc.). This creates a fundamentally unsolvable problem of achieving uniqueness, high accuracy, and completeness of clustering, especially for texts of general, i.e., non-special, topics.
However, we can draw the general conclusion that the choice of a TF-IDF model for the subsequent calculation of metrics between vectors can have a significant impact on the accuracy and completeness of the further clustering of text documents.
4. Model for Determining Metrics of Difference between Text Document Vectors Based on Their Lexico-Semantic Bonds
Matrices of cosine vector values can be obtained based on the TF-IDF creation of text vectors based on the occurrence frequency of terms in documents using the lexical approach or node degrees in semantic networks.
In one matrix, the cosine between two vectors specifies the similarity in the lexical presentation; in the other matrix, it specifies similarity in the semantic presentation.
The simultaneous consideration of lexical and semantic characteristics can be of great interest in document clustering.
To consider the joint influence of lexical and semantic characteristics, we can move from the lexical and semantic matrices of cosine metric values between vectors to the matrix of their averaged values. When constructing it, we took the angle cosines between vectors calculated using the lexical and semantic parameters of the document from two respective matrices. Next, we averaged them and put the resulting value into the new matrix. In this case, we also obtained a square matrix that was symmetrical with respect to the main diagonal and had the same size as the original ones.
The purpose of averaging is as follows: if both cosines have a great value, then their average value that shows the bond between the lexical and semantic features of these documents is greater than in the case where at least one cosine has a small value.
Averaging for a cosine pair can be achieved using the arithmetic mean, harmonic mean, geometric mean, root mean square, or other more sophisticated methods.
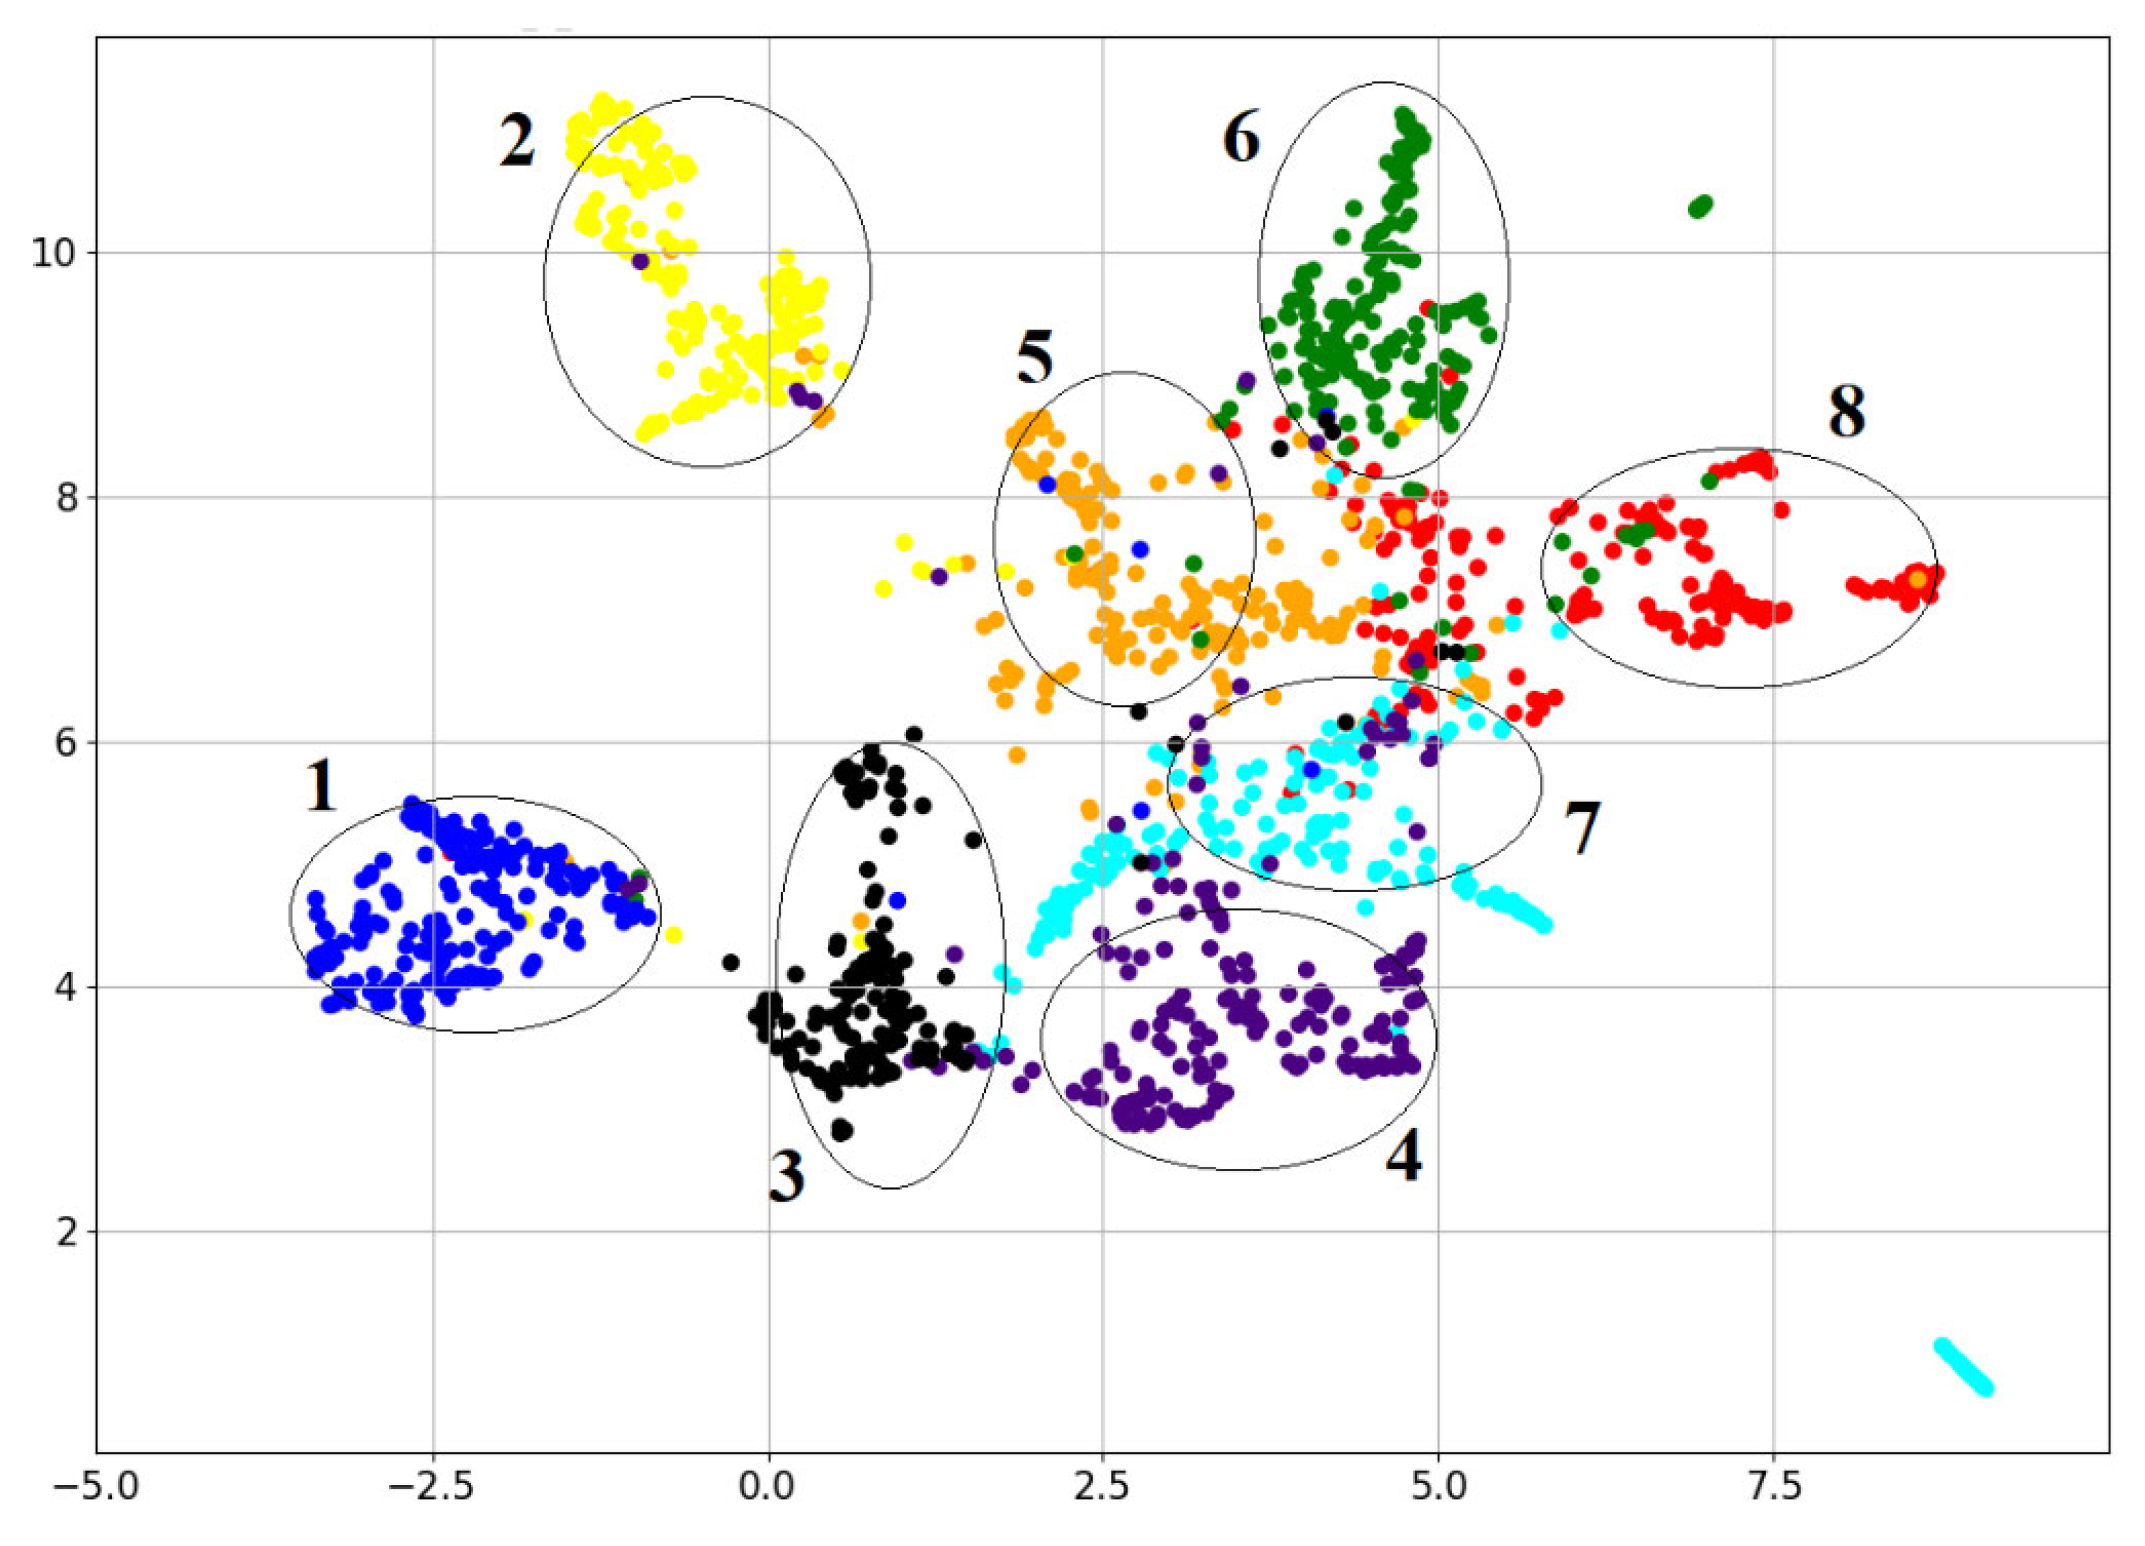
Figure 6 shows the visualization result using the UMAP algorithm for values of such a matrix of cosine metric values between vectors, obtained using the root mean square averaged formula, in the text corpus described above (the cluster colors correspond to the same topics that are shown in
Figure 4). In this case, we used a lexical matrix of cosine metric values that was calculated based on the occurrence frequency of an object in the document (2) and probabilistic inverse document frequency (6) using the occurrence frequency of terms in documents, and a semantic matrix of cosine metric values, calculated based on the double normalized occurrence frequency of an object in the document (3) and inverse document frequency (4) for node/term degrees in document semantic networks. These TF-IDFs showed the best cluster separation when used individually (
Figure 4b and
Figure 5b).
The comparison of
Figure 4b,
Figure 5b and
Figure 6 shows that, when using the average value of cosine metrics, we can generally see a clearer division of documents into clusters than when using the lexical and semantic approaches only: in
Figure 6, there are six distinct clusters (these clusters are numbered 1, 2, 3, 4, 6, and 8), whereas in
Figure 5b, there are five of them (these clusters are numbered 1, 2, 4, 5, and 6), and in
Figure 4b, there are only four of them (these clusters are numbered 1, 2, 3, and 5).
Therefore, we can conclude that the use of averaged values of cosine metrics that take both the lexical and semantic features of documents into account can improve the clustering quality and provide clearer division into distinct clusters.
The approach described above allows us to consider new clustering algorithms based on bonds between the lexical and semantic properties of documents and, e.g., the statistical properties of the similarity metric distributions of their vectors.
5. Algorithm for Clustering Text Documents Based on Their Lexico-Semantic Bond and Statistical Properties of the Similarity Metric Distributions of Their Vectors
Step 1. Take the matrix of the lexico-semantic bond between text document vectors (it has a square shape of size M × M, where M is the number of documents in the corpus) and replace the elements along the main diagonal with zeros in order to exclude the bond of a vector with itself.
Step 2. For each row of the lexico-semantic bond matrix , find the sum of the values of its elements and select the row with the maximum sum value. This row corresponds to the document that best matches the meaning of the other documents in this text corpus. The vector corresponding to this row will form the first cluster (let this row have the number i).
Step 3. For the selected row
i, find the mathematical expectation
and dispersion
of its elements
:
where
N is the number of elements in a row of the matrix, and the number of which is decreased when implementing the algorithm in Step 4, beginning from
M.
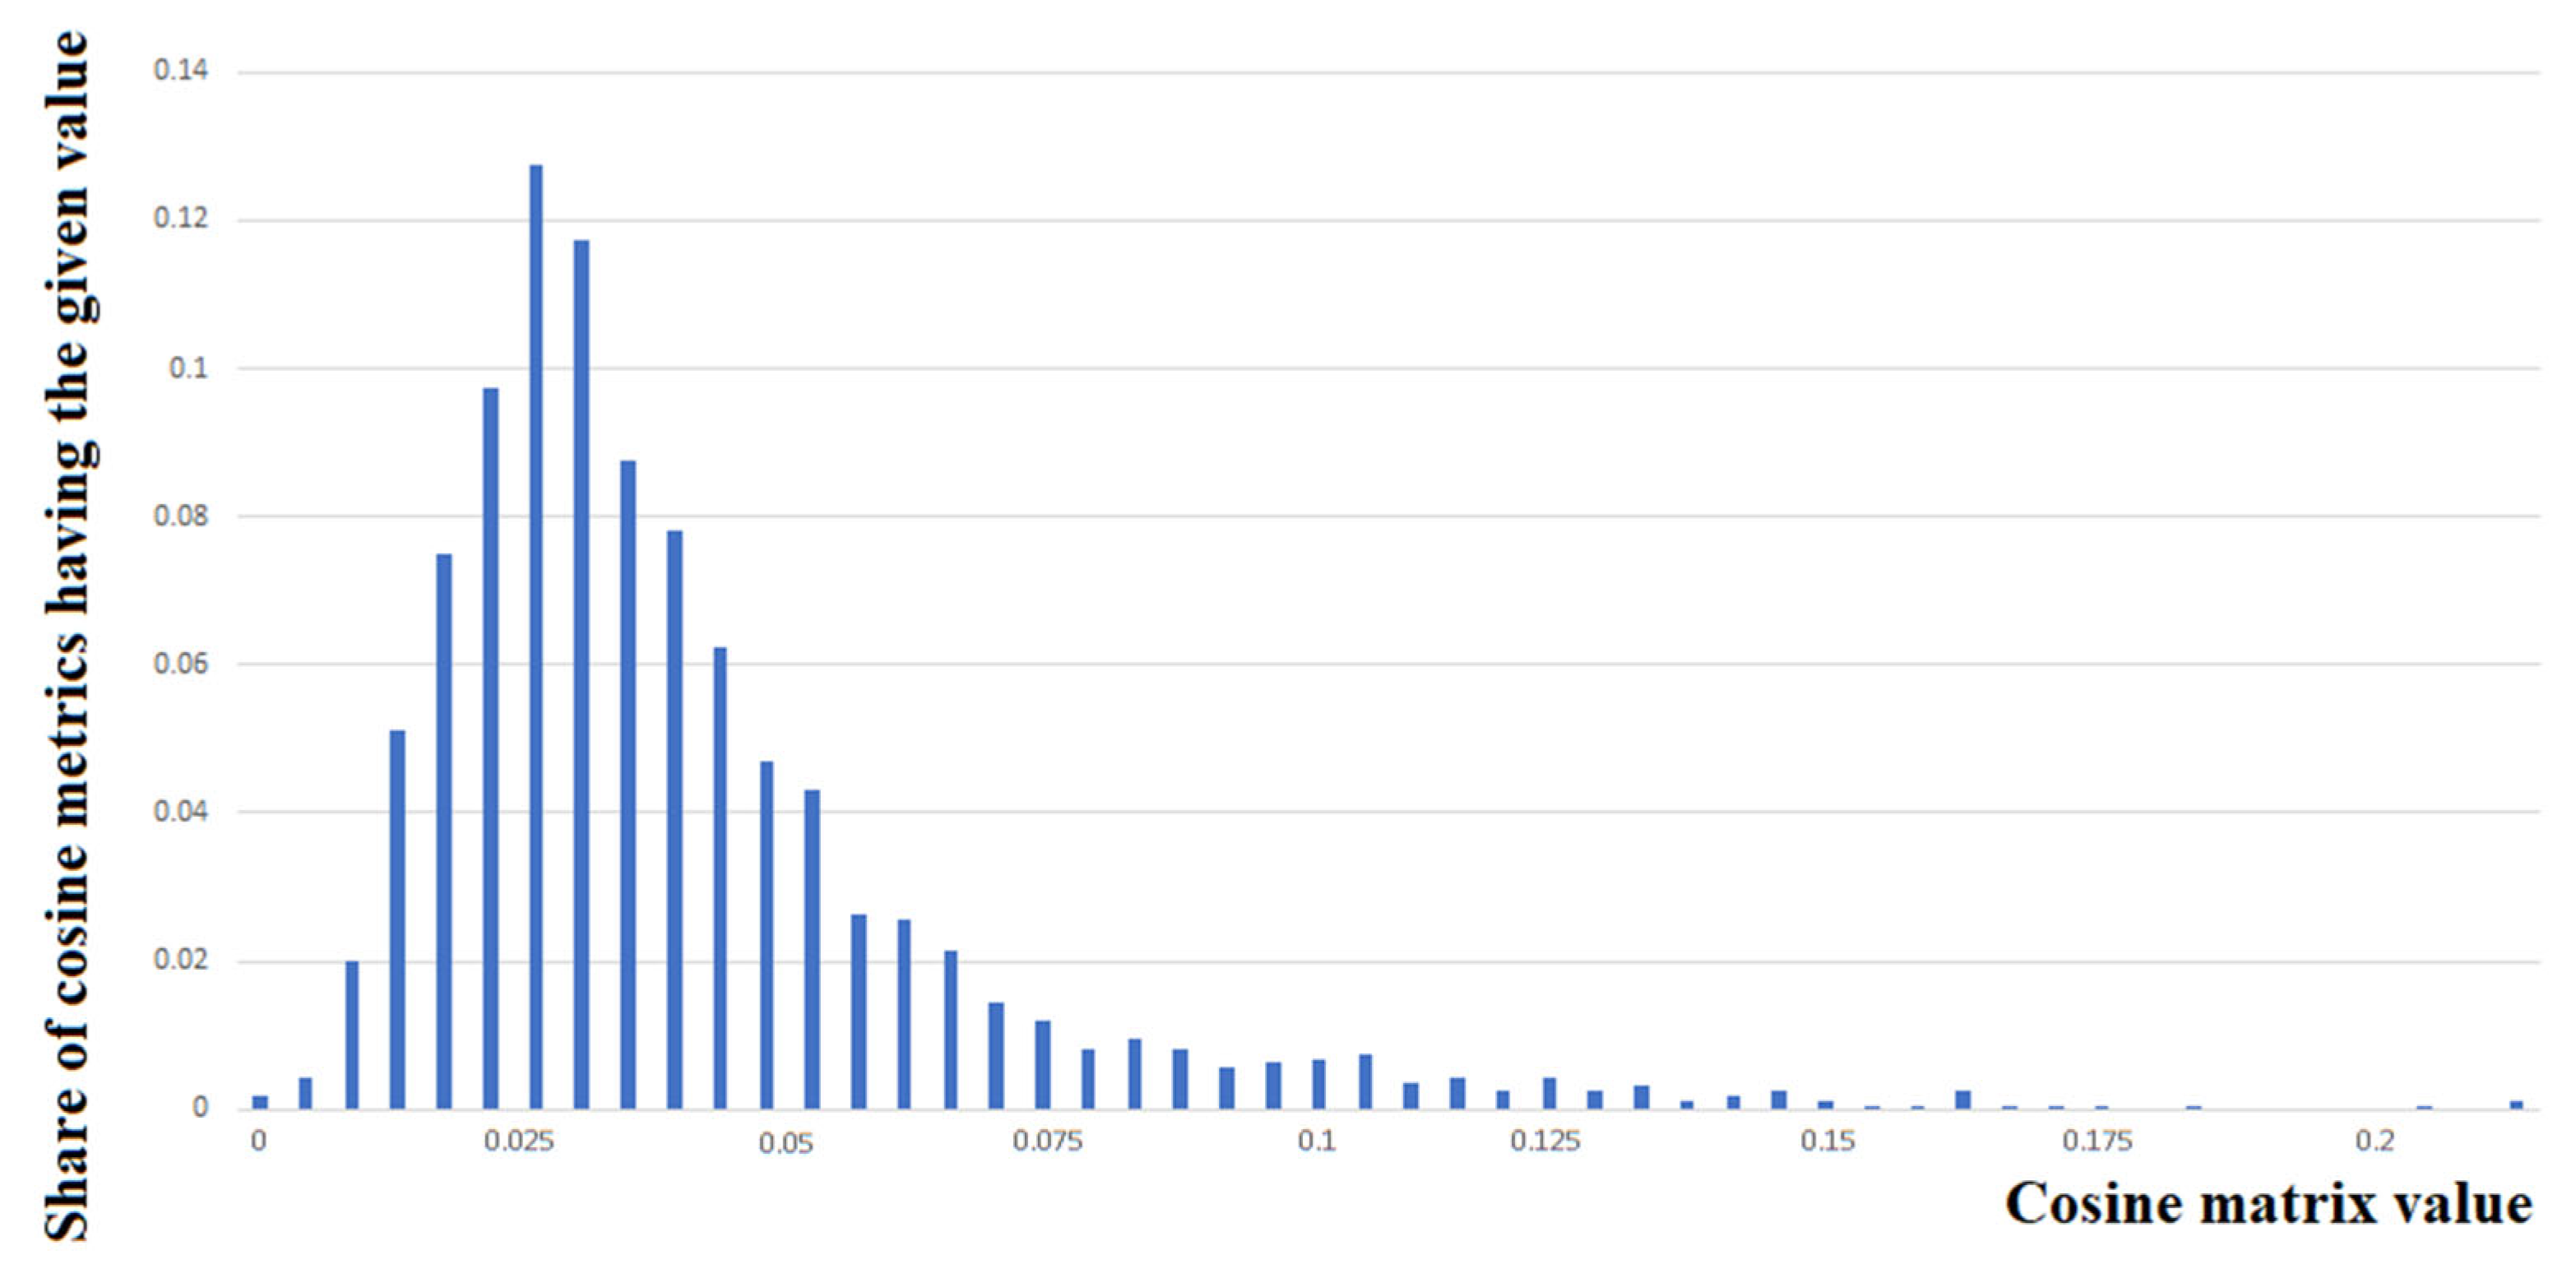
Figure 7 shows an example of the distribution of cosine metric values in the first row of the lexico-semantic bond matrix for a corpus of 1600 documents used in our study. In this case, the mathematical expectation value is equal to 0.043 and the dispersion value is equal to 0.027.
If the distribution of cosine metric values in the i-th row followed the Gaussian law, 2/3 of all values would be within a range of (95% within a range of and 99% within a range of ). To create a semantic cluster, we should select from the i-th row the values of the cosine metric that have the maximum value of the lexico-semantic bond degree, e.g., we should choose the cosine matrix values for which the following inequality is satisfied: , where j is the index showing the place of the cosine metric value between the vectors that are of interest to us in the i-th row (in fact, j is the document number). After this, we should find the documents corresponding to them and place them in the same cluster as the document that defined the i-th row.
Our data analysis shows that the following equalities were satisfied for the distribution of the cosine metric values in the i-th matrix row: the range of includes 89% of values (which is greater than in the case of the Gaussian distribution); the range of includes 96%; and the range of includes 98%. The choice of condition can, on one hand, provide accurate clustering and, on the other hand, result in creating a small number of clusters, whereby some of which can be further combined depending on the texts that they include.
The advantage of this approach is that we do not need to set in advance the number of clusters or the similarity metric between vectors to place them in one cluster. In this case, the similarity metric is related to the statistical characteristics of the distribution of cosine distances between vectors and is automatically derived from the distribution analysis.
Step 4. Delete the rows and columns corresponding to the documents in the first cluster from the matrix . Next, repeat Steps 2 to 4 until all documents are clustered or the following condition is no longer met: (if this condition is not met, all the remaining vectors are placed in the “garbage” cluster).
We can call the suggested algorithm “Lexico-semantic bonds and statistical distributions of similarity metrics”.
The process of clustering text documents using the suggested algorithm is described in Algorithm 2.
| Algorithm 2: Clustering text documents based on their lexico-semantic bond. |
| Input:—lexico-semantic matrix. |
| 1. | . |
| 2. | Repeat: |
| 3. | —set vector to be equal to the first row of the matrix. |
| 4. | —number of the row in matrix . |
| 5. | For each i-th row do |
| 6. | —sum of all components of the vector . |
| 7. | , then |
| 8. | . |
| 9. | . |
| 10. | End loop. |
| 11. | —expected value for vector . |
| 12. | —standard deviation for vector . |
| 13. | —threshold value. |
| 14. | . |
| 15. | For each k-th component of the vector , do |
| 16. | , then |
| 17. |
|
| 18. | End loop. |
| 19. | End loop, if |
| 20. | —ordered set of clusters. |
| 21. | For each
, do |
| 22. | Delete from matrix cells , if . |
| 23. | End loop. |
| 24. | End loop, if . |
| 25. | Return the discovered clusters . |
The computational complexity of the developed algorithm is
, where
is the number of clusters to be found;
is the number of documents in the corpus; and
is the maximum number of documents among the clusters [
22].
6. Using the Developed Model for Lexico-Semantic Presentation of Text Documents in Clustering Algorithms
To analyze the possibility of using the developed model for the lexico-semantic presentation of text documents in clustering algorithms, we should assess the clustering accuracy and completeness that can be obtained when using it. We will compare the proposed algorithm and the affinity propagation algorithm, which is a non-hierarchical algorithm and does not require the number of clusters to be known in advance. The complexity of this algorithm is , where is the number of objects (documents in the corpus) to be clustered and l is the number of iterations. It is widely used to solve document clustering problems; so, we chose it as a research tool for the developed model.
For the results of studies using different clustering algorithms to be comparable with each other, they must be carried out on the same sample of marked texts. For this purpose, we have used the aforementioned marked corpus of documents of 8 different topics (1600 texts; 200 in each topic with 251 to 900 words).
For the convenience of interpreting the experimental results, let us introduce the following description of the processes and tools used:
Affinity propagation—I (lex). The algorithm’s input is the matrix of the cosine metric values, which is calculated based on the occurrence frequency of an object in the document (2) and probabilistic inverse document frequency (6) using the term occurrence frequency in documents. The visualization of this distribution of cosine metric values using the UMAP algorithm is shown in
Figure 4b; with the choice of
and
, we have a better graphic division of clusters when using the lexical approach.
Affinity propagation—II (sem). The algorithm’s input is the matrix of the cosine metric values, which is calculated based on the double normalized frequency occurrence of an object in the document (3) and inverse document frequency (4) for node/term degrees in document semantic networks. The visualization of this distribution of the cosine metric values using the UMAP algorithm is shown in
Figure 5b; with the choice of
и
, we have a better graphic division of clusters when using the semantic approach.
Affinity propagation—III (matrix). The algorithm’s input is the matrix derived from averaging the relevant elements of the lexical and semantic matrices of the cosine metric values between vectors. The visualization of this distribution of averaged cosine metric values using UMAP is shown in
Figure 6.
“Statistical distributions of similarity metrics—lex” algorithm. Its difference from the “Lexico-semantic bonds and statistical distributions of similarity metrics” algorithm lies in the fact that the algorithm’s input is the matrix of the cosine metric values, which is derived from the document lexical presentation only.
“Statistical distributions of similarity metrics—sem” algorithm. Its difference from the “Lexico-semantic bonds and statistical distributions of similarity metrics” algorithm lies in the fact that the algorithm’s input is the matrix of the cosine metric values, which is derived from the document’s semantic presentation only.
“Lexico-semantic bonds and statistical distributions of similarity metrics” algorithm.
The affinity propagation algorithm was launched with the following parameter values:
preference = −5,
max_iter (maximum number of iterations) = 5000, and
convergence_iter (number of convergence iterations) = 15 [
27], as commonly used in practice.
When assessing the quantitative properties of the clustering accuracy and completeness, we used the following methods. We added the vectors of the entire labeled text corpus of eight topics to the input of the algorithms under consideration. Neither the number of topics nor the vector labeling according to the topics were provided to the algorithm. Next, the number of vectors corresponding to each topic of the corpus was calculated in each cluster found by the algorithm under consideration.
Table 1 shows the results of clustering the text corpus under consideration using affinity propagation—II (sem)—as an example.
It should be noted that the clustering, its accuracy, and the completeness assessment were performed for all algorithms under consideration; however, for the sake of brevity, their presentation is not given here.
When assessing the clustering accuracy for any algorithm, we face the following problem: any resulting cluster can include documents with various topics (
Table 1). We need a procedure that would take this fact into account when estimating the average value of the clustering accuracy for documents of each topic, whilst involving all of the clusters found. For this purpose, we can first find the accuracy in each cluster for each topic included in it. For example, when using the semantic approach in the vector presentation of documents, the affinity propagation algorithm creates 14 clusters (
Table 1). Accordingly, we should find the clustering accuracy for each of the eight topics in each of these clusters. Accuracy can be defined as the ratio of the vector number for a given topic in a cluster to the total number of vectors therein.
Then, we should define the mean value of the clustering accuracy and completeness for each topic in the entire document corpus and the mean accuracy and completeness for all of the topics.
To calculate the mean value of the clustering accuracy
for each
j-th topic, we suggest using the following formula:
where
is the mean clustering accuracy for documents of the
j-th topic in all of the clusters that include this topic;
is the total number of documents in the
i-th cluster which include the
j-th topic; and
is the clustering accuracy for documents of the
j-th topic in the
i-th cluster. This formula for assessing the mean values of the clustering accuracy allows us to weigh the contribution of the accuracy value derived for each cluster, taking its size into account.
In the same way, we can calculate the mean clustering completeness for each topic and the mean clustering completeness for all texts in the corpus, if, in the presented formula, we replace with , which is the clustering completeness of texts with the j-th topic included in the i-th cluster. The completeness is calculated as the ratio of the number of texts on a given topic, which are included in the selected cluster, to the total number of documents on this topic in the corpus (in our case, 200).
An assessment of the clustering completeness of texts using their semantic characteristics for the vector presentation is given in
Table 2.
When calculating the mean accuracy and completeness of clustering document topics, we excluded those clusters in which documents on a given topic were not included or included as noise (in
Table 1 and
Table 2, filtered data are marked with dashes).
The resulting data of assessing the topic clustering accuracy and completeness according to clusters allow us to calculate the mean clustering value for each topic and the mean accuracy for all of the topics in the corpus (
Table 3).
The mean accuracy and completeness for all corpus topics can be calculated as the mean arithmetic value of the mean values for each of the corpus topics.
Let us analyze the data presented in
Table 3.
We shall start by analyzing how the lexical, semantic, and combined presentation of texts affect the processing of cosine metric value matrices and clustering accuracy when using the affinity propagation algorithm as a research tool (
Table 3).
When using the lexical, semantic, and combined (with an averaged value matrix representing the lexico-semantic bond) approaches, the number of resulting clusters was equal to 29, 14, and 21 (
Table 3), respectively, whereas the respective clustering accuracy values were 29%, 31%, and 35% (
Table 3). Therefore, we can assume that the transition from the lexical presentation of documents to the semantic one allows us to increase the clustering accuracy (approximately by absolute 3% or relative 10%) and reduce the cluster number (from 29 to 14). When moving from the semantic approach to the combined one, the clustering accuracy increases (approximately by absolute 3% or relative 10%); however, the number of clusters increases as well (from 14 to 21). This suggests that the relationship between the cluster number and the clustering accuracy is not unambiguous, but that the combined approach increases the clustering accuracy, which correlates with the data obtained using the UMAP algorithm from the visualization of cosine metric value matrices using the lexical (
Figure 4b), semantic (
Figure 5b), and combined approaches toward document vectorization (
Figure 6).
The clustering completeness when using the affinity propagation algorithm with lexical, semantic, and combined approaches is 15%, 23%, and 18%, respectively (
Table 3).
It should be noted that assessing the clustering accuracy and completeness in the event where there are many topics and many clusters in which documents from these topics can be included in different ratios is a very difficult issue; however, this is a problem for a separate study. Our assessments do not claim to be absolutely accurate, but they suggest that using the combined approach based on the lexico-semantic bond of texts allows one to increase the clustering accuracy compared to the approaches based only on lexical or semantic document presentation.
Let us analyze the results of using the algorithm for clustering text documents based on their lexico-semantic bond and statistical distribution properties of similarity matrices for their vectors (
Table 3).
When using the lexical, semantic, and combined (with a matrix of averaged values which represents lexico-semantic bonds) approaches, the number of resulting clusters is equal to 113, 98, and 104, respectively (
Table 3). In this case, the clustering accuracy values are 34%, 34%, and 37%, respectively (
Table 3). Therefore, we can assume that the transition from the document lexical presentation to the semantic one allows one to increase the clustering accuracy, as well as when using the affinity propagation algorithm. It should be noted that, in this case, we obtain a significantly greater (about four times) number of clusters than when using the affinity propagation algorithm; however, the trend of changing their number in the series “lexical approach”–“semantical approach”–“combined approach” remains.
The clustering completeness when using the clustering algorithm for text documents based on their lexico-semantic connection and statistical properties of the distributions of the similarity metrics of their vectors is significantly inferior to the affinity propagation algorithm and is 11% for all three approaches (lexical, semantic, and combined) (
Table 3).
If we select documents when combining them in one cluster not based on the row with the maximal sum of its cosine metrics values, but based on the row with the minimal sum, the clustering accuracy values are 24% for the lexical approach (former value: 34% in the case of the maximum-based condition), 25% for the semantic approach (former value: 34% in the case of the maximum-based condition), and 25% for the combined approach (former value: 37% in the case of the maximum-based condition). The clustering completeness in this case is equal to 8%, 8%, and 9%, respectively.
Therefore, we can conclude that choosing the clustering option based on the minimal sum of cosine metric values in the matrix rows is significantly worse as compared to the option with the maximal sum.
In our study, we also analyzed how merging clusters with a small number of objects affects the clustering accuracy and completeness. In particular, we merged clusters containing a small number of vectors: the original clusters were merged into a new enlarged cluster if the number of vectors in the original cluster was less than 21 and . After that, their number was 63 for the lexical approach (former value: 113), 64 for the semantic approach (former value: 98), and 65 for the combined approach (former value: 104). In this case, the clustering accuracy values were equal to 31% (former value: 34%), 31% (former value: 34%), and 35% (former value: 37%), respectively. The clustering completeness was equal to 12%, 12%, and 13%, respectively. We can draw the following conclusion: merging clusters leads to an increase in the completeness of clustering with a slight decrease in accuracy.
7. Findings and Conclusions
The UMAP algorithm that implements a non-linear dimensionality reduction in the original dataset through embedding it in a space of a lower dimension, and provides the possibility of its 2D visualization, shows qualitatively that the best option for dividing documents into clusters is to create their TF-IDF vectors and a matrix of cosine metric values based on the model of their lexico-semantic bond. However, even in this case, the choice of the TF-IDF model for the subsequent calculation of the cosine metric between vectors can have a significant impact on the accuracy and completeness of the further clustering of text documents. The best result can be obtained for the model of the lexico-semantic bond if, in order to calculate the lexical matrix of cosine metric values, we use document vectors based on the occurrence frequency of objects in documents (2) and the probabilistic inverse document frequency (6) using the term occurrence frequency in documents, as well as a semantic matrix of cosine metric values which is calculated based on the vector presentation using the double normalized occurrence frequency of an object in the document (3) and the inverse document frequency (4) for node/term degrees in document semantic networks.
For such an analysis of the joint influence of lexical and semantic characteristics, we can move from the lexical and semantic matrices of the cosine metric values between vectors to the matrix of their averaged values. When constructing such a matrix, we took the angle cosine between vectors calculated using the document lexical characteristics from one matrix and the angle cosine between the same vectors calculated using the semantic characteristics from the other matrix. Then, we averaged them and recorded the resulting value into a new matrix. In this case, we had a square matrix that was symmetric with respect to the main diagonal and had the same size as the original matrices.
The averaged values took into account both the lexical and semantic properties of the documents. The use of these values improved the clustering quality and provided a clearer division into distinct clusters. We saw the best clustering result when using root mean square averaging.
The approach that was described above allowed us to develop new clustering algorithms based on the lexical and semantic properties of documents and the statistical distribution characteristics of similarity matrices for their vectors.
Following these studies, we can draw the following conclusions:
The clustering accuracy of text documents using the affinity propagation algorithm is 29%, 31%, and 35%, respectively, for the lexical, semantic, and combined approaches. The transition from the lexical representation of documents to the semantic one (
Table 3) makes it possible to slightly increase (by approximately 3% absolute or 10% relative) the clustering accuracy and reduce the number of clusters. The transition from the semantic approach to the combined one (
Table 3) leads to a slight increase in the number of clusters and an increase in the clustering accuracy (by about 3% absolute or about 10% relative). The clustering completeness in the lexical, semantic, and combined approaches is 15%, 23%, and 18%, respectively.
The clustering accuracy of text documents when using the algorithm based on their lexico-semantic relationship and statistical properties of distributions of similarity metrics using the procedure for combining clusters containing a small number of texts is 31%, 31%, and 35%, respectively, for the lexical, semantic, and combined approaches. The clustering completeness in the lexical, semantic, and combined approaches is 12%, 12%, and 13%. The accuracy of clustering without the use of the procedure for combining clusters is 34%, 34%, and 37%, respectively, and the recall is 11%, 11%, and 11%, respectively.
Thus, we can conclude that there are similar trends when using both clustering algorithms, both in terms of the number of clusters and in terms of the clustering accuracy in the transition from the lexical approach to the semantic one, and from this to the combined one (
Table 3). At the same time, the proposed clustering algorithm is somewhat superior to the affinity propagation algorithm in terms of accuracy.
Summarizing the results of this study, we can assert the following:
The developed model for the lexico-semantic presentation of text documents allows one to increase the accuracy of their subsequent clustering.
The developed algorithm for clustering text documents based on their lexico-semantic bond and statistic distribution properties of similarity matrices for their vectors shows good results that are comparable with the widely used affinity propagation algorithm; however, our algorithm does not require the configuration parameters or indication of the similarity degree to combine text documents into one cluster.
8. Directions for Further Research
The use of the semantic approach makes it possible to generally improve the accuracy of clustering. In this study, degrees of nodes were used to characterize nodes (words or terms) and their connections with other nodes. This is only one of the possible characteristics of a complex graph of the semantic network of a text document, which narrows the semantic model to a lexical one, in which the occurrence of words and terms is characterized only by their relative occurrence frequencies in the document. However, even this allows one to slightly increase the accuracy of clustering. The use of a semantic approach makes it possible to characterize network nodes not only by their degree, but, for example, by characteristics such as clustering coefficient and mediation coefficient. The clustering coefficient is a measure of the density of connections of a given vertex with its neighbors. It is calculated as the ratio of the actual number of links between the nearest neighbors of a node to the maximum possible number of links in which all of the nearest neighbors of this node would be connected directly to each other. The value of the clustering coefficient of a node is in the range from 0 to 1. The higher the value of the coefficient, the more significant this node is for the semantic network of the document. The mediation coefficient shows how many shortest paths between all pairs of nodes in the network pass through a given node, in relation to the total number of all of the shortest paths in the network. The value of the degree of mediation is in the range from 0 to 1. The higher the value of the degree of mediation, the more significant the role of this node in the exchange of information.
The use of clustering coefficients and mediation coefficients, together with the degree of nodes, can improve the clustering of text documents due to a more accurate conveyance of meanings. In this case, the following model can be proposed:
The first step is to build the semantic network of the text.
The second step is to determine the following characteristics for each node of the constructed network: a is the degree of the node, b is the clustering coefficient, and c is the mediation coefficient. Thus, the characteristics of each node of the graph will be described by a vector consisting of three elements (a, b, and c).
The third step is to build a node–document matrix of size M (M is the number of words or terms of the dictionary of the corpus of texts) by N (N is the number of documents in the corpus):
is the degree of the k-th node in the i-th document; is the clustering coefficient of the k-th node in the i-th document; and is the mediation coefficient of the k-th node in the i-th document. The value of k varies from 1 to M, and i varies from 1 to N.
- 4
The fourth step is to build an N by N matrix of cosine metric values according to (7).
To illustrate the calculation of
,
and
in (7) for
i = 1, we provide the following example:
The value of the node degree is greater than 1; therefore, it should be normalized when calculating the cosine metric so that it does not have a disproportionately large influence (compared to the clustering and mediation coefficients). In order to achieve this, one can find the ratio of the sum of the degrees of a given node over the entire semantic network to the sum of the degrees of all nodes of the graph of the given text.
It should be noted that the clustering and mediation coefficients must also be normalized.
The resulting matrix of the cosine metric can be used for clustering text documents.
In the future, we intend to study the described model and analyze how its use affects the accuracy of clustering when using various algorithms.


