

Storytelling with Image Data: A Systematic Review and Comparative Analysis of Methods and Tools

 , , , and
Abstract
1. Introduction
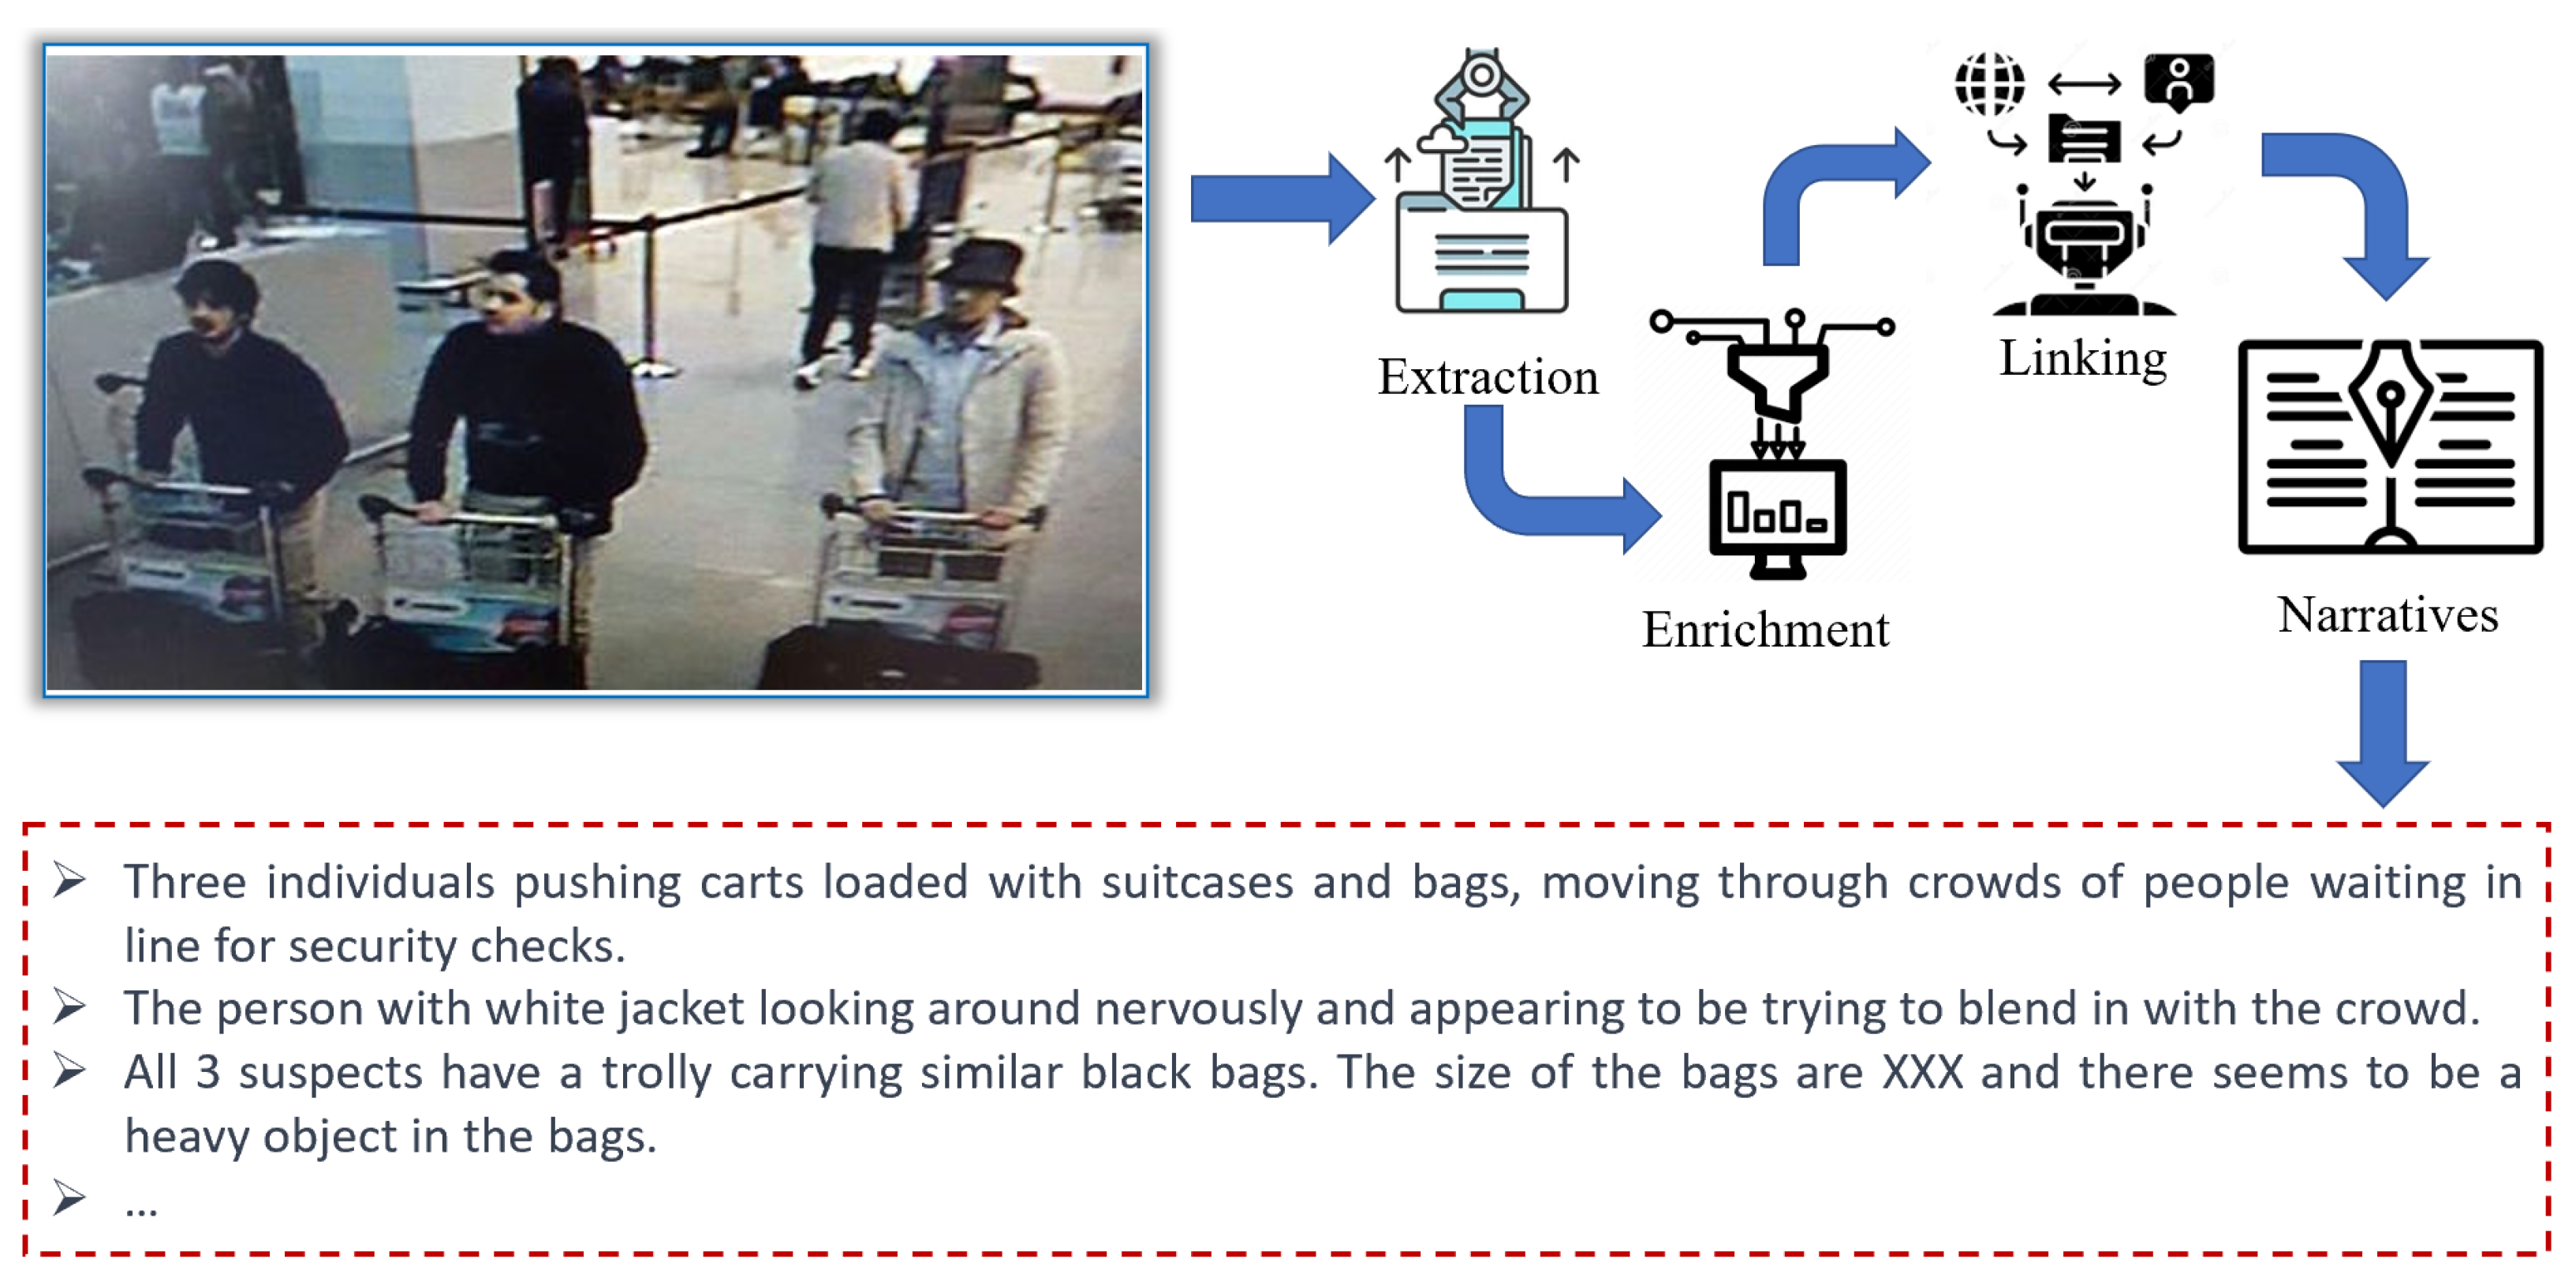
- Unattended bags or packages: these can be detected by analyzing the shape, size, and position of bags and packages in an image.
- People loitering or moving in a suspicious manner: this can be detected by analyzing the movements and patterns of people in the image.
- Individuals wearing bulky or concealed clothing: this can be detected by analyzing the size and shape of individuals in the image.
- Suspicious behavior: this can be detected by analyzing the posture and gestures of individuals in the image.
- Abandoned vehicles or other objects: these can be detected by analyzing the position and size of vehicles and other objects in the image.
2. Literature Selection
2.1. Background and Motivation
2.2. Research Questions
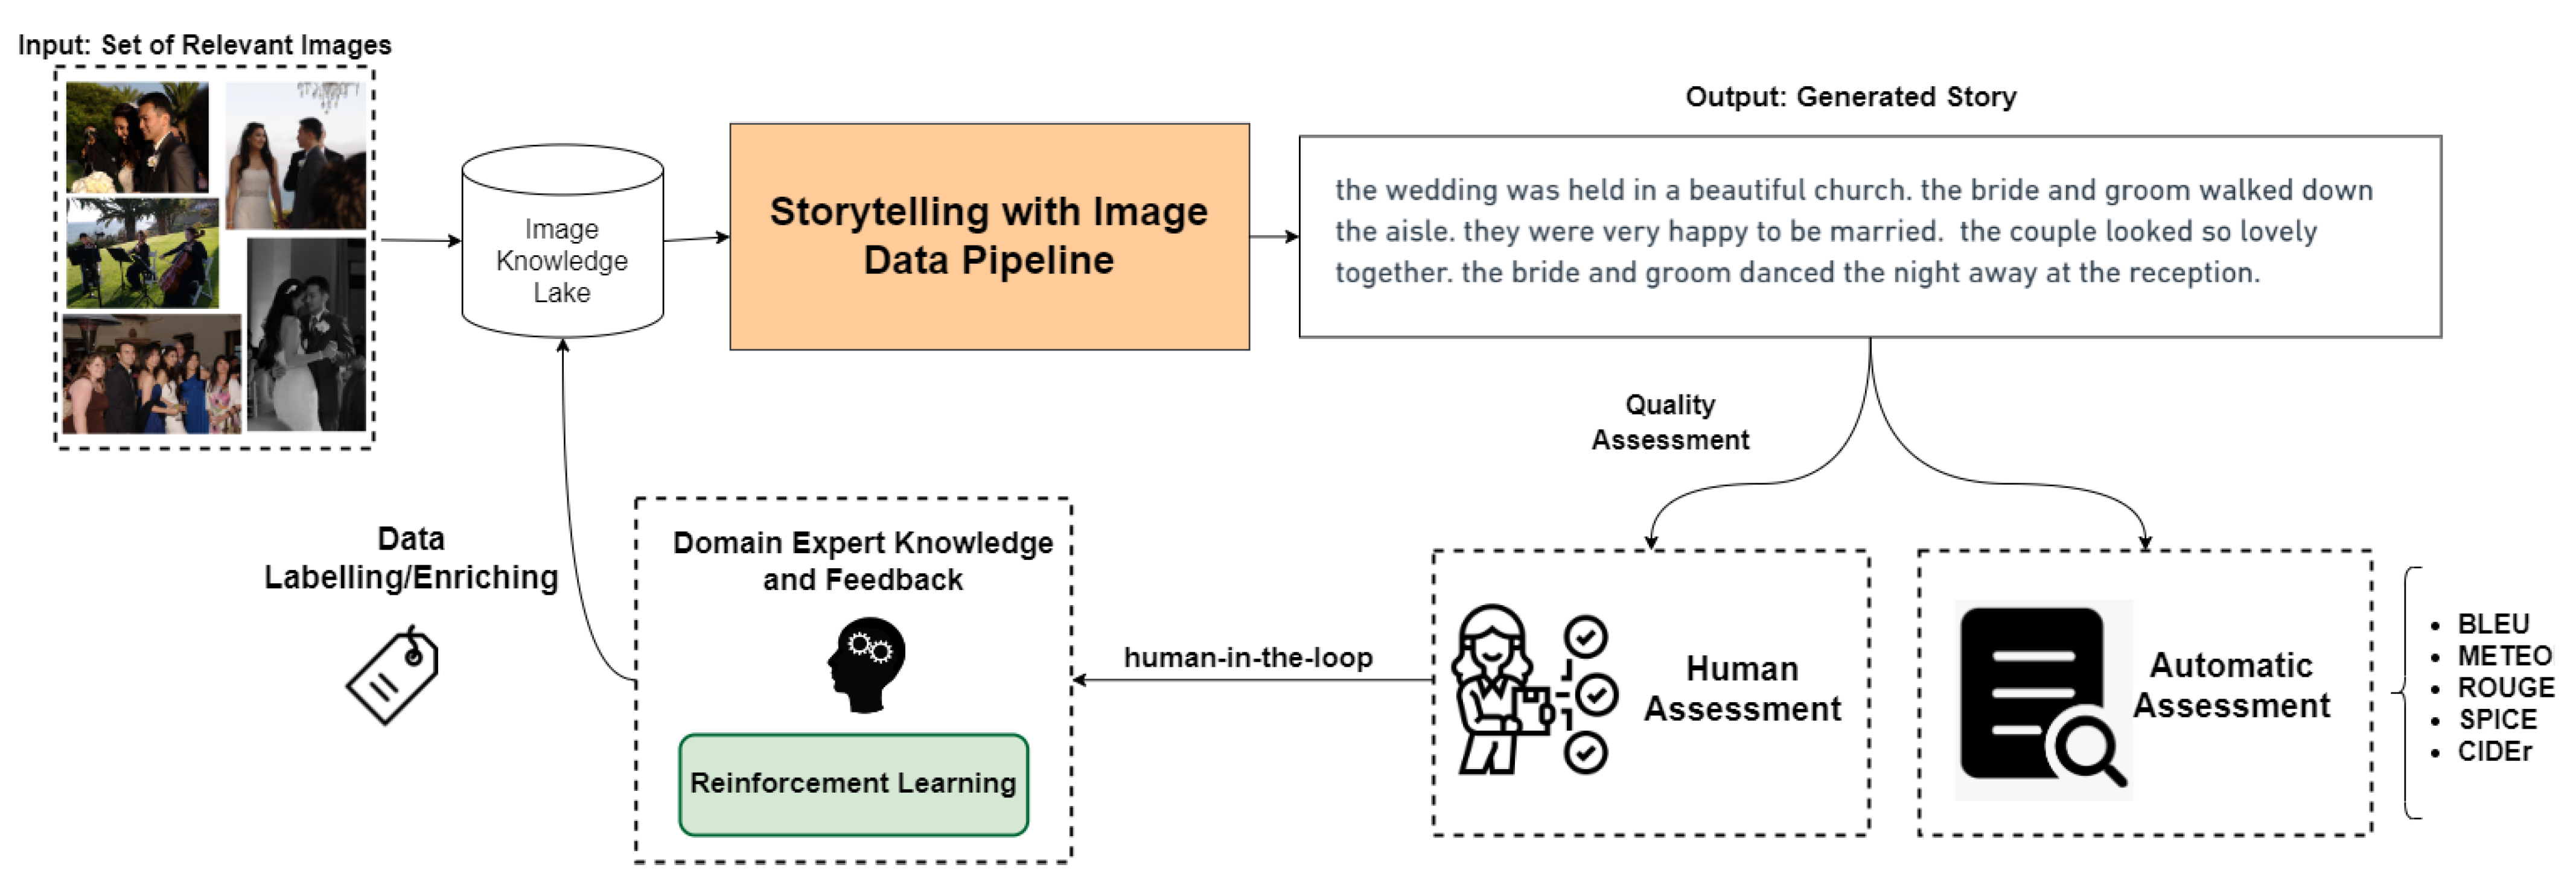
- RQ1. What is storytelling with image data, and how can it contribute to understanding images?
- RQ2. How is storytelling with image data different from image/video captioning methods?
- RQ3. What are the differences between storytelling with a set of related images rather than a single image?
- RQ4. What are the technical challenges we face in storytelling with image data?
- RQ5. What techniques have been used in storytelling with image data?
- RQ6. What are the applications of storytelling with image data, and how can they provide value for businesses?
- Image data can be used to create compelling marketing campaigns that are more engaging than traditional text-based approaches.
- Visualizations of data through image data can provide businesses with valuable insights and help them make data-driven decisions.
- The use of image data can enhance the customer experience by creating more immersive and interactive experiences.
- Storytelling with image data can help businesses to differentiate their brand and stand out in a crowded marketplace.
- The adoption of image data in storytelling can lead to improved brand perception, increased customer loyalty, and ultimately, increased revenue growth.
- RQ7. How can the quality of the stories be assessed?
- The identification of key elements that contribute to the quality of visual stories, such as the use of clear and concise messaging, the use of compelling visual elements, and the emotional impact of the story.
- The development of a framework for evaluating the quality of visual stories, including the creation of metrics to assess the effectiveness of the story in achieving its intended goals.
- The importance of considering the target audience when assessing the quality of visual stories, as different audiences may have different preferences and expectations.
- The need to balance the creative and technical aspects of visual storytelling when assessing quality, as both elements are important in creating effective stories.
- The potential for using technology, such as eye-tracking or emotional recognition software, to measure the impact of visual storytelling on the viewer.
2.3. Literature Selection
- English language studies.
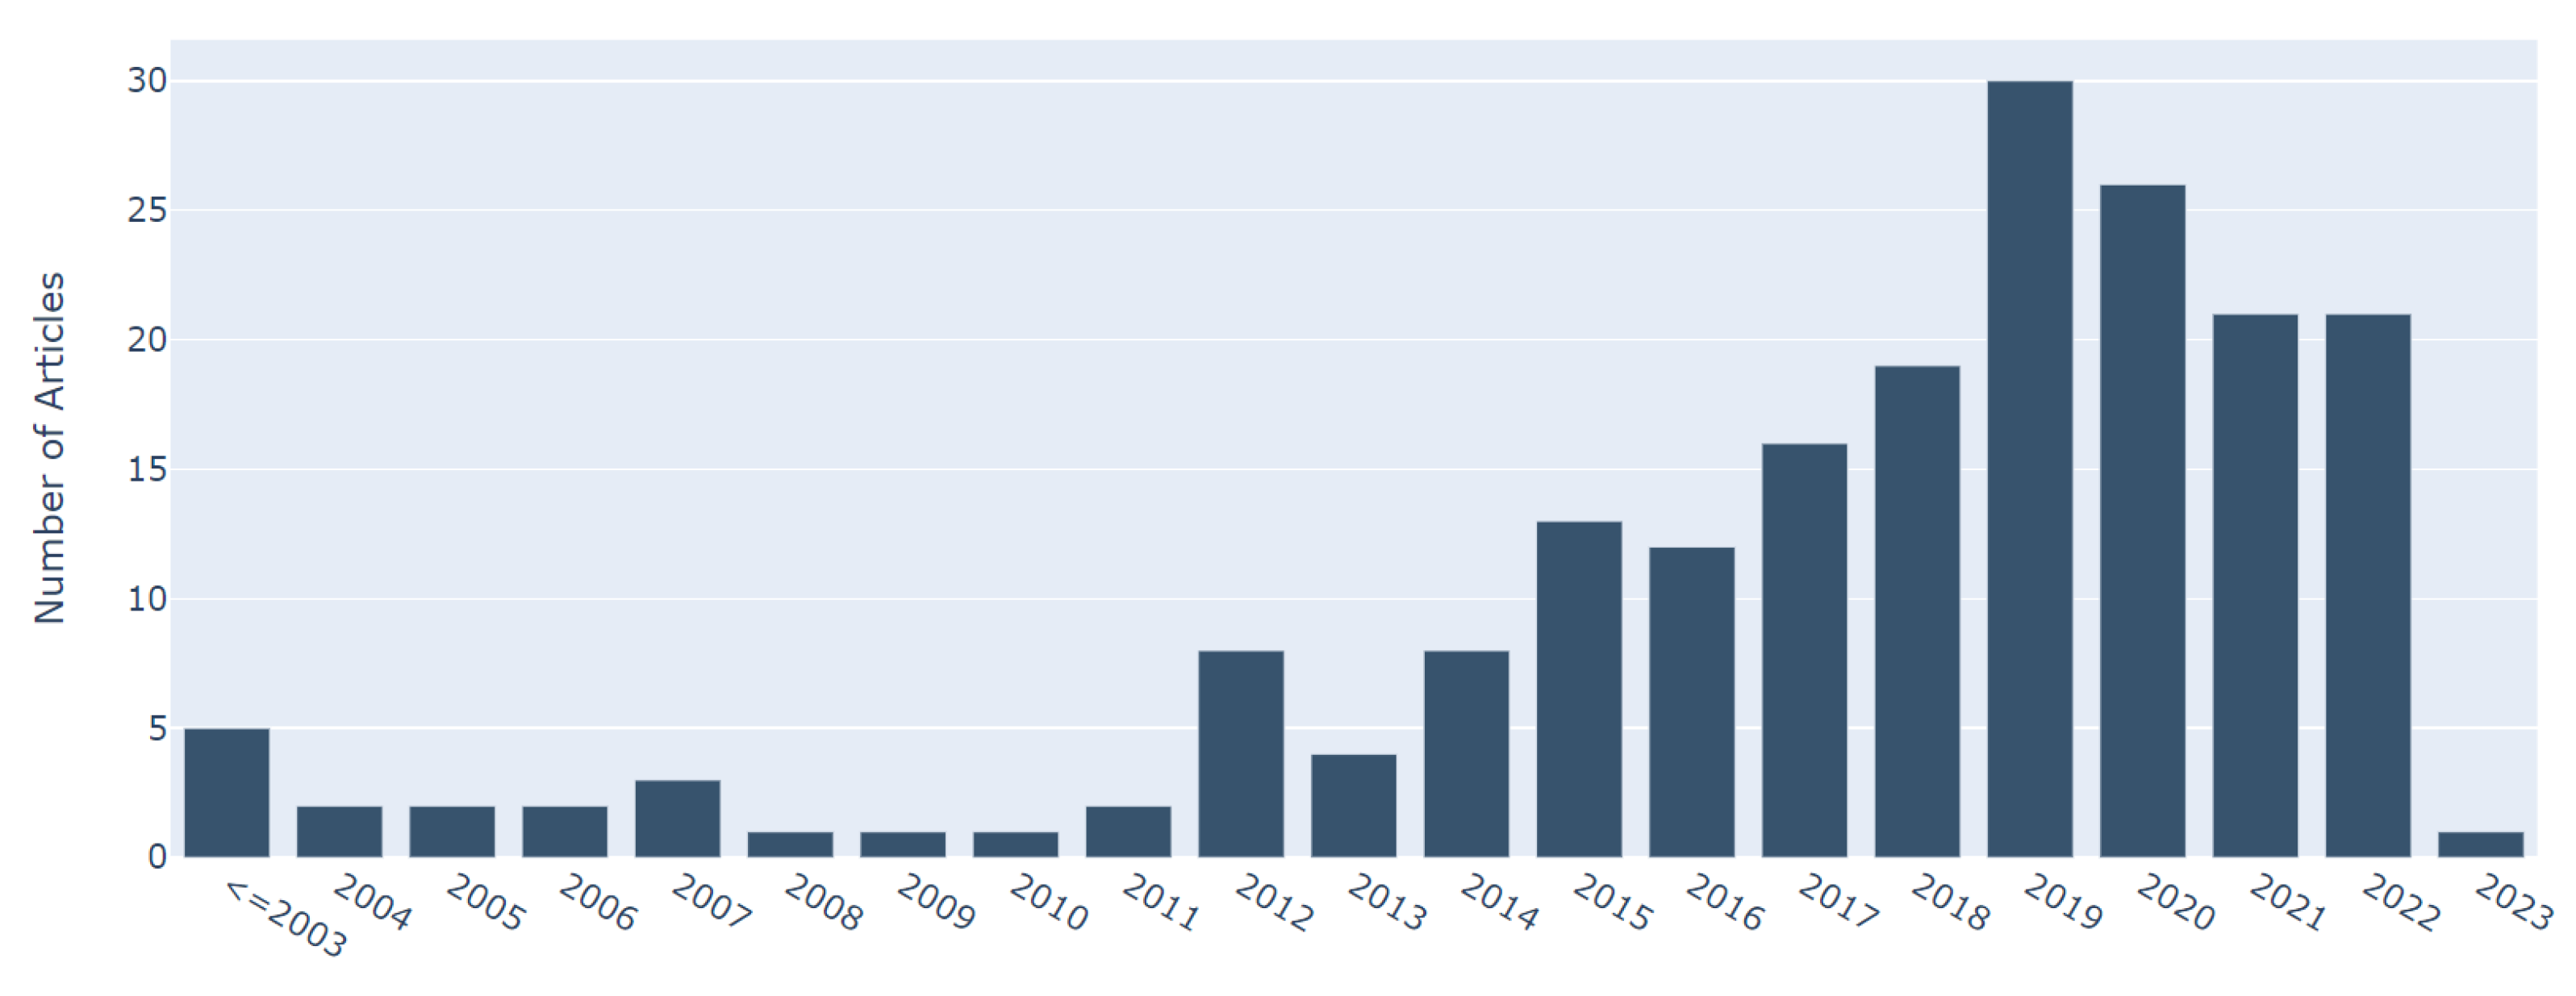
- Articles dated between 1980 and 2022.
- Articles related to at least one aspect of our research questions.
- Reference list from relevant studies and review articles.
- Informal literature surveys (no defined research questions, no search process, no defined data extraction or data analysis process).
- Articles that are not published (except for preprints and arXiv).
- Non-English articles.
- Studies not related to at least one aspect of our research questions.
- Frequency of citations.
- Are the study’s research challenges/contributions/experiments clearly explained?
- Is there a clear statement of the objectives of the research?
- Are the experiments realized to evaluate the ideas presented in the study?
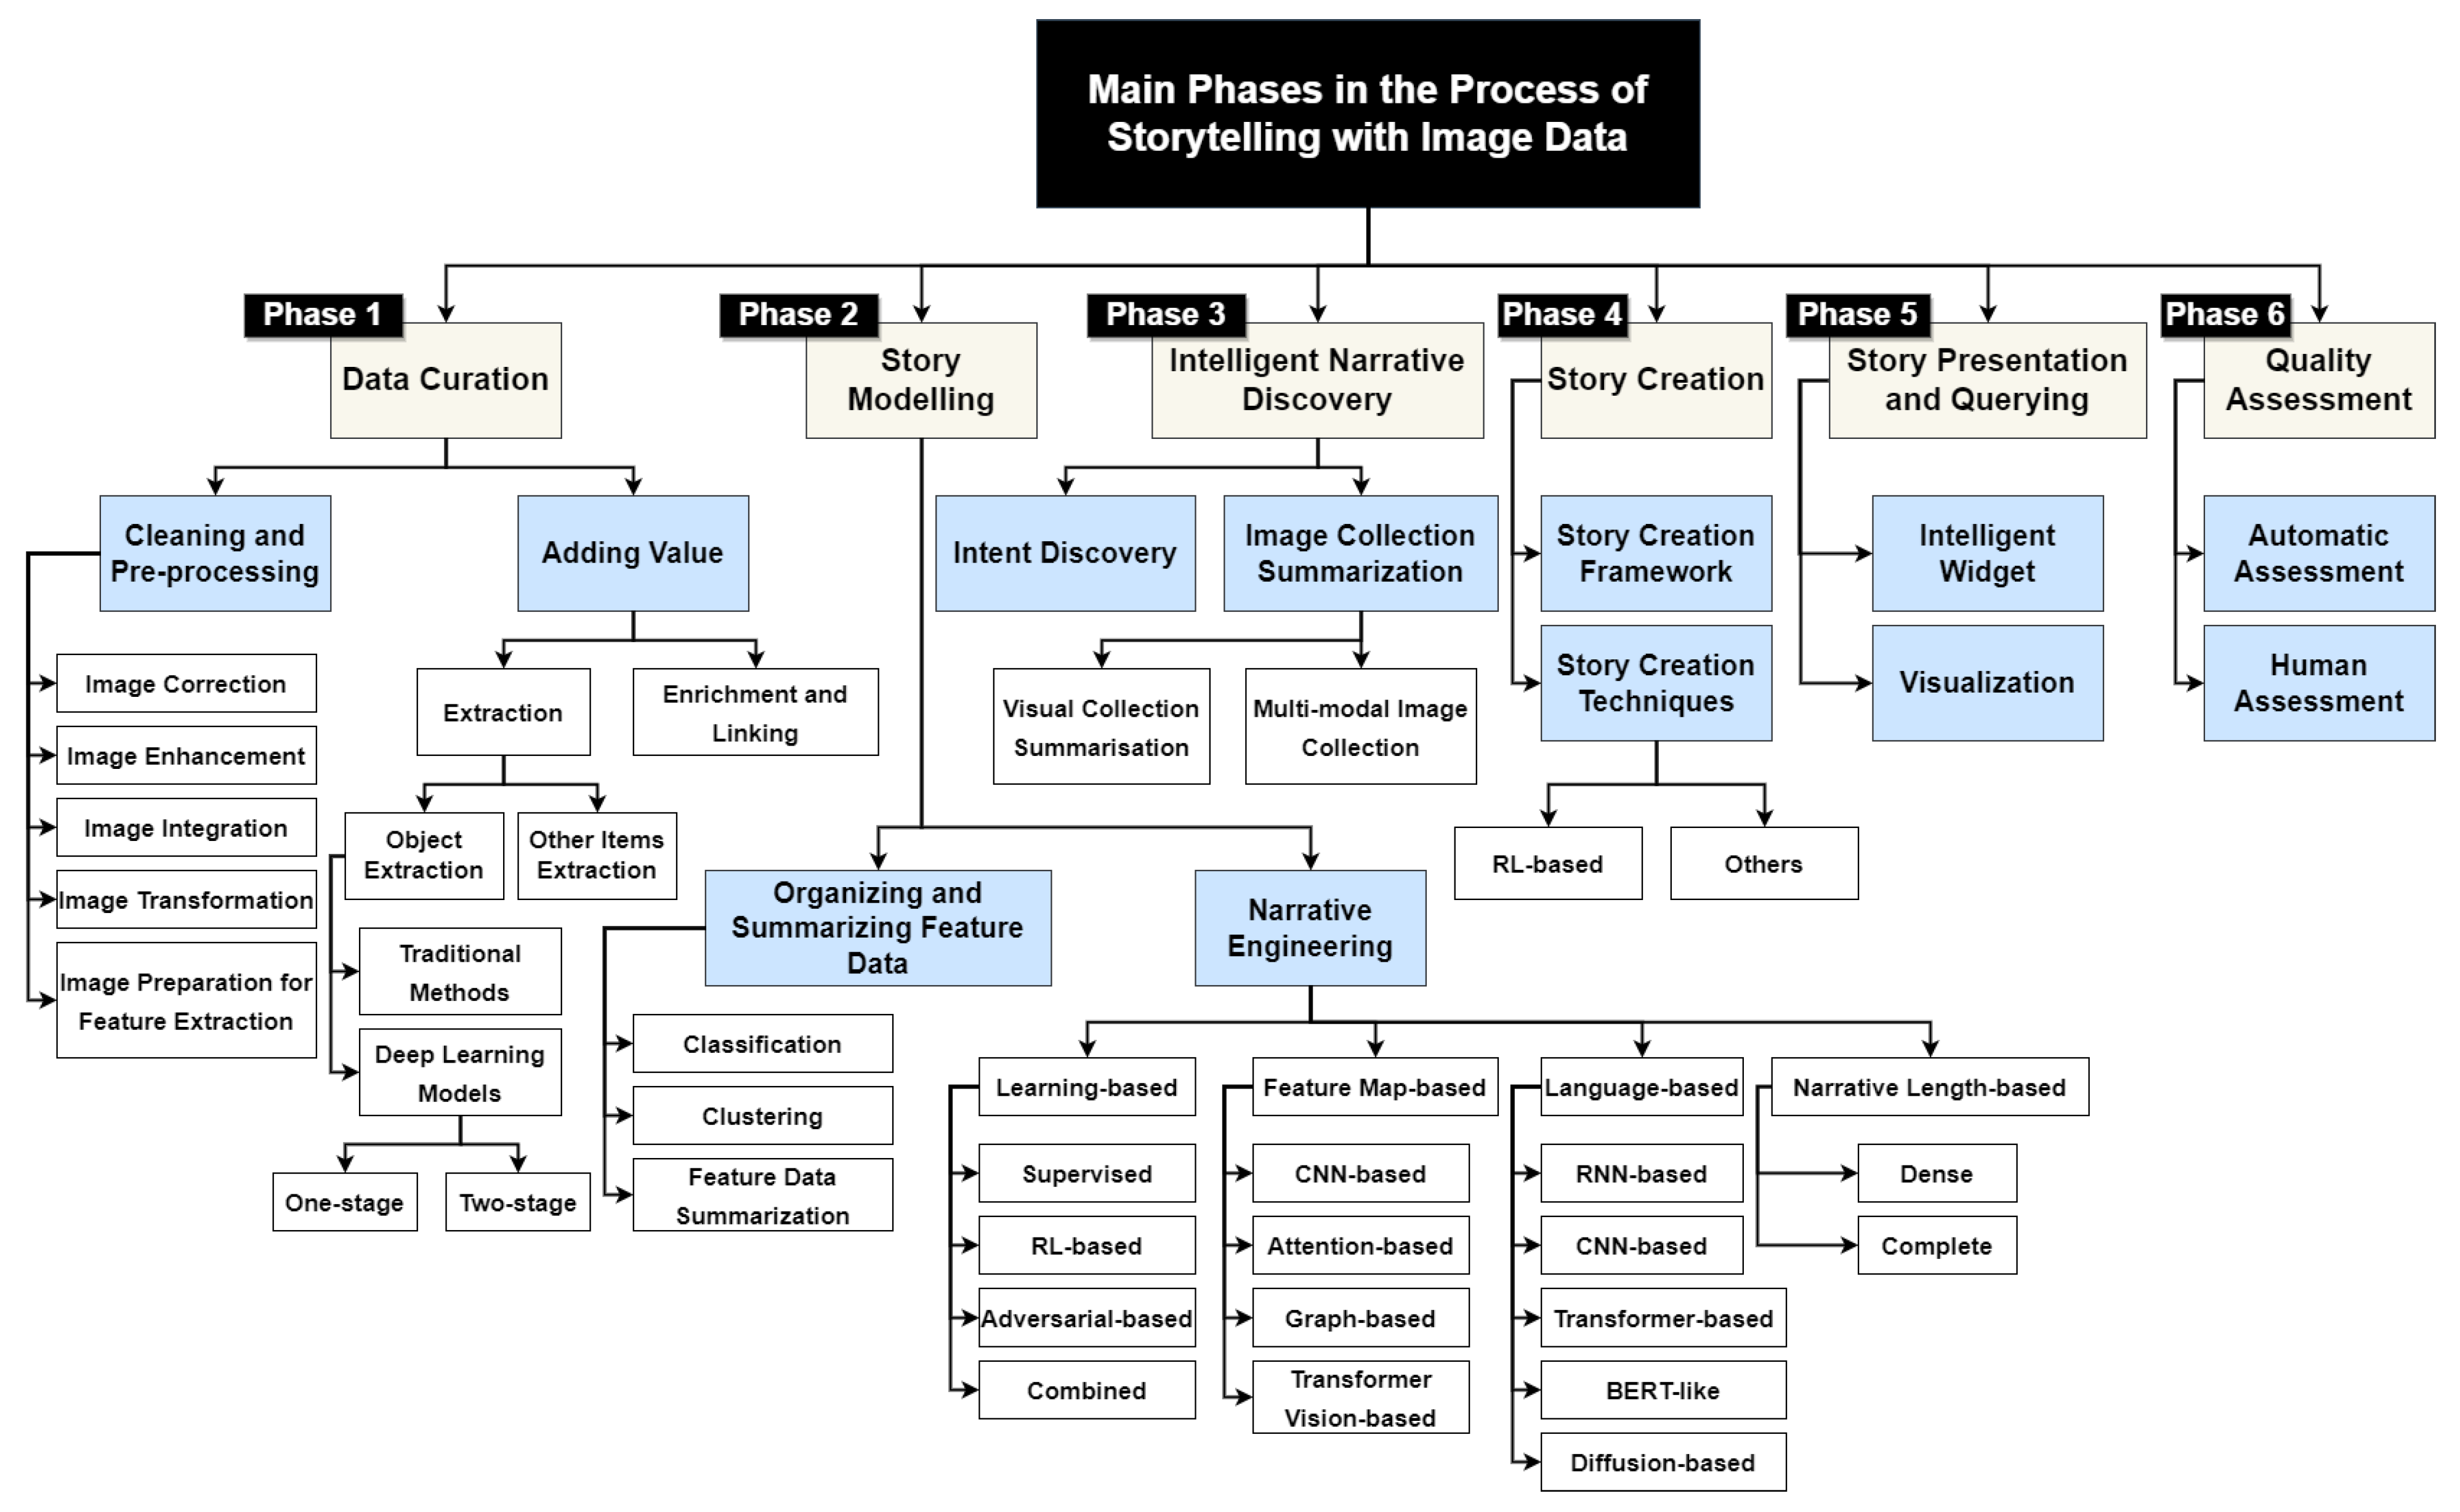
3. Task 1. Building the Foundation for Organizing and Curating the Raw Image Data
3.1. Curation: Image Preparation Using Cleaning and Preprocessing
3.1.1. Image Correction
- Image Denoising [13,14]. Noise might be created randomly or through the operation of a device. The presence of noise distorts the photos and may confuse the identification process. Thus, image denoising is a critical preprocessing approach for the subsequent phases of image processing. Traditionally used single-image denoising methods frequently represent the image’s attributes and the noise they are intended to remove analytically. In contrast, contemporary denoising techniques frequently use neural networks to develop a mapping between noisy and noise-free pictures. While DL models are able to reflect complex features of pictures and noise, they need considerable paired samples to train such systems. Therefore, the majority of denoising approaches that are based on learning make use of synthetic training datasets.
- Color Corrections [15]. Given that digital photographs are inherently color images, such examination should make proper use of the color or spectral data contained in the acquired data. However, prior to performing color picture analysis, considerable preprocessing is often required to both enhance and facilitate effective analysis. Color calibration is used to guarantee that correct color information is collected. In contrast, color enhancing ensures the efficient results of image analysis techniques that are otherwise highly susceptible to imaging circumstances and scanner fluctuations. The approaches used vary from calibrating cameras and scanners to adjusting the presented colors for converting the picture to another color representation, which can help with following activities such as segmentation. The color technique would be utilized to effectively distinguish the achievements of stains that are all in the same region. This allows the assessment of strain-specific pictures, whereas color normalization methods can be used to decrease different shades in histopathology images caused by things such as scanner features, chemical color levels, or different procedures.
- Lighting Corrections [16,17]. Deep shadows cast by lighting can hide particular textural characteristics; inconsistent lighting across the picture might distort findings. Rank filtering, histogram equalization, and remapping are all possible corrective approaches. Background can be caused by uneven illumination, which occurs when the light source is on one side of the picture, and the overall brightness decreases from one side to another. However, there are other different methods to establish a background, and frequently, the background is so faint or normal that we have difficulty noticing it at all. To address background issues, it is good to obtain a separate image of the background. This method compensates for lighting issues and additional background abnormalities.
3.1.2. Image Enhancement
- Enhancements to Illumination [18,19]. Lighting and contrast enhancement difficulties are inextricably linked when it comes to low-light picture enhancement. Several works have attempted to build frameworks for how lighting and noise in low-light images are viewed jointly, resulting in noise control and low-light improvement findings. Convolutional neural networks (CNNs) can simulate the usage patterns of illuminance and picture noise accordingly and utilize them as restrictions to aid the joint learning process. High-quality pictures require high-quality thin slices, should be clean, free of imperfections, and consistent in thickness from center to edge to minimize artificial intervention contrast—the narrower the segment, the smaller the path variance and the lesser the intervention color.
- Pyramids of Scale-Space. Kim [20] developed defining the diffusion pyramid to investigate lighting qualities over a range of scales precisely. They reasoned that by aggregating the nonlinear rate of diffusion from wide to fine scales via max pooling, the dazzling characteristic of lighting, even in the dark environment, would be well shown from both domestic and global perspectives. Additionally, Pang et al. [21] suggested a scale-aware deep CNN for deraining that has a multiscale features extraction branch that is coupled to a scale-space invariant focus branch.
- Enhancements to the Blur. Motion blur is a typical occurrence due to the exposure time taken by camera sensors, throughout which scenes are collected at distinct time stamps and averaged (blurred) into a signal [137]. So, a slow shutter speed and change in momentum of the camera or subject might create motion blur. It can also occur as a result of a UAV (unmanned aerial vehicle) platform’s extreme vibrations, which might impair fracture identification [22]. The noise of blurring produced by complementary beam removal imaging could be reduced with a compressed blind deconvolution and denoising technique [23].
3.1.3. Image Integration
3.1.4. Image Transformation
3.1.5. Other Preprocessing Methods for Feature Extraction
3.2. Curation: Adding Value
3.2.1. Extraction
- Traditional Methods. Traditional object detection methods use handcrafted features and feed them to a classifier or use the correlation between them in different images to detect different objects [39]. A suitable feature extraction technique could be extracting the geometric features from the images using General Hough Transform [40]. This feature extractor detects geometric shapes such as lines, circles, and curves on a grayscale image. Corners and edges are other features used for detecting objects. Harris Corner and Edge detector [41] is one of the feature extractors that could be used in this regard. This method could detect different objects and shapes in the image by extracting the corners and edges of two images and calculating their correlation [39].The problem with these features is that they are all sensitive to rescaling and rotation. To be able to detect the objects without the rotation and scaling concerns, intersect point and local features detectors such as Scale-Invariant Feature Transform (SIFT) [42] and Speeded Up Robust Features (SURF) [43] could be used. These feature descriptors are rotation- and scale-invariant by considering the features as objects. The Histogram of Oriented Gradients (HOG) [44] is another feature descriptor of the same type; however, it is not rotation-invariant and is only robust to scaling [38,39].
- Deep Learning Models. Generally, deep learning object detection approaches are divided into two categories: (i) two-stage: in this approach, first, the regions are extracted, and each region is then fed to a model to detect the object inside that region; (ii) single-stage: in this approach, an end-to-end model will detect both the regions and the class of different objects [38,45]. The following reviews some of the most popular methods in the above categories.
- –
- Two-Stage. A two-stage model finds the object regions first, and then for the next step, each region is treated as a single image and is fed to a model to classify the object in it. Table 3 shows a summary of some of the well-known two-stage object detection models.R-CNN [48]: In this method, 2000 regions of interest will be first selected based on the selective search technique [138] at first. Then, each of these regions is fed to a CNN architecture, resulting in a 4096-dimensional feature vector for each region. In the final step, the feature vector is fed to a pretrained SVM to classify the objects inside that region.SSP-Net [46]: The problem with the R-CNN approach is that it might miss some of the objects that are divided into multiple regions and partially exist in each region. To solve this problem, SPP-Net was proposed using the idea of spatial pyramid matching (SPM) [139]. In this method, in the fifth convolution layer, three kernels with sizes of one, two, and four are applied in each region to consider different objects with different sizes.Fast R-CNN [47]: Like R-CNN, SPP-Net has multiple stages of extracting the feature vector, feeding to SVM for classification, and refining bounding box regions. Fast R-CNN solved this issue by altering the architecture of the CNN in SPP-Net so that the feature vector layer is then connected to two sibling output layers. One is a softmax layer for classifying objects, and one is regarding refining the position of the object’s bounding box.Faster R-CNN [49]: The problem with the proposed approaches is selecting the suitable regions in a costly way. In Faster R-CNN, a Region Proposal Network (RPN) is proposed that could propose accurate bounding boxes for the objects in an image cost-effectively. Adding RPN to the CNN architecture leads to a more efficient and faster solution.ORE [60]: The Open-World Object Detector (ORE) is a new method for detecting objects in the open world using contrastive clustering and energy-based identification.
- –
- Single-Stage. Single-stage models are end-to-end frameworks that perform the region selection and object detection with the same model; hence, the computation cost is drastically reduced in these models. Here, we review some of the popular models in this category.YOLO v1. [50]: In this method, the image is divided into SxS grids, and for each cell of the grid, the bounding boxes plus their confidence scores and the object that is centered on that cell plus its confidence score are calculated. Finally, the prediction of an object will be a function of the two confidence scores of the bounding box and object.SSD [51]: The problem with YOLO is that sometimes it might not detect small objects very well due to its fixed-size grids. SSD solves this issue by proposing a more accurate and faster solution using a set of anchor boxes with different scales to make a discrete output space.RetinaNet [52]: RetinaNet uses a new loss function (also known as Focal Loss) which forces the model to focus on misclassified samples in the training stage. By doing so, the model could reach a comparable accuracy to the two-stage models.NAS-FPN [56]: By utilizing a feature pyramid network, this method intends to learn a more reasonable object detection architecture without designing it manually. This architecture aggregates features at multiple scales.EfficientDet [58]: This method examines the design options for neural network models for object detection and suggests critical optimizations to enhance efficiency. These optimizations are used to design a novel family of detectors called EfficientDet. Feature networks and class prediction networks need to be scaled up to optimize accuracy and efficiency, as the authors claim.
3.2.2. Enrichment and Linking
4. Task 2. Story Modeling
4.1. Organizing and Summarizing Feature Data
4.1.1. Classification
- Decision Tree. Decision trees are one of the classification methods that classify the data based on several conditions, each including one or more features of the data. It is a tree model, in that each node contains a condition that divides the training data into two or more parts, and the number of leaf nodes will determine the number of classes.
- Probabilistic Methods. A model created using probabilistic classifiers estimates the probability of the relation between the feature and its class. Naive Bayes and Logistic Regression are two popular probabilistic classifiers.
- Support Vector Machines. Support Vector Machines classify the data into two classes and are suitable for binary classification tasks. In the feature space for the data, this method tries to fit a hyperplane that separates the two data classes, so that the hyperplane has the maximum margin with the data of both categories.
- Neural Networks. Neural networks are also one type of classifier. Different architectures of neural networks with different output and input layers could be used based on the type of data and the number of classes to nonlinearly classify the data into different categories.
4.1.2. Clustering
- Representative-Based Methods. These methods are the most straightforward clustering techniques, since they use the similarity or distance of the data points in the feature space. In these methods, candidates are chosen among either the data points or a function of the data points, such as mean or median, to be the center of the clusters. The most popular techniques in this category are K-Means, K-Median, and K-Medoids.
- Hierarchical Clustering Methods. Hierarchical clustering methods cluster the data on different levels. In the hierarchical clustering approach, a tree-shaped clustering is produced so that each tree level demonstrates one option for clustering with a specific number of clusters. e.g., the first node of the tree represents all data points in one cluster, and the leaf nodes represent clustering with C clusters, in which C is the number of data points. This approach is advantageous when we need different insights from the clustering and we could obtain those insights by looking at each tree level. Bottom-Up (Agglomerative) and Top-Down (Divisive) are two types of hierarchical clustering approaches.
- Probabilistic Methods. In the probabilistic approaches, for each data point, C likelihoods will be calculated, in which C is equal to or less than the number of the clusters. In these approaches, each data point could belong to multiple clusters but with different probabilities. This method is called soft clustering.
- Density-Based Methods. The problem with distance-based and probabilistic clustering is that the shapes of the clusters are always defined based on the model we are using, e.g., the K-means technique’s cluster shape is always spherical. However, sometimes the clusters of our data points have multiple odd shapes, and the clusters are too close to each other. In this scenario, none of the above functions can correctly cluster them. Density-based clustering solves this problem by identifying fine-grained dense regions.
4.1.3. Feature Data Summarization
4.2. Narrative Engineering
- Supervised Learning Methods. Multimodal Recurrent Neural Network (m-RNN) architecture has been proposed in [69] to handle these two tasks: (1) image-to-sentence description generation and (2) image and sentence retrieval. Additionally, this architecture is trained by utilizing a log-likelihood cost function. The model parameters are learned by differentiating from the cost function given the input and the backpropagation algorithm. Karlpathy et al. [70] introduce a multimodal RNN architecture that learns to generate narratives for image regions based on inferred alignments (multimodal embeddings of convolutions over images and bi-RNNs over sentences). They map every image and sentence into a shared space of h-dimensional vectors. The supervision is carried out at the entire image and sentence level, so they formulate an image–sentence score based on the individual region scores. Vinyals et al. [71] present an end-to-end solution to the caption generation problem, which is fully trainable by employing stochastic gradient descent, and the loss is the sum of each step’s negative log-likelihood of the correct word.
- Reinforcement Learning (RL). SCST [72] is a reinforcement learning (RL) optimization technique that normalizes rewards by exploiting the output of its test-time inference algorithm. This approach baselines the REINFORCE approach more efficaciously, leading to better results with nondifferentiable evaluation metrics. Ren et al. [73] take a collaborative approach and propose a decision-making framework. They use a policy and value network to predict the word for each step of narrative generation. Specifically, an actor–critic RL algorithm is introduced to learn these two networks. Gordon et al. [74] introduce the Interactive Question Answering (IQA) task (answering questions that demand the agent’s interaction with a dynamic environment) and propose the Hierarchical Interactive Memory Network (HIMN). HIMN is factorized into a Planner, a set of controllers, and a semantic spatial memory. The Planner, formulated as an RL problem, invokes the controllers to explore the environment and answer the question in the IQA task.
- Generative Adversarial Networks (GANs). Patro et al. [75] present a Correlated Collaborative Model (CCM) that guarantees the coherence of the generated textual explanations and answers. CCM collaborates with the answer and explanation features and employs generative adversarial strategies for training. In addition, the results are robust to noise in images and text (even if the model is not trained for noise-based attacks).
- Combined Methods (RL + GAN). To generate more human-like answers to questions, Wu et al. [76] combine RL with GANs and introduce a novel framework. This framework updates the generator by employing the reward of the generator policy at each training step. After sampling data from the dialog history (a sequence of textual data), maximum likelihood estimation (MLE) is used to update the generator. Chen et al. [77] introduce a conditional generative adversarial captioning technique to extend RL-based architectures. Furthermore, CNN- and RNN-based architectures are presented for the discriminator module. The discriminator judges whether a human described the resulting caption or if it is machine-generated.
- CNN-Based Methods. Vinyals et al. [71] employ a vision CNN model to extract image features, since CNNs can embed images in fixed-length vectors. They utilize the result feature vector of GoogleNet [141] for the visual feature extraction step. Moreover, Karpathy et al. [70] used the visual features extracted from AlexNet [142]. Many studies employ the CNN modules to extract features such as [72,143,144].
- Attention-Based Methods. Simple CNN-based methods have the main advantage of being compact and straightforward. At the same time, the extreme compactness and lack of granularity are crucial issues that need to be addressed. An attention module handles this issue by computing attention weights and attending to specific parts of the visual features. Many approaches fit into attention-based methods that can be divided into three main categories: grid-based, region-based, and self-attention. In the following items, these three categories are further discussed.
- –
- Grid-Based Attention Methods. A significant proportion of image captioning methods use the attention mechanism to make captioning more flexible and provide better granularity. Xu et al. [78] introduced an attention-based image captioning model inspired by a recent study in machine translation [79] and object detection [80,81]. The authors proposed two attention-based image caption generators: a “soft” deterministic attention mechanism and a “hard” stochastic attention mechanism. An adaptive encoder–decoder model [82] also automatically determines when to rely on the language model and when to look at the image (the spatial CNN features at each of the k grid locations of the image).
- –
- Region-Based Attention Methods. Anderson et al. [83] employ a novel bottom-up and top-down attention module (based on Faster R-CNN [49] and task-specific context). First, the bottom-up visual attention module extracts salient regions of an image and represents them using convolutional feature vectors. Then, the top-down module estimates the distribution of attention over image regions (specifies weights of the features). As a result, a weighted average of all image features is the final attended feature vector. The Look-Back and Predict-Forward (LBPF) approach [84] presents two main modules: Look-Back (LB) module and Predict-Forward (PF) module. As the input of the attention module, the LB module concatenates the previous attention vector and the current hidden state. In contrast, the PF module sequentially predicts the two following hidden states based on the current hidden state. For constructing high-quality image captions, the Reflective Decoding Network (RDN) [85] improves the capability of the standard caption generator to handle long sequential modeling by examining the caption’s word consistency. Li et al. [145] also addresses both the tasks of VQA and VQG using the attention mechanism after extracting the visual features from the input image.
- –
- Self-Attention Methods. Despite the widespread use of attention mechanisms in image captioning, we still do not know how closely related attended vectors and given attention queries are. Therefore, Huang et al. [86] proposed the “Attention on Attention” (AoA) module, which specifies the attention results and queries relevancy. Applying AoA to both the encoder and decoder in this research, the authors introduced AoANet for image captioning. Guo et al. [87] first proposed a normalized self-attention (NSA), which indicated that conducting this normalization on the hidden activations inside self-attention is advantageous. Then, a geometric-aware self-attention (GSA) module was proposed to compute the objects’ geometric bias to assist with image comprehension. Furthermore, the self-attention module in the encoder facilitated the EnTangled Attention (ETA) model [88] to examine the detected entities’ relationships.
- Graph-Based Methods. This image encoder incorporates two kinds of visual relationships (semantic and spatial object relationships) in the proposed GCN-LSTM framework [89], which attempts to explore the relations between objects. Based on these visual relationships, they developed graphs over the detected objects in an image and used GCNs proposed in [146]. The Scene Graph Auto-Encoder (SGAE) [90] embeds inductive bias into a dictionary unsupervised. Subsequently, it is shared as a re-encoder for text generation, enhancing the encoder–decoder performance. For captioning, Yao et al. [91] utilize the hierarchical structure in images at the instance, region, and whole image level. This hierarchical structure is analyzed with a tree-structured LSTM model, and each instance-, region-, and image-level feature is improved. Image encoding is also based on a hierarchical scene parsing architecture.
- RNN-Based Methods. RNNs are a class of artificial neural networks that are derived from feedforward neural networks. RNNs can process variable-length sequences of inputs using their internal state (memory) and are used to handle text data generation due to the sequential structure of the language. Recurrent methods can be divided into three primary types: single-layer, stacked-layer, and attention-based approaches.
- –
- Single-Layer Approaches. Vinyals et al. [71,151] propose a simple single-layer LSTM-based [152] captioning system. Specifically, a convolutional neural Network is employed as an image encoder, followed by LSTM Recurrent Neural Networks as decoders to generate the output sequence. The authors conceptualize image captioning in a way that predicts the probability of a given sentence based on the input image.
- –
- Stacked-Layers Approaches. LRCN model [153] processes the visual input with CNN modules, whose outputs are fed into a stack of recurrent sequence models (two-layer LSTMs) to generate a variable-length sentence description for an input image. Donahue et al. input the image and context word features to the recurrent model at each step instead of feeding visual features to the system solely at the initial phase.
- –
- Attention-Based Approaches. This work [83] introduces top-down and bottom-up attention to salient objects and other image regions. According to this work, based on Faster R-CNN [49], the bottom-up mechanism proposes image regions with a feature vector associated with them (each represented by a pooled convolutional feature vector). In contrast, the top-down mechanism uses task-specific context to predict an attention distribution over the image regions and determine feature weights.
- CNN-Based Methods. LSTM modules overlook a sentence’s underlying hierarchy. Moreover, a memory cell’s long-term dependencies also demand notable storage, which leads to the introduction of CNNs as language models. Unlike LSTMs, CNNs are faster and can learn the internal structure of sentences. The language CNN model introduced in [154] is able to capture long-range dependencies in sequences. It examines the hierarchical and temporal data sequentially for image captioning. An image captioning method using convolutional LSTM units is proposed in [92] to resolve this issue that arises from LSTM units’ complexity and sequential nature. It uses convolutional machine translation models combined with an attention mechanism to utilize spatial image features. The authors of this work provide valuable insights, such as CNNs produce more entropy, do not suffer from vanishing gradients, and are more accurate. The CNN + CNN framework [93], another fast and competitive model with LSTM-based language models, investigated how the kernel width and layer depth of the language CNN impact image captioning. In a meaningful way, according to the authors, the model can visualize learned attention maps and discover the concepts by paying attention to the related areas in images.
- Transformer-Based Methods. The majority of conventional captioning systems use an encoder–decoder framework. First, an input image is encoded into a representation of information within the image and then decoded into an image description. However, these practical and state-of-the-art methods overlook the spatial relationships among the detected objects. The Object Relation Transformer [94] integrates object spatial relationship modeling into image captioning. The Dual-Level Collaborative Transformer (DLCT) [95] leverages region and grid features to enhance image captioning. Moreover, the locality-constrained cross-attention (LCCA) module designed in this work addresses the problem of semantic noise produced when two sources of features are directly fused. To guide the alignment of two sources of features, LCCA constructs a geometric alignment graph.
- BERT-Like Paradigm Methods. Instead of constructing the narrative of an image using the encoder–decoder framework, some approaches have attempted to tackle this task by following the structure of BERT [155]. This category of methods, such as the Vision-Language Pretraining (VLP) model [96], which can be fine-tuned for image-to-text generation and understanding tasks, directly connect the visual and textual inputs.
- Diffusion-Based Methods. In image captioning, the text tokens are decoded one at a time using an auto-regressive method. Non-autoregressive methods, such as diffusion-based captioning models [156,157,158], emit all words simultaneously, enabling bidirectional textual message exchange, in contrast to autoregressive methods that generate sentences word-by-word.
- Complete Narrative Construction. All the image captioning and narrative construction techniques that generate single or multiple captions for the whole scene and the occurrences in the image fall into this category. The studies and research in this category are discussed in previous sections.
- Dense Narrative Construction. Dense narrative construction, or dense captioning, introduced by Johnson et al. [97], simultaneously recognizes and describes salient image regions through short text sentences. As a result, it can be viewed as the generalization of the object detection task, where a caption substitutes a tag, or image captioning, where a single region substitutes the entire image. Another proposed approach for dense captioning [98] is based on two ideas: joint inference and context feature fusion. The localization bounding box gradually adapts to the correct position based on the predicted descriptions through a step-by-step joint inference method. Meanwhile, the fusion of context features from regions of interest can better predict image narratives. The notion of relational captioning is introduced in [99], a novel captioning approach to generate captions and narratives concerning relational information among objects in a given image. Furthermore, the multitask triple-stream network (MTTSNet) has been proposed to train the relational information effectively.
5. Task 3: Intelligent Narrative Discovery
5.1. Intent Discovery
5.2. Image Collection Summarization
5.3. Narrative Extension
6. Task 4: Story Creation
6.1. Story Creation Framework
6.2. Story Creation Techniques
6.2.1. RL-Based Methods
6.2.2. Other Methods
7. Task 5: Story Presentation and Querying
7.1. Intelligent Widget for Narrative Discovery
7.2. Visualization Techniques
8. Task 6: Quality Assessment and Dataset
8.1. Automatic Assessment
8.2. Human Assessment
8.3. Dataset
9. Conclusions, Discussion, and Future Directions
9.1. Discussion
9.2. Future Directions
Author Contributions
Funding
Data Availability Statement
Acknowledgments
Conflicts of Interest
References
- Beheshti, A.; Ghodratnama, S.; Elahi, M.; Farhood, H. Social Data Analytics; CRC Press: Boca Raton, FL, USA, 2022. [Google Scholar]
- Lindeberg, T. Scale Invariant Feature Transform; KTH: Stockholm, Sweden, 2012. [Google Scholar]
- Bay, H.; Ess, A.; Tuytelaars, T.; Van Gool, L. Speeded-up robust features (SURF). Comput. Vis. Image Underst. 2008, 110, 346–359. [Google Scholar] [CrossRef]
- Calonder, M.; Lepetit, V.; Strecha, C.; Fua, P. Brief: Binary robust independent elementary features. In Proceedings of the European Conference on Computer Vision, Heraklion, Greece, 5–11 September 2010; Springer: Berlin/Heidelberg, Germany, 2010; pp. 778–792. [Google Scholar]
- Li, Q.; Li, J.; Sheng, J.; Cui, S.; Wu, J.; Hei, Y.; Peng, H.; Guo, S.; Wang, L.; Beheshti, A.; et al. A Survey on Deep Learning Event Extraction: Approaches and Applications. IEEE Trans. Neural Netw. Learn. Syst. 2022; Early Access. [Google Scholar] [CrossRef]
- Beheshti, A.; Tabebordbar, A.; Benatallah, B. istory: Intelligent storytelling with social data. In Proceedings of the Companion Proceedings of the Web Conference 2020, Taipei, Taiwan, 20–24 April 2020; pp. 253–256. [Google Scholar]
- Thöny, M.; Schnürer, R.; Sieber, R.; Hurni, L.; Pajarola, R. Storytelling in interactive 3D geographic visualization systems. ISPRS Int. J. Geo-Inf. 2018, 7, 123. [Google Scholar] [CrossRef]
- Beheshti, A. Knowledge base 4.0: Using crowdsourcing services for mimicking the knowledge of domain experts. In Proceedings of the 2022 IEEE International Conference on Web Services (ICWS), Barcelona, Spain, 11–15 July 2022; IEEE: Piscataway, NJ, USA, 2022; pp. 425–427. [Google Scholar]
- Beheshti, A.; Benatallah, B.; Sheng, Q.Z.; Schiliro, F. Intelligent knowledge lakes: The age of artificial intelligence and big data. In Proceedings of the International Conference on Web Information Systems Engineering, Amsterdam, The Netherlands, 20–24 October 2020; Springer: Berlin/Heidelberg, Germany, 2020; pp. 24–34. [Google Scholar]
- Zhang, D.; Cui, M.; Yang, Y.; Yang, P.; Xie, C.; Liu, D.; Yu, B.; Chen, Z. Knowledge Graph-based image classification refinement. IEEE Access 2019, 7, 57678–57690. [Google Scholar] [CrossRef]
- Gong, W.; Zhang, X.; Chen, Y.; He, Q.; Beheshti, A.; Xu, X.; Yan, C.; Qi, L. DAWAR: Diversity-aware web APIs recommendation for mashup creation based on correlation graph. In Proceedings of the 45th International ACM SIGIR Conference on Research and Development in Information Retrieval, Madrid, Spain, 11–15 July 2022; pp. 395–404. [Google Scholar]
- Keele, Staffs. Guidelines for Performing Systematic Literature Reviews in Software Engineering; EBSE Technical Report; ver. 2.3 ebse Technical Report; Keele University: Keele, UK, 2007. [Google Scholar]
- Sagheer, S.V.M.; George, S.N. A review on medical image denoising algorithms. Biomed. Signal Process. Control 2020, 61, 102036. [Google Scholar] [CrossRef]
- Brooks, T.; Mildenhall, B.; Xue, T.; Chen, J.; Sharlet, D.; Barron, J.T. Unprocessing images for learned raw denoising. In Proceedings of the IEEE/CVF Conference on Computer Vision and Pattern Recognition, Long Beach, CA, USA, 16–17 June 2019; pp. 11036–11045. [Google Scholar]
- Saafin, W.; Schaefer, G. Pre-processing techniques for colour digital pathology image analysis. In Proceedings of the Annual Conference on Medical Image Understanding and Analysis, Edinburgh, UK, 11–13 July 2017; Springer: Berlin/Heidelberg, Germany, 2017; pp. 551–560. [Google Scholar]
- Krig, S. Image pre-processing. In Computer Vision Metrics; Springer: Berlin/Heidelberg, Germany, 2016; pp. 35–74. [Google Scholar]
- Heilbronner, R.; Barrett, S. Pre-processing. In Image Analysis in Earth Sciences; Springer: Berlin/Heidelberg, Germany, 2014; pp. 59–73. [Google Scholar]
- Wang, Y.; Cao, Y.; Zha, Z.J.; Zhang, J.; Xiong, Z.; Zhang, W.; Wu, F. Progressive retinex: Mutually reinforced illumination-noise perception network for low-light image enhancement. In Proceedings of the 27th ACM International Conference on Multimedia, Nice, France, 21–25 October 2019; pp. 2015–2023. [Google Scholar]
- Heilbronner, R.; Barrett, S. Image Analysis in Earth Sciences: Microstructures and Textures of Earth Materials; Springer Science & Business Media: Berlin, Germany, 2013; Volume 129. [Google Scholar]
- Kim, W. Low-light image enhancement by diffusion pyramid with residuals. J. Vis. Commun. Image Represent. 2021, 81, 103364. [Google Scholar] [CrossRef]
- Pang, B.; Zhai, D.; Jiang, J.; Liu, X. Single image deraining via scale-space invariant attention neural network. In Proceedings of the 28th ACM International Conference on Multimedia, Virtual/Seattle, WA, USA, 12–16 October 2020; pp. 375–383. [Google Scholar]
- Liu, Y.; Yeoh, J.K.; Chua, D.K. Deep learning–based enhancement of motion blurred UAV concrete crack images. J. Comput. Civ. Eng. 2020, 34, 04020028. [Google Scholar] [CrossRef]
- Bai, C.; Liu, C.; Yu, X.; Peng, T.; Min, J.; Yan, S.; Dan, D.; Yao, B. Imaging enhancement of light-sheet fluorescence microscopy via deep learning. IEEE Photonics Technol. Lett. 2019, 31, 1803–1806. [Google Scholar] [CrossRef]
- Dong, J.; Dickfeld, T. Image integration in electroanatomic mapping. Herzschrittmachertherapie Elektrophysiologie 2007, 18, 122–130. [Google Scholar] [CrossRef] [PubMed]
- Zach, C.; Pock, T.; Bischof, H. A globally optimal algorithm for robust tv-l 1 range image integration. In Proceedings of the 2007 IEEE 11th International Conference on Computer Vision, Rio De Janeiro, Brazil, 14–21 October 2007; IEEE: Piscataway, NJ, USA, 2007; pp. 1–8. [Google Scholar]
- Dogra, A.; Kadry, S.; Goyal, B.; Agrawal, S. An efficient image integration algorithm for night mode vision applications. Multimed. Tools Appl. 2020, 79, 10995–11012. [Google Scholar] [CrossRef]
- Bavirisetti, D.P.; Dhuli, R. Multi-focus image fusion using multi-scale image decomposition and saliency detection. Ain Shams Eng. J. 2018, 9, 1103–1117. [Google Scholar] [CrossRef]
- Wang, C.; Xu, C.; Wang, C.; Tao, D. Perceptual adversarial networks for image-to-image transformation. IEEE Trans. Image Process. 2018, 27, 4066–4079. [Google Scholar] [CrossRef]
- Sarid, O.; Huss, E. Image formation and image transformation. Arts Psychother. 2011, 38, 252–255. [Google Scholar] [CrossRef]
- Jia, K.; Wang, X.; Tang, X. Image transformation based on learning dictionaries across image spaces. IEEE Trans. Pattern Anal. Mach. Intell. 2012, 35, 367–380. [Google Scholar] [CrossRef] [PubMed]
- Vial, A.; Stirling, D.; Field, M.; Ros, M.; Ritz, C.; Carolan, M.; Holloway, L.; Miller, A.A. The role of deep learning and radiomic feature extraction in cancer-specific predictive modelling: A review. Transl. Cancer Res. 2018, 7, 803–816. [Google Scholar] [CrossRef]
- Tofighi, G.; Venetsanopoulos, A.N.; Raahemifar, K.; Beheshti, S.; Mohammadi, H. Hand posture recognition using K-NN and Support Vector Machine classifiers evaluated on our proposed HandReader dataset. In Proceedings of the 2013 18th International Conference on Digital Signal Processing (DSP), Fira, Greece, 1–3 July 2013; IEEE: Piscataway, NJ, USA, 2013; pp. 1–5. [Google Scholar]
- Zhao, S.; Ge, D.; Zhao, J.; Xiang, W. Fingerprint pre-processing and feature engineering to enhance agricultural products categorization. Future Gener. Comput. Syst. 2021, 125, 944–948. [Google Scholar] [CrossRef]
- Heaton, J. An empirical analysis of feature engineering for predictive modeling. In Proceedings of the SoutheastCon 2016, Norfolk, VA, USA, 30 March–3 April 2016; IEEE: Piscataway, NJ, USA, 2016; pp. 1–6. [Google Scholar]
- Wiggers, K.L.; Britto, A.S.; Heutte, L.; Koerich, A.L.; Oliveira, L.E.S. Document image retrieval using deep features. In Proceedings of the 2018 International Joint Conference on Neural Networks (IJCNN), Rio de Janeiro, Brazil, 8–13 July 2018; IEEE: Piscataway, NJ, USA, 2018; pp. 1–8. [Google Scholar]
- Farhood, H.; He, X.; Jia, W.; Blumenstein, M.; Li, H. Counting people based on linear, weighted, and local random forests. In Proceedings of the 2017 International Conference on Digital Image Computing: Techniques and Applications (DICTA), Sydney, Australia, 29 November–1 December 2017; IEEE: Piscataway, NJ, USA, 2017; pp. 1–7. [Google Scholar]
- Singh, A.; Sharma, D.K. Image collection summarization: Past, present and future. In Data Visualization and Knowledge Engineering; Springer: Berlin/Heidelberg, Germany, 2020; pp. 49–78. [Google Scholar]
- Zou, Z.; Chen, K.; Shi, Z.; Guo, Y.; Ye, J. Object detection in 20 years: A survey. Proc. IEEE 2023, 99, 1–20. [Google Scholar] [CrossRef]
- Zou, X. A Review of object detection techniques. In Proceedings of the 2019 International Conference on Smart Grid and Electrical Automation (ICSGEA), Xiangtan, China, 10–11 August 2019; IEEE: Piscataway, NJ, USA, 2019; pp. 251–254. [Google Scholar]
- Ballard, D.H. Generalizing the Hough transform to detect arbitrary shapes. Pattern Recognit. 1981, 13, 111–122. [Google Scholar] [CrossRef]
- Harris, C.; Stephens, M. A combined corner and edge detector. In Proceedings of the Alvey Vision Conference, Manchester, UK, 31 August–2 September 1988; Citeseer: Manchester, UK, 1988; Volume 15, pp. 1–6. [Google Scholar]
- Lowe, D.G. Distinctive image features from scale-invariant keypoints. Int. J. Comput. Vis. 2004, 60, 91–110. [Google Scholar] [CrossRef]
- Bay, H.; Tuytelaars, T.; Gool, L.V. Surf: Speeded up robust features. In Proceedings of the European Conference on Computer Vision, Graz, Austria, 7–13 May 2006; Springer: Berlin/Heidelberg, Germany, 2006; pp. 404–417. [Google Scholar]
- Dalal, N.; Triggs, B. Histograms of oriented gradients for human detection. In Proceedings of the 2005 IEEE Computer Society Conference on Computer Vision and Pattern Recognition (CVPR’05), San Diego, CA, USA, 20–25 June 2005; IEEE: Piscataway, NJ, USA, 2005; Volume 1, pp. 886–893. [Google Scholar]
- Zhao, Z.Q.; Zheng, P.; Xu, S.; Wu, X. Object detection with deep learning: A review. IEEE Trans. Neural Netw. Learn. Syst. 2019, 30, 3212–3232. [Google Scholar] [CrossRef]
- He, K.; Zhang, X.; Ren, S.; Sun, J. Spatial pyramid pooling in deep convolutional networks for visual recognition. IEEE Trans. Pattern Anal. Mach. Intell. 2015, 37, 1904–1916. [Google Scholar] [CrossRef]
- Girshick, R. Fast r-cnn. In Proceedings of the IEEE International Conference on Computer Vision, Santiago, Chile, 7–13 December 2015; pp. 1440–1448. [Google Scholar]
- Girshick, R.; Donahue, J.; Darrell, T.; Malik, J. Rich feature hierarchies for accurate object detection and semantic segmentation. In Proceedings of the IEEE Conference on Computer Vision and Pattern Recognition, Columbus, OH, USA, 23–28 June 2014; pp. 580–587. [Google Scholar]
- Ren, S.; He, K.; Girshick, R.; Sun, J. Faster r-cnn: Towards real-time object detection with region proposal networks. Adv. Neural Inf. Process. Syst. 2015, 28, 91–99. [Google Scholar] [CrossRef] [PubMed]
- Redmon, J.; Divvala, S.; Girshick, R.; Farhadi, A. You only look once: Unified, real-time object detection. In Proceedings of the IEEE Conference on Computer Vision and Pattern Recognition, Las Vegas, NV, USA, 27–30 June 2016; pp. 779–788. [Google Scholar]
- Liu, W.; Anguelov, D.; Erhan, D.; Szegedy, C.; Reed, S.; Fu, C.Y.; Berg, A.C. Ssd: Single shot multibox detector. In Proceedings of the European Conference on Computer Vision, Amsterdam, The Netherlands, 11–14 October 2016; Springer: Berlin/Heidelberg, Germany, 2016; pp. 21–37. [Google Scholar]
- Lin, T.Y.; Goyal, P.; Girshick, R.; He, K.; Dollár, P. Focal loss for dense object detection. In Proceedings of the IEEE International Conference on Computer Vision, Venice, Italy, 22–29 October 2017; pp. 2980–2988. [Google Scholar]
- Dash, S.K.; Acharya, S.; Pakray, P.; Das, R.; Gelbukh, A. Topic-based image caption generation. Arab. J. Sci. Eng. 2020, 45, 3025–3034. [Google Scholar] [CrossRef]
- Hu, H.; Gu, J.; Zhang, Z.; Dai, J.; Wei, Y. Relation networks for object detection. In Proceedings of the IEEE Conference on Computer Vision and Pattern Recognition, Salt Lake City, UT, USA, 18–22 June 2018; pp. 3588–3597. [Google Scholar]
- Guo, H.; Zheng, K.; Fan, X.; Yu, H.; Wang, S. Visual attention consistency under image transforms for multi-label image classification. In Proceedings of the IEEE/CVF Conference on Computer Vision and Pattern Recognition, Long Beach, CA, USA, 15–20 June 2019; pp. 729–739. [Google Scholar]
- Ghiasi, G.; Lin, T.Y.; Le, Q.V. Nas-fpn: Learning scalable feature pyramid architecture for object detection. In Proceedings of the IEEE/CVF Conference on Computer Vision and Pattern Recognition, Long Beach, CA, USA, 15–20 June 2019; pp. 7036–7045. [Google Scholar]
- Carion, N.; Massa, F.; Synnaeve, G.; Usunier, N.; Kirillov, A.; Zagoruyko, S. End-to-end object detection with transformers. In Proceedings of the European Conference on Computer Vision, Glasgow, UK, 23–28 August 2020; Springer: Berlin/Heidelberg, Germany, 2020; pp. 213–229. [Google Scholar]
- Tan, M.; Pang, R.; Le, Q.V. Efficientdet: Scalable and efficient object detection. In Proceedings of the IEEE/CVF Conference on Computer Vision and Pattern Recognition, Seattle, WA, USA, 14–19 June 2020; pp. 10781–10790. [Google Scholar]
- Lotfi, F.; Jamzad, M.; Beigy, H. Automatic Image Annotation using Tag Relations and Graph Convolutional Networks. In Proceedings of the 2021 5th International Conference on Pattern Recognition and Image Analysis (IPRIA), Kashan, Iran, 28–29 April 2021; IEEE: Piscataway, NJ, USA, 2021; pp. 1–6. [Google Scholar]
- Joseph, K.; Khan, S.; Khan, F.S.; Balasubramanian, V.N. Towards open world object detection. In Proceedings of the IEEE/CVF Conference on Computer Vision and Pattern Recognition, Nashville, TN, USA, 19–25 June 2021; pp. 5830–5840. [Google Scholar]
- Lotfi, F.; Jamzad, M.; Beigy, H. Automatic Image Annotation Using Quantization Reweighting Function and Graph Neural Networks. In Proceedings of the International Conference on Service-Oriented Computing, Seville, Spain, 29 November–2 December 2022; Springer: Berlin/Heidelberg, Germany, 2022; pp. 46–60. [Google Scholar]
- Yang, P.; Luo, F.; Chen, P.; Li, L.; Yin, Z.; He, X.; Sun, X. Knowledgeable Storyteller: A Commonsense-Driven Generative Model for Visual Storytelling. In Proceedings of the IJCAI, Macao, China, 11–12 August 2019; Volume 3, p. 7. [Google Scholar]
- Speer, R.; Havasi, C. Representing general relational knowledge in conceptnet 5. In Proceedings of the LREC, Istanbul, Turkey, 23–25 May 2012; Volume 2012, pp. 3679–3786. [Google Scholar]
- Chen, H.; Huang, Y.; Takamura, H.; Nakayama, H. Commonsense knowledge aware concept selection for diverse and informative visual storytelling. In Proceedings of the AAAI Conference on Artificial Intelligence, Virtual, 2–9 February 2021; Volume 35, pp. 999–1008. [Google Scholar]
- Li, J.; Shi, H.; Tang, S.; Wu, F.; Zhuang, Y. Informative visual storytelling with cross-modal rules. In Proceedings of the 27th ACM International Conference on Multimedia, Nice, France, 21–25 October 2019; pp. 2314–2322. [Google Scholar]
- Aggarwal, C.C. Data classification. In Data Mining; Springer: Berlin/Heidelberg, Germany, 2015; pp. 285–344. [Google Scholar]
- Aggarwal, C.C.; Reddy, C.K. Data clustering. In Algorithms and Applications; Chapman & Hall/CRC Data Mining and Knowledge Discovery Series; Chapman & Hall: London, UK, 2014. [Google Scholar]
- Ahmed, M. Data summarization: A survey. Knowl. Inf. Syst. 2019, 58, 249–273. [Google Scholar] [CrossRef]
- Mao, J.; Xu, W.; Yang, Y.; Wang, J.; Huang, Z.; Yuille, A. Deep captioning with multimodal recurrent neural networks (m-rnn). arXiv 2014, arXiv:1412.6632. [Google Scholar]
- Karpathy, A.; Fei-Fei, L. Deep visual-semantic alignments for generating image descriptions. In Proceedings of the IEEE Conference on Computer Vision and Pattern Recognition, Boston, MA, USA, 7–12 June 2015; pp. 3128–3137. [Google Scholar]
- Vinyals, O.; Toshev, A.; Bengio, S.; Erhan, D. Show and tell: A neural image caption generator. In Proceedings of the IEEE Conference on Computer Vision and Pattern Recognition, Boston, MA, USA, 7–12 June 2015; pp. 3156–3164. [Google Scholar]
- Rennie, S.J.; Marcheret, E.; Mroueh, Y.; Ross, J.; Goel, V. Self-critical sequence training for image captioning. In Proceedings of the IEEE Conference on Computer Vision and Pattern Recognition, Honolulu, HI, USA, 21–26 July 2017; pp. 7008–7024. [Google Scholar]
- Ren, Z.; Wang, X.; Zhang, N.; Lv, X.; Li, L.J. Deep reinforcement learning-based image captioning with embedding reward. In Proceedings of the IEEE Conference on Computer Vision and Pattern Recognition, Honolulu, HI, USA, 21–26 July 2017; pp. 290–298. [Google Scholar]
- Gordon, D.; Kembhavi, A.; Rastegari, M.; Redmon, J.; Fox, D.; Farhadi, A. Iqa: Visual question answering in interactive environments. In Proceedings of the IEEE Conference on Computer Vision and Pattern Recognition, Salt Lake City, UT, USA, 18–22 June 2018; pp. 4089–4098. [Google Scholar]
- Patro, B.; Patel, S.; Namboodiri, V. Robust explanations for visual question answering. In Proceedings of the IEEE/CVF Winter Conference on Applications of Computer Vision, Snowmass Village, CO, USA, 1–5 March 2020; pp. 1577–1586. [Google Scholar]
- Wu, Q.; Wang, P.; Shen, C.; Reid, I.; Van Den Hengel, A. Are you talking to me? reasoned visual dialog generation through adversarial learning. In Proceedings of the IEEE Conference on Computer Vision and Pattern Recognition, Salt Lake City, UT, USA, 18–22 June 2018; pp. 6106–6115. [Google Scholar]
- Chen, C.; Mu, S.; Xiao, W.; Ye, Z.; Wu, L.; Ju, Q. Improving image captioning with conditional generative adversarial nets. In Proceedings of the AAAI Conference on Artificial Intelligence, Honolulu, HI, USA, 27 January–1 February 2019; Volume 33, pp. 8142–8150. [Google Scholar]
- Xu, K.; Ba, J.; Kiros, R.; Cho, K.; Courville, A.; Salakhudinov, R.; Zemel, R.; Bengio, Y. Show, attend and tell: Neural image caption generation with visual attention. In Proceedings of the International Conference on Machine Learning, Lille, France, 7–9 July 2015; 2015; pp. 2048–2057. [Google Scholar]
- Bahdanau, D.; Cho, K.; Bengio, Y. Neural machine translation by jointly learning to align and translate. arXiv 2014, arXiv:1409.0473. [Google Scholar]
- Ba, J.; Mnih, V.; Kavukcuoglu, K. Multiple object recognition with visual attention. arXiv 2014, arXiv:1412.7755. [Google Scholar]
- Mnih, V.; Heess, N.; Graves, A. Recurrent models of visual attention. Adv. Neural Inf. Process. Syst. 2014, 27, 2204–2212. [Google Scholar]
- Lu, J.; Xiong, C.; Parikh, D.; Socher, R. Knowing when to look: Adaptive attention via a visual sentinel for image captioning. In Proceedings of the IEEE Conference on Computer Vision and Pattern Recognition, Honolulu, HI, USA, 21–26 July 2017; pp. 375–383. [Google Scholar]
- Anderson, P.; He, X.; Buehler, C.; Teney, D.; Johnson, M.; Gould, S.; Zhang, L. Bottom-up and top-down attention for image captioning and visual question answering. In Proceedings of the IEEE Conference on Computer Vision and Pattern Recognition, Salt Lake City, UT, USA, 18–22 June 2018; pp. 6077–6086. [Google Scholar]
- Qin, Y.; Du, J.; Zhang, Y.; Lu, H. Look back and predict forward in image captioning. In Proceedings of the IEEE/CVF Conference on Computer Vision and Pattern Recognition, Long Beach, CA, USA, 16–17 June 2019; pp. 8367–8375. [Google Scholar]
- Ke, L.; Pei, W.; Li, R.; Shen, X.; Tai, Y.W. Reflective decoding network for image captioning. In Proceedings of the IEEE/CVF International Conference on Computer Vision, Seoul, Repulic of Korea, 27 October–2 November 2019; pp. 8888–8897. [Google Scholar]
- Huang, L.; Wang, W.; Chen, J.; Wei, X.Y. Attention on attention for image captioning. In Proceedings of the IEEE/CVF International Conference on Computer Vision, Seoul, Repulic of Korea, 27 October–2 November 2019; pp. 4634–4643. [Google Scholar]
- Guo, L.; Liu, J.; Zhu, X.; Yao, P.; Lu, S.; Lu, H. Normalized and geometry-aware self-attention network for image captioning. In Proceedings of the IEEE/CVF Conference on Computer Vision and Pattern Recognition, Seattle, WA, USA, 14–19 June 2020; pp. 10327–10336. [Google Scholar]
- Li, G.; Zhu, L.; Liu, P.; Yang, Y. Entangled transformer for image captioning. In Proceedings of the IEEE/CVF International Conference on Computer Vision, Seoul, Repulic of Korea, 27 October–2 November 2019; pp. 8928–8937. [Google Scholar]
- Yao, T.; Pan, Y.; Li, Y.; Mei, T. Exploring visual relationship for image captioning. In Proceedings of the European Conference on Computer Vision (ECCV), Munich, Germany, 8–14 September 2018; pp. 684–699. [Google Scholar]
- Yang, X.; Tang, K.; Zhang, H.; Cai, J. Auto-encoding scene graphs for image captioning. In Proceedings of the IEEE/CVF Conference on Computer Vision and Pattern Recognition, Long Beach, CA, USA, 16–17 June 2019; pp. 10685–10694. [Google Scholar]
- Yao, T.; Pan, Y.; Li, Y.; Mei, T. Hierarchy parsing for image captioning. In Proceedings of the IEEE/CVF International Conference on Computer Vision, Seoul, Repulic of Korea, 27 October–2 November 2019; pp. 2621–2629. [Google Scholar]
- Aneja, J.; Deshpande, A.; Schwing, A.G. Convolutional image captioning. In Proceedings of the IEEE Conference on Computer Vision and Pattern Recognition, Salt Lake City, UT, USA, 18–22 June 2018; pp. 5561–5570. [Google Scholar]
- Wang, Q.; Chan, A.B. Cnn+ cnn: Convolutional decoders for image captioning. arXiv 2018, arXiv:1805.09019. [Google Scholar]
- Herdade, S.; Kappeler, A.; Boakye, K.; Soares, J. Image captioning: Transforming objects into words. Adv. Neural Inf. Process. Syst. 2019, 32, 11135–11145. [Google Scholar]
- Luo, Y.; Ji, J.; Sun, X.; Cao, L.; Wu, Y.; Huang, F.; Lin, C.W.; Ji, R. Dual-level collaborative transformer for image captioning. arXiv 2021, arXiv:2101.06462. [Google Scholar] [CrossRef]
- Zhou, L.; Palangi, H.; Zhang, L.; Hu, H.; Corso, J.; Gao, J. Unified vision-language pre-training for image captioning and vqa. In Proceedings of the AAAI Conference on Artificial Intelligence, New York, NY, USA, 7–12 February 2020; Volume 34, pp. 13041–13049. [Google Scholar]
- Johnson, J.; Karpathy, A.; Fei-Fei, L. Densecap: Fully convolutional localization networks for dense captioning. In Proceedings of the IEEE Conference on Computer Vision and Pattern Recognition, Las Vegas, NV, USA, 27–30 June 2016; pp. 4565–4574. [Google Scholar]
- Yang, L.; Tang, K.; Yang, J.; Li, L.J. Dense captioning with joint inference and visual context. In Proceedings of the IEEE Conference on Computer Vision and Pattern Recognition, Honolulu, HI, USA, 21–26 July 2017; pp. 2193–2202. [Google Scholar]
- Kim, D.J.; Choi, J.; Oh, T.H.; Kweon, I.S. Dense relational captioning: Triple-stream networks for relationship-based captioning. In Proceedings of the IEEE/CVF Conference on Computer Vision and Pattern Recognition, Long Beach, CA, USA, 16–17 June 2019; pp. 6271–6280. [Google Scholar]
- Uehara, K.; Mori, Y.; Mukuta, Y.; Harada, T. ViNTER: Image Narrative Generation with Emotion-Arc-Aware Transformer. In Proceedings of the Companion Proceedings of the Web Conference 2022, Virtual Event/Lyon, France, 25–29 April 2022; pp. 716–725. [Google Scholar]
- Su, J.; Dai, Q.; Guerin, F.; Zhou, M. BERT-hLSTMs: BERT and hierarchical LSTMs for visual storytelling. Comput. Speech Lang. 2021, 67, 101169. [Google Scholar] [CrossRef]
- Riahi Samani, Z.; Ebrahimi Moghaddam, M. Image Collection Summarization Method Based on Semantic Hierarchies. AI 2020, 1, 209–228. [Google Scholar] [CrossRef]
- Sharma, V.; Kumar, A.; Agrawal, N.; Singh, P.; Kulshreshtha, R. Image summarization using topic modelling. In Proceedings of the 2015 IEEE International Conference on Signal and Image Processing Applications (ICSIPA), Kuala Lumpur, Malaysia, 19–21 October 2015; IEEE: Piscataway, NJ, USA, 2015; pp. 226–231. [Google Scholar]
- Camargo, J.E.; González, F.A. A multi-class kernel alignment method for image collection summarization. In Proceedings of the Iberoamerican Congress on Pattern Recognition, Guadalajara, Mexico, 15–18 November 2009; Springer: Berlin/Heidelberg, Germany, 2009; pp. 545–552. [Google Scholar]
- Sreelakshmi, P.; Manmadhan, S. Image Summarization Using Unsupervised Learning. In Proceedings of the 2021 7th International Conference on Advanced Computing and Communication Systems (ICACCS), Coimbatore, India, 19–20 March 2021; IEEE: Piscataway, NJ, USA, 2021; Volume 1, pp. 100–103. [Google Scholar]
- Chen, J.; Zhuge, H. Extractive summarization of documents with images based on multi-modal RNN. Future Gener. Comput. Syst. 2019, 99, 186–196. [Google Scholar] [CrossRef]
- Qian, X.; Li, M.; Ren, Y.; Jiang, S. Social media based event summarization by user–text–image co-clustering. Knowl. Based Syst. 2019, 164, 107–121. [Google Scholar] [CrossRef]
- Kuzovkin, D.; Pouli, T.; Cozot, R.; Meur, O.L.; Kervec, J.; Bouatouch, K. Context-aware clustering and assessment of photo collections. In Proceedings of the Symposium on Computational Aesthetics, Los Angeles, CA, USA, 29–30 July 2017; pp. 1–10. [Google Scholar]
- Camargo, J.E.; González, F.A. Multimodal image collection summarization using non-negative matrix factorization. In Proceedings of the 2011 6th Colombian Computing Congress (CCC), Manizales, Colombia, 4–6 May 2011; IEEE: Piscataway, NJ, USA, 2011; pp. 1–6. [Google Scholar]
- Huang, T.H.; Ferraro, F.; Mostafazadeh, N.; Misra, I.; Agrawal, A.; Devlin, J.; Girshick, R.; He, X.; Kohli, P.; Batra, D.; et al. Visual storytelling. In Proceedings of the 2016 Conference of the North American Chapter of the Association for Computational Linguistics: Human Language Technologies, San Diego, CA, USA, 12–17 June 2016; pp. 1233–1239. [Google Scholar]
- Yu, L.; Bansal, M.; Berg, T.L. Hierarchically-attentive rnn for album summarization and storytelling. arXiv 2017, arXiv:1708.02977. [Google Scholar]
- Wang, X.; Chen, W.; Wang, Y.F.; Wang, W.Y. No metrics are perfect: Adversarial reward learning for visual storytelling. arXiv 2018, arXiv:1804.09160. [Google Scholar]
- Wang, J.; Fu, J.; Tang, J.; Li, Z.; Mei, T. Show, reward and tell: Automatic generation of narrative paragraph from photo stream by adversarial training. In Proceedings of the AAAI Conference on Artificial Intelligence, New Orleans, LA, USA, 2–7 February 2018; Volume 32. [Google Scholar]
- Huang, Q.; Gan, Z.; Celikyilmaz, A.; Wu, D.; Wang, J.; He, X. Hierarchically structured reinforcement learning for topically coherent visual story generation. In Proceedings of the AAAI Conference on Artificial Intelligence, Honolulu, HI, USA, 27 January–1 February 2019; Volume 33, pp. 8465–8472. [Google Scholar]
- Hsu, C.C.; Chen, Z.Y.; Hsu, C.Y.; Li, C.C.; Lin, T.Y.; Huang, T.H.; Ku, L.W. Knowledge-enriched visual storytelling. In Proceedings of the AAAI Conference on Artificial Intelligence, New York, NY, USA, 7–12 February 2020; Volume 34, pp. 7952–7960. [Google Scholar]
- Jung, Y.; Kim, D.; Woo, S.; Kim, K.; Kim, S.; Kweon, I.S. Hide-and-tell: Learning to bridge photo streams for visual storytelling. In Proceedings of the AAAI Conference on Artificial Intelligence, New York, NY, USA, 7–12 February 2020; Volume 34, pp. 11213–11220. [Google Scholar]
- Hu, J.; Cheng, Y.; Gan, Z.; Liu, J.; Gao, J.; Neubig, G. What makes a good story? Designing composite rewards for visual storytelling. In Proceedings of the AAAI Conference on Artificial Intelligence, New York, NY, USA, 7–12 February 2020; Volume 34, pp. 7969–7976. [Google Scholar]
- Yu, Y.; Chung, J.; Yun, H.; Kim, J.; Kim, G. Transitional Adaptation of Pretrained Models for Visual Storytelling. In Proceedings of the IEEE/CVF Conference on Computer Vision and Pattern Recognition, Nashville, TN, USA, 19–25 June 2021; pp. 12658–12668. [Google Scholar]
- Lukin, S.M.; Hobbs, R.; Voss, C.R. A pipeline for creative visual storytelling. arXiv 2018, arXiv:1807.08077. [Google Scholar]
- Xu, C.; Yang, M.; Li, C.; Shen, Y.; Ao, X.; Xu, R. Imagine, Reason and Write: Visual Storytelling with Graph Knowledge and Relational Reasoning. In Proceedings of the AAAI Conference on Artificial Intelligence, Virtual, 2–9 February 2021; Volume 35, pp. 3022–3029. [Google Scholar]
- Wang, E.; Han, C.; Poon, J. RoViST: Learning Robust Metrics for Visual Storytelling. arXiv 2022, arXiv:2205.03774. [Google Scholar]
- Li, T.; Wang, H.; He, B.; Chen, C.W. Knowledge-enriched attention network with group-wise semantic for visual storytelling. IEEE Trans. Pattern Anal. Mach. Intell. 2022; Early Access. [Google Scholar] [CrossRef]
- Knaflic, C.N. Storytelling with Data: Let’s Practice! John Wiley & Sons: Hoboken, NJ, USA, 2019. [Google Scholar]
- Toker, D.; Conati, C.; Carenini, G.; Haraty, M. Towards adaptive information visualization: On the influence of user characteristics. In Proceedings of the International Conference on User Modeling, Adaptation, and Personalization, Montreal, QC, Canada, 16–20 July 2012; Springer: Berlin/Heidelberg, Germany, 2012; pp. 274–285. [Google Scholar]
- Papineni, K.; Roukos, S.; Ward, T.; Zhu, W.J. Bleu: A method for automatic evaluation of machine translation. In Proceedings of the 40th Annual Meeting of the Association for Computational Linguistics, Philadelphia, PA, USA, 7–12 July 2002; pp. 311–318. [Google Scholar]
- Banerjee, S.; Lavie, A. METEOR: An automatic metric for MT evaluation with improved correlation with human judgments. In Proceedings of the ACL Workshop on Intrinsic and Extrinsic Evaluation Measures for Machine Translation and/or Summarization, Ann Arbor, MI, USA, 29 June 2005; pp. 65–72. [Google Scholar]
- Anderson, P.; Fernando, B.; Johnson, M.; Gould, S. Spice: Semantic propositional image caption evaluation. In Proceedings of the European Conference on Computer Vision, Amsterdam, The Netherlands, 11–14 October 2016; Springer: Berlin/Heidelberg, Germany, 2016; pp. 382–398. [Google Scholar]
- Vedantam, R.; Lawrence Zitnick, C.; Parikh, D. Cider: Consensus-based image description evaluation. In Proceedings of the IEEE Conference on Computer Vision and Pattern Recognition, Boston, MA, USA, 7–12 June 2015; pp. 4566–4575. [Google Scholar]
- Yao, L.; Peng, N.; Weischedel, R.; Knight, K.; Zhao, D.; Yan, R. Plan-and-write: Towards better automatic storytelling. In Proceedings of the AAAI Conference on Artificial Intelligence, Honolulu, HI, USA, 27 January–1 February 2019; Volume 33, pp. 7378–7385. [Google Scholar]
- Chen, Y.C.; Bansal, M. Fast abstractive summarization with reinforce-selected sentence rewriting. arXiv 2018, arXiv:1805.11080. [Google Scholar]
- Aafaq, N.; Mian, A.; Liu, W.; Gilani, S.Z.; Shah, M. Video description: A survey of methods, datasets, and evaluation metrics. ACM Comput. Surv. (CSUR) 2019, 52, 1–37. [Google Scholar] [CrossRef]
- Kilickaya, M.; Erdem, A.; Ikizler-Cinbis, N.; Erdem, E. Re-evaluating automatic metrics for image captioning. arXiv 2016, arXiv:1612.07600. [Google Scholar]
- Sai, A.B.; Mohankumar, A.K.; Khapra, M.M. A survey of evaluation metrics used for NLG systems. ACM Comput. Surv. (CSUR) 2022, 55, 1–39. [Google Scholar] [CrossRef]
- Engel, J.; Gerretzen, J.; Szymańska, E.; Jansen, J.J.; Downey, G.; Blanchet, L.; Buydens, L.M. Breaking with trends in pre-processing? TrAC Trends Anal. Chem. 2013, 50, 96–106. [Google Scholar] [CrossRef]
- Hemanth, D.J.; Anitha, J. Image pre-processing and feature extraction techniques for magnetic resonance brain image analysis. In Proceedings of the International Conference on Future Generation Communication and Networking, London, UK, 12–14 December 2012; Springer: Berlin/Heidelberg, Germany, 2012; pp. 349–356. [Google Scholar]
- Rajesh, S.D.; Almeida, J.M.; Martins, A. Image Cleaning and Enhancement Technique for Underwater Mining. In Proceedings of the OCEANS 2019, Marseille, France, 17–20 June 2019; IEEE: Piscataway, NJ, USA, 2019; pp. 1–6. [Google Scholar]
- Jiang, Z.; Zhang, Y.; Zou, D.; Ren, J.; Lv, J.; Liu, Y. Learning event-based motion deblurring. In Proceedings of the IEEE/CVF Conference on Computer Vision and Pattern Recognition, Seattle, WA, USA, 14–19 June 2020; pp. 3320–3329. [Google Scholar]
- Uijlings, J.R.; Van De Sande, K.E.; Gevers, T.; Smeulders, A.W. Selective search for object recognition. Int. J. Comput. Vis. 2013, 104, 154–171. [Google Scholar] [CrossRef]
- Lazebnik, S.; Schmid, C.; Ponce, J. Beyond bags of features: Spatial pyramid matching for recognizing natural scene categories. In Proceedings of the 2006 IEEE Computer Society Conference on Computer Vision and Pattern Recognition (CVPR’06), New York, NY, USA, 17–22 June 2006; IEEE: Piscataway, NJ, USA, 2006; Volume 2, pp. 2169–2178. [Google Scholar]
- Shin, A.; Ushiku, Y.; Harada, T. Customized Image Narrative Generation via Interactive Visual Question Generation and Answering. In Proceedings of the IEEE Conference on Computer Vision and Pattern Recognition, Salt Lake City, UT, USA, 18–22 June 2018; pp. 8925–8933. [Google Scholar]
- Szegedy, C.; Liu, W.; Jia, Y.; Sermanet, P.; Reed, S.; Anguelov, D.; Erhan, D.; Vanhoucke, V.; Rabinovich, A. Going deeper with convolutions. In Proceedings of the IEEE Conference on Computer Vision and Pattern Recognition, Boston, MA, USA, 7–12 June 2015; pp. 1–9. [Google Scholar]
- Krizhevsky, A.; Sutskever, I.; Hinton, G.E. Imagenet classification with deep convolutional neural networks. Adv. Neural Inf. Process. Syst. 2012, 25, 1106–1114. [Google Scholar] [CrossRef]
- Fang, H.; Gupta, S.; Iandola, F.; Srivastava, R.K.; Deng, L.; Dollár, P.; Gao, J.; He, X.; Mitchell, M.; Platt, J.C.; et al. From captions to visual concepts and back. In Proceedings of the IEEE Conference on Computer Vision and Pattern Recognition, Boston, MA, USA, 7–12 June 2015; pp. 1473–1482. [Google Scholar]
- Wu, Q.; Shen, C.; Liu, L.; Dick, A.; Van Den Hengel, A. What value do explicit high level concepts have in vision to language problems? In Proceedings of the IEEE Conference on Computer Vision and Pattern Recognition, Las Vegas, NV, USA, 27–30 June 2016; pp. 203–212. [Google Scholar]
- Li, Y.; Duan, N.; Zhou, B.; Chu, X.; Ouyang, W.; Wang, X.; Zhou, M. Visual question generation as dual task of visual question answering. In Proceedings of the IEEE Conference on Computer Vision and Pattern Recognition, Salt Lake City, UT, USA, 18–22 June 2018; pp. 6116–6124. [Google Scholar]
- Kipf, T.N.; Welling, M. Semi-supervised classification with graph convolutional networks. arXiv 2016, arXiv:1609.02907. [Google Scholar]
- Malakan, Z.M.; Hassan, G.M.; Mian, A. Vision Transformer Based Model for Describing a Set of Images as a Story. In Proceedings of the AI 2022: Advances in Artificial Intelligence: 35th Australasian Joint Conference, AI 2022, Perth, WA, Australia, 5–8 December 2022; Springer: Berlin/Heidelberg, Germany, 2022; pp. 15–28. [Google Scholar]
- Cao, S.; An, G.; Zheng, Z.; Wang, Z. Vision-Enhanced and Consensus-Aware Transformer for Image Captioning. IEEE Trans. Circuits Syst. Video Technol. 2022, 32, 7005–7018. [Google Scholar] [CrossRef]
- Fang, Z.; Wang, J.; Hu, X.; Liang, L.; Gan, Z.; Wang, L.; Yang, Y.; Liu, Z. Injecting semantic concepts into end-to-end image captioning. In Proceedings of the IEEE/CVF Conference on Computer Vision and Pattern Recognition, New Orleans, LA, USA, 18–24 June 2022; pp. 18009–18019. [Google Scholar]
- Dosovitskiy, A.; Beyer, L.; Kolesnikov, A.; Weissenborn, D.; Zhai, X.; Unterthiner, T.; Dehghani, M.; Minderer, M.; Heigold, G.; Gelly, S.; et al. An image is worth 16x16 words: Transformers for image recognition at scale. arXiv 2020, arXiv:2010.11929. [Google Scholar]
- Vinyals, O.; Toshev, A.; Bengio, S.; Erhan, D. Show and tell: Lessons learned from the 2015 mscoco image captioning challenge. IEEE Trans. Pattern Anal. Mach. Intell. 2016, 39, 652–663. [Google Scholar] [CrossRef]
- Hochreiter, S.; Schmidhuber, J. Long short-term memory. Neural Comput. 1997, 9, 1735–1780. [Google Scholar] [CrossRef] [PubMed]
- Donahue, J.; Anne Hendricks, L.; Guadarrama, S.; Rohrbach, M.; Venugopalan, S.; Saenko, K.; Darrell, T. Long-term recurrent convolutional networks for visual recognition and description. In Proceedings of the IEEE Conference on Computer Vision and Pattern Recognition, Boston, MA, USA, 7–12 June 2015; pp. 2625–2634. [Google Scholar]
- Gu, J.; Wang, G.; Cai, J.; Chen, T. An empirical study of language cnn for image captioning. In Proceedings of the IEEE International Conference on Computer Vision, Venice, Italy, 22–29 October 2017; pp. 1222–1231. [Google Scholar]
- Devlin, J.; Chang, M.W.; Lee, K.; Toutanova, K. Bert: Pre-training of deep bidirectional transformers for language understanding. arXiv 2018, arXiv:1810.04805. [Google Scholar]
- Zhu, Z.; Wei, Y.; Wang, J.; Gan, Z.; Zhang, Z.; Wang, L.; Hua, G.; Wang, L.; Liu, Z.; Hu, H. Exploring Discrete Diffusion Models for Image Captioning. arXiv 2022, arXiv:2211.11694. [Google Scholar]
- Luo, J.; Li, Y.; Pan, Y.; Yao, T.; Feng, J.; Chao, H.; Mei, T. Semantic-Conditional Diffusion Networks for Image Captioning. arXiv 2022, arXiv:2212.03099. [Google Scholar]
- Xu, S. CLIP-Diffusion-LM: Apply Diffusion Model on Image Captioning. arXiv 2022, arXiv:2210.04559. [Google Scholar]
- Cheung, J.C.K.; Li, X. Sequence clustering and labeling for unsupervised query intent discovery. In Proceedings of the Fifth ACM International Conference on Web Search and Data Mining, Seattle, WA, USA, 8–12 February 2012; pp. 383–392. [Google Scholar]
- Vedula, N.; Lipka, N.; Maneriker, P.; Parthasarathy, S. Towards open intent discovery for conversational text. arXiv 2019, arXiv:1904.08524. [Google Scholar]
- Narayanan, A.; Chandramohan, M.; Venkatesan, R.; Chen, L.; Liu, Y.; Jaiswal, S. graph2vec: Learning distributed representations of graphs. arXiv 2017, arXiv:1707.05005. [Google Scholar]
- Beheshti, A.; Benatallah, B.; Nouri, R.; Chhieng, V.M.; Xiong, H.; Zhao, X. Coredb: A data lake service. In Proceedings of the 2017 ACM on Conference on Information and Knowledge Management, Singapore, 6–10 November 2017; pp. 2451–2454. [Google Scholar]
- Beheshti, A.; Benatallah, B.; Nouri, R.; Tabebordbar, A. CoreKG: A knowledge lake service. Proc. VLDB Endow. 2018, 11, 1942–1945. [Google Scholar] [CrossRef]
- Li, N.; Liu, B.; Han, Z.; Liu, Y.S.; Fu, J. Emotion reinforced visual storytelling. In Proceedings of the 2019 on International Conference on Multimedia Retrieval, Ottawa, ON, Canada, 10–13 June 2019; pp. 297–305. [Google Scholar]
- Hsu, C.Y.; Chu, Y.W.; Huang, T.H.; Ku, L.W. Plot and Rework: Modeling Storylines for Visual Storytelling. arXiv 2021, arXiv:2105.06950. [Google Scholar]
- Nahian, M.; Al, S.; Tasrin, T.; Gandhi, S.; Gaines, R.; Harrison, B. A hierarchical approach for visual storytelling using image description. In Proceedings of the International Conference on Interactive Digital Storytelling, Little Cottonwood Canyon, UT, USA, 19–22 November 2019; Springer: Berlin/Heidelberg, Germany, 2019; pp. 304–317. [Google Scholar]
- Kim, T.; Heo, M.O.; Son, S.; Park, K.W.; Zhang, B.T. Glac net: Glocal attention cascading networks for multi-image cued story generation. arXiv 2018, arXiv:1805.10973. [Google Scholar]
- Wang, R.; Wei, Z.; Li, P.; Zhang, Q.; Huang, X. Storytelling from an image stream using scene graphs. In Proceedings of the AAAI Conference on Artificial Intelligence, New York, NY, USA, 7–12 February 2020; Volume 34, pp. 9185–9192. [Google Scholar]
- Zhang, B.; Hu, H.; Sha, F. Visual storytelling via predicting anchor word embeddings in the stories. arXiv 2020, arXiv:2001.04541. [Google Scholar]
- Gonzalez-Rico, D.; Fuentes-Pineda, G. Contextualize, show and tell: A neural visual storyteller. arXiv 2018, arXiv:1806.00738. [Google Scholar]
- Wang, P.; Zamora, J.; Liu, J.; Ilievski, F.; Chen, M.; Ren, X. Contextualized scene imagination for generative commonsense reasoning. arXiv 2021, arXiv:2112.06318. [Google Scholar]
- Smilevski, M.; Lalkovski, I.; Madjarov, G. Stories for images-in-sequence by using visual and narrative components. In Proceedings of the International Conference on Telecommunications, Saint Malo, France, 26–28 June 2018; Springer: Berlin/Heidelberg, Germany, 2018; pp. 148–159. [Google Scholar]
- Chandu, K.; Nyberg, E.; Black, A.W. Storyboarding of recipes: Grounded contextual generation. In Proceedings of the 57th Annual Meeting of the Association for Computational Linguistics, Florence, Italy, 28 July–2 August 2019; pp. 6040–6046. [Google Scholar]
- Salvador, A.; Gundogdu, E.; Bazzani, L.; Donoser, M. Revamping cross-modal recipe retrieval with hierarchical transformers and self-supervised learning. In Proceedings of the IEEE/CVF Conference on Computer Vision and Pattern Recognition, Nashville, TN, USA, 19–25 June 2021; pp. 15475–15484. [Google Scholar]
- Nishimura, T.; Hashimoto, A.; Ushiku, Y.; Kameko, H.; Yamakata, Y.; Mori, S. Structure-aware procedural text generation from an image sequence. IEEE Access 2020, 9, 2125–2141. [Google Scholar] [CrossRef]
- Qi, M.; Qin, J.; Huang, D.; Shen, Z.; Yang, Y.; Luo, J. Latent Memory-augmented Graph Transformer for Visual Storytelling. In Proceedings of the 29th ACM International Conference on Multimedia, Virtual, 20–24 October 2021; pp. 4892–4901. [Google Scholar]
- Hong, X.; Shetty, R.; Sayeed, A.; Mehra, K.; Demberg, V.; Schiele, B. Diverse and Relevant Visual Storytelling with Scene Graph Embeddings. In Proceedings of the 24th Conference on Computational Natural Language Learning, Online, 19–20 November 2020; pp. 420–430. [Google Scholar]
- Joana, K.; Chan, S.W.; Chu, S.K. Quality assessment for digital stories by young authors. Data Inf. Manag. 2021, 5, 174–183. [Google Scholar]
- Kusner, M.; Sun, Y.; Kolkin, N.; Weinberger, K. From word embeddings to document distances. In Proceedings of the International Conference on Machine Learning, Lille, France, 7–9 July 2015; pp. 957–966. [Google Scholar]
- Lin, C.Y. Rouge: A package for automatic evaluation of summaries. In Text Summarization Branches Out; Association for Computational Linguistics: Barcelona, Spain, 2004; pp. 74–81. [Google Scholar]
- Hsu, T.Y.; Huang, C.Y.; Hsu, Y.C.; Huang, T.H. Visual story post-editing. arXiv 2019, arXiv:1906.01764. [Google Scholar]
- Ravi, H.; Kafle, K.; Cohen, S.; Brandt, J.; Kapadia, M. AESOP: Abstract Encoding of Stories, Objects, and Pictures. In Proceedings of the IEEE/CVF International Conference on Computer Vision, Montreal, QC, Canada, 10–17 October 2021; pp. 2052–2063. [Google Scholar]
- Hsu, C.Y.; Chu, Y.W.; Chen, V.; Lo, K.C.; Chen, C.; Huang, T.H.; Ku, L.W. Learning to Rank Visual Stories From Human Ranking Data. In Proceedings of the 60th Annual Meeting of the Association for Computational Linguistics (Volume 1: Long Papers), Dublin, Ireland, 22–27 May 2022; pp. 6365–6378. [Google Scholar]
- Marin, J.; Biswas, A.; Ofli, F.; Hynes, N.; Salvador, A.; Aytar, Y.; Weber, I.; Torralba, A. Recipe1m+: A dataset for learning cross-modal embeddings for cooking recipes and food images. IEEE Trans. Pattern Anal. Mach. Intell. 2019, 43, 187–203. [Google Scholar] [CrossRef]
- Wang, H.; Lin, G.; Hoi, S.C.; Miao, C. Decomposed generation networks with structure prediction for recipe generation from food images. arXiv 2020, arXiv:2007.13374. [Google Scholar]
- Nishimura, T.; Hashimoto, A.; Ushiku, Y.; Kameko, H.; Mori, S. Recipe Generation from Unsegmented Cooking Videos. arXiv 2022, arXiv:2209.10134. [Google Scholar]
- Fain, M.; Twomey, N.; Ponikar, A.; Fox, R.; Bollegala, D. Dividing and conquering cross-modal recipe retrieval: From nearest neighbours baselines to sota. arXiv 2019, arXiv:1911.12763. [Google Scholar]
- Sakib, M.S.; Paulius, D.; Sun, Y. Approximate task tree retrieval in a knowledge network for robotic cooking. IEEE Robot. Autom. Lett. 2022, 7, 11492–11499. [Google Scholar] [CrossRef]


| ID | Research Question | Description and Main Motivation |
|---|---|---|
| RQ1 | What is storytelling with image data, and how can it contribute to understanding images? | Storytelling with image data aims to generate a coherent story based on a set of relevant images. The main steps to understanding image data are curation, summarization, and presentation in a succinct and consumable manner to end-users. Storytelling with image data is therefore considered an appropriate metaphor for capturing and representing the temporal/sequential order of key events. |
| RQ2 | How is storytelling with image data different from image/video captioning methods? | Storytelling with image data could differ from image/video captioning, classification, and labeling tasks. In storytelling, the objective is to describe a set of images subjectively. Due to different understandings, a data analyst may create various narratives for a set of images. Based on the combinations of these narratives and the goals of an analyst, personalized and customized stories could be generated. |
| RQ3 | What are the differences between storytelling with a set of related images rather than a single image? | Storytelling with a single image could differ from storytelling with a set of images. Multiple images generate more features and consist of more dimensions, such as time and location, resulting in diverse knowledge and context-aware narratives. For example, imagine a single image showing a nervous woman in a meeting vs. multiple images depicting her activities, such as waking up, having breakfast with family, going to work, being late and stuck in traffic, being in a meeting nervously, and finally going back home. |
| RQ4 | What are the technical challenges we face in storytelling with image data? | Storytelling mainly focuses on understanding a set of related images. There is a plethora of research in storytelling with textual data, which is well-matured, and there has been significant progress in this field. It can develop, focus, and deliver critical concepts from an unstructured corpus into a narrative. However, the field of storytelling with image data is at an early stage. The challenges in storytelling fundamentally differ from simple text generation based on an image. Filling in the visual gap between the images with a subjective story is the main challenge of storytelling with image data. |
| RQ5 | What techniques have been used in storytelling with image data? | Although scattered work has been conducted in storytelling with image data, this issue has not yet been coined. Object extraction, image captioning, labeling, and annotation are some of the leading practices in this field. We take one step forward and combine them to provide a detailed view at multiple levels to help analysts to understand image data. In summary, we combine data with narratives to reduce the ambiguity of data, connect data with context, and describe a specific interpretation. |
| RQ6 | What are the applications of storytelling with image data, and how can they provide value for businesses? | We believe storytelling with image data is essential for advancing AI towards a more human-like understanding. The need for understanding the massive amount of image data published on social media platforms, IoT devices such as CCTV cameras, smart cars, dash cams, and video captioning for the visually or hearing impaired is strongly felt. Storytelling could help businesses to build personalized stories. For example, numerous images/videos are captured by various CCTVs or at the crime scene, which could help with the police investigation of crimes. Accordingly, instead of individuals spending a lot of time looking for a specific clue, storytelling could help speed up the investigation process and discover rich insights. |
| RQ7 | How can the quality of the stories be assessed? | Researchers should ensure that a high-quality story (a semantically and logically coherent story that accurately describes the objects in a given set of images and engages the analyst) is generated, since trust is essential in storytelling with data. For example, we can point out stories generated around fake news based on a set of images. Moreover, story quality assessment could also be automated by using human in the loop. |
| Category | Subcategory | Literature | Time Period | No. |
|---|---|---|---|---|
| Curation: Cleaning and Preprocessing | Image Correction | [13,14,15,16,17] | [2014–2020] | 5 |
| Image Enhancement | [18,19,20,21,22,23] | [2013–2021] | 6 | |
| Image Integration | [24,25,26,27] | [2007–2020] | 4 | |
| Image Transformation | [28,29,30] | [2011–2018] | 3 | |
| Image Preparation for Feature Extraction | [16,31,32,33,34,35,36,37] | [2013–2021] | 8 | |
| Curation: Adding Value | Extraction | [38,39,40,41,42,43,44,45,46,47,48,49,50,51,52,53,54,55,56,57,58,59,60,61] | [1981–2022] | 24 |
| Enrichment and Linking | [62,63,64,65] | [2012–2021] | 4 | |
| Story modeling | Organizing and summarizing Feature Data | [66,67,68] | [2014–2019] | 3 |
| Narrative Engineering | [49,69,70,71,72,73,74,75,76,77,78,79,80,81,82,83,84,85,86,87,88,89,90,91,92,93,94,95,96,97,98,99,100] | [2014–2022] | 33 | |
| Intelligent Narrative Discovery | Image Collection Summarization | [37,101,102,103,104,105,106,107,108,109] | [2009–2021] | 10 |
| Story Creation | Framework and Techniques | [62,110,111,112,113,114,115,116,117,118,119,120,121,122] | [2016–2022] | 14 |
| Story Presentation and Querying | Intelligent Widget/Visualization | [6,123,124] | [2012–2020] | 3 |
| Quality Assessment | Automatic Assessment | [112,117,125,126,127,128,129,130,131,132] | [2002–2020] | 10 |
| Human Assessment | [112,117,131,132,133] | [2016–2020] | 5 |
| Model | Region Finding Method | Feature Extraction Model | Classifier |
|---|---|---|---|
| R-CNN [48] | Selective Search | CNN | SVM |
| SSP-Net [46] | Edge Box | CNN | SVM |
| Fast R-CNN [47] | Selective Search | CNN | Softmax Layer |
| Faster R-CNN [49] | Region Proposal Network | CNN | Softmax Layer |
| ORE [60] | Region Proposal Network | CNN | Energy-based Layer |
| No. | Model | Relevant Phases | CNN | RNN | GNN | GAN | RL | TR | TCN |
|---|---|---|---|---|---|---|---|---|---|
| 1 | [110] | 1, 4, 6 | ✔ | ✔ | × | × | × | × | × |
| 2 | [111] | 1, 4, 6 | ✔ | ✔ | × | × | × | × | × |
| 3 | [112] | 1, 4, 6 | ✔ | ✔ | × | ✔ | ✔ | × | × |
| 4 | [114] | 1, 4, 6 | ✔ | ✔ | × | × | ✔ | × | × |
| 5 | [62] | 1, 4, 6 | ✔ | ✔ | × | × | × | × | × |
| 6 | [115] | 1, 4, 6 | ✔ | ✔ | × | × | × | ✔ | × |
| 7 | [116] | 1, 4, 6 | ✔ | ✔ | × | × | × | × | × |
| 8 | [117] | 1, 4, 6 | ✔ | ✔ | × | × | ✔ | × | × |
| 9 | [118] | 1, 4, 6 | ✔ | ✔ | × | × | × | ✔ | × |
| 10 | [120] | 1, 4, 6 | ✔ | ✔ | ✔ | × | × | × | × |
| 11 | [65] | 1, 4, 6 | ✔ | ✔ | × | × | × | × | × |
| 12 | [164] | 1, 4, 6 | ✔ | ✔ | × | ✔ | ✔ | × | × |
| 13 | [165] | 1, 4, 6 | ✔ | ✔ | × | × | ✔ | ✔ | × |
| 14 | [121] | 1, 4, 6 | ✔ | × | × | × | × | ✔ | × |
| 15 | [166] | 1, 4, 6 | ✔ | ✔ | × | × | × | × | × |
| 16 | [167] | 1, 4, 6 | ✔ | ✔ | × | × | × | × | × |
| 17 | [168] | 1, 4, 6 | ✔ | ✔ | ✔ | × | × | × | ✔ |
| 18 | [122] | 1, 4, 6 | ✔ | ✔ | × | × | × | × | × |
| 19 | [64] | 1, 4, 6 | ✔ | ✔ | × | × | × | × | × |
| 20 | [101] | 1, 4, 6 | ✔ | ✔ | × | × | × | ✔ | × |
| 21 | [169] | 1, 4, 6 | ✔ | ✔ | × | × | × | × | × |
| 22 | [170] | 1, 4, 6 | ✔ | ✔ | × | × | × | × | × |
| Name of Metric | Developed to Evaluate | Technique |
|---|---|---|
| BLEU [125] | Automatic translation | n-gram accuracy |
| METEOR [126] | Automatic translation | n-gram with matching of synonyms |
| ROUGE [180] | Documentation summary | n-gram recall |
| SPICE [127] | Image description | Scene-to-synonym correspondence |
| CIDEr [128] | Image description | tf-idf weighted n-gram correlation |
| Dataset | Description | References |
|---|---|---|
| VIST [110] (2016) | 40,098 train, 4988 validation, and 5050 test samples | [65,101,110,111,112,113,114,115,116,117,120,164,165,167,181] |
| VIST-Edit1 [181] (2019) | 14,905 human-edited versions of 2981 generated stories | [115,121,165,181] |
| AESOP [182] (2021) | 7062 stories containing 21,186 abstract visual scenes with corresponding text | [182] |
| VHED [183] (2022) | 11,208 train, 1351 validation, and 1316 test samples | [183] |
| Cooking [173] (2019) | 16,441 recipes with 160,479 photos with 80% train, 10% validation, and 10% test | [173,174,175,185,186] |
| Recipe1M+ [184] (2019) | Over 1 million recipes and 13 million food images | [184,187,188] |
Disclaimer/Publisher’s Note: The statements, opinions and data contained in all publications are solely those of the individual author(s) and contributor(s) and not of MDPI and/or the editor(s). MDPI and/or the editor(s) disclaim responsibility for any injury to people or property resulting from any ideas, methods, instructions or products referred to in the content. |
© 2023 by the authors. Licensee MDPI, Basel, Switzerland. This article is an open access article distributed under the terms and conditions of the Creative Commons Attribution (CC BY) license (https://creativecommons.org/licenses/by/4.0/).
Share and Cite
Lotfi, F.; Beheshti, A.; Farhood, H.; Pooshideh, M.; Jamzad, M.; Beigy, H. Storytelling with Image Data: A Systematic Review and Comparative Analysis of Methods and Tools. Algorithms 2023, 16, 135. https://doi.org/10.3390/a16030135
Lotfi F, Beheshti A, Farhood H, Pooshideh M, Jamzad M, Beigy H. Storytelling with Image Data: A Systematic Review and Comparative Analysis of Methods and Tools. Algorithms. 2023; 16(3):135. https://doi.org/10.3390/a16030135
Chicago/Turabian StyleLotfi, Fariba, Amin Beheshti, Helia Farhood, Matineh Pooshideh, Mansour Jamzad, and Hamid Beigy. 2023. "Storytelling with Image Data: A Systematic Review and Comparative Analysis of Methods and Tools" Algorithms 16, no. 3: 135. https://doi.org/10.3390/a16030135
APA StyleLotfi, F., Beheshti, A., Farhood, H., Pooshideh, M., Jamzad, M., & Beigy, H. (2023). Storytelling with Image Data: A Systematic Review and Comparative Analysis of Methods and Tools. Algorithms, 16(3), 135. https://doi.org/10.3390/a16030135