Abstract
This article introduces a novel nature-inspired algorithm called the Plum Tree Algorithm (PTA), which has the biology of the plum trees as its main source of inspiration. The PTA was tested and validated using 24 benchmark objective functions, and it was further applied and compared to the following selection of representative state-of-the-art, nature-inspired algorithms: the Chicken Swarm Optimization (CSO) algorithm, the Particle Swarm Optimization (PSO) algorithm, the Grey Wolf Optimizer (GWO), the Cuckoo Search (CS) algorithm, the Crow Search Algorithm (CSA), and the Horse Optimization Algorithm (HOA). The results obtained with the PTA are comparable to the results obtained by using the other nature-inspired optimization algorithms. The PTA returned the best overall results for the 24 objective functions tested. This article presents the application of the PTA for weight optimization for an ensemble of four machine learning regressors, namely, the Random Forest Regressor (RFR), the Gradient Boosting Regressor (GBR), the AdaBoost Regressor (AdaBoost), and the Extra Trees Regressor (ETR), which are used for the prediction of the heating load and cooling load requirements of buildings, using the Energy Efficiency Dataset from UCI Machine Learning as experimental support. The PTA optimized ensemble-returned results such as those returned by the ensembles optimized with the GWO, the CS, and the CSA.
1. Introduction
The nature-inspired optimization research field evolved a lot in recent years, and its sources of inspiration are various, ranging from swarm intelligence [1] to the laws of physics [2]. Nature-inspired optimization algorithms are often used as an alternative to mathematical methods to solve global optimization problems in various domains, such as finance [3], engineering [4], data mining [5], and other areas. Their main advantage is that they lead to good optimal solutions using reasonable computational resources. Several representative classes that can be distinguished among nature-inspired algorithms [6] are swarm intelligence methods [7], evolutionary computation approaches [8], and the algorithms which have the laws of physics and biology as their main source of inspiration [9].
Methods in the swarm intelligence class represent solutions as swarm members that exchange information during the search process. The exchanged information is related to the properties of the swarm leaders, which are either global leaders or local leaders. This class includes algorithms such as the Particle Swarm Optimization (PSO) algorithm [10], the Elephant Herding Optimization (EHO) algorithm [11], the Whale Optimization Algorithm (WOA) [12], the Spotted Hyena Optimizer (SHO) [13], and the Horse Herd Optimization Algorithm (HHOA) [14].
Approaches in the evolutionary computation class associate the search process to the evolution of a set of solutions called the population. Representative algorithms of this class are the Genetic Algorithms (GA) [15], the Differential Evolution (DE) algorithm [16], the Scatter Search (SS) algorithm [17], and the Invasive Weed Optimization (IWO) algorithm [18].
The algorithms inspired by the laws of biology and physics include a selection of algorithms which imitate the biological and physical processes of the nature. This class is represented by algorithms such as Harmony Search (HS) [19], the Gravitational Search Algorithm (GSA) [20], the Fireworks Algorithms (FA) [21], and the Spiral Dynamics Algorithm (SDA) [22].
Table 1 presents a selection of representative nature-inspired algorithms for each year from the period 2005–2022.

Table 1.
Representative Nature-Inspired Algorithms for 2005–2022.
As shown in the table, the sources of inspiration are various, ranging from the behaviors of specific birds or mammals to processes related to flower pollination or to trees’ competition for light. Moreover, the big number of nature-inspired algorithms proposed in recent years demonstrates that the nature-inspired optimization research field is still an open research field with a variety of challenges.
The applications of nature-inspired algorithms are various. The authors of [41] considered an algorithm based on the Glowworm Swarm Optimization (GSO) algorithm [42] and the Bacterial Foraging Optimization (BFO) algorithm [43] for multi-objective optimization. The approach presented in [44] introduced a novel algorithm named the Pelican Optimization Algorithm (POA), which was applied in engineering problems such as the pressure vessel design problem and the welded beam design problem. Another approach, the one presented in [45], considered a binary version of the HOA with applications in feature selection for classification problems. Nature-inspired algorithms were also considered in research fields such as image processing [46], pattern recognition [47], data mining [48], and video compression [49].
The application of these machine learning models in real systems is crucial to achieve smart building control and performant energy efficiency, as demonstrated in [50], in which the authors considered current practical issues related to the application of machine learning models to building energy efficiency. Moreover, the application of ensemble learning received a lot of attention in building energy prediction recently [51] because it returned predictions which were more stable and accurate than the ones returned by using conventional methods based on a single predictor. Using the building energy prediction data from an institutional building located at the University of Florida as experimental support, the authors of [51] demonstrated the feasibility of a method based on an exhaustive search when identifying the optimal ensemble learning model. The building environment sector is responsible for approximately one-third of the world’s energy consumption; therefore, seeking solutions that aim to reduce the demands of the building energy is an important research direction in the context of the mitigation of adverse environmental impacts [52].
In addition to the application of machine learning techniques to improve energy efficiency estimation, the research community also considered approaches to improve energy storage devices. In [53], the authors proposed a solution based on a mechanically interlocked network (MIN) in a Li anode, which promises future success in battery fields that suffer from volume variations. As shown in [54], the lithium metal batteries which use solid electrolytes are expected to become the next generation of lithium batteries. Another challenge related to lithium-ion batteries is the accurate prediction of their lifetime in the context of the acceleration of their technological applications and advancements [55].
The main objective of this paper is the proposal of a novel nature-inspired algorithm with applications in a wide range of engineering problems. The energy efficiency estimation problem was selected as a representative use-case for the application of the proposed algorithm because of the importance of energy research in the context of climate change’s near-future impact as well as because the application of ensemble learning to building energy efficiency prediction attracted much attention in the research community in recent years.
The main contributions of the article are:
- (1)
- A critical review of the nature-inspired approaches applied to machine learning ensemble optimization;
- (2)
- An overview of the application of machine learning approaches to energy efficiency estimation;
- (3)
- The proposal of a novel nature-inspired algorithm called the Plum Tree Algorithm (PTA), which has the biology of the plum tree as its main source of inspiration;
- (4)
- The evaluation and the validation of the PTA using 24 benchmark functions and the comparison of the results to the results obtained by using the Chicken Swarm Optimization (CSO) algorithm [56], the PSO algorithm, the Grey Wolf Optimizer (GWO) [57], the CS algorithm, the CSA, and the HOA;
- (5)
- The application of the PTA to weight optimization for an ensemble of four algorithms for energy efficiency data prediction using the Energy Efficiency Dataset from the UCI Machine Learning repository [58,59];
- (6)
- The comparison of the results obtained using the PTA ensemble approach to the ones based on other nature-inspired algorithms and to the results obtained in other research studies.
The article has the following structure. Section 2 presents the research background. Section 3 presents the Plum Tree Algorithm (PTA), including its sources of inspiration and its main steps. Section 4 presents the results obtained after the comparison of the PTA to six nature-inspired algorithms using 24 benchmark objective functions. Section 5 presents the application of the PTA to weight optimization for an ensemble of four regressors used for energy efficiency estimation. Section 6 presents a discussion and compares the results to the ones obtained using other methods. Finally, Section 7 presents conclusions and future research directions.
2. Background
The research background section is organized into three subsections. The first subsection reviews the application of nature-inspired algorithms to the optimization of machine learning ensembles, the second section presents representative studies which considered the application of machine learning techniques to energy efficiency estimation, and the third section presents the contribution of this paper with respect to previous research.
2.1. Nature-Inspired Algorithms for Machine Learning Ensemble Optimization
The authors of [60] considered the application of ensemble and nature-inspired machine learning algorithms for driver behavior prediction. The three classifiers applied were the Support Vector Machine (SVM) algorithm, the K-Nearest Neighbors (K-NN) algorithm, and the Naïve Bayes (NB) algorithm. Initially, the performance of the classifiers was improved using techniques such as voting ensemble, bagging, and boosting. Then, four nature-inspired algorithms were applied to improve the results. These four algorithms were as follows: the PSO algorithm, the GWO, the WOA, and the Ant Lion Optimizer (ALO) [61]. The results showed that the best approach was the GWO-voting approach, which had an accuracy of 97.50%.
The approach presented in [62] analyzed driver performance considering a learning technique based on weighted ensembles and nature-inspired algorithms. The applied ensemble technique was the Extreme Learning Machine (ELM) algorithm, and the combined classifiers were the Generalized Linear Model (GLM), the K-NN algorithm, and the Linear Discriminant Analysis (LDA) algorithm. The applied nature-inspired algorithms were the GA, the Grasshopper Optimization Algorithm (GOA) [63], and the binary BA. Compared to the other models proposed in that approach, the model that was based on the hybrid nature-inspired ELM algorithm led to the highest performance metrics.
In [64], the authors applied an ensemble method based on the SVM, the K-NN, and the PSO to improve the accuracy of intrusion detection. The obtained results suggested that the novel approach was better than the Weighted Majority Algorithm (WMA) [65] in terms of accuracy. The approach presented in [66] applied a WOA-based ensemble using the SVM and the K-NN for the classification of the diabetes based on data collected from medical centers from Iran. The WOA ensemble classifier improved the best preceding classifier by about 5%.
The authors of [67] proposed a method based on an improved version of the PSO combined with the Adaptive Boosting (AdaBoost) [68] ensemble algorithm for the classification of imbalanced data. The experimental results showed that the proposed method was effective in the processing of the data characterized by a high imbalance rate. Another approach, the one considered in [69], proposed an ensemble system based on the modified AdaBoost with area under the curve (M-AdaBoost-A) classifier, which was optimized using strategies such as the PSO. The proposed approach returned performant results both for 802.11 wireless and for traditional enterprise intrusion detection.
2.2. Machine Learning Approaches to Energy Efficiency Estimation
Energy efficiency estimation using machine learning techniques was considered in the literature from different perspectives. Moreover, the literature contains a variety of review studies which focus on the application of machine learning techniques to energy performance, such as the ones presented in [70,71].
In [72], the authors proposed an estimation model for heating energy demand in which a methodology based on a two-layer approach was developed using a database of approximately 90,000 Energy Performance Certificates (EPCs) of flats from Italy’s Piedmont region. The proposed methodology consisted of two layers: the classification layer, which was used to estimate the segment of energy demand, and the regression layer, which was used to estimate the Primary Energy Demand (PED) of the flat. The four algorithms which were used and compared in both layers were the Decision Tree (DT) algorithm, the Support Vector Machine (SVM) algorithm, the Random Forest (RF) algorithm, and an Artificial Neural Network (ANN). Another approach, the one presented in [73], considered the application of two ANNs, one for actual energy performance and another for key economic indicators. The data was collected from the energy audits of 151 public buildings from four regions of South Italy. The prediction of their energy performance was done using a decision support tool based on these two ANNs.
In [74], an ensemble learning technique method was applied to energy demand prediction in the case of the residential buildings. The data was collected from residential buildings located in Henan, China. The applied model was used to forecast the heating load 2 h ahead. The ensemble learning method combined the algorithms Extreme Learning Machine (ELM), Extreme Gradient Boosting (XGB), and Multiple Linear Regression (MLR) with the Support Vector Regression (SVR) algorithm to obtain a model that was more accurate. The authors of [75] considered a PSO-based ensemble learning approach for the energy forecast. The proposed optimized ensemble model was used for the management of the smart home energy consumption. The PSO algorithm was used to fine-tune the hyper-parameters of the ensemble model. The results showed that the performance of the optimized ensemble was better than the performance of both the non-optimized ensemble and the individual models.
The authors of [76] developed an ensemble machine learning model for the prediction of building cooling loads. The model was created and evaluated using data from 243 buildings. The results show that cooling loads can be predicted quickly and accurately in the early design stage. Energy demand management was approached in [77] using a method based on a weighted aggregated ensemble model. The ensemble consisted of the weighted linear aggregation of the Least Square Boosted Regression Trees (LSB) and Gaussian Process Regression (GPR) algorithms, and the design parameters were evaluated using the Marine Predators Algorithm (MPA) [78].
Building energy prediction was approached in [79] using energy consumption pattern classification. The DT algorithm was used for mining energy consumption patterns and classifying energy consumption data, whereas ensemble learning was used to establish energy consumption prediction models for the patterns. The data used in the work was hourly meteorological data collected from a meteorological station, and the energy consumption data was collected from an office building from New York City.
2.3. Contributions with Respect to Previous Research
Compared to the method presented in [80], where ensembles of ANN were used for the prediction of smart grid stability, the ensemble proposed in this manuscript consists of four regressors. The same objective function for the evaluation of the performance of the ensembles was considered, but the results were compared to more nature-inspired algorithm-based ensembles, using 30 runs for each fold.
The authors of [81] approached the problem of energy efficiency estimation using the same experimental dataset as the one used in this manuscript. However, they focused on heating predictions only rather than on both cooling and heating predictions. Even though they used nature-inspired algorithms such as the Firefly Algorithm (FA) [82], the Shuffled Complex Evolution (SCE) algorithm [83], the Optics-Inspired Optimization (OIO) algorithm [84], and the Teaching–Learning-Based Optimization (TLBO) algorithm [85], those algorithms were used to tune the hyper-parameters of an ANN rather than to tune ensembles of regressors such as in the approach presented in this article. The conclusions of the authors showed that the prediction results were performant and better than the results obtained by using state-of-the-art algorithms.
The approach presented in [86] applied the Shuffled Frog Leaping Algorithm (SFLA) [87] in the tuning of the hyper-parameters of a Regression Tree Ensemble (RTE), which was an approach proposed for the accurate prediction of heating loads and cooling loads. Compared to other methods presented in the article, the SFLA-based approach showed the best results in terms of evaluation metrics.
In [88], the PSO algorithm was applied to improve the performance of the Extreme Gradient Boosting Machine (XGBoost) algorithm [89] used in the prediction of heating loads. The PSO-based approach returned better results compared to classical state-of-the-art approaches. However, the authors of the study focused only on the prediction of the heating load like the approach in [81]. Similar to the approach presented in this article, 80% of the dataset was considered in the training phase, and 20% was considered in the testing phase. On the other hand, that approach also considered a re-sampling method based on 10-fold cross-validation to reduce errors.
3. Plum Tree Algorithm
The plum is a fruit of the Prunus species, a genus of trees which also includes peach, cherry, nectarine, almond, and apricot trees. Plums have a lot of health benefits. They contain a lot of nutrients, are rich in antioxidants, promote bone health, and help lower blood sugar. Several statistics mention China and Romania as the top two largest plum producers.
Figure 1 shows a representative illustration of plum flowers.
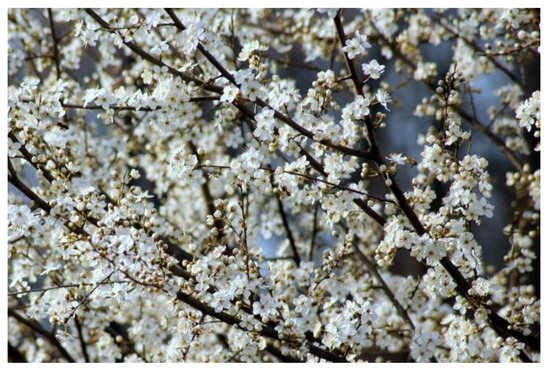
Figure 1.
Representative Illustration of Plum Flowers.
Figure 2 shows a representative illustration of a bunch of plums.
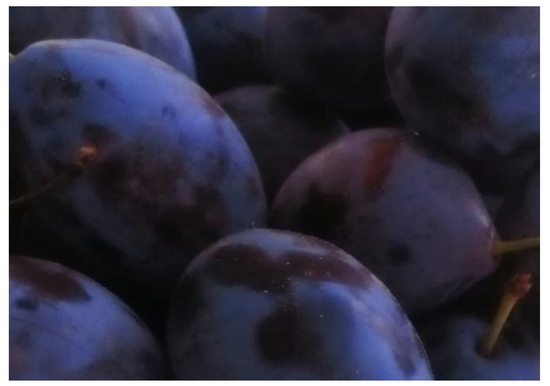
Figure 2.
Representative Illustration of a Bunch of Plums.
The main sources of inspiration for the PTA are as follows:
- The flowering of the plum trees in the early spring;
- The transformation of the pollinated flowers to plums;
- The plums drop before maturity by 20–30% due to various reasons or diseases, such as diseases caused by plant viruses [90];
- The plums have a shelf life of around 2–6 weeks, even when they are stored at 0 °C [91].
The PTA implements these sources of inspiration as follows: the positions of the flowers and the positions of the plums are represented as matrices, the dropping of the plums before maturity is represented by a fruitiness threshold (), and the shelf life of the plums after they are collected is represented by a ripeness threshold (). The two thresholds lead to the development of three types of equations to update the positions of the flowers.
The PTA presents similarities with other bio-inspired algorithms which were also sources of inspiration. The PTA was inspired by the CSO algorithm in the use of a Gaussian distribution to update the positions of the flowers and the use of a random number from a range bounded by the minimum fruitiness rate () and the maximum fruitiness rate (). The PTA was inspired by the PSO algorithm in the development of the equations that update the positions of the flowers. Another source of inspiration is the GWO in the sense that these equations consider the best and second-best positions determined so far. The PTA describes these positions as the ripe position and the unripe position, respectively. The CSA inspired the PTA in the use of an additional data structure for the flowers, the updating of the plums in each iteration considering the best values between the current positions of the plums and the new positions of the flowers, and the use of a random numerical value in the range of to distinguish between the three types of equations to update the positions of the flowers.
Figure 3 presents the high-level overview of the PTA.
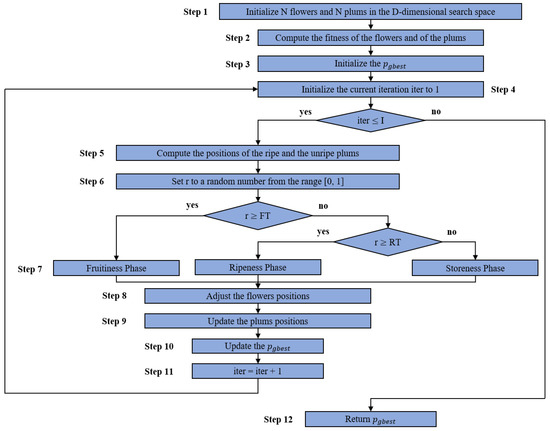
Figure 3.
PTA High-Level View.
The PTA starts with the initialization of flowers and plums in the -dimensional search space (Step 1). Initially, the positions of the plums have the same values as the positions of the flowers. The fitness values of the flowers and the plums are computed in Step 2, and the is initialized to the position of the plum which has the best fitness value (Step 3). The current iteration has the value 1 initially (Step 4). The instructions from Step 5–Step 11 are performed times, where is the number of iterations. The positions of the ripe and the unripe plums correspond to the positions of the plums with the best and the second-best fitness values, respectively (Step 5). According to the value of a random number r in the range of (Step 6), the positions of the flowers are updated according to the fruitiness phase, the ripeness phase, or the storeness phase equations using Formulas (3), (4), and (5) and (6), respectively (Step 7). The three phases are delimited by their and thresholds. The flowers’ positions are adjusted to be within the limits of the search space (Step 8), and the positions of the plums are updated using Formula (7) (Step 9). The is updated if there exists a plum which has a better fitness value (Step 10), the current iteration is incremented by 1 (Step 11), and the algorithm returns the value after all iterations have been performed (Step 12).
The pseudo-code of the PTA is presented below (see Algorithm 1).
| Algorithm 1 PTA | |
| 1: | Input |
| 2: | Output |
| 3: | initialize flowers in the -dimensional space with values from |
| 4: | initialize plums to the positions of the flowers |
| 5: | apply to compute the fitness of the plums and the flowers and update |
| 6: | for to do |
| 7: | compute the ripe position |
| 8: | compute the unripe position |
| 9: | for each flower do |
| 10: | update to a random number from the range [0, 1] |
| 11: | if then |
| 12: | update the flower using formula (3) |
| 13: | else if then |
| 14: | update the flower using formula (4) |
| 15: | else |
| 16: | update the flower using the formulas (5)–(6) |
| 17: | end if |
| 18: | adjust the flowers to be in the range |
| 19: | end for |
| 20: | for each plum do |
| 21: | update the plum using formula (7) |
| 22: | end for |
| 23: | update the |
| 24: | end for |
| 25: | return |
The input of the PTA is represented by the following parameters: —the number of iterations, —the number of dimensions, —the number of plums, —the fruitiness threshold, —the ripeness threshold, —the minimum fruitiness rate, —the maximum fruitiness rate, —a constant for avoiding division by zero, —the objective function, —the minimum possible value of the position, and —the maximum possible value of the position. The output of the PTA is , the global best plum position.
flowers are initialized in (line 3) in the -dimensional search space with values from the range :
and plums are initialized in (line 4) with the values of the flowers:
The fitness values of the flowers and plums are computed in (line 5) using the , and the value of the global best plum is updated to the position of the plum which has the best fitness value.
The instructions from the (lines 7–23) are performed times, such that describes the value of the current iteration.
The ripe position is updated to the position of the plum with the best fitness value (line 7), whereas the unripe position is updated to the position of the plum with the second-best fitness value (line 8).
The positions of the flowers are given as , where are updated in (lines 10–18) considering the value of a random number within the range of (line 10).
If the value of is greater than or equal to (line 11), then the position of the flower is updated using the following formula:
such that returns uniformly a number from the range .
If the value of is less than and greater than or equal to (line 13), then the position of the flower is updated as follows:
where and are random numbers within the range of , and and are the ripe position and the unripe position, respectively.
If the value of is less than (line 15), then the flower updates its position using the formula:
such that is a Gaussian distribution which has the mean 0 and the standard deviation σ2, which is defined by the formula:
where is a constant used to avoid division by .
The flowers are adjusted to be in the range of (line 18) such that if , then , and if , then , where .
The position of each plum is updated in (lines 20–22) as follows:
The value of the global best plum is updated in (line 23) to the position of the plum which has the best fitness value according to the objective function OF. Finally, the algorithm returns the value (line 25).
4. Results
The PTA was evaluated and compared to the CSO algorithm, the PSO algorithm, the GWO, the CS algorithm, the CSA, and the HOA using 24 objective functions. Out of the 24 objective functions, 23 were from the EvoloPy library [92,93,94], whereas one was from [95]. The implementations of the PSO algorithm, the GWO, and the CS algorithm were the ones from the EvoloPy library, whereas the implementations of the CSO algorithm, the CSA, and the HOA were developed in-house.
The CSO algorithm version used in experiments was an adapted version in which the equations for the updating of the positions of the hens were modified such that the values of the and parameters were set to 1 in cases in which the fitness of the hen was better than the fitness of the associated rooster or hen, respectively. The mother hens were considered to be the top MP (mothers percent) hens.
The experiments were written in Python using the EvoloPy library and a machine with the following properties: Intel(R) Core(TM) i7-7500U CPU processor, 8.00 GB installed RAM, 64-bit operating system, and Windows 10 Pro N operating system.
Table 2, Table 3 and Table 4 present the unimodal objective functions, the high-dimensional multi-objective functions, and the fixed-dimensional multimodal objective functions, respectively.

Table 2.
Unimodal Objective Functions (Objective Functions ).

Table 3.
High-Dimensional Multi-Objective Functions (Objective Functions ).

Table 4.
Fixed-Dimensional Multimodal Objective Functions (Objective Functions ).
For each algorithm and objective function, 30 runs were performed. The number of iterations was set to 1000, and the population size was set to 50 for all runs.
Table 5 presents the specific configurations of the nature-inspired algorithms used in the experiments.

Table 5.
Nature-Inspired Algorithms’ Specific Configurations.
The configuration parameters of the PSO algorithm, the GWO, and the CS algorithm were the ones from the EvoloPy library, whereas those of the CSO algorithm, the CSA, and the HOA were taken from the original articles which introduced them.
The configuration parameters of the PTA were selected after a series of in-house experiments. They were inspired by the configuration parameters of other nature-inspired algorithms, especially by those of the CSO algorithm. Therefore, their values were similar to the state-of-the-art values.
Figure 4 presents the boxplot charts for the objective functions and , and Figure 5 presents the boxplot charts for the objective functions .
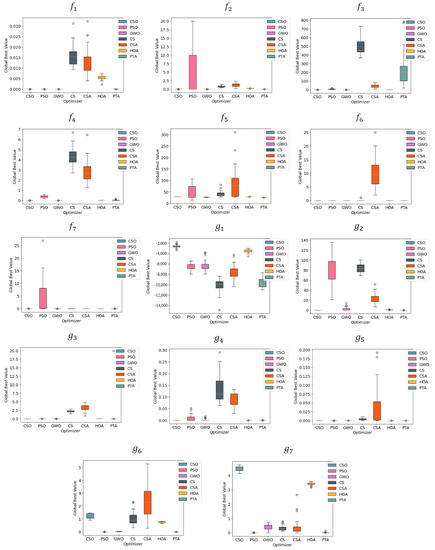
Figure 4.
Boxplot Charts for the Objective Functions
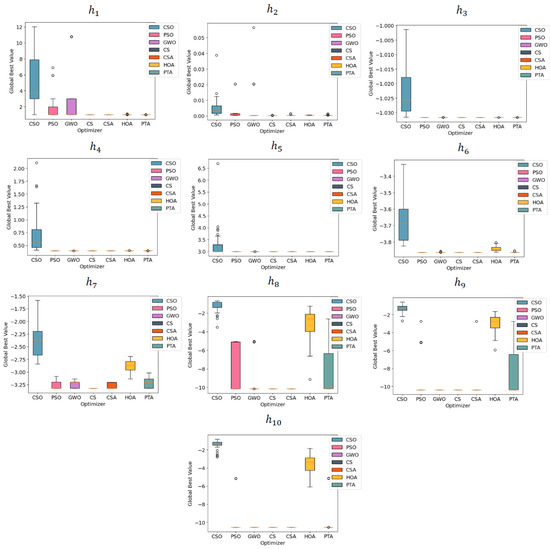
Figure 5.
Boxplot Charts for the Objective Functions
The PTA showed large variations for , , and . It also showed a larger deviation from the optimal solution in the case of these three objective functions. One of the reasons for this is represented by the values of the configuration parameters. The default values of the PTA configuration parameters were inspired by those used by the algorithms which were its sources of inspiration; this is why it returned overall good results with few exceptions. For example, when FT and RT were set to 0.5 and 0.3, respectively, the results for are 10.76859 as the mean and 15.47429 as the standard deviation (std), the results for are a mean of −10.1531 and a std of 0.000252, and the results for are a mean of −10.4027 and a std of 0.044829.
Figure 6 presents the convergence charts for the objective functions and , and Figure 7 presents the convergence charts for the objective functions .
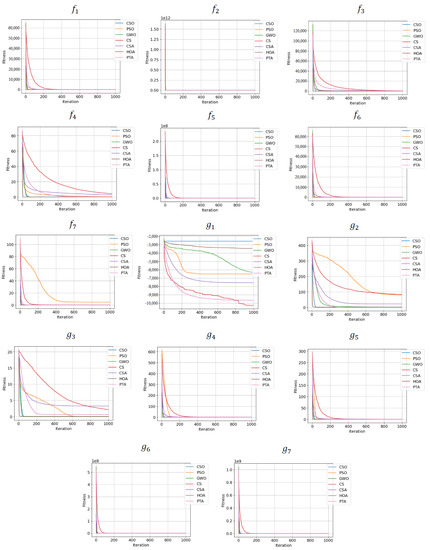
Figure 6.
Convergence Charts for the Objective Functions and
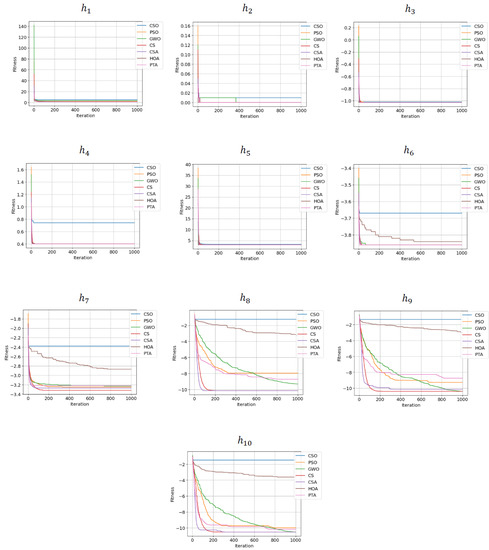
Figure 7.
Convergence Charts for the Objective Functions
Table 6 presents the mean and the std results for each of the objective functions , , and .

Table 6.
Mean and Standard Deviation Results Summary.
Table 7 presents the summarized comparison of the results from Table 6 in terms of performance ranking in which better ranks are assigned to the best solutions by using an approach like the one presented in [96]. The best rank was considered to be 1, and in the cases in which two solutions had the same value, they were assigned the same rank. The last row of the table presents the results when the same index computation, namely, the mean rank and the rank, was applied for all 24 benchmark objective functions.

Table 7.
Rank Comparison Results Summary.
As shown in Table 7, the PTA returned results comparable or even better than the ones returned from the other nature-inspired algorithms. It ranked third for , first for , and fourth for . When the mean rank and the rank were computed for all objective functions, the PTA had the best rank.
Different experiments with other values for the configuration parameters showed better results for the PTA for some objective functions. When FT and RT were set to 0.5 and 0.3, respectively, the PTA ranked second for the functions . However, the differences were insignificant for the other two groups, namely, and , for which it ranked third and first, respectively, as when the default values were used.
The PTA was designed to return good results across all 24 benchmark objective functions rather than to return the best results for each group of functions; this is the principal reason why it did not return the best results for and under the default configurations.
5. PTA and Machine Learning Ensembles for Energy Efficiency Estimation
This section is organized into four subsections. The first subsection presents the data used as experimental support, namely, the Energy Efficiency Dataset from the UCI Machine Learning repository. The second subsection presents the PTA application for the machine learning ensembles for the estimation of the energy efficiency. The third subsection presents the data standardization adaptation of the PTA ensemble-based energy efficiency estimation methodology. The fourth subsection presents the energy efficiency estimation results.
5.1. Energy Efficiency Dataset Description
The Energy Efficiency Dataset is characterized by 768 instances, 8 attributes, and 2 responses. The data was obtained using 12 building shapes, which were simulated in Ecotect. Table 8 presents the summary of the attributes’ information.

Table 8.
Energy Efficiency Dataset Attribute Information Summary.
The features X1–X8 describe the attributes, whereas the features Y1–Y2 describe the responses.
5.2. PTA for Ensemble Weight Optimization for Energy Efficiency Estimation
Figure 8 presents the PTA methodology for ensemble weight optimization used in the estimation of energy efficiency.
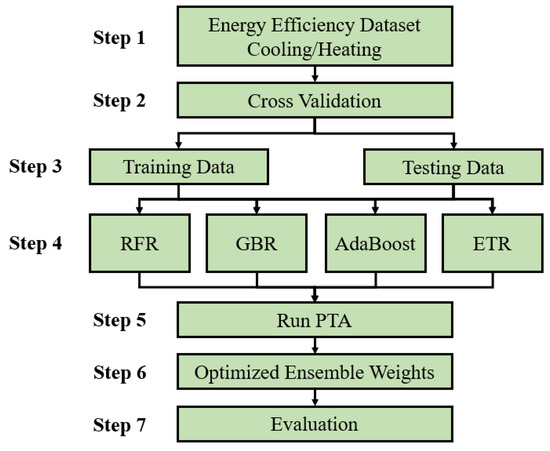
Figure 8.
PTA Methodology for Ensemble Weight Optimization for Energy Efficiency Estimation.
The steps of the methodology are as follows:
- Step 1.
- The input is the Energy Efficiency Dataset. The data samples of the original dataset are shuffled randomly. Two datasets are derived from this dataset, namely, the Cooling Dataset and the Heating Dataset, depending on the column used for the prediction. The Cooling Dataset does not contain the Y1 column, whereas the Heating Dataset does not contain the Y2 column.
- Step 2.
- In the cross-validation phase, fivefold cross validation is used. Table 9 presents a summary of the number of samples of each fold.
 Table 9. Cooling Dataset and Heating Dataset Folds Summary.
 - Step 3.
- The Training Data and the Testing Data are represented by 80% and 20% of the total samples, respectively. In each of the five cases, the Testing Data is represented by one distinct fold from the five folds, whereas the Training Data is represented by the remaining four folds.
- Step 4.
- The four algorithms of the ensemble are the Random Forest Regressor (RFR), the Gradient Boosting Regressor (GBR), the AdaBoost Regressor (AdaBoost), and the Extra Trees Regressor (ETR). The implementations of these regressors are the ones from the sklearn.ensemble library, and their default configurations are used. The only parameter which is overwritten was the random_state, which is set to an arbitrary constant, namely 42, to obtain reproducible research results.
- Step 5.
- The original PTA is adapted to compute the weights of the ensemble. The number of dimensions of the search space is set to 4, a value equal to the number of the algorithms of the ensemble.
Then, for each plum Pi, where is the index of the plum, the partial weights are computed using the following formula:
whereas the ensemble weights are computed using the following formula:
Considering the values of , , , and predicted by using the RFR, GBR, AdaBoost, and ETR, respectively, as well as the values of the Standardized Testing Data, and the number of samples of the Standardized Testing Data, the objective function has the following formula:
such that:
- Step 6.
- The optimized ensemble weights are the ones which are computed from the value.
- Step 7.
- The ensemble is evaluated using the Root-Mean-Square Error (RMSE), R-squared (), the Mean Absolute Error (MAE), and the Mean Absolute Percentage Error (MAPE), represented by Formulas (12)–(15), respectively:such that represents the values predicted by the ensemble, and is defined as:
5.3. Data Standardization Adaptation
The PTA methodology presented in Figure 8 was adapted such that the training data and the testing data were standardized to obtain better predictability. The z-score was used for the standardization of the Training Data, the Testing Data was standardized using the values of the mean and the standard deviation computed in the standardization of the Training Data, and the resulting Standardized Training Data and Standardized Testing Data were used as input for the components of the ensemble and in the evaluation of the performance of the predictions. The resulted standardized data were called the Standardized Cooling Dataset and the Standardized Heating Dataset, respectively.
5.4. Energy Efficiency Estimation Results
The energy efficiency estimation experiments were performed using the sklearn package. The values of the specific configuration parameters of the PTA were the default ones presented in Table 5. Table 10 summarizes the adapted parameters of the PTA for the optimization of the ensemble weights.

Table 10.
PTA-Adapted Parameters for Ensemble Weight Optimization Summary.
For each dataset used in the experiments, namely, the Cooling Dataset and the Heating Dataset, and for each configuration resulting from the cross-validation operation, 30 runs were performed. The total number of runs was equal to .
The std values were either zero or a very small number for both the Cooling Dataset and the Heating dataset; therefore, the mean values of the RMSE, R2, MAE, and MAPE were also the best ones.
Figure 9 presents the summary of the mean RMSE results.
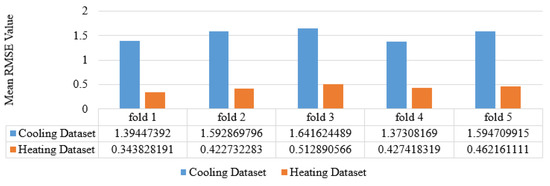
Figure 9.
PTA Ensemble Mean RMSE Results Summary.
The best mean results for the Cooling Dataset and the Heating Dataset were returned for fold 4 and fold 1, respectively. Another remark is that the mean RMSE results were much better for the Heating Dataset for all five folds.
Figure 10 presents the detailed results summary that corresponds to the runs which resulted in the best RMSE values. The values for the , MAE, and MAPE were equal in each of the 30 runs for each fold; therefore, the results were the same when the best values of these indicators were used as selection criteria for the most representative runs.
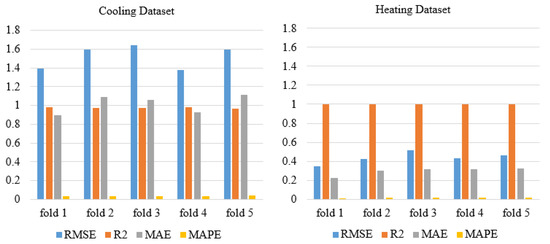
Figure 10.
PTA Ensemble Detailed Evaluation Metrics Results Summary for the Best RMSE Values.
The detailed results for each fold show that the prediction results were comparable for the two datasets for each fold, which means that the PTA ensembles’ optimization models fit the data well for both datasets and for all folds. The best MAE and MAPE results were obtained for the Heating Dataset for all folds.
Figure 11 presents a comparison of the running times of the runs which resulted in the best RMSE values.
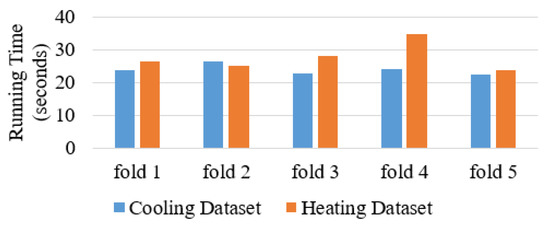
Figure 11.
PTA Ensemble Running Time Results Summary.
The running time results varied more for the Heating Dataset than for the Cooling Dataset. The differences are justified by the different durations required to train each regressor of the ensemble.
Figure 12 presents the weight results for each algorithm of the ensemble for each fold.
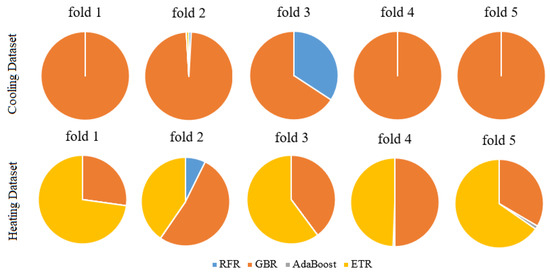
Figure 12.
PTA Ensemble Weights Summary.
As can be seen in the figure, the PTA-optimized ensemble weights varied more in the case of the Heating Dataset than in the case of the Cooling Dataset. Although the GBR received the highest weight for each fold, the AdaBoost received a weight equal to zero for each fold of the Cooling Dataset. On the other hand, the ETR received the highest weight for three out of the five folds, whereas AdaBoost received non-zero weights for fold 4 and fold 5 of the Heating Dataset.
6. Discussions
This section compares the results obtained using the PTA-based method considering the following performance factors: (1) the application of the data standardization procedure, (2) the results obtained by the average ensemble and the individual components of the ensemble, and (3) the results obtained by other nature-inspired algorithm-based ensembles. Finally, the last subsection presents a comparison to representative results obtained in other research studies.
6.1. Data Standardization Results
The application of data standardization led to much better results in terms of RMSE. Figure 13 presents the detailed results summary for the runs which led to the best RMSE values. The results were almost identical when other indicators were considered as selection criteria for the most representative runs.
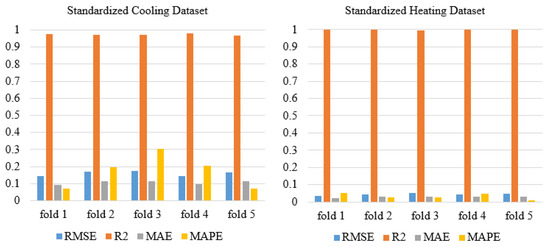
Figure 13.
PTA Ensemble Detailed Evaluation Metrics Results Summary for the Best RMSE Values when Data Standardization is Applied.
The prediction results were much better for the Standardized Heating Dataset than for the Standardized Cooling Dataset for each fold, as shown in the Heating Dataset and Cooling Dataset energy prediction results. The values of were close to 1, which means that predictability performance was similar for both standardized datasets. Regarding running time, the average running times for the best runs for the Standardized Cooling Dataset and Standardized Heating Dataset were 29.35312 s and 24.94228 s, respectively. These values are slightly higher than when no standardization was applied, which can be justified by the time required to standardize the data and the way in which the algorithms behave when the data is standardized.
Figure 14 presents the weights of each algorithm of the ensemble for each fold when data standardization is applied. These weights are the ones which correspond to the best runs in terms of RMSE.
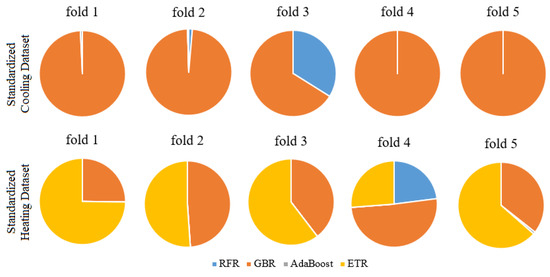
Figure 14.
PTA Ensemble Weight Summary When Standardization is Applied.
The weights of the ensemble for the Standardized Cooling Dataset are almost identical to the weights obtained for the Cooling Dataset. Even though the weights were similar for fold 1, fold 3, and fold 5 for the Standardized Heating Dataset and the Heating Dataset, there were significant differences between fold 2 and fold 4. However, the GBR and the ETR obtained the highest weights of the ensemble for both fold 2 and fold 4.
6.2. Comparison to Average Ensemble and Individual Components of the Ensemble
Table 11 compares the best results obtained by the PTA ensemble to the ones obtained by the average ensemble and by the algorithms of the ensemble. The evaluation metrics presented in the table were computed as the averages of those obtained for each fold.

Table 11.
Comparison to the Average Ensemble and the Individual Components of the Ensemble.
As shown in the table, the PTA ensemble returned the best RMSE results for each dataset compared to the other approaches, which were based on the average ensemble and on the individual components of the ensemble, namely, the RFR, the GBR, the AdaBoost, and the ETR. For each dataset, the PTA ensemble returned the R2 values which were the closest to one, which means that it fit the data the best. Regarding the MAE values, it also returned the best results. However, in the case of the MAPE values, there were exceptions for the Cooling Dataset, in which the values returned by the RFR and the ETR were better, and for the Standardized Cooling Dataset, in which the value returned by the GBR was better. The differences were very small or insignificant. These differences can be justified by the objective function used by the ensemble, which gave more attention to the minimization of the RMSE.
6.3. Comparison to Other Nature-Inspired Algorithm-Based Ensembles
This section compares the performance of the PTA ensemble to the performance of the ensembles based on other nature-inspired algorithms both for when no standardization was considered and for when the data was standardized.
For each nature-inspired algorithm considered in the experiments, the same specific configuration parameters values were applied as the ones presented in Table 4. For each algorithm and for each fold, 30 runs were performed. The results did not present a lot of differences during the runs; therefore, the best runs were the ones for which the RMSE value was minimal. If more runs returned the same minimal RMSE value, then the run that corresponded to the minimum running time was selected. For each dataset, the mean values of the evaluation metrics were computed as averages of the values which corresponded to each fold.
The values of RMSE, , MAE, MAPE, and of the weights of the ensembles were almost identical for all 30 runs for all algorithms, except for the CSO algorithm and the PSO algorithm. For example, for the CSO–based ensemble, the RMSE had values from [1.394474, 1.47675] for fold 1 of the Cooling Dataset. Similarly, for the PSO-based ensemble, the RMSE had values from [0.3438, 0.3522] for fold 1 of the Heating Dataset. However, the best runs out of the 30 runs for both the PSO and CSO algorithms were similar or identical to the ones of the other nature-inspired algorithms, except for the running time.
Figure 15 presents the summary of the average running time for all nature-inspired algorithm-based ensembles considered in the experiments, with separate graphs for each experimental dataset showing the runs that returned the best RMSE values.
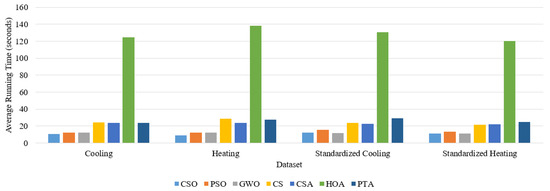
Figure 15.
Comparison of the PTA Ensemble Average Running Time with the Average Time of Other Nature-Inspired Algorithm-Based Ensembles.
As shown in Figure 15, the standardization of the data did not greatly influence the average running times of the nature-inspired algorithms. The worst performance was that of the HOA, whereas the best performance was that of the GWO for the Cooling Standardized Dataset and that of the CSO algorithm for the other three datasets.
As an overall remark, from the perspective of running time and the variation in the results, the GWO-based ensemble returned the best results. The PTA performed quite well; it was similar to the CS and CSA in terms of running time and similar to the GWO, the CS algorithm, the CSA, and the HOA in terms of variation in the results.
Finally, the PTA results in terms of RMSE for the best runs for all four datasets were equal to the ones returned by the GWO, the CS algorithm, and the CSA. The effectiveness of the PTA is justified by the fact that it was not outperformed by the other nature-inspired algorithms in terms of RMSE, and the returned results varied insignificantly for all 30 runs for each fold of each dataset. These results show that the PTA is a reliable algorithm which can be used in other engineering applications as well.
6.4. Comparison to the Results from Other Research Studies
This section compares the results obtained in this study to those obtained by other representative research studies which used the same dataset and the same cross-validation type, namely, fivefold cross-validation. The CS algorithm, the CSA, the GWO, and the PTA ensemble-based methods which also considered the standardization of the data are abbreviated as CS-S, CSA-S, GWO-S, and PTA-S, respectively.
Table 12 summarizes the comparison of the results.

Table 12.
Comparison to the Literature Results.
The comparison to the results from [97], in which methods based on the Tri-Layer Neural Network (TNN) and the Maximum Relevance Minimum Redundancy (MRMR), GPR, Boosted Trees, Medium Tree, Fine Tree, Bagged Trees, LR, SVM, Stepwise Linear Regression (SLR), and Coarse Tree were used, is not accurate even though the same ratio for cross-validation was used because that approach also had a data preprocessing phase in which the irrelevant, noisy, and redundant data was eliminated, and it also had a feature selection phase in which the most representative features were selected. The results are comparable to those obtained by the CS algorithm, CSA, GWO, and PTA methods. The nature-inspired algorithm-based ensemble methods returned better RMSE values than all of the other approaches for the Heating Dataset; however, they were outperformed in the Cooling Dataset by the TNN and MRMR and by the GPR.
Compared to the method presented in [98], where a Naïve Bayes Classifier was applied, the CS-S, CSA-S, GWO-S, and PTA-S methods were better in terms of heating prediction results, but they did not lead to better results in terms of cooling prediction results.
The authors of [99] considered the application of the GA and the Imperialist Competition Algorithm (ICA) [100] in the optimization of the biases and the weights of an ANN. The results showed that the optimization of the ANN using metaheuristics led to better results. The results obtained by the nature-inspired algorithm-based methods described in this article were better, but the results returned by the ANN methods showed fewer differences between the Cooling Dataset and Heating Dataset results.
7. Conclusions
This article presents a novel approach based on the PTA for the estimation of energy efficiency in which the weights of an ensemble composed of the RFR, the GBR, the AdaBoost, and the ETR is used in the prediction of cooling and heating loads. Fivefold cross-validation was used to validate the method, and the results obtained for the cooling and heating predictions were 1.519352 and 0.433806, respectively, when no standardization was applied, and they were 0.159903 and 0.043124, respectively, when standardization was applied. The obtained results were also compared to those in the literature.
The principal outcomes are the following:
- The PTA is a performant nature-inspired algorithm, as shown by the comparison to six other nature-inspired algorithms using 24 benchmark objective functions;
- The PTA has fewer configuration parameters compared to the HOA and CSO algorithms, which makes it easier to configure for certain optimization problems;
- On the other hand, the PTA has more configuration parameters than the GWO, the CS algorithm, and the CSA, which might be an advantage for other types of optimization problems;
- The PTA and PTA-S ensembles showed better prediction results in terms of RMSE, , MAE, and MAPE compared to the average ensemble and the individual components of the PTA-based ensembles;
- The quantitative results obtained by using the PTA and PTA-S methods to predict energy efficiency were equal to those obtained by using the CS algorithm, the CSA, the GWO, the CS-S, the CSA-S, and the GWO-S;
- The results obtained by using the nature-inspired algorithm-based methods for the prediction of energy efficiency are comparable to those obtained in the literature with state-of-the-art methods.
As future research work, the following directions are proposed:
- The evaluation of the PTA using more objective benchmark objective functions and the comparison to other nature-inspired algorithms;
- The improvement of the performance of the PTA through hybridization with other nature-inspired algorithms or the modification of the equations applied to update the positions of the flowers;
- The application of the PTA to more types of engineering problems;
- The development of a multi-objective version of the PTA.
Funding
This research received no external funding.
Institutional Review Board Statement
Not applicable.
Informed Consent Statement
Not applicable.
Data Availability Statement
The dataset which supports this article is from the UCI machine learning repository, which can be found at “https://archive.ics.uci.edu/ml/index.php (accessed on 5 December 2022)”.
Acknowledgments
The author wants to express appreciation for the editors and the anonymous reviewers for their beneficial suggestions, which improved the quality of this manuscript significantly.
Conflicts of Interest
The author declares no conflict of interest.
References
- Chakraborty, A.; Kar, A.K. Swarm Intelligence: A Review of Algorithms. In Nature-Inspired Computing and Optimization. Modeling and Optimization in Science and Technologies; Patnaik, S., Yang, X.S., Nakamatsu, K., Eds.; Springer: Cham, Switzerland, 2017; Volume 10, pp. 475–494. [Google Scholar]
- Biswas, A.; Mishra, K.; Tiwari, S.; Misra, A. Physics-inspired optimization algorithms: A survey. J. Optim 2013, 2013, 438152. [Google Scholar] [CrossRef]
- Vasiliadis, V.; Dounias, G. Applications of Nature-Inspired Intelligence in Finance. In Artificial Intelligence and Innovations 2007: From Theory to Applications, Proceedings of the AIAI 2007. IFIP The International Federation for Information Processing, Peania, Athens, 19–21 September 2007; Boukis, C., Pnevmatikakis, A., Polymenakos, L., Eds.; Springer: Boston, MA, USA, 2007; Volume 247, pp. 187–194. [Google Scholar]
- Yang, X.S.; He, X. Nature-Inspired Optimization Algorithms in Engineering: Overview and Applications. In Nature-Inspired Computation in Engineering. Studies in Computational Intelligence; Yang, X.S., Ed.; Springer: Cham, Switzerland, 2016; Volume 637, pp. 1–20. [Google Scholar]
- Hemeida, A.M.; Alkhalaf, S.; Mady, A.; Mahmoud, E.A.; Hussein, M.E.; Eldin, A.M.B. Implementation of nature-inspired optimization algorithms in some data mining tasks. Ain Shams Eng. J. 2020, 11, 309–318. [Google Scholar] [CrossRef]
- Panteleev, A.V.; Kolessa, A.A. Application of the Tomtit Flock Metaheuristic Optimization Algorithm to the Optimal Discrete Time Deterministic Dynamical Control Problem. Algorithms 2022, 15, 301. [Google Scholar] [CrossRef]
- Wahab, M.N.A.; Nefti-Meziani, S.; Atyabi, A. A Comprehensive Review of Swarm Optimization Algorithms. PLoS ONE 2015, 10, e0122827. [Google Scholar] [CrossRef] [PubMed]
- Xue, B.; Zhang, M.; Browne, W.N.; Yao, X. A Survey on Evolutionary Computation Approaches for Feature Selection. IEEE Trans. Evol. Comput. 2016, 20, 606–626. [Google Scholar] [CrossRef]
- Can, U.; Alatas, B. Physics Based Metaheuristic Algorithms for Global Optimization. AJISCE 2015, 1, 94–106. [Google Scholar]
- Kennedy, J.; Eberhart, R. Particle swarm optimization. In Proceedings of the ICNN’95—International Conference on Neural Networks, Perth, WA, Australia, 27 November–1 December 1995; pp. 1942–1948. [Google Scholar]
- Wang, G.-G.; Deb, S.; Coelho, L.D.S. Elephant Herding Optimization. In Proceedings of the 2015 3rd International Symposium on Computational and Business Intelligence (ISCBI), Bali, Indonesia, 7–9 December 2015; pp. 1–5. [Google Scholar]
- Mirjalili, S.; Lewis, A. The Whale Optimization Algorithm. Adv. Eng. Softw. 2016, 95, 51–67. [Google Scholar] [CrossRef]
- Dhiman, G.; Kumar, V. Spotted hyena optimizer: A novel bio-inspired based metaheuristic technique for engineering applications. Adv. Eng. Softw. 2017, 114, 48–70. [Google Scholar] [CrossRef]
- MiarNaeimi, F.; Azizyan, G.; Rashki, M. Horse herd optimization algorithm: A nature-inspired algorithm for high-dimensional optimization problems. Knowl. Based Syst. 2021, 213, 106711. [Google Scholar] [CrossRef]
- Holland, J.H. Adaptation in Natural and Artificial Systems. In An Introductory Analysis with Application to Biology, Control and Artificial Intelligence, 1st ed.; The University of Michigan: Ann Arbor, MI, USA, 1975. [Google Scholar]
- Storn, R. On the usage of differential evolution for function optimization. In Proceedings of the North American Fuzzy Information Processing, Berkley, CA, USA, 19–22 June 1996; pp. 519–523. [Google Scholar]
- Marti, R.; Laguna, M.; Glover, F. Principles of scatter search. Eur. J. Oper. Res. 2006, 169, 359–372. [Google Scholar] [CrossRef]
- Mehrabian, A.R.; Lucas, C. A novel numerical optimization algorithm inspired from weed colonization. Ecol. Inform. 2006, 1, 355–366. [Google Scholar] [CrossRef]
- Geem, Z.W.; Kim, J.H.; Loganathan, G.V. A New Heuristic Optimization Algorithm: Harmony Search. Simulation 2001, 76, 60–68. [Google Scholar] [CrossRef]
- Rashedi, E.; Nezamabadi-pour, H.; Saryazdi, S. GSA: A Gravitational Search Algorithm. Inf. Sci. 2009, 179, 2232–2248. [Google Scholar] [CrossRef]
- Tan, Y.; Zhu, Y. Fireworks Algorithm for Optimization. In Advances in Swarm Intelligence. ICSI 2010. Lecture Notes in Computer Science; Tan, Y., Shi, Y., Tan, K.C., Eds.; Springer: Berlin/Heidelberg, Germany, 2010; Volume 6145, pp. 355–364. [Google Scholar]
- Siddique, N.; Adeli, H. Spiral dynamics algorithm. Int. J. Artif. Intell. Tools 2014, 23, 1430001. [Google Scholar] [CrossRef]
- Karaboga, D. An Idea Based on Honey Bee Swarm for Numerical Optimization, Technical Report; Erciyes University: Kayseri, Turkey, 2005; pp. 1–10. [Google Scholar]
- Chu, S.C.; Tsai, P.W.; Pan, J.S. Cat swarm optimization. In Proceedings of the 9th Pacific Rim International Conference on Artificial Intelligence, Guilin, China, 7–11 August 2006; pp. 854–858. [Google Scholar]
- Mucherino, A.; Seref, O. Monkey search: A novel metaheuristic search for global optimization. AIP Conf. Proc. 2007, 953, 162–173. [Google Scholar]
- Chu, Y.; Mi, H.; Liao, H.; Ji, Z.; Wu, Q.H. A Fast Bacterial Swarming Algorithm for high-dimensional function optimization. In Proceedings of the 2008 IEEE Congress on Evolutionary Computation (IEEE World Congress on Computational Intelligence), Hong Kong, China, 1–6 June 2008; pp. 3135–3140. [Google Scholar]
- Yang, X.-S.; Deb, S. Cuckoo search via Lévy flights. In Proceedings of the 2009 World Congress on Nature & Biologically Inspired Computing, Coimbatore, India, 9–11 December 2009; pp. 210–214. [Google Scholar]
- Yang, X.-S. A New Metaheuristic Bat-Inspired Algorithm. In Nature Inspired Cooperative Strategies for Optimization (NICSO 2010); González, J.R., Pelta, D.A., Cruz, C., Terrazas, G., Krasnogor, N., Eds.; Springer: Berlin/Heidelberg, Germany, 2010; pp. 65–74. [Google Scholar]
- Rajabioun, R. Cuckoo optimization algorithm. Appl. Soft Comput. 2011, 11, 5508–5518. [Google Scholar] [CrossRef]
- Yang, X.-S. Flower Pollination Algorithm for Global Optimization. In Unconventional Computation and Natural Computation, Proceedings of the 11th International Conference, UCNC 2012, Orléan, France, 3–7 September 2012; Springer Science and Business Media LLC: Berlin/Heidelberg, Germany, 2012; pp. 240–249. [Google Scholar]
- Kaveh, A.; Farhoudi, N. A new optimization method: Dolphin echolocation. Adv. Eng. Softw. 2013, 59, 53–70. [Google Scholar] [CrossRef]
- Ghaemi, M.; Feizi-Derakhshi, M.-R. Forest Optimization Algorithm. Exp. Syst. Appl. 2014, 41, 6676–6687. [Google Scholar] [CrossRef]
- Merrikh-Bayat, F. The runner-root algorithm: A metaheuristic for solving unimodal and multimodal optimization problems inspired by runners and roots of plants in nature. Appl. Soft Comput. 2015, 33, 292–303. [Google Scholar] [CrossRef]
- Askarzadeh, A. A novel metaheuristic method for solving constrained engineering optimization problems: Crow search algorithm. Comput. Struct. 2016, 169, 1–12. [Google Scholar] [CrossRef]
- Mirjalili, S.; Gandomi, A.H.; Mirjalili, S.Z.; Saremi, S.; Faris, H.; Mirjalili, S.M. Salp Swarm Algorithm: A bio-inspired optimizer for engineering design problems. Adv. Eng. Softw. 2017, 114, 163–191. [Google Scholar] [CrossRef]
- Cheraghalipour, A.; Hajiaghaei-Keshteli, M.; Paydar, M.M. Tree Growth Algorithm (TGA): A novel approach for solving optimization problems. Eng. Appl. Artif. Intell. 2018, 72, 393–414. [Google Scholar] [CrossRef]
- Shadravan, S.; Naji, H.R.; Bardsiri, V.K. The Sailfish Optimizer: A novel nature-inspired metaheuristic algorithm for solving constrained engineering optimization problems. Eng. Appl. Artif. Intell. 2019, 80, 20–34. [Google Scholar] [CrossRef]
- Moldovan, D. Horse Optimization Algorithm: A Novel Bio-Inspired Algorithm for Solving Global Optimization Problems. In Artificial Intelligence and Bioinspired Computational Methods. CSOC 2020. Advances in Intelligent Systems and Computing; Silhavy, R., Ed.; Springer: Cham, Switzerland, 2020; Volume 1225, pp. 195–209. [Google Scholar]
- Abdollahzadeh, B.; Gharehchopogh, F.S.; Mirjalili, S. African vultures optimization algorithm: A new nature-inspired metaheuristic algorithm for global optimization problems. Comput. Ind. Eng. 2021, 158, 107408. [Google Scholar] [CrossRef]
- Hashim, F.A.; Hussien, A.G. Snake Optimizer: A novel meta-heuristic optimization algorithm. Knowl.-Based Syst. 2022, 242, 108320. [Google Scholar] [CrossRef]
- Wang, Y.; Cui, Z.; Li, W. A Novel Coupling Algorithm Based on Glowworm Swarm Optimization and Bacterial Foraging Algorithm for Solving Multi-Objective Optimization Problems. Algorithms 2019, 12, 61. [Google Scholar] [CrossRef]
- Krishnanand, K.N.; Ghose, D. Glowworm swarm optimization for simultaneous capture of multiple local optima of multimodal functions. Swarm Intell. 2009, 3, 87–124. [Google Scholar] [CrossRef]
- Yang, C.; Ji, J.; Liu, J.; Yin, B. Bacterial Foraging Optimization Using Novel Chemotaxis and Conjugation Strategies. Inf. Sci. 2016, 363, 72–95. [Google Scholar] [CrossRef]
- Trojovsky, P.; Dehghani, M. Pelican Optimization Algorithm: A Novel Nature-Inspired Algorithm for Engineering Problems. Sensors 2022, 22, 855. [Google Scholar] [CrossRef]
- Moldovan, D. Binary Horse Optimization Algorithm for Feature Selection. Algorithms 2022, 15, 156. [Google Scholar] [CrossRef]
- Yang, X.-S.; Papa, J.P. Chapter 1—Bio-inspired computation and its applications in image processing: An overview. In Bio-Inspired Computation and Applications in Image Processing; Yang, X.-S., Papa, J.P., Eds.; Academic Press: Cambridge, MA, USA, 2016; pp. 1–24. [Google Scholar]
- Omran, M.G.H.; Engelbrecht, A.P.; Salman, A. Particle Swarm Optimization for Pattern Recognition and Image Processing. In Swarm Intelligence in Data Mining; Abraham, A., Grosan, C., Ramos, V., Eds.; Springer: Berlin/Heidelberg, Germany, 2006; pp. 125–151. [Google Scholar]
- Sousa, T.; Silva, A.; Neves, A. Particle Swarm based Data Mining Algorithms for classification tasks. Parallel Comput. 2004, 30, 767–783. [Google Scholar] [CrossRef]
- Saikia, M.; Choudhury, H.A.; Sinha, N. Optimized particle swarm optimization for faster accurate video compression. Multimed. Tools Appl. 2022, 81, 23289–23310. [Google Scholar] [CrossRef]
- Wang, Z.; Liu, J.; Zhang, Y.; Yuan, H.; Zhang, R.; Srinivasan, R.S. Practical issues in implementing machine-learning models for building energy efficiency: Moving beyond obstacles. Renew. Sust. Energ. Rev. 2021, 143, 110929. [Google Scholar] [CrossRef]
- Wang, Z.; Liang, Z.; Zeng, R.; Yuan, H.; Srinivasan, R.S. Identifying the optimal heterogeneous ensemble learning model for building energy prediction using the exhaustive search method. Energy Build. 2023, 281, 112763. [Google Scholar] [CrossRef]
- Tien, P.W.; Wei, S.; Darkwa, J.; Wood, C.; Calautit, J.K. Machine Learning and Deep Learning Models for Enhancing Building Energy Efficiency and Indoor Environmental Quality—A Review. Energy AI 2022, 10, 100198. [Google Scholar] [CrossRef]
- Zhao, J.; Hong, M.; Ju, Z.; Yan, X.; Gal, Y.; Liang, Z. Durable Lithium Metal Anodes Enabled by Interfacial Layers Based on Mechanically Interlocked Networks Capable of Energy Dissipation. Angew. Chem. 2022, 61, e202214386. [Google Scholar] [CrossRef] [PubMed]
- Kim, S.; Kim, J.-S.; Miara, L.; Wang, Y.; Jung, S.-K.; Park, S.Y.; Song, Z.; Kim, H.; Badding, M.; Chang, J.; et al. High-energy and durable lithium metal batteries using garnet-type solid electrolytes with tailored lithium-metal compatibility. Nat. Commun. 2022, 13, 1883. [Google Scholar] [CrossRef] [PubMed]
- Xiong, W.; Xu, G.; Li, Y.; Zhang, F.; Ye, P.; Li, B. Early prediction of lithium-ion battery cycle life based on voltage-capacity discharge curves. J. Energy Storage 2023, 62, 106790. [Google Scholar] [CrossRef]
- Meng, X.; Liu, Y.; Gao, X.; Zhang, H. A New Bio-inspired Algorithm: Chicken Swarm Optimization. In Advances in Swarm Intelligence. ICSI 2014. Lecture Notes in Computer Science; Tan, Y., Shi, Y., Coello, C.A.C., Eds.; Springer: Cham, Switzerland, 2014; Volume 8794, pp. 86–94. [Google Scholar]
- Mirjalili, S.; Mirjalili, S.M.; Lewis, A. Grey Wolf Optimizer. Adv. Eng. Softw. 2014, 69, 46–61. [Google Scholar] [CrossRef]
- UCI Machine Learning Repository. Available online: https://archive.ics.uci.edu/ml/index.php (accessed on 18 September 2022).
- Tsanas, A.; Xifara, A. Accurate quantitative estimation of energy performance of residential buildings using statistical machine learning tools. Energy Build. 2012, 49, 560–567. [Google Scholar] [CrossRef]
- Koohestani, A.; Abdar, M.; Khosravi, A.; Nahavandi, S.; Koohestani, M. Integration of Ensemble and Evolutionary Machine Learning Algorithms for Monitoring Driver Behavior Using Physiological Signals. IEEE Access 2019, 7, 98971–98992. [Google Scholar] [CrossRef]
- Mirjalili, S. The Ant Lion Optimizer. Adv. Eng. Softw. 2015, 83, 80–98. [Google Scholar] [CrossRef]
- Koohestani, A.; Abdar, M.; Hussain, S.; Khosravi, A.; Nahavandi, D.; Nahavandi, S.; Alizadehsani. Analysis of Driver Performance Using Hybrid of Weighted Ensemble Learning Technique and Evolutionary Algorithms. Arab. J. Sci. Eng. 2021, 46, 3567–3580. [Google Scholar] [CrossRef]
- Saremi, S.; Mirjalili, S.; Lewis, A. Grasshopper Optimization Algorithm: Theory and Application. Adv. Eng. Softw. 2017, 105, 30–47. [Google Scholar] [CrossRef]
- Aburomman, A.A.; Reaz, M.B.I. A novel SVM-kNN-PSO ensemble method for intrusion detection system. Appl. Soft Comput. 2016, 38, 360–372. [Google Scholar] [CrossRef]
- Littlestone, N.; Warmuth, M.K. The Weighted Majority Algorithm. Inf. Comput. 1994, 108, 212–261. [Google Scholar] [CrossRef]
- Khademi, F.; Rabbani, M.; Motameni, H.; Akbari, E. A weighted ensemble classifier based on WOA for classification of diabetes. Neural Comput. Appl. 2022, 34, 1613–1621. [Google Scholar] [CrossRef]
- Li, K.; Zhou, G.; Zhai, J.; Li, F.; Shao, M. Improved PSO_AdaBoost Ensemble Algorithm for Imbalanced Data. Sensors 2019, 19, 1476. [Google Scholar] [CrossRef] [PubMed]
- Freund, Y.; Schapire, R.E. A Decision-Theoretic Generalization of On-Line Learning and an Application to Boosting. J. Comput. Syst. Sci. 1997, 55, 119–139. [Google Scholar] [CrossRef]
- Zhou, Y.; Mazzuchi, T.A.; Sarkani, S. M-AdaBoost-A based ensemble system for network intrusion detection. Expert Syst. Appl. 2020, 162, 113864. [Google Scholar] [CrossRef]
- Anastasiadou, M.; Santos, V.; Dias, M.S. Machine Learning Techniques Focusing on the Energy Performance of Buildings: A Dimensions and Methods Analysis. Buildings 2022, 12, 28. [Google Scholar] [CrossRef]
- Ardabili, S.; Abdolalizadeh, L.; Mako, C.; Torok, B.; Mosavi, A. Systematic Review of Deep Learning and Machine Learning for Building Energy. Front. Energy Res. 2022, 10, 786027. [Google Scholar] [CrossRef]
- Attanasio, A.; Piscitelli, M.S.; Chiusano, S.; Capozzoli, A.; Cerquitelli, T. Towards an Automated, Fast and Interpretable Estimation Model of Heating Energy Demand: A Data-Driven Approach Exploiting Building Energy Certificates. Energies 2019, 12, 1273. [Google Scholar] [CrossRef]
- Becalli, M.; Ciulla, G.; Lo Brano, V.; Galatioto, A.; Bonomolo, M. Artificial neural network decision support tool for assessment of the energy performance and the refurbishment actions for the non-residential building stock in Southern Italy. Energy 2017, 137, 1201–1218. [Google Scholar] [CrossRef]
- Huang, Y.; Yuan, Y.; Chen, H.; Wang, J.; Guo, Y.; Ahmad, T. A novel energy demand prediction strategy for residential buildings based on ensemble learning. Energy Procedia 2019, 158, 3411–3416. [Google Scholar] [CrossRef]
- Shafqat, W.; Malik, S.; Lee, K.-T.; Kim, D.-H. PSO Based Optimized Ensemble Learning and Feature Selection Approach for Efficient Energy Forecast. Electronics 2021, 10, 2188. [Google Scholar] [CrossRef]
- Ngo, N.-T. Early predicting cooling loads for energy-efficient design in office buildings by machine learning. Energy Build. 2019, 182, 264–273. [Google Scholar] [CrossRef]
- Pachauri, N.; Ahn, C.W. Weighted aggregated ensemble model for energy demand management of buildings. Energy 2023, 263, 125853. [Google Scholar] [CrossRef]
- Faramarzi, A.; Heidarinejad, M.; Mirjalili, S.; Gandomi, A.H. Marine Predators Algorithm: A nature-inspired metaheuristic. Expert Syst. Appl. 2020, 152, 113377. [Google Scholar] [CrossRef]
- Dong, Z.; Liu, J.; Liu, B.; Li, K.; Li, X. Hourly energy consumption prediction of an office building based on ensemble learning and energy consumption pattern classification. Energy Build. 2021, 241, 110929. [Google Scholar] [CrossRef]
- Moldovan, D. Ensembles of Artificial Neural Networks for Smart Grids Stability Prediction. In Artificial Intelligence Trends in Systems. CSOC 2022. Lecture Notes in Networks and Systems; Silhavy, R., Ed.; Springer: Cham, Switzerland, 2022; Volume 502, pp. 320–336. [Google Scholar]
- Almutairi, K.; Algarni, S.; Alqahtani, T.; Moayedi, H.; Mosavi, A. A TLBO-Tuned Neural Processor for Predicting Heating Load in Residential Building. Sustainability 2022, 14, 5924. [Google Scholar] [CrossRef]
- Yang, X.-S. Firefly algorithm. Nat. Inspired Metaheuristic Algorithms 2008, 20, 79–90. [Google Scholar]
- Duan, Q.; Gupta, V.K.; Sorooshian, S. Shuffled complex evolution approach for effective and efficient global minimization. J. Optim. Theory Appl. 1993, 76, 501–521. [Google Scholar] [CrossRef]
- Kashan, A.H. A new metaheuristic for optimization: Optics inspired optimization (OIO). Comput. Oper. Res. 2015, 55, 99–125. [Google Scholar] [CrossRef]
- Rao, R.V.; Savsni, V.J.; Vakharia, D. Teaching-learning-based optimization: A novel method for constrained mechanical design optimization problems. Comput. Aided Des. 2011, 43, 303–315. [Google Scholar] [CrossRef]
- Pachauri, N.; Ahn, C. Regression tree ensemble learning-based prediction of the heating and cooling loads of residential buildings. Build. Simul. 2022, 15, 2003–2017. [Google Scholar] [CrossRef]
- Eusuff, M.M.; Lansey, K.E. Optimization of water distribution network design using the shuffled frog leaping algorithm. J. Water Resour. 2003, 129, 210–225. [Google Scholar] [CrossRef]
- Le, L.T.; Nguyen, H.; Zhou, J.; Dou, J.; Moayedi, H. Estimating the Heating Load of Buildings for Smart City Planning Using a Novel Artificial Intelligence Technique PSO-XGBoost. Appl. Sci. 2019, 9, 2714. [Google Scholar] [CrossRef]
- Chen, T.; He, T. Xgboost: Extreme Gradient Boosting; R Package Version 0.4-2. Available online: https://cran.r-project.org/web/packages/xgboost/vignettes/xgboost.pdf (accessed on 19 February 2023).
- Loebenstein, G. Plant Virus Diseases: Economic Aspects. In Encyclopedia of Virology (Third Edition); Mahy, B.W.J., Van Regenmortal, M.H.V., Eds.; Academic Press: Cambridge, MA, USA, 2008; pp. 197–201. [Google Scholar]
- Miranda-Castro, S.P. Chapter 3—Application of Chitosan in Fresh and Minimally Processed Fruits and Vegetables. In Chitosan in the Preservation of Agricultural Commodities; Bautista-Banos, S., Romanazzi, G., Jimenez-Aparicio, A., Eds.; Academic Press: Cambridge, MA, USA, 2016; pp. 67–113. [Google Scholar]
- Faris, H.; Aljarah, I.; Mirjalili, S.; Castillo, P.; Merelo, J. EvoloPy: An Open-source Nature-inspired Optimization Framework in Python. In Proceedings of the 8th International Joint Conference on Computational Intelligence (IJCCI 2016)—Volume 1: ECTA, Porto, Portugal, 9–11 November 2016; pp. 171–177. [Google Scholar]
- Qaddoura, R.; Faris, H.; Aljarah, I.; Castillo, P.A. EvoCluster An Open-Source Nature-Inspired Optimization Clustering Framework in Python. In Applications of Evolutionary Computation. Evo Applications 2020; Castillo, P.A., Jimenez Laredo, J.L., Fernandez de Vega, F., Eds.; Springer: Cham, Switzerland, 2020; Volume 12104, pp. 20–36. [Google Scholar]
- Khurma, R.A.; Aljarah, I.; Sharieh, A.; Mirjalili, S. EvoloPy-FS: An Open-Source Nature-Inspired Optimization Framework in Python for Feature Selection. In Evolutionary Machine Learning Techniques. Algorithms for Intelligent Systems; Mirjalili, S., Faris, H., Aljarah, I., Eds.; Springer: Singapore, 2020; pp. 131–173. [Google Scholar]
- Moldovan, D. Improved Kangaroo Mob Optimization and Logistic Regression for Smart Grid Stability Classification. In Artificial Intelligence in Intelligent Systems. CSOC 2021. Lecture Notes in Networks and Systems; Silhavy, R., Ed.; Springer: Cham, Switzerland, 2021; Volume 229, pp. 469–487. [Google Scholar]
- Shami, T.M.; Grace, D.; Burr, A.; Mitchell, P.D. Single Candidate Optimizer: A Novel Optimization Algorithm. Evol. Intell. 2022. [Google Scholar] [CrossRef]
- Ghasemkhani, B.; Yilmaz, R.; Birant, D.; Kut, R.A. Machine Learning Models for the Prediction of Energy Consumption Based on Cooling and Heating Loads in Internet-of-Things Based Smart Buildings. Symmetry 2022, 14, 1553. [Google Scholar] [CrossRef]
- Prasetiyo, B.; Alamsyah; Muslim, M.A. Analysis of building energy efficiency dataset using naïve bayes classification classifier. J. Phys. Conf. Ser. 2019, 1321, 032016. [Google Scholar] [CrossRef]
- Bui, D.T.; Moayedi, H.; Anastasios, D.; Foong, L.K. Predicting Heating and Cooling Loads in Energy-Efficiency Buildings Using Two Hybrid Intelligent Models. Appl. Sci. 2019, 9, 3543. [Google Scholar]
- Atashpaz-Gargari, E.; Lucas, C. Imperialist competitive algorithm: An algorithm for optimization inspired by imperialist competition. In Proceedings of the 2007 IEEE Congress on Evolutionary Computation, Singapore, 25–28 September 2007; pp. 4661–4667. [Google Scholar]
Disclaimer/Publisher’s Note: The statements, opinions and data contained in all publications are solely those of the individual author(s) and contributor(s) and not of MDPI and/or the editor(s). MDPI and/or the editor(s) disclaim responsibility for any injury to people or property resulting from any ideas, methods, instructions or products referred to in the content. |
© 2023 by the author. Licensee MDPI, Basel, Switzerland. This article is an open access article distributed under the terms and conditions of the Creative Commons Attribution (CC BY) license (https://creativecommons.org/licenses/by/4.0/).