Article

A Novel Deep Learning Segmentation and Classification Framework for Leukemia Diagnosis

1
Department of Medical Laboratory Technology, Faculty of Medical Applied Science, Northern Border University, Arar 91431, Saudi Arabia
2
Department of Electrical Engineering, College of Engineering, Northern Border University, Arar 91431, Saudi Arabia
3
Department of Electrical Engineering, Faculty of Engineering at Rabigh, King Abdulaziz University, Jeddah 21589, Saudi Arabia
*
Author to whom correspondence should be addressed.
Algorithms 2023, 16(12), 556; https://doi.org/10.3390/a16120556
Submission received: 12 November 2023 / Revised: 29 November 2023 / Accepted: 30 November 2023 / Published: 5 December 2023
(This article belongs to the Special Issue Artificial Intelligence Algorithms for Healthcare)

Abstract

:
Blood cancer occurs due to changes in white blood cells (WBCs). These changes are known as leukemia. Leukemia occurs mostly in children and affects their tissues or plasma. However, it could occur in adults. This disease becomes fatal and causes death if it is discovered and diagnosed late. In addition, leukemia can occur from genetic mutations. Therefore, there is a need to detect it early to save a patient’s life. Recently, researchers have developed various methods to detect leukemia using different technologies. Deep learning approaches (DLAs) have been widely utilized because of their high accuracy. However, some of these methods are time-consuming and costly. Thus, a need for a practical solution with low cost and higher accuracy is required. This article proposes a novel segmentation and classification framework model to discover and categorize leukemia using a deep learning structure. The proposed system encompasses two main parts, which are a deep learning technology to perform segmentation and characteristic extraction and classification on the segmented section. A new UNET architecture is developed to provide the segmentation and feature extraction processes. Various experiments were performed on four datasets to evaluate the model using numerous performance factors, including precision, recall, F-score, and Dice Similarity Coefficient (DSC). It achieved an average 97.82% accuracy for segmentation and categorization. In addition, 98.64% was achieved for F-score. The obtained results indicate that the presented method is a powerful technique for discovering leukemia and categorizing it into suitable groups. Furthermore, the model outperforms some of the implemented methods. The proposed system can assist healthcare providers in their services.

1. Introduction

Blood cancer affects children and adults [1]. Blood cancer is also known as leukemia and it occurs due to changes in white blood cells [1,2]. Leukemia refers to the uncontrolled growth of blood cells [3]. Acute leukemia and chronic leukemia are considered the most common types of blood cancer that occur often and are widely diagnosed around the world [3,4,5]. Uncontrolled changes in white blood cells stimulate the birth of too many cells or generate unneeded behaviors [6]. Recently, physicians named four types of leukemia: acute lymphoblastic leukemia (ALL), acute myeloid leukemia (AML), chronic lymphocytic leukemia (CLL), and chronic myeloid leukemia (CML) [6,7,8,9,10,11]. These types were categorized according to the intensity levels of tumor cells [12,13,14].
Acute lymphoblastic leukemia (ALL) affects children and older adults (65 years old and over) [1,14,15]. Pathologists and physicians consider acute myeloid leukemia (AML) the most fatal type since just under 30% of patients have survived in the past five years [1,16]. The National Cancer Institute in the United States of America reported that nearly 24,500 patients died in 2017 due to leukemia [1,17,18,19,20]. In addition, leukemia was the main cause of 4.1.% reported cancers in the United States of America [1].
Various known risk factors can cause leukemia. These factors include smoking, exposure to high levels of radiation and chemotherapy, a blood disorder, family history, and some genetic mutations [21,22]. In young patients, leukemia occurs often due to genetic mutations that take place in blood cells only [23]. In addition, some genetic mutations can be inherited from parents and cause leukemia [24,25].
Acute lymphoblastic leukemia (ALL), acute myeloid leukemia (AML), chronic lymphocytic leukemia (CLL), and chronic myeloid leukemia (CML) are recognized by their intensity level and form of infected cells [1]. Acute myeloid leukemia (AML) occurs in adults more often than children, and more specifically, in men more often than women. In addition, acute myeloid leukemia (AML) is the deadliest type of leukemia since its five-year survival rate is 26.9% [1]. Chronic lymphocytic leukemia (CLL) affects men more than women, since two-thirds of the positive reported cases are men [1]. Moreover, this type of leukemia occurs in people aged 55 years and over, and its survival rate between 2007 and 2013 was 83.2% according to [1].
The evaluation of leukemia is determined by expert pathologists who have sufficient skills [1]. Leukemia types are determined by Molecular Cytogenetics, Long-Distance Inverse Polymerase Chain Reaction (LDI-PCR), and Array-based Comparative Genomic Hybridization (ACGH) [1]. These procedures require substantial effort and skills [1]. Pathologists and physicians use smear blood and bone marrow tests to identify leukemia [1,2,3]. However, these tests are expensive and time-consuming. In addition, interventional radiology is another procedure used to identify leukemia [1]. Yet, the radiological procedures are limited by hereditary issues that are affected by the sensitivity and resolution of the imaging modality [1].
At the moment, deep learning (DL) methods can be deployed in the medical field to support and provide aid for identifying infected leukemia cells or healthy ones. These approaches require datasets for training purposes. In this study, four datasets from Kaggle are used. Neural networks are widely used in image processing, detection, and categorization due to their rapid reputation for accuracy and effectiveness. Overfitting issues could occur for some reasons. To eliminate or minimize these issues, taking equal numbers of images from different samples is necessary. Various deep learning solutions for leukemia diagnosis and categorization were implemented with reasonable results. Therefore, obtaining greater accuracy is required.

1.1. Research Problem and Motivations

Numerous methods were developed to diagnose leukemia using neural networks, such as in [1,2,3,4,5]. All methods, except those in [1], implemented work to detect tumor cells without the capability of classifying these cells into their suitable types. Only the developed method in [1] could classify leukemia into ALL, AML, CLL, and CML. However, this algorithm suffers from a drawback as some of its evaluated metrics did not exceed 98.5%. Therefore, another practical algorithm to detect leukemia and categorize it is required.

1.2. Research Contributions

A novel segmentation method based on new deep learning technology is proposed in this article. This segmentation is performed to detect leukemia cells and categorize these cells into their suitable types, ALL and AML, due to the availability of these two types in the utilized datasets. A newly implemented UNET model is used to extract the required features for classification purposes. The major contributions are:
  I.
Developing a novel segmentation process to detect leukemia based on a deep learning architecture according to a U-shaped architecture.
 II.
Implementing the UNET model to extract various characteristics for the categorization of the main two categories.
III.
Using four datasets to evaluate the proposed approach.
IV.
Calculating several performance quantities to evaluate the correctness and robustness of the presented algorithm.
The rest of the article is organized as follows: a literature review is presented in Section 1.3 and Section 2 provides a description of the proposed method. Section 3 contains the evaluated performance metrics, their results, and the details of the conducted comparative analysis with some developed methods, and Section 4 provides a discussion. The conclusion is given in Section 5.

1.3. Related Work

Recently, Computer Vision (CV) was deployed in various leukemia models to identify and classify tumors.
N. Veeraiah et al., in [1], developed a model to detect and categorize leukemia based on deep learning technology. A Generative Adversarial Network (GAN) was used for feature extraction purposes. In addition, a Generative Adversarial System (GAS) and the Principal Component Analysis (PCA) method were deployed on the extracted characteristics to distinguish suitable types of leukemia. Furthermore, the authors deployed some image preprocessing methods to segment the detected blood cells. The developed method achieved 99.8%, 98.5%, 99.7%, 97.4%, and 98.5% for accuracy, precision, recall, F-score, and DSC, respectively. These achieved results came from applying the model to one dataset. In contrast, the proposed model utilized the newly implemented segmented technique and the newly developed UNET model to detect and categorize leukemia according to the extracted features. The presented method used three datasets to test the algorithm and achieve an acceptable range of outcomes between 97% and 99%. The obtained findings imply that the model can be used by any hospital or healthcare provider to support pathologists and physicians in their diagnosis of leukemia properly and accurately. The proposed model produces better results than the developed method in [1] in some cases, as its accuracy reached 99% when the number of iterations and epochs increased.
The authors in [2] implemented a method to discover long noncoding RNA using a competitive network. This network was developed on endogenous RNA and utilized on a dataset that had long noncoding RNAs and mRNAs. In addition, the authors validated their outcomes using a reverse transcription quantitative real-time approach. Unfortunately, the authors provided no information about the achieved accuracy or any other metric, while the proposed method achieved 97.82% accuracy using the new segmentation technique.
In [3], N. Veeraiah et al. proposed a method to detect leukemia based on a histogram threshold segmentation classifier. This method worked on the color and brightness variation of blood cells. The authors cropped the detected nucleus using arithmetic operations and an automated approximation technique. In addition, the active contour method was utilized to determine the contrast in the segmented white blood cells. The authors achieved 98% accuracy and reached more than 99% when combined with other classifiers on a single dataset. In contrast, the proposed algorithm utilized three datasets and achieved nearly an average of 98% accuracy. This accuracy increased to nearly 98.9% when enhancing the number of iterations and epochs as well.
The authors in [4] implemented a model to discover malignant leukemia cells using a deep learning model. The authors used a Convolutional Neural Network (CNN) to spot ALL and AML. In addition, two blocks of the CNN model were hybridized together. The algorithm was evaluated on a public dataset that contained 4150 blood smear images. In addition, transforming the color images into grey ones was deployed to assist the model in segmentation purposes. Five different classifiers were utilized to evaluate the model to achieve 89.63% accuracy, which is considered to be a low outcome. In contrast, the presented approach in this article used new segmentation and classification methods to spot and categorize four subcategories of leukemia. Four datasets were utilized to attain 97.82% accuracy, which is better than the obtained outcomes in [4].
G. Sriram et al., in [6], implemented a model to categorize leukemia using the VGG-16 CNN model when applied to a single dataset of nearly 700 images. This model classified only two types, which were ALL and AML, and attained nearly 98% accuracy, which is less than what the proposed algorithm obtained on four datasets.
Table 1 offers a summary of what has been implemented to detect and categorize leukemia.

2. Materials and Methods

2.1. Problem Statement

Several Computer-Aided Detection systems (CADs) rely on segmentation to spot and discover cancerous cells. This segmentation is performed according to some built-in functions and tools. In addition, this segmentation is accompanied by some image preprocessing processes. Thus, it is crucial to have a practical automated segmentation method to identify and categorize leukemia early. This research aims to design and develop a reliable robust system for leukemia identification and categorization using a novel UNET architecture.

2.2. Datasets

In this study, four leukemia datasets were used to train, validate, test, and evaluate the proposed model. These four datasets were downloaded from the Kaggle websites [26,27,28,29]. Each dataset has its number of images, types of leukemia, and the size of all images. The first dataset was downloaded from [26] and contains 3256 images from 89 patients. All images are of ALL. The size of this set is 116 MB. The second dataset was downloaded from [27] with 6512 images and a size of approximately 210 MB. This set contains ALL only. The third dataset was downloaded from [28] with a size of 909 MB and it includes 15,135 images of ALL. These images were collected from 118 patients. The last dataset was obtained from [29] and it contains 3242 images from 89 patients. The size of this set is 2 GB. These four datasets were divided into three groups: training, validation, and testing. The training group represents 70%, while the validation and testing groups represent 30%. Table 2 offers a description of the utilized datasets. Table 3 shows the number of assigned images from each dataset to training, validation, and testing groups.

2.3. The Proposed System

This section offers a complete description of the presented algorithm. The proposed model takes inputs of images, converts every image into grayscale, and performs some preprocessing to remove noise, enhance the pixels, rescale all images to a common size, and normalize each input. Normalization is applied to change pixel intensity and divide each pixel value by the allowed maximum value that a pixel can take. The system rescales each input to 600 × 600 pixels. The performed preprocessing processes are applied using some built-in functions. These functions include filters, such as Bilateral, Gaussian, and Gabor. In addition, morphological operations are deployed to support the presented framework in its segmentation stage. Then, the segmentation stage takes place to segment each input to outline potential Regions of Interest (RoIs). These regions are utilized to extract the needed characteristics for the categorization stage. The utilized segmentation stage is applied using the newly implemented model for this purpose based on U architecture. This architecture is a simple, popular architecture used in image segmentation; training a model is easy on this network, and preferable for applications that require less computational resources. In addition, UNET is composed of two components, which are a contracting path and an expansive path [30,31,32]. The contracting path is represented by the left-hand side and the expansive path is denoted by the right-hand side. In the contraction stage, the proposed approach reduces the spatial information and increases feature information [30,31,32]. The expansive pathway is responsible for combining the extracted features and the spatial information. Moreover, UNET architecture localizes and distinguishes RoIs by performing operations based on the pixel level to equalize the size of input and output. After that, the classification is performed using the UNET model to categorize the identified potential RoIs as either healthy or cancerous cells. The cancerous cells are further classified into two suitable types, which are ALL and AML as depicted in Figure 1. Unfortunately, the deployed datasets contain only these two types. Figure 1 illustrates a flowchart and block diagram of the proposed approach to discover and categorize leukemia using blood images. Some blood smear images can be blurry and contain undesirable noise, which could affect the segmentation process and lead to unneeded outcomes. Thus, these images should be clear; this is achieved using three built-in filters, which are Bilateral, Gaussian, and Gabor.
Then, some morphological operations are deployed to distinguish between red and white cells. In addition, all white blood cells are outlined to start determining the possible potential RoIs. Later, all processed inputs are normalized. All these procedures take place in the preprocessing phase, which is considered the first stage of the presented model. After that, the second and the third stages occur consecutively. These stages are segmentation and classification. Inside the segmentation stage, white blood cells are analyzed to spot potential cells and outline them as well. These outline cells are analyzed further to extract the needed features and perform the categorization process based on these characteristics. The proposed model extracts 23 features, including area, diameter, shape, location, mean, and variance. Figure 2 depicts the detail of the internal structure of the developed segmentation model and Figure 3 offers a complete internal description of the implemented categorization method.
In Figure 2, the segmentation is performed based on the deep learning architecture, which is U-shaped. To obtain a final segmentation result, any input is required to travel through various levels. These levels represent different resolutions. The input is represented in a size of H × W × D, where H refers to the height, W denotes the width, and D refers to the depth. In this study, depth denotes the number of applied neurons. The dimensional size of the inputs is projected inside the projection layer into a constant dimensional space. Then, a patch size of 32 is applied. The Multi-Layer Perceptron (MLP) encompasses three Gaussian error Linear Units (GeLU). Each GeLU contains a convolutional block with a size of 2 × 2 and one downsampling operator. In addition, to enhance the segmentation accuracy, two tools are deployed, which are Gated Position-Sensitive Axial Attention (GPSAA) and the Local–Global training method (LoGo). The GPSAA tool determines the interaction relationship between the features and the efficiency of the occurred computations, while the LoGo tool assists in extracting local and global features. Furthermore, a learnable positional embedded Epos is applied in this study to maintain the retrieved spatial information between inputs.
In Figure 3, the feature extraction and categorization operations are performed using the UNET structure. This structure includes three levels. Each level contains layers of convolutional, max-pooling, and fully connected. In addition, the ReLU activation function takes place at each level. The proposed approach categorizes results as healthy or cancerous cells. Cancerous cells are classified into two groups, which are ALL or AML. No public datasets that included all four types were found. In every convolutional block, a dedicated number of kernels is assigned to ensure that diverse features are achieved. The utilized number of kernels is 5 × 5 × 4. Three fully connected layers with 200 neurons in each are deployed. The last fully connected block includes three nodes to represent the total number of obtained findings by the proposed framework, which are healthy cells, ALL cells, and AML cells. Table 4 shows the applied configuration hyperparameters inside the feature extraction and classification stage.

2.4. The Evaluated Metrics

Various performance quantities are computed in this study to evaluate the proposed system. These performance parameters are True Positive (TP), True Negative (TN), False Positive (FP), False Negative (FN), accuracy, precision, recall (sensitivity), specificity, F-score, Jaccard index, and DSC.
Accuracy (Acu) is calculated as illustrated in Equation (1):
Acu = ( T P + T N ) ( T P + T N + F N + F P )
Precision (Pcs) is computed using Equation (2):
Pcs = T P ( T P + F P )
Recall (Rca) is computed using Equation (3):
Rca = T P ( T P + F N )
Specificity (Sfc) is determined as in Equation (4):
Sfc = T P ( T P + F P )
F-score (Fs) is calculated using Equation (5):
Fs = 2   ×   [ ( P C S   ×   R C A ) ( P C S + R C A ) ]
Jaccard Index (JI) is computed using Equation (6):
JI = ( T L     P L ) ( T L     P L )
TL denotes the true labels and PL represents the output labels by the proposed model.
DSC is calculated as shown in Equation (7):
DSC = 2 T P ( 2 T P + F P + F N )
A higher value of DSC means a better prediction is obtained.

3. Results

This section contains the conducted experiments to evaluate the presented algorithm for leukemia identification and categorization. This study aims to design and implement a new trustworthy Computer-Aided Design (CAD) system for the diagnosis and categorization of leukemia using two models. These models are developed for segmentation, characteristics extraction, and classification purposes. This system was trained, validated, tested, and evaluated using four datasets as shown in Table 2. The performed analysis shows the superiority of the presented system. The utilized images from the used datasets were allocated equally between the assigned three groups, which are training, validation, and testing. As shown in Table 2, the first set contains 19,701 images, while the other sets contain 4222 in each.
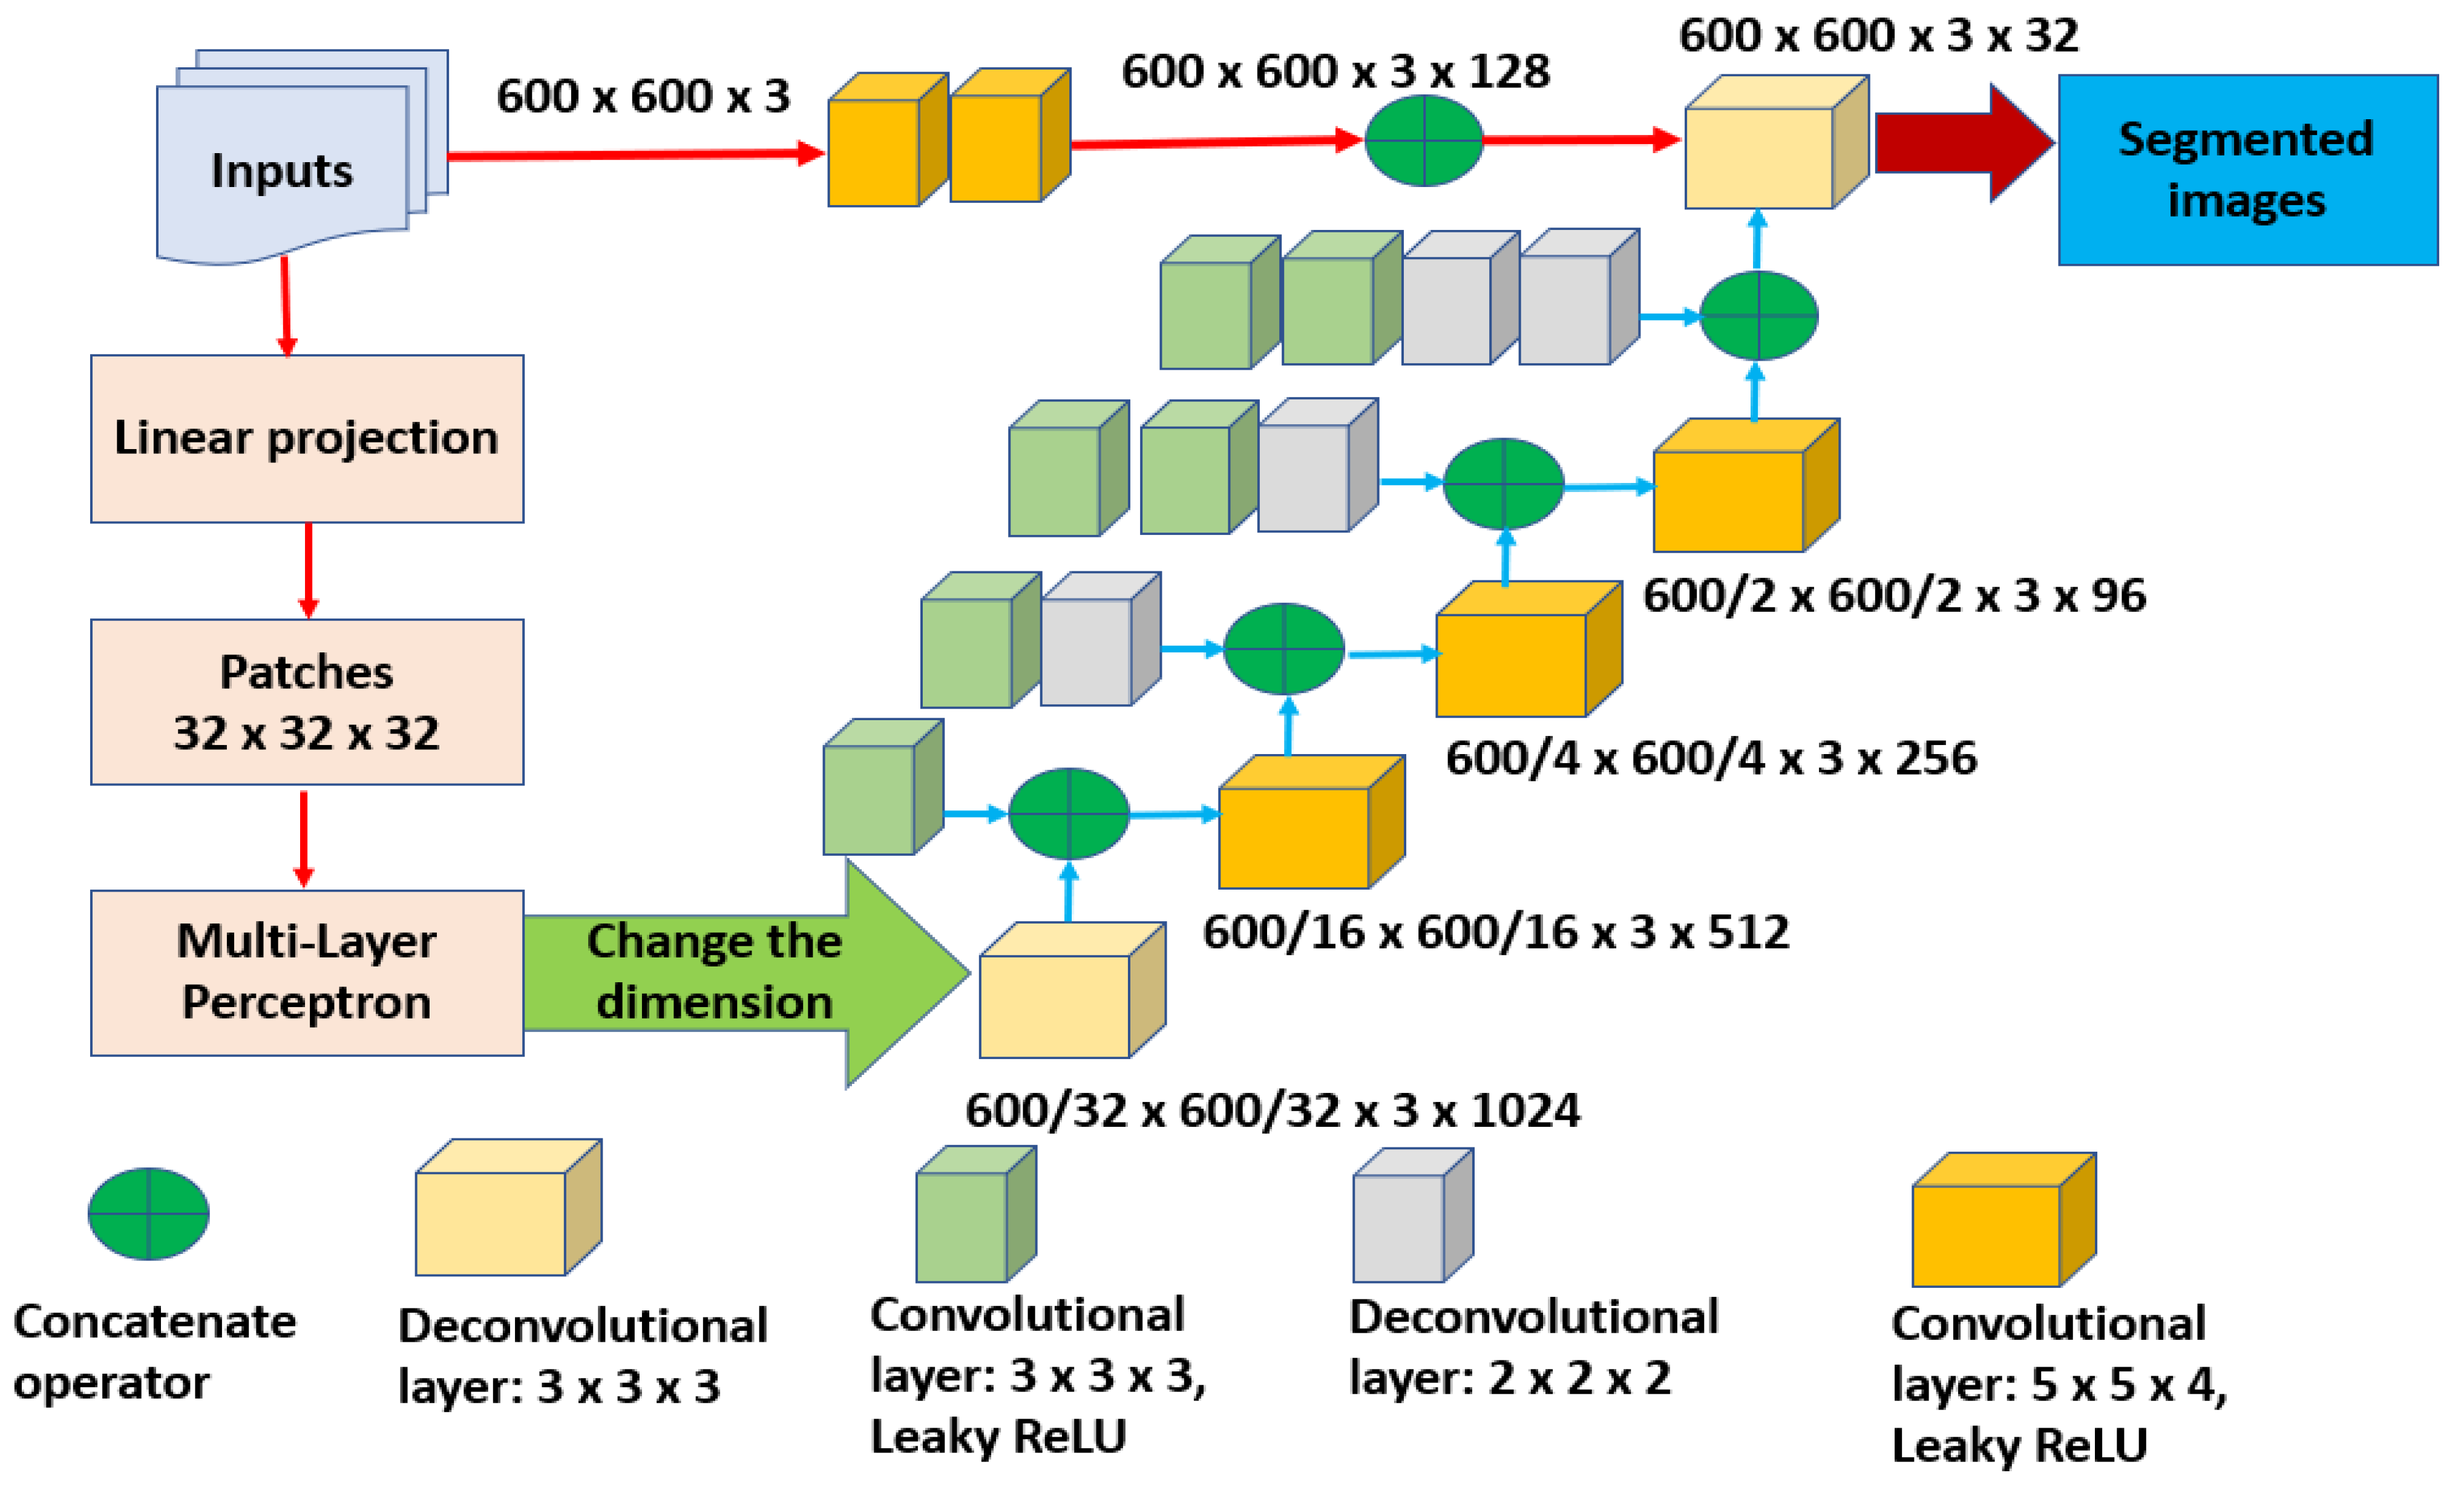
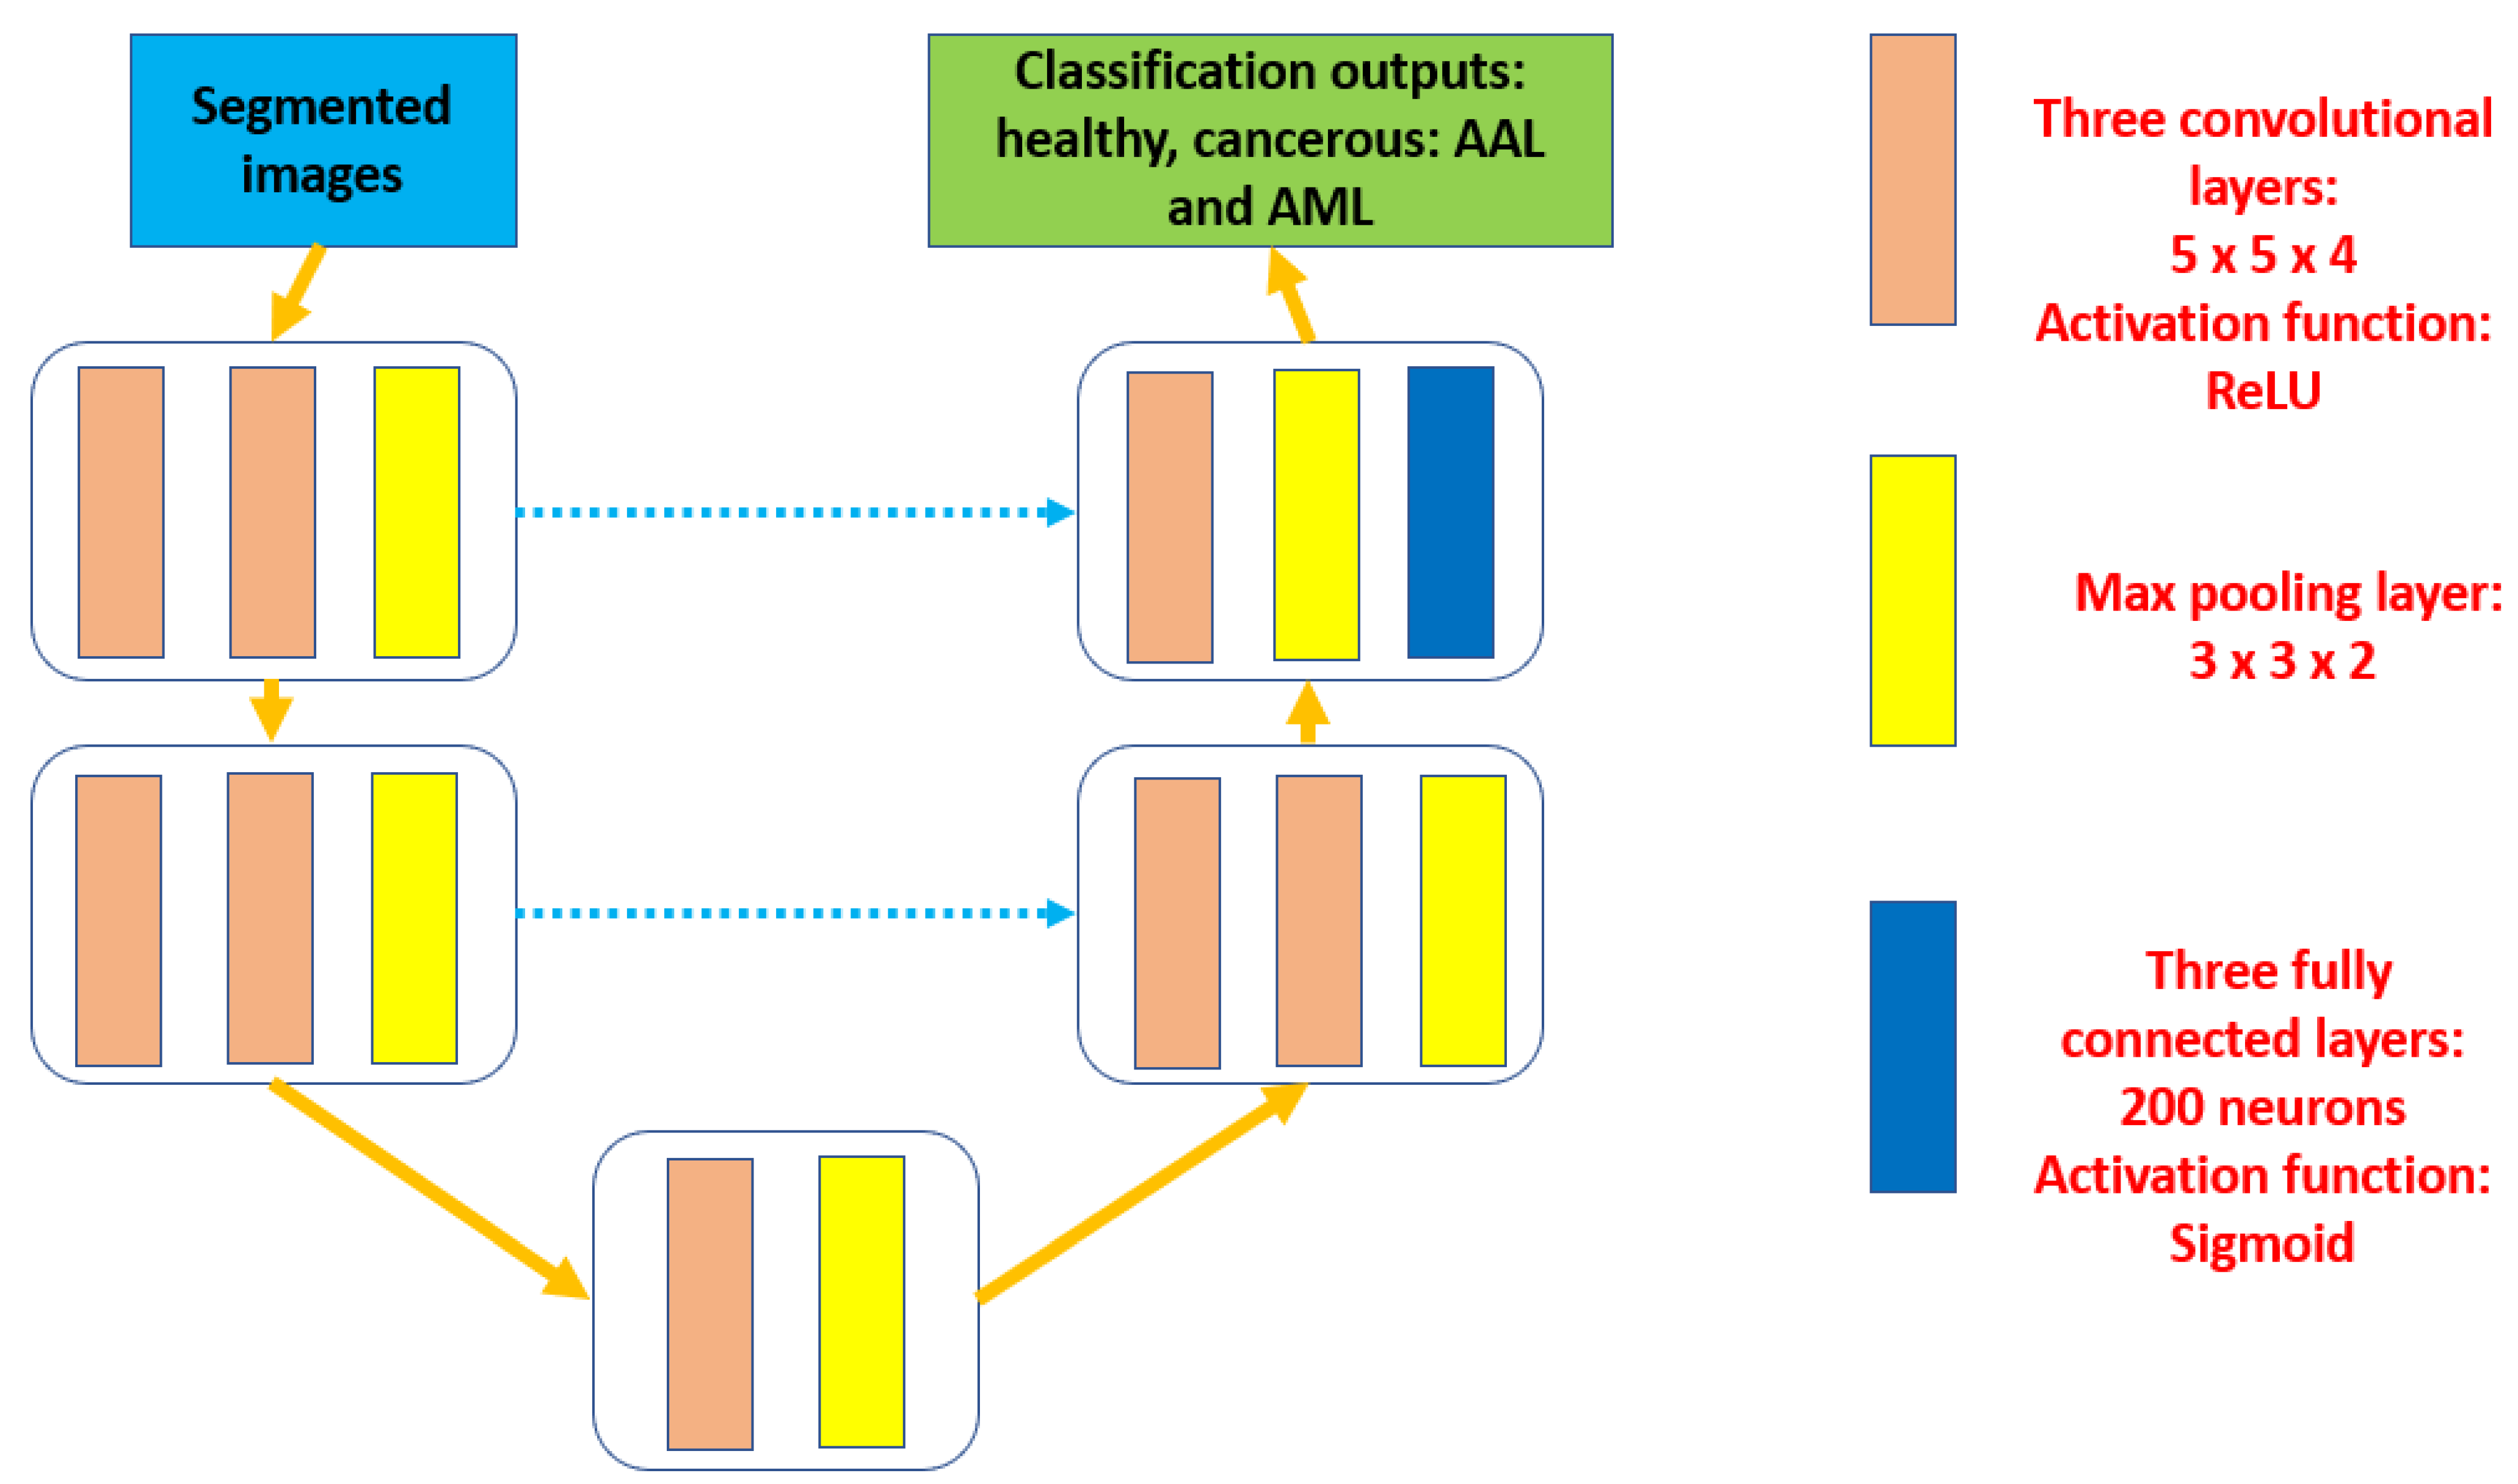
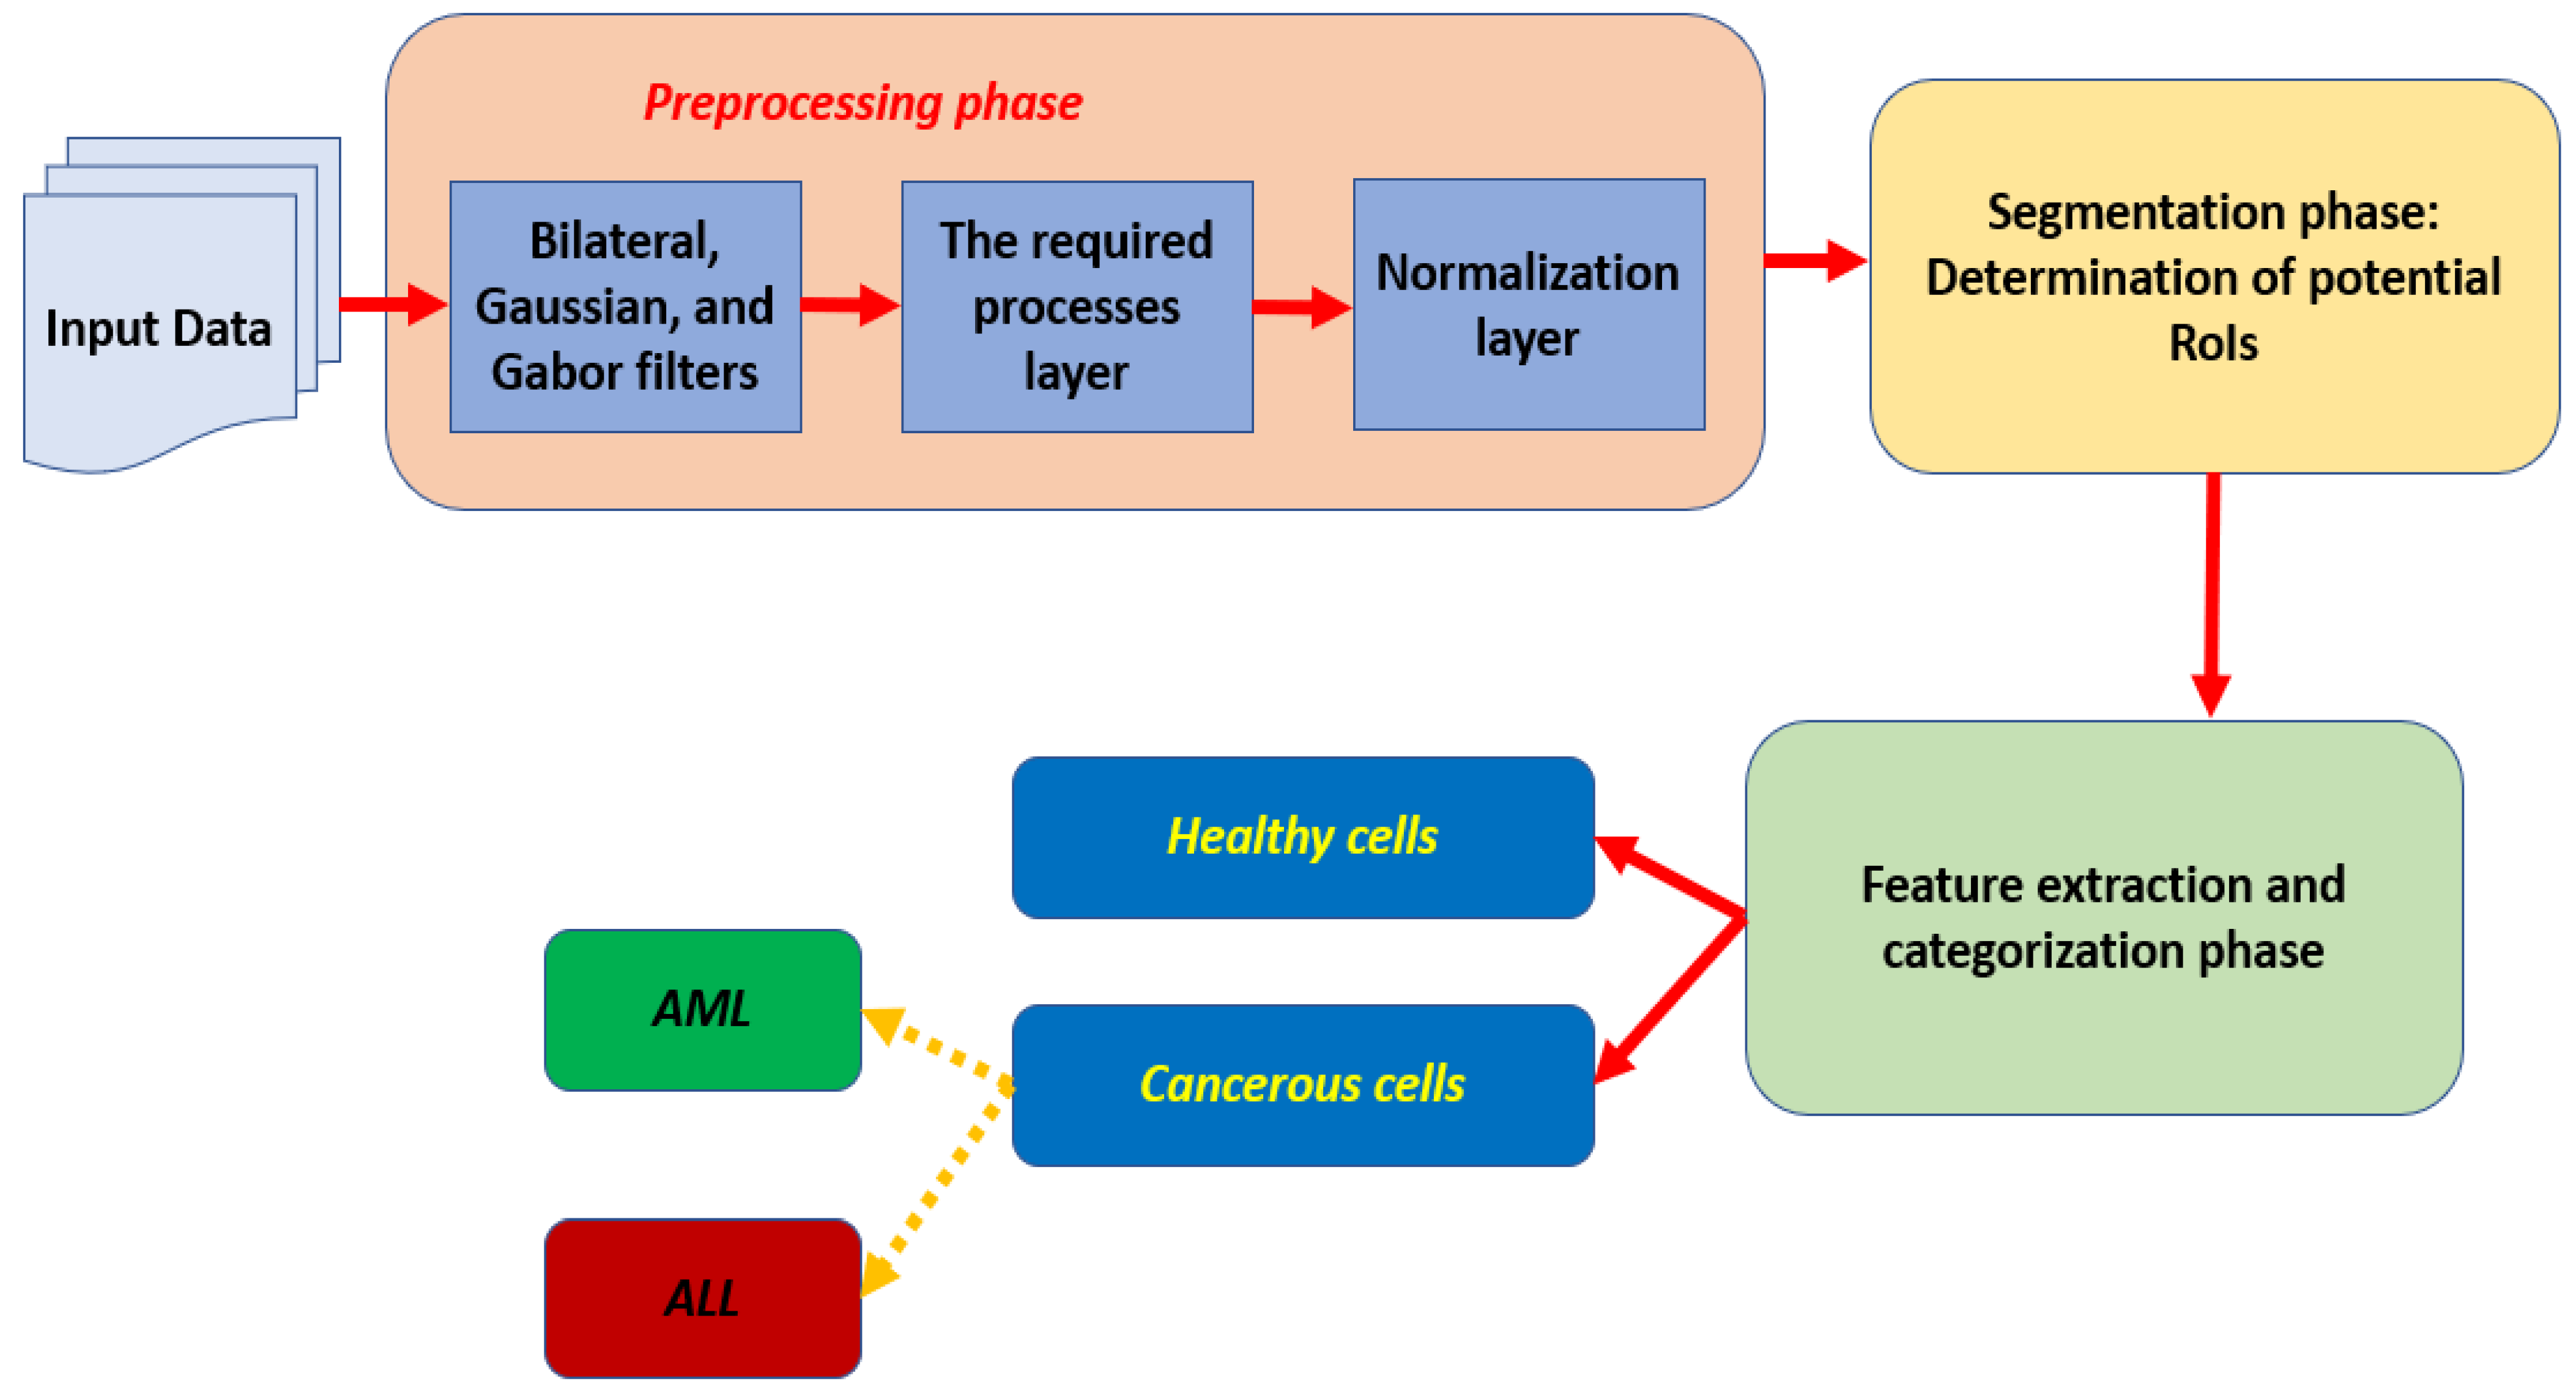
In this research, the proposed algorithm consists of three main components as depicted in Figure 1. Each preprocessed input is segmented in the second phase to outline the potential RoIs and produce semantic outcomes. These segmented results are fed into the third stage to perform the extraction of the required characteristics and categorization procedures.

3.1. Experimental Setup

The conducted experiments were performed on a MATLAB that was installed on a machine with an Intel Core I7 8th Gen., 16 GB RAM, 64-bit Operating System, and 2 GHz. The machine operates using Windows 11 Pro.

3.2. Results

Numerous scenarios were performed to train and test the proposed approach using four datasets. A total of 19,701 images were used for training, whereas 4222 images were utilized for testing purposes. The success or failure of the segmentation stage depends mainly on the segmentation accuracy. As shown in Table 4, different configurations were deployed to provide diverse evaluations. Table 5 lists the achieved average accuracy from the second and third stages. In addition, it shows how accuracy was influenced and impacted by the optimizer. Table 6 shows the obtained average outputs of the considered performance parameters with the use of the optimization tool and without it when the number of iterations ranged from 3000 to 8000.
Accuracy was impacted by the optimizer tool as it increased by 2.48%.
As shown in Table 5 and Table 6, the deployment of the optimizer tool had a significant role in the achieved results. The obtained results of the considered performance quantities were increased using the optimizer tool. 
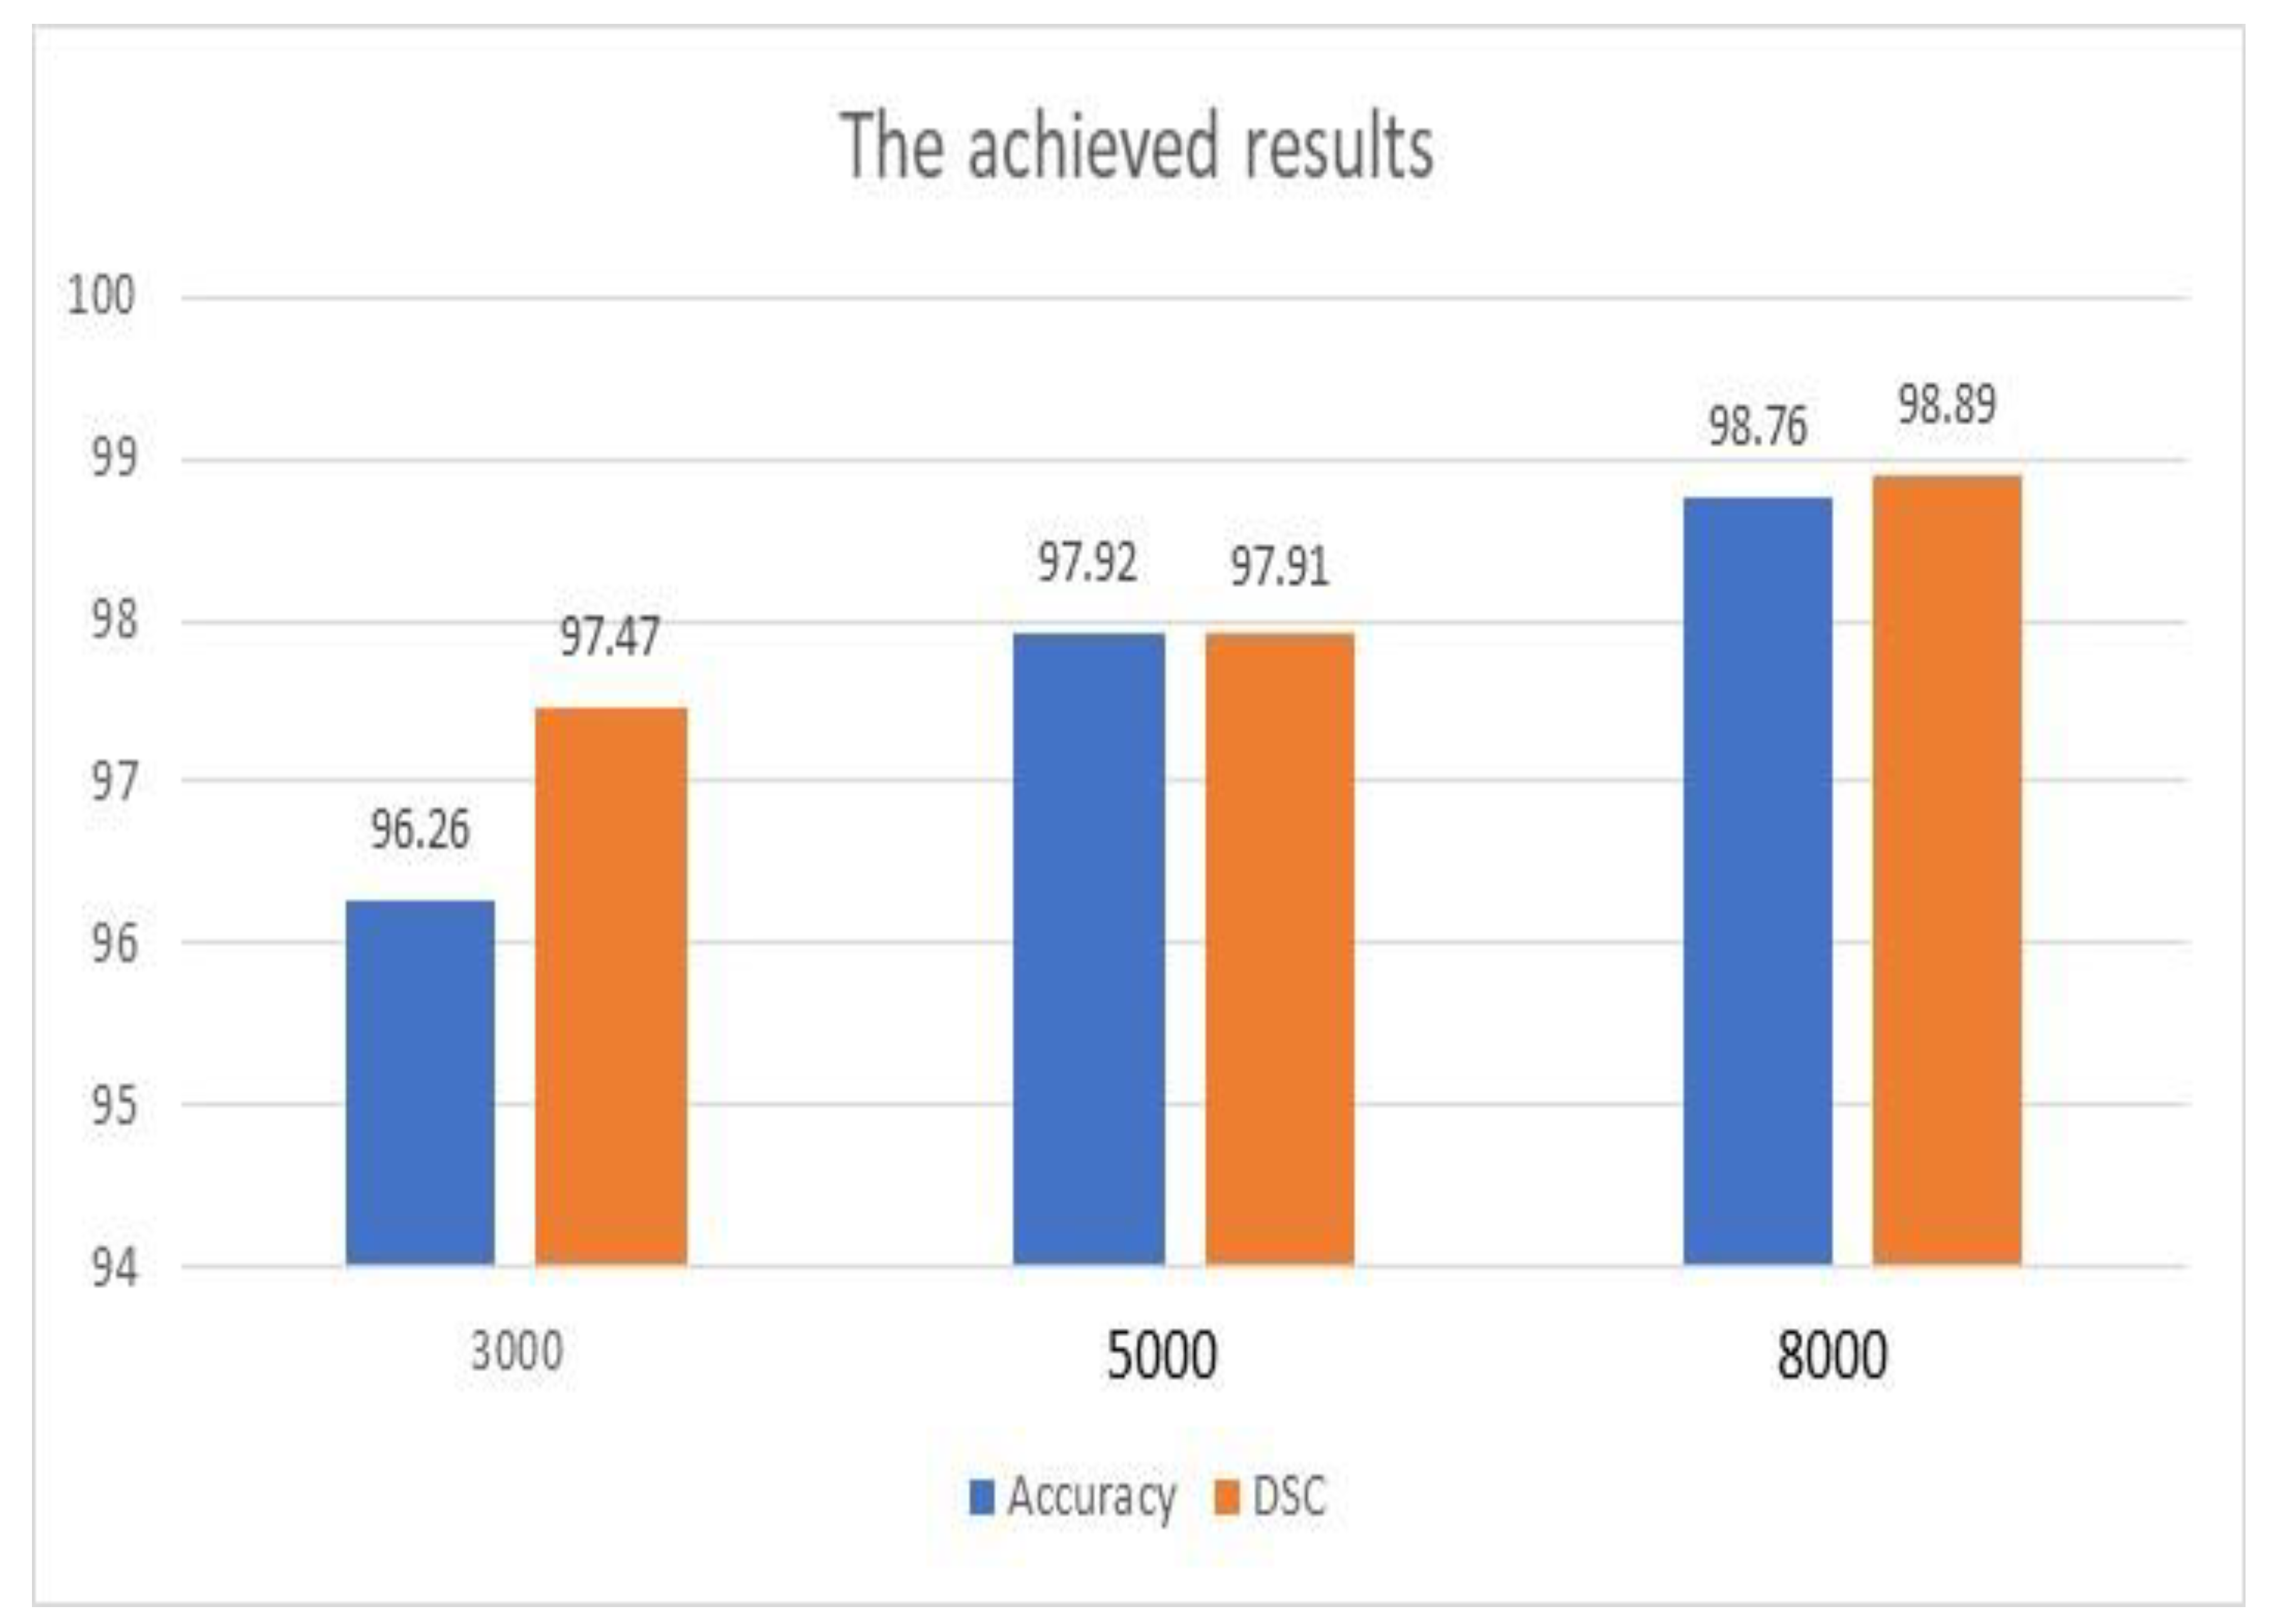
Figure 4 illustrates the achieved outputs of accuracy and DSC when different numbers of iterations were applied, as shown in Table 4. In addition, these results were achieved with the use of the ADAM optimization tool. Both metrics improved significantly as the number of iterations increased. The enhancement of accuracy was 2.66%, while DSC improved by 1.43%. Furthermore, accuracy was improved when the scale of inputs was changed from 600 × 600 to 720 × 720 by approximately 8.21%. However, this improvement occurred with a penalty on the execution time.
Figure 4 and Table 6 show that the achieved results of the proposed model are encouraging, and the system can be deployed to save lives and enhance the diagnosis procedures.
The execution time per input, also known as the processing time, the total number of utilized parameters, and the total number of Floating-Point Operations per Second (FLOPS) were evaluated. This evaluation was conducted according to the assigned size of images, which was 600 × 600, and a sliding window method. Table 7 displays the attained results of these parameters. These outcomes indicate that the presented algorithm is highly computational. Nevertheless, acceptable and reasonable findings were obtained. FLOPS and the total number of parameters were found in millions.
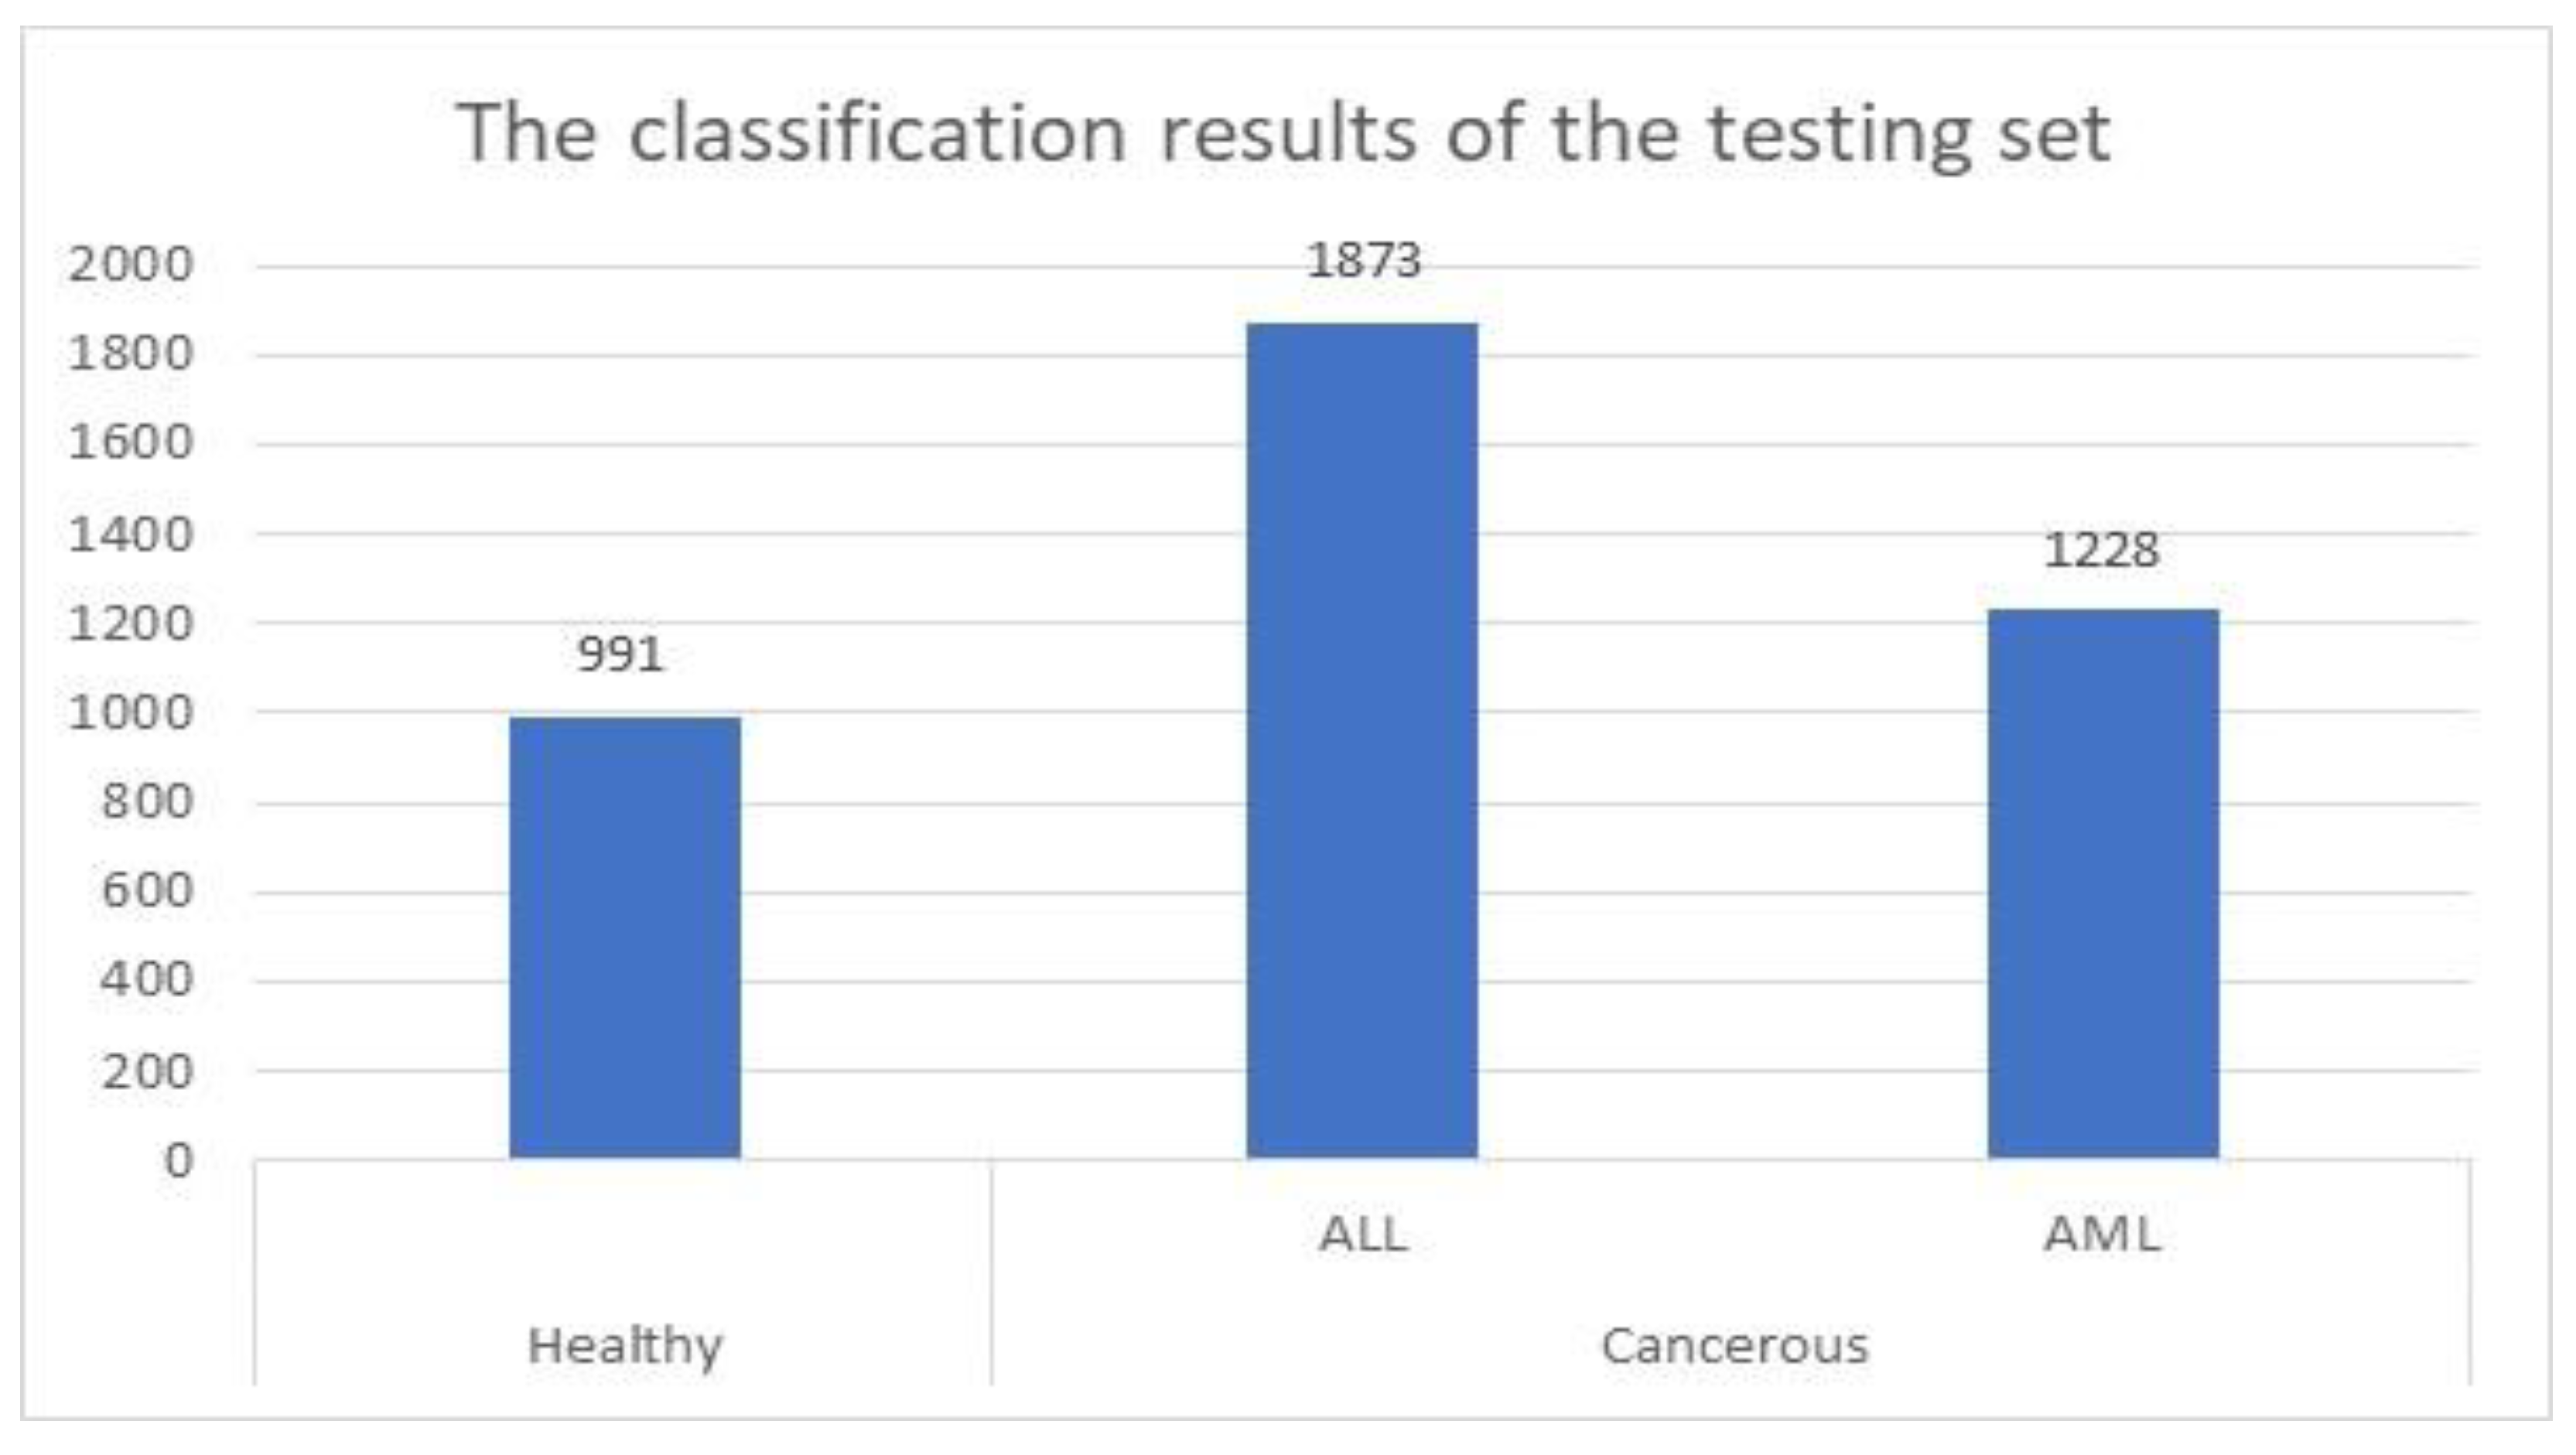
For the testing set, the proposed method was successfully identified and categorized 4092 images out of 4222, which represents approximately 97%. This set contained 1142 healthy cells and 3080 cancerous cells. These cells were 1731 ALL cells and 1349 AML cells. The presented system identified and categorized 991 healthy cells out of 1142 properly. Figure 5 shows the achieved results when the model was applied to the testing set.

3.3. Comparative Assessment

An assessment evaluation between the proposed algorithm and some implemented methods in the literature was conducted to analyze the obtained outputs and efficiency and measure robustness. This comparative study included the number of used datasets, applied technology, obtained accuracy, and DSC. Table 8 shows the performed comparative evaluation.
The presented approach performed better accuracy than the implemented methods in [3,6,8,12], while the approaches in [1,9] gave better results. However, both methods used a single dataset in each, while the proposed algorithm utilized four datasets. In addition, the number of used images in the proposed system was bigger than both models [1,9]. Nevertheless, the presented algorithm attained over 99% accuracy when the number of iterations exceeded 15000 and the value of learning changed from 0.001 to 0.01. Furthermore, the accuracy was enhanced by nearly 1.8% when the patch size decreased by half.
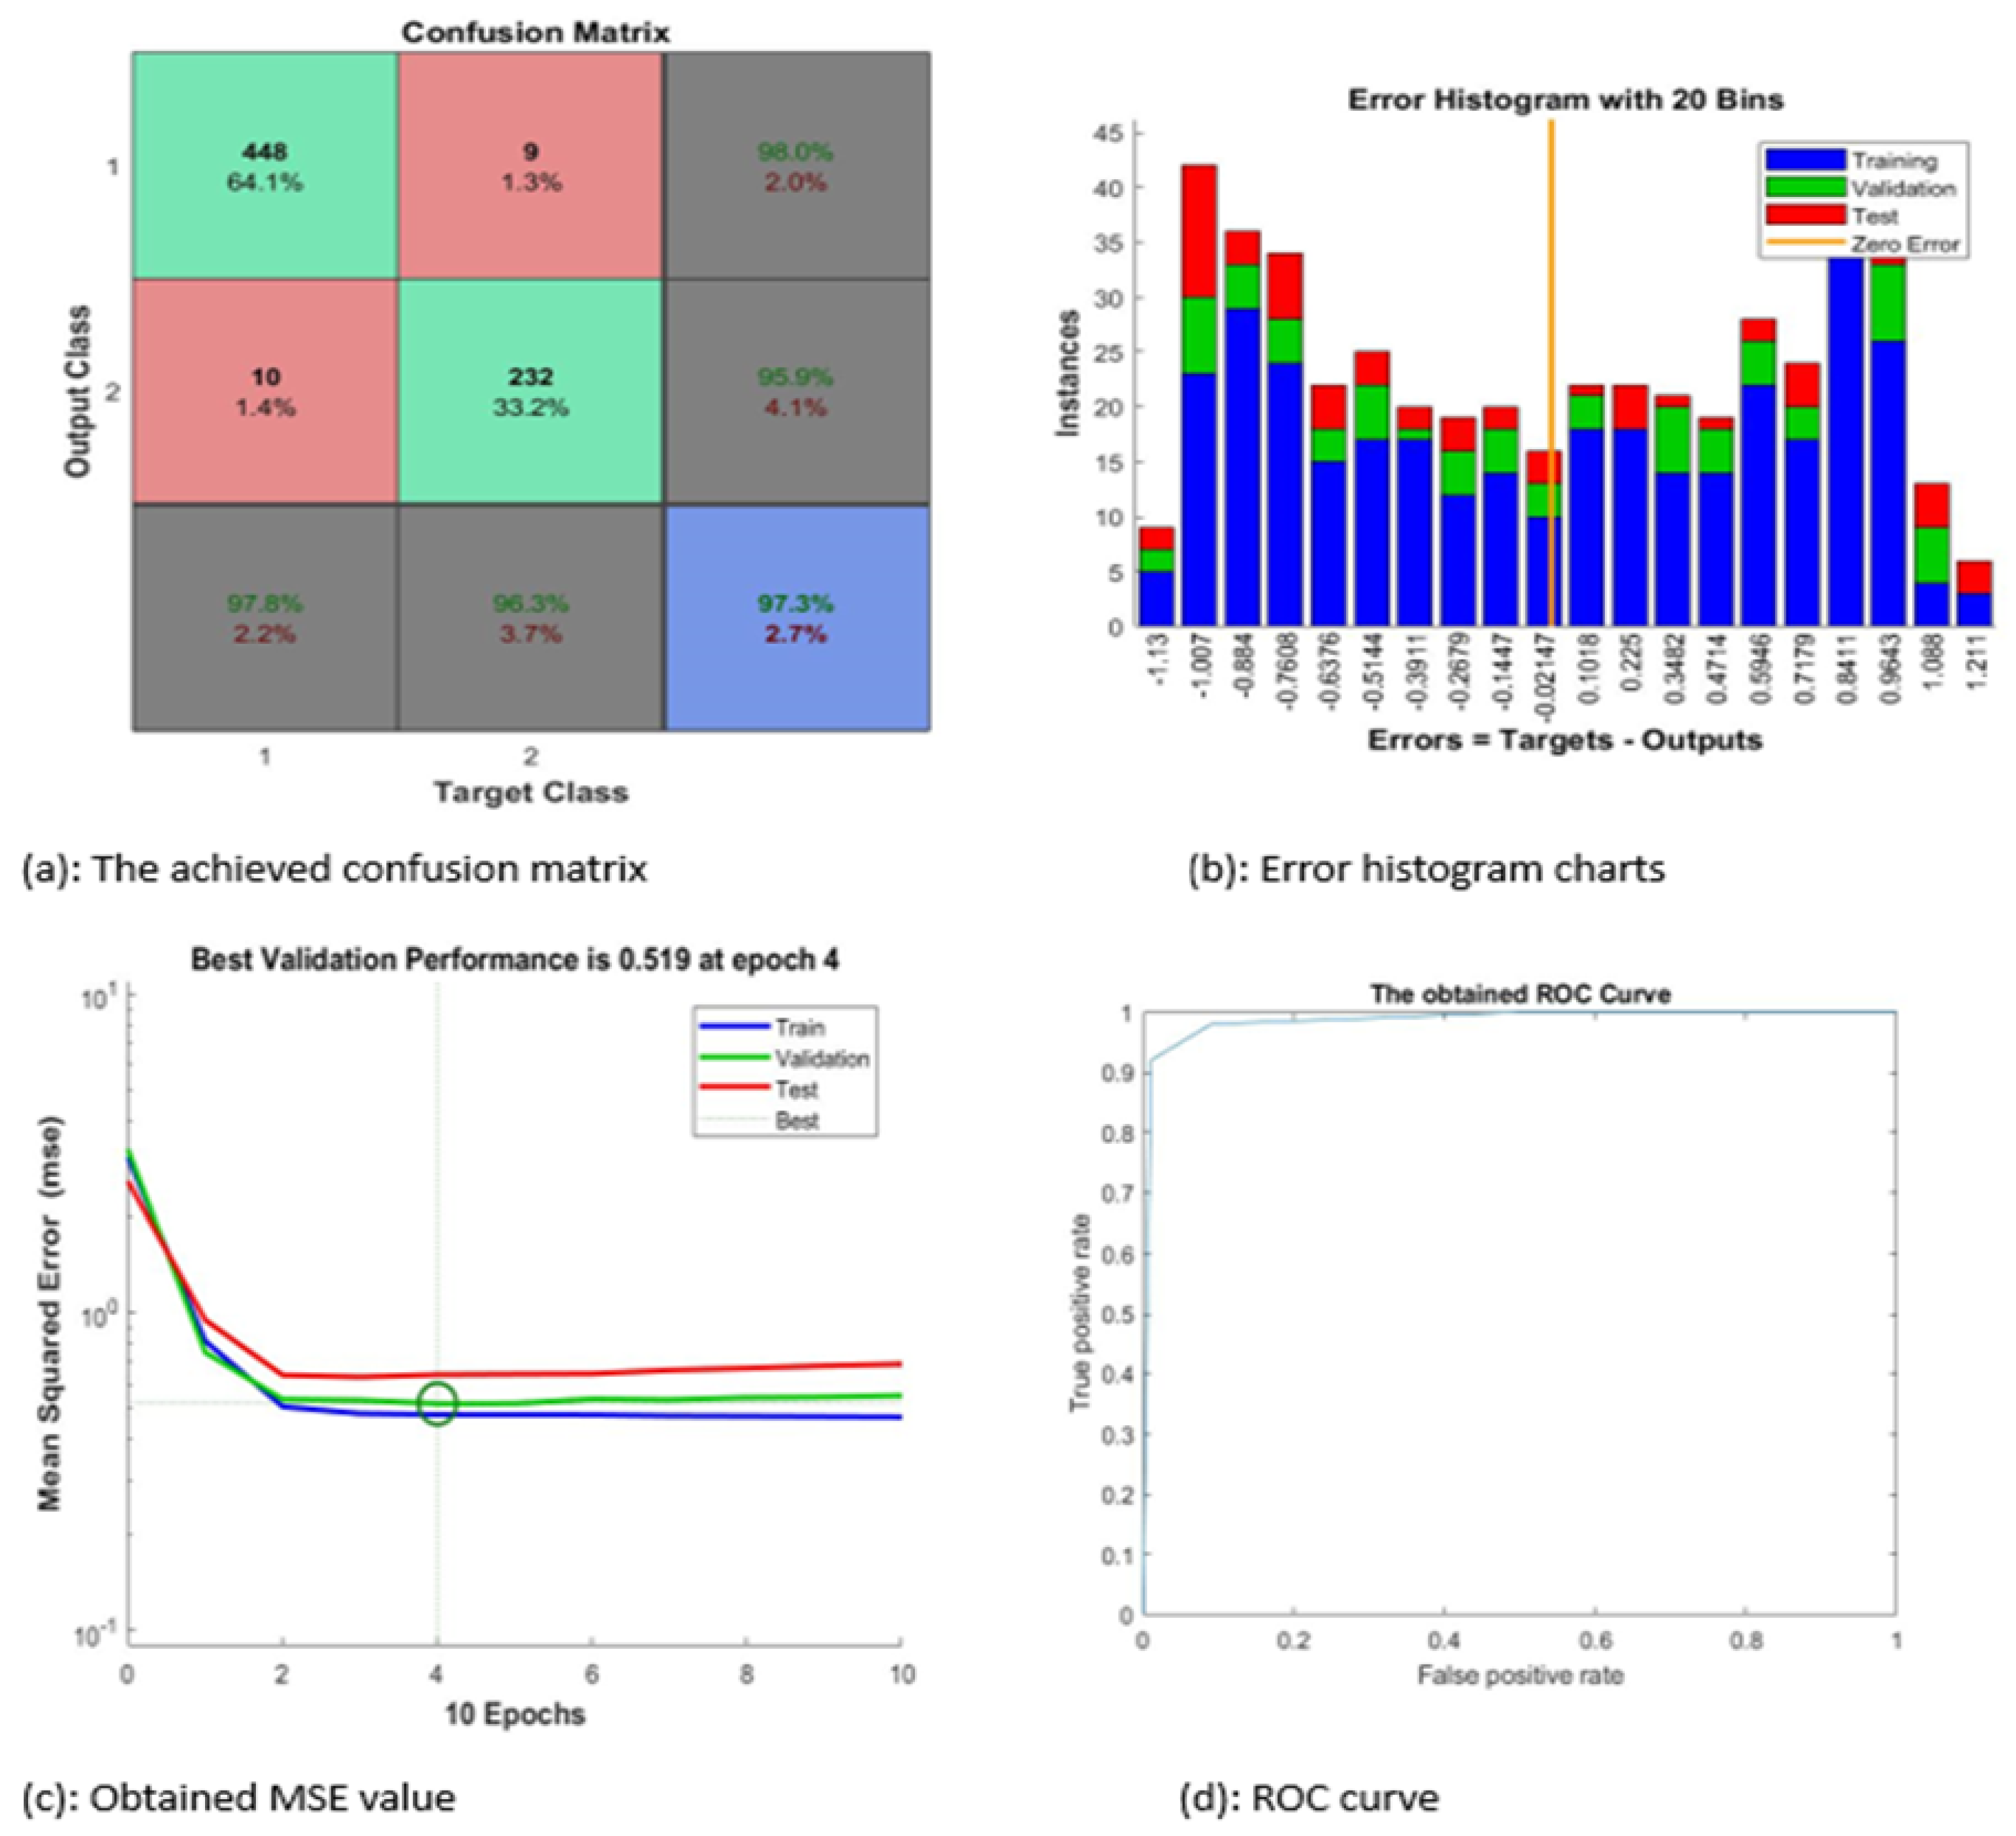
Figure 6 contains four subgraphs: (a) illustrates a confusion matrix for a sample of 700 images, (b) depicts an error histogram, (c) depicts a chart of Mean Squared Error (MSE), and (d) depicts a curve of Receiver Operating Characteristic (ROC). In Figure 6a, class 1 denotes the ALL type and class 2 refers to the AML type.
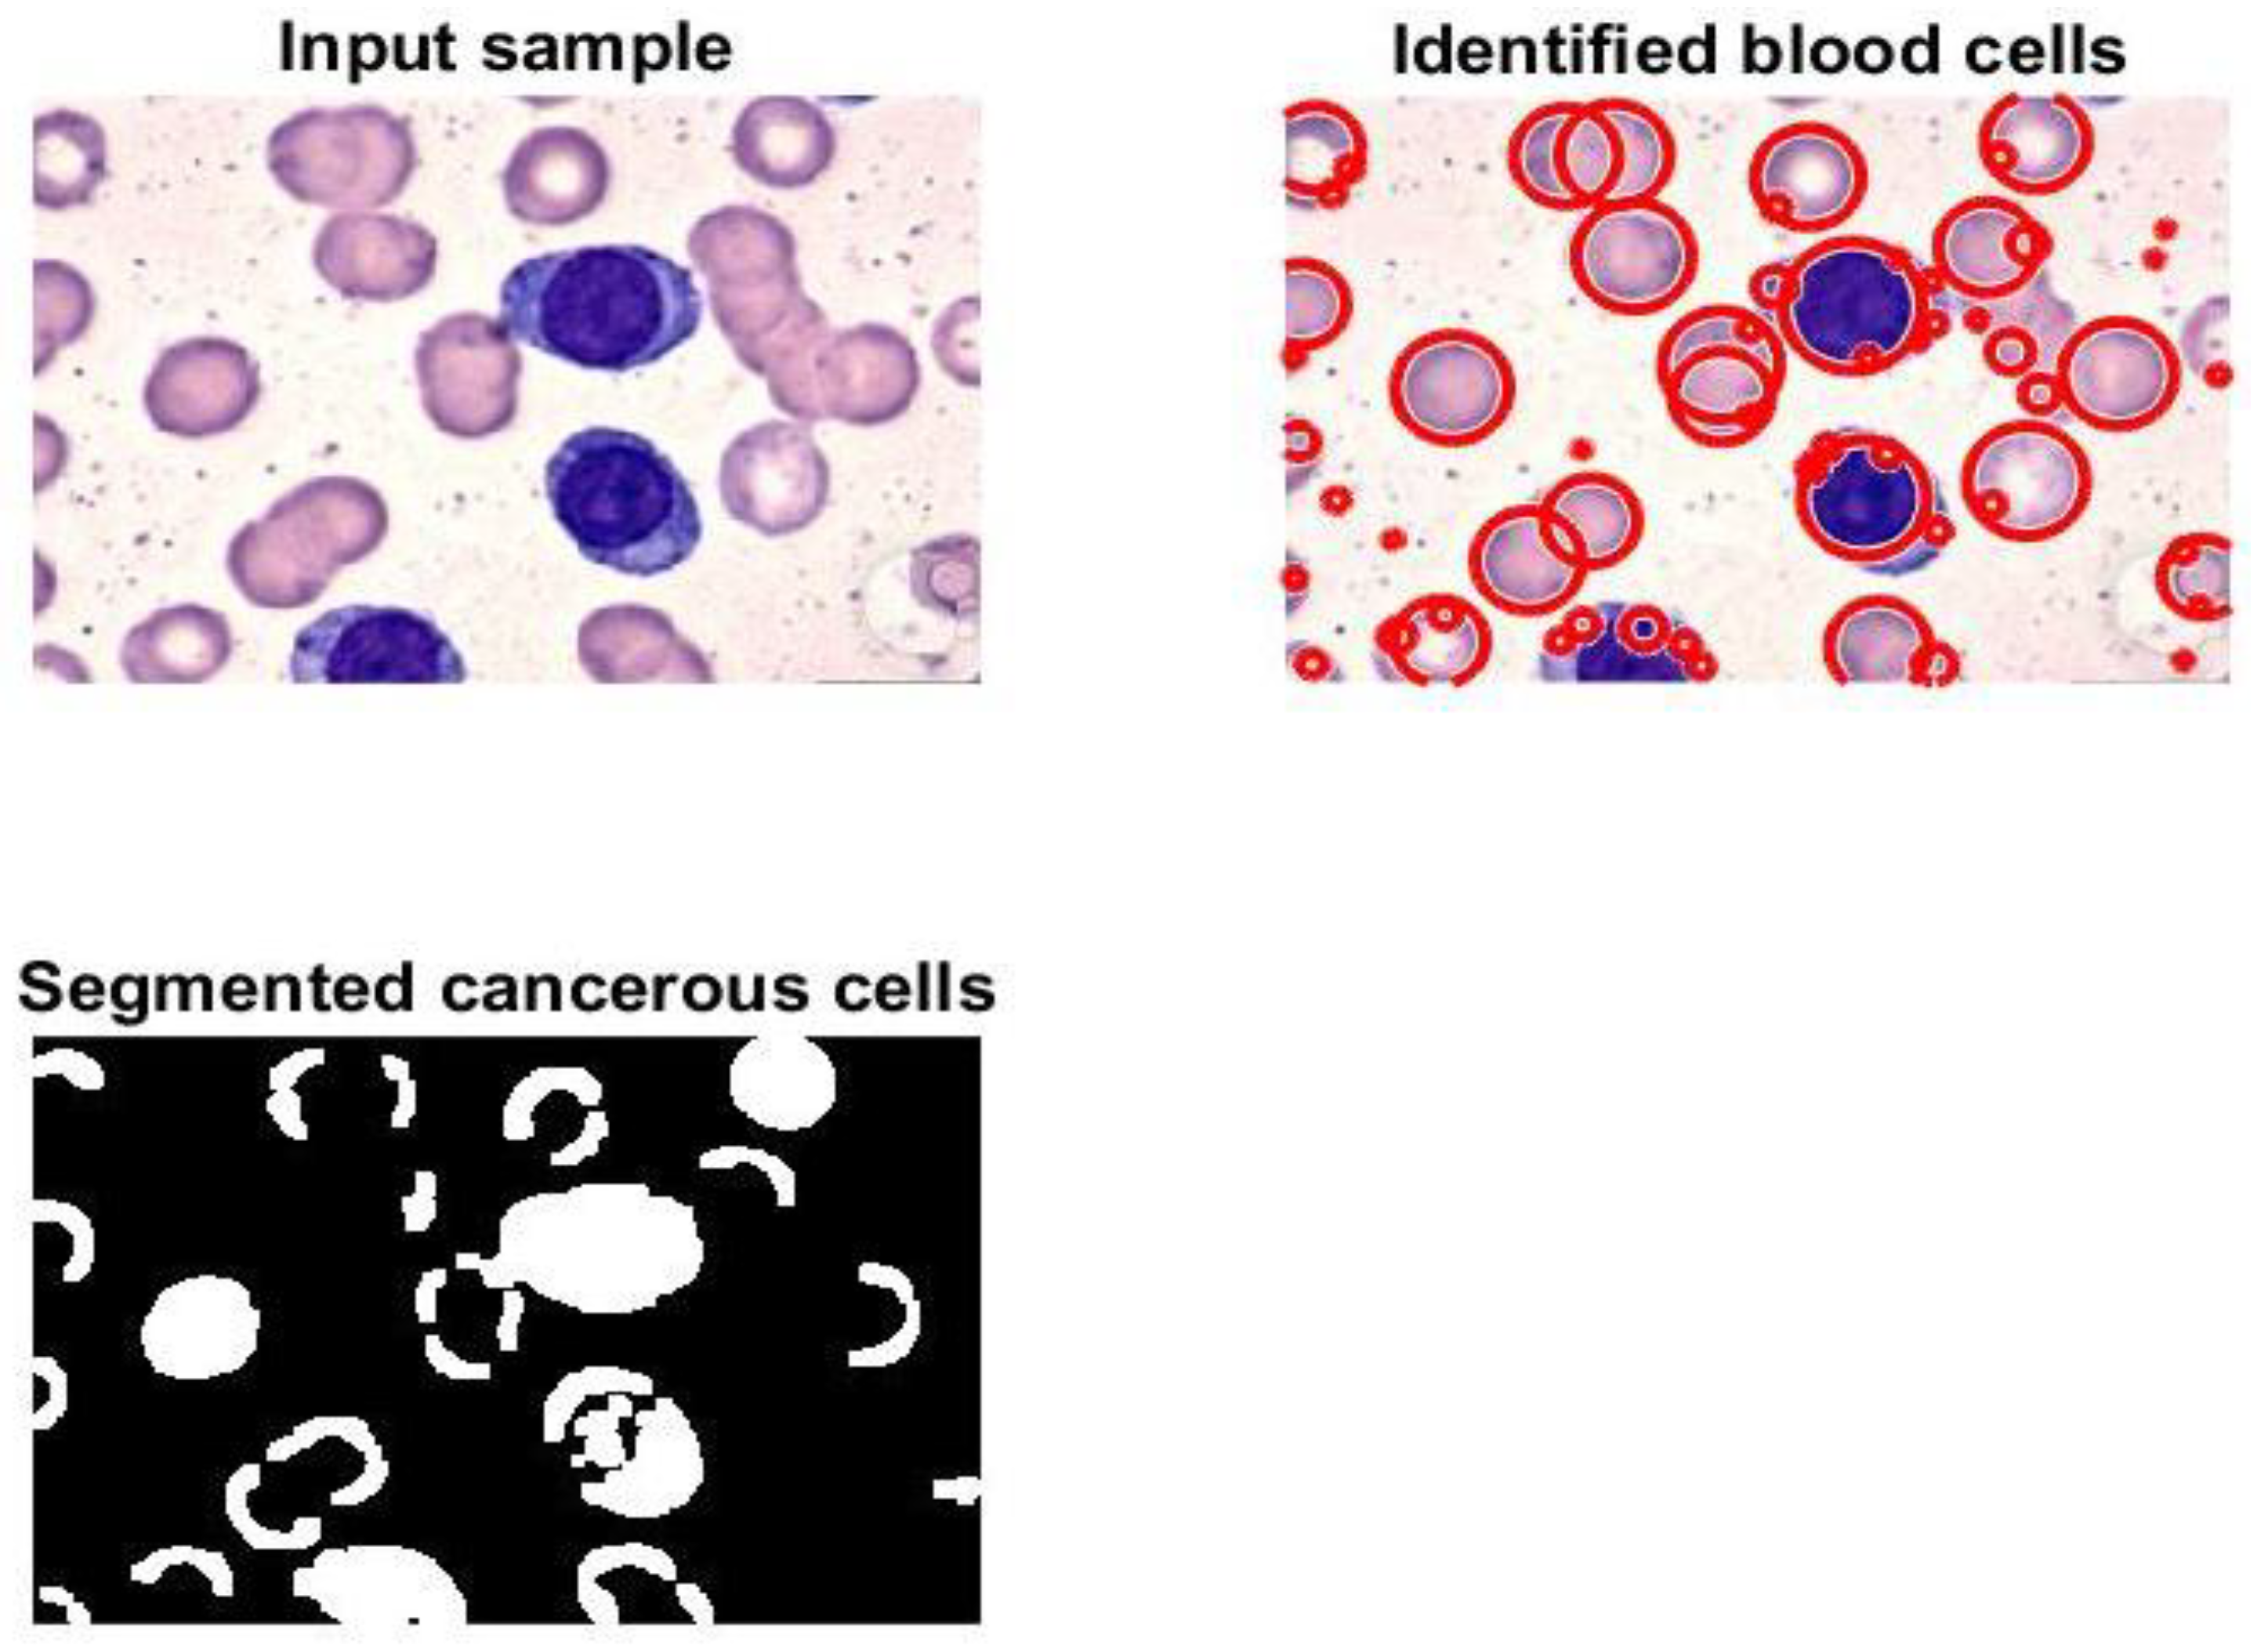
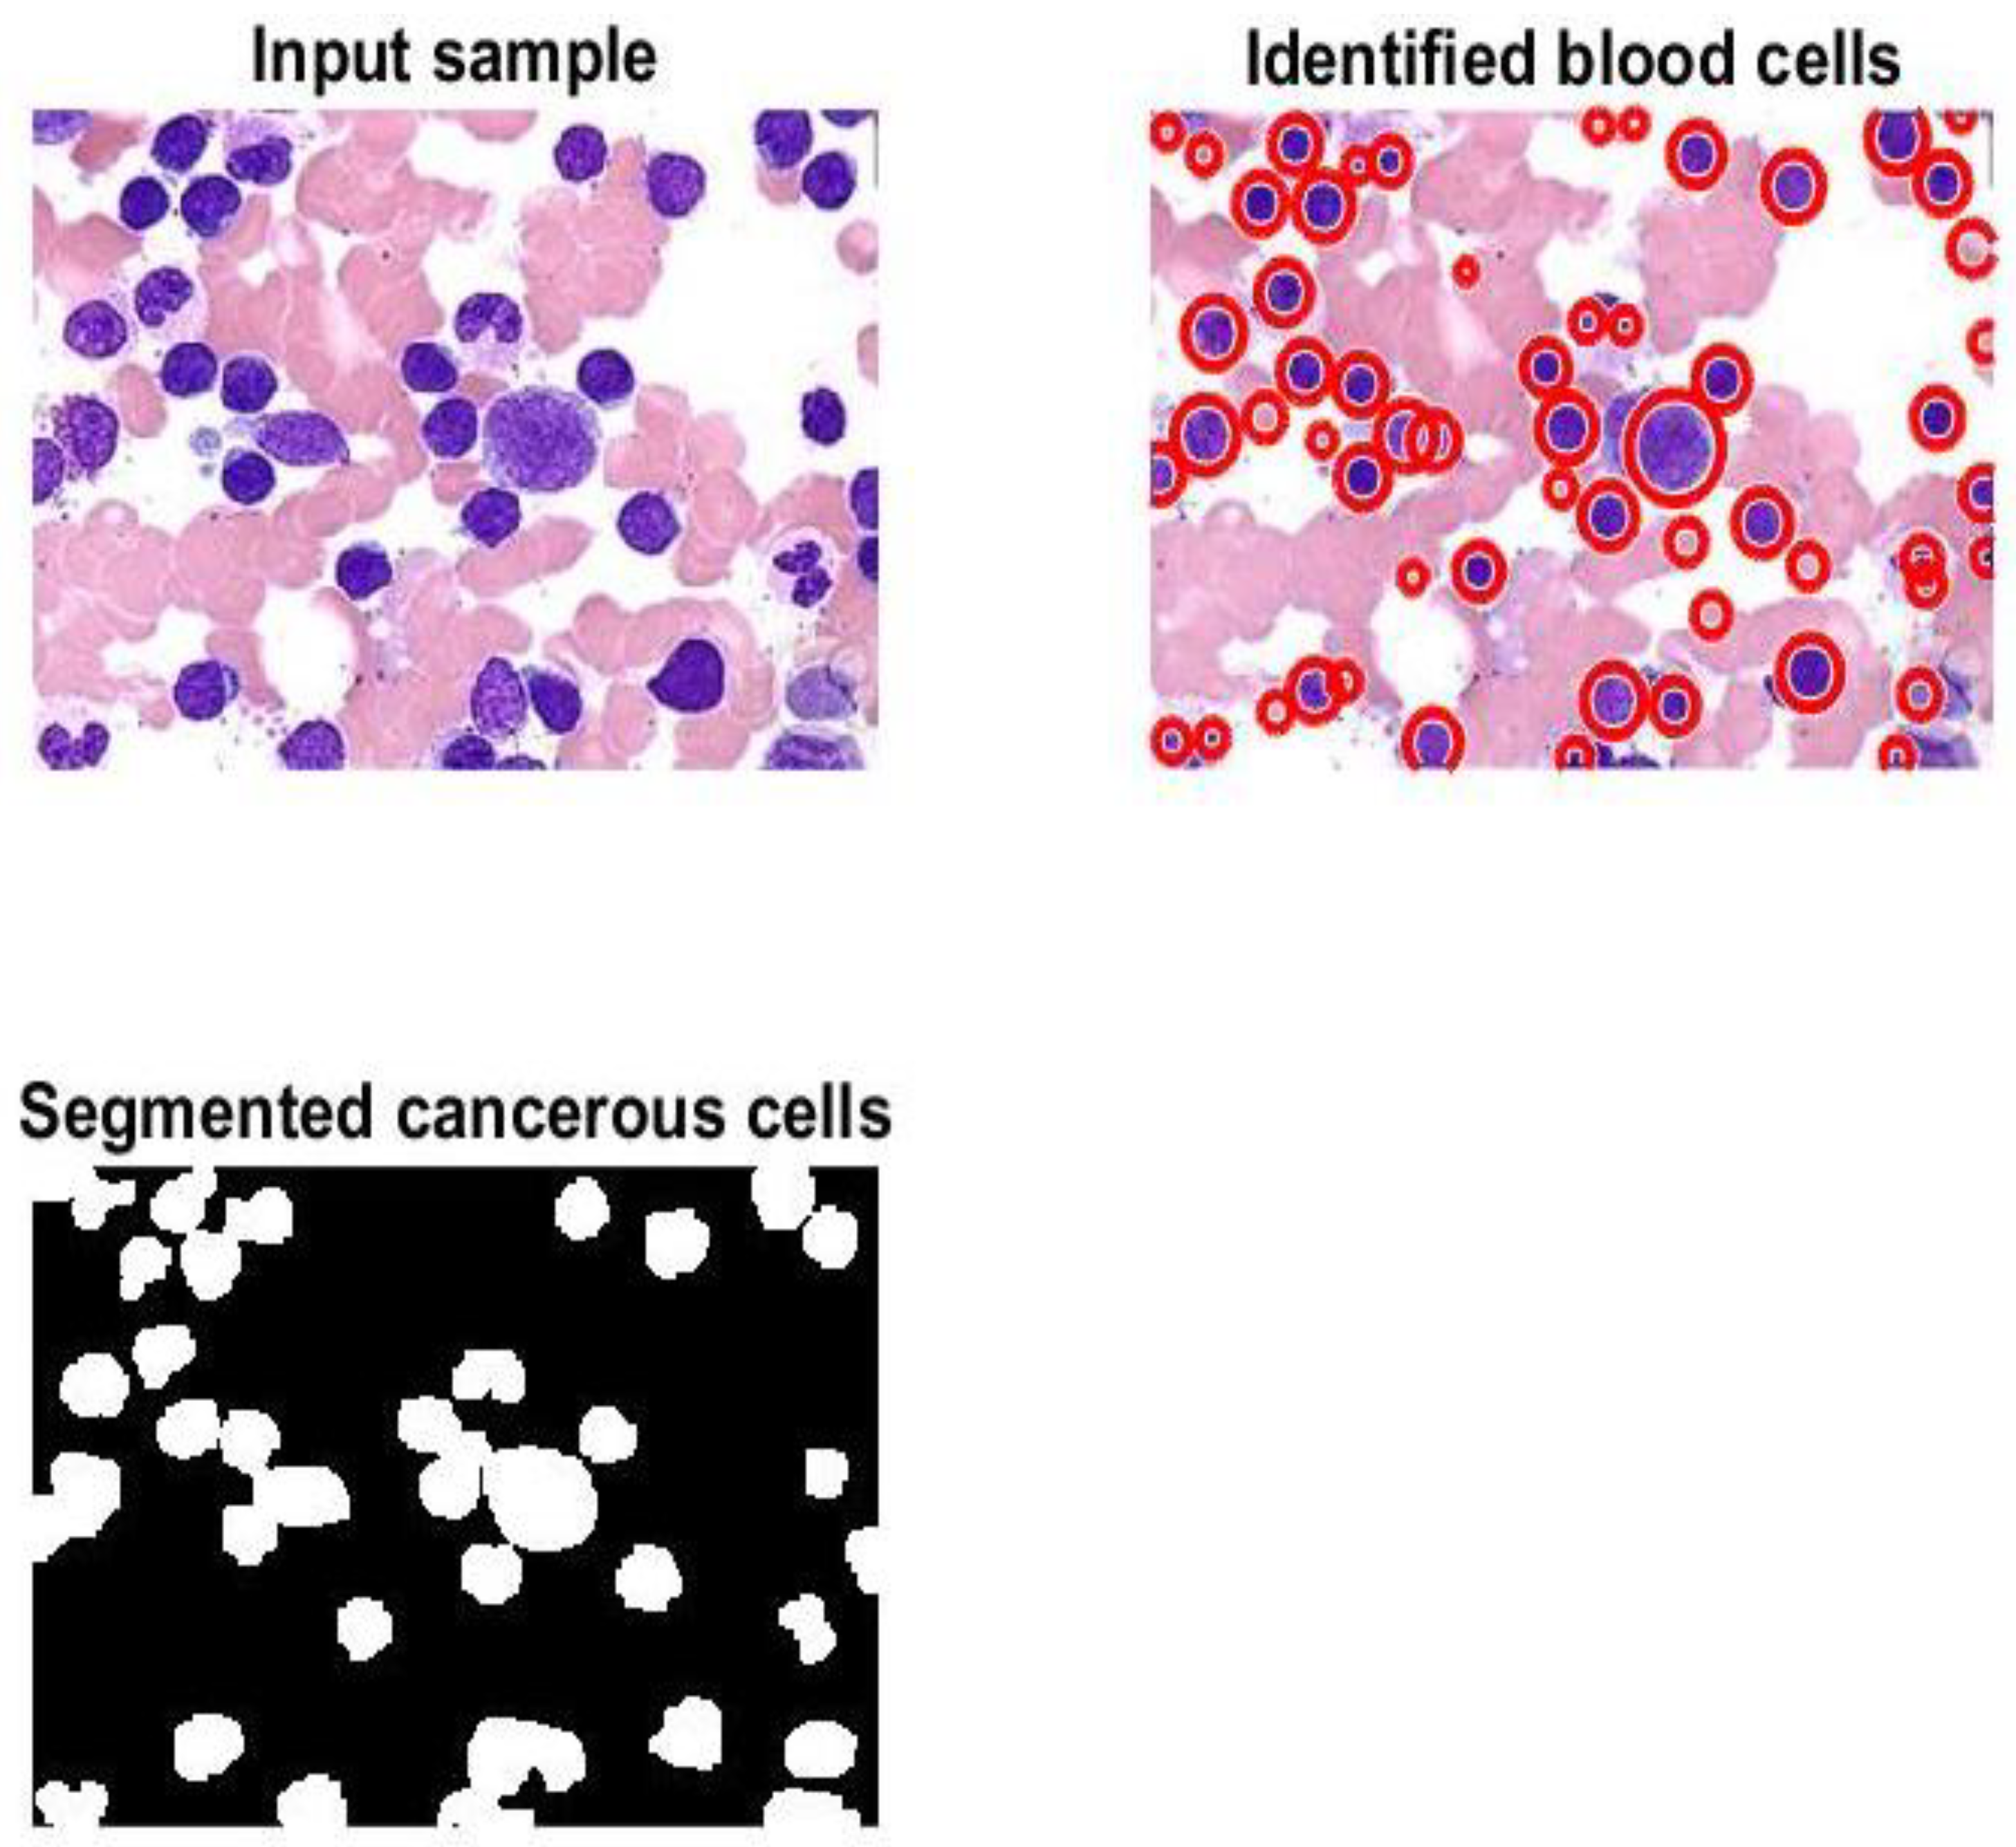
 Figure 7 and Figure 8 display samples of segmentation outcomes for two inputs. Both Figure 7 and Figure 8 contain three subgraphs in each. These subgraphs are original inputs, identified and outlined potentially infected cells, and binary segmented masks.
In Figure 6, the proposed system categorized nearly 97.3% of the given sample accurately. The best value of MSE occurred at epoch 4 with a minimum value of 0.519.

3.4. The Cross-Validation Results

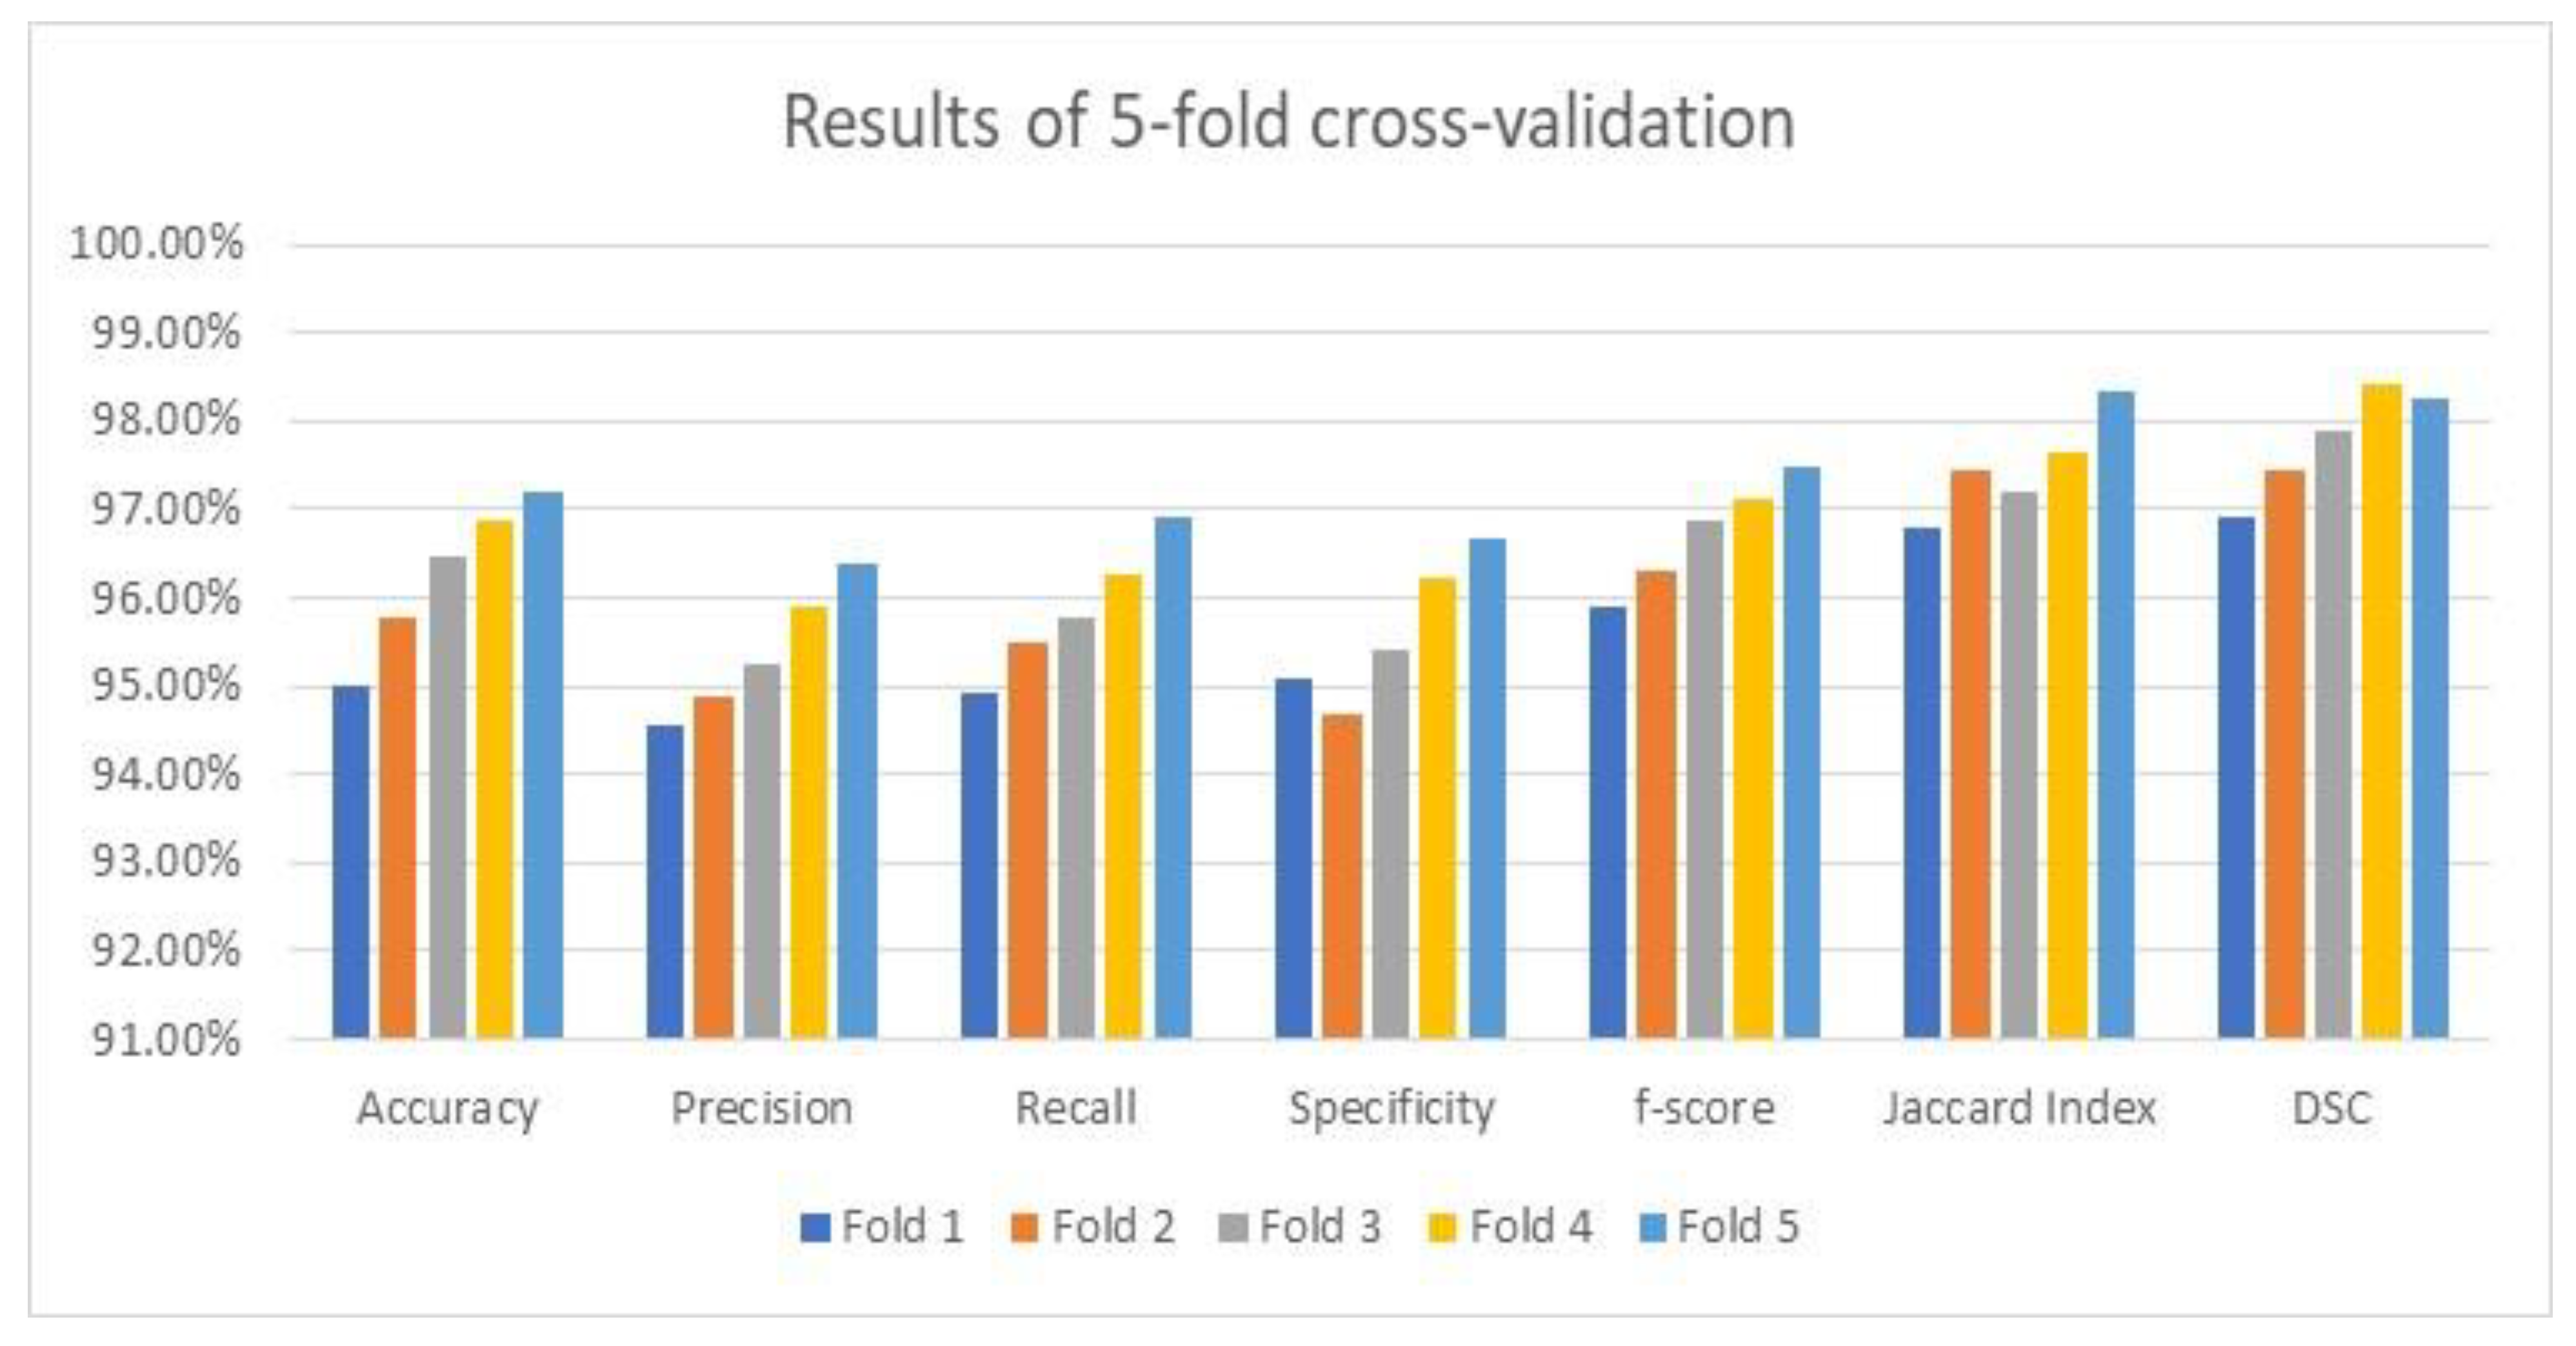
As stated earlier, the utilized datasets were divided into three dependent sets: training, validation, and testing. The testing set was evaluated using an average value on the five-fold cross-validation methodology to prove its accuracy and robustness. The attained average results of the considered performance parameters and their averages by the suggested framework are illustrated in Figure 9 using the applied optimizer. These results are exquisite and imply that the framework is reliable and trustworthy since accuracy, which is the main focused metric, increased after each fold as depicted in Figure 9. Figure 9 shows the visualization charts of the performance parameters using five-fold cross-validation.

3.5. The Influence of Modifying the Deployed Hyperparameters

As shown in Table 7, the elapsed time for every input is nearly 8.5 s, which is considered higher than what was anticipated. Thus, the hosting machine started suffering from allocated hardware resources. Therefore, modifying or adjusting the applied configurations was required to reduce the execution time and minimize the required resources, such as memory. Thus, reducing the patch size to 6 was the optimal value to achieve the desired outputs. In addition, the decay factor was set to 0.25 to lower the learning rate by the decay factor if no enhancement in accuracy was noticed for seven consecutive epochs. Moreover, the proposed framework used an early stopping strategy to prevent overfitting from occurring. This forced the framework to halt or terminate if it detected an overfitting issue. These modifications improved the execution time by 34.87%, decreased to 5.536 s per image, and the number of total parameters went down by 24.1% and the number of FLOPS decreased by approximately 28%. Accuracy was positively affected since it was enhanced to nearly 98.76%.

3.6. The Statistical Analysis

A statistical analysis between the suggested framework and two traditional convolutional neural networks was performed based on the test based on a statistical parameter, which was the mean. These two convolutional neural networks were LeNet and Residual Neural Network (ResNet). Three performance indicators were measured, which were accuracy, F-score, and Jaccard Index. Table 9 lists the obtained outcomes; these findings confirmed that the variations between the offered framework and other convolutional neural networks are statistically noticeable. The best results are bold. Moreover, the presented framework surpasses these networks.

4. Discussion

Various metrics of the presented algorithm were evaluated and analyzed. The comparison study in Table 8 reveals that the model produces encouraging findings, and these results indicate that it is possible to apply the model in healthcare facilities to support physicians and pathologists. Saving patients’ lives can be achieved with support from the proposed method. This method can identify, outline, and segment the potential RoIs appropriately as shown in Figure 7 and Figure 8. Moreover, counting of the number of blood cells takes place in this algorithm. The presented framework’s performance was assessed as shown in Table 6; the obtained results show that exquisite findings were reached and considered promising. In addition, this framework was compared against some developed works from the literature. This comparison is reported in Table 8, and it shows that the implemented framework outperforms all models except those from [1,9]. This assessment demonstrates that the proposed framework shows higher performance than most of the current techniques.
Numerous experiments were performed in this research to exhibit and validate the attained performance results by the presented framework by modifying and adjusting the applied configurations of the hyperparameters and preprocessing methods. The execution time reduced from 8.5 s per image to 5.536 s, which means the improvement was nearly 34.87%. In addition, the number of the total parameters went down from 63.82 million to approximately 48.44 million; the percentage of this reduction is 24.1%. Moreover, the number of FLOPS decreased by approximately 28%. The performed changes affected the performance quantities positively, since accuracy was raised to nearly 98.76%, precision increased to 97.84%, recall went up to 98.02%, specificity enhanced to 97.47%, F-score was raised to nearly 99.21%, and Jaccard Index and DSC increased to 98.61% and 98.76%, respectively.
Investigating the effectiveness of data augmentation on the proposed framework was explored. This investigation showed that applying the framework without data augmentation affected its performance negatively since accuracy dropped to 94.11% due to limitations in capturing the complexities between data. Moreover, other metrics went down significantly. The lowest result was around 90.34% for specificity.
The major limitation/obstacle that this research faced was the availability of all leukemia types as the applied datasets contain only two types, ALL and AML, as stated earlier. In this regard, these datasets are believed to be difficult in many attributes. Firstly, only two types exist with different sizes, which require rescaling for each input. Secondly, rescaling all images takes time, and this results in the elapsed time by the framework. Lastly, these datasets entail multi-class classification on the pixel level of the binary image mode, which forces us to deploy various methodologies to reach the final findings.

5. Conclusions

This article proposes a new algorithm to identify and classify two types of leukemia, which are ALL and AML. This algorithm contains three main components, which are image preprocessing, segmentation, and classification. The segmentation part is developed using U-shaped architecture and the classification procedures are performed using a newly developed UNET. Four datasets were used to validate and test the model. These validation and testing operations were conducted using numerous experiments on the MATLAB platform. The proposed model reached an accuracy between 97% and 99%. However, reaching high accuracy requires increasing the number of iterations and decreasing the patch size. These two factors affect the execution significantly. This approach suffers from computational complexity since a huge number of parameters were involved. In addition, only two types of leukemia were identified and categorized because no public datasets for other types were found. These limitations can be resolved by having additional datasets for the remaining types and optimizing the proposed model to reduce the utilized number of parameters.
Improving classification accuracy, reducing computational complexity, and adding additional datasets will be considered in future work.

Author Contributions

Conceptualization, A.K.A. and A.A.A.; data curation, T.S. and A.A.; formal analysis, A.A.A. and Y.S.; funding acquisition, A.K.A.; investigation, A.A.A. and A.A.; methodology, T.S. and Y.S.; supervision, A.K.A.; validation, A.K.A., A.A.A., T.S. and Y.S.; writing—original draft, A.A.A. and A.A.; writing—review and editing, A.K.A., T.S. and Y.S. All authors have read and agreed to the published version of the manuscript.

Funding

The authors extend their appreciation to the Deanship of Scientific Research at Northern Border University, Arar, K.S.A. for funding this research work through the project number “AMSA-2023-12-2012”.

Data Availability Statement

In this study, datasets were downloaded from the Kaggle website. Their references are available in the reference section.

Conflicts of Interest

The authors declare no conflict of interest.

References

  1. Veeraiah, N.; Alotaibi, Y.; Subahi, A.F. MayGAN: Mayfly optimization with generative adversarial network-based deep learning method to classify leukemia form blood smear images. Comput. Syst. Sci. Eng. 2023, 42, 2039–2058. [Google Scholar] [CrossRef]
  2. Nekoeian, S.; Rostami, T.; Norouzy, A.; Hussein, S.; Tavoosidana, G.; Chahardouli, B.; Rostami, S.; Asgari, Y.; Azizi, Z. Identification of lncRNAs associated with the progression of acute lymphoblastic leukemia using a competing endogenous RNAs network. Oncol. Res. 2023, 30, 259–268. [Google Scholar] [CrossRef] [PubMed]
  3. Veeraiah, N.; Alotaibi, Y.; Subahi, A.F. Histogram-based decision support system for extraction and classification of leukemia in blood smear images. Comput. Syst. Sci. Eng. 2023, 46, 1879–1900. [Google Scholar] [CrossRef]
  4. Baig, R.; Rehman, A.; Almuhaimeed, A.; Alzahrani, A.; Rauf, H.T. Detecting malignant leukemia cells using microscopic blood smear images: A deep learning approach. Appl. Sci. 2022, 12, 6317. [Google Scholar] [CrossRef]
  5. Sadashiv, W.K.; Sanjay, K.S.; Pradeep, S.V.; Anil, C.A.; Janardhan, K.A. Detection and classification of leukemia using deep learning. Int. J. Res. Appl. Sci. Eng. Technol. 2022, 10, 3235–3237. [Google Scholar] [CrossRef]
  6. Sriram, G.; Babu, T.R.G.; Praveena, R.; Anand, J.V. Classification of Leukemia and Leukemoid Using VGG-16 Convolutional Neural Network Architecture. Mol. Cell. Biomech. 2022, 19, 29–41. [Google Scholar] [CrossRef]
  7. Rupapara, V.; Rustam, F.; Aljedaani, W.; Shahzad, H.F.; Lee, E. Blood cancer prediction using leukemia microarray gene data and hybrid logistic vector trees model. Sci. Rep. 2022, 12, 1000. [Google Scholar] [CrossRef]
  8. Venkatesh, K.; Pasupathy, S.; Raja, S.P. A construction of object detection model for acute myeloid leukemia. Intell. Autom. Soft Comput. 2022, 36, 543–556. [Google Scholar] [CrossRef]
  9. Atteia, G.E. Latent space representational learning of deep features for acute lymphoblastic leukemia diagnosis. Comput. Syst. Sci. Eng. 2022, 45, 361–377. [Google Scholar] [CrossRef]
  10. Bukhari, M.; Yasmin, S.; Sammad, S.; El-Latif, A.A.A. A deep learning framework for leukemia cancer detection in microscopic blood samples using squeeze and excitation learning. Math. Probl. Eng. 2022, 2022, 2801228. [Google Scholar] [CrossRef]
  11. Ghaderzadeh, M.; Asadi, F.; Hosseini, A.; Bashash, D.; Abolghasemi, H.; Roshanpour, A. Machine Learning in Detection and Classification of Leukemia Using Smear Blood Images: A Systematic Review. Sci. Program. 2021, 2021, 9933481. [Google Scholar] [CrossRef]
  12. Mondal, C.; Hasan, K.; Jawad, T.; Dutta, A.; Islam, R.; Awal, A.; Ahmad, M. Acute lymphoblastic leukemia detection from microscopic images using weighted ensemble of convolutional neural networks. arXiv 2021, arXiv:2105.03995v1. [Google Scholar]
  13. Sashank, G.V.S.; Jain, C.; Venkateswaran, N. Detection of acute lymphoblastic leukemia by utilizing deep learning methods. In Machine Vision and Augmented Intelligence—Theory and Applications. Lecture Notes in Electrical Engineering; Bajpai, M.K., Kumar Singh, K., Giakos, G., Eds.; Springer: Singapore, 2021; Volume 796, pp. 453–467. [Google Scholar]
  14. Alagu, S.; Priyanka, A.N.; Kavitha, G.; Bagan, K.B. Automatic detection of acute lymphoblastic leukemia using UNET based segmentation and statistical analysis of fused deep features. Appl. Artif. Intell. 2021, 35, 1952–1969. [Google Scholar] [CrossRef]
  15. Saleem, S.; Amin, J.; Sharif, M.; Anjum, M.A.; Iqbal, M.; Wang, S.-H. A deep network designed for segmentation and classification of leukemia using fusion of the transfer learning models. Complex Intell. Syst. 2021, 8, 3105–3120. [Google Scholar] [CrossRef]
  16. Kavya, N.D.; Meghana, A.V.; Chaithanya, S.; Aishwarya, S.K. Leukemia detection in short time duration using machine learning. Int. J. Adv. Res. Comput. Commun. Eng. 2021, 10, 485–489. [Google Scholar]
  17. Eckardt, J.-N.; Middeke, J.M.; Riechert, S.; Schmittmann, T.; Sulaiman, A.S.; Kramer, M.; Sockel, K.; Kroschinsky, F.; Schuler, U.; Schetelig, J.; et al. Deep learning detects acute myeloid leukemia and predicts NPM1 mutation status from bone marrow smears. Leukemia 2021, 36, 111–118. [Google Scholar] [CrossRef] [PubMed]
  18. Nemade, T.; Parihar, A.S. Leukemia detection employing machine learning: A review and taxonomy. Int. J. Adv. Eng. Manag. 2021, 3, 1197–1204. [Google Scholar]
  19. Maria, I.J.; Devi, T.; Ravi, D. Machine learning algorithms for diagnosis of leukemia. Int. J. Sci. Technol. Res. 2020, 9, 267–270. [Google Scholar]
  20. Loey, M.; Naman, M.; Zayed, H. Deep transfer learning in diagnosing leukemia in blood cells. Computers 2020, 9, 29. [Google Scholar] [CrossRef]
  21. Shafique, S.; Tehsin, S. Acute lymphoblastic leukemia detection and classification of its subtypes using pretrained deep convolutional neural networks. Technol. Cancer Res. Treat. 2018, 17, 1–7. [Google Scholar] [CrossRef]
  22. Hariprasath, S.; Dharani, T.; Bilal, S.M. Automated detection of acute lymphocytic leukemia using blast cell morphological features. In Proceedings of the 2nd International Conference on Advances in Science and Technology (ICAST-2019), Bahir Dar, Ethiopia, 8–9 April 2019; K. J. Somaiya Institute of Engineering & Information Technology, University of Mumbai: Maharashtra, India, 2019; pp. 1–6. [Google Scholar]
  23. Parra, M.; Baptista, M.J.; Genesca, E.; Arias, P.L.; Esteller, M. Genetics and epigenetics of leukemia and lymphoma: From knowledge to applications, meeting report of the Josep Carreras Leukaemia Research Institute. Hematol. Oncol. 2020, 38, 432–438. [Google Scholar] [CrossRef] [PubMed]
  24. Harris, M.H.; Czuchlewski, D.R.; Arber, D.A.; Czader, M. Genetic Testing in the Diagnosis and Biology of Acute Leukemia. Am. J. Clin. Pathol. 2019, 152, 322–346. [Google Scholar] [CrossRef]
  25. Rastogi, N. Genetics of Acute Myeloid Leukemia—A Paradigm Shift. Indian Pediatr. 2018, 55, 465–466. [Google Scholar] [CrossRef]
  26. Aria, M.; Ghaderzadah, M.; Bashash, D. Acute Lymphoblastic Leukemia (ALL) Image Dataset, Kaggle. 2021. Available online: https://www.kaggle.com/datasets/mehradaria/leukemia (accessed on 3 May 2023).
  27. Sharma, N. Leukemia Dataset, Kaggle. 2020. Available online: https://www.kaggle.com/code/nikhilsharma00/leukemia-classification/input (accessed on 3 May 2023).
  28. Larxel, Leukemia Classification, Kaggle. 2020. Available online: https://www.kaggle.com/datasets/andrewmvd/leukemia-classification (accessed on 3 May 2023).
  29. Eshraghi, M.A.; Ghaderzadeh, M. Blood Cells Cancer (ALL) Dataset. 2021. Available online: https://www.kaggle.com/datasets/mohammadamireshraghi/blood-cell-cancer-all-4class?resource=download (accessed on 3 May 2023).
  30. Cranaf, R.; Kavitha, G.; Alague, S. Selective kernel U-Net Segmentation Method for Detection of Nucleus in Acute Lymphoblastic Leukemia blood cells. Proceedings of 13th National Conference on Signal Processing, Communication & VLSI Design (NCSCV’21), Online, 23–24 December 2021; pp. 16–21. [Google Scholar]
  31. Lu, Y.; Qin, X.; Fan, H.; Lai, T.; Li, Z. WBC-Net: A white blood cell segmentation network based on UNet++ and ResNet. Appl. Soft Comput. 2021, 101, 107006. [Google Scholar] [CrossRef]
  32. Taormina, V.; Raso, G.; Gentile, V.; Abbene, L.; Buttacavoli, A.; Bonsignore, G.; Valenti, C.; Messina, P.; Scardina, G.A.; Cascio, D. Automated Stabilization, Enhancement and Capillaries Segmentation in Videocapillaroscopy. Sensors 2023, 23, 7674. [Google Scholar] [CrossRef] [PubMed]
Figure 1. The flowchart of the proposed algorithm.
Algorithms 16 00556 g001
Figure 2. The internal structure of the segmentation stage.
Algorithms 16 00556 g002
Figure 3. The complete architecture of the developed classification model.
Algorithms 16 00556 g003
Figure 4. Achieved accuracy and DSC outputs.
Algorithms 16 00556 g004
Figure 5. Classification results of the testing group.
Algorithms 16 00556 g005
Figure 6. The achieved results.
Algorithms 16 00556 g006
Figure 7. Samples of the segmented image.
Algorithms 16 00556 g007
Figure 8. Samples of the segmented image.
Algorithms 16 00556 g008
Figure 9. The visualization chart of 5-fold cross-validation outputs.
Algorithms 16 00556 g009
Table 1. Summary of some developed methods.
ReferencePublication YearDeployed TechnologyAdvantagesLimitations
[1]2023GNA, GSA, and PCACategorization of all four subtypes of leukemiaUsing one small dataset and time-consuming due to the utilized number of operations
[3]2023Histogram threshold segmentation classifierUsing color and brightness variations to detect leukemiaRequires multiple classifiers to reach high accuracy and classify two subtypes only
[4]2022CNN and hibernation of two CNN blocksThe number of images in the utilized dataset was sufficientThe achieved accuracy was less than 90% and discovered two subtypes only
[6]2022VGG-16 CNNReached nearly 98% accuracyClassified two subtypes and the number of utilized images was insufficient
[8]2022Region-based CNNAchieved 97.3% accuracy and utilized a sufficient number of imagesThe evaluated performance quantities reached results between 93% and 97%
[9]2022CNNAchieved 100% accuracy Utilizing a single dataset and categorizing a single type: ALL
Table 2. The utilized datasets description.
First Dataset [26]Second Dataset [27]Third Dataset [28]Fourth Dataset [29]
Number of images3256651215,1353242
Size116 MB210 MB909 MB2 GB
Ground TruthYesYesYesYes
Table 3. Details of the utilized datasets.
Dataset NumberNumber of Images
TrainingValidationTesting
12800200256
247907221000
310,52925002106
41582800860
Table 4. The applied settings of hyperparameters.
Name of the HyperparameterValue
Learning rate: L0.001
Batch size16
Dropout0.25
OptimizerAdam
Regression weight0.001
Momentum0.8
Activation functionsReLU and Sigmoid
Number of iterations3000, 5000, 8000
Number of epochs65
Table 5. The achieved accuracy from the segmentation and classification stages.
Performance QuantityWith OptimizerWithout Optimizer
Accuracy97.82%95.39%
Table 6. The evaluated considered quantities.
Performance MetricsWithout OptimizerWith Optimizer
Accuracy95.39%97.82%
Precision94.24%97.23%
Recall93.98%96.79%
Specificity95.78%97.03%
F-score95.62%98.72%
Jaccard Index93.81%97.91%
DSC95.45%98.33%
Table 7. The complexity of the proposed model.
FLOPSNumber of ParametersExecution Time
57.7163.828.45 s
Table 8. The comparative evaluation results.
WorksThe Number of Utilized DatasetsApplied TechnologyAccuracyDSC
[1], 20231GAN, GAS, and PCA99.8%98.5%
[3], 20231Histogram threshold segmentation classifier98%N/A
[6], 20221VGG-16 CNN98%N/A
[8], 20221Region-based CNN97.3%N/A
[9], 20221Hybrid deep learning tools: CNNs and inception v2 and support vector machine100%N/A
[10], 20222Squeeze and Excitation Learning98.3%N/A
[12], 20211Weighted ensemble of different CNNs86.2%N/A
The Proposed algorithm4Image preprocessing and UNET98.76%98.89%
Table 9. Results of the statistical analysis test.
IndicatorLeNetResNetPresented FRAMEWORK
Accuracy96.21%96.01%97.53%
F-score96.98%95.35%98.11%
Jaccard Index95.76%95.44%97.74%
Disclaimer/Publisher’s Note: The statements, opinions and data contained in all publications are solely those of the individual author(s) and contributor(s) and not of MDPI and/or the editor(s). MDPI and/or the editor(s) disclaim responsibility for any injury to people or property resulting from any ideas, methods, instructions or products referred to in the content.

