Article

eNightTrack: Restraint-Free Depth-Camera-Based Surveillance and Alarm System for Fall Prevention Using Deep Learning Tracking

by
Ye-Jiao Mao
1,
Andy Yiu-Chau Tam
1,2,
Queenie Tsung-Kwan Shea
1,2,3,
Yong-Ping Zheng
1,2 and
James Chung-Wai Cheung
1,2,*
1
Department of Biomedical Engineering, Faculty of Engineering, The Hong Kong Polytechnic University, Hong Kong 999077, China
2
Research Institute for Smart Ageing, The Hong Kong Polytechnic University, Hong Kong 99077, China
3
Division of Medical Physics, Medical Innovation and Technology, The Chinese University of Hong Kong Medical Center, Hong Kong 999077, China
*
Author to whom correspondence should be addressed.
Algorithms 2023, 16(10), 477; https://doi.org/10.3390/a16100477
Submission received: 29 August 2023 / Revised: 9 October 2023 / Accepted: 10 October 2023 / Published: 12 October 2023
(This article belongs to the Special Issue Artificial Intelligence Algorithms for Healthcare)

Abstract

:
Falls are a major problem in hospitals, and physical or chemical restraints are commonly used to “protect” patients in hospitals and service users in hostels, especially elderly patients with dementia. However, physical and chemical restraints may be unethical, detrimental to mental health and associated with negative side effects. Building upon our previous development of the wandering behavior monitoring system “eNightLog”, we aimed to develop a non-contract restraint-free multi-depth camera system, “eNightTrack”, by incorporating a deep learning tracking algorithm to identify and notify about fall risks. Our system evaluated 20 scenarios, with a total of 307 video fragments, and consisted of four steps: data preparation, instance segmentation with customized YOLOv8 model, head tracking with MOT (Multi-Object Tracking) techniques, and alarm identification. Our system demonstrated a sensitivity of 96.8% with 5 missed warnings out of 154 cases. The eNightTrack system was robust to the interference of medical staff conducting clinical care in the region, as well as different bed heights. Future research should take in more information to improve accuracy while ensuring lower computational costs to enable real-time applications.

1. Introduction

Falls and their associated injuries pose significant challenges in hospitals, and healthcare institutions prioritize the delivery of safe, effective, and high-quality care to patients [1]. In the United States, it is estimated that there are between 0.7 and 1 million patient falls in hospitals, resulting in up to 250,000 injuries and 11,000 deaths [2]. Falls are a major safety concern and account for over 84% of all adverse incidents that occur in hospitals [3]. Nearly half of these falls occur in close proximity to the patient’s bed [4]. Approximately 33% of hospital falls result in injuries, and among these incidents, 4 to 6% are severe enough to cause additional health problems and even death, such as fractures and subdural hematomas [5]. Consequently, many hostels and hospitals have resorted to using restraints as a precautionary measure [6].
Physical restraint involves the use of devices or equipment to restrict an individual’s movement, and these cannot be removed by the person themselves [7]. Physical restraints are employed to ensure the safety of individuals using medical devices and to manage aggressive or agitated behaviors [8,9,10]. Patients with dementia or cognitive impairments are often physically restrained to prevent harm to themselves or others [11]. Chemical restraints can also be used to achieve similar effects to physical restraints in clinical settings [12].
However, there is much debate surrounding the use of both physical and chemical restraints. Restraining individuals can prevent them from fulfilling basic needs like accessing water and using the restroom, which is unethical and detrimental to their mental health. Moreover, serious accidents such as strangulation can occur when individuals are restrained [13]. Those who have been restrained have reported experiencing unpleasant emotions and psychological damage, including hopelessness, sadness, fear, anger, and anxiety [14]. Adverse health effects of restraint include respiratory problems, malnutrition, urinary incontinence, constipation, poor balance, pressure ulcers, and bruises [15]. Similarly, chemical restraints also have negative consequences. For instance, antipsychotic medications can cause drowsiness, gait disturbances, chest infections, and other adverse effects. Some medications can also impact nutrition absorption, increasing the risk of hospitalization. Furthermore, a 1.7-times higher mortality rate over a two-year period has been observed, and the incidence of severe cerebrovascular events is approximately doubled with the use of antipsychotic medications [16]. Considering these drawbacks, there is a significant demand for alternatives to physical and chemical restraints.
With advancements in sensor and remote sensing technology, virtual restraints are increasingly being used as alternatives to physical and chemical restraints, such as infrared photodetectors [17], pressure sensors [18], wearable equipment [19], and associated telehealth items [20]. The current approaches for human action recognition using RGB-D data can be categorized into three groups based on the type of data modality employed: depth-based methods, skeleton-based methods, and hybrid feature-based methods [21]. Muñoz et al. created an RGB-D-based interactive system for upper limb rehabilitation [22]. However, it was limited due to the extra computational cost of RoI detection using whole-depth sequences [21]. There are several studies of multi-modal interactive frameworks. For example, Avola et al. proposed a system to establish a connection between the activities initiated by the user and the corresponding reactions from the system [23]. By processing data in diverse modalities such as RGB images, depth maps, sounds, and proximity sensors, the system actively achieves real-time correlations between outcomes and activities [23]. Moreover, instrumented mattresses embedded with sensors may not be cost-effective or feasible in clinical settings, and wearable devices can present compliance issues, particularly for patients with dementia and agitated behaviors [24]. The Bed-Ex occupancy monitoring system utilizes weight-sensitive sensor mats attached to the bed to detect when a patient leaves. An alert is triggered on the inpatient ward and the central nursing station when a certain loss of weight is detected [25]. However, this type of virtual restraint system functions as a threshold decision system that only detects danger when people exit the bed. Falls can still occur when people engage in risky behaviors on the bed, such as leaning or hanging on the railings, which the weight sensor may still detect. Therefore, a virtual restraint technique capable of continuously tracking the users’ state is needed, rather than simply activating an alarm once they exit. The presence of caregivers performing routine services around the bed can introduce distortion to the sensing system, leading to false alarms. Infrared fences and pressure mats need to be turned off before conducting services, which increases the risk of forgetting to restart them and causing misalignment.
In terms of wearable sensors, an IMU (Inertial Measurement Unit) is an electronic device designed to be worn on a specific part of the body. It combines accelerometer and gyroscope sensors, and sometimes a magnetometer, to measure angular rate and magnetic fields in the vicinity of the body [26]. The recent progress in MEMS (Micro-Electro-Mechanical Systems) technology has enabled the development of smaller and lighter sensors, allowing for continuous tracking of human motion and device orientation [27]. Electromyography (EMG) has found extensive application in human–machine interaction (HMI) tasks. In recent times, deep learning techniques have been utilized to address various EMG pattern recognition tasks, including movement classification and joint angle prediction [28]. Deep learning has gained significant popularity in EMG-based HMI systems. However, most studies have primarily focused on evaluating offline performance using diverse datasets. It is crucial to give due consideration to online performance in real-world applications, such as prosthetic hand control and exoskeleton robot operation [29]. Similarly, in indoor applications, such as hospitals and hotels, Wi-Fi is considerably more practical than video or wearable technology. Jannat et al. developed a Wi-Fi-based human activity recognition method using adaptive antenna elimination, which required minimal computational resources to distinguish falls from other human activities based on machine learning [30]. Wang et al. [31] introduced a model called WiFall that has the capability to detect falls in elderly individuals, along with monitoring certain activities. WiFall utilizes Channel State Information (CSI) for wireless motion detection. The model employs machine learning algorithms to learn patterns in CSI signal amplitudes. Initially, a Support Vector Machine (SVM) is used to extract features, and Random Forest (RF) is applied to enhance the system’s performance. The results demonstrate that WiFall achieves a satisfactory level of ability in fall detection. The approach achieves a detection precision of 90% with a false-alarm rate of 15% when using the SVM classifier. When the RF algorithm is employed, the accuracy is further improved and the false-alarm rate is reduced. However, it is important to note that this approach focuses on monitoring a single individual’s motion. Overall, the academic community is additionally highly engaged in innovative sensor exploration for human activity recognition and behavior recognition, which involves novel sensors for HAR/HBR, creative designs and usages of traditional sensors, the utilization of non-traditional sensor categories that are applicable to HAR/HBR, etc. [32].
The utilization of machine learning (ML) represents significant potential for fall detection, including Support Vector Machines (SVMs), Random Forest (RF), and Hidden Markov Models (HMM) [33]. These models rely on handcrafted features and require extensive feature engineering [34]. Hidden Markov Models (HMMs) are based on the concept of a Markov process, which is a stochastic process with the property that the future state depends only on the current state and not on the past states [33]. Liang et al. introduced an alarm system that utilizes an HMM-based Support Vector Machine (SVM) [35]. The model was trained and evaluated using a dataset consisting of 180 fall instances. Liu et al. proposed an innovative method for human activity recognition that involves partitioning activities into meaningful phases called motion units, similar to phonemes in speech recognition [36]. Hartann et al. developed and assessed a concise set of six high-level features (HLFs) on the CSL-SHARE and UniMiB SHAR datasets [37]. They demonstrated that HLFs can be effectively extracted using ML methods, allowing for activity classification across datasets, even in imbalanced and limited training scenarios. Additionally, they identified specific HLF extractors responsible for classification errors.
However, DL models, in particular convolutional neural networks (CNNs) [38,39], recurrent neural networks (RNNs) [40], and their variations, have evolved as enhanced fall detection methods. The requirement for manual feature extraction was eliminated by the capacity of DL models to automatically extract pertinent features from unprocessed sensor data, which allows for quicker and more precise detection. Carneiro et al. employed high-level handcrafted features, including human pose estimation and optical flow, as inputs for individual VGG-16 classifiers [38]. Kasturi et al. developed a visual-based system that utilizes video information captured via a Kinect camera [39]. Multiple frames from the video are stacked to form a cube, which is inputted into a 3D CNN. The 3D CNN effectively incorporates spatial and temporal characteristics, encoding both appearance and motion characteristics across frames [39]. Hasan et al. introduced a system for fall detection utilizing video data, employing a recurrent neural network (RNN) with two layers of Long Short-Term Memory (LSTM) [40]. The approach involved performing 2D pose estimation using the OpenPose [41] algorithm to provide body joint information. The extracted pose vectors were then input into a two-layer LSTM network, enabling fall detection.
We endeavored to identify bed exiting and other dangerous activities, which would serve as a measure to prevent falls and injuries and be more effective and desirable. Previously, we developed a depth camera and ultrawideband radar system, named “eNightLog”, to monitor and classify the night wandering behaviors of older adults. We demonstrated that it outperformed the integrated pressure mattress and infrared fence system [42] and was effective in managing wandering behaviors in a field test [43]. We then developed deep learning models for the depth camera [44,45] and ultrawideband (UWB) radar [46,47] to better classify sleep postures. However, eNightLog had some limitations. It could not distinguish between users and medical staff, especially when they were taking care of the users. False alarms also happened when the bed was raised over the threshold height of the patient’s head or the patient’s service table height changed.
In view of this, we aimed to optimize the existing eNightLog system and extend its functions to detect potential fall events. We dubbed this new system “eNightTrack” as the succession of our previous system with enhanced tracking functions.

2. Materials and Methods

This section is composed of 6 subsections. Section 2.1 describes the data collection protocols. Section 2.2 shows the system setup of data collection. Section 2.3 explains the procedure of pre-processing to accommodate the format of input to the instance segmentation model. Section 2.4 describes instance segmentation based on the YOLOv8 model. Section 2.5 explains the head-tracking techniques. Finally, Section 2.6 presents the algorithm for raising an alarm when a user is in danger of falling. Figure 1 presents the overall structure and development of the eNightTrack system.

2.1. Data Collection
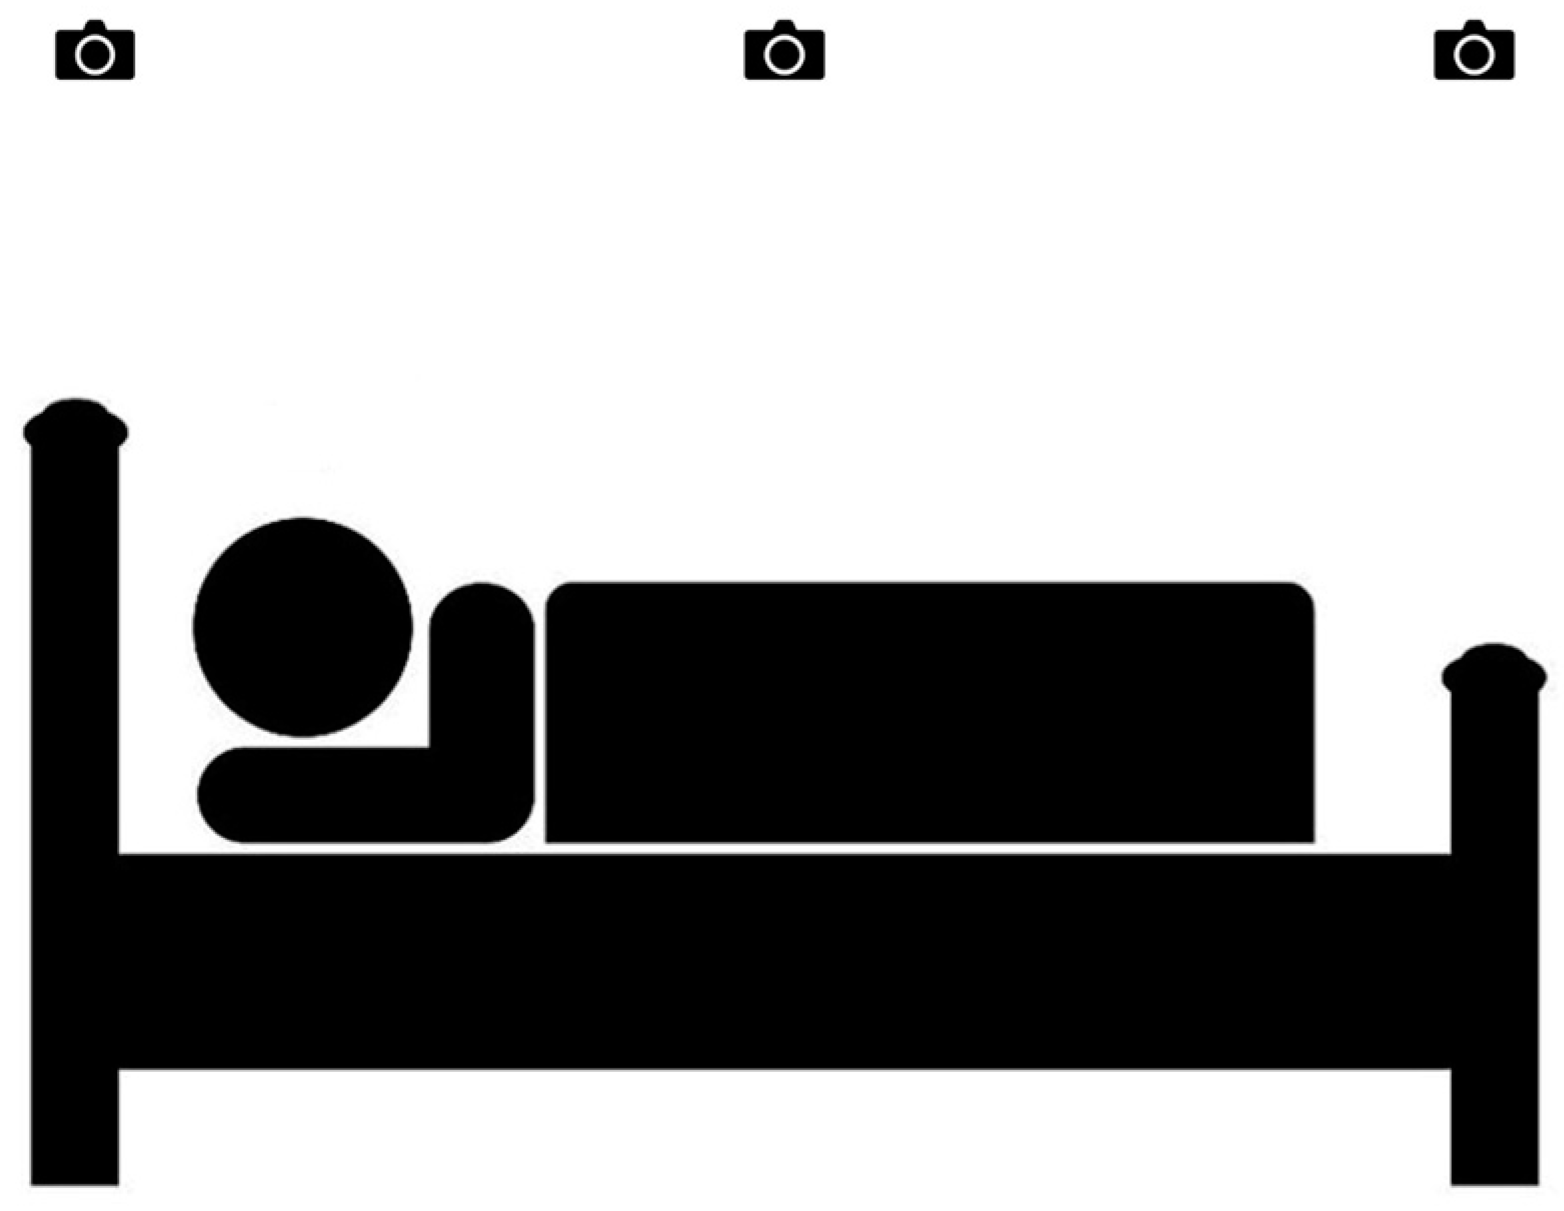
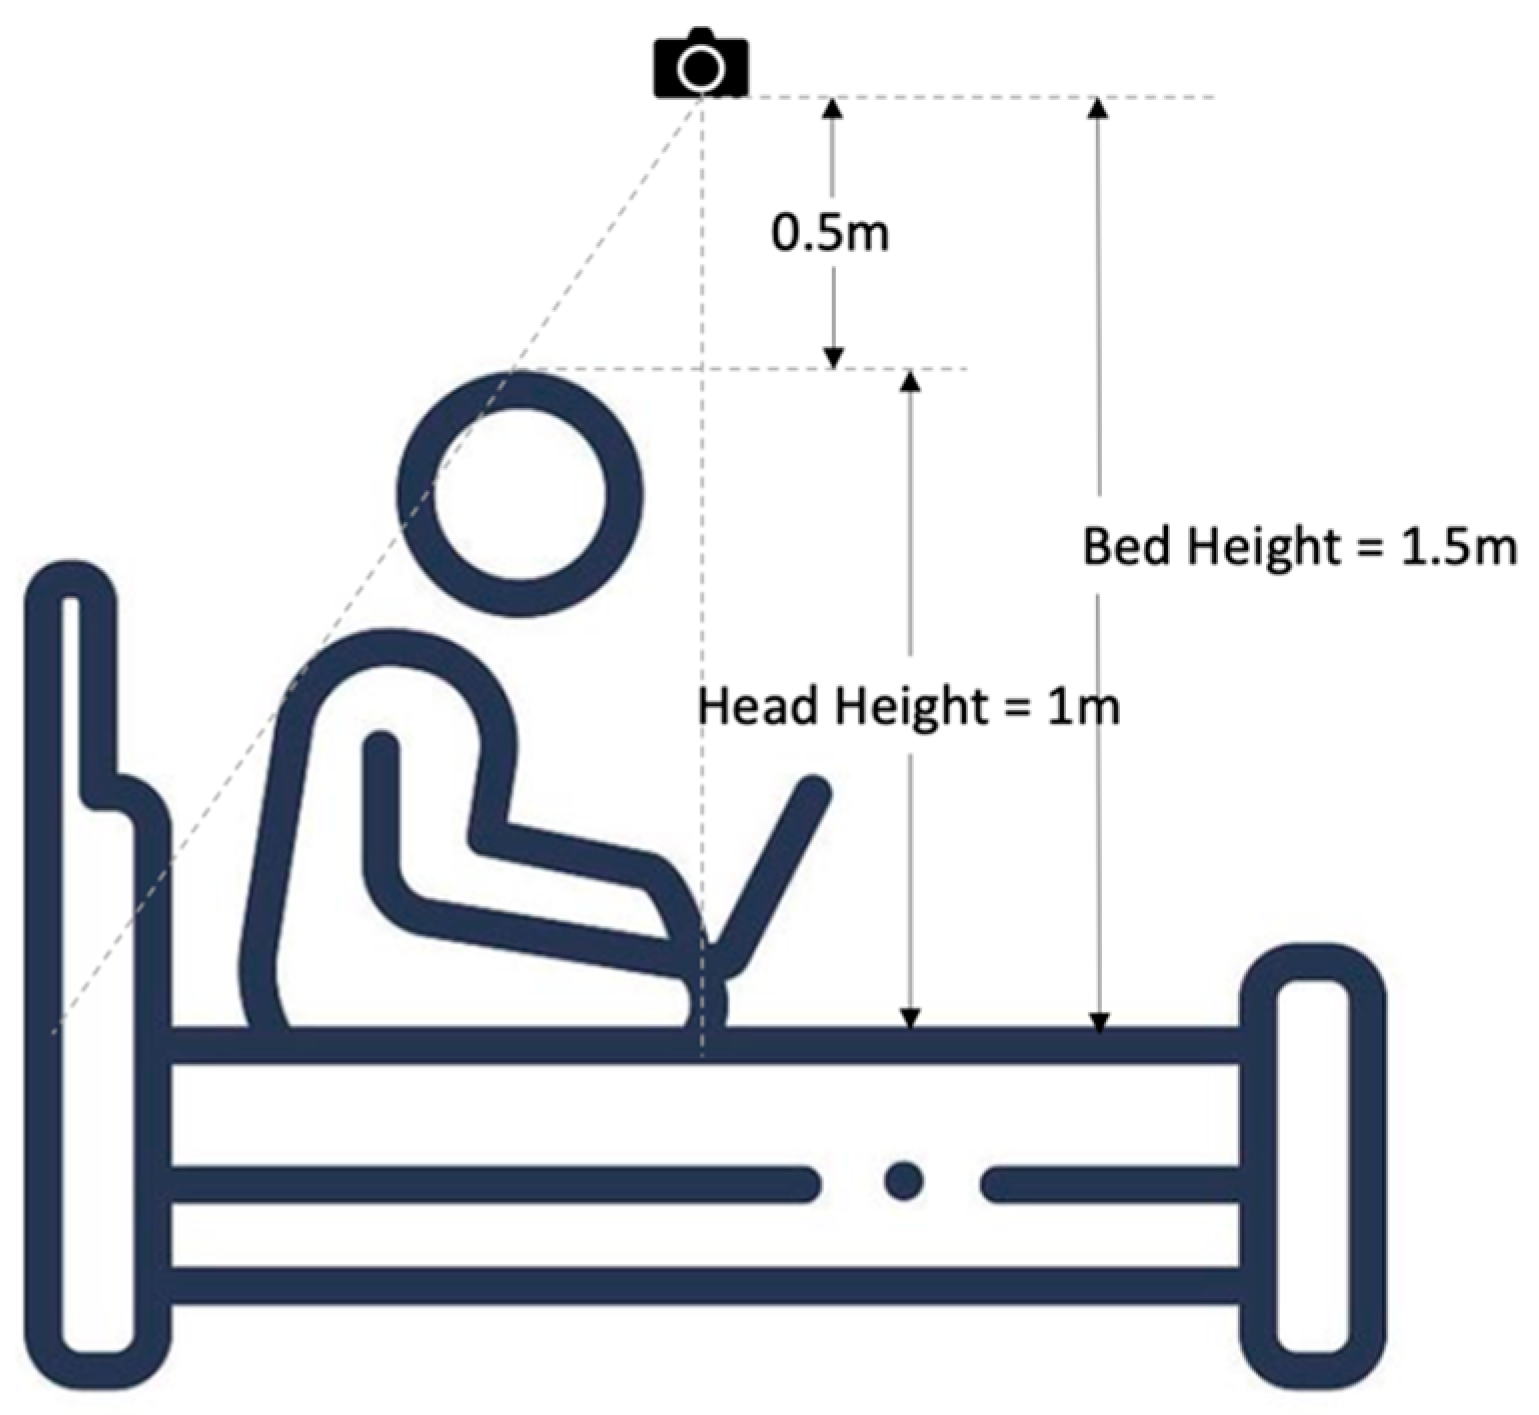
Twenty-four nurses (n = 24) from a local hospital participated in a role-play activity simulating a fall-risk-related scenario for data collection. The nurses reported no physical disabilities or chronic diseases. They were divided into 8 teams of 3 members. One member acted as a patient and the others as nurses. During the data collection process, the nurses performed their routine duties on the ward. The “patient” and “nurses” performed different activities according to the protocol listed in Table 1. The simulation was performed under the guidance and advice of nursing school instructors. Also, the protocol was built according to their real-world experience in the hospital after several experiment preparation meetings. Figure 2 illustrates screenshots of some scenarios taken. The Human Subjects Ethics Sub-committee of Hong Kong Polytechnic University approved the study (reference no. HSEARS20210127007). Written and oral descriptions of the experimental procedures were offered to all participants, and informed consent was obtained from all participants.

2.2. System Setup

Three infrared red–blue–green (RGB) stereo-based depth cameras (Realsense D435i, Intel Corp., Santa Clara, CA, USA) were positioned to capture the entire scenario simulation process using the RealSense Software Development Kit (SDK) platform in a clinical teaching room. We used D435i because it had a smaller minimum Z depth for detection of 28 cm to ensure the user could be detected when they stood up as the depth cameras were installed 1.5 m above the bed. The 1.5 m height of the depth camera above the bed ensures the ability to capture a reasonable field of view to observe the patient’s movements in bed and whether he or she left the bed. The data were transmitted and processed on a personal computer. Figure 3 presents the setup of the experiment equipment. In this experiment, the information from the depth camera in the middle was used for analysis. The information from the other two depth cameras at both ends could be used in a future study of reconstructed 3D monitoring work. The depth cameras were adopted to prevent ethical issues, as the RGB camera would capture the real scene and human appearances. Generally, the middle depth camera obtains the best performance individually compared to the others at the two ends [48]. Therefore, we took the data from the middle depth camera to conduct an initial experiment in this project. Multiple depth cameras provided a wider field of view, allowing for a more comprehensive monitoring of patients’ movements that could be particularly beneficial in scenarios where a patient’s movements are not confined to a single viewpoint. In the future, the data from three depth cameras will be combined for 3D reconstruction to avoid line-of-sight issues.

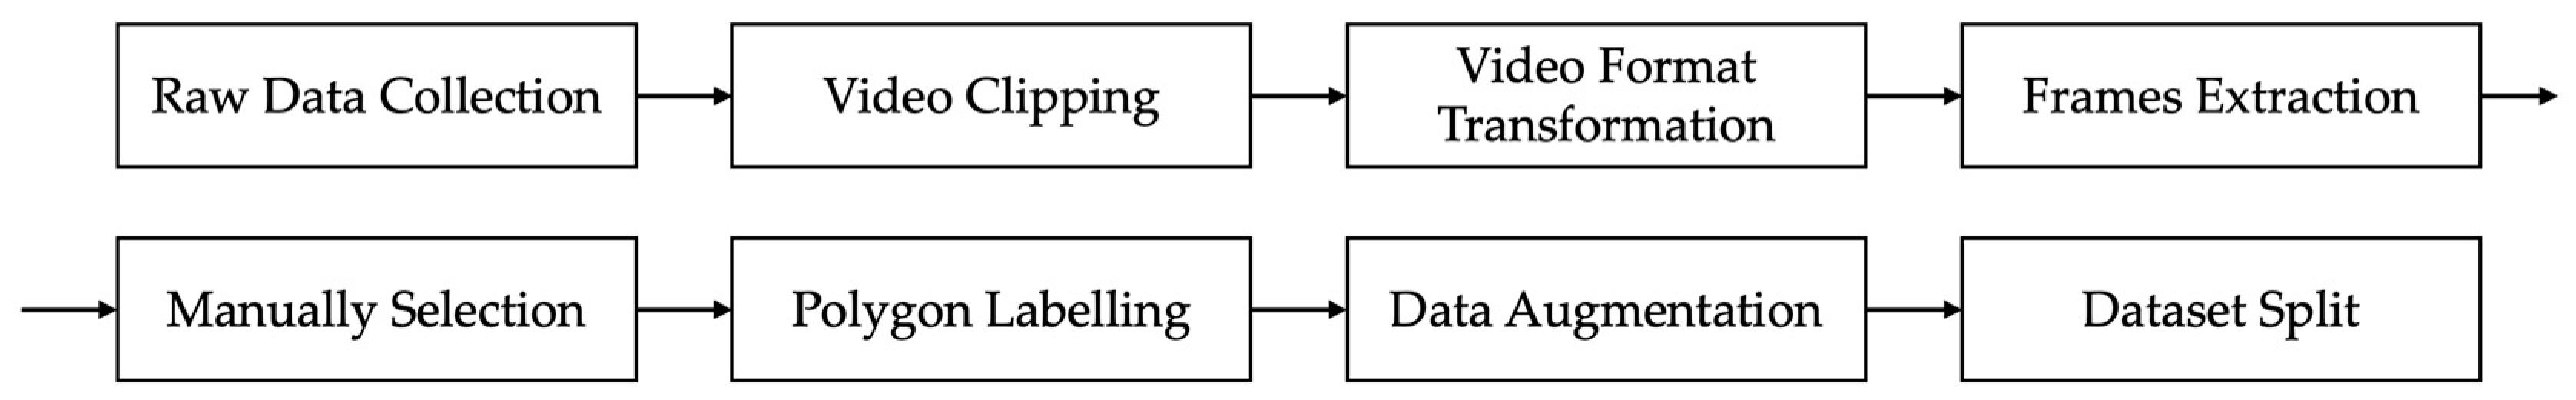
2.3. Data Preprocessing

The dataset must be preprocessed before being used for instance segmentation. The workflow of data preprocessing is shown in Figure 4. The raw data (in bag format) collected covered 20 scenarios, which contain 10 negatives (patient staying in bed) and 10 positives (patient leaving bed area). The definition of each scenario is presented in Table 1. In total, 307 individual videos were successfully obtained after the original bag files were clipped with a frame rate 6 frames/s, and the number of each scenario is also displayed in Table 1. There were supposed to be an equal number of positive and negative video clips, but one of the positive samples was abnormal due to a power issue and was adopted for testing.
To reduce the computation cost of achieving real-time analysis, the clipped data needed to be compressed before further processing. As the particular input of the instance segmentation model is in png file format, the bag format files of different scenarios were converted to mp4 files. In our project, the patient’s head movement was representative of patient movement because the head can be more easily detected most of the time, while other parts of the body may be covered by the quilt. Moreover, if the head is detected out of the bed, it is almost certain that the patient is at risk of falling.
Generally, thousands of samples are required for training most instance segmentation models; therefore, frames were extracted every 40 frames to cover the various poses of patients and 2127 png images were obtained in total. Before polygon labelling, the acquired images needed to be manually filtered. Images were disqualified and excluded if (a) the head was indistinguishable from the background; (b) the head was blocked; or (c) no head was in the scene (patient leaving). Polygon labelling was implemented on the online cloud platform named Roboflow where two classes, 0 for the head of the patient and 1 for the head of medical care personnel, were labelled.
The labels for each png sample were stored in a txt file and the output format for a single row in the segmentation data is ‘<class-index> <x1> <y1> <x2> <y2> … <xn> <yn>’. In this format, <class-index> represents the index of the class assigned to the object, and <x1> <y1> <x2> <y2> … <xn> <yn> denote the bounding coordinates of the object’s segmentation mask. Once polygon labelling is finished, data augmentation, such as horizontal and vertical flips, was applied to make the model insensitive to object orientation and improve the generalization. The training dataset is typically the largest subset for generalization of the model when maintaining enough cases for validation and testing. A validation dataset is used to fine-tune the hyperparameters, monitor performance during training, and prevent overfitting. A relatively small ratio is used for the validation set. The test dataset is usually the smallest for the final evaluation of the trained model, measuring its generalization capability. We originally selected the train/valid/test ratio as 7:2:1 on the RoboFlow label platform. The system automatically suggested the final ratio after data augmentation when more augmented data were included in the training dataset. Finally, 2552 images were obtained and were split as follows: training dataset 2152, 84.3%; validation dataset 266, 10.4%; and testing dataset 134, 5.3%.

2.4. Instance Segmentation

The novel YOLOv8 model expands on the achievement of earlier YOLO iterations and incorporates additional capabilities and enhancements that significantly increase its performance and versatility [49]. The pre-trained weight model “yolov8-seg.yaml” from GitHub was used as the initial model. Rather than splitting up into two phases like Faster R-CNN, which first detects regions of interest before recognizing items in those areas, algorithms such as Single-Shot Detector (SSD) and You Only Look Once (YOLO) focus on locating every item in the shot in a single forward pass [49,50,51]. Faster R-CNN is a rather sluggish detector that fails in real-time tasks, while it has a slightly improved accuracy when real-time processing is not necessary [52,53]. SSD is simpler compared to methods that require region proposals because it completely eliminates the proposal generation phase and the subsequent pixel or feature resampling phase, encapsulating all computations in a single network [50]. Therefore, YOLO is more suitable for our application to achieve real-time segmentation. To avoid the disturbance created by medical personnel or visitors entering the identification area, our customized YOLO model should have the ability to identify the head of a patient and heads of non-patient participants. Thus, instance segmentation is preferred over object detection as it takes more morphological information into consideration to identify similar objects. The training phase adopted python 3.10.11, torch 2.0.0, 100 epochs, batch size 16, a learning rate of 0.01, momentum of 0.937, and patience of 50. The computer (Centralfield Computer Ltd., Hong Kong, China) used for training with Windows 10 Education operating system (Microsoft Co., Redmond, WA, USA) 32 GB of RAM, a 2.1 GHz Intel® Core™ i7-12700 processor with 12 cores and 2 TB of solid state hard disk (SSD).

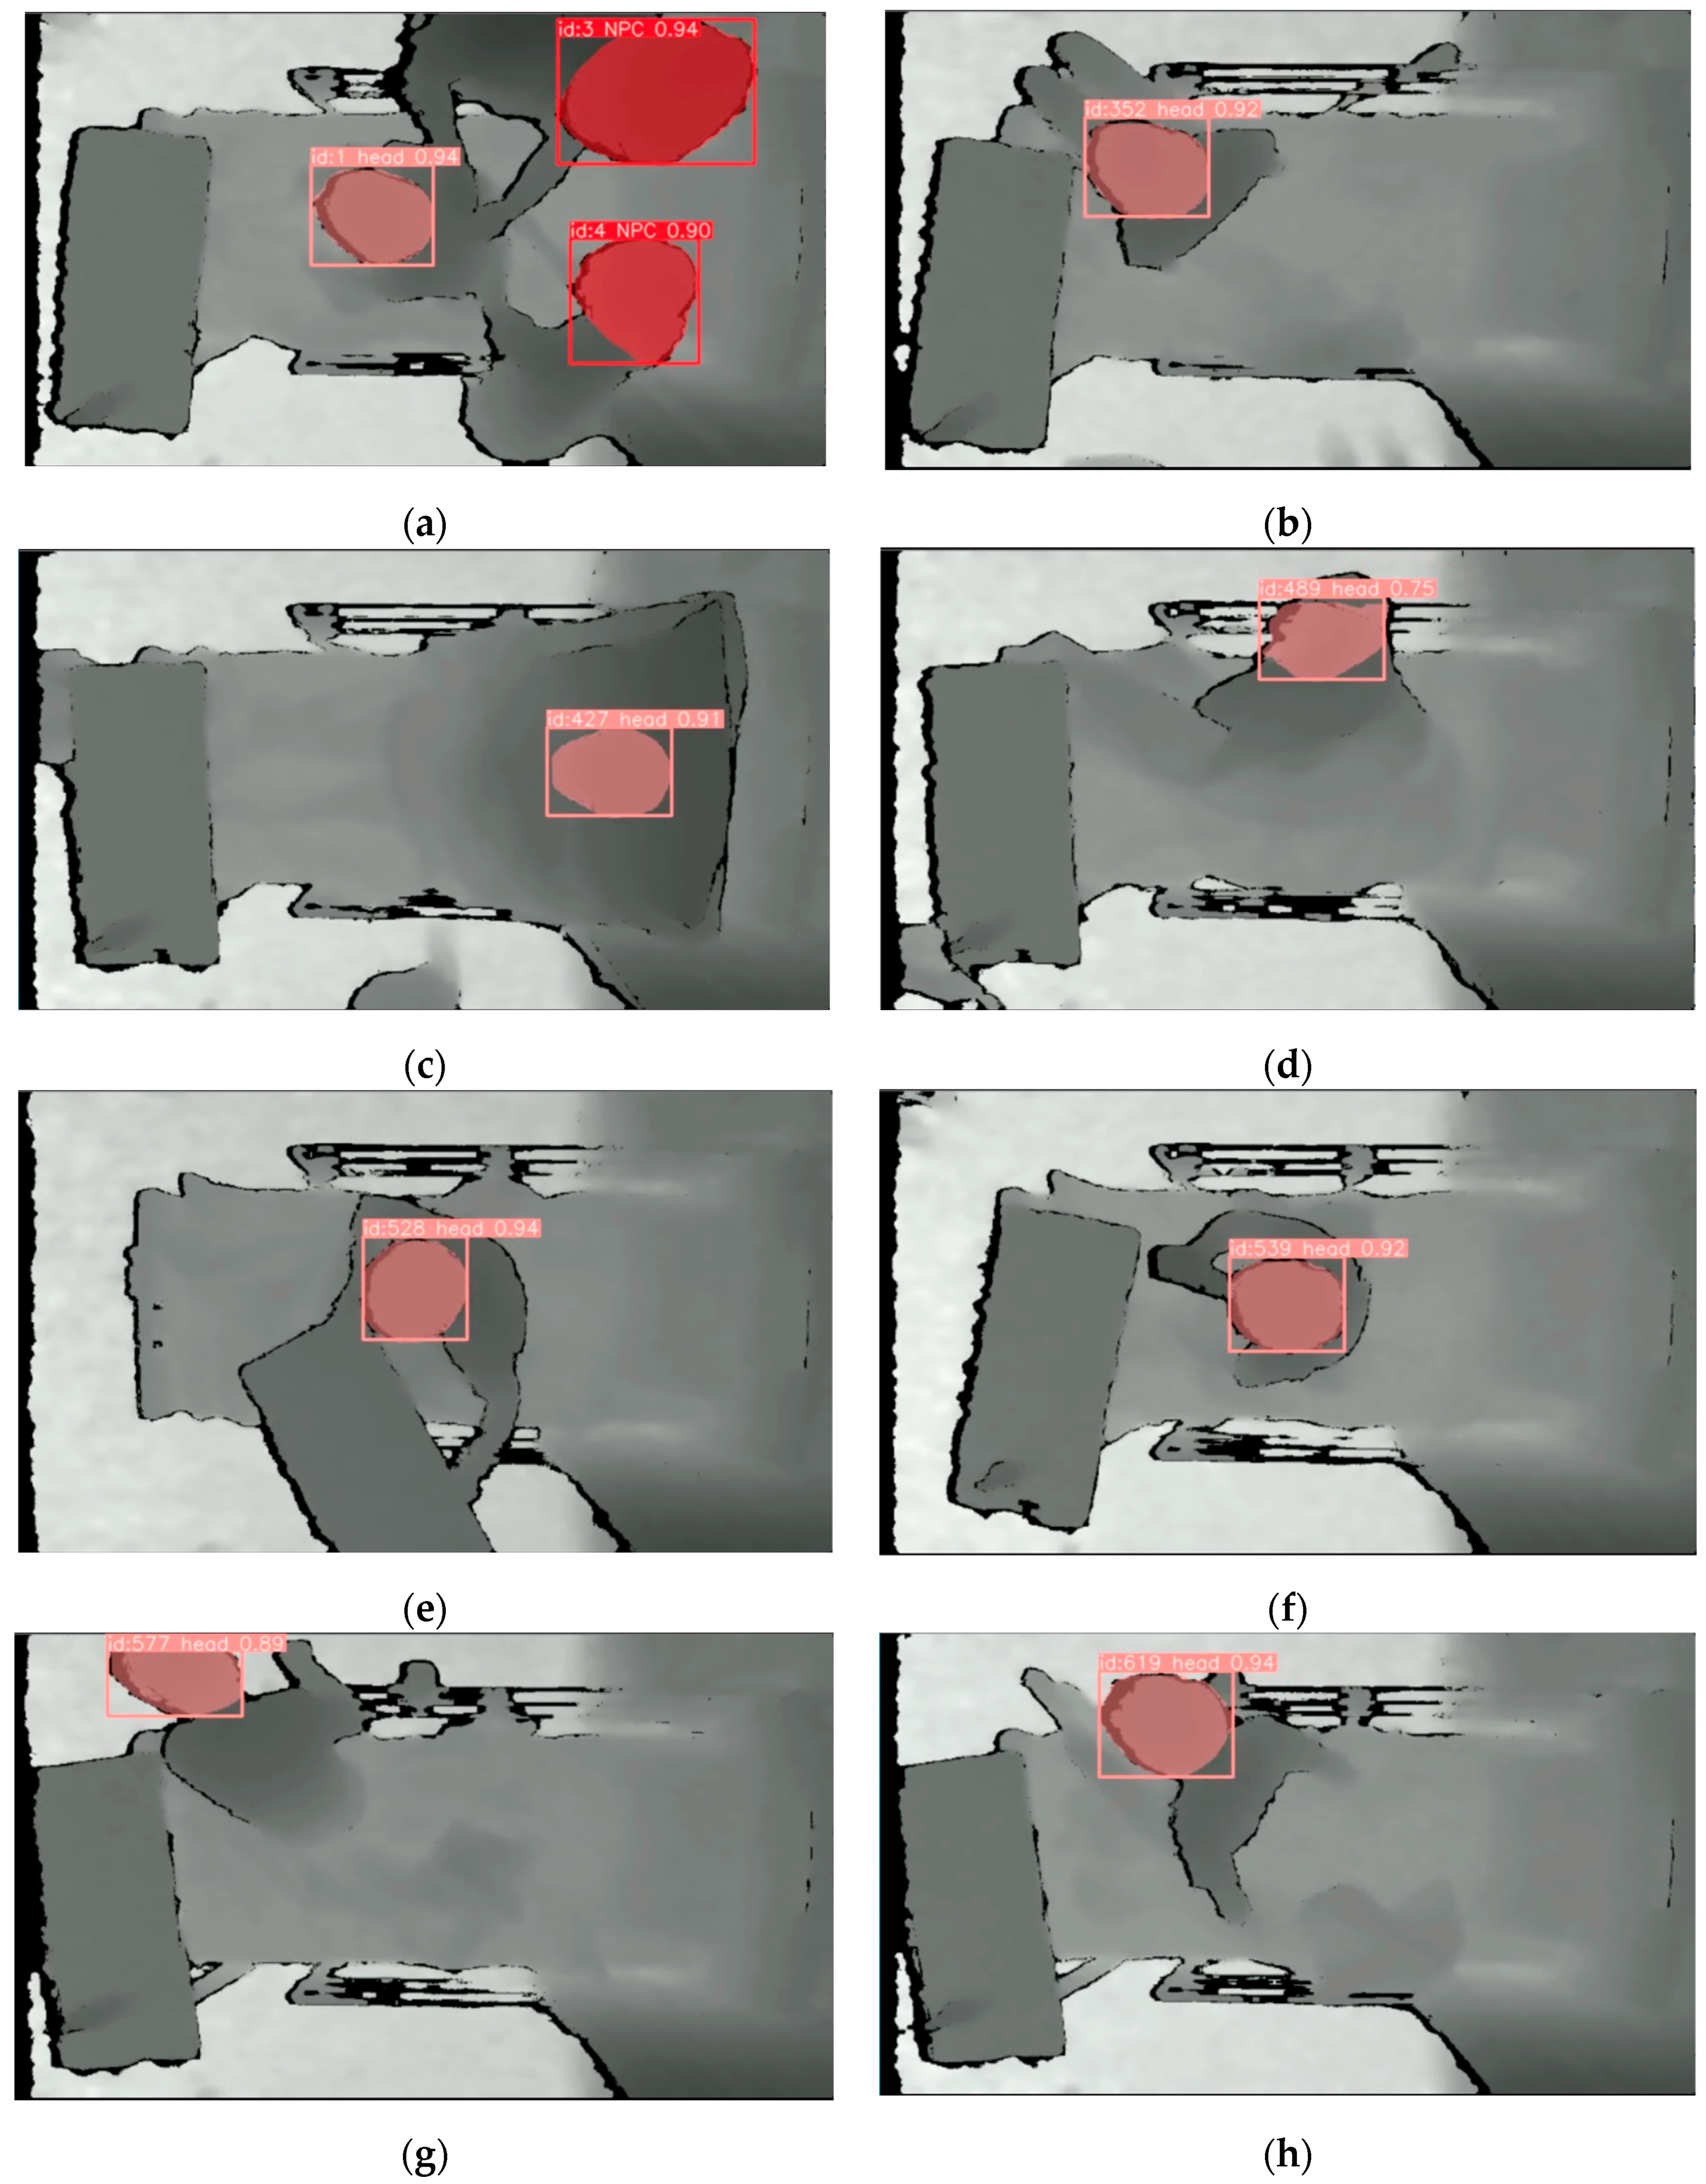
2.5. Multi-Object Detection

MOT (Multi-Object Tracking) is based on object detection and object re-identification (ReID) [54,55]. Three different MOT techniques, StrongSORT [54], ByteTrack [56,57], and DeepSORT [58], were adopted and compared based on their tracking performance. DeepSORT was one of the original methods to use a deep learning model for MOT. It is usually selected because of its generalization and effectiveness [59]. Although its tracking paradigm was valuable, the performance of DeepSORT was not comparable due to its outmoded techniques. StrongSORT was developed using the fundamental elements of DeepSORT and advanced components. For instance, Faster R-CNN was applied in DeepSORT while YOLOX-X was chosen for StrongSORT. Also, a superior appearance feature extractor, BoT (Bottleneck Transformer) [60], was selected rather than simple CNN [54]. ByteTrack is a tracking method based on the tracking-by-detection paradigm. A simple and efficient data association method called BYTE was proposed. The vital difference between it and other tracking algorithms is that it does not simply remove the low-score detection results but associates every detection box [57]. By using the similarity between the detection box and the trajectories, the background can be removed from the low-score detection results while retaining the high-score detection results, and real objects (difficult samples such as occlusion and blurring) are removed, thus reducing missed detections and improving the tracking coherence [56]. The resulting MOT method with the best performance from this section is applied in Section 2.6 Alarm Identification.
A widely used method for evaluating the performance and generalizability of a machine learning model is 5-fold cross-validation. The basic concept was to split the original dataset into five parts of equal size, of which four were used to train the model and one was used to validate it. After carrying out this process five times, the final assessment results were calculated by averaging the outcomes of the five performance evaluations.

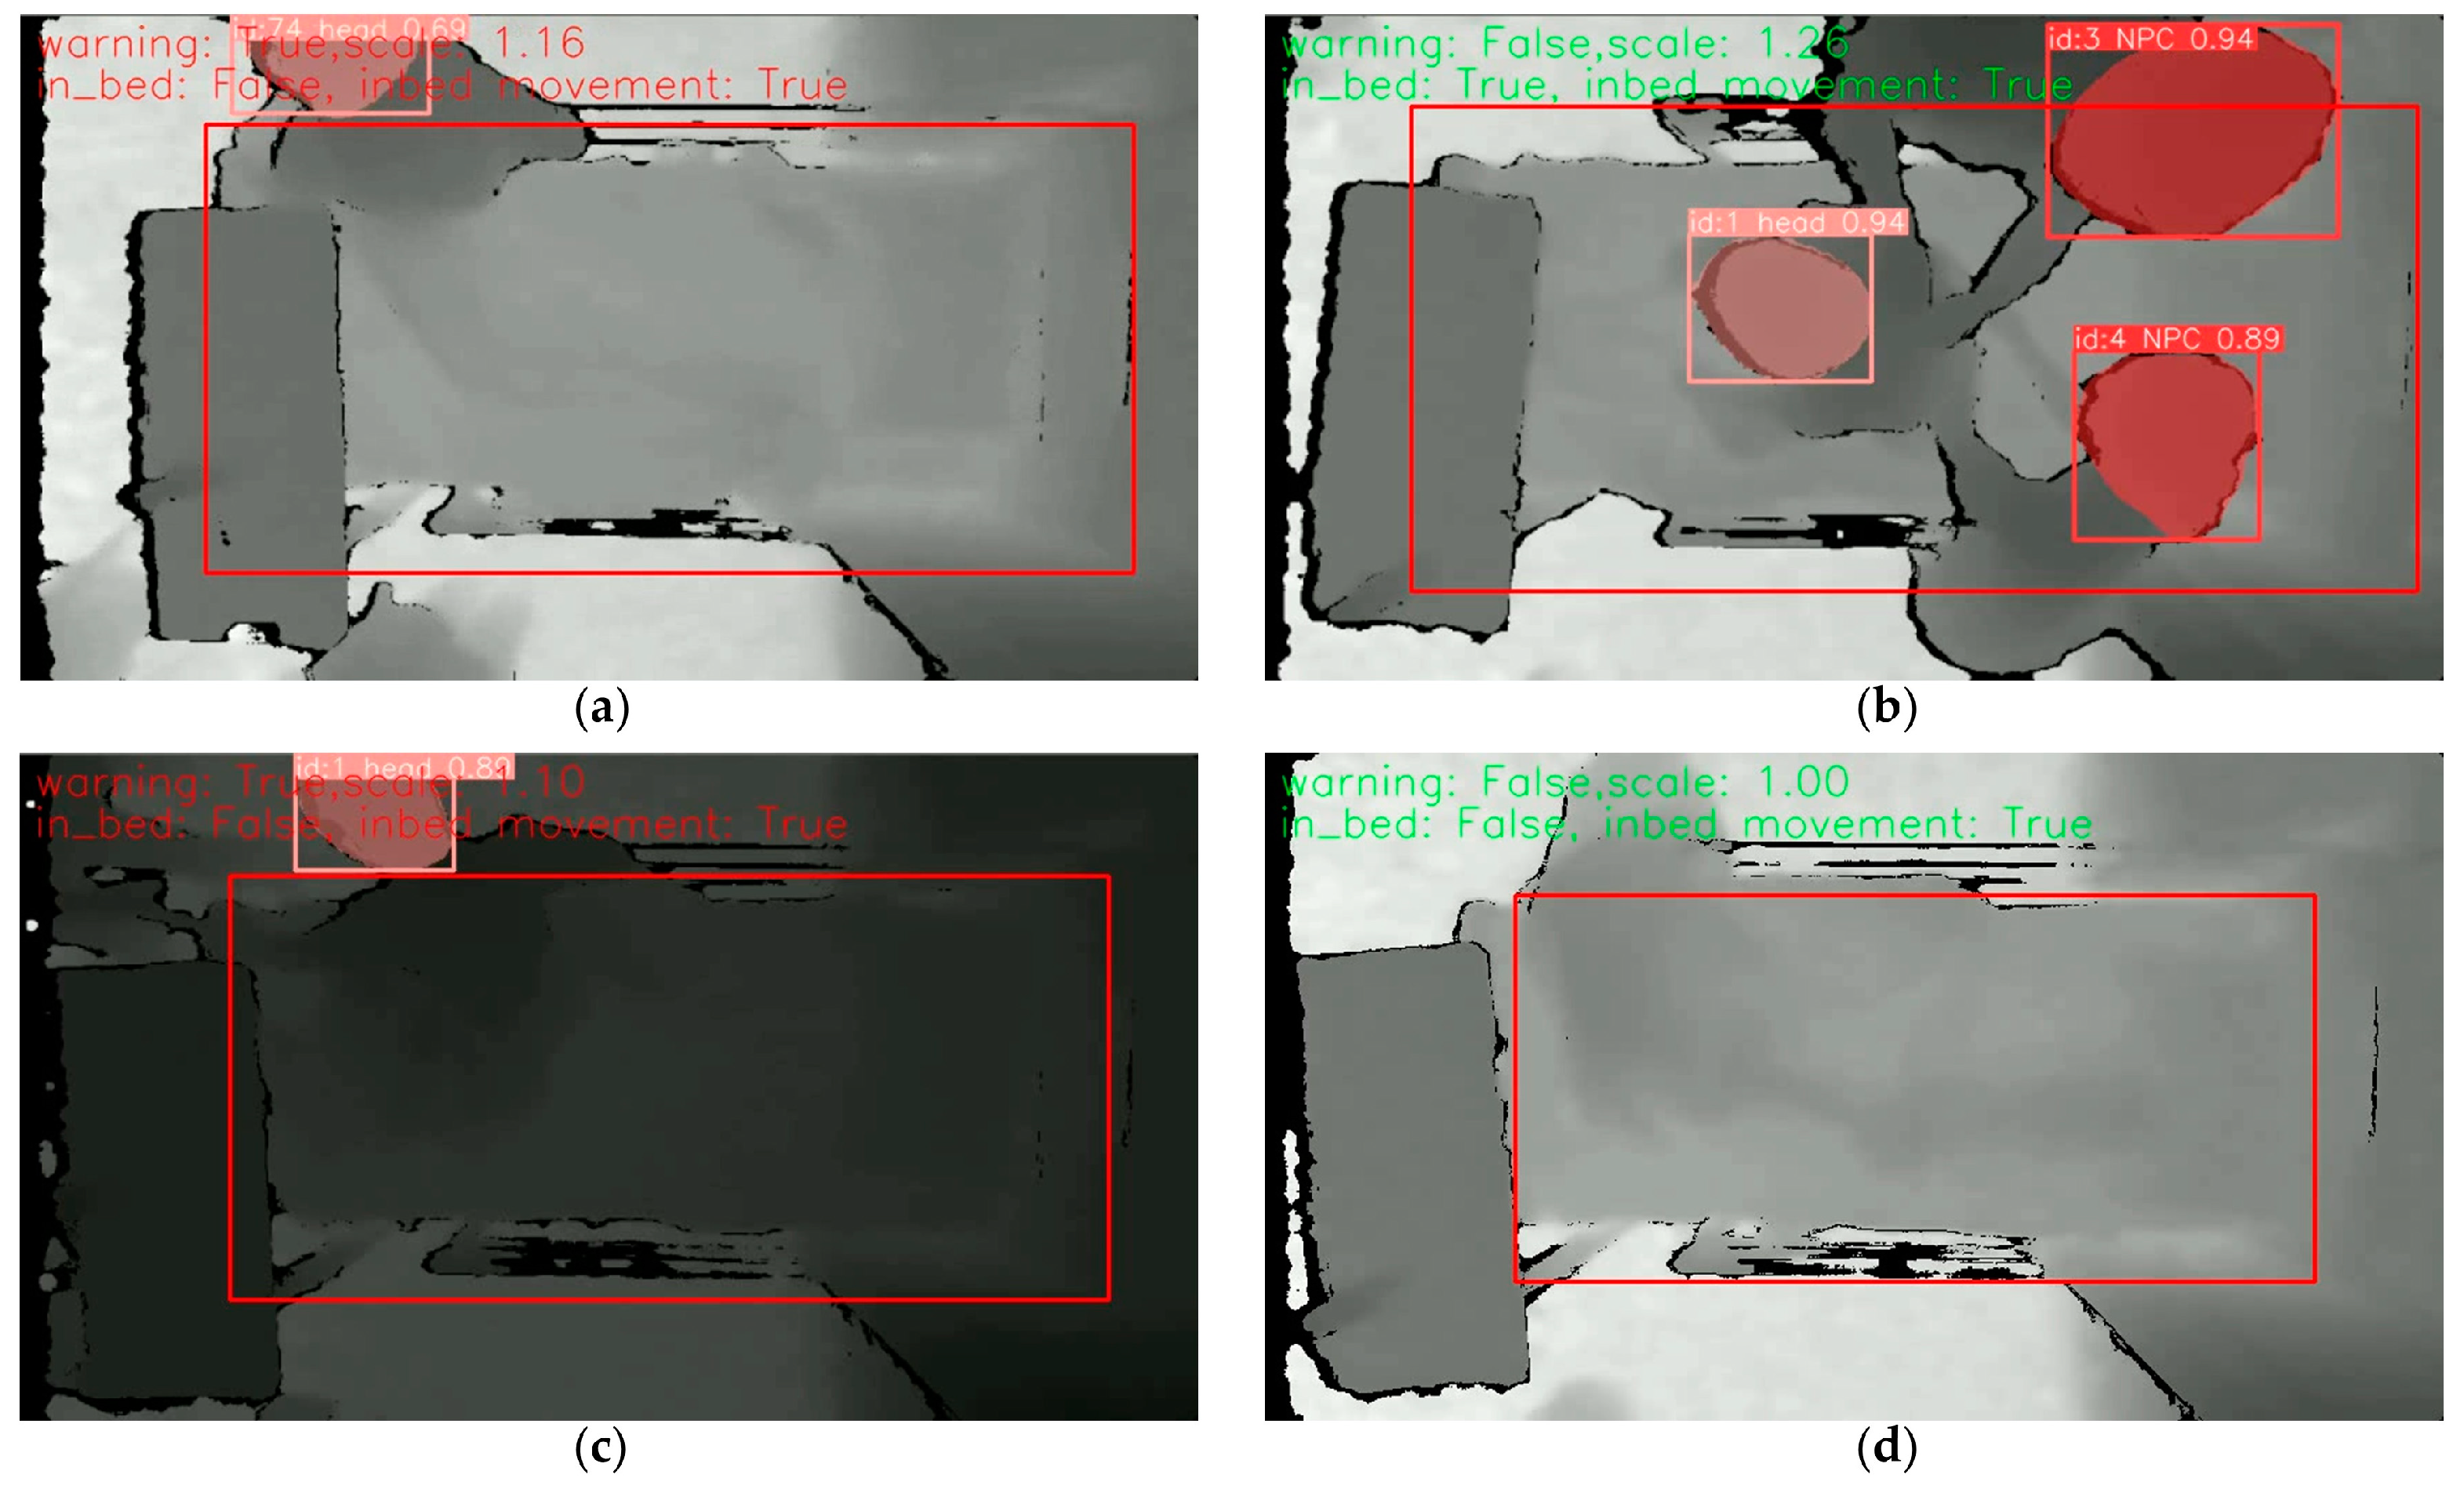
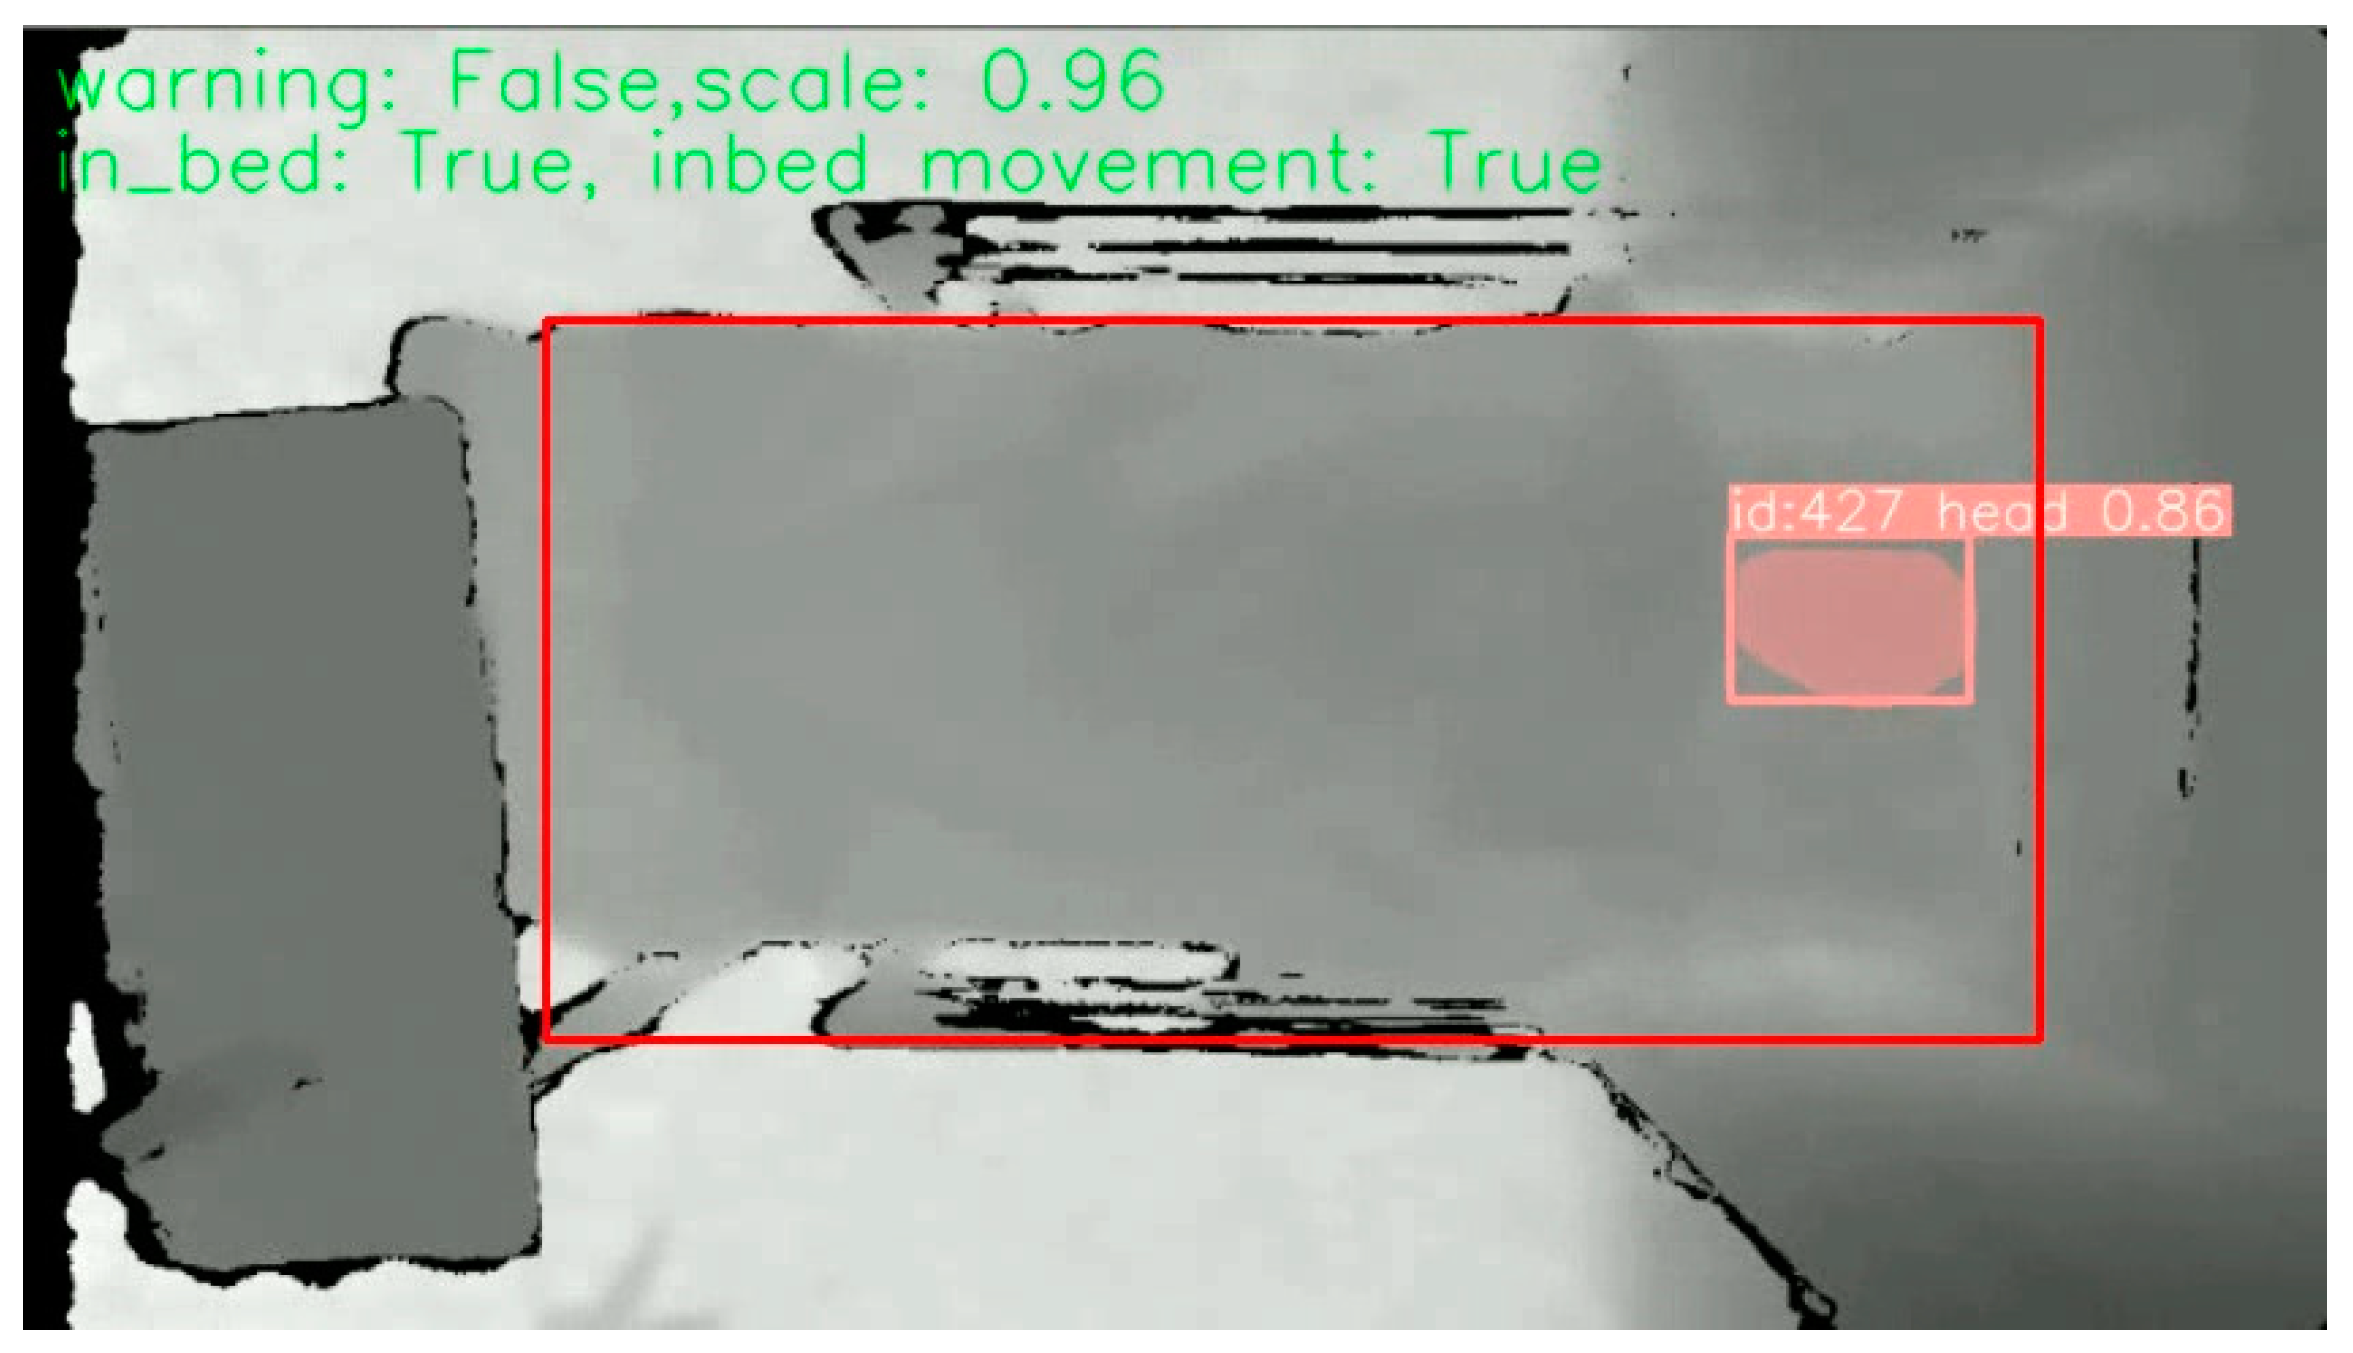
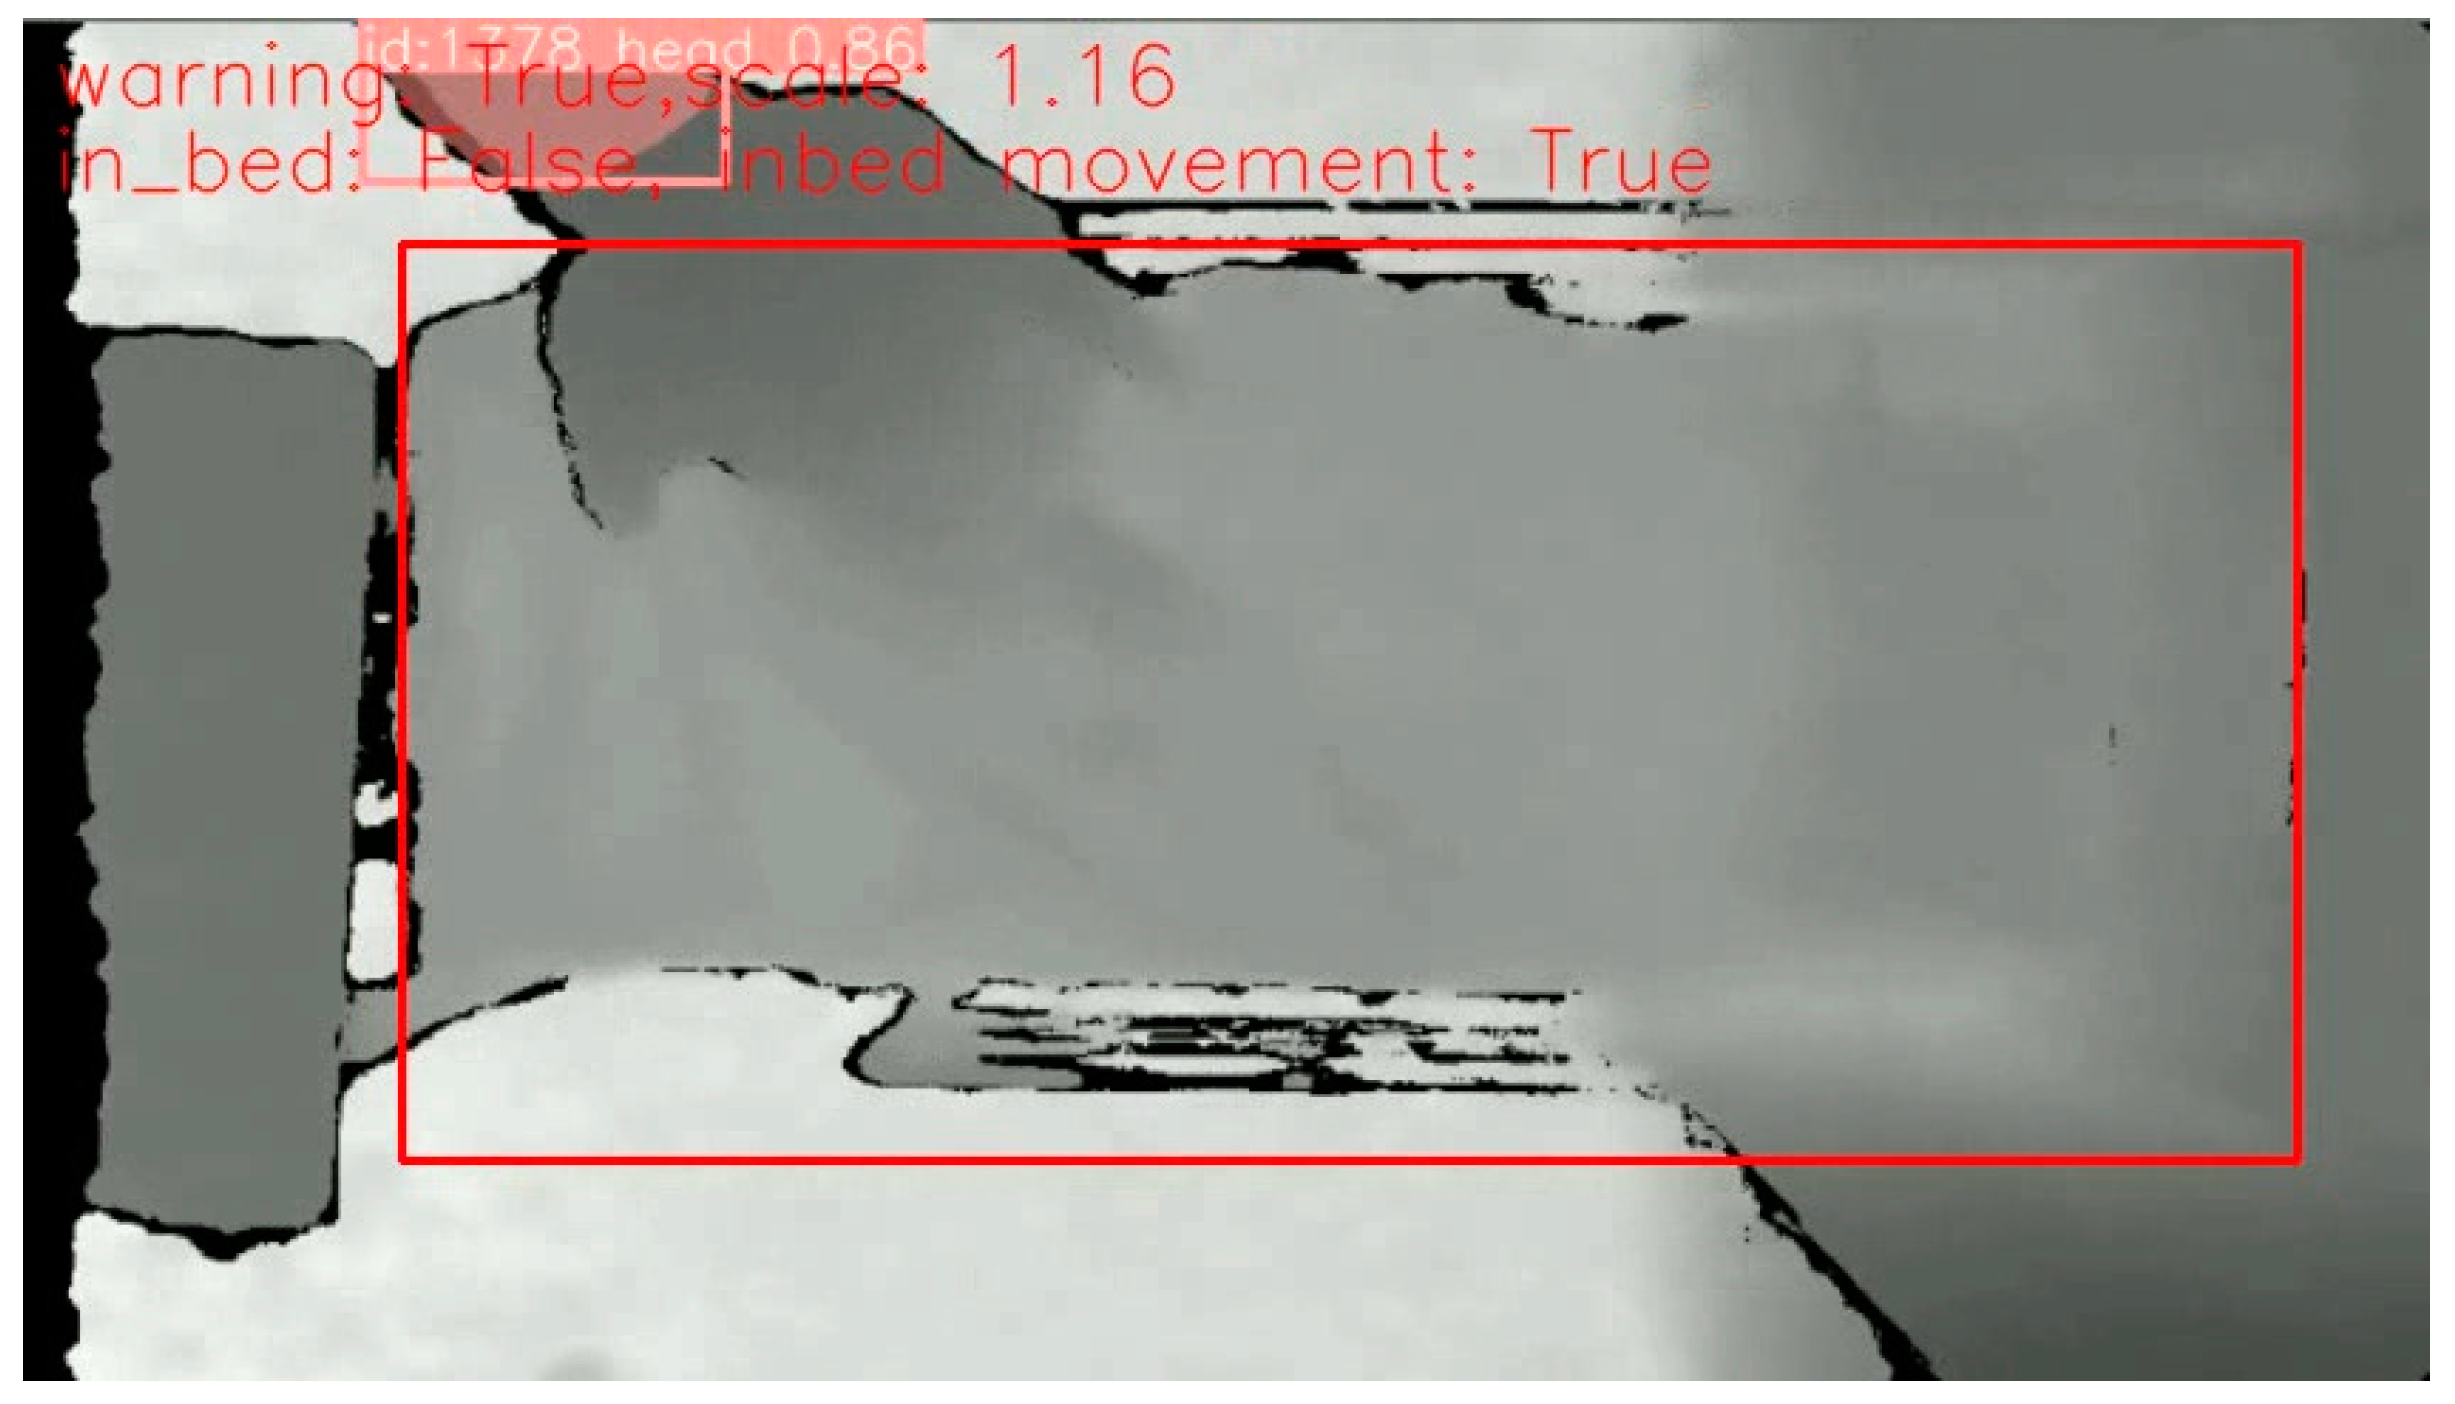
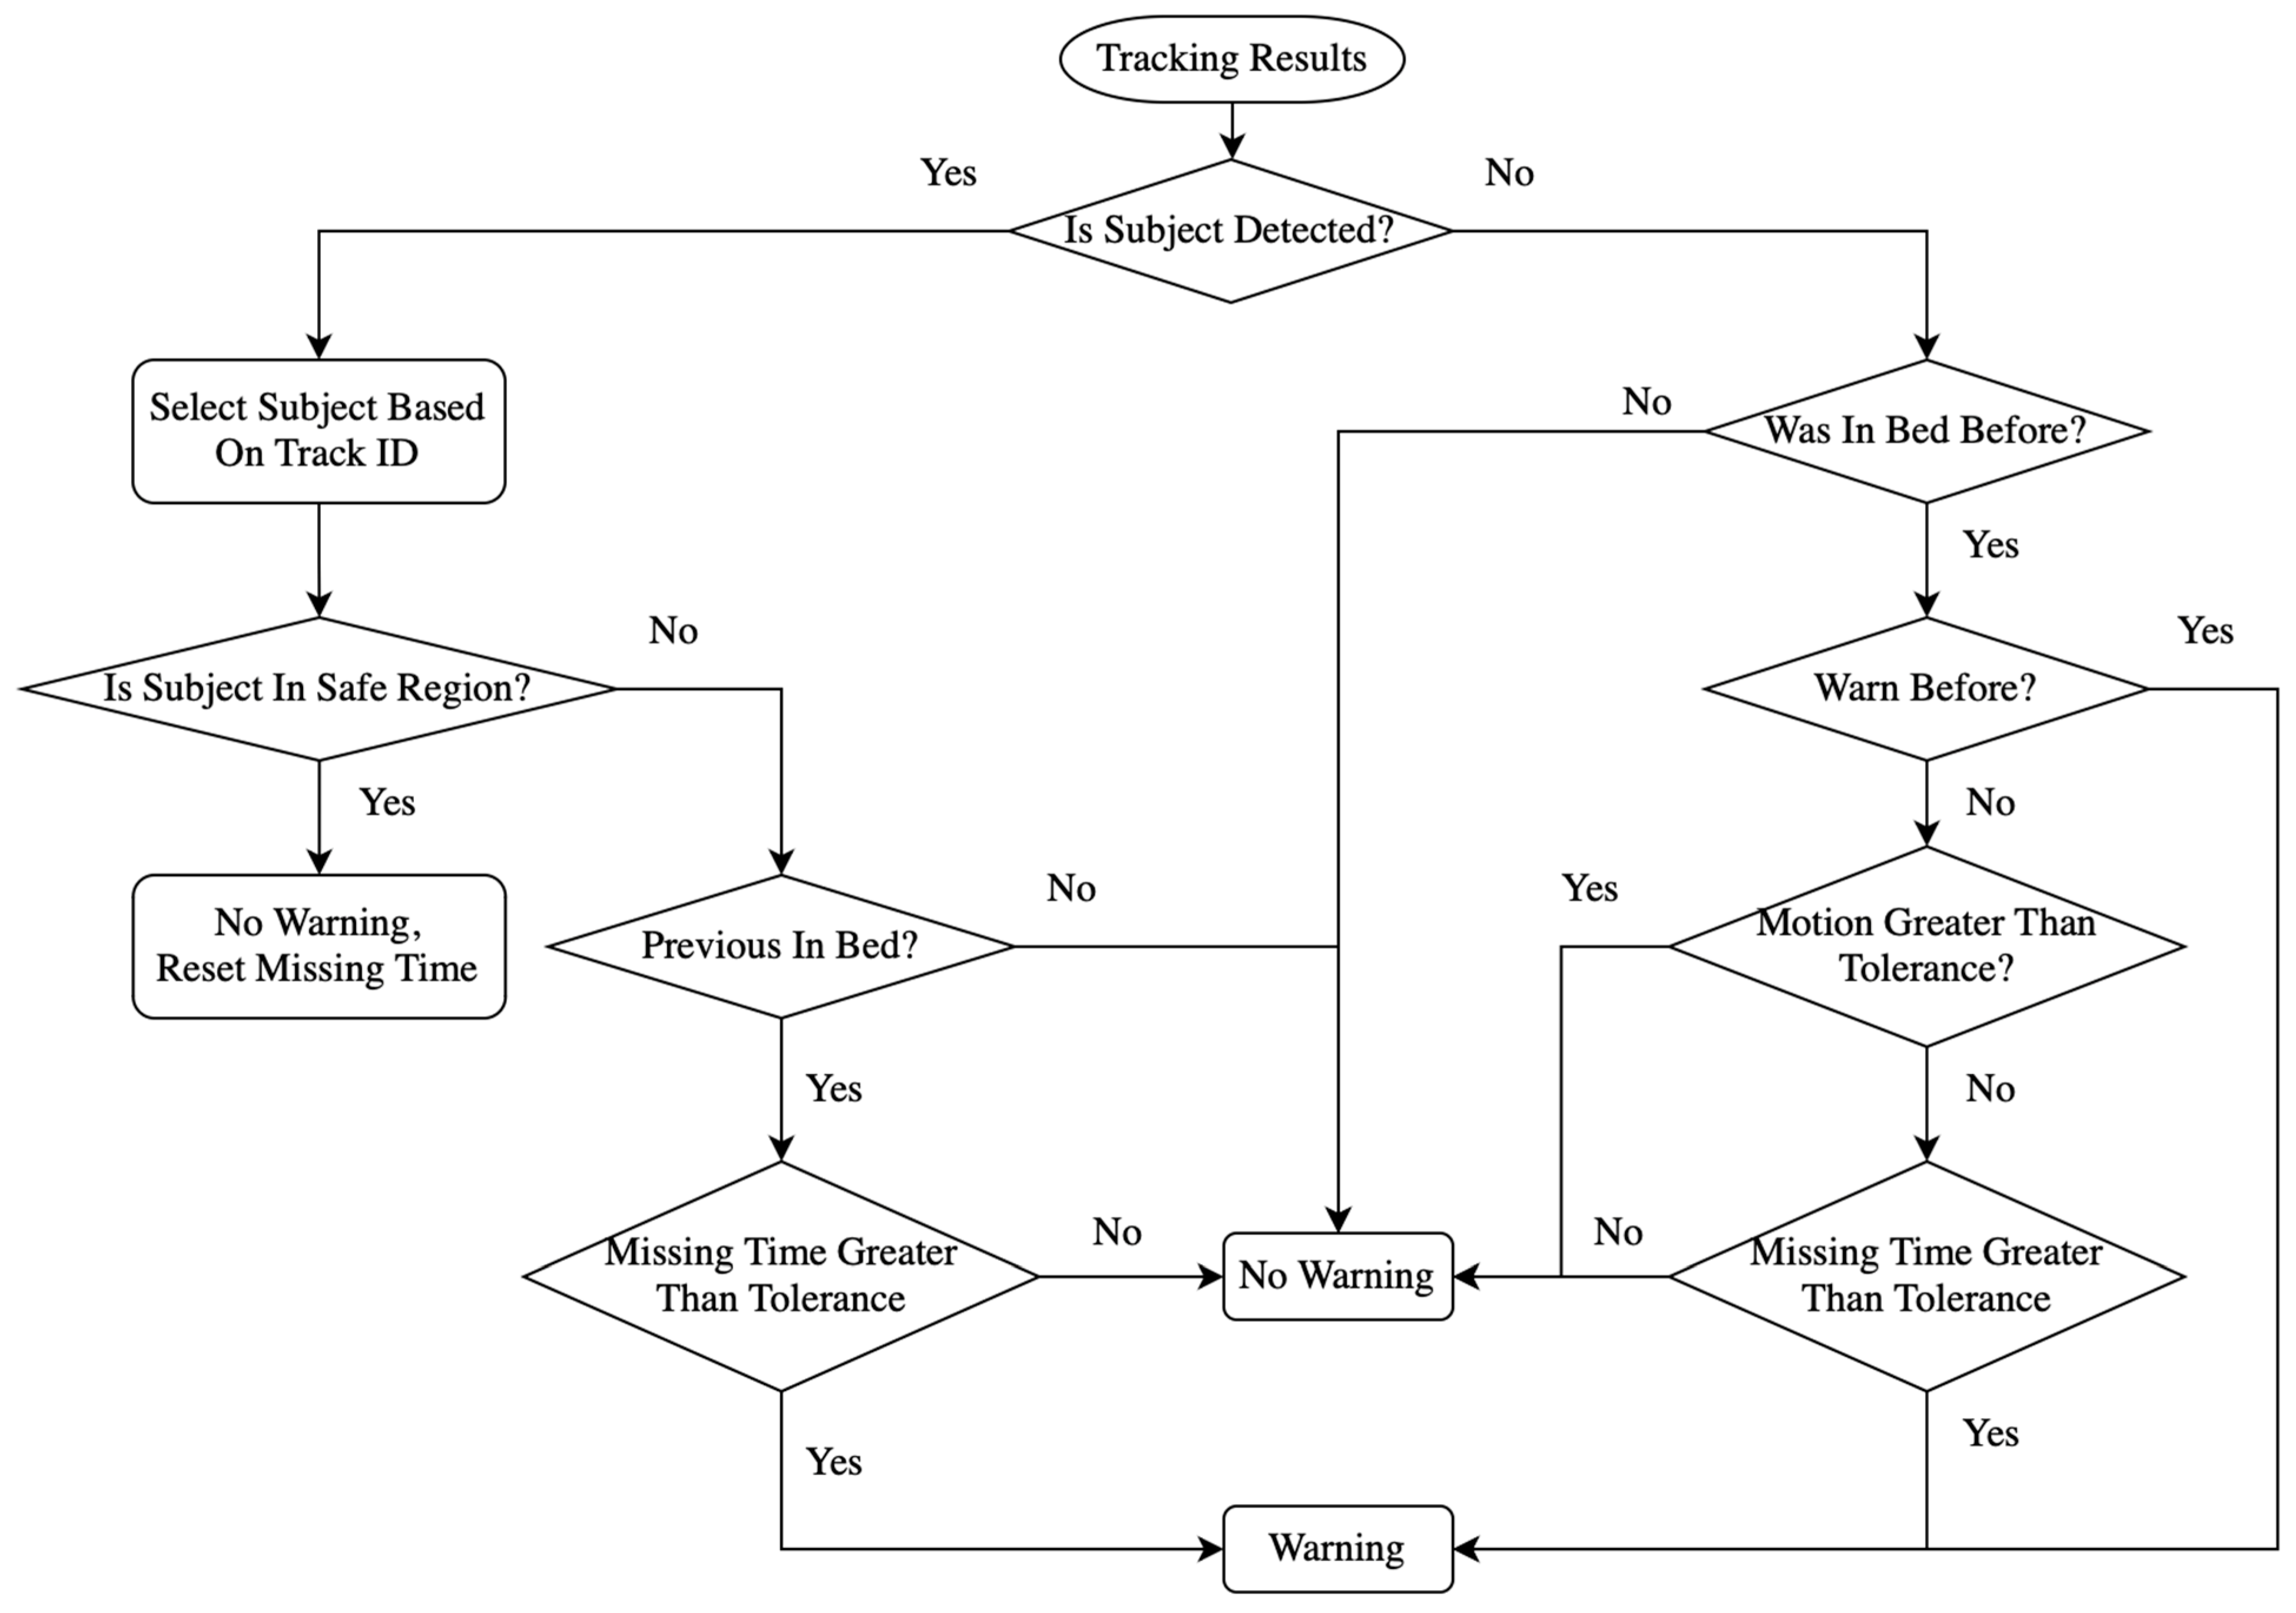
2.6. Alarm Identification

The algorithm should achieve the goal of triggering an alarm when the head center of a patient goes beyond the dynamically defined safe region, which varies with the head height, as shown in Figure 5.
The detected label information (head) of tracked frames is output as a text file that can be accessed before further processing. Due to the fact that the object size viewed by the camera decreases as its distance from the lens increases, the safe region defined to limit patient movement should be adjusted with the patient’s head height, as shown in Figure 6.
The bed height is the distance from the camera to the bed and the head height is from the head center to the bed. The initial state is assumed as a patient lying in bed, at which point medical personnel will manually initiate the tracking and alarm program as depicted in Figure 7. The scale of the dynamic safe region is used to calculate an instant safe region relative to the initial condition, and is expressed as follows:
s c a l e = B h B h H h
where Bh is bed height, Hh is head height.
The tolerable head height for patient safety was set to 1 m in our experiment when the patient was in a sitting position, which was used to limit the maximum safe region. Here, the maximum scale of the safe region is obtained from Equation (1):
s c a l e = B h m a x B h m a x H h m a x = 1.5 m 1.5 m 1 m = 3
The patient was regarded as exiting the safe region when the head center was beyond the safe region as shown in Figure 8, where the head center was defined as the 5% highest region in the detected head bounding box.
The algorithm flowchart for alarm identification is illustrated in Figure 9. When the subject or patient was detected and was in the safe region, there was no need to raise an alarm. When the subject was not in bed, but he/she was once detected in bed, this was determined as them exiting the bed and the alarm was raised if the duration was over the tolerant time. However, if the patient was never detected in the scenario, all the parameters recorded were reset as a new video. When tracking of the subject was lost and they were not previously detected to be in bed, it was assumed that there was no person visible in the field of view and no alarm was required. If tracking of the subject was lost and they were detected to have not previously been in bed with previous warning, this frame was regarded as a warning state. When the subject was in bed previously and tracking was lost without previous warning, the movement value was used to determine whether the patient was still in the safe region. As displayed in Figure 10, the movement indicator diagram was designed using the movement value calculated by
m o v e m e n t = i = 0 v a l i d . p i x e l s { 0 ,                                                 d e p t h [ i ] t h r e s h o l d d e p t h [ i ] ,                     d e p t h [ i ] > t h r e s h o l d
where the valid.pixels are those pixels for which the depth camera is able to retrieve the depth information, while the left-side parts of Figure 7 and Figure 8 contain black regions that are invalid pixels. depth[i] is the difference between the adjacent frames. The threshold of movement was determined by the movement value of the frames when no patient was in bed, which here was 100,000.0. If there is no movement, it should theoretically be all black in the movement view diagram, as in Figure 10a. The red frames in Figure 10 are the bed edge.
To adapt the depth information noise, the noise threshold was set as 80.0, indicating that the difference between adjacent frames should be greater than 80.0 to confirm movement existing. Movement existing in the bed but no patient detected could be the case that tracking was lost for the head but the subject was still in bed. However, warning was needed when the movement was less than the threshold over the tolerant time.

3. Results

This section is about the demonstration of the experimental aims and consists of four subsections. In Section 3.1, the evaluation metrices are adopted to assess the results and performance of a series of technological processes mentioned in Section 2. Section 3.2 presents the instance segmentation results and evaluates the ability to classify the heads of subjects and medical helpers. In Section 3.3, a comparison of different tracking techniques will be conducted. Then, Section 3.4 will show the final performance of the safe alarm algorithm.

3.1. Evaluation Metrices

3.1.1. Tracking Evaluation

The three MOT methods, StrongSORT, DeepSORT, and ByteTrack, are compared in terms of lost-tracking rate and the number of ID changes. The lost-tracking rate is calculated as follows:
L t r = N n d N f
where Ltr is the lost-tracking rate, Nnd is the number of frames without detection, and Nf is the total number of frames.
A higher lost-tracking rate means fewer frames are being tracked. Therefore, the MOT method with the lowest lost-tracking rate is preferred.
Moreover, the MOT models should ideally continue tracking a certain subject with a constant ID number. However, the tracker may reassign a new ID number to the same subject once the subject is re-tracked after a break, which means the tracker recognizes the subject with a different identification number. More frequent ID changes or identity-switching errors indicate the tracker has a worse ability for tracking and can lead to incorrect interpretations of object behavior and interactions [55]. Thus, the MOT method with fewer ID changes is superior.

3.1.2. Confusion Matrices

One of the most common performance measurements of pattern classification is accuracy, which is defined as the portion of correct predictions to the total size of the dataset. The accuracy generally evaluates the overall classification results but cannot reflect which class the misclassification is from. Therefore, a bias towards the majority class, ignoring the minority class, could happen. The confusion matrix, which also takes the particularities of the decisions into consideration, could be used to solve this issue. As two conditions, positive and negative, are determined, four possible outputs could be defined as true positive (TP), true negative (TN), false positive (FP), and false negative (FN). TP is the number of positive cases correctly predicted as positive. TN is the number of negative cases correctly predicted as negative. FP is the number of negative cases incorrectly predicted as positive, while FN is the number of positive cases that are incorrectly predicted as negative.
In addition, sensitivity, specificity, and balanced accuracy are usually used alongside the confusion matrix. Sensitivity is the ratio of TP over all positive cases, specificity is the ratio of TN over all negative cases, and the balanced accuracy is the mean value of sensitivity and specificity that eliminates the imbalance in the number of different classes of data.
sensitivity = TP TP + FN
specificity = TN TN + FP
balanced   accuracy = sensitivity + specificity 2
where precision measures the proportion of correctly predicted positive instances out of all instances predicted as positive.
precision = TP TP + FP
Recall, also known as sensitivity or true-positive rate, measures the proportion of predicted true positives out of all positives.
recall = TP TP + FN
F1 is commonly used for the evaluation of a model’s accuracy and is particularly suitable for imbalanced datasets. It can be expressed as follows:
F 1 = 2   ×   precision   ×   recall precision + recall

3.1.3. Object Detection Performance Evaluation

mAP50 (mean Average Precision at 50) is a performance discipline widely employed in object detection and image retrieval that is used to evaluate the accuracy and efficiency of a machine learning model based on recall and precision. mAP50 calculates the average precision across different levels of recall, specifically at 50 recall points. These recall points are evenly spaced from 0 to 1. The precision at each recall point is determined, and the average precision is computed by taking the mean of all these precision values [61].

3.2. Performance of YOLOv8 Instance Segmentation

As displayed in Table 2, the overall mAP50 for the segmentation of the heads of both medical personnel and patients reaches 98.8%, which indicates an acceptable ability of the customized YOLOv8 model. The mAP50 of medical personnel segmentation is 98.6%, which is slightly lower than that of patients, which is 99.0%. The ability to identify the patient’s head is related to the following steps, so a mAP50 of 99.0% is reasonable for the tracking and alarm identification process.
Table 3 indicates the mean mAP50 values of 5-fold cross-validation for all classes, for medical personnel, and for the patient, which are 97.6%, 96.6%, and 98.5%. The cross-validation results demonstrated the superior performance and good generalization of the model.

3.3. Comparison of Different Tracking Techniques

The total number of frames in all video clips is 91,829. As the tracking results recorded in Table 4 show, StrongSORT has the highest lost-tracking rate of 23.4%, while DeepSORT and BtyeTrack have the same rate of 8.9%. StrongSORT loses tracking in almost a quarter of all frames, which is not suitable for further alarm identification. DeepSORT and ByteTrack with lower lost-tracking rates have no reaction delay on re-tracking a subject, while StrongSORT requires a certain number of frames to confirm the appearance of a detected subject. As for the count of ID changes, although StrongSORT has the least amount of ID changes, it could be caused by its worse performance on tracking, which means that fewer frames have been tracked, resulting in fewer scenes where ID change can occur. From the comparison of the number of ID changes in DeepSORT (2109) and ByteTrack (1697), ByteTrack demonstrates a better ability to keep tracking a specific subject. However, it is not directly relevant to the accuracy of identifying a patient’s head. Therefore, a further comparison of DeepSORT and ByteTrack is conducted in the next section.

3.4. Performance of Alarm Algorithm

To evaluate the performance of the alarm stage, the state of staying in bed is regarded as a positive condition while exiting the bed is negative. Therefore, the detection metrics are defined as follows:
  • TP: the bed-exiting scenarios are predicted with warning.
  • TN: the staying-in-bed scenarios are identified as safe.
  • FP: the staying-in-bed scenarios are predicted with warning.
  • FN: the bed-exiting scenarios are identified as safe.
The examples of the above four conditions are illustrated in Figure 11. The TP example was from scenario 17 when the patient exited from the bedside. The TN example was from scenario 1 when the medical personnel helped to put a safety vest on the patient. The FP example was from scenario 1 when the in-bed movement was identified as bed exiting. The FN example was from scenario 2 where the alarm was not triggered as tracking of the patient’s head was lost when the patient slipped away from the side of the bed. The causes of lost tracking could be that the patient moved so fast that the frame rate of the depth camera could not capture it. Figure 12 displays the confusion matrices of the alarm algorithm combined with tracking results from DeepSORT and ByteTrack.
Both results shown in Table 5 from the MOT methods DeepSORT and ByteTrack have excellent sensitivity with satisfactory specificity. The false-negative scenario where the alarm is not raised while the patient is at risk of a fall should be controlled at the lowest level in real hospital applications, which in our experiment happens at a rate of 3.2%.

4. Discussion

The innovation of this study lies in the application and integration of depth cameras and deep learning to address the demand for a restraint-free bed-exiting alarm system for fall prevention with real-time tracking and dynamic virtual fence techniques. It is worth noticing that our previous research eNightLog [40] had no tracking. The highest point of the defined region was regarded as the patient’s head so the interference factor of bed height would raise a false alarm in scenario 07 when the nurse/patient adjusts the level of the bed. As shown in Figure 13, with the ability of head tracking and application of a dynamic safe region that expands with the head height increasing, our system could avoid the disturbance caused by alternative bed heights, which demonstrated the robustness of our model. Also, since our system could classify whether a person is medical personnel or a user, it is able to prevent mistaking medical personnel for users and raising false alarms when medical personnel leave the safe region. Therefore, comparing our current study, we can adjust the bed height and inclination without affecting the system performance. Although the accuracy of our system cannot match that of previous wearable sensors, it is not complicated to use and reduces the workload of nurses.
The misclassification of patient heads in YOLOv8 when identifying the patients and medical personnel is mainly due to head-like interference, such as pillows, shoulders, and knees, when viewing from certain levels. The depth information used in this experiment is only from a top-down viewpoint, which results in the intake of information about the appearance of subjects in the visible area being relatively limited. Therefore, misclassification could occur when our customized YOLOv8 model misidentifies items of head-like shapes as a head. The issue could be addressed when the depth information captured by multi-depth cameras from diverse perspectives is taken into consideration. Also, the multi-depth camera information could also be registered into a new volume to avoid the issue of overlapping objects.
Some false negatives occur during tracking with a relatively large safe region. The largest safe region is already limited by the user sitting height, so the user leaves the depth camera’s view once he leaves the safe region. This buffer zone can be enlarged by using a camera with a wider angle or installing a camera in a higher position so that the proportion of the predetermined region to the whole field of view is small enough to provide a reasonable buffer zone area. In addition, a greater frame rate than the 6 frames/s in this experiment could increase the flexibility of our eNightTrack system. Though the ReID changes demonstrated robustness as they indicated the situations of lost tracking and mis-tracking in MOT techniques, it could not exactly reflect the robustness. As for the complexity, both DeepSORT and StrongSORT tracking contained approximately 6.46 M trainable parameters, while the YOLOv8 segmentation model contained 261 layers and approximately 3.41 M trainable parameters. Due to the limitation that only a small number of features were used in this study, it is not easy to remove any feature among them for an ablation study. In a future study, we can track all palms, shoulders, knees, and feet, where OpenPose can be used to recognize them and improved tracking techniques can then be applied to track additional features to enhance the performance. Compared with the bed-exiting identification system developed by Lu et al. in 2018 [62] that achieved an accuracy of 60.3% on 151 samples with combination of DPCA (dynamic principal component analysis) and GMM (Gaussian mixture model) technologies, our system demonstrated higher accuracies of 79.8% and 79.1%.
In future implementations of our system in hospitals, the tolerant head height of the patient used to determine the maximum safe region should be adjusted to the patient’s height. Furthermore, more subjects could be recruited in future work to eliminate inter-subject interference and improve the generality of the eNightTrack system. Additionally, prior YOLO models, such as YOLO-NAS, could be utilized for head detection. Similarly, an emergency MOT technique could substitute the tracking model adopted in this experiment. The registered 3D data mentioned in Section 3.2 could be utilized for 3D tracking, which could be more comprehensive. Clinical trials should be implemented before it is finally applied to hospital use.

5. Conclusions

In hospitals, some unattended patient bed-exiting events might result in falls, increasing the burden on medical staff. At present, commonly used means of physical or chemical restraint might harm the physical and mental health of patients. Ordinary RGB camera monitoring systems involve privacy concerns. Therefore, our virtual monitoring system based on depth cameras has been developed for preventing patients’ movements and fall risk.
We demonstrated that the eNightTrack system had a convincing sensitivity of 96.8% for detecting bed-exiting events, making it a potential effective tool to prevent falls. Moreover, it offers several advantages, including the avoidance of privacy issues and could serve as an alternative to current restraint measures. The system is robust to disturbances caused by bed height variations, furniture changes, and medical personnel entering the predefined region. However, there are still several limitations and concerns that should be focused on during future developments. A further modified eNightTrack system could be installed in hospital wards to support nurses in monitoring at any moment.

Author Contributions

Conceptualization, Y.-P.Z. and J.C.-W.C.; methodology, Y.-P.Z. and J.C.-W.C.; software, Y.-J.M. and A.Y.-C.T.; validation, A.Y.-C.T. and Q.T.-K.S.; formal analysis, Y.-J.M. and A.Y.-C.T.; investigation, A.Y.-C.T. and Q.T.-K.S.; resources, Y.-P.Z. and J.C.-W.C.; data curation, A.Y.-C.T. and Q.T.-K.S.; writing—original draft preparation, Y.-J.M.; writing—review and editing, J.C.-W.C.; supervision, Y.-P.Z. and J.C.-W.C.; project administration, Q.T.-K.S. and J.C.-W.C.; funding acquisition, J.C.-W.C. All authors have read and agreed to the published version of the manuscript.

Funding

This research was funded by the University Grants Committee of Hong Kong under the General Research Fund (GRF), grant number: PolyU15223822.

Institutional Review Board Statement

This study was approved by the Human Subjects Ethics Sub-committee of Hong Kong Polytechnic University (No. HSEARS20210127007).

Data Availability Statement

The data presented in this study are available on request from the corresponding author.

Conflicts of Interest

The authors declare no conflict of interest.

References

  1. Ko, A.; Van Nguyen, H.; Chan, L.; Shen, Q.; Ding, X.M.; Chan, D.L.; Chan, D.K.Y.; Brock, K.; Clemson, L. Developing a self-reported tool on fall risk based on toileting responses on in-hospital falls. Geriatr. Nurs. 2012, 33, 9–16. [Google Scholar] [CrossRef] [PubMed]
  2. LeLaurin, J.H.; Shorr, R.I. Preventing falls in hospitalized patients: State of the science. Clin. Geriatr. Med. 2019, 35, 273–283. [Google Scholar] [CrossRef] [PubMed]
  3. Gallardo, M.; Asencio, J.; Sanchez, J.; Banderas, A.; Suarez, A. Instruments for assessing the risk of falls in acute hospitalized patients: A systematic review protocol. J. Adv. Nurs. 2012, 69, 185–193. [Google Scholar] [CrossRef]
  4. Hignett, S.; Sands, G.; Griffiths, P. In-patient falls: What can we learn from incident reports? Age Ageing 2013, 42, 527–531. [Google Scholar] [CrossRef] [PubMed]
  5. Choi, Y.S.; Lawler, E.; Boenecke, C.A.; Ponatoski, E.R.; Zimring, C.M. Developing a multi-systemic fall prevention model, incorporating the physical environment, the care process and technology: A systematic review. J. Adv. Nurs. 2011, 67, 2501–2524. [Google Scholar] [CrossRef]
  6. Feng, Z.; Hirdes, J.P.; Smith, T.F.; Finne-Soveri, H.; Chi, I.; Du Pasquier, J.N.; Gilgen, R.; Ikegami, N.; Mor, V. Use of physical restraints and antipsychotic medications in nursing homes: A cross-national study. Int. J. Geriatr. Psychiatry A J. Psychiatry Late Life Allied Sci. 2009, 24, 1110–1118. [Google Scholar] [CrossRef] [PubMed]
  7. Kwok, T.; Bai, X.; Chui, M.Y.; Lai, C.K.; Ho, D.W.; Ho, F.K.; Woo, J. Effect of physical restraint reduction on older patients’ hospital length of stay. J. Am. Med. Dir. Assoc. 2012, 13, 645–650. [Google Scholar] [CrossRef] [PubMed]
  8. Choi, E.; Song, M. Physical restraint use in a Korean ICU. J. Clin. Nurs. 2003, 12, 651–659. [Google Scholar] [CrossRef] [PubMed]
  9. Capezuti, E. Minimizing the use of restrictive devices in dementia patients at risk for falling. Nurs. Clin. 2004, 39, 625–647. [Google Scholar] [CrossRef]
  10. Gallinagh, R.n.; Nevin, R.; Mc Ilroy, D.; Mitchell, F.; Campbell, L.; Ludwick, R.; McKenna, H. The use of physical restraints as a safety measure in the care of older people in four rehabilitation wards: Findings from an exploratory study. Int. J. Nurs. Stud. 2002, 39, 147–156. [Google Scholar] [CrossRef] [PubMed]
  11. Hofmann, H.; Hahn, S. Characteristics of nursing home residents and physical restraint: A systematic literature review. J. Clin. Nurs. 2014, 23, 3012–3024. [Google Scholar] [CrossRef] [PubMed]
  12. Lam, K.; Kwan, J.S.; Kwan, C.W.; Chong, A.M.; Lai, C.K.; Lou, V.W.; Leung, A.Y.; Liu, J.Y.; Bai, X.; Chi, I. Factors associated with the trend of physical and chemical restraint use among long-term care facility residents in Hong Kong: Data from an 11-year observational study. J. Am. Med. Dir. Assoc. 2017, 18, 1043–1048. [Google Scholar] [CrossRef]
  13. Lancaster, G.A.; Whittington, R.; Lane, S.; Riley, D.; Meehan, C. Does the position of restraint of disturbed psychiatric patients have any association with staff and patient injuries? J. Psychiatr. Ment. Health Nurs. 2008, 15, 306–312. [Google Scholar] [CrossRef] [PubMed]
  14. Andrews, G.J. Managing challenging behaviour in dementia. BMJ 2006, 332, 741. [Google Scholar] [CrossRef] [PubMed]
  15. Gastmans, C.; Milisen, K. Use of physical restraint in nursing homes: Clinical-ethical considerations. J. Med. Ethics 2006, 32, 148–152. [Google Scholar] [CrossRef] [PubMed]
  16. Ooi, C.H.; Yoon, P.S.; How, C.H.; Poon, N.Y. Managing challenging behaviours in dementia. Singap. Med. J. 2018, 59, 514. [Google Scholar] [CrossRef]
  17. Ackerman, M.M.; Tang, X.; Guyot-Sionnest, P. Fast and sensitive colloidal quantum dot mid-wave infrared photodetectors. ACS Nano 2018, 12, 7264–7271. [Google Scholar] [CrossRef] [PubMed]
  18. Massé, F.; Gonzenbach, R.R.; Arami, A.; Paraschiv-Ionescu, A.; Luft, A.R.; Aminian, K. Improving activity recognition using a wearable barometric pressure sensor in mobility-impaired stroke patients. J. Neuroeng. Rehabil. 2015, 12, 72. [Google Scholar] [CrossRef]
  19. Cheung, C.-W.J.; Chan, W.-H.R.; Chiu, M.-W.; Law, S.-Y.; Lee, T.-H.; Zheng, Y.-P. A three-month study of fall and physical activity levels of intellectual disability using a transfer belt-based motion recording sensor. In 6th World Congress of Biomechanics (WCB 2010), Proceedings of the in Conjunction with 14th International Conference on Biomedical Engineering (ICBME) and 5th Asia Pacific Conference on Biomechanics (APBiomech), Singapore, 1–6 August 2010; Springer: Berlin/Heidelberg, Germany, 2010; pp. 1393–1396. [Google Scholar]
  20. Yaacoub, J.-P.A.; Noura, M.; Noura, H.N.; Salman, O.; Yaacoub, E.; Couturier, R.; Chehab, A. Securing internet of medical things systems: Limitations, issues and recommendations. Future Gener. Comput. Syst. 2020, 105, 581–606. [Google Scholar] [CrossRef]
  21. Liu, B.; Cai, H.; Ju, Z.; Liu, H. RGB-D sensing based human action and interaction analysis: A survey. Pattern Recognit. 2019, 94, 1–12. [Google Scholar] [CrossRef]
  22. Fuertes Muñoz, G.; Mollineda, R.A.; Gallardo Casero, J.; Pla, F. A rgbd-based interactive system for gaming-driven rehabilitation of upper limbs. Sensors 2019, 19, 3478. [Google Scholar] [CrossRef] [PubMed]
  23. Avola, D.; Cinque, L.; Del Bimbo, A.; Marini, M.R. MIFTel: A multimodal interactive framework based on temporal logic rules. Multimed. Tools Appl. 2020, 79, 13533–13558. [Google Scholar] [CrossRef]
  24. Cheung, J.C.-W.; So, B.P.-H.; Ho, K.H.M.; Wong, D.W.-C.; Lam, A.H.-F.; Cheung, D.S.K. Wrist accelerometry for monitoring dementia agitation behaviour in clinical settings: A scoping review. Front. Psychiatry 2022, 13, 913213. [Google Scholar] [CrossRef] [PubMed]
  25. Shorr, R.I.; Chandler, A.M.; Mion, L.C.; Waters, T.M.; Liu, M.; Daniels, M.J.; Kessler, L.A.; Miller, S.T. Effects of an intervention to increase bed alarm use to prevent falls in hospitalized patients: A cluster randomized trial. Ann. Intern. Med. 2012, 157, 692–699. [Google Scholar] [CrossRef] [PubMed]
  26. Faisal, I.A.; Purboyo, T.W.; Ansori, A.S.R. A review of accelerometer sensor and gyroscope sensor in IMU sensors on motion capture. J. Eng. Appl. Sci 2019, 15, 826–829. [Google Scholar]
  27. Sawane, M.; Prasad, M. MEMS piezoelectric sensor for self-powered devices: A review. Mater. Sci. Semicond. Process. 2023, 158, 107324. [Google Scholar] [CrossRef]
  28. Xiong, D.; Zhang, D.; Zhao, X.; Zhao, Y. Deep Learning for EMG-based Human-Machine Interaction: A Review. IEEE/CAA J. Autom. Sin. 2021, 8, 512–533. [Google Scholar] [CrossRef]
  29. Xue, J.; Lai, K.W.C. Dynamic gripping force estimation and reconstruction in EMG-based human-machine interaction. Biomed. Signal Process. Control 2023, 80, 104216. [Google Scholar] [CrossRef]
  30. Jannat, M.K.A.; Islam, M.S.; Yang, S.H.; Liu, H. Efficient Wi-Fi-Based Human Activity Recognition Using Adaptive Antenna Elimination. IEEE Access 2023, 11, 105440–105454. [Google Scholar] [CrossRef]
  31. Ding, J.; Wang, Y. A WiFi-Based Smart Home Fall Detection System Using Recurrent Neural Network. IEEE Trans. Consum. Electron. 2020, 66, 308–317. [Google Scholar] [CrossRef]
  32. Liu, H.; Gamboa, H.; Schultz, T. Sensor-Based Human Activity and Behavior Research: Where Advanced Sensing and Recognition Technologies Meet. Sensors 2023, 23, 125. [Google Scholar] [CrossRef] [PubMed]
  33. Xue, T.; Liu, H. Hidden Markov Model and Its Application in Human Activity Recognition and Fall Detection: A Review. In Proceedings of the Communications, Signal Processing, and Systems, Singapore, 21–22 August 2021; pp. 863–869. [Google Scholar]
  34. Mekruksavanich, S.; Jantawong, P.; Hnoohom, N.; Jitpattanakul, A. Automatic Fall Detection using Deep Neural Networks with Aggregated Residual Transformation. In Proceedings of the 2022 37th International Technical Conference on Circuits/Systems, Computers and Communications (ITC-CSCC), Phuket, Thailand, 5–8 July 2022; pp. 811–814. [Google Scholar]
  35. Liang, S.; Chu, T.; Lin, D.; Ning, Y.; Li, H.; Zhao, G. Pre-impact Alarm System for Fall Detection Using MEMS Sensors and HMM-based SVM Classifier. In Proceedings of the 2018 40th Annual International Conference of the IEEE Engineering in Medicine and Biology Society (EMBC), Honolulu, HI, USA, 18–21 July 2018; pp. 4401–4405. [Google Scholar]
  36. Liu, H.; Hartmann, Y.; Schultz, T. Motion Units: Generalized Sequence Modeling of Human Activities for Sensor-Based Activity Recognition. In Proceedings of the 2021 29th European Signal Processing Conference (EUSIPCO), Dublin, Ireland, 23–27 August 2021; pp. 1506–1510. [Google Scholar]
  37. Hartmann, Y.; Liu, H.; Schultz, T. High-Level Features for Human Activity Recognition and Modeling. In Proceedings of the Biomedical Engineering Systems and Technologies. BIOSTEC 2022, Vienna, Austria, 9–11 February 2022; pp. 141–163. [Google Scholar]
  38. Carneiro, S.A.; Silva, G.P.d.; Leite, G.V.; Moreno, R.; Guimarães, S.J.F.; Pedrini, H. Multi-Stream Deep Convolutional Network Using High-Level Features Applied to Fall Detection in Video Sequences. In Proceedings of the 2019 International Conference on Systems, Signals and Image Processing (IWSSIP), Osijek, Croatia, 5–7 June 2019; pp. 293–298. [Google Scholar]
  39. Kasturi, S.; Filonenko, A.; Jo, K.-H. Human fall recognition using the spatiotemporal 3d cnn. In Proceedings of the 29th International Workshop on Frontiers of Computer Vision, 2019, Yeosu, South Korea, 20–22 February 2023; pp. 1–3. [Google Scholar]
  40. Hasan, M.M.; Islam, M.S.; Abdullah, S. Robust Pose-Based Human Fall Detection Using Recurrent Neural Network. In Proceedings of the 2019 IEEE International Conference on Robotics, Automation, Artificial-intelligence and Internet-of-Things (RAAICON), Dhaka, Bangladesh, 29 November–1 December 2019; pp. 48–51. [Google Scholar]
  41. Cao, Z.; Simon, T.; Wei, S.-E.; Sheikh, Y. Realtime multi-person 2d pose estimation using part affinity fields. In Proceedings of the IEEE Conference on Computer Vision and Pattern Recognition (CVPR), Honolulu, HI, USA, 21–26 July 2017; pp. 7291–7299. [Google Scholar]
  42. Cheung, J.C.-W.; Tam, E.W.-C.; Mak, A.H.-Y.; Chan, T.T.-C.; Lai, W.P.-Y.; Zheng, Y.-P. Night-time monitoring system (eNightLog) for elderly wandering behavior. Sensors 2021, 21, 704. [Google Scholar] [CrossRef] [PubMed]
  43. Cheung, J.C.-W.; Tam, E.W.-C.; Mak, A.H.-Y.; Chan, T.T.-C.; Zheng, Y.-P. A night-time monitoring system (eNightLog) to prevent elderly wandering in hostels: A three-month field study. Int. J. Environ. Res. Public Health 2022, 19, 2103. [Google Scholar] [CrossRef] [PubMed]
  44. Tam, A.Y.-C.; So, B.P.-H.; Chan, T.T.-C.; Cheung, A.K.-Y.; Wong, D.W.-C.; Cheung, J.C.-W. A blanket accommodative sleep posture classification system using an infrared depth camera: A deep learning approach with synthetic augmentation of blanket conditions. Sensors 2021, 21, 5553. [Google Scholar] [CrossRef] [PubMed]
  45. Tam, A.Y.-C.; Zha, L.-W.; So, B.P.-H.; Lai, D.K.-H.; Mao, Y.-J.; Lim, H.-J.; Wong, D.W.-C.; Cheung, J.C.-W. Depth-Camera-Based Under-Blanket Sleep Posture Classification Using Anatomical Landmark-Guided Deep Learning Model. Int. J. Environ. Res. Public Health 2022, 19, 13491. [Google Scholar] [CrossRef] [PubMed]
  46. Lai, D.K.-H.; Zha, L.-W.; Leung, T.Y.-N.; Tam, A.Y.-C.; So, B.P.-H.; Lim, H.-J.; Cheung, D.S.K.; Wong, D.W.-C.; Cheung, J.C.-W. Dual ultra-wideband (UWB) radar-based sleep posture recognition system: Towards ubiquitous sleep monitoring. Eng. Regen. 2023, 4, 36–43. [Google Scholar] [CrossRef]
  47. Lai, D.K.-H.; Yu, Z.-H.; Leung, T.Y.-N.; Lim, H.-J.; Tam, A.Y.-C.; So, B.P.-H.; Mao, Y.-J.; Cheung, D.S.K.; Wong, D.W.-C.; Cheung, J.C.-W. Vision Transformers (ViT) for Blanket-Penetrating Sleep Posture Recognition Using a Triple Ultra-Wideband (UWB) Radar System. Sensors 2023, 23, 2475. [Google Scholar] [CrossRef] [PubMed]
  48. Shea, T.; Tam, Y.; So, P.; Chan, T.; Mak, H.; Lai, K.; Wong, M.; Zheng, Y.; Cheung, C. Multi-depth cameras system for bed exit and fall prevention of hospitalized elderly patients. Gerontechnology 2022, 21, 1. [Google Scholar] [CrossRef]
  49. Jocher, G.; Chaurasia, A.; Stoken, A.; Borovec, J.; Kwon, Y.; Michael, K.; Fang, J.; Wong, C.; Yifu, Z.; Montes, D. Ultralytics/Yolov5: v6. 2-Yolov5 Classification Models, Apple m1, Reproducibility, Clearml and Deci. ai Integrations. Available online: https://ui.adsabs.harvard.edu/abs/2022zndo...7002879J/exportcitation (accessed on 25 August 2023).
  50. Liu, W.; Anguelov, D.; Erhan, D.; Szegedy, C.; Reed, S.; Fu, C.-Y.; Berg, A.C. Ssd: Single shot multibox detector. In Proceedings of the Computer Vision–ECCV 2016: 14th European Conference, Amsterdam, The Netherlands, 11–14 October 2016; Proceedings, Part I 14. pp. 21–37. [Google Scholar]
  51. Ren, S.; He, K.; Girshick, R.; Sun, J. Faster R-CNN: Towards Real-Time Object Detection with Region Proposal Networks. In Proceedings of the Advances in Neural Information Processing Systems 28 (NIPS 2015), Montreal, QC, Canada, 7–12 December 2015. [Google Scholar]
  52. Phon-Amnuaisuk, S.; Murata, K.T.; Pavarangkoon, P.; Yamamoto, K.; Mizuhara, T. Exploring the applications of faster R-CNN and single-shot multi-box detection in a smart nursery domain. arXiv 2018, arXiv:1808.08675. [Google Scholar]
  53. Lee, J.-D.; Chien, J.-C.; Hsu, Y.-T.; Wu, C.-T. Automatic Surgical Instrument Recognition—A Case of Comparison Study between the Faster R-CNN, Mask R-CNN, and Single-Shot Multi-Box Detectors. Appl. Sci. 2021, 11, 8097. [Google Scholar] [CrossRef]
  54. Du, Y.; Zhao, Z.; Song, Y.; Zhao, Y.; Su, F.; Gong, T.; Meng, H. Strongsort: Make deepsort great again. IEEE Trans. Multimed. 2023, 1–14. [Google Scholar] [CrossRef]
  55. Gong, S.; Cristani, M.; Loy, C.C.; Hospedales, T.M. The re-identification challenge. In Person Re-Identification; Gong, S., Cristani, M., Yan, S., Loy, C.C., Eds.; Springer: London, UK, 2014; pp. 1–20. [Google Scholar]
  56. Zhang, Y.; Wang, X.; Ye, X.; Zhang, W.; Lu, J.; Tan, X.; Ding, E.; Sun, P.; Wang, J. ByteTrackV2: 2D and 3D Multi-Object Tracking by Associating Every Detection Box. arXiv 2023, arXiv:2303.15334. [Google Scholar]
  57. Zhang, Y.; Sun, P.; Jiang, Y.; Yu, D.; Weng, F.; Yuan, Z.; Luo, P.; Liu, W.; Wang, X. Bytetrack: Multi-object tracking by associating every detection box. In Proceedings of the European Conference on Computer Vision, Tel Aviv, Israel, 24–28 October 2022; pp. 1–21. [Google Scholar]
  58. Veeramani, B.; Raymond, J.W.; Chanda, P. DeepSort: Deep convolutional networks for sorting haploid maize seeds. BMC Bioinform. 2018, 19, 289. [Google Scholar] [CrossRef] [PubMed]
  59. Wojke, N.; Bewley, A.; Paulus, D. Simple online and realtime tracking with a deep association metric. In Proceedings of the 2017 IEEE International Conference on Image Processing (ICIP), Beijing, China, 17–20 September 2017; pp. 3645–3649. [Google Scholar]
  60. Luo, H.; Jiang, W.; Gu, Y.; Liu, F.; Liao, X.; Lai, S.; Gu, J. A strong baseline and batch normalization neck for deep person re-identification. IEEE Trans. Multimed. 2019, 22, 2597–2609. [Google Scholar] [CrossRef]
  61. Lin, T.-Y.; Goyal, P.; Girshick, R.; He, K.; Dollár, P. Focal loss for dense object detection. In Proceedings of the IEEE International Conference on Computer Vision, Venice, Italy, 22–29 October 2017; pp. 2980–2988. [Google Scholar]
  62. Lu, L.; Zhao, C.; Luo, S.; Fu, Y. A Data-Driven Human Activity Classification Method for an Intelligent Hospital Bed. In Proceedings of the 2018 40th Annual International Conference of the IEEE Engineering in Medicine and Biology Society (EMBC), Honolulu, HI, USA, 18–21 July 2018; pp. 4991–4996. [Google Scholar]
Figure 1. Overall structure eNightTrack.
Algorithms 16 00477 g001
Figure 2. Illustrations of 8 screenshots from representative scenarios: (a) Sc01; (b) Sc04; (c) Sc07; (d) Sc10; (e) Sc13; (f) Sc15; (g) Sc18; (h) Sc20.
Algorithms 16 00477 g002
Figure 3. Setup and environment of data collection.
Algorithms 16 00477 g003
Figure 4. Workflow of data preprocessing.
Algorithms 16 00477 g004
Figure 5. Workflow of alarm identification.
Algorithms 16 00477 g005
Figure 6. Scale determination of safe region.
Algorithms 16 00477 g006
Figure 7. Initial state of each scenario, where the red frame here indicates the dynamic safe region and the pink frame indicates the head of user.
Algorithms 16 00477 g007
Figure 8. Illustration of head center out of safe region.
Algorithms 16 00477 g008
Figure 9. Algorithm flowchart of alarm identification.
Algorithms 16 00477 g009
Figure 10. Movement indicator diagram: (a) no movement, so all black in red frame; (b) movement existing.
Algorithms 16 00477 g010
Figure 11. Illustration of four conditions of confusion matrices, where the large red frame indicates the dynamic safe region, the pink frame indicates the head of user, and the small red frames indicate the head of medical personnel: (a) true-positive example; (b) true-negative example; (c) false-positive example; (d) false-negative example.
Algorithms 16 00477 g011
Figure 12. Confusion matrices of alarm algorithm: (a) DeepSORT; (b) ByteTrack.
Algorithms 16 00477 g012
Figure 13. Bed raising scenario without false warning, where the red frame is dynamic safe region.
Algorithms 16 00477 g013
Table 1. Simulated bedtime activity scenario.
ScenarioVideo Clips CountPurpose of SimulationStateCaregivers Appear?
Sc01 115Nurse helping with dressing scenario—nurse puts a safety vest on the patient.Staying In BedYes
Sc0215Exiting bedside scenario—patient removes the safety vest and slips away at the side of bed.Bed ExitingNo
Sc0315Nurse changing sheets scenario—nurse changes bed sheets when the patient is on the bed.Staying In BedYes
Sc0414Exiting at bed end scenario—patient exits bed at the rear end of the bed.Bed ExitingNo
Sc0514Nurse helping adjust position scenario—nurse pulls sheets up to help patient to adjust their sleeping position.Staying In BedYes
Sc0615Kneeling on rear edge of bed scenario—patient kneels on the bed at the rear edge.Bed ExitingNo
Sc0715Adjusting bed level scenario—nurse/patient adjusts the level of the bed from lying to sitting and raises the level of the bed and returns it to the original position.Staying In BedYes
Sc0816Picking up belongings scenario—patient leans over the bed rail to look for personal belongings at the bottom of locker.Bed ExitingNo
Sc0915Nurse helping turn scenario—nurse helps patient to turn and places a pillow for support.Staying In BedYes
Sc1015Pillow mimicking scenario—patient exits bed when a supporting pillow similar to a human shape is still on the bed.Bed ExitingNo
Sc1115Changing position scenario—patient changes from a lying to sitting position.Staying In BedNo
Sc1215Climbing exiting scenario—patient climbs over bed rails and leaves.Bed ExitingNo
Sc1315Pushing table scenario—patient pushes table towards the rear end of bed.Staying In BedNo
Sc1416Leaning scenario—patient climbs over rail and leans their upper body out to pick up items.Bed ExitingNo
Sc1516Drinking scenario—patient searches for personal belongings on top of the locker (only reaching hand out to pick up a cup of water).Staying In BedNo
Sc1616Sliding under the blanket scenario—patient slides under the blanket at the rear end of bed and leaves.Bed ExitingNo
Sc1716Use of urinal scenario—male patient sits near the edge of the bed and uses urinal for voiding.Staying In BedNo
Sc1816Leaning forward scenario—patient leans forward when sitting at the edge of bed.Bed ExitingNo
Sc1917Use of bedpan scenario—patient uses bedpan in bed.Staying In BedYes
Sc2016Sliding scenario—patient slides to the rear end of the bed and leaves without blanket.Bed ExitingNo
1 Sc denotes scenario.
Table 2. The performance of customized YOLOv8.
ClassmAP50
All98.8%
Medical Personnel98.6%
Patient99.0%
Table 3. Five-fold cross-validation results of customized YOLOv8.
mAP50
ClassFold 1Fold 2Fold 3Fold 4Fold 5Mean
All98.2%98.8%97.0%96.8%97.0%97.6%
Medical Personnel97.1%98.4%94.8%97.3%95.5%96.6%
Patient9.91%99.3%99.2%96.3%98.4%98.5%
Table 4. Comparison of MOT methods.
StrongSORTDeepSORTByteTrack
Number of frames losing tracking21,48282058205
Lost-tracking rate23.4%8.9%8.9%
Total count of ID changes155021091697
Table 5. Performance of alarm algorithm based on DeepSORT and ByteTrack.
Sensitivity SpecificityBalanced AccuracyF1
DeepSORT96.8%62.8%79.8%82.8%
ByteTrack96.8%61.4%79.1%82.3%
Disclaimer/Publisher’s Note: The statements, opinions and data contained in all publications are solely those of the individual author(s) and contributor(s) and not of MDPI and/or the editor(s). MDPI and/or the editor(s) disclaim responsibility for any injury to people or property resulting from any ideas, methods, instructions or products referred to in the content.

