Article

Assessing the Impact of Patient Characteristics on Genetic Clinical Pathways: A Regression Approach

1
UK Endorsement Board, London E14 4PU, UK
2
Département des Operations et Systèmes des Décision, Université Laval, Quebec City, QC G1V 0A6, Canada
3
Centre de Recherche du Centre Hospitalière Universitaire de Québec, Axe Santé des Populations et Pratiques Optimales en Santé, Université Laval, Quebec City, QC G1V 0A6, Canada
4
Groupe de Recherche en Écologie Buccale (GREB), Université Laval, Quebec City, QC G1V 0A6, Canada
5
Centre Interuniversitaire de Recherche sur les Réseaux D’entreprise, La Logistique et le Transport (CIRRELT), Université Laval, Québec City, QC G1V 0A6, Canada
6
Department of Economics (DIEC), University of Genoa, 16126 Genoa, Italy
7
Department of Internal Medicine and Medical Specialties (DIMI), University of Genoa, 16132 Genoa, Italy
*
Author to whom correspondence should be addressed.
Algorithms 2024, 17(2), 75; https://doi.org/10.3390/a17020075
Submission received: 30 October 2023 / Revised: 25 January 2024 / Accepted: 28 January 2024 / Published: 7 February 2024
(This article belongs to the Special Issue Artificial Intelligence Algorithms for Healthcare)

Abstract

:
Molecular genetic techniques allow for the diagnosing of hereditary diseases and congenital abnormalities prenatally. A high variability of treatments exists, engendering an inappropriate clinical response, an inefficient use of resources, and the violation of the principle of the equality of treatment for equal needs. The proposed framework is based on modeling clinical pathways that contribute to identifying major causes of variability in treatments justified by the clinical needs’ variability as well as depending on individual characteristics. An electronic data collection method for high-risk pregnant women addressing genetic facilities and laboratories was implemented. The collected data were analyzed retrospectively with two aims. The first is to identify how the whole activity of genetic services can be broken down into different clinical pathways. This was performed by building a flow chart with the help of doctors. The second aim consists of measuring the variability, within and among, the different paths due to individual characteristics. A set of statistical models was developed to determine the impact of the patient characteristics on the clinical pathway and its length. The results show the importance of considering these characteristics together with the clinical information to define the care pathway and the use of resources.

1. Introduction

A prenatal diagnosis includes a set of procedures designed to recognize, or exclude, the presence of fetal congenital abnormalities. The proper application of these diagnostic techniques is primarily intended to provide an accurate result, to provide information about the risks associated with them, especially when we are burdened by a significant degree of specific diseases. The fast development of new molecular genetic techniques has allowed for broadening of the spectrum of hereditary diseases and congenital abnormalities that are diagnosed prenatally. For the same genetic problem or genetic disease, therefore, a high variability of treatment exists, and this causes perhaps not only an inappropriate clinical response but also an inefficient use of resources, together with the violation of the principle of fairness, a fundamental principle of the national health service in Italy, where the system should ensure that there is equality of treatment for equal needs.
In this general context, the specific objective of this study consists of identifying major causes of variability in treating high-risk pregnancies, separating the variability justified by the clinical need from the variability depending on individual characteristics.
The point of view taken in this study is of the patient’s perspective, following the so-called clinical pathways [1,2], as suggested in the Report of the Ministerial Committee of Genetics in the Italian National Health Service [3].
Clinical pathways are a recognized tool to improve the performance and quality of care provided for a well-defined group of patients who journey across the entire continuum of care, from prevention and screening to recovery or palliative care. This approach also guarantees resource optimization from the pathway analysis to arriving at a fair estimation of the quantity of the necessary resources [4].
Modeling clinical pathways had wide applications within the last two decades [5,6,7,8]. The increase in data availability and technology performance in big data analyses provided a new opportunity to analyze and monitor the clinical pathways through the computerization of many activities and the easiest collection of clinical and hospital data [9]. The use of pathways is focused only on clinical data, as the main information needed is provided by the disease. However, as it is used in socioeconomic analyses, it is useful to provide a holistic approach that is able to capture not only clinical information but also other characteristics such as health deprivation, education, and more.
As reported in [10], the effectiveness of pathways analysis is heavily dependent on individual characteristics and the conditions under which the pathways are implemented, which should be based on evidence. The factors affecting pathways to care for children and adolescents with complex vascular malformations were identified in [11]. The authors provided a qualitative study that identified them such as individual characteristics, health care systems, clinical characteristics, social support networks, and scientific progress.
It is important to implement an adaptive approach for modeling clinical pathways for the high variability of patient trajectories and their individual characteristics [12]. Through the adoption of techniques and tools such as data and process mining, graphs, and nets, patterns of the clinical pathways can predict the trajectories of new patients [8,9]. In the international literature, some studies propose regression analyses for CP and non-CP diagnoses, respectively, to detect annual utilization and cost changes, controlling for any individual characteristics. The most basic approach consists of assuming a Poisson process to describe the probability of observing inpatient stay, conditional on explanatory variables such as age, gender, job status, and year [13].
In [14], the authors analyzed changes in the utilization and costs for the conditions entering clinical pathways from 2010 to 2012, using various regression analyses, controlling for individual factors, to model the patterns in year-to-year changes regarding the length of stay and medical costs for clinical-pathway and non-clinical-pathway patients, respectively. A recent study focused on the identification and exploration of the hospital admission risk factors associated with the hospital length of stay by applying a relatively novel statistical method for counting data using predictors among COVID-19 patients, controlling for unobserved individual characteristics in the regression models [15].
To our knowledge, and through looking into the international literature, in the genetic services there are no studies that explore the patient individual characteristics that might affect the presence of a specific diagnostic pathway and the overall pathway length.
From an economic point of view, moreover, the pathway analysis is the first step towards a correct valorization of the resources used for this type of service [16]. At present, most of the activities are reimbursed simply by paying for productive inputs (personnel, goods, materials), or at a rate within the framework of specialist services that are very compartmentalized in the current tariff, without any consideration of the appropriateness of the path followed by the patient, whether the patient receives the appropriate mix of services, and the final result or outcome. Reasoning according to clinical pathways would make it possible to overcome these issues to arrive at a comprehensive pathway remuneration model that takes into account both clinical severity and care complexity.
The structure of this manuscript is as follows: In Section 2, we report the materials and methods, according to the problem addressed together with the modeling definition; in Section 3, we present the results in terms of data characteristics, identification of paths and their modeling using flow charts, and the analysis of the determinants of path variability, the regression models developed and the information obtained using the statistical models. In Section 4, we report the discussions on the results of the regression model information and the conclusion of the study.

2. Materials and Methods

The analysis is retrospective and refers to data collected in the period January–December 2011 at three clinical genetics and laboratory operating units (located in Bologna, Ferrara, and Imola) of the Emilia Romagna Region in Italy. The criteria for enrolling patients and for choosing the relevant data to identify the complexity of care were defined in collaboration with the staff of the operating units involved in the project. The first part of the research resulted in the development of a patient-centered dedicated database.
Then, the individual pathways were analyzed for homogeneous groups of admission types, resulting in corresponding decision trees complete with the details of the relevant path with the collaboration of the operating unit staff. The variability between and within each pathway was identified by employing a set of process indicators (path length, tests, and outcomes).
The last part of the research used statistical modeling techniques to identify the relevance of individual characteristics in determining differences in the length of each specific pathway, which was assumed to be a proxy for care complexity and, ultimately, also for the cost of treatment and allocation to different pathways. We go into the details of each part below.

2.1. Data Collection

This part of the research was carried out in three phases. Initially, the methods and contents of the data collection tools were defined, i.e., using ad hoc forms to collect data useful for modeling the clinical pathways and their evaluation. In the second phase, data were collected in the period from January to December 2011, and, in the third phase, the data collected were reprocessed to obtain data records providing, for each patient, all the information of interest relating to the pathway followed (medical history, reasons for admission, dates of visits, examinations performed, outcomes, risk, indication of prenatal diagnoses, and so on).
The data thus structured have led to the creation of a database that creates complete information centered on the patient, capable of reconstructing the overall pathway, from patient arrival to exit diagnosis. The work was particularly complex because we started from a situation in which there was no data sharing between the laboratory and the clinical facility until we were able to follow the patient’s entire treatment course.

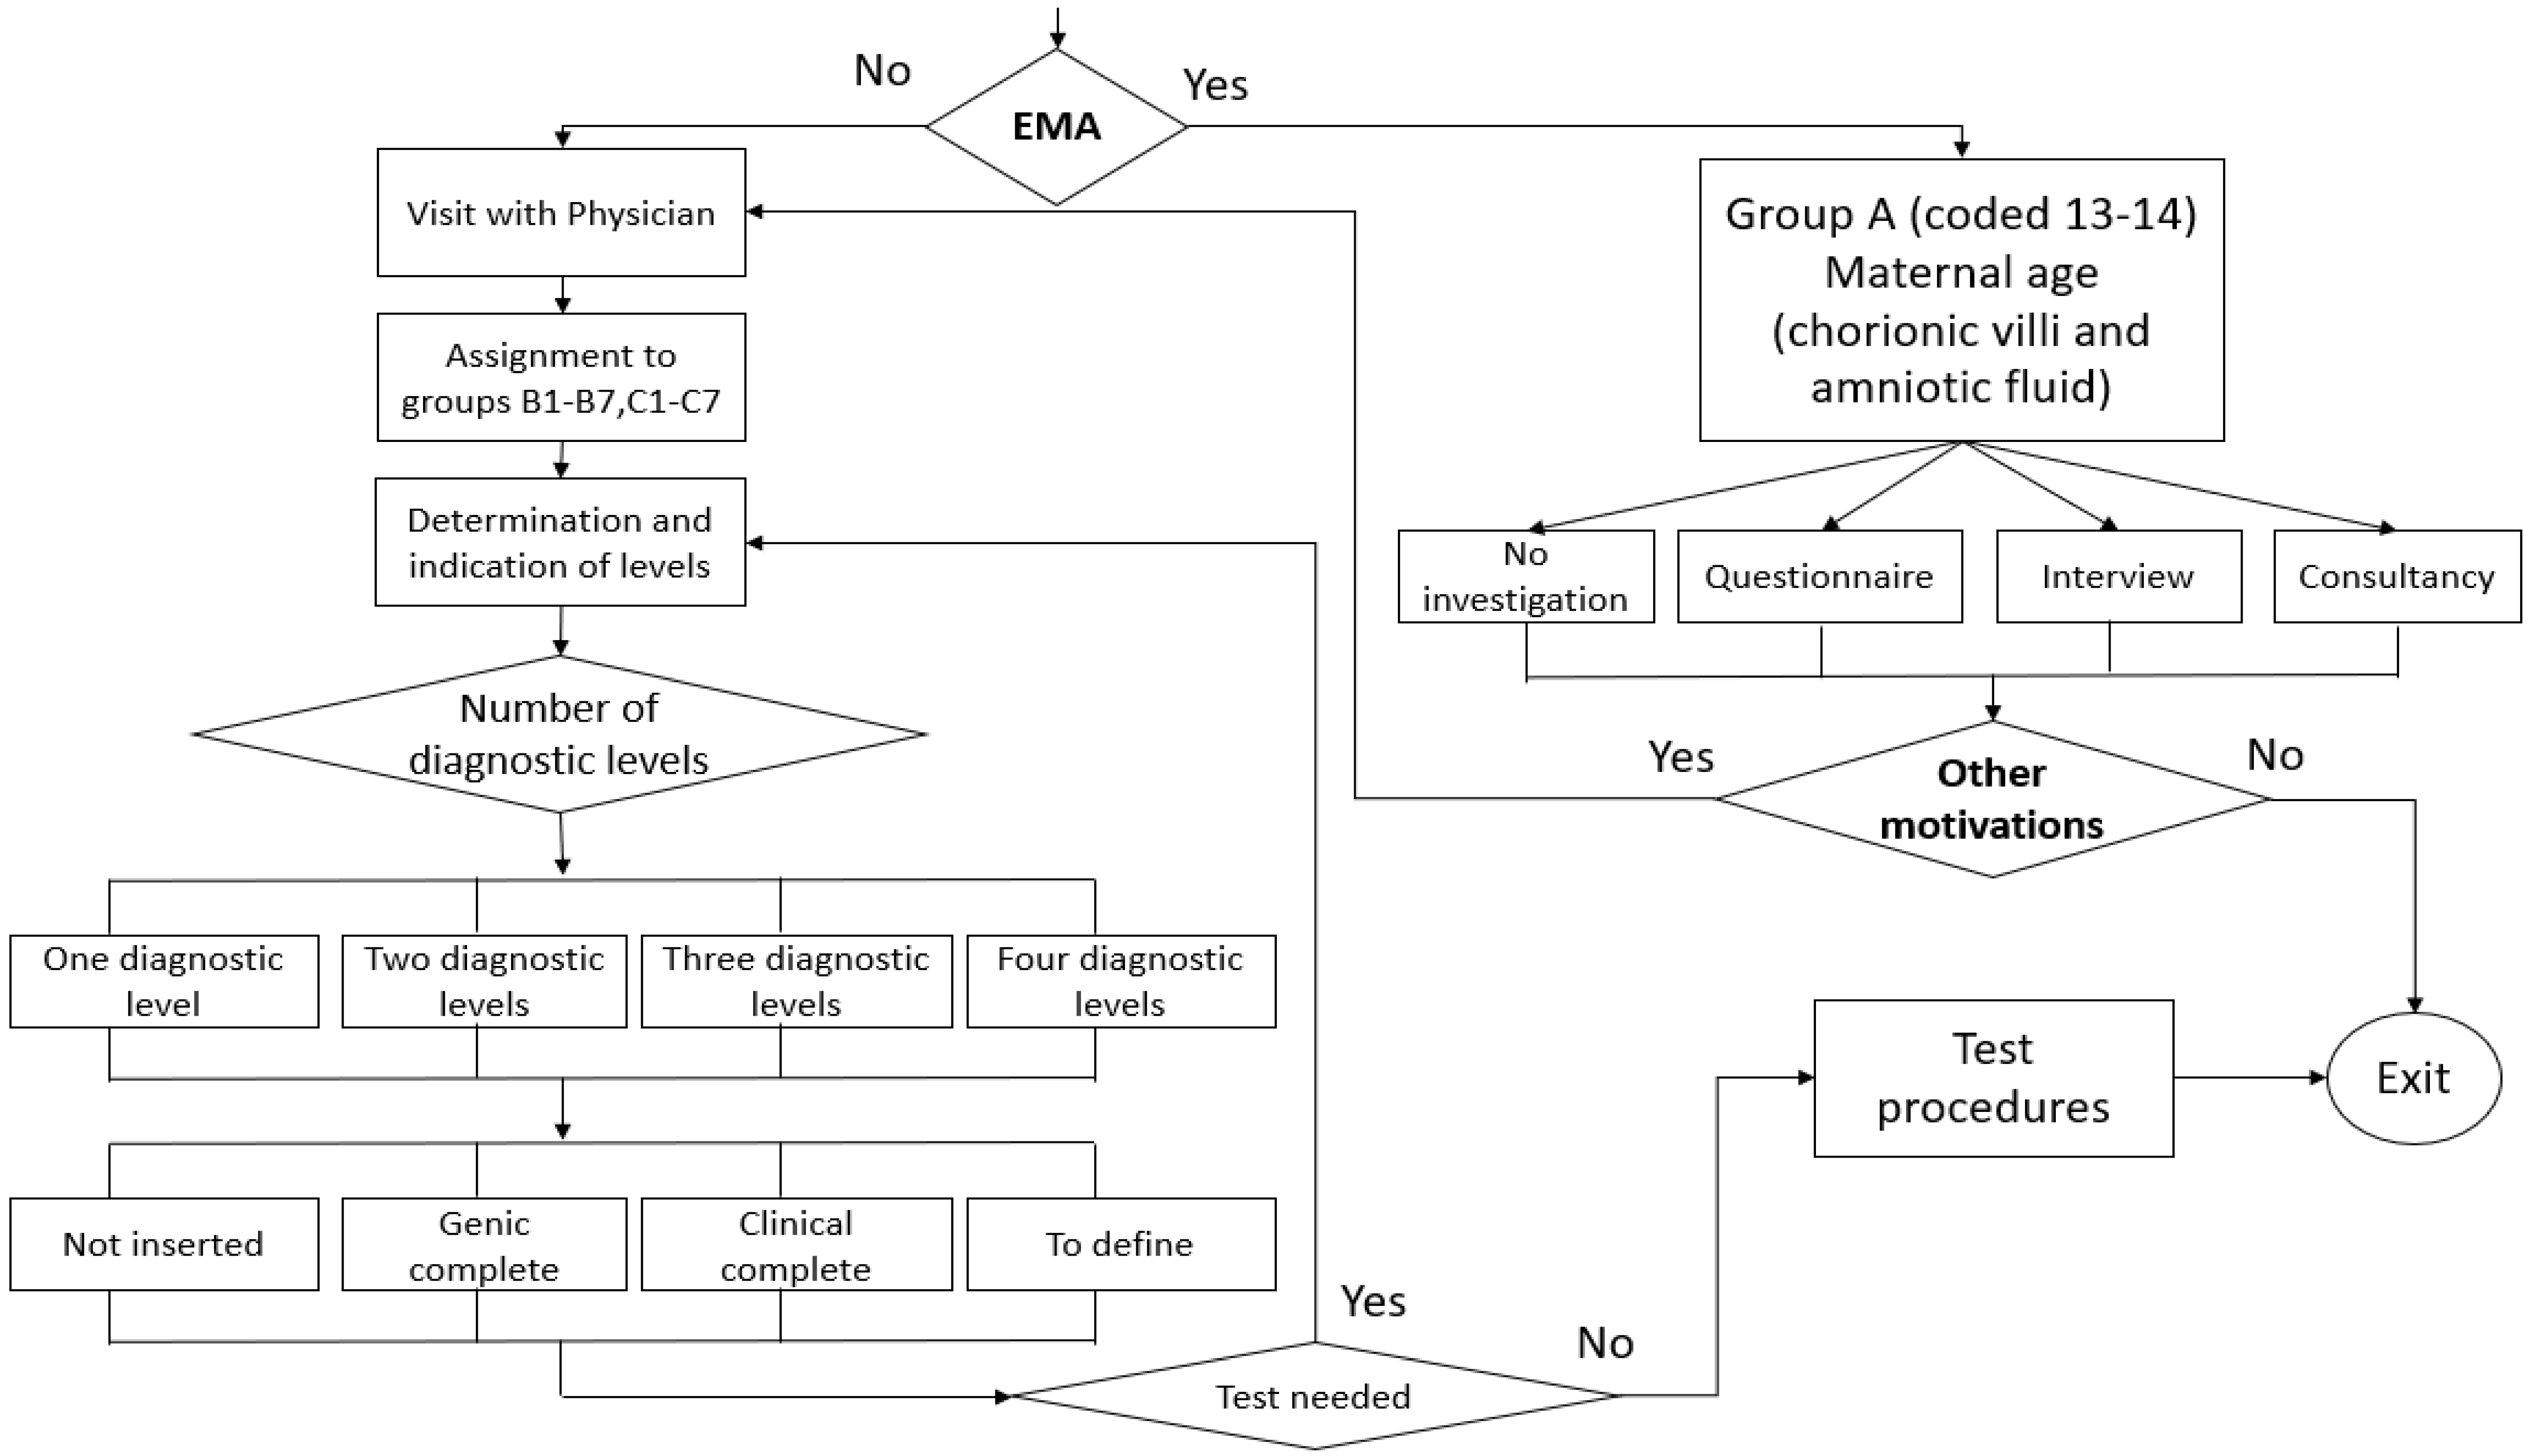
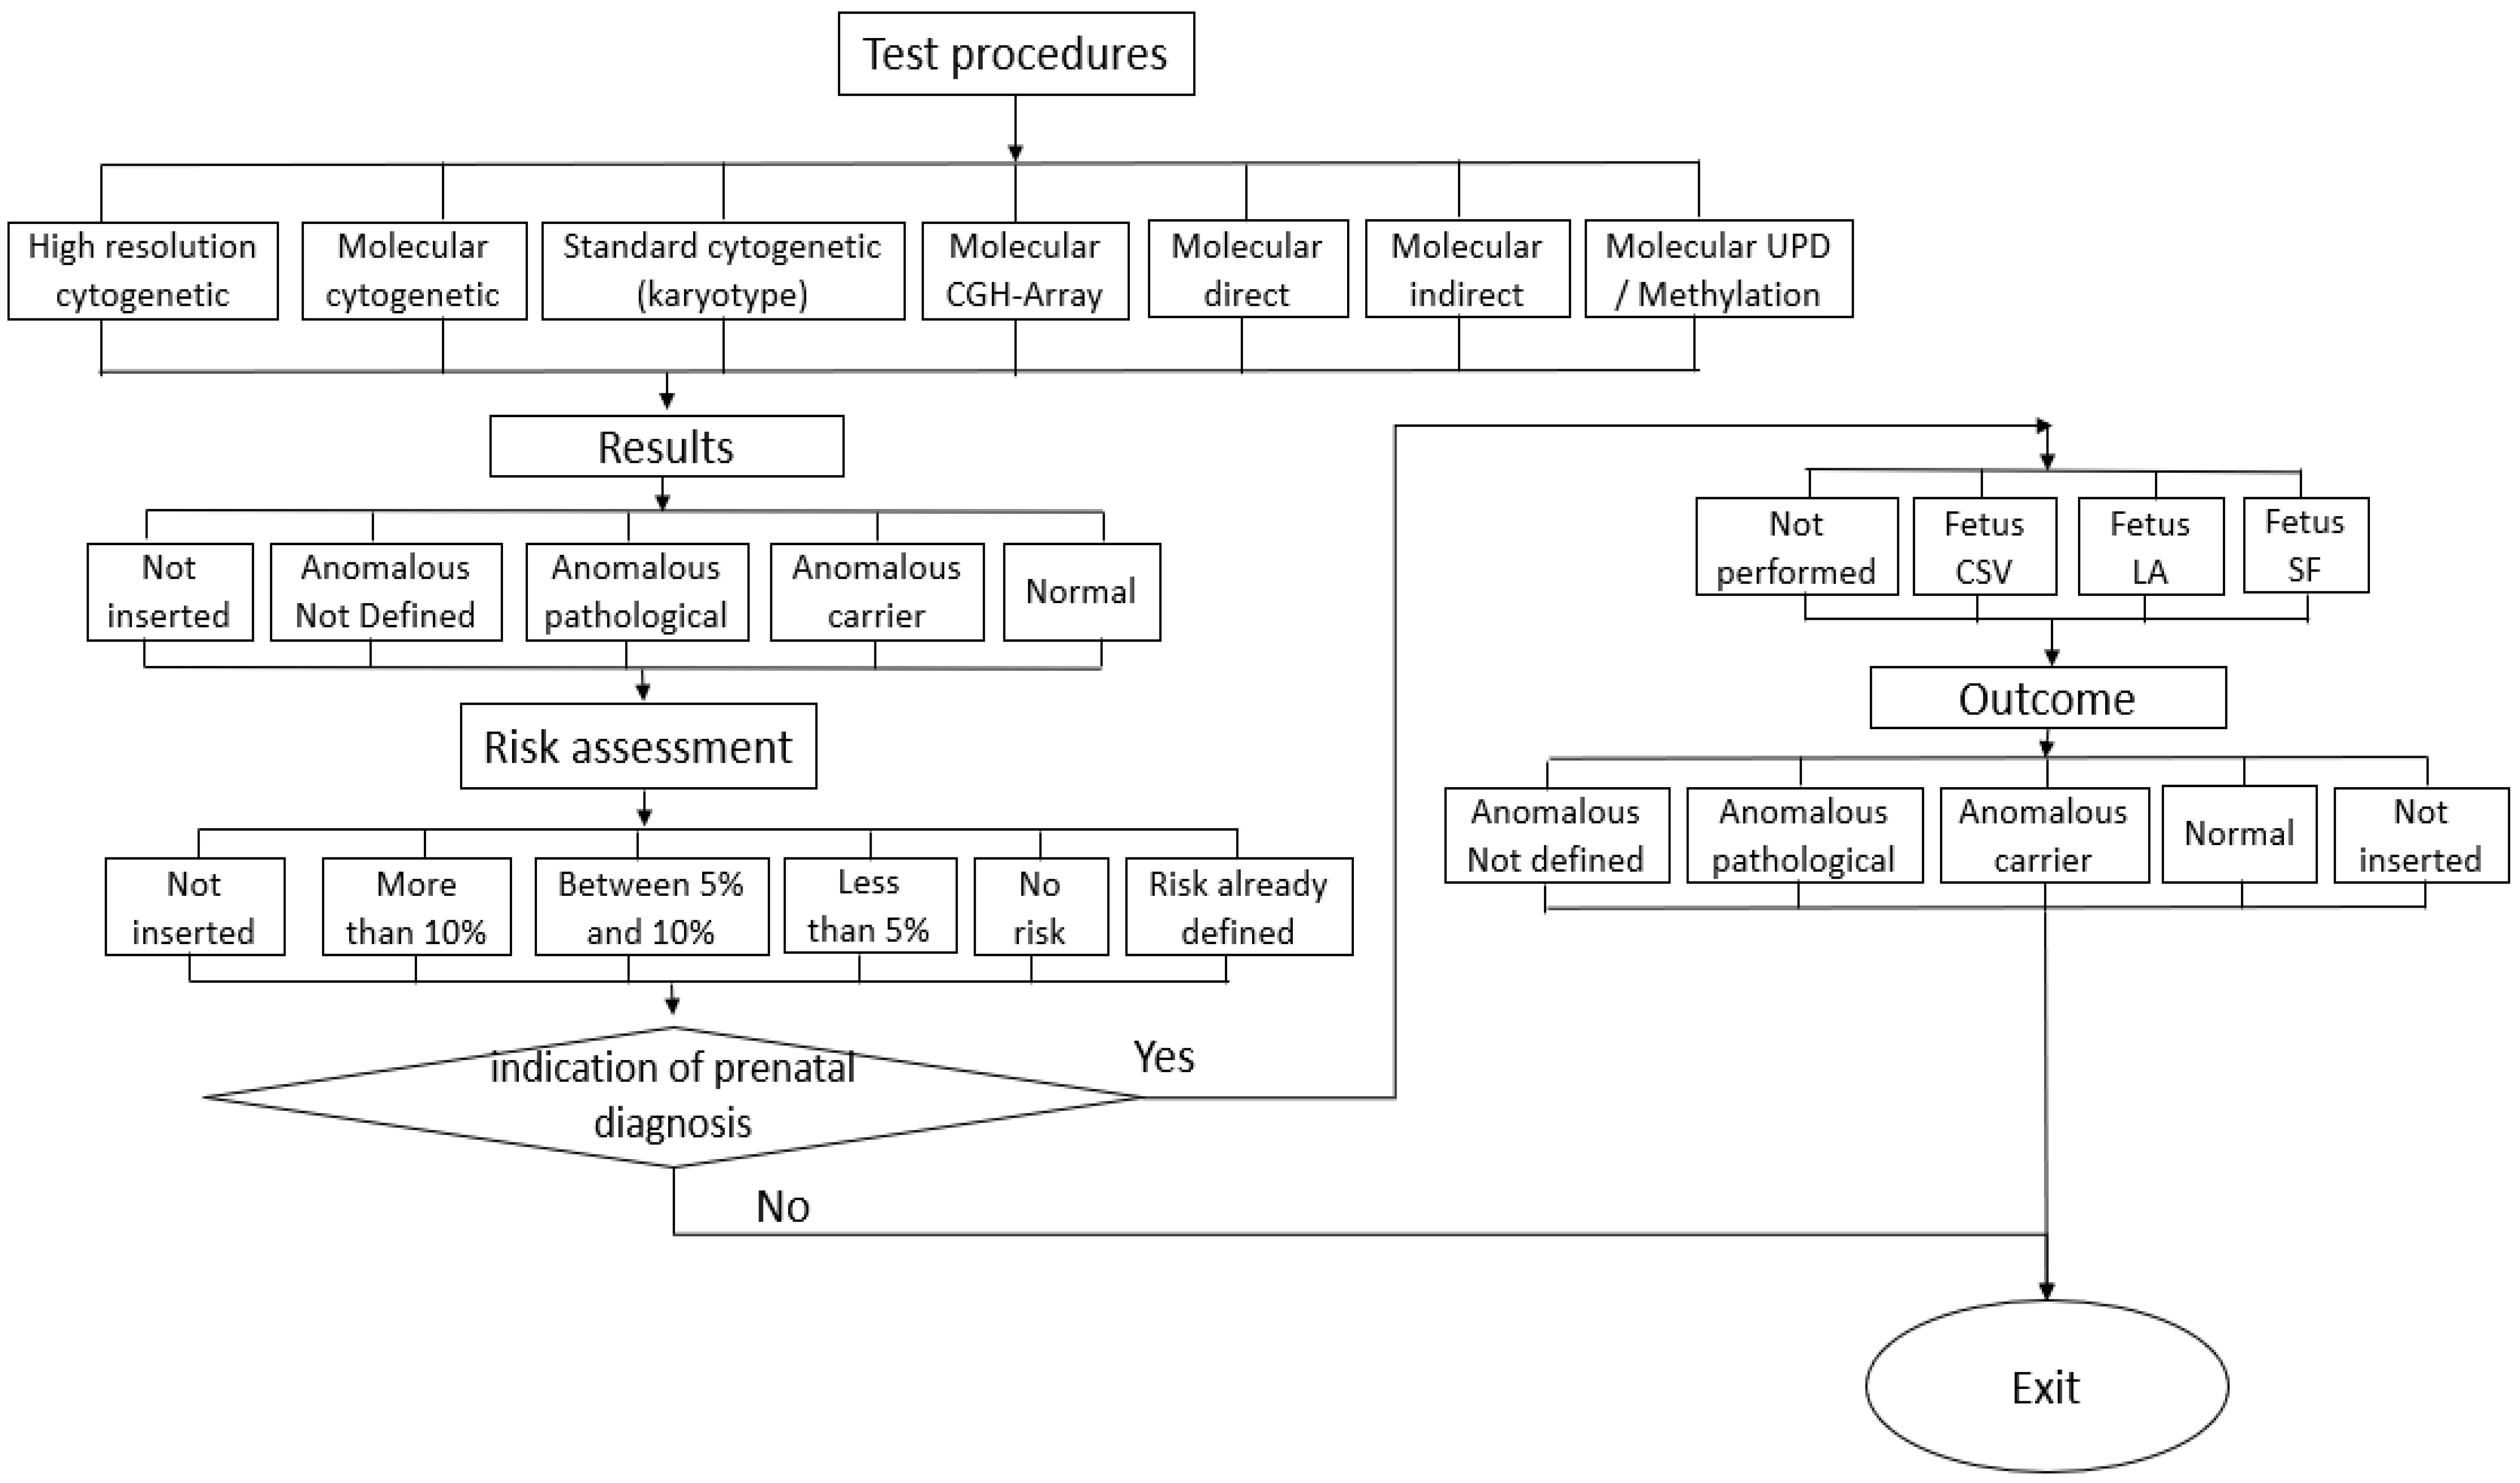
2.2. Pathways Identification

The data collected enabled the identification of homogeneous groups of patients using clinical pathways. The basic criterion for identifying the pathway was, at the suggestion of the medical doctors and the operating unit staff, the motivation for the admission, i.e., whether the patient came to the genetics hospital center because the patient was older (more than 35 years old), or because there were already high-risk pregnancies in the family, or because the mother was exposed to risk factors during the beginning of the pregnancy. Since the same patient could also present multiple motivations, it was necessary to identify, with the help of the medical doctors, the most relevant motivation for the pathway, and several motivations that provided indications of similar clinical pathways were then aggregated.
Once the clinical pathways had been identified which, on a theoretical level, based on the motivation (or motivations) made it possible to determine what the services to be provided should be, an attempt was made to choose, using the historical data from the database, which indicators could best describe what the pathways followed by the patients were. In the case of clinical pathways, it is considered that the patient’s perspective (outcome indicators) and the internal organizational perspective of the operating unit (process indicators) should be taken into account above all [16].
The outcome indicators are those linked directly to the final or intermediate result of the management of the patient through the pathway. Process indicators are linked to the services provided, activities, and roles and, above all, to the time needed to complete the pathway. It is evident that each pathway is assigned to patients who are similar in terms of relevant clinical characteristics (in our case defined by the motivation) but not perfectly homogeneous. To highlight this circumstance, descriptors and indicators are presented in the following tables to highlight the specific characteristics of the patients assigned to the different pathways (e.g., in terms of age and previous pregnancies), but also differences concerning the types of examinations performed and the time taken to complete the entire diagnostic course. Descriptors and indicators were calculated separately for both Italian and foreign patients because different nationalities proved to be an important factor in determining diversity in clinical pathways.
The pathways thus identified were then, again with the help of the operating unit medical doctors, translated into flow charts to better visualize the actual clinical pathway followed by the different patient flows between the different phases from the time of admission to the final diagnosis [17]. The proposed modeling, based on flow charts, made it possible to summarize the activity of the structures and to study the dynamics and variability of the different paths followed by women with risky pregnancies within the Regional Health Service. It was also possible to quantify the numerical flows of patients passing through the different decision-making nodes. This tool highlights in detail the diagnostic choices made in current practice for the patients in the sample, to verify their clinical appropriateness, even if it is outside the scope of this research study.

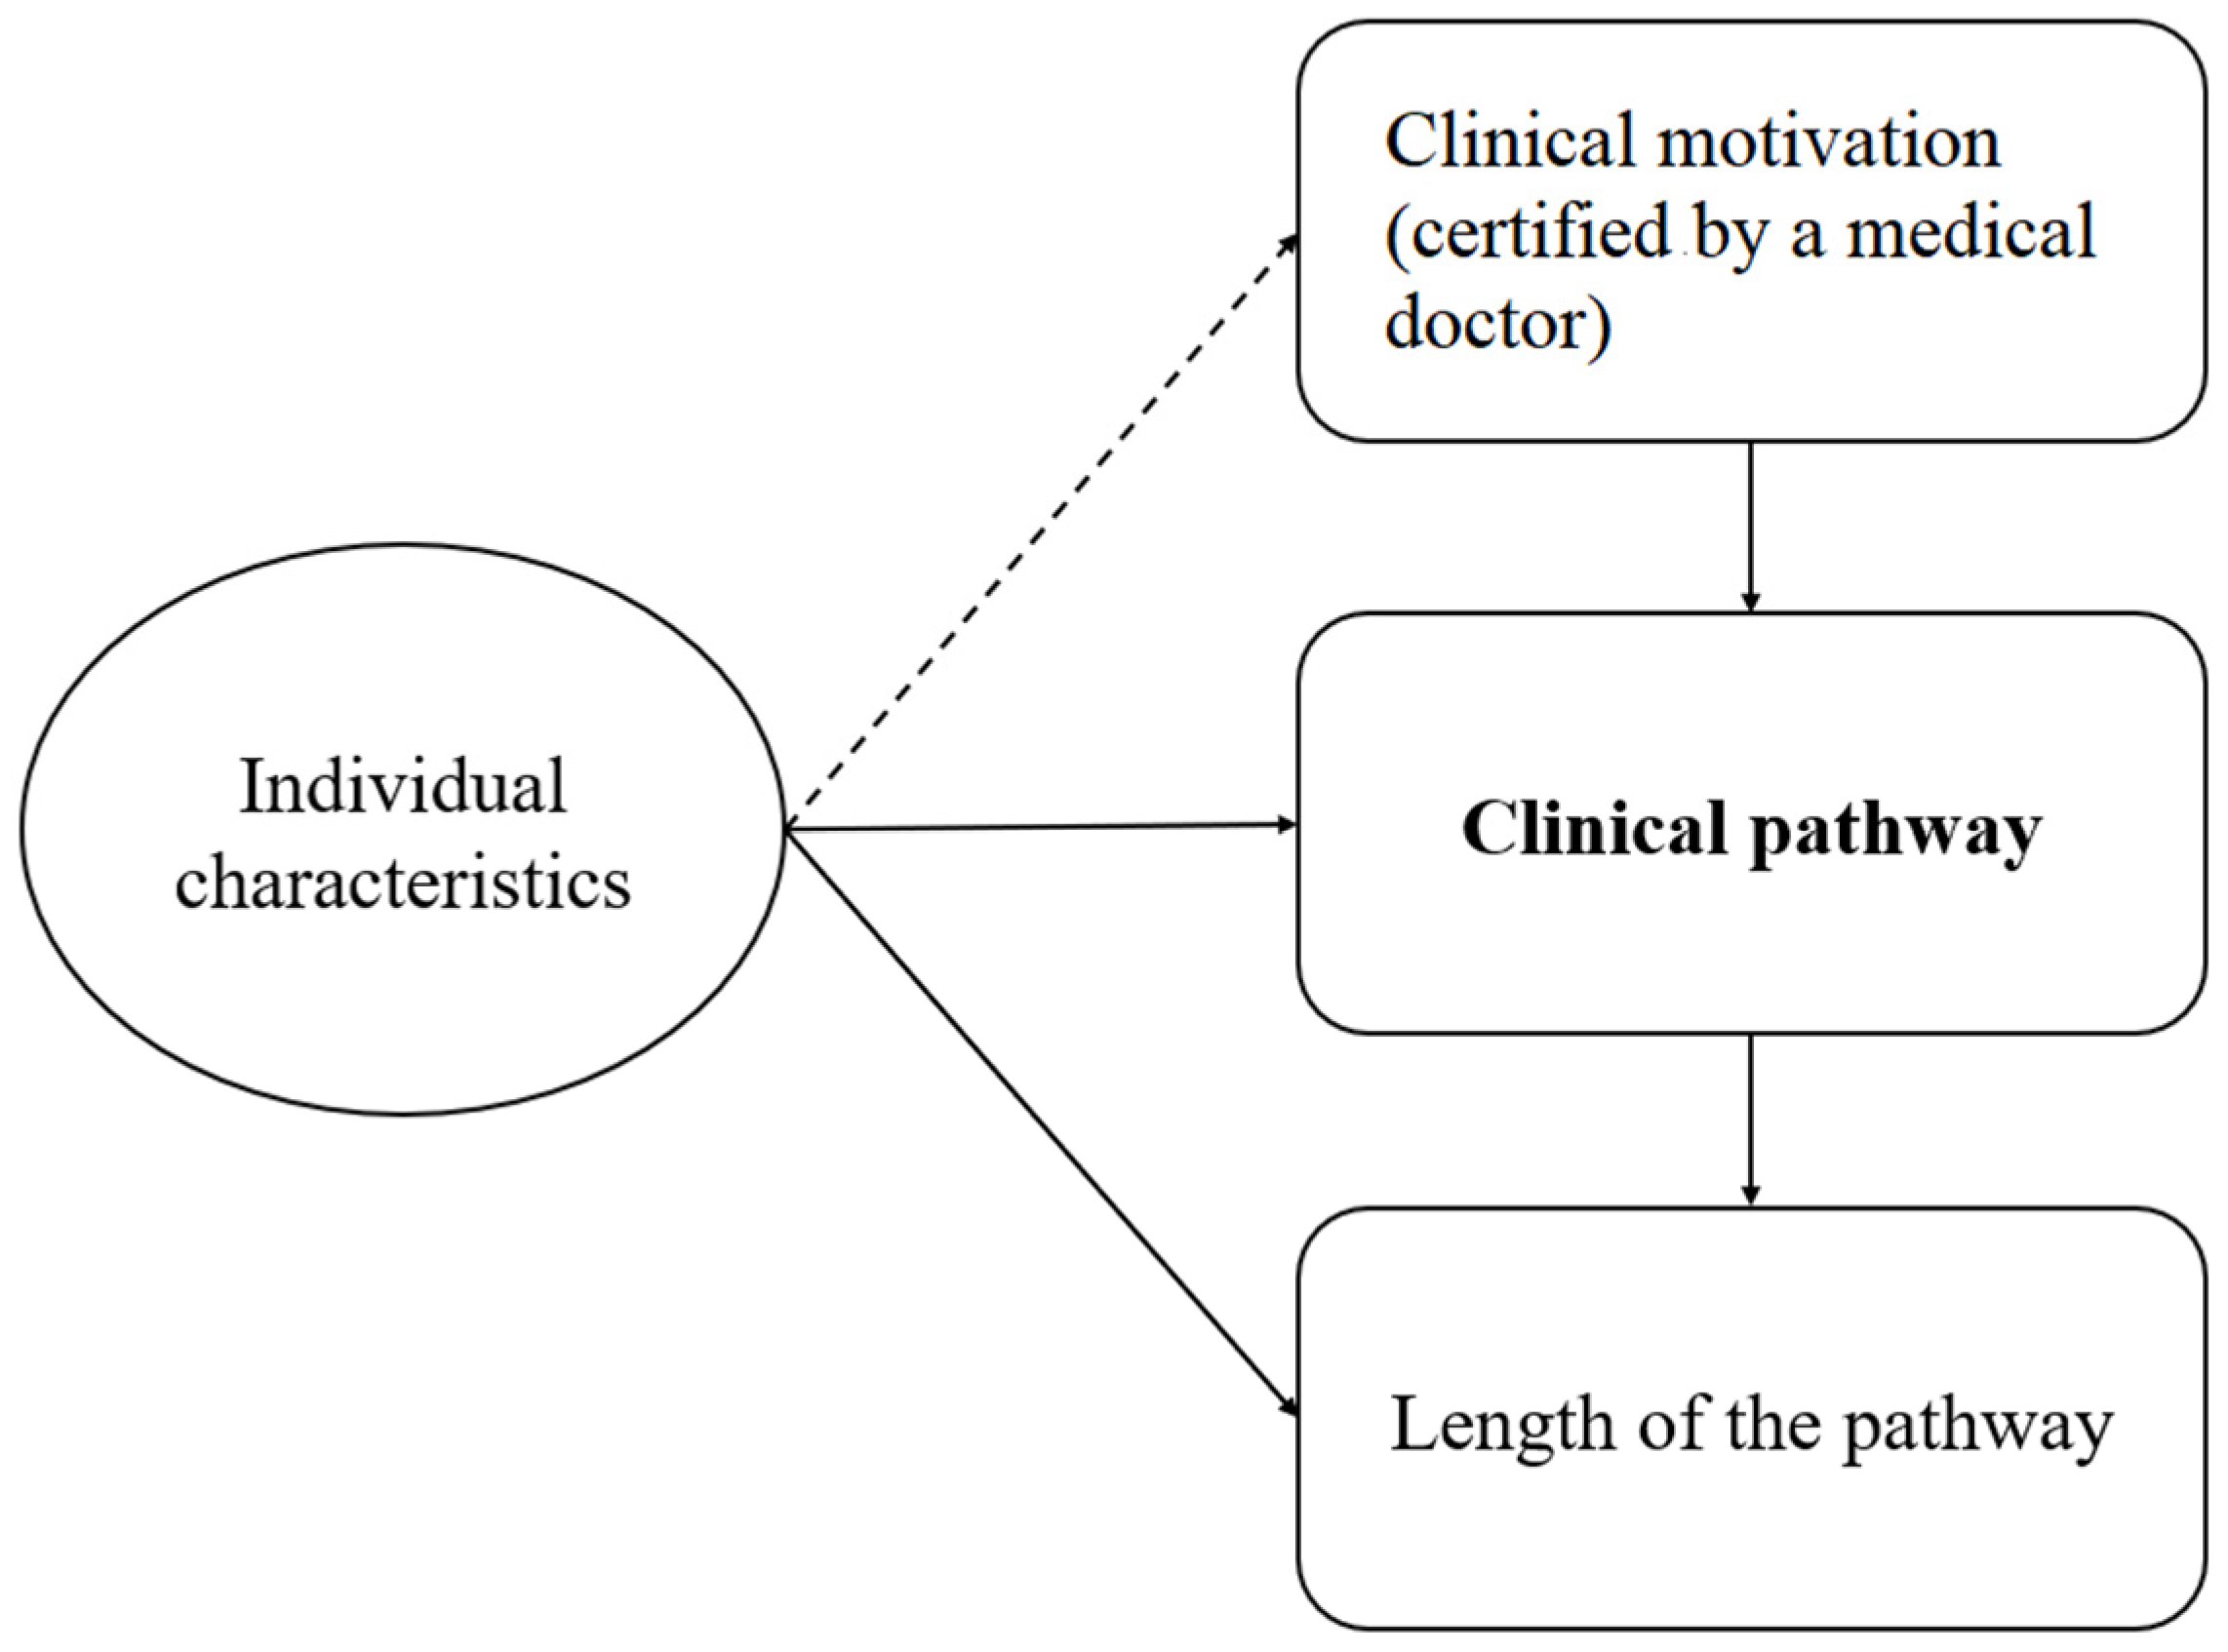
2.3. Analysis of the Determinants of Variability between and within Pathways

The creation of homogeneous groups of cases and the modelling of their diagnostic process within the facilities explains much of the variability in treatment, but there is still residual variability both in the allocation to individual clinical pathways, but also within the same pathway. In reality, the cases are homogeneous but not entirely identical both in terms of clinical motivation and also because of different individual characteristics exogenous to their motivation (e.g., the number of weeks of pregnancy at the first visit or a different nationality).
This means that with the same motivation for admission, some patients receive a diagnosis in a shorter time while others need additional investigations. This variability generates a different care complexity which, for the same clinical severity, implies a greater use of resources and more time spent within the pathway, i.e., overall a higher cost and a late diagnosis for the patient. The hypothesis assumed here, described using the conceptual model presented in Figure 1, is that the care complexity, quantified by the length of the clinical pathway, derives not only from clinical reasons, certified by the physician at the time of referral but also from individual characteristics that influence also the motivation (diagnostic question) leading the physicians to the start of the clinical tests and genetic investigation (dotted line).
It should be noted that the cost of the clinical pathway would have been a better indicator of the complexity of care because it would have made it possible to incorporate the monetary value of all the resources used. The available data, however, do not allow us to quantify these costs. The only possibility would be to dispense with an estimate of the actual production costs, resorting to the tariffs recognized by the national list for the individual services constituting a pathway. This way of proceeding, however, did not seem correct because at present the tariff list does not seem to reflect the production cost and, in particular, underestimates the resources, sometimes quite substantially, used for counseling activities. For this reason, it was preferred to conduct the analysis by considering only the length of the pathway as the dependent variable for the cost. To identify the determinants of variability between paths and within the same path, it was decided to carry out two types of analyses, and, consequently, two different regression techniques were chosen: Logit and Poisson maximum likelihood [18,19,20,21].
The first analysis aimed to study the variability in the allocation of patients to clinical pathways, conditioned for the individual characteristics of the patients. In this case, the dependent variable is a binary variable, equal to one if the patient is assigned to a certain pathway, and equal to zero otherwise. The estimate provides the probability of being in a specific clinical pathway, given a set of individual characteristics. The technique used to answer the first question is the logistic or Logit regression. This technique allows us to find for each independent variable or predictor the corresponding marginal effect, i.e., the probability that a given outcome (in our case the assignment to a specific pathway) occurs or does not occur when one of the independent variables varies.
The second analysis, on the other hand, aims to assess whether the length of the clinical pathway is correlated with individual characteristics. In this case, the dependent variable, the pathway length, is a continuous quantitative variable, and, therefore, it is possible to use the maximum likelihood estimate that assumes a Poisson distribution of the residuals, the pseudo-Poisson maximum likelihood (PPML). This technique considers the probability distribution of the dependent variable. The results obtained are then compared with a simple ordinary least square (OLS) estimate, for which a specification test is subsequently performed.
For the choice of regressors, i.e., the individual characteristics determining variability, a descriptive analysis was carried out on the available data, considering that these characteristics are expressed both with quantitative variables (e.g., number of previous pregnancies, age) and with qualitative variables (e.g., Italian or foreign).

3. Results

The large amount of data collected (all information on 2119 patients from January to December 2011) was entered into a dedicated database, which served as the basis for our processing.

3.1. Identification of Clinical Pathways

In Table 1, we report the main motivations, i.e., the diagnostic questions, reported by the clinicians at the time of referral. The list includes pathologies (e.g., genetic, cytogenetic, chromosomal) and exposures (e.g., radiation, drugs, infection) that might impact the health of the fetus.
The first step for the modeling was to assign each patient to a motivation, i.e., the diagnostic question, because, according to Evidence-Based Medicine (EBM) guidelines, assignment to a specific diagnostic treatment protocol should depend on this [22,23].
In Table 2, the number of motivations recorded for the 2119 patients is reported. We observe that the majority of patients (1866) present only one motivation, but a substantial number (253) present two or more entry motivations. It is evident that in the case of patients with only one motivation, the allocation of patients to the specific protocol was completed automatically by the information in the database. For the others, with double motivation or multiple motivations, the association to the pathway was made with the support of the medical doctors of the operating units involved.
As a result, it was possible to agree on some general allocation rules (Table 3). This was, however, only possible for 210 patients. The other 43 were considered to be special cases and had to be assigned one by one.
Subsequently, considering the diagnostic–therapeutic protocols prescribed by medical practice for different cases, again on the recommendation of the medical doctors, it was possible to aggregate the different groups of motivations, thus arriving at the definition of 16 clinical pathways that identify homogeneous groups of patients in terms of the type of services to be provided (Table 4).
The most consistent flows are those corresponding to Motivations 13 and 14, referred to overall as type-A pathways, corresponding to the Maternal Age (EMA) motivation. Type-B pathways are those corresponding to single or multiple motivations identified using rules (the 210 cases reported in Table 3), and type C refers to the 43 individually assigned patients.

3.2. Main Descriptors and Indicators by Clinical Pathway and Nationality

The amount of information contained in the database made it possible to extract many descriptors and indicators to quantify the characteristics of the diagnostic process carried out and the corresponding outcomes, i.e., to consider both the point of view of the facility and that of the patients. The main ones are indicated below.
Table 5 and Table 6 show the distribution by clinical pathway of patients in the three facilities and by age, respectively. Given the low number of patients in the type-C clinical pathways, the data from these pathways were considered together. For each clinical pathway, a further distinction was made between Italian (I) and foreign (F) patients. The last two rows of Table 5 show the percentages, respectively, of the total sample, and of the composition, within each pathway, of Italian women and those of a foreign nationality. This subdivision appeared necessary because foreign women now have a rather relevant consistency within some pathways. In B1, they make up more than a third, but about a fifth are also in B3 and B6, and, even in the two A pathways referring to maternal age, they reach a rather high percentage close to 10%.
The categories with the highest frequency of cases are, in addition to those related to maternal age (A1 and A2), genetic disorders in families with consanguinity (B1), ultrasound, cytogenetic or fetal screening disorders (B5), and finally the category of maternal environmental, drug, radiation, and infection exposures (B6).
Table 7 shows, for each pathway, the anamnestic data referring to previous pregnancies. In this case, the total per line does not correspond to the total of the sample because the same patient may also have had more than one previous pregnancy. In the Table, moreover, data on the absence of previous pregnancies are not reported.
From Table 7 it can be seen, for each previous pregnancy and for each clinical pathway, which is the main cause of recourse to genetic services and how the number of foreign patients (reported as F in Table 7) is quite similar to those of Italian patients (reported as I in Table 7). The greatest recourse to clinical genetic pathways occurs when the patient has had a previous pregnancy that was generally carried to term. Another important reason for resorting to requesting a clinical genetic pathway occurs when there has been a previous miscarriage: the patient likely wants to investigate whether there may be genetic complications that could generate miscarriages, or even in the case of voluntary pregnancy interruption (VPI), as it is possible that on discovering certain genetically inherited pathologies the patient has decided to terminate the pregnancy.
While the previous tables reported data and indicators referring to the characteristics of the demand expressed by the patients, the following Table 8 and Table 9, instead, report some process indicators, i.e., the services provided to the patients. With reference to the type of genetic test carried out by the patients in Table 8 and Table 9, the distributions of the patients within the different pathways are highlighted. In this case, pathway A (maternal age) does not appear because it does not provide this type of service. Table 8 reports the examination with a fetus, and Table 9 reports the examinations without a fetus. The examinations performed ‘with the fetus’ are the genetic examinations completed directly on the fetus, and they lead to a more accurate investigation when previous investigations performed on the mother’s or relatives’ genes (without the fetus) did not provide clear information to proceed to a diagnosis. Chromosomal investigation on the fetus is often performed at the end of the course because it can be a risk factor for the development of the fetus and the progress of the pregnancy.
Table 10 and Table 11 below present the results of the examinations carried out: it can be seen that about 50 percent provide a positive result (with high percentages of abnormal carrier and other abnormalities), so it can be assumed that they are appropriate, i.e., that there was a well-founded reason for further genetic investigation.
From the above tables, it is clear that the patients included in the different pathways are different from each other in terms of demographic characteristics, previous pregnancy conditions, use of private services, etc. In addition, within the same pathway, there is a difference between Italian and foreign patients. Although the distribution of the patients is rather heterogeneous, it is evident that there was fairness of treatment, as the difference in nationality (depending on the clinical pathway) does not cause significant variations between patients.
Finally, it should be noted that many other indicators could be defined and calculated from the above data. In particular, all those that refer to the fact that genetic services are not only provided to patients but often tests must also be carried out on relatives to highlight any familiarity following the guidelines’ indications, which may also be of interest. The availability of the data collected in the database allows us to obtain a lot of information; this shows how a patient-centered data collection, which allows us to follow the patient throughout the entire pathway, constitutes the added value of being able to ask questions about the treatment ‘process’, thus identifying both its effectiveness and the effective use of resources.

3.3. The Definition of Clinical Pathways

In this section, we consider the process perspective, adhering to the clinical pathway approach, which can be defined as “… a multidisciplinary structured care plan, containing the sequence and timing of activities to be performed on a given patient affected by a given pathology, based on technical and scientific knowledge and the organizational, professional and technological available resources” [24,25,26]. With the available data, an attempt was made to identify the flows of patients belonging to the 16 identified pathways through the various stages of their journey to exiting. Although the pathway under consideration is relatively simple since it consists of a set of activities aimed at obtaining a diagnosis, the decision-making process is by no means simple, and the description of the flows is particularly complex. It is a matter of defining the several sequential phases into a flow chart with the corresponding decision nodes and the characteristics that cause a patient to be directed towards one pathway rather than another. The perspective is that of the overall health service (clinical genetics and laboratory services).
Figure 2 shows the first part of the flow chart describing the sample flows of the 2119 patients analyzed. The first distinction is between patients who accessed the facility due to their age (type A pathways) and all others (who are collectively referred to as ‘Not-EMA’). The connecting lines and arrows indicate the sequence of activities and the logical and precedence links between them. The rectangles correspond to activities such as visits, administering a questionnaire, writing a report, and so on. It is evident that each of these activities then consists of a set of activities also carried out by different persons, requiring execution time, resources, and overall resources. In this study, this aspect was not evaluated, but the construction of such a flow chart would immediately allow, if the data are available, the association to each rectangle of a cost of the activity required and as such the monetary value of all the resources or inputs necessary. The structures investigated were not able to provide this data and further analyses would have to be carried out using a micro-costing logic, based, for example, on the so-called activity-based costing methodology [27,28].
As is well known, in flow chart symbology, the rhombuses correspond to decision nodes. These are particularly interesting moments from a clinical point of view, where recommendations for good medical practice should be implemented. They may also correspond to organizational choices. Each node corresponds to a question and thus a breakdown of the patient flow can be obtained. For 1266 patients out of 1415 who came into contact with clinical genetics services with EMA entry motivation, the pathway ends and they exit the process. The elapsed time in this case is very short because entry and case closure usually take place within the same day. For 149 patients, however, the pathway continues and this group joins the group of the other 704 patients who had other reasons for entry and are admitted directly to the other diagnostic steps.
Following the first visit, a ‘diagnostic level’ is defined for each patient, which makes explicit the type of investigation to be carried out. Note that these diagnostic levels must in some cases also be extended to other family members (hence the possibility of having multiple diagnostic levels). For each diagnostic level, three types of response are possible, in addition to the field not entered: complete gene, complete clinical, and to be defined, which correspond to the level at which the case is framed and, consequently, the type of investigation required to reach a diagnosis/outcome. This phase ends with a decision node to which the question “examinations?” corresponds. In Figure 3, we start from this very question to illustrate how the process continues.
After the details of the examinations are performed, which may be more than one for each patient, and the resulting outcomes are recorded (Anomalous ND, Anomalous, Carrier, and Normal), we can find the classification of the risk level of the case. This is followed by the possible results for prenatal diagnoses, which in the case of the sample of 853 patients is recommended for 257 patients. The last branch of the flow chart indicates the patients who underwent prenatal diagnoses and the resulting outcomes.
The flow chart created is already an important result because it allows us to enter a process-management perspective. From such a representation, and knowing the resource data, it might be possible to start examining the operational structures involved. The next question one should ask oneself at this point is whether the operational support structure is efficient, i.e., whether from an organizational point of view these flows are not subject to bottlenecks, there are no dead times between successive phases, the right person is always available for a certain activity (e.g., consulting), and so on. From a methodological point of view, this means that Business Process Modelling tools (together with the supporting extensions) [29,30,31,32] should be applied, and then, subsequently, simulation models are able to assess whether all process indicators are satisfactory and, if not, they can identify improvement scenarios [5].

3.4. Analysis of Variability between and within Pathways

This section aims to show some descriptive statistics and preliminary analyses concerning both the regressors and dependent variables of our statistical models and to present the results of the statistical analysis carried out.

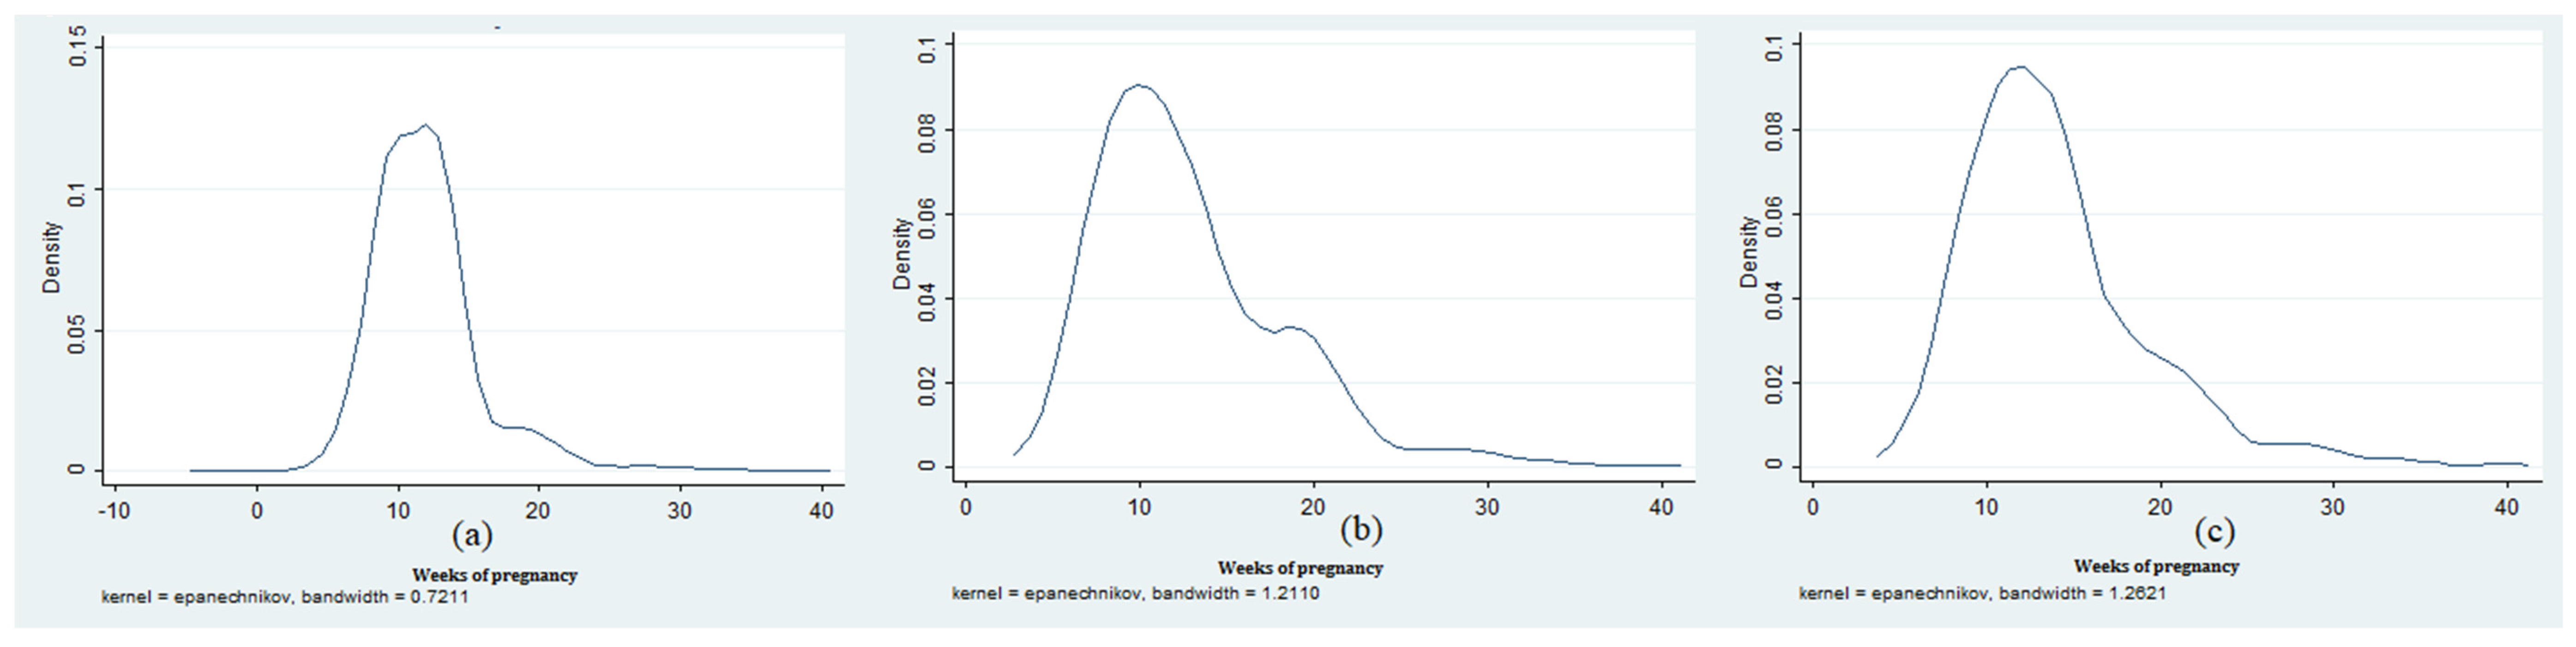
Descriptive Statistics

Among the variables in the database that could affect the pathways, the length of the clinical pathway is considered a proxy for the complexity of care and the costliness of the clinical pathway; the variables chosen as possible regressors are maternal age, week of pregnancy (at the time of first admission to the facility), live births (from previous pregnancies), miscarriages (from previous pregnancies), voluntary pregnancy interruptions (VPI), and the referring medical doctor. These variables constitute the regressors of the statistical estimates performed in the models.
The reference sample contains 2119 observations. However, a significant proportion of observations (1266) are attributable to a particular type of pathway, of very short length (defined as “day-hospital”) and with peculiar characteristics, which refers to the entry motivation “maternal age”. This sub-sample (which we can define “Maternal Age-EMA”) is rather homogeneous even though it includes two entry motivations (amniocentesis and chorionic villi for women over 35 years old). It appears, on the other hand, rather interesting to carry out a descriptive analysis for the other sub-sample, i.e., the one consisting of motivations other than just maternal age, which will henceforth be referred to as ‘Not-EMA’ for brevity. Another sub-sample that appears to be interesting to examine is that of foreign mothers. These present significantly different characteristics, in terms of age and weeks of pregnancy. For each regressor, the statistics presented in Table 12 refer both to the total sample and the not-EMA and foreign women sub-samples.
The mothers in the whole sample presented themselves on average at the twelfth week of pregnancy. This result is not accidental, as the first useful information about the fetus is generally available after the third month of pregnancy. However, in the two subsamples considered, mothers arrived later in their gestation. Testing the hypothesis that the mean in the not-EMA sub-sample is equal to the mean of the whole sample, we obtain a result (4.70) that allows us to reject the hypothesis that the two averages are equal at the 5% level of significance. The same test, on the subsample of foreign mothers, provides a result equal to 6.71.
With respect to the average age in the total sample, an average value of 35.5 years is recorded. This result is influenced by the fact that the sample contains mothers who have undergone compulsory examinations due to maternal age. The probability distribution is consequently strongly influenced by this self-selection. This is confirmed by the fact that the average age for the not-EMA sub-sample is lower (32.5 years). A hypothesis test that the mean is 35.45 against the alternative that it is less than 35.45 provides a result equal to −15.43. The hypothesis that the two averages are equal can be strongly rejected. Foreign mothers were significantly younger. The hypothesis test on the subsample of foreign mothers provided a result equal to −8.25. Again, the hypothesis that the mean is equal is strongly rejected.
Figure 4 contains the estimated density functions for the variable weeks of pregnancy, for the whole sample (a), and for the two subsamples considered: not-EMA (b) and foreign women (c). In line with what we have analyzed from descriptive statistics, the probability distribution of weeks of pregnancy for the entire sample is roughly symmetrical (mean and median almost coincide), with a long tail on the right. But, in general, mothers who access the genetics center for compulsory examinations concerning maternal age seem to arrive at the earliest useful time, which is at the end of the third month of pregnancy. The distribution of weeks in the subsamples is more asymmetrical and towards the right (the mean is larger than the median in both cases), and it seems clear that the “Not-EMA” and foreign women came to the genetics department at a later stage.
Figure 5 reports the estimated density functions for the age of the patients. For the whole sample (a), it is evident that patients tested for maternal age skew the distribution, which has a long tail on the left but rises rapidly towards the mean. In the density function for not-EMA patients (b) and foreign women (c), the distribution in the sub-sample of foreign mothers has a lower mean with respect to the full sample, although the distribution is skewed to the left.
Note that the kernel density estimation herein presented is applied as a non-parametric method to estimate the probability density function of the random variable based on kernels as weights. The kernel function used is the Epanechnikov kernel, which is optimal in a mean square error. The bandwidth is not fixed for all samples but is varied depending on the samples. The objective of this choice is to produce a particularly powerful method for the estimation, called variable bandwidth kernel density estimation. In Figure 4, the first density function for the weeks of pregnancy has a bandwidth of 0.7211, the second has a bandwidth of 1.2110, and the third has a bandwidth of 1.2621. While, in Figure 5, the first density function for patient age has a bandwidth of 0.7211, the second has a bandwidth of 1.7805, and the third has a bandwidth of 1.3574.
With respect to the other personal characteristics in the database, they have a discrete distribution. Table 13 summarizes the statistics for these variables, while Table 14 describes the distribution of the referring professionals. The majority of examinations were prescribed by the general practitioner, or by a hospital, consultant, or contracted specialist. The number of mothers whose examinations were prescribed by private specialists is relatively small.
The last descriptive statistics refer to the length of the clinical pathway, which measures the care complexity of the clinical pathway. Table 15 reports the descriptive statistics for the entire sample and the two subsamples considered.
As already indicated, the women examined for maternal age were not following a proper clinical course, and their pathway length is extremely short (less than one day). The distribution of this variable is, therefore, affected by this characteristic, and the mean of the entire sample is significantly lower than in the two subsamples considered. The hypothesis test applied in the previous subsection allows us to reject the null hypothesis that in the two subsamples, the mean is equal to that of the entire sample. Figure 6 shows the estimated length density function for the entire sample. The first density function for the length of the pathway has a bandwidth of 0.8553, the second has a bandwidth of 4.3249, and the third has a bandwidth of 4.4172.
The distribution is concentrated around the zero value, with a very long tail on the right-hand side. This particular distribution of the dependent variable will influence the choice of the statistical estimation technique. The distribution in the sub-samples also appears asymmetrical towards the left, but less ‘collapsed’ around the zero value. Despite this, it presents similar characteristics.
Finally, Table 16 shows some descriptive statistics for the distribution of clinical pathways: belonging to a clinical pathway is, in fact, the dependent variable for the logit models. The pathways are the same as those identified above.
Due to the low number of several clinical pathways, some of them were grouped together in the estimates. How the pathways were grouped is described in the next section.

3.5. Statistical Analyses

This section describes the statistical analyses carried out on the collected samples. Our objective is twofold; the first objective is to study the variability in the allocation to clinical pathways with respect to individual patient characteristics, while the second objective is to assess whether the length of the clinical pathway is correlated with these same individual characteristics, i.e., whether there is a direct correlation between individual characteristics and pathway length that does not pass through the assignment to the clinical pathway.
The technique used to answer the first question is a binary choice model that assumes a logistic distribution of residuals (i.e., logit). The dependent variable is a binary variable, equal to one if the patient is assigned to a specific pathway, equal to zero otherwise, assessing the probability of being in a given clinical pathway given a set of individual characteristics. Two different techniques are used to assess the direct correlation between personal characteristics and pathway length. The first one is a maximum likelihood estimation that assumes a Poisson distribution of the residuals (i.e., pseudo-Poisson maximum likelihood). This technique takes into account the probability distribution of the dependent variable. We then compare the results obtained with the second technique, a simple OLS estimate, on which a specification test is subsequently performed. The following subsections contain the statistical estimates, divided for the three reference samples: the full sample, the not-EMA, and the foreign women.
The initial estimates are made on the full sample. This presents the problem that a large part of its numerosity is attributable to mothers who come to the genetics center for age-related examinations, as has already been pointed out. This clinical pathway has very special characteristics, as its length is zero and its cost is small. It is, therefore, extremely likely that the estimates of the whole sample are influenced by this sub-sample.

3.5.1. Binary Models: Assignment to a Clinical Pathway—Full Sample

The estimates presented in Table 17 concern nine binary models, where the dependent variable is a dummy equal to one if the patient is assigned to a specific clinical pathway. The dependent variable is, therefore, the probability of being or not being in a specific clinical pathway. The numbers in brackets indicate the Student’s t-statistics.
The objective consists of analyzing whether and to what extent certain personal characteristics are correlated with the probability of being assigned to a certain clinical pathway. In this context, it is more accurate to use correlation and not causation, as it is, in fact, difficult to assess whether the regressors are purely exogenous. The coefficients shown are marginal effects. It should also be noted that in models (4), (6), and (7), the statistical software has excluded some variables for reasons of multicollinearity, which is why the number of observations is lower. The variable age is also excluded from the regressions as it is strongly endogenous for reasons of reverse causality.
The most interesting results concern the clinical pathways B1, B5, B6, and DA. Pathway B1 relates to examinations for genetic diseases in the family and consanguinity. Being a foreign patient is positively correlated with the probability of being in this clinical pathway, together with past voluntary interruptions of pregnancy. One possible interpretation is that this might be related to socioeconomic or health deprivation. The B5 pathway, on the other hand, is linked to fetal pathologies. Patients seem to become aware of this problem later in pregnancy (weeks are positively correlated with the probability of being in this pathway). Being Italian increases the probability of being in this pathway. The number of past interruptions of pregnancy (spontaneous and voluntary) is, in turn, positively correlated with the probability of being in this pathway. One possible interpretation is that, if the fetus is potentially affected by genetic disorders, the same genetic problems may also have adversely affected past pregnancies. Pathway B6 concerns exposure to external factors (e.g., radiation, drugs). Weeks of pregnancy are negatively correlated, and this is not surprising, and if the patient realizes or is aware of the exposure, she contacts the department at the earliest opportunity. The number of children born alive from previous pregnancies is negatively correlated, perhaps because mothers with more past experience are less likely to have this type of problem.
The A pathway (maternal age) has the largest number of significant variables. Mothers take these examinations at the earliest convenient time (weeks of pregnancy are negatively correlated). Foreign mothers, as seen, are on average younger: they are, therefore, more likely to be in the A pathway if the mother is Italian. The number of children born alive from previous pregnancies is positively correlated with the probability of being in the pathway. Being an older mother means they are more likely to have had other children in the past. Voluntary terminations of pregnancy are negatively correlated, while miscarriages are positively correlated. Finally, it is interesting to comment on the referral of medical doctors across the board. Examinations by maternal age are prescribed more by the general practitioner, whereas if the prescription is made by a hospital specialist, the patient is more likely to be in the B5 or B6 pathway.

3.5.2. Pseudo-Poisson Maximum Likelihood and OLS: The Length of the Clinical Pathway—Full Sample

Table 18 reports the estimates with pathway length as the dependent variable. The estimate is greatly affected, as might have been expected, by the presence of EMAs within the sample.
As already pointed out, the clinical pathway related to maternal age is extremely short. Being foreign affects the length positively, and this is because foreign mothers are on average younger. Weeks of pregnancy have a positive influence, but as seen, one is more likely to be in the A pathway if one is close to the fourth week. The results are robust to different specifications and different techniques. The OLS estimates, which do not consider the distribution of the dependent variable, are consistent with the pseudo-Poisson maximum likelihood (PPML) estimates. A reset test (shown in column (5)) allows us not to reject the null hypothesis that the model is well specified. Column (6) shows standard errors of the bootstrapped coefficients (500 replications). The result remains robust.

3.5.3. Binary Models: Assignment to a Clinical Pathway—Not-EMA Sample

In the present section and the next, we restrict the sample to not-EMA. The reason for this choice is extremely simple; given the large number of mothers tested by maternal age, the estimates are biased. The analyses proposed are the same as in the previous subsection. The estimates now contain the variable age, which is no longer, logically, endogenous. Table 19 shows that, as for the general sample, paths B1, B5, and B6 are the most interesting ones.
The coefficients of path B1 are quite similar to those of the previous estimates. The estimation is robust to the subsample considered. Of course, the age variable is now also present, which is significant and negatively correlated with the probability of being in B1. A similar argument applies to the B5 path, to which more older mothers seem to be assigned. A similar argument can be made for path B6.

3.5.4. Pseudo-Poisson Maximum Likelihood and OLS: The Length of the Clinical Pathway—Not-EMA Sample

Contrary to the previous analysis, the estimates with pathway length as the dependent variable (Table 20) do not appear to be robust to the subsample considered. Despite this, both age and citizenship appear significant, the former being negatively correlated with length, the latter being positively correlated. In particular, the significance of the foreign dummy appears interesting. It may be that due to language problems, cultural differences, and difficulties in reconstructing the medical records of a foreign individual, the clinical course is more complex. The RESET test does not allow us to accept the null hypothesis that the model is well specified, in this case.

3.5.5. Binary Models: Assignment to a Clinical Pathway: Foreign Mother Sample

As pointed out in the descriptive statistics, the sub-sample of foreign mothers presents quite peculiar characteristics compared to the whole sample. It, therefore, seems sensible to repeat the analyses on this subsample to see whether, within the group of foreign mothers, the correlation between the personal characteristics and the assignment to the clinical pathway and, on the other hand, the performance indicator, varies significantly with respect to the full sample. Since the subsample of foreign women includes EMAs anyway, the variable age is omitted as endogenous.
As in previous estimates, the most interesting clinical pathways in Table 21 appear to be B1, B5, B6, and A. The estimates appear robust compared to the samples previously considered. The weeks of pregnancy are positively correlated with the probability of being in B1 and B5, and negatively with the A pathway. A specialist physician assigns patients to B5 and B6. The number of children born alive is negatively correlated with the probability of being assigned to B6. Individual characteristics influence the probability of being assigned to a particular clinical pathway regardless of nationality. This result functions as a robustness test for the results obtained.

3.5.6. Pseudo-Poisson Maximum Likelihood and OLS: The Length of the Clinical Pathway—Foreign Women Sample

In this case, (Table 22), the regressions do not present any particularly interesting results, except that weeks of pregnancy is positively correlated with length, probably due to the negative correlation with EMA, while the consultant specialist is negatively correlated with the dependent variable, probably because it is this specialist who prescribes maternal age examinations for patients. The sample is relatively small, and the OLS estimates are consistent with the pseudo-Poisson maximum likelihood. The RESET test accepts the null hypothesis of a good specification; although in this case, it would be better to say a ‘non-specification’: the correlations seem to work predominantly through assignment to pathway A. The results do not change when standard errors are calculated with resampling.

3.5.7. Clinical Pathway Length: Individual Characteristics vs. Clinical Pathway

This short subsection contains an OLS estimation of the length on individual and dummy characteristics of the clinical path. The objective is to estimate the clinical path length by means of the regression model, i.e., to see whether the path length, conditioned with respect to individual characteristics is significantly different from the unconditioned average length divided by path. Furthermore, such regressions are used to find out whether the length is really influenced by personal characteristics, or whether, on the contrary, the significance is mainly captured by the clinical path. It is evident from the results (Table 23) that a large part of the significance of the path length is indeed captured by the clinical pathways (as can be deduced from the significance of the dummies). Some variables are, however, also significant and, in particular, children born of previous pregnancies and the referring professionals. For those not belonging to a clinical pathway, the number of children born alive may be negatively correlated, since the greater the number of previously successfully completed pregnancies, the less complicated the mother’s situation is likely to be and the shorter the cynical pathway.

4. Discussion and Conclusions

The research examined an almost unexplored problem to our knowledge, the analysis of clinical pathways for pregnancies that are at risk. In this field, the activity is carried out in a rather fragmented way from the organizational point of view, holding more a clinical structure point of view and with the laboratory providing the service rather than the patient. Indeed, to our knowledge and looking into the international literature, in the genetic services, there are no studies that explore the patient individual characteristics that might affect the diagnostic pathway and the overall pathway length.
The limitations of the current situation depend mainly on the insufficient availability of data: the initial phase of the research devoted a lot of time to this aspect, to demonstrate the need to collect individual data per patient. This is the premise for starting to think in terms of pathways and, above all, for making these pathways operational in clinical practice as well. Since a potential weakness and limitation of this study is the availability of data only for one year in the past, it is to be hoped that the database that has been experimentally collected can continue to be implemented and extended to other genetics centers and laboratories, preferably leading to a single regional survey system. The analysis of clinical pathways requires, in fact, the comparison of different situations to be able to highlight which is the best reference practice that combines the best care with the best use of resources, with a view to their appropriateness, which is the fundamental property of the essential levels of care provided by our health care system.
From the point of view of the construction of the pathways, however, even with the limited data available it was possible to set up an analysis methodology that if implemented and verified with the operators could lead to an improvement in the service. In particular, the different pathways were defined and flow charts were constructed to follow the patients’ flows within each of them, also highlighting some process indicators to describe and evaluate them. The statistical analysis, which, despite the limited data available, showed how it is possible, and it showed additional information on the relationship between individual characteristics and performance at the clinical pathway level.
In particular, the results of the binary model estimates underline how there are potentially different patient profiles assigned to different clinical pathways. The variable ‘foreign mother’ presents the most interesting results. Not only does this variable have a correlation that is robust to the different specifications and sub-samples for the binary models, but it also directly influences the length of the clinical pathway, even in the not-EMA sample. Investigating the reasons for this correlation appears to be important above all to overcome any cultural barriers that might jeopardize access to essential levels of care for these patients. To better investigate these difficulties, it would be very useful to have even more detailed data, especially on the socio-economic characteristics of the patients themselves.
Lastly, further analyses would be possible if we had data on resources, a characteristic that unfortunately could not be detected within the project; this would make it possible to distinguish how much of the variability is explained by personal characteristics (not only clinical, but also socio-economic information such as health deprivation index or socio-economic deprivation), but also that there is residual variability that cannot be explained or justified and which could be eliminated, being attributable to poor organization and the presence of purely economic inefficiency.

Author Contributions

Conceptualization, A.T., E.T., S.A. and P.L.; methodology, A.T. and S.A.; software, P.L. and S.A.; validation, A.T., E.T., S.A. and P.L.; formal analysis, P.L. and S.A.; investigation, S.A. and A.T.; resources, A.T.; data curation, P.L. and E.T.; writing—original draft preparation, S.A., E.T. and A.T.; writing—review and editing, P.L., A.T., E.T. and S.A.; visualization, S.A. and P.L.; supervision, A.T. and E.T. All authors have read and agreed to the published version of the manuscript.

Funding

This research received no external funding.

Data Availability Statement

Due to the nature of the research and due to legal constraints, supporting data are not available.

Acknowledgments

The authors acknowledge the genetic centers of the hospitals of Bologna, Ferrara and Imola, in the Emilia–Romagna region in Italy. Special thanks to Elisa Calzolari and Olga Calabrese for their precious help in the development of the database and in the discussion of the results.

Conflicts of Interest

The authors declare no conflicts of interest.

References

  1. Gartner, J.B.; Abasse, K.S.; Bergeron, F.; Landa, P.; Lemaire, C.; Côté, A. Definition and conceptualization of the patient-centered care pathway, a proposed integrative framework for consensus: A Concept analysis and systematic review. BMC Health Serv. Res. 2022, 22, 558. [Google Scholar] [CrossRef] [PubMed]
  2. De Blaser, L.; Depreitere, R.; De Waele, K.; Vanhaecht, K.; Vlayen, J.; Sermeus, W. Defining pathways. J. Nurs. Manag. 2006, 14, 553–563. [Google Scholar] [CrossRef] [PubMed]
  3. Ministerial Commission for Genetics in the Italian National Health Service. Available online: http://www.salute.gov.it/imgs/C_17_pubblicazioni_908_allegato.pdf (accessed on 15 July 2023).
  4. Vanhaecht, K.; Panella, M.; van Zelm, R.; Sermeus, W. An overview on the history and concept of care pathways as complex interventions. Int. J. Care Pathw. 2010, 14, 117–123. [Google Scholar] [CrossRef]
  5. Aspland, E.; Gartner, D.; Harper, P. Clinical pathway modelling: A literature review. Health Syst. 2021, 10, 1–23. [Google Scholar] [CrossRef] [PubMed]
  6. Manktelow, M.; Iftikhar, A.; Bucholc, M.; McCann, M.; O’Kane, M. Clinical and operational insights from data-driven care pathway mapping: A systematic review. BMC Med. Inform. Decis. Mak. 2022, 22, 43. [Google Scholar] [CrossRef]
  7. Erdogan, T.G.; Tarhan, A. A goal-driven evaluation method based on process mining for healthcare processes. Appl. Sci. 2018, 8, 894. [Google Scholar] [CrossRef]
  8. Erdogan, T.G.; Tarhan, A. Systematic mapping of process mining studies in healthcare. IEEE Access 2018, 6, 24543–24567. [Google Scholar] [CrossRef]
  9. Gooch, P.; Roudsari, A. Computerization of workflows, guidelines, and care pathways: A review of implementation challenges for process-oriented health information systems. J. Am. Med. Inform. Assoc. 2011, 18, 738–748. [Google Scholar] [CrossRef]
  10. Kreys, E.D.; Koeller, J.M. Role of clinical pathways in health care provision: Focus on cancer treatment. Am. J. Health-Syst. Pharm. 2013, 70, 1081–1085. [Google Scholar] [CrossRef] [PubMed]
  11. Sisk, B.A.; Kerr, A.; King, K.A. Factors affecting pathways to care for children and adolescents with complex vascular malformations: Parental perspectives. Orphanet. J. Rare Dis. 2022, 17, 271. [Google Scholar] [CrossRef] [PubMed]
  12. Lin, F.; Chou, S.; Pan, S.; Chen, Y. Mining time dependency patterns in clinical pathways. Int. J. Med. Inform. 2001, 62, 11–25. [Google Scholar] [CrossRef]
  13. Prokofyeva, E.S.; Zaytsev, R.D. Clinical pathways analysis of patients in medical institutions based on hard and fuzzy clustering methods. Bus. Inform. 2020, 14, 19–31. [Google Scholar] [CrossRef]
  14. He, J.A.; Yang, W. Clinical pathways in China—An evaluation. Int. J. Health Care Qual. Assur. 2015, 28, 394–411. [Google Scholar] [CrossRef] [PubMed]
  15. Zeleke, A.J.; Moscato, S.; Miglio, R.; Chiari, L. Length of Stay Analysis of COVID-19 Hospitalizations Using a Count Regression Model and Quantile Regression: A Study in Bologna, Italy. Int. J. Environ. Res. Public Health 2022, 19, 2224. [Google Scholar] [CrossRef] [PubMed]
  16. American College of Medical Genetics. Manual on Reimbursement for Medical Genetics Services; Williams, M.S., Ed.; Kendall Hunt: Dubuque, IW, USA, 2002. [Google Scholar]
  17. Monitoring and Evaluation of Diagnostic-Therapeutic Care Pathways. Methodology for Calculating Indicators, 23 July 2018 Directorate General for Health Programming, Italian Ministry of Health 23 July 2018. Available online: https://www.salute.gov.it/imgs/C_17_pagineAree_5238_3_file.pdf (accessed on 15 July 2023).
  18. Motta, V. Estimating Poisson pseudo-maximum-likelihood rather than log-linear model of a log-transformed dependent variable. RAUSP Manag. J. 2019, 54, 508–518. [Google Scholar] [CrossRef]
  19. Tolles, J.; Meurer, W.J. Logistic Regression: Relating Patient Characteristics to Outcomes. JAMA 2016, 316, 533–534. [Google Scholar] [CrossRef] [PubMed]
  20. Zwinderman, A.H.; Glas, A.S.; Bossuyt, P.M.; Florie, J.; Bipat, S.; Stoker, J. Statistical models for quantifying diagnostic accuracy with multiple lesions per patient. Biostatistics 2008, 9, 513–522. [Google Scholar] [CrossRef] [PubMed]
  21. Santos Silva, J.M.C.; Tenreyro, S. The Log of Gravity. Rev. Econ. Stat. 2006, 88, 641–658. [Google Scholar] [CrossRef]
  22. Heneghan, C. EBM Guidelines: Evidence-Based Medicine. BMJ Evid. Based Med. 2004, 9, 61. [Google Scholar] [CrossRef]
  23. Masic, I.; Miokovic, M.; Muhamedagic, B. Evidence based medicine—New approaches and challenges. Acta Inform. Med. 2008, 16, 219–225. [Google Scholar] [CrossRef]
  24. Campbell, H.H.R.; Bradshaw, N.; Porteous, M. Integrated care pathways. Br. Med. J. 1998, 316, 133–144. [Google Scholar] [CrossRef]
  25. Rotter, T.; de Jong, R.B.; Lacko, S.E.; Ronellenfitsch, U.; Kinsman, L. Clinical pathways as a quality strategy. In Improving Healthcare Quality in Europe: Characteristics, Effectiveness and Implementation of Different Strategies [Internet]; Busse, R., Klazinga, N., Panteli, D., Quentin, W., World Health Organization, Eds.; European Observatory on Health Systems and Policies: Copenhagen, Denmark, 2019; (Health Policy Series, No. 53.) 12. Available online: https://www.ncbi.nlm.nih.gov/books/NBK549262/ (accessed on 12 July 2023).
  26. Hughes, R.G. Tools and Strategies for Quality Improvement and Patient Safety. In Patient Safety and Quality: An Evidence-Based Handbook for Nurses; Hughes, R.G., Ed.; Agency for Healthcare Research and Quality (US): Rockville, MD, USA, 2008; Chapter 44. Available online: https://www.ncbi.nlm.nih.gov/books/NBK2682/ (accessed on 10 August 2023).
  27. Asadi, M.J.; Baltz, W.A. Activity-based costing for clinical paths. An example to improve clinical cost & efficiency. J. Soc. Health Syst. 1996, 5, 1–7. [Google Scholar]
  28. Dubron, K.; Verschaeve, M.; Roodhooft, F. A time-driven activity-based costing approach for identifying variability in costs of childbirth between and within types of delivery. BMC Pregnancy Childbirth 2021, 21, 705. [Google Scholar] [CrossRef]
  29. Braun, R.; Schlieter, H.; Burwitz, M.; Esswein, W. BPMN4CP: Design and implementation of a BPMN extension for clinical pathways. In Proceedings of the 2014 IEEE International Conference on Bioinformatics and Biomedicine (BIBM), Belfast, UK, 2–5 November 2014; pp. 9–16. [Google Scholar] [CrossRef]
  30. Kassim, S.A.; Gartner, J.B.; Labbé, L.; Landa, P.; Paquet, C.; Bergeron, F.; Lemaire, C.; Côté, A. Benefits and limitations of business process model notation in modelling patient healthcare trajectory: A scoping review protocol. BMJ Open 2022, 12, e060357. [Google Scholar] [CrossRef] [PubMed]
  31. Pufahl, L.; Zerbato, F.; Weber, B.; Weber, I. BPMN in healthcare: Challenges and best practices. Inf. Syst. 2022, 107, 102013. [Google Scholar] [CrossRef]
  32. Shitkova, M.; Taratukhin, V.; Becker, J. Towards a methodology and a tool for modeling clinical pathways. Procedia Comput. Sci. 2015, 63, 205–212. [Google Scholar] [CrossRef]
Figure 1. The influence of individual characteristics on care complexity and clinical pathway length.
Algorithms 17 00075 g001
Figure 2. Clinical pathway flows (part 1).
Algorithms 17 00075 g002
Figure 3. Clinical pathway flows (part 2).
Algorithms 17 00075 g003
Figure 4. Density function for week of pregnancy: whole sample (a) and sub-samples not-EMA (b) and foreign women (c).
Algorithms 17 00075 g004
Figure 5. Density function for age of the patients: whole sample (a) and sub-samples not-EMA (b) and foreign women (c).
Algorithms 17 00075 g005
Figure 6. Density function for length pathway of the patient: whole sample (a) and sub-samples not-EMA (b) and foreign women (c).
Algorithms 17 00075 g006
Table 1. List and description of the motivations for clinical investigation.
MotivationDescription of the Motivation for the Diagnosis
1Gene pathology in the family
2Chromosomal pathology in the family
3Multifactorial/heterogeneous pathology in the family
4Undefined or other pathology in the family
5Fetal ultrasound pathology
6Cytogenetic fetal pathology
7Fetal screening
8Maternal exposure to radiation
9Maternal exposure to drugs
10Maternal environmental exposure
11Maternal infection exposure
12Consanguinity
13Maternal age (EMA)—Chorionic villi
14Maternal age (EMA)—Amniotic fluid
15Non-specific indication
Table 2. Distribution of the number of motivations assigned to patients.
Motivations Assigned to PatientsNumber of Patients
One motivation1866
Two motivations239
Three motivations13
Four motivations1
Total2119
Table 3. Rules for assigning patients to a motivation group.
Composition of Motivation CodesNumber of Patients
(Maternal age (EMA)—Chorionic villi OR Maternal age (EMA)—Amniotic fluid) AND Other = Other149
(Maternal exposure to radiation OR Maternal exposure to drugs OR Maternal environmental exposure OR Maternal infection exposure) AND Other = Other12
Non-specific indication AND Other = Other48
Double motivation with the same code = Code1
Total210
Table 4. The characteristics of the identified clinical pathways: motivation groups and numerosity.
Clinical PathwayMotivation CodesNumber of Patients
A1Maternal age (EMA)—Chorionic villi491
A2Maternal age (EMA)—Amniotic fluid775
B1Gene pathology in the family OR Chromosomal pathology in the family 370
B2Chromosomal pathology in the family47
B3Multifactorial/heterogeneous pathology in the family71
B4Undefined or other pathology in the family9
B5Fetal ultrasound pathology OR Cytogenetic fetal pathology OR Fetal screening194
B6Maternal exposure to radiation OR Maternal exposure to drugs OR Maternal environmental exposure OR Maternal infection exposure115
B7Non-specific indication4
C1Gene pathology in the family AND Chromosomal pathology in the family5
C2Gene pathology in the family AND Multifactorial/heterogeneous pathology in the family17
C3Gene pathology in the family AND (Fetal ultrasound pathology OR Cytogenetic fetal pathology OR Fetal screening)8
C4Chromosomal pathology in the family AND Multifactorial/heterogeneous pathology in the family1
C5Multifactorial/heterogeneous pathology in the family AND (Fetal ultrasound pathology OR Cytogenetic fetal pathology OR Fetal screening)7
C6Gene pathology in the family AND Chromosomal pathology in the family AND Multifactorial/heterogeneous pathology in the family4
C7Gene pathology in the family AND Multifactorial/heterogeneous pathology in the family AND Fetal ultrasound pathology1
Total 2119
Table 5. Distribution of patients in the sample by territory and by clinical pathway.
AgeA1A2B1B2B3B4B5B6B7C1–C7Total
IFIFIFIFIFIFIFIFIFIF
Bologna3512530532781820123430739100041351
Ferrara88112391415210511221820761192214026888
Imola15115926125941233116901003015
Total4543770372242128407561581165299322403492119
% total21233311620.5310.5081410021100
% path92891965358515792189118515811910007921
Table 6. Distribution of patients in the sample by age and clinical pathway.
AgeA1A2B1B2B3B4B5B6B7C1–C7Total
IFIFIFIFIFIFIFIFIFIF
15–240100153030430092115008394
25–3419169811372216289616510501230176516
>3543535634641142616124320911732510901509
Total4543770372242128407561581165299322403492119
Table 7. Distribution of patients by anamnestic data on previous pregnancies by clinical pathway.
Anamnestic DataA1A2B1B2B3B4B5B6B7C1–C7Total
IFIFIFIFIFIFIFIFIFIF
Live birth44841302438831343134254110173302
Stillborn101000000110000000116
Term birth21619101194142001915000031125
Preterm birth100200000000000000003
Miscarriage35731137181238131018130010115196
VPI61636833200010310003055
Total10822985848732710272051815651203510687
Table 8. Distribution of genetic testing performed by patients by clinical pathway (with fetus).
Genetic Test (with Fetus)B1B2B3B4B5B6B7C1–C7Total
IFIFIFIFIFIFIFIF
Not inserted11100000000000002
High resolution cytogenetic00200000300000426
Molecular cytogenetic1025030003100001011
Standard cytogenetic (karyotype)39190313630962311102410260
Molecular CGH-Array11200000300000005
Molecular direct325273002621 29600005517728
Molecular indirect11400000000000002
Molecular UPD/Methylation000 30009200003021
Total3682953434584014332111087291035
Table 9. Distribution of genetic testing performed by patients by clinical pathway (no fetus).
Genetic Test (no Fetus)B1B2B3B4B5B6B7C1–C7Total
IFIFIFIFIFIFIFIF
Not inserted11000000000000002
High resolution cytogenetic00100000200000025
Molecular cytogenetic00103000000000105
Standard cytogenetic (karyotype)101339430231200009683
Molecular CGH-Array11000000000000002
Molecular direct249239002421023500004216601
Molecular indirect01000000000000001
Molecular UPD/Methylation00203000200000209
Total25224217339640501700005424708
Table 10. Distribution of examination outcome (with fetus) by patients by clinical pathway.
Outcome (with Fetus) B1B2B3B4B5B6B7C1–C7Total
IFIFIFIFIFIFIFIF
Not inserted28650230012001007367
Anomalous not defined510000002100000110
Anomalous pathological17161020008200004151
Anomalous carrier1531456020001360000161342
Normal165127223395401082310104423565
Total3682953434584014332111071291035
Table 11. Distribution of examination outcome (no fetus) by patients by clinical pathway.
Outcome (no Fetus) B1B2B3B4B5B6B7C1–C7Total
IFIFIFIFIFIFIFIF
Not inserted2353022000000006243
Anomalous not defined41000000100000017
Anomalous pathological560010000000000113
Anomalous carrier1191303020001350000121285
Normal10110011334440361200003619360
Total25224217339640501700005424708
Table 12. Descriptive statistics for week of pregnancy and maternal age.
MeanMedianSt. Dev.MinMax
Sample size = 2119
Weeks of pregnancy11.97124.01440
Age35.45364.921548
Sample size = 853—Not-EMA
Weeks of pregnancy12.85125.46437
Age32.38335.811648
Sample size = 321—Foreign women
Weeks of pregnancy13.99135.35440
Age32.56346.271546
Table 13. Descriptive statistics for previous pregnancies.
Previous PregnanciesLive Births
(Quantity and %)
Spontaneous Abortions
(Quantity and %)
VPI
(Quantity and %)
0120916402046
0.5700.7730.965
170936171
0.3340.1700.033
2166932
0.0780.0430.000
33023-
0.0140.010-
452-
0.0020.000-
5-1-
-0.000-
Total211921192119
111
Table 14. Descriptive statistics relating to the referring medical doctor.
Referring Medical DoctorFrequency(%)
General practitioner55926.38
NHS specialist26512.51
Consultant specialist31014.63
Unidentified specialist944.44
Hospital specialist43220.39
Private specialist1406.61
Other31915.06
Total2119100
Table 15. Descriptive statistics on the length of the clinical pathway.
Pathway Length (Days)MeanMedianSt. Dev.MinMax
Sample size = 21196.77016.030259
Sample size = 853—Not-EMA16.27821.570259
Sample size = 321 Foreign women13.24222.260195
Table 16. Descriptive statistics on the distribution of patients in pathways.
Clinical PathwayFrequency(%)
A14910.2317
A27750.3657
B13700.1746
B2470.0222
B3710.0335
B490.0042
B51940.0916
B61150.0543
B740.0019
C150.0024
C2170.0080
C380.0038
C410.0005
C570.0033
C640.0019
C710.0005
Total21191
Table 17. Probability of being assigned to a particular clinical pathway—LOGIT estimates.
Variables(1)
B1
(2)
B2
(3)
B3
(4)
B4
(5)
B5
(6)
B6
(7)
B7
(8)
C
(9)
A
Weeks of pregnancy0.00245
(1.373)
−0.00233 ***
(−2.979)
−0.00425 ***
(−5.358)
−0.000678 **
(−2.221)
0.0126 ***
(9.328)
−0.00243 ***
(−2.803)
0.000538
(0.721)
−4.24 × 10⁻⁵
(−0.0693)
−0.0168 ***
(−5.981)
Foreign0.235 ***
(8.119)
0.00267
(0.342)
0.0219 *
(1.840)
0.000243
(0.0851)
−0.0410 ***
(−5.404)
0.00469
(1.148)
-
-
0.00648
(0.806)
−0.274 ***
(−8.184)
Live births−0.00879
(−0.796)
−0.00477
(−1.592)
−0.00378
(−0.888)
−0.000195
(−0.146)
−1.29 × 10⁻⁵
(−0.00241)
−0.0202 ***
(−3.203)
−0.00634
(−0.665)
−0.00162
(−0.522)
0.0769 ***
(4.467)
Miscarriages−0.0619 ***
(−4.572)
0.00494
(1.630)
0.00735
(1.624)
−0.00181
(−0.876)
0.00934 *
(1.743)
-
-
−0.00197
(−0.243)
0.00281
(0.661)
0.0613 ***
(3.154)
VPI0.0549 *
(1.814)
0.0175 **
(2.550)
0.00654
(0.569)
-
-
0.0495 ***
(3.138)
−0.00719
(−1.010)
-
-
0.00740
(0.769)
−0.266 ***
(−4.140)
General practitioner−0.132 ***
(−7.891)
−0.00275
(−0.369)
−0.0100
(−1.153)
−0.00134
(−0.446)
−0.0461 ***
(−4.990)
−0.0119 **
(−2.118)
-
-
−0.0194 ***
(−3.661)
0.298 ***
(11.11)
Hospital specialist−0.0188
(−0.914)
0.00290
(0.317)
0.00937
(0.798)
0.00479
(0.749)
0.0352 **
(2.355)
0.0335 *
(1.723)
-
-
0.00173
(0.264)
−0.133 ***
(−3.744)
Private specialist0.0348
(1.011)
−0.00134
(−0.126)
0.0149
(0.820)
0.00218
(0.305)
0.00730
(0.446)
0.0867 *
(1.670)
-
-
−0.00414
(−0.523)
−0.236 ***
(−4.636)
Consultant specialist−0.0100
(−0.460)
−0.00935
(−1.343)
−0.00990
(−1.052)
-
-
−0.0316 ***
(−3.127)
0.116 **
(2.090)
-
-
−0.000813
(−0.123)
−0.0948 **
(−2.448)
NHS specialist−0.0601 ***
(−2.950)
0.0261
(1.582)
0.0107
(0.765)
0.00417
(0.618)
−0.0219 **
(−2.142)
−0.00209
(−0.318)
-
-
−0.0136 ***
(−2.804)
0.103 ***
(2.826)
No. obs.21192119211917452119163935021192119
Note: *** p < 0.001; ** p < 0.01; * p < 0.05.
Table 18. Clinical path length estimation with different techniques—full sample.
Variables(1)
PPML
(2)
PPML
(3)
PPML
(4)
OLS
(5)
OLS Reset
(6)
OLS
Bootstrap
Weeks of pregnancy0.0286 **
(2.118)
0.0125
(0.998)
0.0117
(0.955)
0.219 *
(1.716)
0.0429
(0.337)
0.219 *
(1.753)
Foreign0.782 ***
(6.373)
0.446 ***
(3.540)
0.433 ***
(3.469)
6.529 ***
(5.145)
0.853
(0.278)
6.529 ***
(5.686)
Live births-−0.147 **
(−2.136)
−0.139 **
(−1.992)
−1.663 ***
(−3.957)
−0.739
(−1.254)
−1.663 ***
(−3.916)
Miscarriages-−0.0328
(−0.419)
−0.0136
(−0.175)
−0.668
(−1.482)
−0.288
(−0.586)
−0.668
(−1.492)
VPI-0.440 **
(2.330)
0.418 **
(2.219)
4.647 *
(1.855)
0.0417
(0.0118)
4.647 *
(1.870)
General practitioner--−0.465 **
(−2.021)
−2.416 ***
(−2.895)
−1.769
(−1.633)
−2.416 ***
(−2.752)
Hospital specialist--0.381 ***
(2.664)
3.082 ***
(3.062)
1.187
(0.736)
3.082 ***
(2.937)
Private specialist--0.615 ***
(3.418)
6.190 ***
(3.532)
1.532
(0.447)
6.190 ***
(3.396)
Consultant specialist--0.244
(1.550)
2.958 **
(2.473)
0.930
(0.575)
2.958 **
(2.428)
NHS specialist--0.530 ***
(2.960)
5.117 ***
(3.124)
1.515
(0.547)
5.117 ***
(3.069)
Squares of estimated values----0.0371
(0.673)
-
Cubes of estimated values----0.000438
(0.190)
-
Constant1.389 ***
(8.265)
2.411 ***
(15.85)
2.181 ***
(11.73)
2.958 *
(1.838)
3.787 **
(2.123)
2.958 *
(1.819)
No. obs.211921192119211921192119
R squared0.0370.1140.1260.0730.0770.073
Note: *** p < 0.001; ** p < 0.01; * p < 0.05.
Table 19. Probability of being assigned to a clinical pathway—LOGIT estimates—not-EMA sample.
Variables(1)
B1
(2)
B2
(3)
B3
(4)
B4
(5)
B5
(6)
B6
(7)
C
(8)
A
Age−0.00574 *
(−1.718)
−0.00111
(−1.288)
−0.00212 *
(−1.702)
−2.05 × 10⁻⁵
(−0.589)
0.0120 ***
(4.423)
0.00237 *
(1.673)
0.000175
(0.175)
−0.00371 ***
(−4.076)
Weeks of pregnancy−0.00505
(−1.487)
−0.00428 ***
(−3.594)
−0.00868 ***
(−5.902)
−0.000155 ***
(−3.143)
0.0282 ***
(8.317)
−0.0112 ***
(−4.007)
−0.000709
(−0.410)
−0.000872
(−0.743)
Foreign0.249 ***
(5.643)
−0.0133
(−1.040)
0.00325
(0.170)
−0.000294
(−0.464)
−0.159 ***
(−5.931)
−0.00713
(−0.370)
-−0.0148
(−1.138)
Live births0.0567 **
(2.245)
−0.00201
(−0.328)
0.00593
(0.624)
0.000179
(0.464)
−0.00395
(−0.231)
−0.111 ***
(−4.823)
−0.0191
(−0.508)
0.0121
(1.563)
Miscarriages−0.110 ***
(−3.421)
0.0173 ***
(2.855)
0.0288 ***
(2.746)
−0.0003
(−0.523)
0.0493 **
(2.045)
-−0.00188
(−0.0555)
0.0163 *
(1.702)
VPI−0.0271
(−0.428)
0.0200
(1.461)
−0.0141
(−0.528)
-0.0840 **
(2.031)
−0.0664
(−1.498)
-−6.02 × 10⁻⁵
(−0.00238)
General practitioner0.0302
(0.404)
0.0409
(1.140)
0.0610
(1.295)
0.994 ***
(166.0)
−0.0756 **
(−2.369)
−0.0454 *
(−1.736)
-0.0200
(0.456)
Hospital specialist−0.0980 *
(−1.763)
−0.00939
(−0.604)
−0.00158
(−0.0647)
0.877 ***
(13.96)
0.00502
(0.137)
0.0936 *
(1.764)
-0.0354
(1.055)
Private specialist−0.0373
(−0.527)
−0.0171
(−1.172)
−0.000514
(−0.0174)
0.991 ***
(87.09)
−0.0750 **
(−2.389)
0.201 *
(1.885)
-0.0126
(0.331)
Consultant specialist−0.0677
(−1.108)
−0.0286 **
(−2.197)
−0.0382 *
(−1.859)
−0.123 ***
(−3.902)
0.354 ***
(3.174)
0.0281
(0.784)
NHS specialist−0.0102
(−0.141)
0.0716
(1.563)
0.0497
(1.131)
0.996 ***
(343.5)
−0.0885 ***
(−3.012)
−0.0234
(−0.688)
−0.00207
(−0.0646)
No. obs.85385385364185364693853
Note: *** p < 0.001; ** p < 0.01; * p < 0.05.
Table 20. Clinical path length estimates with different techniques—not-EMA sample.
Variables(1)
PPML
(2)
PPML
(3)
PPML
(4)
OLS
(5)
OLS reset
(6)
OLS
Bootstrap
Age−0.0153 *
(−1.942)
−0.0104
(−0.985)
−0.0119
(−1.098)
−0.226 *
(−1.704)
4.086 *
(1.713)
−0.226 *
(−1.696)
Weeks of pregnancy−0.00247
(−0.253)
−0.000820
(−0.0820)
0.000752
(0.0756)
0.0130
(0.0783)
−0.229
(−1.218)
0.0130
(0.0811)
Foreign0.232 *
(1.914)
0.242 **
(2.039)
0.261 **
(2.233)
4.532 **
(2.128)
−82.27 *
(−1.713)
4.532 **
(2.194)
Live births-−0.0818
(−1.434)
−0.0819
(−1.390)
−1.279
(−1.433)
22.66 *
(1.714)
−1.279
(−1.413)
Miscarriages-0.00873
(0.119)
0.0107
(0.144)
0.199
(0.162)
−3.477
(−1.413)
0.199
(0.164)
VPI-0.178
(1.040)
0.162
(0.943)
2.879
(0.824)
−51.48 *
(−1.738)
2.879
(0.817)
General practitioner--0.138
(0.642)
2.008
(0.619)
−35.47 *
(−1.743)
2.008
(0.621)
Hospital specialist--0.130
(1.026)
1.872
(1.008)
−32.99 *
(−1.694)
1.872
(1.022)
Private specialist--0.276 *
(1.708)
4.316
(1.623)
−77.55 *
(−1.696)
4.316
(1.626)
Consultant specialist--0.0861
(0.585)
1.179
(0.526)
−20.61 *
(−1.656)
1.179
(0.532)
NHS specialist--0.301
(1.399)
4.797
(1.281)
−85.85 *
(−1.751)
4.797
(1.279)
Squares of estimated values----1.138 *
(1.750)
-
Cubes of estimated values----−0.0220 *
(−1.687)
-
Constant3.248 ***
(12.54)
3.105 ***
(9.502)
2.973 ***
(8.572)
20.46 ***
(4.320)
−267.1 *
(−1.657)
20.46 ***
(4.181)
No. obs.853853853853853853
R squared0.0130.0170.0210.0210.0250.021
Note: *** p < 0.001; ** p < 0.01; * p < 0.05.
Table 21. Probability of being assigned to a particular clinical pathway—LOGIT estimates—foreign women sample.
Variables(1)
B1
(2)
B2
(3)
B3
(4)
B4
(5)
B5
(6)
B6
(7)
C
(8)
DA
Weeks of pregnancy0.0196 ***
(2.901)
−0.00242
(−0.882)
−0.00594 ***
(−2.617)
−0.00834
(−0.988)
0.00578 ***
(2.804)
−0.00602 *
(−1.654)
−0.00101
(−0.402)
−0.0315 ***
(−5.393)
Live births0.0821 **
(2.185)
−0.0193
(−1.422)
−0.00525
(−1.025)
0.00727
(0.663)
0.00466
(0.509)
−0.0558 **
(−2.041)
−0.0137
(−1.236)
0.0321
(0.997)
Miscarriages−0.0601
(−1.225)
−0.00437
(−0.337)
0.0136 *
(1.878)
-0.0139
(1.259)
-0.00878
(0.644)
0.00905
(0.254)
VPI0.149
(1.459)
0.0644 *
(1.911)
--0.00869
(0.389)
--−0.143
(−0.975)
General practitioner−0.181 *
(−1.901)
0.0195
(0.486)
--−0.0386 *
(−1.649)
-−0.0196
(−0.713)
0.412 ***
(4.085)
Hospital specialist−0.110
(−1.182)
-0.0370
(1.208)
-0.0327
(0.890)
0.0342
(0.604)
0.00298
(0.0966)
−0.0371
(−0.439)
Private specialist0.110
(0.636)
0.0109
(0.174)
--0.0252
(0.343)
0.0575
(0.531)
-−0.175 *
(−1.744)
Consultant specialist0.00887
(0.0910)
-−0.0133
(−0.891)
-−0.0696 ***
(−2.953)
0.0936
(1.055)
0.00859
(0.284)
−0.125
(−1.554)
NHS specialist−0.211 **
(−2.317)
0.0378
(0.761)
0.00196
(0.0956)
-−0.00798
(−0.272)
−0.00387
(−0.127)
-0.264 **
(2.214)
No. obs.32115324226321191257321
Note: *** p < 0.001; ** p < 0.01; * p < 0.05.
Table 22. Clinical path length estimates with different techniques—foreign women sample.
Variables(1)
PPML
(2)
PPML
(3)
PPML
(4)
OLS
(5)
OLS Reset
(6)
OLS
Bootstrap
Weeks of pregnancy0.0411 ***
(2.901)
0.0428 ***
(2.887)
0.0344 **
(2.337)
0.561 **
(2.171)
0.902
(0.698)
0.561 **
(2.268)
Live births-−0.135
(−1.591)
−0.0924
(−1.061)
−1.304
(−1.238)
−2.009
(−0.679)
−1.304
(−1.229)
Miscarriages-−0.0965
(−0.753)
−0.0279
(−0.230)
−0.716
(−0.490)
−1.209
(−0.451)
−0.716
(−0.481)
VPI-0.504 **
(2.022)
0.469 *
(1.749)
9.046
(1.266)
14.97
(0.535)
9.046
(1.027)
General practitioner--−0.833
(−1.333)
−8.004 *
(−1.894)
−11.59
(−0.861)
−8.004 *
(−1.823)
Hospital specialist--−0.193
(−0.845)
−3.104
(−0.963)
−4.983
(−0.583)
−3.104
(−0.970)
Private specialist--0.391
(1.272)
6.891
(1.118)
11.44
(0.630)
6.891
(1.082)
Consultant specialist--0.161
(0.718)
2.848
(0.746)
4.707
(0.557)
2.848
(0.779)
NHS specialist--−0.927 ***
(−2.811)
−9.294 ***
(−3.013)
−13.49
(−0.733)
−9.294 ***
(−3.112)
Squares of estimated values----−0.0266
(−0.222)
-
Cubes of estimated values----0.000287
(0.162)
-
Constant1.982 ***
(7.598)
2.021 ***
(7.823)
2.251 ***
(7.701)
8.055 *
(1.840)
9.028
(1.141)
8.055 *
(1.951)
No. obs.321321321321321321
R squared0.0250.0430.0810.0880.0890.088
Note: *** p < 0.001; ** p < 0.01; * p < 0.05.
Table 23. Clinical pathway length for the full sample and for not-EMA and foreign women samples.
Clinical PathwayFull
Sample
Not-EMA
Sample
Foreign Women Sample
Weeks of pregnancy0.0789
(0.608)
0.138
(0.736)
0.116
(0.421)
Foreign1.013
(0.886)
1.547
(0.778)
-
Live births−1.175 ***
(−3.385)
−2.783 ***
(−3.314)
−1.439
(−1.529)
Miscarriages0.0936
(0.226)
0.0697
(0.0564)
-
Voluntary pregnancy interruptions1.586
(0.703)
2.836
(0.846)
−0.977
(−0.571)
General practitioner0.702
(0.946)
0.0644
(0.0202)
7.091
(1.135)
Hospital specialist1.270
(1.605)
3.271 **
(2.042)
−0.945
(−0.208)
Private specialist3.267 **
(2.304)
6.046 **
(2.537)
−2.667
(−0.974)
Consultant specialist2.203 **
(2.104)
4.285 **
(2.005)
6.244
(1.424)
NHS specialist1.202
(0.973)
3.774
(1.061)
1.813
(0.462)
DB120.63 ***
(11.99)
19.04 ***
(8.357)
−3.199
(−1.400)
DB211.25 ***
(3.855)
9.807 ***
(2.626)
21.98 **
(2.373)
DB316.41 ***
(4.425)
15.06 ***
(3.613)
7.120
(0.582)
DB415.95 ***
(2.615)
14.36 **
(2.190)
19.55 *
(1.651)
DB56.135 **
(2.524)
4.507
(1.316)
15.91 *
(1.853)
DB61.383
(0.962)
−1.319
(−0.583)
6.205
(0.552)
DB70.765
(0.342)
0.423
(0.142)
−0.533
(−0.0548)
Maternal age−0.961
(−0.596)
-−0.869
(−0.0758)
Constant27.64 ***
(7.938)
26.18 ***
(6.859)
29.33 ***
(2.884)
Number of observations2119853321
R Squared0.4420.4610.474
Note: *** p < 0.001; ** p < 0.01; * p < 0.05.
Disclaimer/Publisher’s Note: The statements, opinions and data contained in all publications are solely those of the individual author(s) and contributor(s) and not of MDPI and/or the editor(s). MDPI and/or the editor(s) disclaim responsibility for any injury to people or property resulting from any ideas, methods, instructions or products referred to in the content.

