Article

Parkinson’s Disease Classification Framework Using Vocal Dynamics in Connected Speech

Department of Electrical Engineering, College of Engineering, University of South Florida, Tampa, FL 33620, USA
*
Authors to whom correspondence should be addressed.
Algorithms 2023, 16(11), 509; https://doi.org/10.3390/a16110509
Submission received: 15 September 2023 / Revised: 24 October 2023 / Accepted: 31 October 2023 / Published: 4 November 2023
(This article belongs to the Special Issue Machine Learning for Pattern Recognition)

Abstract

:
Parkinson’s disease (PD) classification through speech has been an advancing field of research because of its ease of acquisition and processing. The minimal infrastructure requirements of the system have also made it suitable for telemonitoring applications. Researchers have studied the effects of PD on speech from various perspectives using different speech tasks. Typical speech deficits due to PD include voice monotony (e.g., monopitch), breathy or rough quality, and articulatory errors. In connected speech, these symptoms are more emphatic, which is also the basis for speech assessment in popular rating scales used for PD, like the Unified Parkinson’s Disease Rating Scale (UPDRS) and Hoehn and Yahr (HY). The current study introduces an innovative framework that integrates pitch-synchronous segmentation and an optimized set of features to investigate and analyze continuous speech from both PD patients and healthy controls (HC). Comparison of the proposed framework against existing methods has shown its superiority in classification performance and mitigation of overfitting in machine learning models. A set of optimal classifiers with unbiased decision-making was identified after comparing several machine learning models. The outcomes yielded by the classifiers demonstrate that the framework effectively learns the intrinsic characteristics of PD from connected speech, which can potentially offer valuable assistance in clinical diagnosis.

1. Introduction

Approximately 7.5 million people all over the world are diagnosed with Parkinson’s disease (PD). Since its first description put forth by James Parkinson in 1817, PD has been a neurodegenerative disease that affects motor functioning [1]. With a prevalence of 572 per 100,000 individuals in North America, is the second most common neurodegenerative disorder caused by the degeneration and dysfunction of dopaminergic neurons in the substantia nigra [2]. A 2022 Parkinson’s Foundation-backed study revealed that nearly 90,000 people are diagnosed with PD in the U.S. each year [3]. Projections show that the number of people with PD (45 years) will rise to approximately 1,238,000 by 2030 [4]. PD is primarily characterized by motor symptoms like muscle weakness, rigidity, tremor, bradykinesia (slow movement) that includes hypomimia, movement variability, and freezing of gait, and nonmotor symptoms like olfactory dysfunction, anxiety, depression, cognitive deficits, dementia, sleep disorders, and even melanoma [5]. The onset age ranges anywhere between 35 years and 60 years, and over 90% of people with PD are known to develop nonmotor manifestations [6]. However, the disease course and symptom manifestations are known to vary considerably from individual to individual. Such heterogeneity is also observed in response to levodopa medication. Many people with PD experience a drastic decrease in quality of life due to the substantial degeneration of dopaminergic neurons [7,8].
For over twenty-five years, clinical diagnosis of this highly heterogeneous disease has seen little improvement in terms of accuracy. Before the late 1980s, formal diagnostic criteria for this illness were nonexistent. Today, clinicians rely heavily on the Movement Disorder Society-Sponsored Revision of the Unified Parkinson’s Disease Rating Scale (MDS-UPDRS) and the Hoehn and Yahr (HY) rating scales to evaluate various aspects and primary motor symptoms in patients’ daily lives. However, these subjective ratings can result in incorrect diagnoses due to atypical Parkinsonian conditions, essential tremors, and other dementias [9], which is why research in Parkinson’s primarily focuses on disease detection, symptom research, and sustaining people’s quality of life.
Reports indicate that the onset of prodromal Parkinson’s disease is a slow and gradual process, lasting from three to fifteen years [10]. Consequently, the motor effects of the condition are often too subtle to be evident, making it difficult to diagnose. One of the most frequent and early manifestations of PD is speech impairment, which is experienced by approximately 90% of people living with the disorder [10,11,12,13]. Speech in people with PD is subject to several vocal impairments, such as tremors, lowered loudness, pitch alteration, hoarseness, imprecise articulation, delayed onset time, and decreased intelligibility [14,15,16]. These factors have provided researchers with an array of opportunities to conduct in-depth studies on the subject using signal processing and machine learning. As a method of day-to-day patient assessment, speech recording is an effective and non-invasive tool since it is fast, affordable, and generates objective data.
Over the past decade, speech research for PD has garnered increasing interest within the research community. Numerous studies have analyzed speech samples from individuals with PD and healthy controls (HC) to conduct classification and monitoring investigations. These studies can be broadly categorized into those based on ratings provided by trained listeners according to their perception [17,18,19,20,21,22], acoustic analysis [23,24,25,26,27], and/or computational methods involving mathematical modeling with signal processing and machine learning techniques [28,29,30,31,32,33,34]. Computational methods employ distinct sets of acoustic features extracted from various speech samples or tasks. The choice of speech stimuli and the specific features extracted from them depend on the research question and the type of speech impairment (phonatory or articulatory) targeted for classification.
Three types of speech tasks are commonly employed to elicit the effects of PD. These tasks include sustained vowel phonations, diadochokinetic (DDK; repetition of syllables), and connected speech (word/sentence/paragraph readings, monologues, etc.) tasks. Studies using sustained vowel phonations [32,35,36,37] focus on regularities or irregularities in phonation to train efficient classification models. Sustained phonations are relatively easy to analyze and do not suffer from language or accent barriers other than connected speech. However, researchers have reported the higher suitability of connected speech over sustained phonations to study pathological speech [38,39] due to their closeness to everyday speech. Although the DDK task is speech-like, it is less natural, and research consensus is mixed on the effectiveness of DDK in PD classification. Some studies have shown no significant differences between PD and HC groups [40], and other more recent studies have shown that people with PD have lower DDK rates than healthy speakers [41].
The individual diversities in cognitive processing behind speech production reflect misread texts, variations in pause durations, and other such manifestations. These manifestations make connected speech more complicated for analysis because it often requires manual corrections to maintain consistency in the data, which is essential for unbiased classification experiments. Hence, fewer research studies like [28] aim to automate PD classification/monitoring using connected speech. Rusz et al. showed significant progress in utilizing connected speech for automatic PD classification [42,43]. They used multiple types of speech tasks and observed that features extracted from monologue (connected speech) were sensitive enough and tasks like sustained phonations and DDK were not optimal to capture impairments due to prodromal PD. Studies like [44,45,46] used passage reading tasks to evaluate continuous speech and observe the variability between PD and HC using temporal and spectral features. Skodda et al. focused on specific vowel sounds and observed reductions in vowel space in PD speech [47]. In another study [48], various speech features, including NHR, fundamental frequency, relative shimmer, and jitters, were evaluated and compared. Lower values for these features are considered desirable for good speech signal quality. Additionally, the study explored the variants of vowel space area (triangular VSA—tVSA and quadrilateral VSA—qVSA), and FCR (Formant Centralization Ratio), which are indicators of potential dysarthria-related conditions that could lead to compression in VSA.
Furthermore, some recent studies [49] have discussed the application of different automatic speech recognition (ASR) services (such as Amazon, Google, and IBM) to differentiate between healthy controls and PD patients. Nonlinear mixed effects models (nLMEM) accounted for the unequal variance between healthy controls and individuals with speech disorders.
In recent years, there has been a notable shift towards utilizing deep learning models for speech processing in PD classification. Convolutional neural networks (CNNs) and recurrent neural networks (RNNs) [50,51,52,53] have gained prominence in detecting and classifying PD based on speech signals. These models have the capability to automatically extract features from speech signals [54,55] and learn to classify them based on underlying patterns within the data. However, it is essential to acknowledge that the use of deep learning techniques often has limitations that include data dependency, computationally intensive, lack of interpretability, and high training time. The positive aspect is that these opportunities provide us with a range of future prospects.
In our previous study [56], a novel classification protocol that deviates from the conventional process primarily in terms of signal segmentation was introduced. Syllabic-level feature variances were used instead of features themselves for training classifiers. The data used in that study consisted of three different word utterances repeated multiple times at various places in the paragraphs read by 40 different speakers.
Research on connected speech and sustained phonations has shown different strengths individually in capturing the effects of PD. In this study, a novel framework that draws on and combines these strengths of connected speech was developed and evaluated. The development and evaluation of this framework is a step toward establishing an efficient process that can be used to aid in diagnosis and telemonitoring applications. The proposed methodology closely follows the procedure adopted in our earlier study [56], with significant modifications. Here, different options for methodological steps representing the conventional and proposed frameworks were identified. The optimal choice for each step was identified through a comprehensive analysis. Features were extracted only from all the voiced segments in paragraph recordings collected from people with PD and HCs. A variety of classifiers were trained on the features themselves using hold-out validation. Through this approach, pitch-synchronous (PS) segmentation was proven to capture vocalic dynamics more efficiently, resulting in better and more reliable PD classification. To test the efficiency of the proposed framework, two separate datasets consisting of paragraph recordings in different languages were used, with each dataset being utilized in the training and testing phases individually. The features from our earlier study [56] were divided into two groups: mel-frequency cepstral coefficients (MFCCs) and pitch-synchronous features (PSFs), and they were compared. MFCCs have been widely used for speech recognition and speaker identification tasks. They have also been part of many studies aimed at PD classification and stood out as some of the best features yielding good performance [32,34,35,37,57]. The methodology adopted to evaluate the MFCCs for PD classification here has been designed to replicate these research works, where the results show a classification accuracy close to 90%. Most of these studies employ linear SVM kernels for classification, and we included the same in our classifier set. PSFs, designed to work with PS segmentation of voiced speech, had superior performance among the two feature groups.
In summary, the benefits of this study are as follows:
  • Efforts to establish an analytical framework that can be automated to classify between PD and HC using vocalic dynamics.
  • Providing evidence as to the robustness of the framework for the language being spoken.
  • Evaluation of PSFs for PD classification.
  • Providing evidence for the shortcomings of using MFCCs for PD classification due to their inherent nature of embedding patient identifiable information.

2. Dataset Description

This research utilized data from two different databases. The use of multiple databases helps verify the reproducibility of results and comprehend the effect of dataset size on classification performance. In this study, connected speech is evaluated using passages in Italian (Database 1) and English (Database 2) languages read by people with PD and healthy controls. The database descriptions are as follows:

2.1. Database 1

The first database was accessed from the IEEE DataPort [58], which is an Italian Parkinson’s voice and speech collected by Dimauro and Girardi for the assessment of speech intelligibility in PD using a speech-to-text system. It contains two phonetically balanced Italian passages read by 50 subjects: 28 PD (19 male and 9 female) and 22 HC (10 male and 12 female). The recordings were created at a sampling rate of 44.1 kHz with 16 bits/sample. The duration of each passage recording varied between 1 and 4 min, with a mean of 1.3 min. The recordings were performed in an echo-free room, with the distance between the speaker and microphone varying between 15 and 25 cm. According to the authors of [59], none of the patients reported speech or language disorders unrelated to their PD symptoms prior to their study and were receiving antiparkinsonian treatment. The HY scale ratings were <4 for all the patients except for two patients with stage 4 and 1 patient with stage 5. Only the passage reading speech task from this database was used for this study.

2.2. Database 2

Database 2 was selected from a larger database collected at the Movement Disorders Center, University of Florida [60]. It comprises speech tasks such as passage reading (“The Rainbow Passage”, Fairbanks, 1940) and sustained vowel phonations, though only the former was used in this study. This dataset is more balanced compared to Database 1 with 10 age and gender-matched data in both PD and HC groups. Recordings were taken with a Marantz portable recorder (Marantz America, LLC, Mahwah, NJ, USA) and stored digitally with a sampling rate of either 44.1 kHz or 22.05 kHz and 16 bits/sample. The duration of recordings from this database varied between 25 and 90 s, with a mean of 41 s. Despite the existence of two different sampling rates in Database 2, the procedure was not affected since the segmentation and feature extraction were designed to be robust and independent of the sampling frequency. Additionally, the sampling rates are not class-specific, i.e., both HC and PD classes consist of data that have both sampling frequencies. The institutional review board approved all test procedures at the University of Florida, and testing was completed following an informed consent process.

3. Materials and Methods

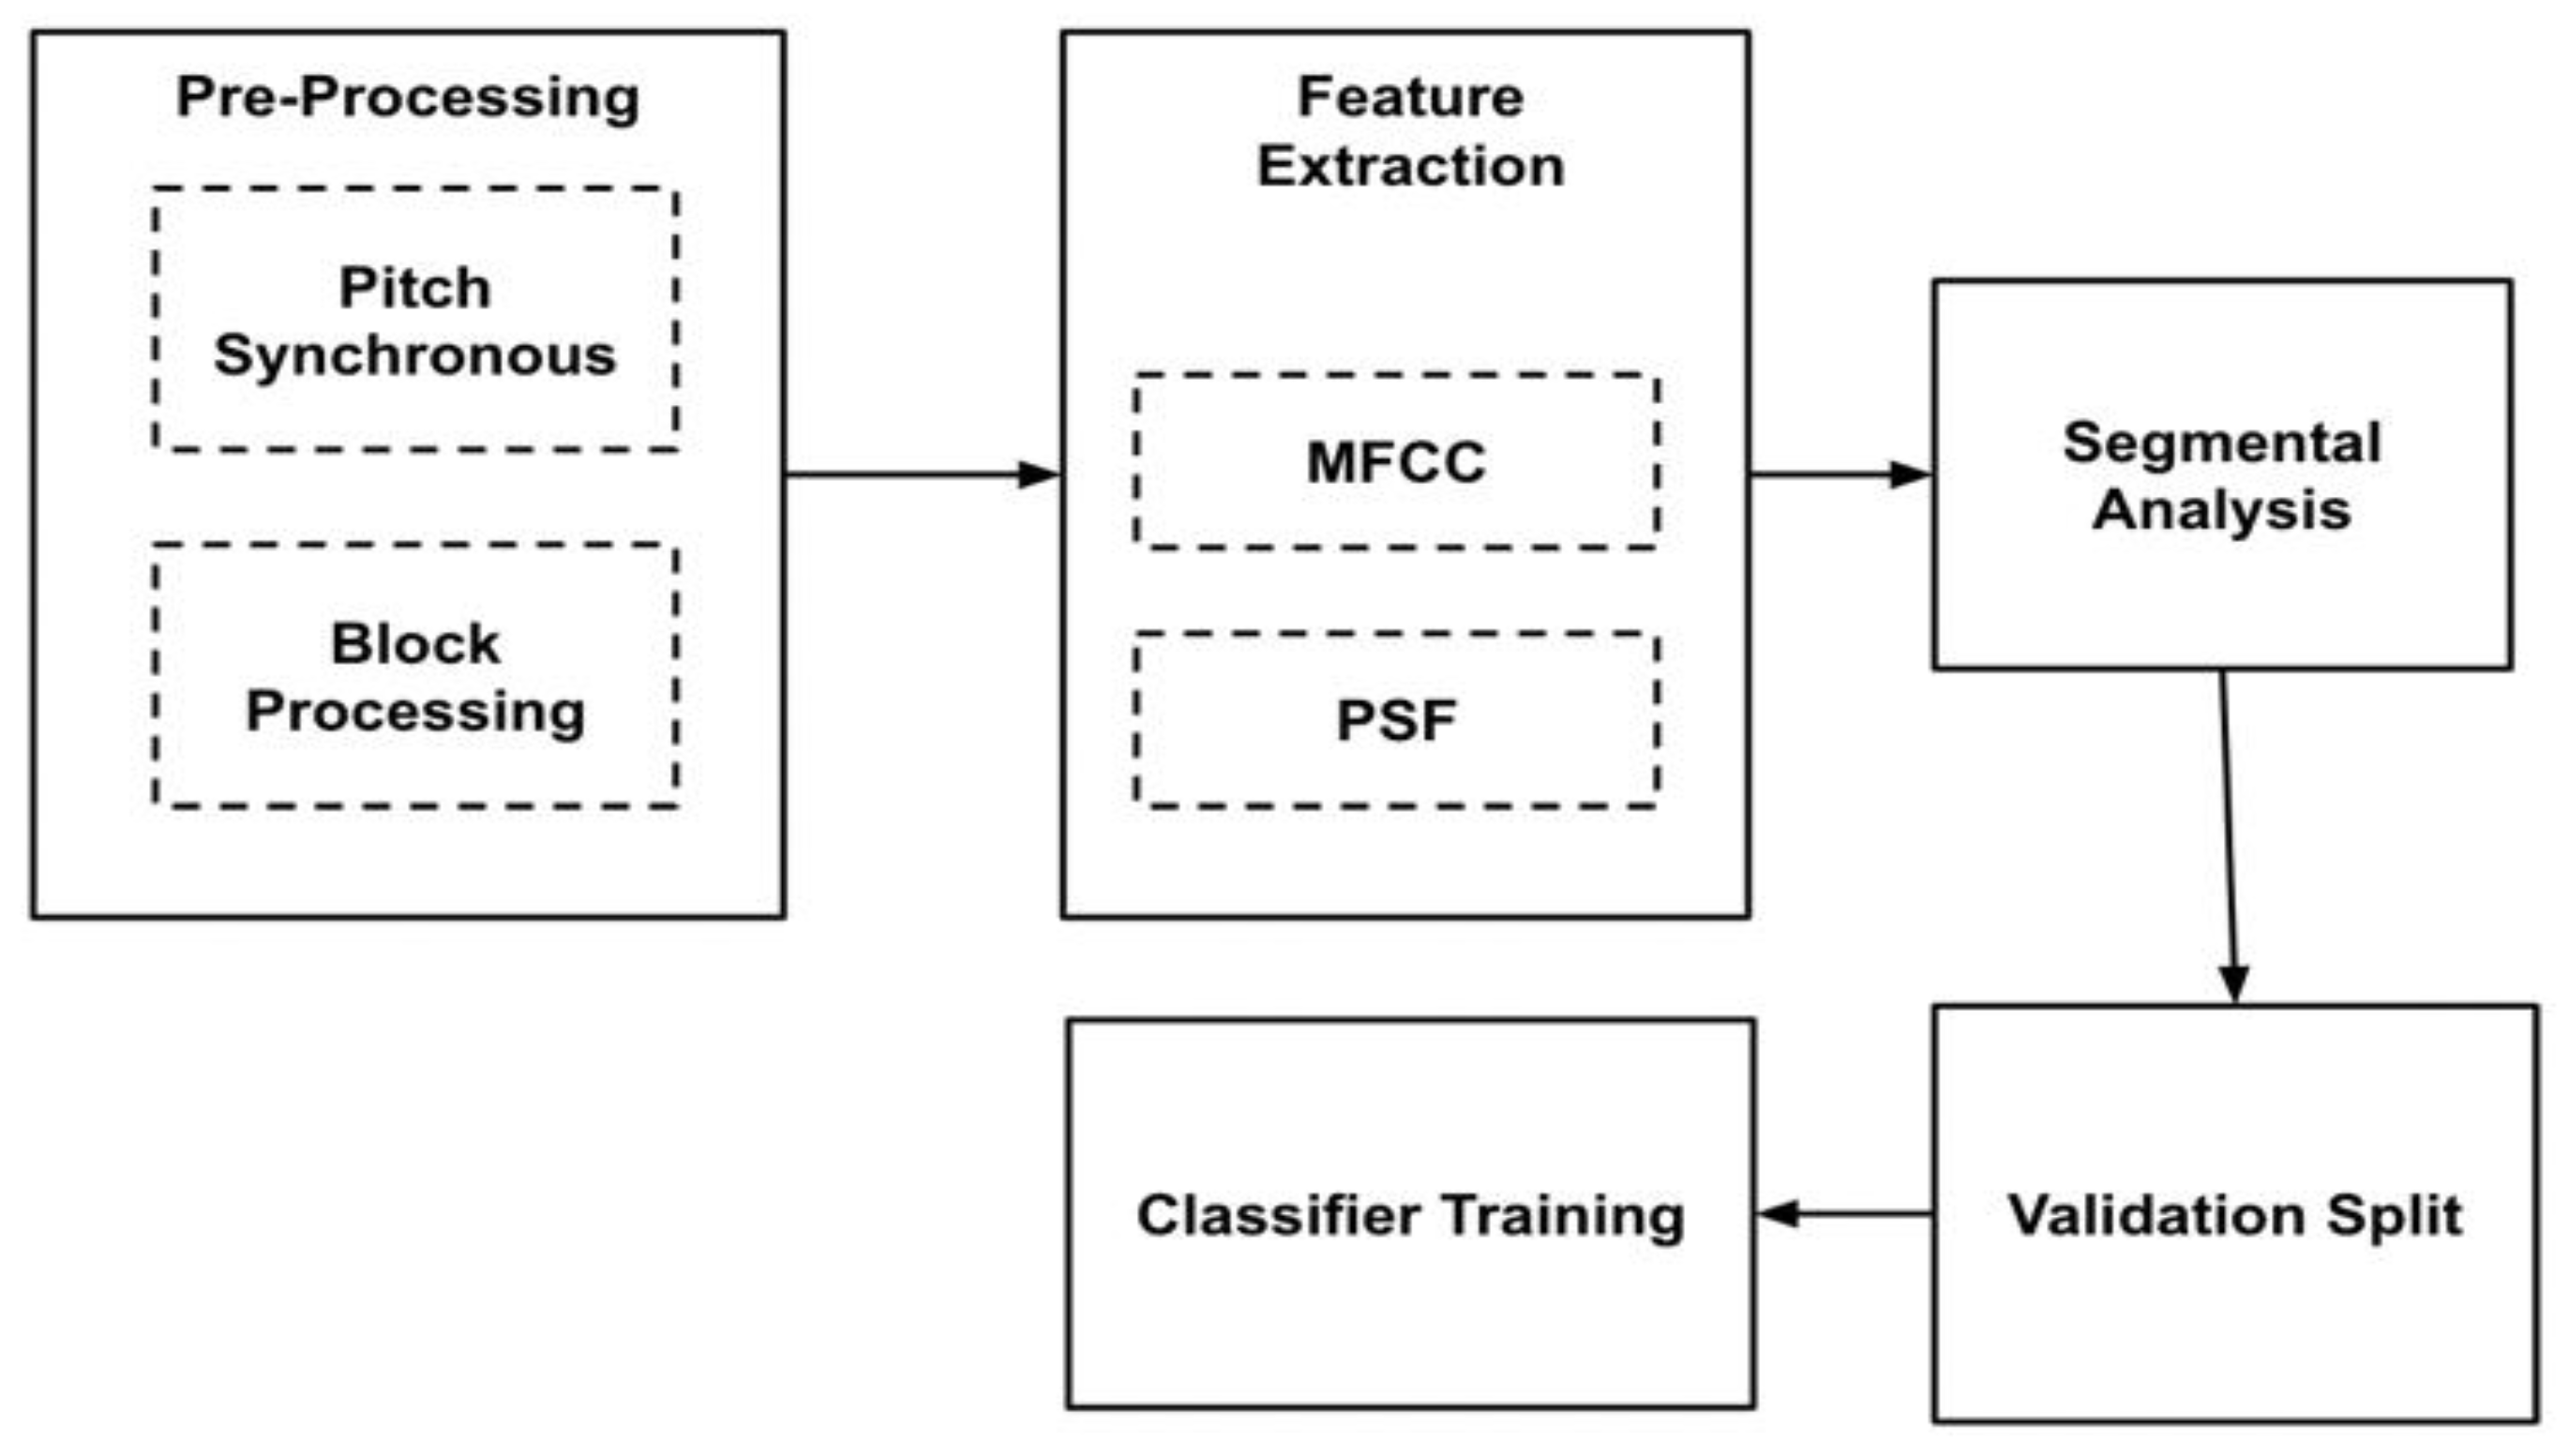
3.1. Methodology Block Description

The experimental methodology was conducted to assess the different alternatives identified for each block depicted in Figure 1. The final framework remains unchanged from the methodology block diagram, considering only the optimal choices identified from the results for each block.
The methodology blocks, along with the different choices, are explained as follows:

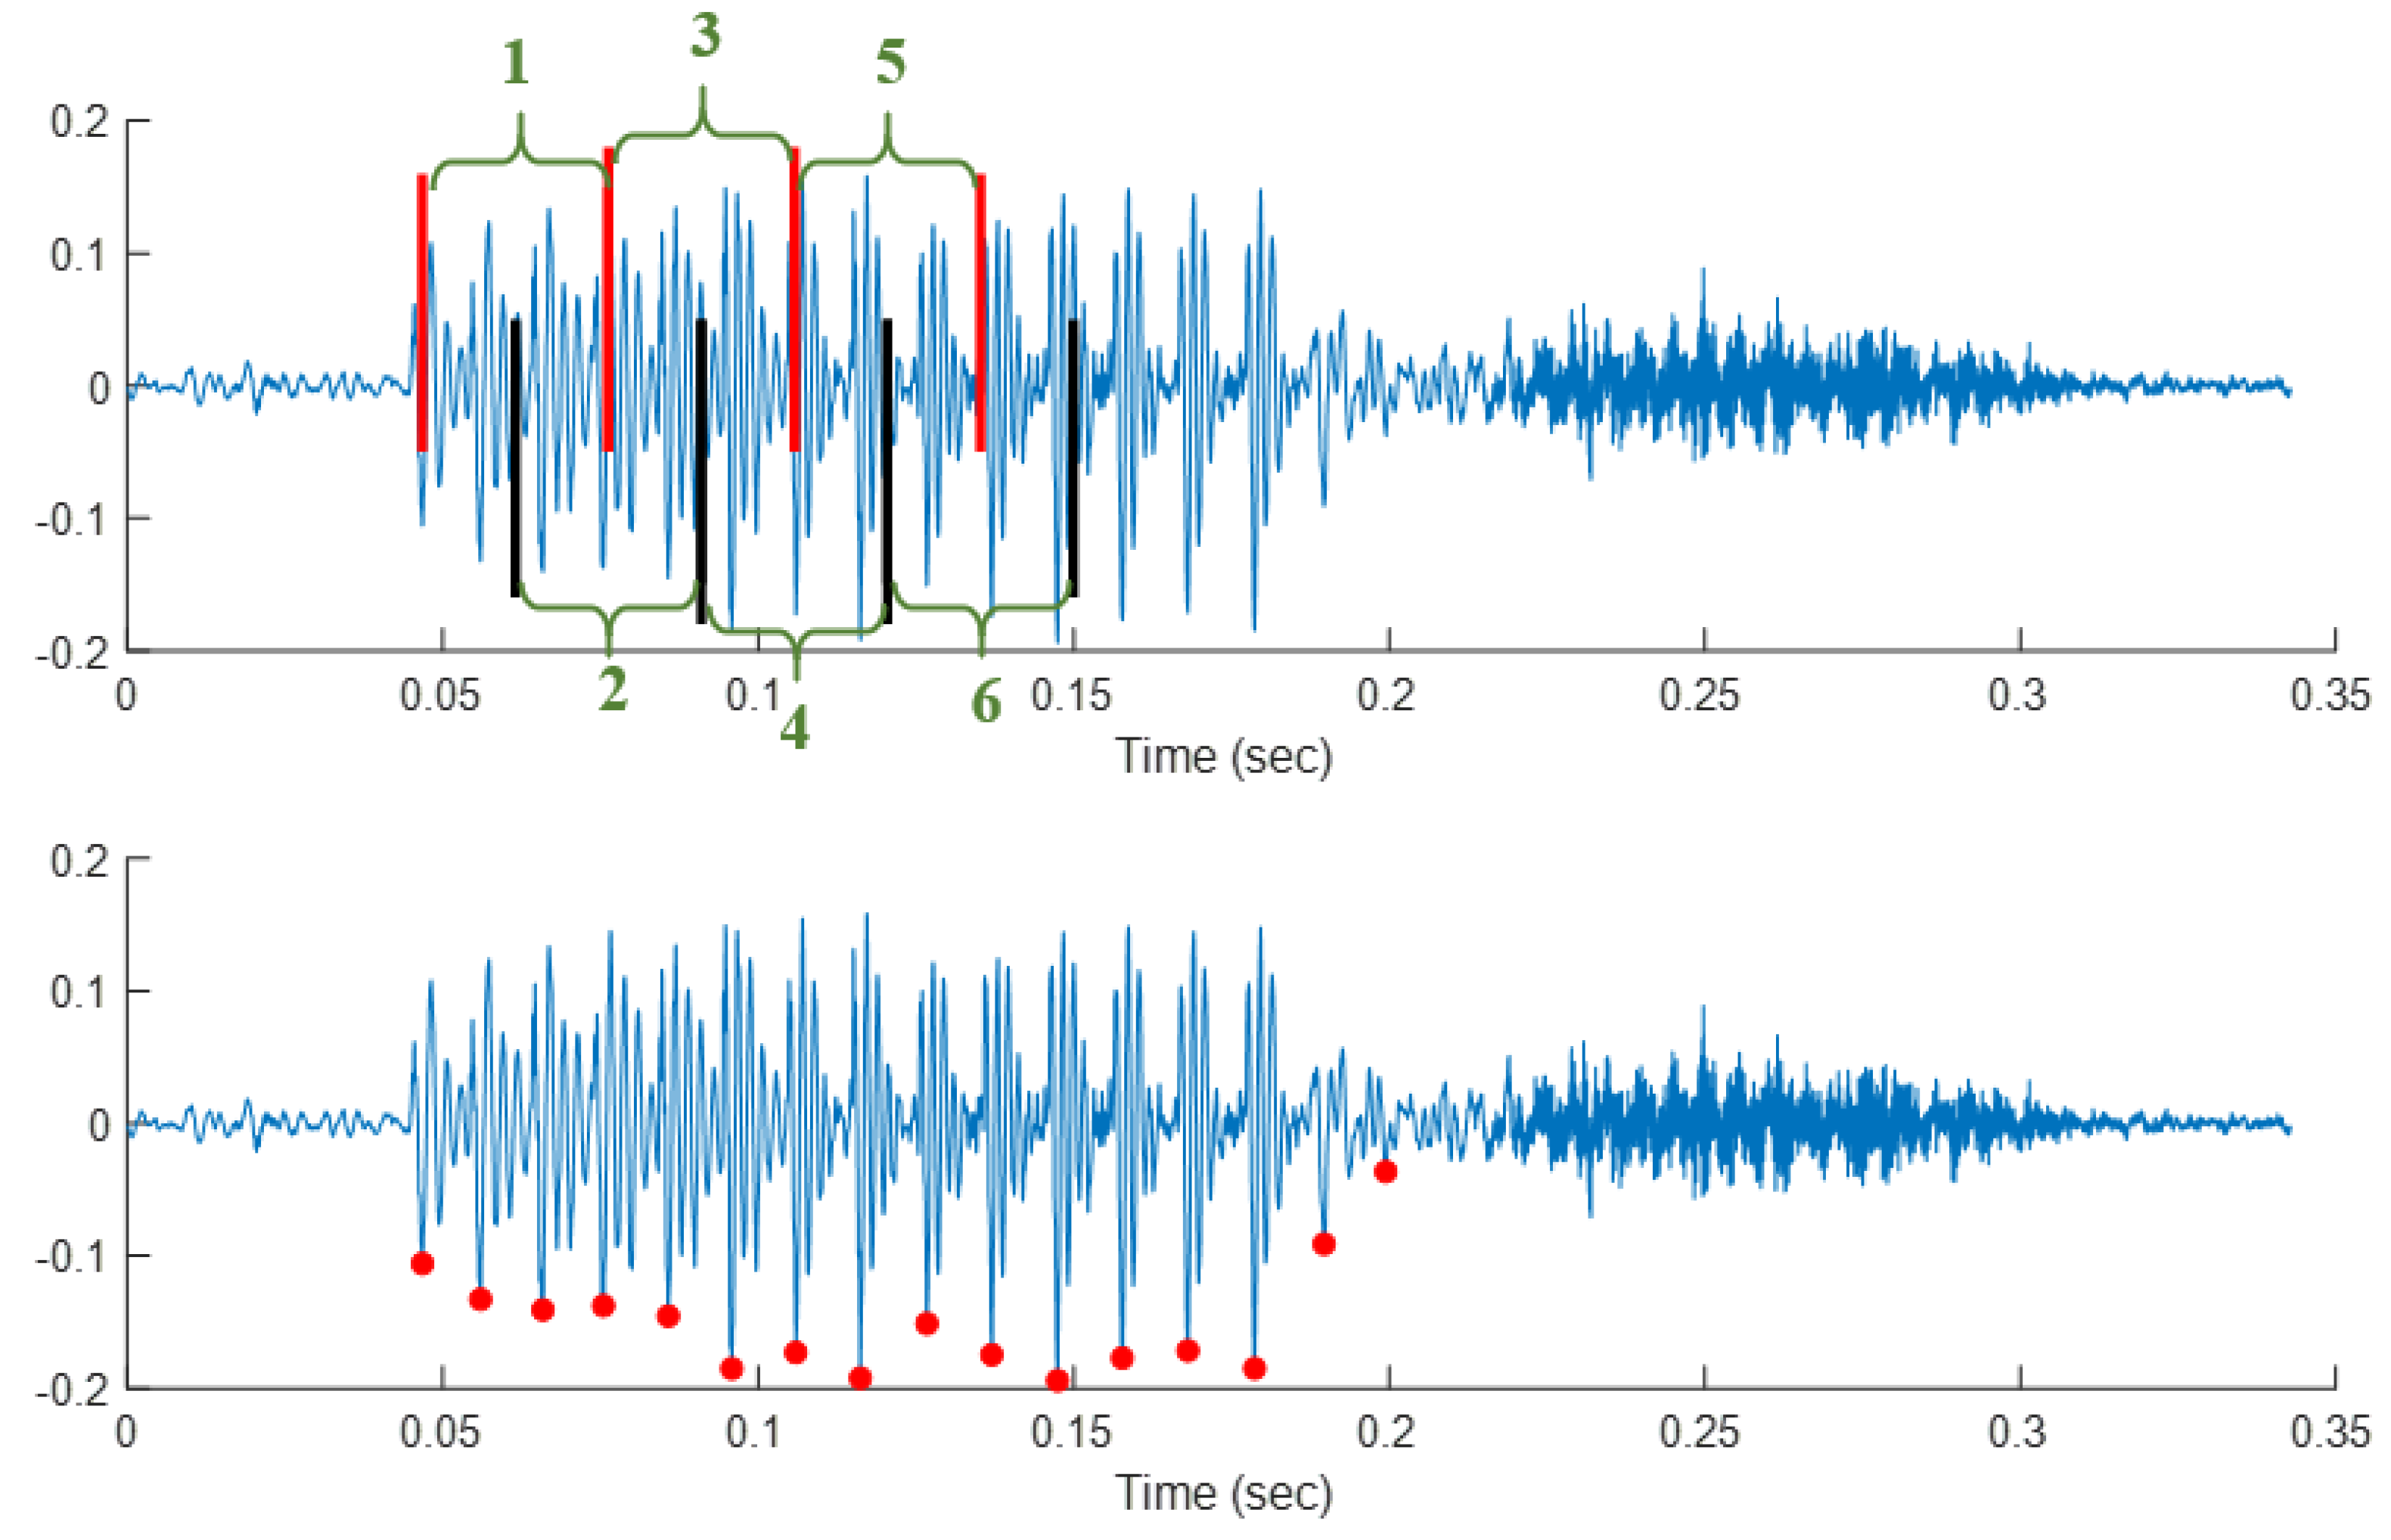
3.1.1. Preprocessing: Block Processing and Pitch Synchronous Segmentation

After categorizing voiced and unvoiced portions from the speech signals, super-segments were recognized as the voiced components surrounded by unvoiced/silent portions on both sides. These super-segments are subsequently segmented into blocks or pitch-synchronous segments. Typical speech analysis follows a block processing approach where the block size can vary between 20 and 50 ms, depending on the application. These blocks are known to retain the necessary statistical stationarity in the data. In pitch-synchronous (PS) segmentation, the pitch cycles in voiced portions of speech are segmented out and processed.
Figure 2 shows a speech sample segmented using block processing (top) with a 25 ms window size and 50% overlap. The red vertical lines show the window edges for the first, third, and fifth windows, and the black lines show the same for the second, fourth, and sixth windows. The 50% overlap can be seen between red windows and black windows. In PS segmentation (bottom), the length of each segment is correlated with the fundamental frequency of the speaker and intonational variations and thus can vary from cycle to cycle. The PS segmentation was executed through an automated algorithm that detects voiced sections and subsequently segments them in accordance with the pitch-synchronous method outlined in [61].
In Database 1, a total of 378,000 pitch-synchronous cycles were identified, whereas in Database 2, approximately 87,000 pitch-synchronous segments were extracted. In Database 1, a total of 12,600 super segments were picked out. From each paragraph reading an average of 134 ± 24 super-segments have been identified. Each super segment contained an average of 30 cycles, with a standard deviation of 27 cycles. In Database 2, a total of 1357 super-segments were extracted, with an average of 68 ± 20 super segments per paragraph. Each super segment contained an average of 64 ± 58 cycles.

3.1.2. Feature Extraction: MFCCs and PSFs

MFCCs and custom-designed PSFs are used in this study. MFCCs are widely utilized features in speaker recognition applications due to their effectiveness. In this study, 15 MFCCs were extracted from each speech segment and used for classification. A set of 15 PSFs was extracted from each PS segment in voiced portions of the recordings. These features were explained in our previous work [56]. Table 1 provides the feature names along with the corresponding number of elements obtained from each feature. Since the speech samples underwent two distinct segmentation methods, MFCCs were separately extracted for each segmentation type. However, PSFs were exclusively extracted using the PS segmentation protocol. These features target cycle-to-cycle perturbations, which cannot be adequately captured by traditional measures like jitter and shimmer.
Moreover, PSFs emphasize a wide range of attributes in both the time and frequency domains, enabling them to capture perturbations in both the vocal cords and the vocal tract. This comprehensive approach contributes to their effectiveness in the classification process.

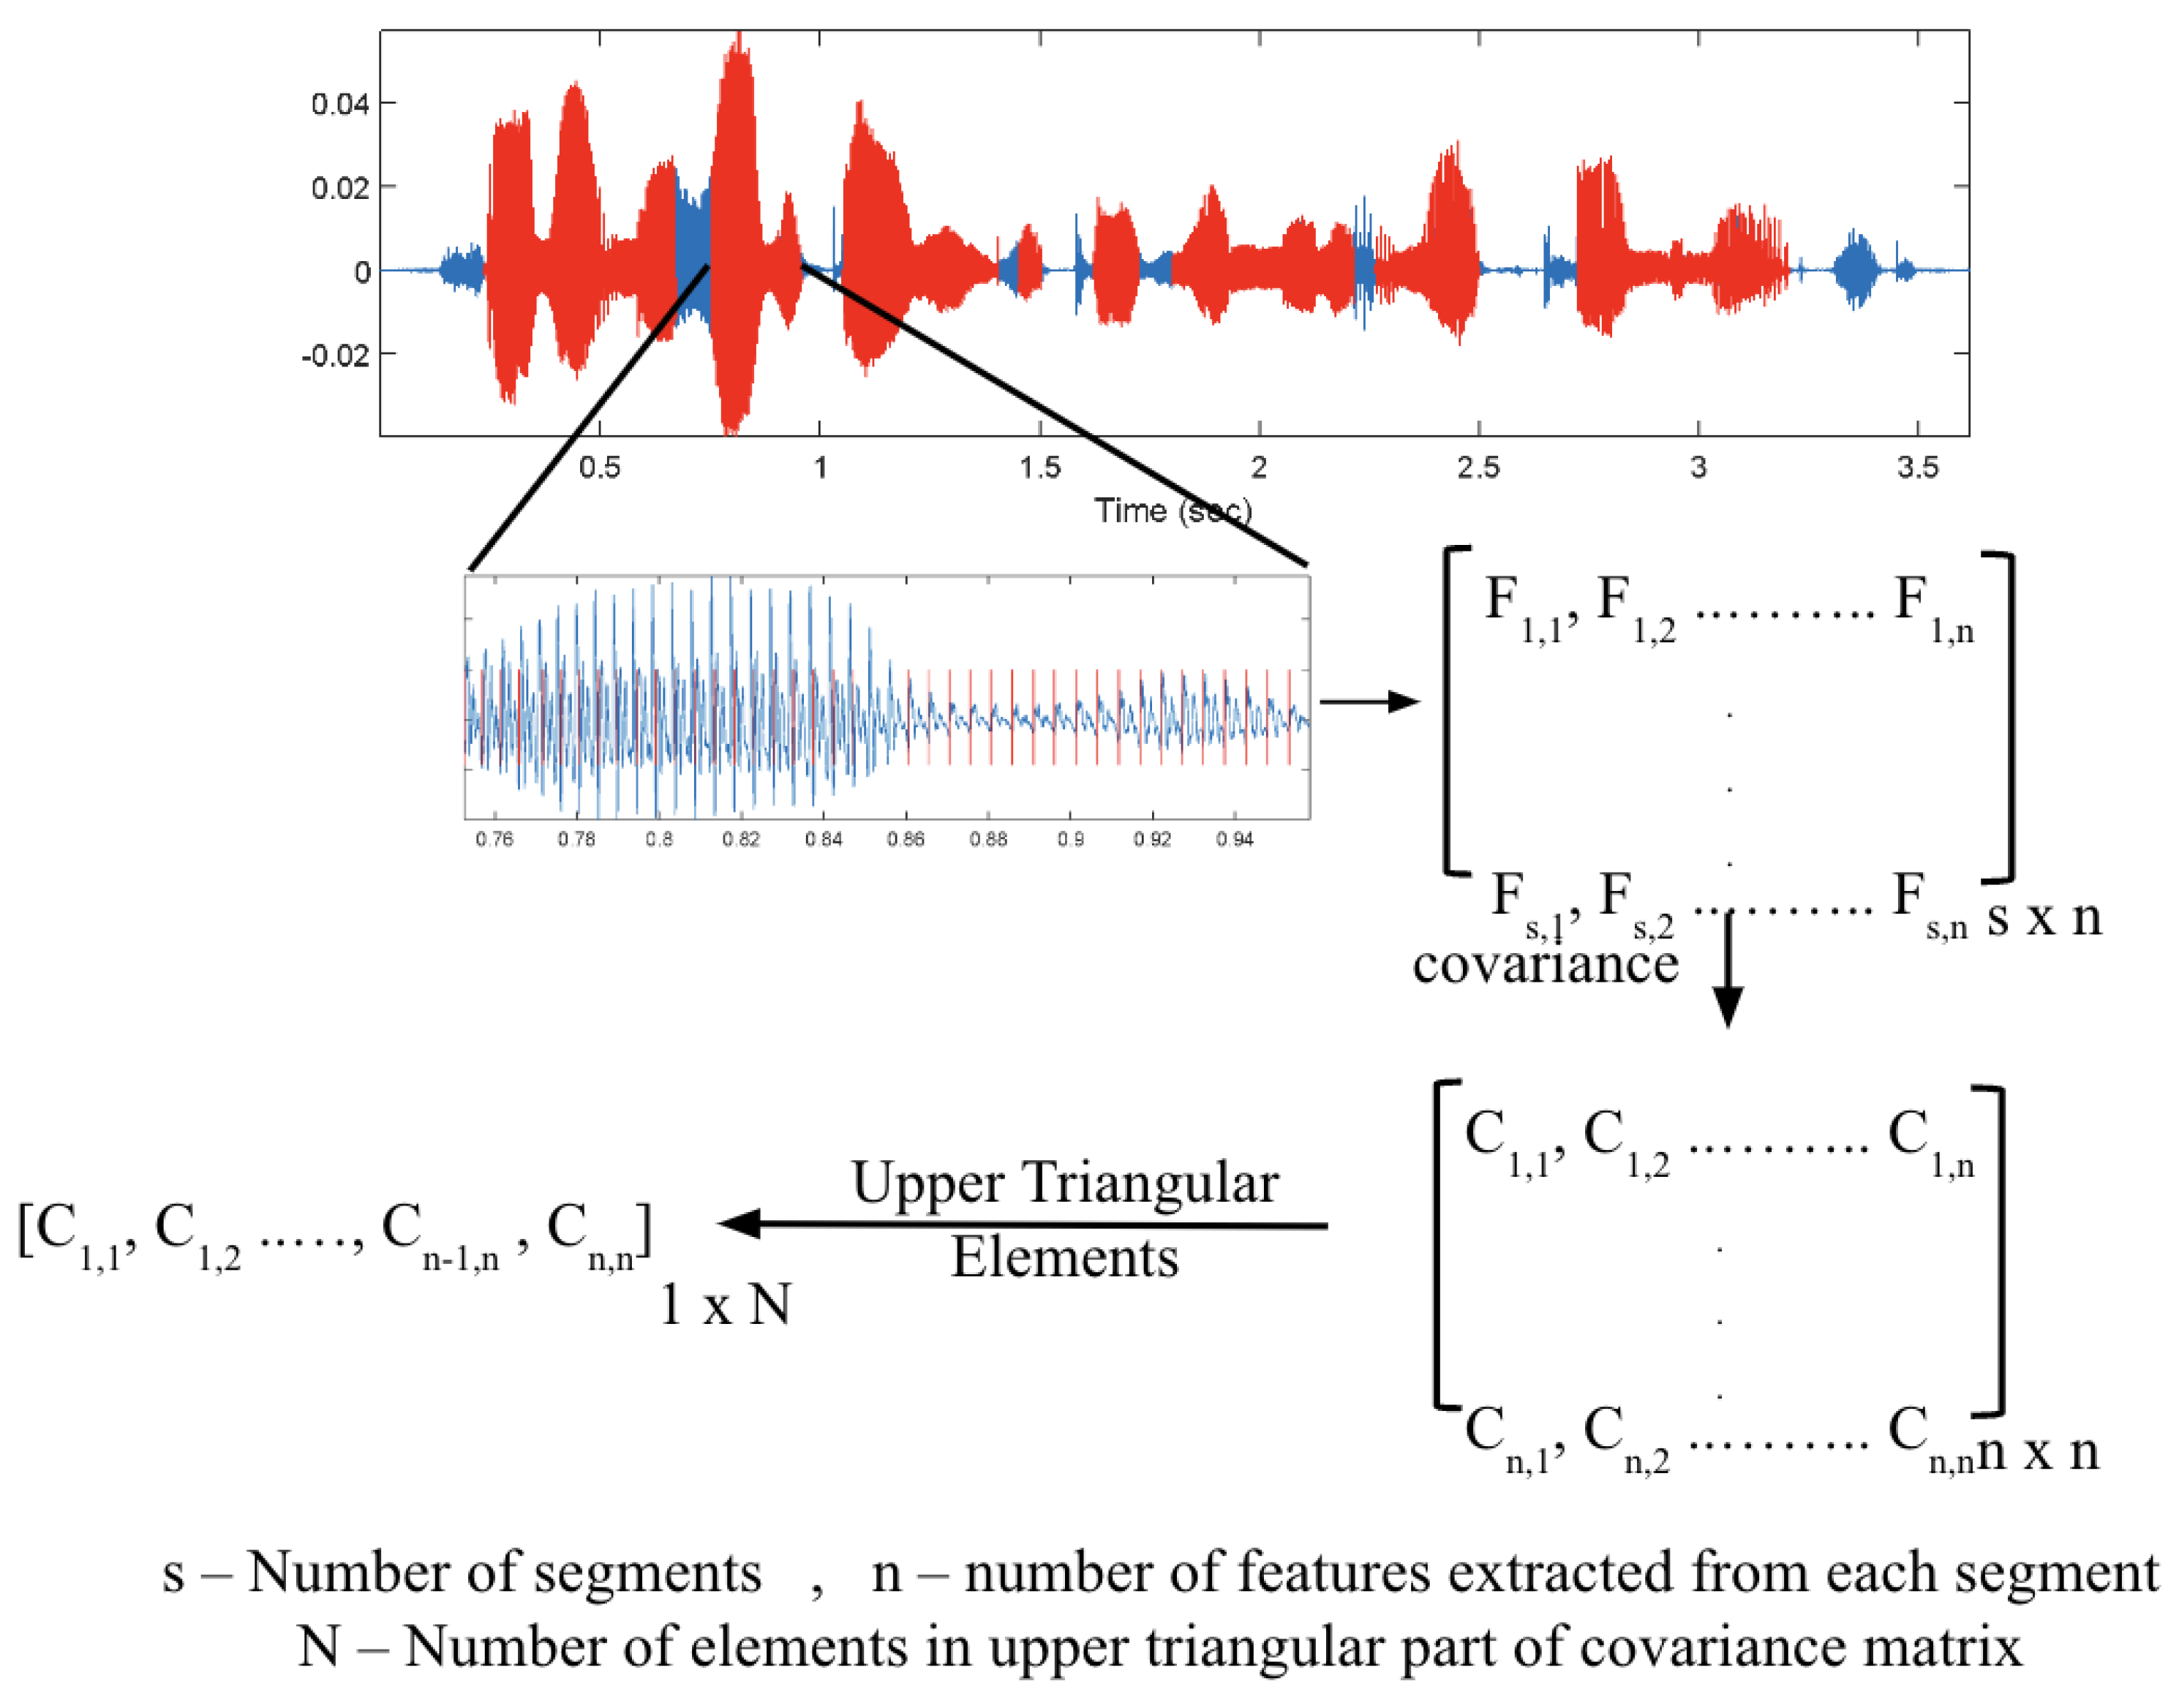
3.1.3. Feature Preparation

In segmental analysis, the features extracted from each speech segment (block processing or PS) were treated as individual data points while training the classifiers. The available samples (feature vectors) were randomized and divided into training and testing sets. For PSFs, each feature vector except Quarter Segment Energy and Quarter Band Magnitude is transformed using min-max normalization at a super segment level to maintain consistency in their scales. As those two features contain four values, they are normalized as a group, i.e., All four vectors were grouped together and then the min and max values across the group of four vectors were used as the min and max for the group for normalization. This normalization allows the maintenance of variability within the features while matching the scales across the super segments for each feature.

3.1.4. Validation Split: Hold-Out

It is common practice to randomize data and extract 80% of it for training and test the model performance on the remaining 20% in machine learning problems with each data point treated as unique and independent.
In this study, due to data imbalance, after creating the training and testing datasets, they were further reduced following a specific protocol that mitigates the class imbalances while preserving generalization. After performing the 80–20% split, ‘N’ random samples from each class (PD/HC) in the original training set were pooled to have a total of 2N samples in the training set. N was chosen to be equivalent to 50% of the minority class size in the initial train set. This protocol ensures that the train and test sets have no shared samples and that the class distributions remain similar. The selection of the 50% factor also ensured sufficient training samples.

3.1.5. Classifier Training

A total of 17 classifiers available in MATLAB were employed for conducting classification experiments in this study. It included variants of Trees, Support Vector Machines (SVMs), k-nearest Neighbors (KNNs), Ensemble learners, and logistic regression. All the classifiers were trained with 5-fold cross-validation. Using a collection of classifiers, the suitability of different classifiers for this application was evaluated with unbiased decision-making. The arrangement of all the classifiers into their respective groups can be observed in Figure 3. Notably, all the classifiers were utilized with their default hyperparameter settings, as provided by MATLAB’s Classification Learner Application.

3.2. Experimental Design

Classification experiments were targeted to systematically identify the optimal choice for each methodology block in Figure 1. This experimental process included various steps, focused on the identification of optimal choices for segmentation methods, feature sets, and analysis techniques, subsequently, evaluating the appropriateness of each classifier for each application.
Finally, the performance was assessed when the optimal classifier set was trained and tested using data from different databases while employing the optimal segmentation method and feature set.
Individual step descriptions and their goals are described below in detail.

3.2.1. Importance of Block Size in Conventional Block Processing

Identification of the right block size becomes imperative when PS segmentation must be compared against block processing. In this step, performances for the block sizes ranging from 20 to 50 ms with 5 ms increments and 50% overlap were tested using MFCCs under the Hold-Out validation protocol for both genders individually. Results from this step were used to pick an optimal candidate for block size. In subsequent steps, whenever block processing was compared against PS segmentation, results from using the optimal block size choice identified in this step were used.

3.2.2. Identification of Optimal Choice for Segmentation Method

A novel comparison technique was adopted in this step to identify the optimal choice for segmentation and analysis methods. This technique was designed to measure the efficiency of classifiers in learning the effects of PD rather than their ability to remember the speakers in each class. The process is twofold: first, classification performance was determined under regular circumstances, and then speakers were randomly assigned PD/HC labels, and classification experiments were repeated without making any other changes to the protocol. As the speakers were randomly labeled, a drop in classification performance was anticipated across all cases. Since the segmentation and analysis technique combined with the ability to remember speakers in each category, comparable results were expected regardless of the original and random PD/HC labels. Therefore, the magnitude of the performance reduction was likely to be lower for such combinations.
Relative   Reduction = O A R A O A × 100
where OA & RA are accuracies with original random labels.
The relative reduction in accuracy defined by the drop in performance was calculated as per the equation. The experiments involved utilizing MFCCs from Database1 separately for each gender, employing all available classifiers. In the case of experimental parameters favoring speaker identification over recognition of PD effects, comparable results were expected regardless of the original and random PD/HC labels. Therefore, the magnitude of the performance reduction was likely to be lower for such combinations.

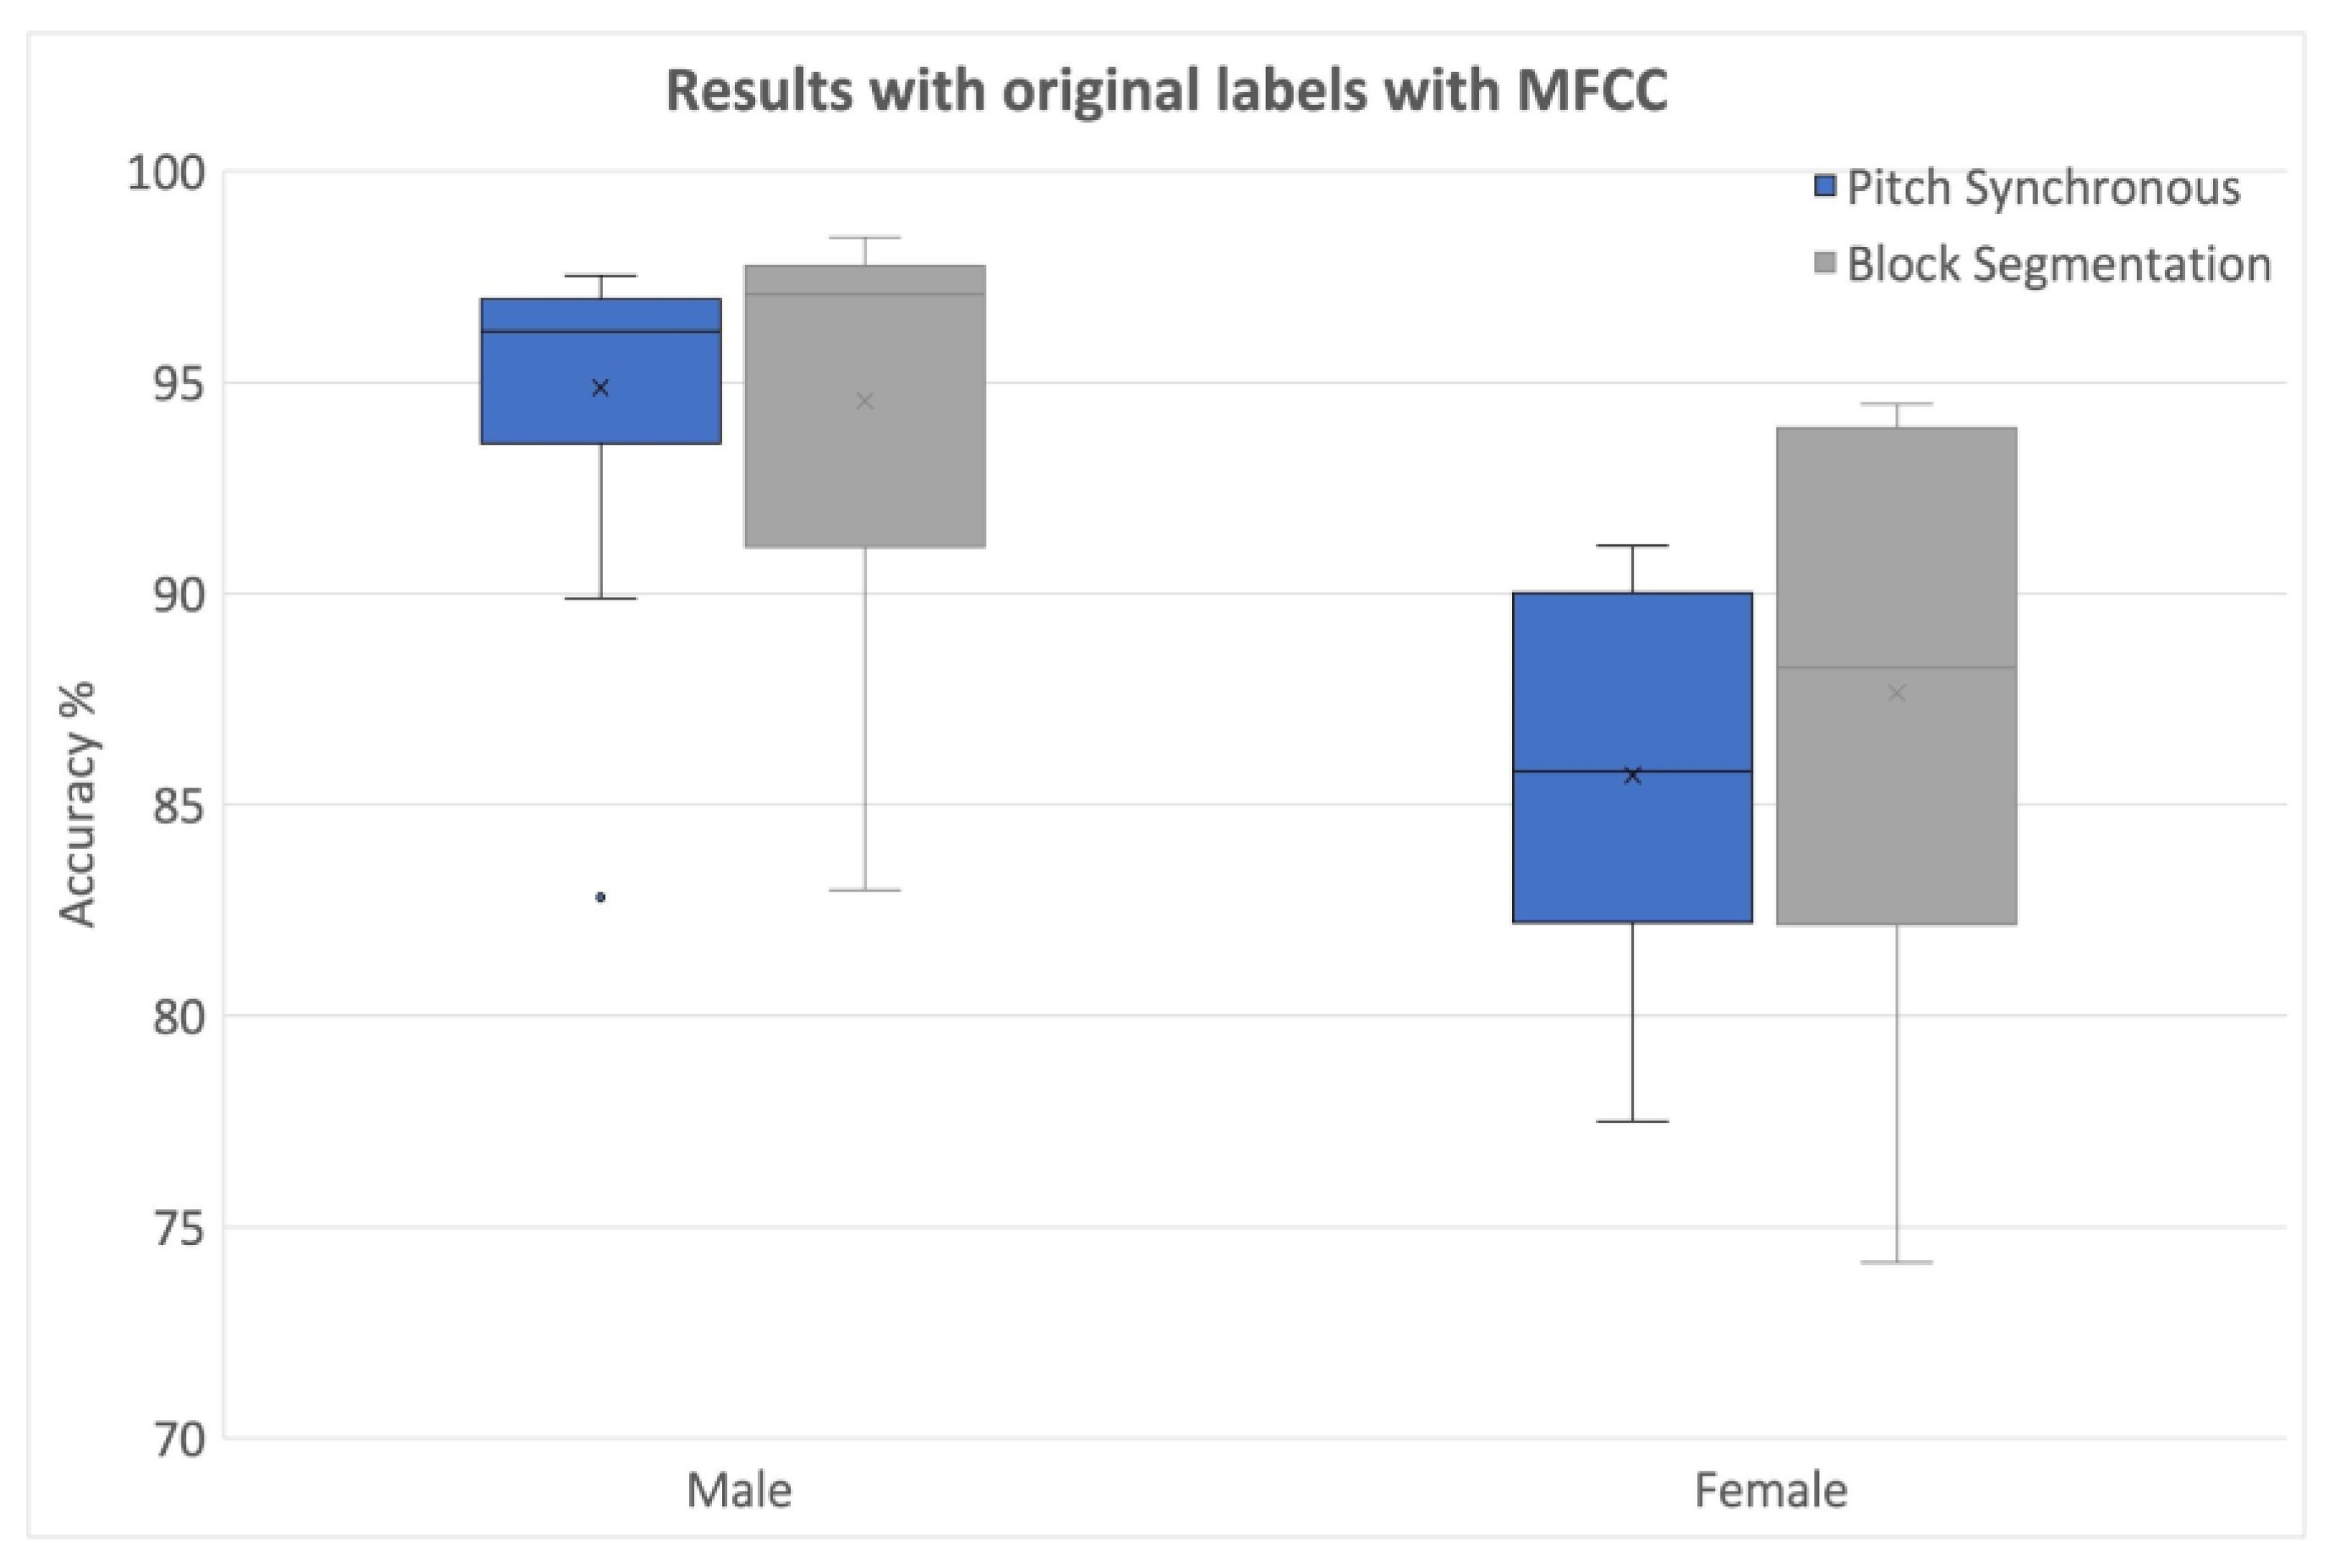
3.2.3. Identification of Optimal Choice for Feature Types

During this step, the selection between features MFCCs and PSFs, was made using the same protocol as in the previous step. The evaluation of feature combinations for each gender was carried out independently by assessing the relative reduction in classification accuracy resulting from random label assignment.

3.2.4. Evaluation of Classifiers

The 17 classifiers used for the experiments as listed in Figure 3, were evaluated for over-fitting by comparing the overfit factor and test accuracies. The overfit factor, calculated according to the given Equation (2), quantifies the relative difference between the training and testing accuracies. A higher overfit factor value indicates that the classifier performs well on the data seen during training but may be overfitting to that specific training data.
Overfit   factor = T r a i n   A c c T e s t   A c c T r a i n   A c c
The test accuracy with random label assignment serves as an indicator of the classifier’s tendency to memorize speakers more effectively than learning the patterns associated with PD. These two metrics, obtained from the results of experiments using the optimal choices determined in the previous steps, were utilized to identify, and eliminate classifiers that exhibited a significant inclination to overfitting.

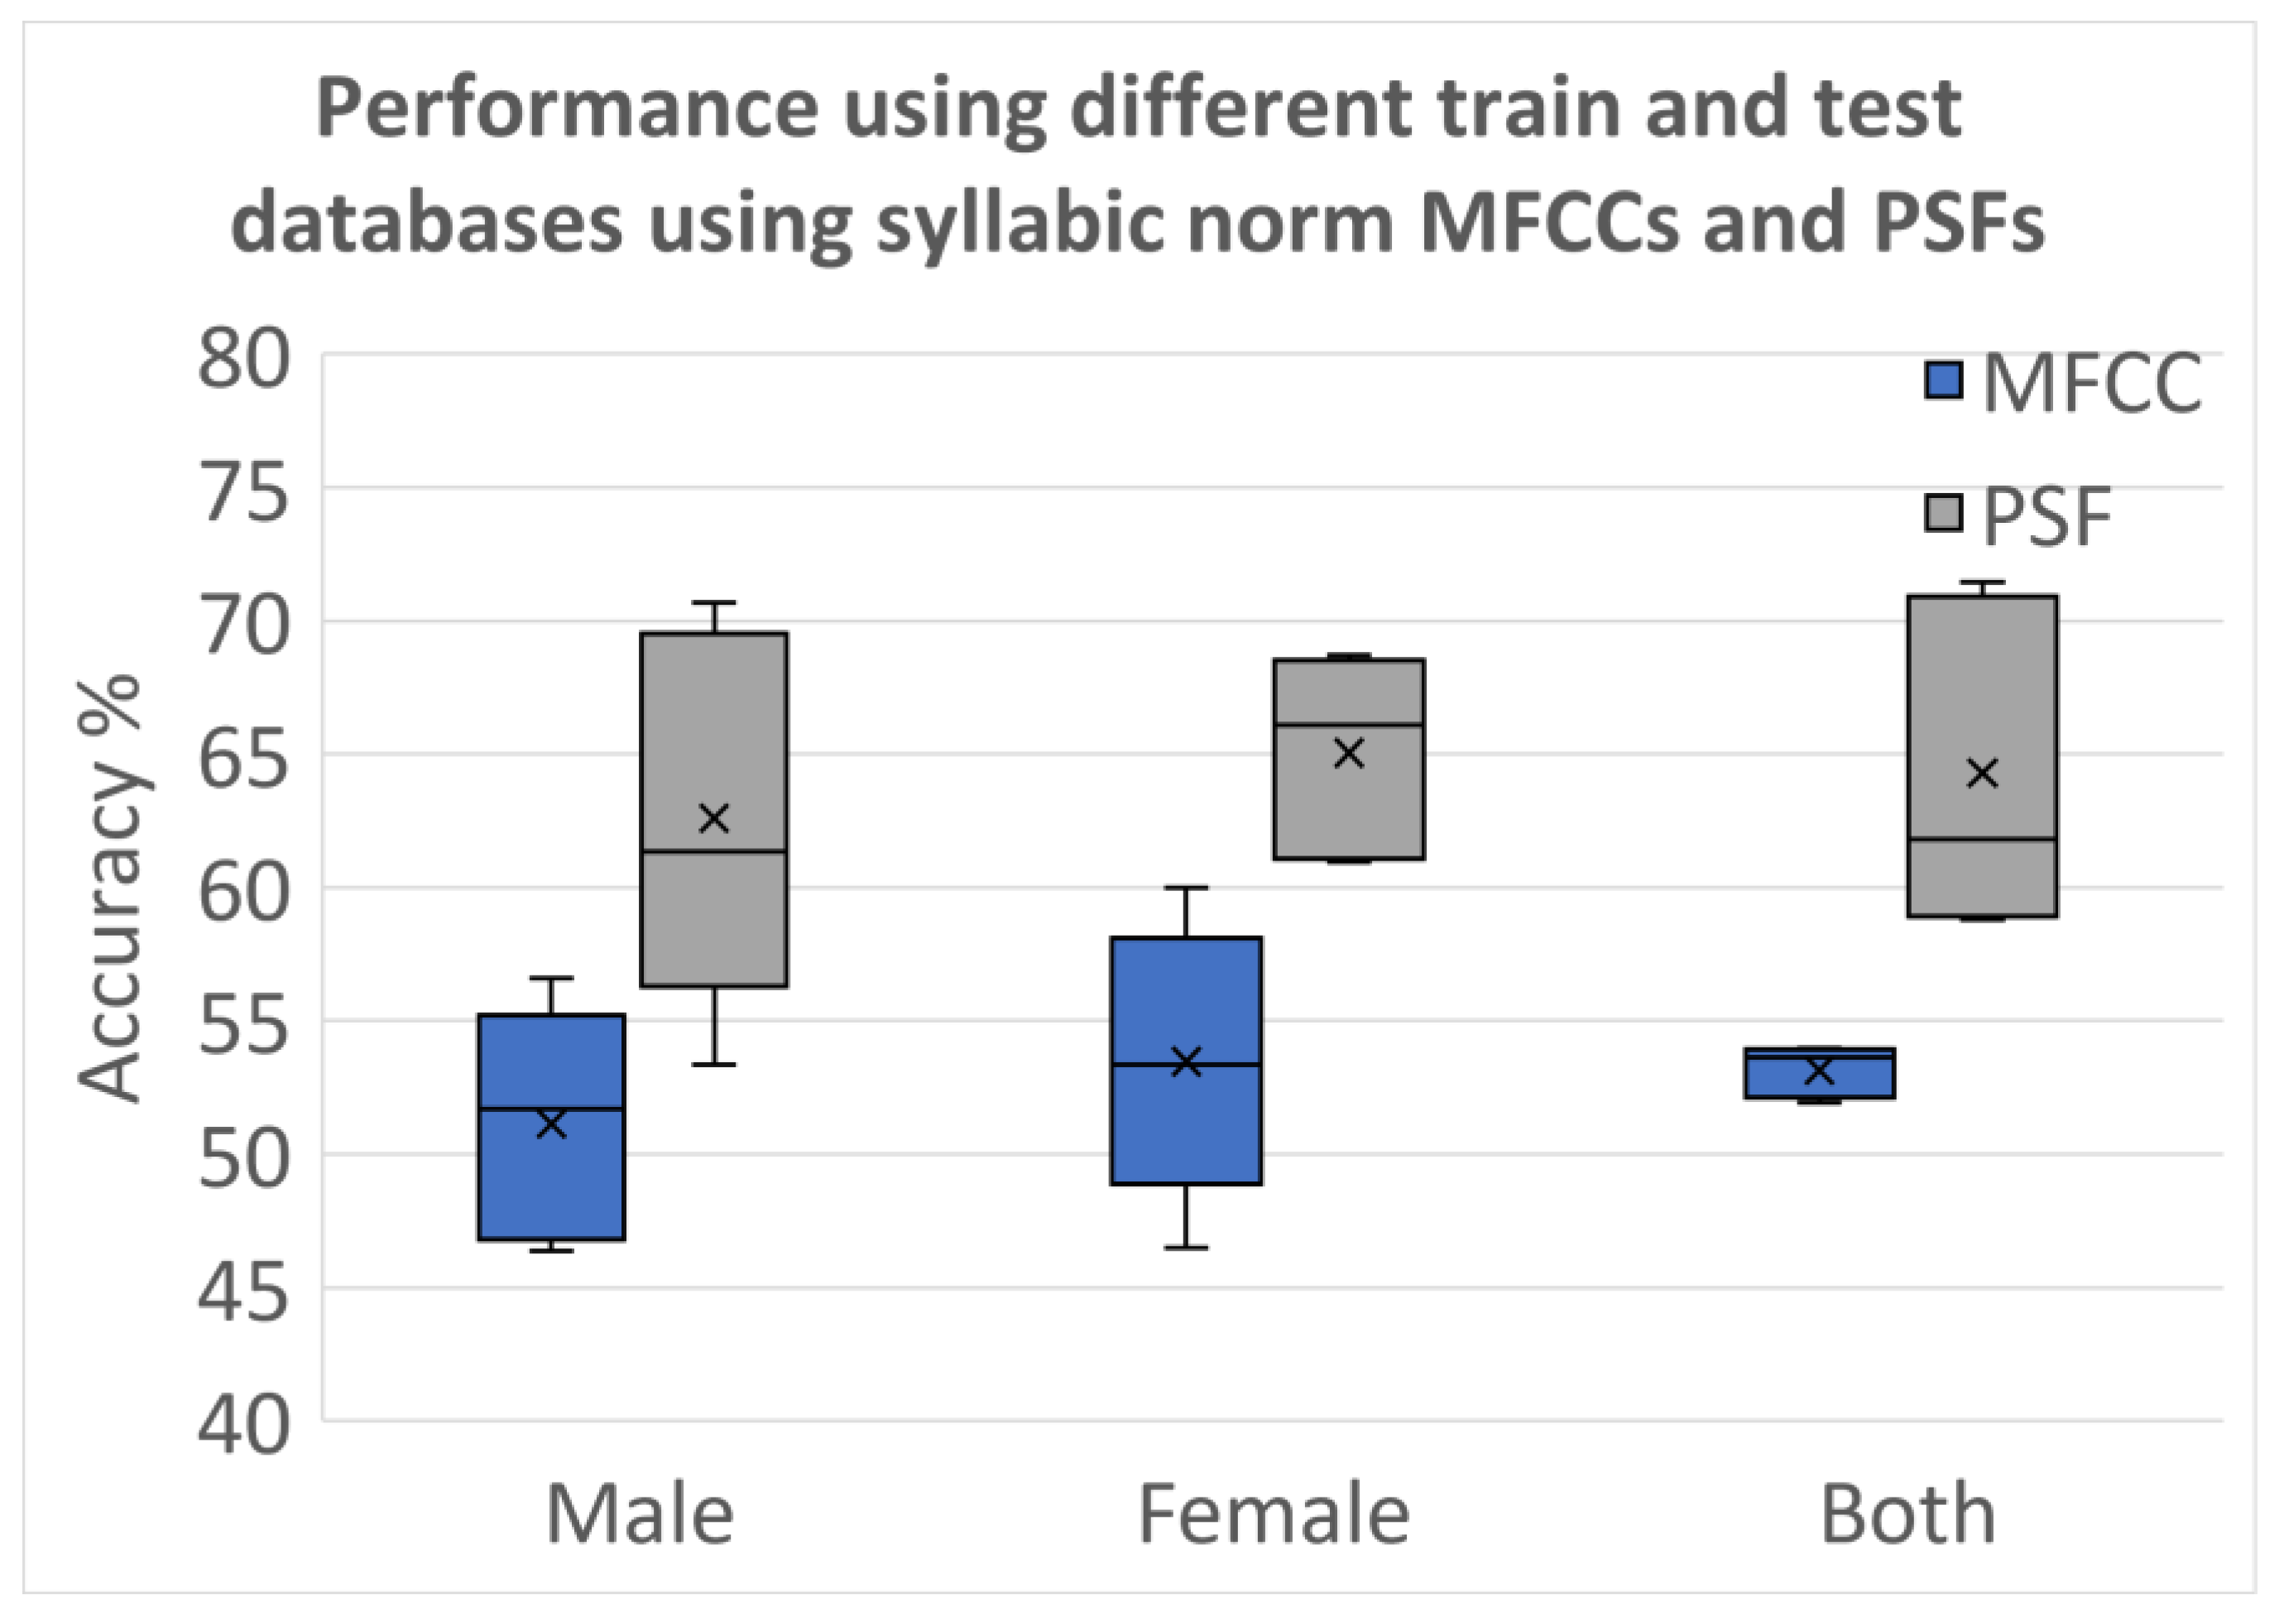
3.2.5. Testing Using Different Databases

The optimal feature choice and a reduced list of classifiers were selected for the final framework development. The efficacy of this framework was tested by training the classifiers on a larger dataset and testing them on a different dataset. The latter dataset, except for the speech task, differed in terms of speakers, language, and acquisition environment, ensuring a more comprehensive assessment of the classifiers’ performance and robustness. Furthermore, the influence of gender over the framework was examined by conducting replications of the experiment without any gender-based filters to the data. This allowed for a broader analysis of how the classifiers performed across both genders without any gender-specific constraints.
Owing to the variations in data acquisition conditions, such as differences in equipment and variations in speaker-to-microphone distances, the features extracted from different databases exhibited discrepancies in their numerical ranges. Normalization has been used to address these differences and maintain uniformity between the features from both databases before initiating the experimentation where training and testing were performed using different databases. z-scores with zero mean and unit standard deviation were extracted from feature data using Equation (3) and used for training and testing.
z i j = x i j μ i σ i
where, x-Feature value, i-Feature index, j-segment index, μ-Mean, and σ-Standard deviation.
In addition to the normalization, a syllabic analysis approach is designed to emphasize more of the perturbations. The features extracted were transformed into covariances at a super segment level to do this. In the speech data, super segments were identified as the voiced components bordered by unvoiced/silent portions on both ends as explained earlier. Features extracted from all segments within a super segment were grouped and covariances of these feature groups were used for training classifiers. Figure 4 shows the method adopted to extract these covariances. C1 to Cn represent the feature covariances and subsequently used feature vectors from each super segment.

4. Results and Discussion

In this section, results for each one of the five steps mentioned in the previous section were presented. As results contain classification accuracies from multiple classifiers, box plots were used to show their distribution.
MFCCs with block segmentation with various block sizes ranging from 10 ms to 40 ms were extracted and utilized for PD/HC classification. The result did not demonstrate any significant impact due to block sizes and for brevity, only results from a block size of 25 ms were used whenever block processing results were discussed to be investigated from hereon.
The results from PS and block processing (25 ms block size, 50% overlap) with original labels and randomly assigned labels along with their relative differences were used. The outcomes from MFCCs using block and PS segmentations for both genders in Database 1 using holdout validation are provided in Figure 5. It was observed that both segmentation methods performed similarly across all genders.
These results indicated that except for females with block processing, the PS segmentation led to comparable or even greater degradation in all other cases. Notably, some of the classifiers exhibited negative values for percentage decrease, indicating better classifications with randomized labels. Upon closer examination, it was revealed that classifiers with fine kernels were primarily responsible for such effects. These classifiers were also found to be prone to overfitting issues, as discussed in detail later in this paper.
Overall, block segmentation yielded superior accuracies compared to PS segmentation when MFCCs are used.
When classifiers were trained using data with random labels, performance decreased in all cases as expected. The relative accuracy reduction due to random label assignment is shown in Figure 6.
The relative reduction in accuracy was also more pronounced in the case of block segmentation for females. In males, both segmentation methods were comparable when data was labeled randomly. In conclusion, it was observed that when trained with random labels, the degradation in accuracy was more pronounced, highlighting a lack of robustness in the classifiers while using block segmentation.
The comparison between feature types was made using classification accuracies with original labels and the relative decline in performance due to random label assignment. The performance comparison between MFCCs from PS segmentation and PSFs using Database 1 for both genders is shown in Figure 7. We observe that in female, PSFs has better median accuracies than MFCCs. The significantly higher relative reduction in performance for PSFs along with higher classification accuracies for MFCC as depicted in Figure 6, indicates that MFCCs contain more speaker-identifiable information while PSFs exhibit a higher capability to capture the impact of PD on vocalic dynamics. Conversely, PSFs exhibited a higher capability to capture the impact of PD on vocalic dynamics compared to MFCCs.
The percentage reduction in classification performance with original labels and randomly assigned labels was consistently higher for PSFs than MFCCs in all cases, as demonstrated in Figure 8. In conclusion, these findings suggest that PSFs are more effective than MFCCs in containing the effects of PD, while MFCCs are better suited for speaker identification and verification applications. As PSFs are extracted using PS segmentation, between block processing and PS segmentation, the latter becomes the optimal choice.
Next, to recognize the optimal set of classifiers, each one of the 17 classifiers was evaluated using two different metrics:
  • Overfit factors are displayed in Table 2;
  • Test accuracy using random label assignment is shown in Table 3.
In both Table 2 and Table 3, the classifiers were arranged in ascending order of the overfit factor observed in males using MFCC for training. Index numbers were assigned to each classifier in the leftmost column of both tables for easy identification during discussions. To ensure robustness and bias-free analysis, all classifier experiments, including training, testing, and result acquisition, were repeated 10 times and the median values of overfit factors and test accuracies were then presented in Table 2 and Table 3, respectively.
In Table 2, for both MFCCs and PSFs in both genders, classifiers 1 to 10 exhibited significantly lower overfit factors compared to the rest. Conversely, from classifier 11 to classifier 17, the overfit factors increased, indicating a greater tendency to overfit the training data. Table 3 displays the median test accuracies for each classifier under pitch-synchronous segmentation when labels were randomized. Among the classifiers with lower overfit values identified in Table 2 (classifiers 1 to 10), the first three classifiers exhibited significantly higher accuracy values even with random labels. This finding indicates that kNNs are more suitable for speaker verification applications than PD classification. They tend to rely on the proximity of samples in the feature space and learn minimal information related to the effects of PD. Comparably, the results in Table 3 revealed that MFCCs achieved much higher accuracy values than PSFs, suggesting that MFCCs are better suited for speaker identification tasks compared to PD classification. Based on these observations, only classifiers 4–10 were identified as optimal classifiers.
For the final step, training and testing were carried out using different databases. Database 1 and Database 2 consist of speakers with varying characteristics, including nationality, spoken language, paragraph length, and sampling frequency (16 kHz for Database 1 and 44.1 kHz for Database 2).
Figure 9 presents the results obtained when the optimal set of classifiers is trained and tested over different databases after applying normalization and using the z-scores before training the classifiers. The normalization process ensured that the classifiers were trained and tested on data with consistent scales, facilitating fair and reliable performance comparisons across the two databases. Figure 10 shows the results for the same grouping as Figure 9, where the syllabic level covariances are used for classification instead of the z-scores. Comparison between both figures shows the MFCCs cannot contain the effects of PD as well as PSFs. Covariances computed over PSFs at the super-segment level are more reliable than MFCCs. While it can clearly be improved further, these results provide evidence for the need to develop features that capture the vocalic dynamics more than the features that are reliable in identifying the speakers.
Besides accuracy, additional metrics were used to evaluate the performance. The descriptions are as follows:
  • True Positives (TP): Number of PD samples predicted as PD.
  • True Negatives (TN): Number of HC samples predicted as HC.
  • False Positives (FP): Number of HC samples predicted as PD.
  • False Negatives (FN): Number of PD samples predicted as HC.
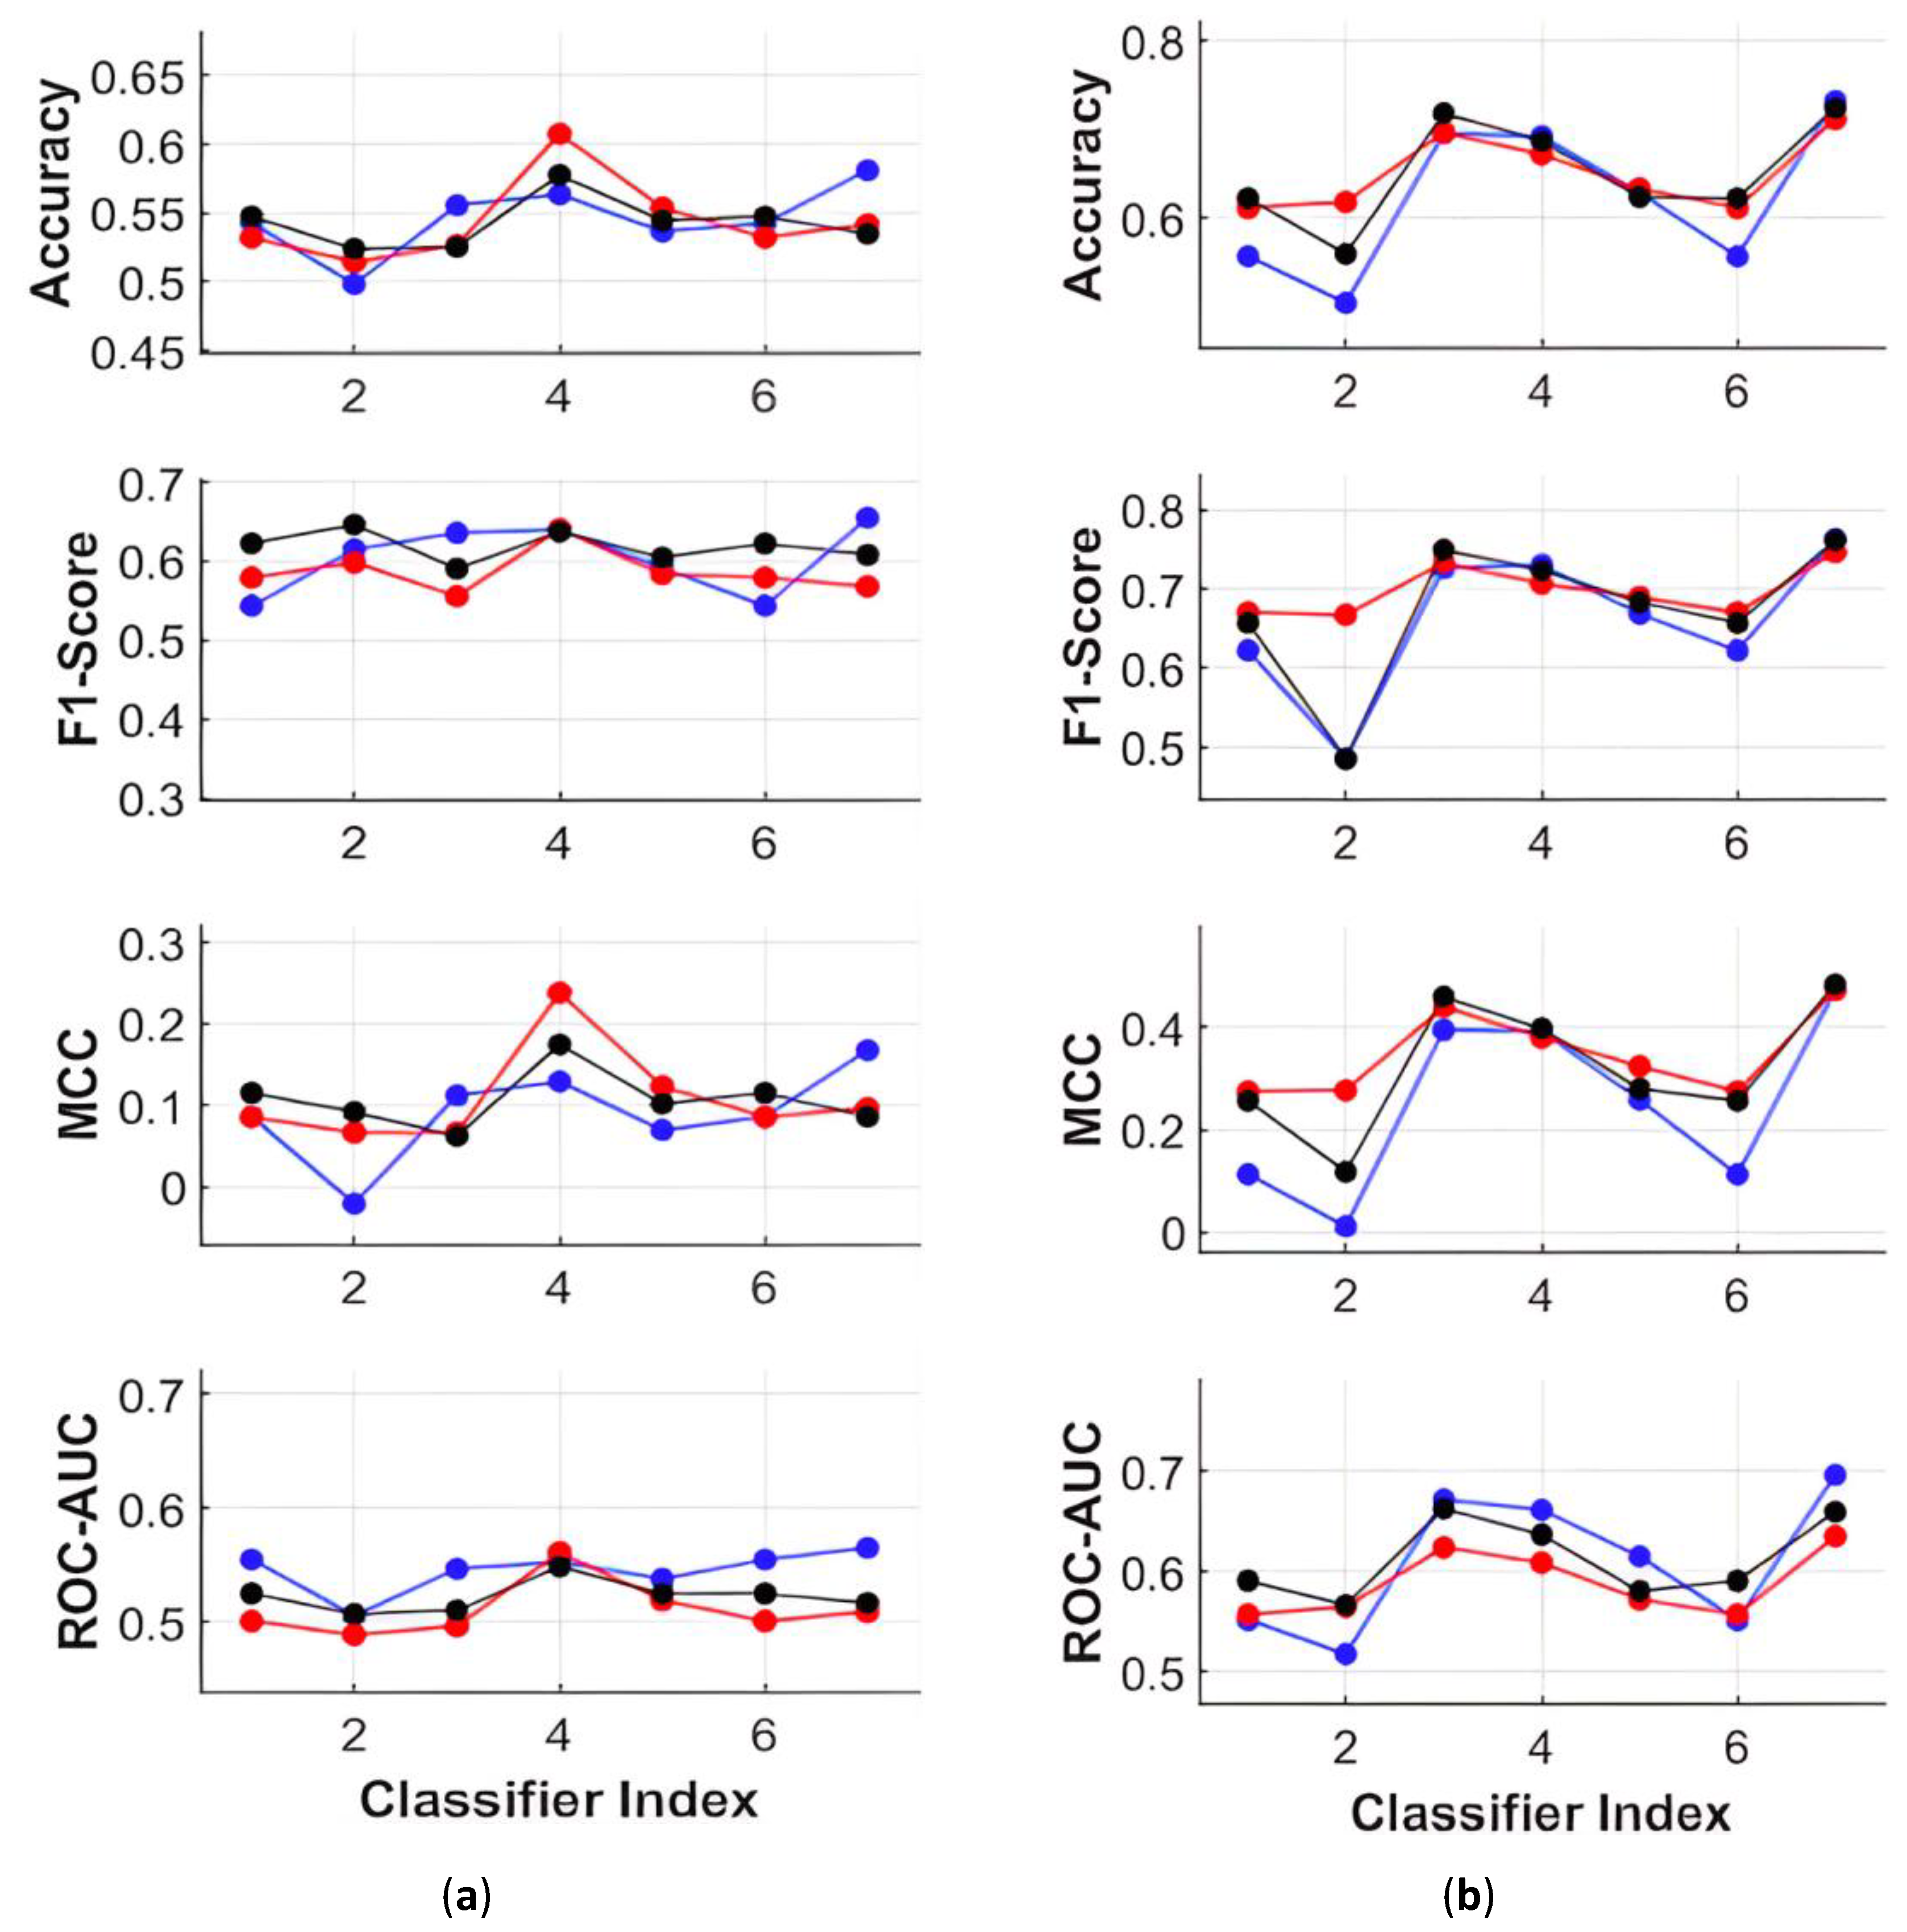
  • Accuracy: Proportion of test samples correctly predicted.
Accuracy = ( T P + T N ) ( T P + T N + F P + F N )
  • Precision (P): Proportion of PD predictions that were correct.
Precision = T P ( T P + F P )
  • Recall (R): Proportion of all PD samples correctly predicted.
Recall = T P ( T P + F N )
  • F1-Score: Harmonic mean of precision and recall.
F 1 - Score = 2 × P × R ( P + R )
  • Matthews Correlation Coefficient (MCC): An improvement over F1-Score as it includes the TN in its computation.
MCC = T P × T N F P × F N T P + F P T P + F N ( T N + F P ) ( T N + F N )
  • ROC-AUC: Area under Receiver Operating Characteristic (ROC) curve.
All the metrics except MCC have values between 0 and 1, with 1 being the best possible value. MCC can have values between −1 and 1, with 1 being the best possible value.
Under gender-independent grouping (black) for MFCCs, Coarse Gaussian SVM and Logistic Regression demonstrated relatively higher performance across all metrics, as illustrated in Figure 11a For PSFs, Medium Trees also exhibited comparable performance to Coarse Gaussian SVM and Logistic Regression, as depicted in Figure 11b Therefore, Coarse Gaussian SVM and Logistic Regression emerge as superior classifiers for PD classification, whether using MFCCs or PSFs. with PSFs, Coarse Gaussian SVM, and Ensemble Boosted Trees achieved classification accuracies close to 75% without any indication of bias in F1-scores and MCC. Upon a more detailed analysis of the results in Figure 5, it was observed that under the same conditions, these two classifiers achieved an average accuracy of 85% when exclusively using Database 1 for training and testing.
In this paper, all the results presented so far were obtained by treating each segment as an individual sample. Using logistic regression with PSFs, the percentage of correctly predicted segments from each participant was determined. The results from coarse Gaussian SVM closely followed the outcomes from logistic regression.
Remarkably, the proposed framework demonstrated a high recall and good precision for detecting PD; this was supported by the result that more than 80% of PD speaker segments and over 50% of HC speaker segments were correctly predicted with their corresponding labels. The proposed methodology is being further developed to improve the precision by decreasing false positives. It involves capturing the cycle-to-cycle perturbations much better and evaluating each syllable holistically. In our latest studies, a syllabic analysis protocol is being developed and preliminary results show signs of PSFs consistently outperforming MFCCs. These insights will be incorporated into our upcoming report.

5. Conclusions

In this study, a novel protocol for PD classification using connected speech has been proposed and thoroughly tested under various experimental conditions. Different choices representing proposed and existing frameworks for some of the methodological blocks were identified and systematically evaluated. In the analysis of block processing with varying block sizes using MFCCs, it was revealed that the block size had no significant impact on the classification performance. On comparing the two segmentation protocols, PS segmentation exhibited superior performance, which could be attributed to its ability to maintain consistent resolution across speakers with different and varying fundamental frequencies. Furthermore, when considering results with randomized labels, MFCCs demonstrated their strength in providing speaker-identifiable information to classifiers, rendering them more suitable for speaker-identification applications.
Between MFCCs and PSFs for PS segmental analysis, PSF provides reliability due to its ability to capture the patterns in speech affected by Parkinson’s disease. The study demonstrated the positive impact of reducing identifying information on classifier reliability. A total of 17 classifiers were utilized for testing, with each one being individually assessed for reliability and overfitting capability. Among the 17 classifiers, 10 displayed tendencies towards overfitting. The remaining seven classifiers were employed to test the proposed gender framework independently using different databases. The performance results showed that coarse Gaussian SVMs, ensemble boosted trees, and logistic regression are all well-suited for this application. These results are promising, considering the magnitude of the differences in both data sets.
Future work is aimed at identifying the effects of various factors, like variants of features used, and improving the analysis methods presented here by employing advanced techniques like autoencoders to further improve the ability to capture the effects of PD on speech production. We plan to compare performances utilizing sustained phonations with varying vowels and diverse linear and nonlinear features. Our objective is to create a comprehensive automated classification procedure capable of overcoming challenges such as data availability, ease of implementation, and enhanced generalizability. Such a protocol can very well be used beyond PD for other ailments that affect speech production.

Author Contributions

Conceptualization, S.B.A. and R.S.; methodology, S.B.A. and R.S.; software, S.B.A.; validation, S.B.A. and R.S.; formal analysis, S.B.A.; investigation, S.B.A. and R.S.; resources, S.B.A.; data curation, R.S. and S.B.A.; writing—original draft preparation, S.B.A., R.P. and R.S.; writing—review and editing, S.B.A., R.P. and R.S.; visualization, S.B.A. and R.P.; supervision, R.S.; project administration, R.S. All authors have read and agreed to the published version of the manuscript.

Funding

This research received no external funding.

Institutional Review Board Statement

Not applicable for Database 1. The institutional review board approved all test procedures at the University of Florida for Database 2.

Informed Consent Statement

Informed consent was obtained from all test subjects involved in the study.

Data Availability Statement

Database 1 presented in the study is openly available in “IEEE DataPort” at http://dx.doi.org/10.21227/aw6b-tg17, accessed on 3 April 2020.

Acknowledgments

The authors would like to thank Dimauro and Girardi for sharing their Italian dataset via IEEE DataPort and the researchers at the Movement Disorder Center at the University of Florida for sharing the English dataset. We would like to thank Supraja Anand at the University of South Florida College of Behavioral and Community Sciences for providing help in curating and analyzing the dataset.

Conflicts of Interest

The authors declare no conflict of interest.

References

  1. Parkinson, J. An essay on the shaking palsy. J. Neuropsychiatry Clin. Neurosci. 2002, 14, 223–236. [Google Scholar] [CrossRef]
  2. Tohgi, H.; Abe, T.; Takahashi, S. Parkinson’s disease: Diagnosis, treatment and prognosis. Nihon Ronen Igakkai Zasshi. Jpn. J. Geriatr. 1996, 33, 911–915. [Google Scholar] [CrossRef] [PubMed]
  3. New Study Shows the Incidence of Parkinson’s Disease in the U.S. Is 50% Higher than Previous Estimates. Available online: https://www.parkinson.org/about-us/news/incidence-2022 (accessed on 3 April 2020).
  4. Marras, C.; Beck, J.C.; Bower, J.H.; Roberts, E.; Ritz, B.; Ross, G.W.; Abbott, R.D.; Savica, R.; Van Den Eeden, S.K.; Willis, A.W.; et al. Prevalence of Parkinson’s disease across North America. NPJ Park. Dis. 2018, 4, 21. [Google Scholar] [CrossRef]
  5. Lima, M.S.M.; Martins, E.F.; Marcia Delattre, A.; Proenca, M.B.; Mori, M.A.; Carabelli, B.; Ferraz, A.C. Motor and non-motor features of Parkinson’s disease–A review of clinical and experimental studies. CNS Neurol. Disord. Drug Targets Former. Curr. Drug Targets CNS Neurol. Disord. 2012, 11, 439–449. [Google Scholar]
  6. Lang, A.E. A critical appraisal of the premotor symptoms of Parkinson’s disease: Potential usefulness in early diagnosis and design of neuroprotective trials. Mov. Disord. 2011, 26, 775–783. [Google Scholar] [CrossRef] [PubMed]
  7. Schrag, A.; Jahanshahi, M.; Quinn, N. How does Parkinson’s disease affect quality of life? A comparison with quality of life in the general population. Mov. Disord. Off. J. Mov. Disord. Soc. 2000, 15, 1112–1118. [Google Scholar] [CrossRef]
  8. Lang, A.E.; Obeso, J.A. Time to move beyond nigrostriatal dopamine deficiency in Parkinson’s disease. Ann. Neurol. Off. J. Am. Neurol. Assoc. Child Neurol. Soc. 2004, 55, 761–765. [Google Scholar] [CrossRef]
  9. Rizzo, G.; Copetti, M.; Arcuti, S.; Martino, D.; Fontana, A.; Logroscino, G. Accuracy of clinical diagnosis of Parkinson disease: A systematic review and meta-analysis. Neurology 2016, 86, 566–576. [Google Scholar] [CrossRef] [PubMed]
  10. Postuma, R.; Lang, A.; Gagnon, J.; Pelletier, A.; Montplaisir, J. How does parkinsonism start? Prodromal parkinsonism motor changes in idiopathic REM sleep behaviour disorder. Brain 2012, 135, 1860–1870. [Google Scholar] [CrossRef] [PubMed]
  11. Harel, B.T.; Cannizzaro, M.S.; Cohen, H.; Reilly, N.; Snyder, P.J. Acoustic characteristics of Parkinsonian speech: A potential biomarker of early disease progression and treatment. J. Neurolinguist. 2004, 17, 439–453. [Google Scholar] [CrossRef]
  12. Ho, A.K.; Iansek, R.; Marigliani, C.; Bradshaw, J.L.; Gates, S. Speech impairment in a large sample of patients with Parkinson’s disease. Behav. Neurol. 1998, 11, 131–137. [Google Scholar] [CrossRef] [PubMed]
  13. Kent, R.D.; Kent, J.F.; Weismer, G.; Duffy, J.R. What dysarthrias can tell us about the neural control of speech. J. Phon. 2000, 28, 273–302. [Google Scholar] [CrossRef]
  14. Rudzicz, F. Articulatory knowledge in the recognition of dysarthric speech. IEEE Trans. Audio Speech Lang. Process. 2010, 19, 947–960. [Google Scholar] [CrossRef]
  15. Canter, G.J. Speech characteristics of patients with Parkinson’s disease: III. Articulation, diadochokinesis, and over-all speech adequacy. J. Speech Hear. Disord. 1965, 30, 217–224. [Google Scholar] [CrossRef]
  16. Darley, F.L.; Aronson, A.E.; Brown, J.R. Motor Speech Disorders; Saunders: Philadelphia, PA, USA, 1975. [Google Scholar]
  17. Tjaden, K.; Kain, A.; Lam, J. Hybridizing conversational and clear speech to investigate the source of increased intelligibility in speakers with Parkinson’s disease. J. Speech Lang. Hear. Res. 2014, 57, 1191–1205. [Google Scholar] [CrossRef]
  18. Anand, S.; Stepp, C.E. Listener perception of monopitch, naturalness, and intelligibility for speakers with Parkinson’s disease. J. Speech Lang. Hear. Res. 2015, 58, 1134–1144. [Google Scholar] [CrossRef]
  19. Chiu, Y.-F.; Neel, A. Predicting Intelligibility Deficits in Parkinson’s Disease With Perceptual Speech Ratings. J. Speech Lang. Hear. Res. 2020, 63, 433–443. [Google Scholar] [CrossRef]
  20. Miller, N.; Allcock, L.; Jones, D.; Noble, E.; Hildreth, A.J.; Burn, D.J. Prevalence and pattern of perceived intelligibility changes in Parkinson’s disease. J. Neurol. 2007, 78, 1188–1190. [Google Scholar] [CrossRef]
  21. Cannito, M.P.; Suiter, D.M.; Beverly, D.; Chorna, L.; Wolf, T.; Pfeiffer, R.M. Sentence intelligibility before and after voice treatment in speakers with idiopathic Parkinson’s disease. J. Voice 2012, 26, 214–219. [Google Scholar] [CrossRef]
  22. Cannito, M.P.; Suiter, D.M.; Chorna, L.; Beverly, D.; Wolf, T.; Watkins, J. Speech intelligibility in a speaker with idiopathic Parkinson’s disease before and after treatment. J. Med. Speech Lang. Pathol. 2008, 16, 207–213. [Google Scholar]
  23. Goberman, A.M.; Elmer, L.W. Acoustic analysis of clear versus conversational speech in individuals with Parkinson disease. J. Commun. Disord. 2005, 38, 215–230. [Google Scholar] [CrossRef] [PubMed]
  24. Chenausky, K.; MacAuslan, J.; Goldhor, R. Acoustic analysis of PD speech. Park. Dis. 2011, 2011, 435232. [Google Scholar] [CrossRef] [PubMed]
  25. Kuo, C.; Tjaden, K. Acoustic variation during passage reading for speakers with dysarthria and healthy controls. J. Commun. Disord. 2016, 62, 30–44. [Google Scholar] [CrossRef] [PubMed]
  26. Fletcher, A.R.; McAuliffe, M.J.; Lansford, K.L.; Liss, J.M. Assessing vowel centralization in dysarthria: A comparison of methods. J. Speech Lang. Hear. Res. 2017, 60, 341–354. [Google Scholar] [CrossRef]
  27. Burk, B.R.; Watts, C.R. The effect of Parkinson disease tremor phenotype on cepstral peak prominence and transglottal airflow in vowels and speech. J. Voice 2019, 33, 580.e11–580.e19. [Google Scholar] [CrossRef]
  28. Orozco-Arroyave, J.R.; Hönig, F.; Arias-Londoño, J.D.; Vargas-Bonilla, J.F.; Skodda, S.; Rusz, J.; Nöth, E. Automatic detection of Parkinson’s disease from words uttered in three different languages. In Proceedings of the Fifteenth Annual Conference of the International Speech Communication Association, Singapore, 14–18 September 2014. [Google Scholar]
  29. Orozco-Arroyave, J.; Hönig, F.; Arias-Londoño, J.; Vargas-Bonilla, J.; Daqrouq, K.; Skodda, S.; Rusz, J.; Nöth, E. Automatic detection of Parkinson’s disease in running speech spoken in three different languages. J. Acoust. Soc. Am. 2016, 139, 481–500. [Google Scholar] [CrossRef]
  30. Rusz, J.; Cmejla, R.; Tykalova, T.; Ruzickova, H.; Klempir, J.; Majerova, V.; Picmausova, J.; Roth, J.; Ruzicka, E. Imprecise vowel articulation as a potential early marker of Parkinson’s disease: Effect of speaking task. J. Acoust. Soc. Am. 2013, 134, 2171–2181. [Google Scholar] [CrossRef]
  31. Skodda, S.; Grönheit, W.; Schlegel, U. Intonation and speech rate in Parkinson’s disease: General and dynamic aspects and responsiveness to levodopa admission. J. Voice 2011, 25, e199–e205. [Google Scholar] [CrossRef]
  32. Tsanas, A.; Little, M.A.; McSharry, P.E.; Spielman, J.; Ramig, L.O. Novel speech signal processing algorithms for high-accuracy classification of Parkinson’s disease. IEEE Trans. Biomed. Eng. 2012, 59, 1264–1271. [Google Scholar] [CrossRef]
  33. Rusz, J.; Cmejla, R.; Ruzickova, H.; Ruzicka, E. Quantitative acoustic measurements for characterization of speech and voice disorders in early untreated Parkinson’s disease. J. Acoust. Soc. Am. 2011, 129, 350–367. [Google Scholar] [CrossRef]
  34. Little, M.; McSharry, P.; Hunter, E.; Spielman, J.; Ramig, L. Suitability of dysphonia measurements for telemonitoring of Parkinson’s disease. Nat. Preced. 2008, 1. [Google Scholar] [CrossRef]
  35. Almeida, J.S.; Rebouças Filho, P.P.; Carneiro, T.; Wei, W.; Damaševičius, R.; Maskeliūnas, R.; de Albuquerque, V.H.C. Detecting Parkinson’s disease with sustained phonation and speech signals using machine learning techniques. Pattern Recognit. Lett. 2019, 125, 55–62. [Google Scholar] [CrossRef]
  36. Benba, A.; Jilbab, A.; Hammouch, A. Detecting patients with Parkinson’s disease using Mel frequency cepstral coefficients and support vector machines. Int. J. Electr. Eng. Inform. 2015, 7, 297. [Google Scholar]
  37. Rahn, D.A., III; Chou, M.; Jiang, J.J.; Zhang, Y. Phonatory impairment in Parkinson’s disease: Evidence from nonlinear dynamic analysis and perturbation analysis. J. Voice 2007, 21, 64–71. [Google Scholar] [CrossRef] [PubMed]
  38. Klingholtz, F. Acoustic recognition of voice disorders: A comparative study of running speech versus sustained vowels. J. Acoust. Soc. Am. 1990, 87, 2218–2224. [Google Scholar] [CrossRef]
  39. Zraick, R.I.; Dennie, T.M.; Tabbal, S.D.; Hutton, T.J.; Hicks, G.M.; O’Sullivan, P.S. Reliability of speech intelligibility ratings using the Unified Parkinson Disease Rating Scale. J. Med. Speech Lang. Pathol. 2003, 11, 227–241. [Google Scholar]
  40. Ackermann, H.; Konczak, J.; Hertrich, I. The temporal control of repetitive articulatory movements in Parkinson’s disease. Brain Lang. 1997, 56, 312–319. [Google Scholar] [CrossRef]
  41. Kumar, S.; Kar, P.; Singh, D.; Sharma, M. Analysis of diadochokinesis in persons with Parkinson’s disease. J. Datta Meghe Inst. Med. Sci. Univ. 2018, 13, 140. [Google Scholar] [CrossRef]
  42. Hlavnička, J.; Čmejla, R.; Tykalová, T.; Šonka, K.; Růžička, E.; Rusz, J. Automated analysis of connected speech reveals early biomarkers of Parkinson’s disease in patients with rapid eye movement sleep behaviour disorder. Sci. Rep. 2017, 7, 12. [Google Scholar] [CrossRef]
  43. Rusz, J.; Hlavnička, J.; Tykalová, T.; Novotný, M.; Dušek, P.; Šonka, K.; Růžička, E. Smartphone allows capture of speech abnormalities associated with high risk of developing Parkinson’s disease. IEEE Trans. Neural Syst. Rehabil. Eng. 2018, 26, 1495–1507. [Google Scholar] [CrossRef]
  44. Whitfield, J.A.; Goberman, A.M. Articulatory–acoustic vowel space: Application to clear speech in individuals with Parkinson’s disease. J. Commun. Disord. 2014, 51, 19–28. [Google Scholar] [CrossRef] [PubMed]
  45. MacPherson, M.K.; Huber, J.E.; Snow, D.P. The intonation–syntax interface in the speech of individuals with Parkinson’s disease. J. Speech Lang. Hear. Res. 2011, 54, 19–32. [Google Scholar] [CrossRef] [PubMed]
  46. Forrest, K.; Weismer, G.; Turner, G.S. Kinematic, acoustic, and perceptual analyses of connected speech produced by Parkinsonian and normal geriatric adults. J. Acoust. Soc. Am. 1989, 85, 2608–2622. [Google Scholar] [CrossRef]
  47. Skodda, S.; Visser, W.; Schlegel, U. Vowel articulation in Parkinson’s disease. J. Voice 2011, 25, 467–472. [Google Scholar] [CrossRef] [PubMed]
  48. Vizza, P.; Tradigo, G.; Mirarchi, D.; Bossio, R.B.; Lombardo, N.; Arabia, G.; Quattrone, A.; Veltri, P. Methodologies of speech analysis for neurodegenerative diseases evaluation. Int. J. Med. Inform. 2019, 122, 45–54. [Google Scholar] [CrossRef]
  49. Schultz, B.G.; Tarigoppula, V.S.A.; Noffs, G.; Rojas, S.; van der Walt, A.; Grayden, D.B.; Vogel, A.P. Automatic speech recognition in neurodegenerative disease. Int. J. Speech Technol. 2021, 24, 771–779. [Google Scholar] [CrossRef]
  50. Shi, X.; Wang, T.; Wang, L.; Liu, H.; Yan, N. Hybrid Convolutional Recurrent Neural Networks Outperform CNN and RNN in Task-state EEG Detection for Parkinson’s Disease. In Proceedings of the 2019 Asia-Pacific Signal and Information Processing Association Annual Summit and Conference (APSIPA ASC), Lanzhou, China, 18–21 November 2019; pp. 939–944. [Google Scholar]
  51. Quan, C.; Ren, K.; Luo, Z. A Deep Learning Based Method for Parkinson’s Disease Detection Using Dynamic Features of Speech. IEEE Access 2021, 9, 10239–10252. [Google Scholar] [CrossRef]
  52. Gunduz, H. Deep Learning-Based Parkinson’s Disease Classification Using Vocal Feature Sets. IEEE Access 2019, 7, 115540–115551. [Google Scholar] [CrossRef]
  53. Nagasubramanian, G.; Sankayya, M. Multi-Variate vocal data analysis for Detection of Parkinson disease using Deep Learning. Neural Comput. Appl. 2020, 33, 4849–4864. [Google Scholar] [CrossRef]
  54. Karaman, O.; Çakın, H.; Alhudhaif, A.; Polat, K. Robust automated Parkinson disease detection based on voice signals with transfer learning. Expert Syst. Appl. 2021, 178, 115013. [Google Scholar] [CrossRef]
  55. Ali, L.; Zhu, C.; Zhang, Z.; Liu, Y. Automated Detection of Parkinson’s Disease Based on Multiple Types of Sustained Phonations Using Linear Discriminant Analysis and Genetically Optimized Neural Network. IEEE J. Transl. Eng. Health Med. 2019, 7, 2000410. [Google Scholar] [CrossRef] [PubMed]
  56. Appakaya, S.B.; Sankar, R. Classification of Parkinson’s disease Using Pitch Synchronous Speech Analysis. In Proceedings of the 2018 40th Annual International Conference of the IEEE Engineering in Medicine and Biology Society (EMBC), Honolulu, HI, USA, 17–21 July 2018; pp. 1420–1423. [Google Scholar]
  57. Benba, A.; Jilbab, A.; Hammouch, A. Discriminating between patients with Parkinson’s and neurological diseases using cepstral analysis. IEEE Trans. Neural Syst. Rehabil. Eng. 2016, 24, 1100–1108. [Google Scholar] [CrossRef] [PubMed]
  58. Giovanni, D.; Francesco, G. Italian Parkinson’s Voice and Speech. IEEE Dataport 2019. [Google Scholar] [CrossRef]
  59. Dimauro, G.; Di Nicola, V.; Bevilacqua, V.; Caivano, D.; Girardi, F. Assessment of speech intelligibility in Parkinson’s disease using a speech-to-text system. IEEE Access 2017, 5, 22199–22208. [Google Scholar] [CrossRef]
  60. Skowronski, M.D.; Shrivastav, R.; Harnsberger, J.; Anand, S.; Rosenbek, J. Acoustic discrimination of Parkinsonian speech using cepstral measures of articulation. J. Acoust. Soc. Am. 2012, 132, 2089. [Google Scholar] [CrossRef]
  61. Appakaya, S.B.; Sankar, R. Parkinson’s Disease Classification using Pitch Synchronous Speech Segments and Fine Gaussian Kernels based SVM. In Proceedings of the 2020 42nd Annual International Conference of the IEEE Engineering in Medicine & Biology Society (EMBC), Montreal, QC, Canada, 20–24 July 2020; pp. 236–239. [Google Scholar]
Figure 1. Methodology Block Diagram.
Algorithms 16 00509 g001
Figure 2. Segmentations: Block processing (top) with vertical (red/black) lines showing block limits with block indices (green) and pitch synchronous (bottom). Y–axis shows the normalized signal amplitude.
Algorithms 16 00509 g002
Figure 3. Organization of classifiers used in this study.
Algorithms 16 00509 g003
Figure 4. Syllabic learning approach showing the original recording (blue) overlaid with voiced sections (red) in the figure at the top. One of the voiced sections, segmented pitch synchronously, is zoomed into and shown at the center.
Algorithms 16 00509 g004
Figure 5. Classification results with different segmentations using original labels (MFCCs from Database 1).
Algorithms 16 00509 g005
Figure 6. Percentage reduction in classification performance with original and random labels (MFCCs from Database 1).
Algorithms 16 00509 g006
Figure 7. Classification performance comparison between MFCCs and PSFs (Database 1).
Algorithms 16 00509 g007
Figure 8. Percentage reduction in classification performances with original and random labels—classification between MFCCs and PSF (Database1).
Algorithms 16 00509 g008
Figure 9. Classification accuracies with Database 1 used for training and Database 2 used for testing using z-scores for MFCCs and PSF.
Algorithms 16 00509 g009
Figure 10. Classification accuracies with Database 1 used for training and Database 2 used for testing using covariances from syllabic analysis z-scores for MFCCs and PSF.
Algorithms 16 00509 g010
Figure 11. Performance Metrics with Database 1 for training and Database 2 for testing with (a) MFCCs in three groups; and (b) PSFs in three groups. The three groups are namely group 1 (blue line), group 2 (red line), and group 3 (black line).
Algorithms 16 00509 g011
Table 1. Pitch Synchronous Features.
Feature NameSize
Pitch Period1
LOC—Length of Curve1
Quarter Segment Energy4
Total Energy1
Correlation Canceller Efficiency1
Correlation Canceller MSE1
Peak Frequency (Hz)1
Quarter Band Magnitude4
Spectral Factor1
Table 2. Overfit Factor with Original Label.
Classifier No.Classifier NameOverfit Factor with Original Label
MaleFemale
MFCCPSFMFCCPSF
1Medium KNN−0.0030.0210.0230.022
2Coarse KNN−0.0120.0170.0140.003
3Cosine KNN0.0050.0150.0160.021
4Linear SVM−0.001−0.0050.0090
5Coarse Tree0.0120.0370.017−0.001
6Coarse Gaussian SVM−0.0020.0060.0130.001
7Medium Tree0.0160.0310.0150.003
8Ensemble Boosted Tree0.0180.0260.0250.004
9RUS Boosted Tree0.0160.0310,0150.003
10Logistic Regression0−0.0120.007−0.001
11Fine Tree0.0390.030.0610.008
12Medium Gaussian SVM0.0030.0060.020.001
13Fine KNN0.0350.0570.1090.111
14Weighted KNN0.0260.0550.0990.1
15Ensemble Bagged Trees0.0460.0510.10.051
16Ensemble Subspace KNN0.0260.1390.0890.13
17Fine Gaussian SVM0.1730.0170.1370.008
Table 3. Median Test Accuracies with Random Labels in Both Genders for Both Features.
Classifier No.Classifier NameMedian Test Accuracy
MaleFemale
MFCCPSFMFCCPSF
1Medium KNN90.1875.7793.7378.725
2Coarse KNN85.3372.1789.1174.855
3Cosine KNN89.4675.96593.1479.31
4Linear SVM67.6958.880.4453.65
5Coarse Tree66.5259.5277.0169.605
6Coarse Gaussian SVM75.1261.71583.9264.525
7Medium Tree68.8363.0976.8172.405
8Ensemble Boosted Tree74.0467.9682.7675.415
9RUS Boosted Tree68.8363.0976.8172.35
10Logistic Regression67.6259.33579.9259.38
11Fine Tree72.1866.96580.6275.93
12Medium Gaussian SVM86.6370.2190.7875.865
13Fine KNN91.2775.3293.9176.43
14Weighted KNN91.9777.494.2978.66
15Ensemble Bagged Trees88.6780.9892.3985.26
16Ensemble Subspace KNN90.6266.12594.0873.915
17Fine Gaussian SVM92.1478.41595.8680.62
Disclaimer/Publisher’s Note: The statements, opinions and data contained in all publications are solely those of the individual author(s) and contributor(s) and not of MDPI and/or the editor(s). MDPI and/or the editor(s) disclaim responsibility for any injury to people or property resulting from any ideas, methods, instructions or products referred to in the content.

