1. Introduction
Laboratories are known to have a primary role in learning activities. Previous research studies (e.g., [
1]) have shown that practical activities provide benefits to students in terms of knowledge acquisition, level of engagement, well-being, interaction skills, revision, and validation of knowledge competencies. In computer science, laboratories often rely on computerized services. They allow students to practice what they have learnt in theory in an interactive way, typically under the supervision of the teaching assistants. Hence, teachers have the opportunity to closely monitor learners in a “natural” learning environment, where they can learn the necessary knowledge by doing. To this end, lab assignments typically include exercises of variable complexity, thus allowing learning to deal with problems that gradually become similar to the final assessment tasks [
2].
Due to the fact that, in computer science laboratories, learners commonly work in a controlled environment for a restricted time period, an increasing research interest has been devoted to acquiring, collecting, and analyzing learner-generated data in order to measure and monitor students’ engagement level during laboratory activities [
3]. According to [
4], student engagement is the energy and effort that students employ within their learning community, observable via any number of behavioral, cognitive or affective indicators across a continuum. Learner engagement can be analyzed under various dimensions, such as (i) the behavioral aspects, related to observable behavioral characteristics, e.g., the level of effort that students dedicate to learning by participating in the proposed activities and by being involved in the assigned tasks [
5], (ii) the cognitive aspects, related to students’ motivation and investment of thought, mental effort, and willingness to comprehend new ideas and methods [
6], and (iii) the emotional aspects, related to the affective reactions of the students towards teachers and colleagues [
7].
Monitoring and facilitating learning engagement is particularly challenging since it requires identification of the key factors behind students’ motivation. Student engagement analytics typically consist of the following steps: First, an appropriate source of information needs to be identified. To collect relevant information, previous studies have considered, for instance, data from educational service logs [
8], surveys [
9], mobile technologies [
10], and social networks [
11]. Secondly, it entails defining a set of quantitative descriptors of student engagement that are tailored to the specific learning context. Examples of analyzed contexts include, among other, MOOCs [
9], traditional university-level courses [
12], and secondary school lessons [
13]. Finally, the acquired data can be analyzed by means of advanced data analytics tools or data-mining algorithms in order to extract relevant and promptly usable knowledge. Teachers can exploit the discovered information to facilitate learners’ engagement and to improve the quality of the learning activities. Recent surveys on students’ engagement and learning technologies [
4] acknowledge the need for further research efforts addressing the use of data-mining techniques in university-level laboratory activities. The present paper presents research activities in the aforesaid direction.
This work analyzes the level of engagement of university-level students in computer laboratories on writing database queries in the Structured Query Language (SQL). Teaching SQL is widespread in university-level database courses. Computer laboratories are particularly suitable for SQL education because learners can type the queries solving a list of exercises, progressively submit the draft solutions, and eventually fix them by adopting a trial-and-error approach [
14]. We present a case study that we performed in our university, where we set up the laboratory environment and acquired learner-generated data. The designed environment also provides teaching assistants with a prioritized and “democratic” way for giving assistance to students: through an informed environment they can easily spot who is experimenting difficulties according to objective parameters extracted by real-time data collected during their time in the lab. To retrieve data about student engagement, we trace the activities of both students and teaching assistants in the computer lab to analyze the following aspects: (i) the timing and order of access to the given exercises, (ii) the timing of the (potentially multiple) submissions for each assigned exercise, (iii) the submissions’ outcome (correct or wrong query), (iv) the requests for teachers’ assistants made by the students, and (v) the interventions of the teaching assistants. Therefore, unlike traditional log-based systems, the computer lab scenario allows us to trace key aspects of the learning-by-doing process, such as the sequence of submission successes/failures for a given exercise and the requests for assistance. Acquiring the data described above enables the analysis of a number of key indicators of learner’s engagements. To this end, we apply an exploratory sequence pattern mining approach [
15] in order to extract temporal patterns from learner-generated data. Patterns describe recurrent and temporally correlated sequences of traced events that can be used to characterize student engagement from multiple perspectives. More specifically, in the present work we will exploit the extracted sequential patterns to answer the following research question: which kind of information about students’ behavioral, cognitive, and affective engagement can be extracted from the temporal sequences of the students’ activities? To efficiently extract the desired information, we enforce ad hoc pattern constraints into the sequence mining algorithm. Furthermore, the collected data have shown to be helpful in addressing issues that are specifically related to the learning experience of the students (e.g., an exercise whose complexity is significantly above average), thus improving the future teaching activities. For example, they help to understand the complexity of the laboratory assignment, evaluate the correctness of the sequence of the proposed exercises, and analyze the impact and effectiveness of the teaching assistance, whenever requested.
The remainder of the paper is organized as follows.
Section 2 overviews the related works.
Section 3 describes the experimental settings, while
Section 4 presents the applied methodology.
Section 5 reports the analysis of the extracted patterns and discusses the results from the point of view of the students’ learning experience.
Section 6 focuses on the description of the key engagement indicators extracted by means of sequential pattern mining. It profiles students according to a number of selected behavioral, cognitive, and affective engagement dimensions. Furthermore, it also analyzes the correlation among the engagement dimensions extracted from the experimental data. Finally,
Section 7 draws the conclusions and future perspectives of this work.
2. Literature Review
The use of laboratories in computer science education is well established; several studies (e.g., [
1,
2,
16,
17]) have highlighted the advantages of having a practical approach to learning, describing facilities and suggesting best practices. The research community has stressed the importance of cooperation while working in laboratories. Laboratories are not simply considered as places where a single student interacts with a Personal Computer: their use is primarily concerned with the interaction between students [
16,
18]. Therefore, studying learners’ interactivity inside a lab is particularly useful for improving the effectiveness of learning practices.
The Structured Query Language (SQL) is the most widespread declarative programming language to query relational databases. Due to the overwhelming diffusion of relational Database Management Systems, in software engineering and computer science education, Structured Query Language (SQL) skills are deemed to be fundamental. A systematic review of SQL education is given by [
14]. In the early 2000s, most research works related to SQL education were focused on proposing ad hoc tools to support laboratory sessions on SQL query writing (e.g., [
19,
20,
21]). Later on, with the growth of Learning Analytics (LA) technologies, the attention of the community has shifted towards the development of smart solutions to acquire, collect, and analyze learner-generated data within SQL laboratories. For example, an established LA challenge is to predict students’ performance early [
22]. Under this umbrella, the works presented in [
23,
24,
25] proposed recording students’ activities in SQL laboratories in order to obtain inferences related to the upcoming students’ performance. More recently, the research community has paid more and more attention to innovative SQL learning paradigms, e.g., blended learning [
26,
27], game-based learning [
28], and flipped classrooms activities [
29]. The present paper positions itself as a new learning analytics study in higher education [
30], with particular reference to SQL laboratory activities. Unlike [
23,
24,
25], the focus of the present work is not on predicting students’ performance. Conversely, it investigates the use of exploratory data-mining techniques, i.e., sequence pattern mining [
31], to characterize and profile learners’ activities during SQL laboratory sessions and to describe the cognitive, behavioral, and affective dimensions of student engagement.
In recent years, the parallel issue of fostering student engagement through educational technologies in secondary and higher education has received increasing attention [
1,
4,
8,
32]. For example, the authors in [
32] analyzed the behavioral engagement of MOOC participants based on both the timing of resource accesses and on the type of explored resources, i.e., video, Self Regulated Learning (SRL) support video, discussion, quiz, assignment, reading. In [
8], the authors analyzed click-stream log data related to 89 students of a Freshman English course. They classified students as surface, deep, or strategic according to their engagement level measured in terms of time spent on the Web pages and number of actions made on that pages (detected from reading logs). Some attempts to facilitate students’ engagement in secondary education through flipped learning approaches have also been made [
4]. An extensive overview of the existing educational technology applications to enhance student engagement in higher education can be found in [
1]. Similar to [
8,
32], in this study we analyze click-stream data in order to monitor students’ engagement levels. Unlike [
8] we consider a different context of application (i.e., a higher education course on databases), and we apply a different methodology for exploring data. Compared to [
32], the present work analyzes a different context (i.e., an assisted laboratory activity) and exploits different activity indicators beyond access to a resource, such as the success/fail of a tentative submission of an exercise solution and the interactions with the teaching assistants. The enriched data model also enables the study of different learning aspects related to behavioral, cognitive, and affective engagement.
Table 1 enumerates the engagement key indicators that will be addressed in the paper. For each of the selected indicators, the table contains the category (behavioral, cognitive, or affective), consistent with the classification proposed in [
4], a definition, and a list of related works.
3. Experimental Setting
To analyze students’ activities and engagement in SQL education, the present research work relies on real data collected during educational laboratory sessions. The educational context is a computer lab related to a course on database design and management. The course is offered in the context of a B.S. degree in engineering. All the students are enrolled in the same bachelor degree course, have approximately the same background, and carried out the practice under the same conditions. The objective of the laboratory activity is to become familiar with the SQL language through a number of proposed SQL exercises, where the student has to write SQL declarative statements to query a relational database.
The computer lab is equipped with 43 workstations, but the course has approximately 650 enrolled students; for this reason, students were divided into groups and participated in a 90-min lab session. The task consisted of solving 13 proposed exercises through an educational tool that supported them and recorded all the related events. The first 4 exercises only required knowledge of the basic SQL syntax SELECT … FROM … WHERE … ORDER BY, the subsequent 4 exercises required a more advanced understanding of SQL grouping operators (GROUP BY … HAVING …), while the remaining ones mainly focused on nesting SQL queries using Table Functions and the IN, EXISTS, NOT IN, NOT EXISTS operators.
The students’ user interface proposed one exercise at a time, with the problem statement, the associated relational database schema, and the table representing the expected correct results. The students entered their tentative query and the Oracle DBMS [
45] executed it, providing feedback that was shown to the learners. Besides the DBMS messages (useful for understanding query errors), when the query was syntactically correct, the environment compared the executed result with the expected result, thus highlighting possible semantic errors.
Through the user interface, students could also ask for the teaching assistant’s intervention; the environment recorded both help requests and interventions.
Participation to labs was optional (even though highly encouraged). Therefore, not every student participated to the lab experiment. For this study, we collected data regarding 215 students, considering only those who accessed at least one exercise.
4. Materials and Methods
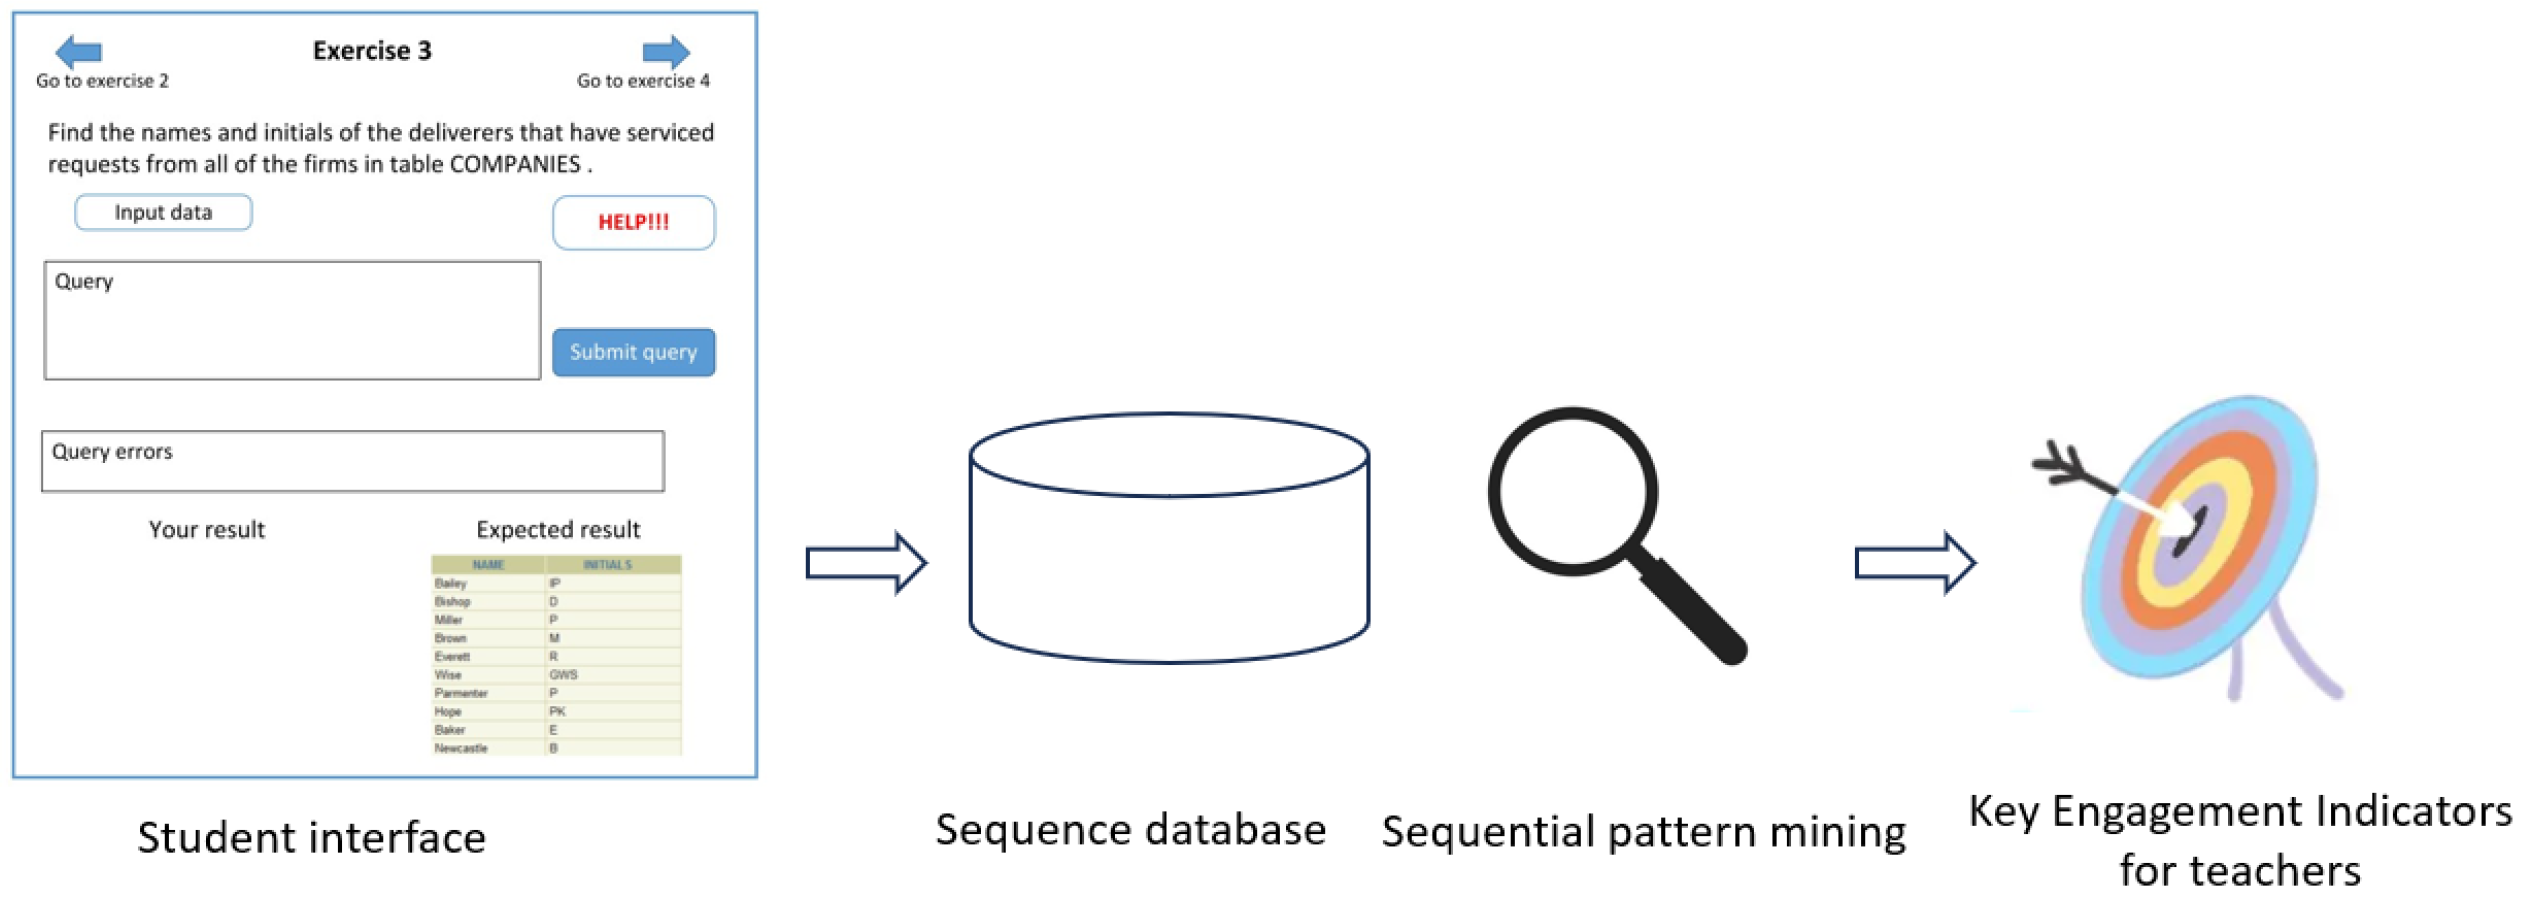
The pipeline of analysis designed for studying student engagement in SQL education during computer laboratory consists of three main steps (see
Figure 1). Firstly, the data are acquired through the computer laboratory interface. Then, data are tailored to an appropriate sequence database, which incorporates all the necessary information. Secondly, a subset of relevant temporal patterns is extracted using an established sequential pattern mining approach [
15]. Pattern extraction is aimed at automatically extracting recurrent subsequences of temporally correlated events related to student engagement. Lastly, a set of Key Engagement Indicators (KEIs) (see
Table 1) are computed on top of the extracted patterns. KEI exploration can help teachers to monitor and facilitate learner engagement from multiple perspectives.
In the following sections, the above-mentioned steps will be thoroughly described.
4.1. Preliminaries
We first define the preliminary concepts of sequence and sequential databases. Sequential pattern mining in compliance with [
46].
Let I be a set of all items. An itemset is a subset of items in I. A sequence, s, is an ordered list of itemsets. A sequence, s, is denoted by , where , is an itemset. is also denoted by element of the sequence, consisting of a set of items (), where , . For the sake of brevity, hereafter we will omit the brackets when m = 1. An item occurs at most once in an element of a sequence, but can occur multiple times in different elements of the same sequence. An l-sequence, i.e., a sequence of length l, is a sequence where the number of instance of occurring items is l. = is a subsequence of another sequence, = , denoted by , if there exist integers such that , , …, .
A sequence database, S, is a set of tuples, , where is the sequence identifier and s is a sequence. A tuple, , contains subsequence if . The absolute support of subsequence in S, denoted by sup(s), is the number of tuples containing . The relative support is the fraction of tuples containing .
Sequential Pattern Mining
Given a sequence database, S, and a minimum support threshold, minsup, the sequential pattern mining task entails extracting all the subsequences, , in S whose sup() ≥ minsup, i.e., it focuses on discovering all the frequent subsequences in the sequence database.
Whether or not the occurrences of the sequence elements are timestamped, i.e., is the timestamp at sequence , we can enforce additional constraints into the sequential pattern mining process (beyond enforcing the support threshold):
mingap: the minimum time gap between consecutive elements of a sequence;
maxgap: indicates the the maximum time gap between consecutive elements of a sequence;
maxwinsize: the maximum temporal duration of the overall sequence.
When not otherwise specified, time gaps and window sizes are expressed in minutes.
By varying the values of mingap, maxgap, and maxwinsize, it is possible to focus the exploration on sequences with varying temporal periodicity.
4.2. Data Model
We introduce the notation used throughout the section below.
Participating students (): set of students who participated in a SQL laboratory session (i.e., in our experiments, 215 students);
Lab duration (D): The time span corresponding to lab development (i.e., a 90-min time window, in our experiments);
Time window (): A time span at a finer granularity than D (e.g., a 5-min time span);
Events (): The set of events of interest that occurred in the SQL laboratory. An event, , that occurred at an arbitrary time point, , and involved a specific student, .
The analysis focuses on the most relevant temporal correlations between the events that occurred in the labs and are relative to the same student. Each event describes either a specific action made by the student (e.g., access to a new exercise), an achievement (e.g., exercise solved), a request for assistance, or an assistance intervention. As discussed later on, the selected events are deemed as relevant to quantify the key engagement indicators under analysis. For our convenience, hereafter each event will be represented by a symbol consisting of the number of the exercise surrounded by a colored shape that describes the type of the event. Specifically,
the symbol
![Algorithms 16 00464 i001]()
represents an access to exercise 1;
the symbol
![Algorithms 16 00464 i002]()
represents the submission of a correct solution for exercise 1;
the symbol
![Algorithms 16 00464 i003]()
represents the failure of exercise 1;
the symbol
![Algorithms 16 00464 i004]()
represents an assistance request for exercise 1;
the symbol
![Algorithms 16 00464 i005]()
represents assistance for exercise 1.
Since the main goal of the study is to quantify the engagement key indicators of the students attending an SQL laboratory using the most representative temporal sequences of events, we rely on an event data model consisting of a sequence database [
31], as described in
Section 4.1. Specifically, each symbol describing an event is an item and each subsequence is an ordered list of single events (or event sets) associated with a given student.
For example, the subsequence 〈
![Algorithms 16 00464 i001]()
![Algorithms 16 00464 i003]()
![Algorithms 16 00464 i002]()
〉 represents a student that accesses exercise 1, fails it, and then subbits the correct solution.
4.3. The CSpade Algorithm
The CSpade algorithm [
47], whose pseudocode is given in Algorithm 1, extracts all subsequences satisfying the input constraints by adopting a prefix-based strategy. The key idea is to decompose the original problem into smaller sub-problems using equivalence classes on frequent sequences. Each equivalence class can be solved independently and likely fits in the main memory. The enumeration step is known to be the most computationally intensive one and is traditionally performed via Breadth-First Search (BFS) or Depth-First Search (DFS) [
47]. However, as discussed later on in
Section 4.4, we envisage a further algorithmic optimization.
| Algorithm 1 CSpade [47] |
- Require:
, minsup, mingap, maxgap, maxwinsize - Ensure:
Sequences -
{Frequent elements} -
{Frequent sequence of k elements} -
for k=2; ; k = do -
Enumerate all the frequent sequences via BFS/DFS ▹ This step will be further optimized (see Section 4.4) -
{Candidate sequences of length k} -
while do -
for do -
Update c.support, c.size, c.gap -
end for -
end while -
satisfies all input constraints} -
end for
|
4.4. Computation and Analysis of Engagement Key Indicators
Teachers explore the sequential patterns extracted at the previous step to gain insights into students’ engagement in the SQL computer laboratories.
The student-related events considered in this study (see
Section 4.2) are exploited to analyze student involvement, motivation, and willingness to comprehend the fundamentals behind the SQL language. Specifically, the aim is to analyze the sequence database in order to characterize the behavioral, cognitive, and affective engagement levels of the students who participated to the laboratories.
The occurrence of single events (e.g., the access to a specific exercise) is not relevant enough to profile students according to their engagement level because it is likely to be related to the occurrence of other events that occurred in the past, potentially regarding different event types and exercises. Hence, the present analysis relies on the extraction of sequential patterns, which represent the most significant temporal correlation between the occurrences of multiple events. The idea behind this is to capture the most interesting temporal relationships between correlated events and obtain actionable knowledge about student activities, involvement, and motivation.
Based on the characteristics of the contained events, the extracted sequential patterns can be classified as follows:
Access patterns: This type of pattern comprises all the sequences whose elements are exclusively composed of events of type access to exercise. Since students (i) are provided with an ordered list of exercises, (ii) have no time limits to solve an exercise, (iii) and can move back-and-forth in the exercise list according to their preferences, exploring access patterns allows teachers to understand the way students deal with the laboratory exercises as well as to analyze the time spent on each exercise.
Successful patterns: This pattern category includes all the sequences whose elements comprise both access and successful attempts for the same exercise. They are deemed as relevant to explore both the level of complexity of the provided exercises and the level of competence of the students.
Assistance request patterns: This type of pattern includes all the sequences that comprehend a request for assistance.
Assistance intervention patterns: This type of pattern consists of all the sequences that comprehend an intervention of the teaching assistant. Together with the assistance request patterns, they provide interesting insights into the ability of the students to work in autonomy. They allow us also to identify the most common situations when students ask for help, and to study the impact of the intervention of a teaching assistant on the development of the current and following exercises.
Error patterns: This pattern type comprises all the sequences whose elements include events of type wrong submitted query for a given exercise. They can be exploited to identify the exercises generating major difficulties and to cluster students based on their level of competence, as well as to monitor the progresses of the students across the practice (e.g., to understand whether the trial-and-error approach actually works or not).
Time-constrained patterns: This class of pattern consists of all the sequences extracted by enforcing either a minimum/maximum gap between each element of the sequence or a maximum sequence duration (i.e., the elapsed time for the occurrence of the first element and those of the last one). Unlike all the previous pattern types, they give more insights into the timing of specific event. They can be exploited to analyze the timing of the activities and the responsiveness of a student (e.g., the time needed to submit the first query, the time needed to resubmit a query after a failure, and the overall time spent in solving an exercise).
As detailed in
Table 2, the above-mentioned pattern categories are mapped to the engagement key indicators reported in
Table 1.
5. Results
Multiple sequential pattern mining sessions were run on the sequence database acquired during the SQL laboratory sessions of a B.S. course held at our university (see
Section 4.2). The mined sequential patterns are explored in order to evaluate the effectiveness of the proposed methodology in supporting and monitoring students’ engagement levels.
The experiments were run on a machine equipped with an Intel(R) Core(TM) i7-8550U CPU with 16 GB of RAM running on an Ubuntu 18.04 server. To extract sequential patterns, we used the CSpade algorithm implementation provided by the respective authors. Multiple mining sessions were run by varying the minsup value to extract sequential patterns without time constraint, and by varying minsup, mingap, maxgap, and maxlen to mine time-constrained patterns.
5.1. Access Patterns
These patterns describe the timing of the students’ accesses to the proposed exercises during the SQL laboratory session. A sample of the extracted sequences is reported in
Table 3, with the relative support value (percentage of students that satisfy the specific sequence). Based on the sequences belonging to this pattern type, students can be clustered into two groups based on their profile of accesses to the proposed exercises:
Students using sequential patterns: this cluster consists of the students who accessed the exercises in the proposed sequence (from exercise 1 to 13).
Students using out-of-order patterns: this groups the students who follow a non-sequential order in accessing the assigned exercises.
Sequential patterns reveal that most students consecutively accessed the first five exercises. However, as the exercise number increases, the pattern support decreases. For example, it decreases by 4% from A1 to A2 and by 9% (179 students) from A2 to A3. Furthermore, the frequency count halves from A3 to A4. This result reflects the actual complexity of the proposed exercises: teaching assistants confirmed that the perceived complexity of exercise 5 was higher than expected. It should be noted that the application used by the students during the laboratory allowed them to access a specific exercise only after all previous ones are accessed. This is the reason why skipped exercises never occurred in these patterns (An exercise is considered as skipped when the student did not access it).
Out-of-order patterns reveal the students who came back to a previous exercise. In [
49], the authors highlighted the usefulness of “design by copying” practice, whereas in [
50] the authors paid attention to the “we do as we did in the previous exercise” thinking in learning practice. These behaviors also occur in this learning context and explain why the students are used to coming back to the previous exercises; most of students are facing the SQL language practice for the first time and they are not yet familiar with the subject.
Table 3 shows that
out-of-order patterns are almost equally spread over the first six exercises; in fact, the support value does not show any significant variation, as happened for the
sequential sequences. Conversely, it slightly varies between 16.7% (36 students) and 20% (43 students).
The differences between sequential and out-of order sequences are likely to be related to the
“Persistence” indicator of behavioral engagement. This aspect will be discussed later on (see
Section 6).
5.2. Successful Patterns
This pattern type describes the sequences that contain accesses and successful query submissions. The top-ranked sequences (in order of decreasing support value) are reported in
Table 4.
We can differentiate between sequential patterns and out-of-order patterns, even in this case; the first ones reveal the students that accessed an exercises only after having solved all the previous ones. Of the students who solved the first two exercises sequentially (pattern S1, ), 81.4% did the same for exercise 3 (pattern S2, ). Skipping exercise 3 is therefore a relatively rare condition. On the contrary, only 61.9% of the students who completed the third exercise succeeded in the fourth one (pattern S3, ). The sup(S4) (93 students) is almost equal to sup(S3) (91 students): only 1% (2 students) who solved the first four exercises did not solve exercise 1.
By comparing S2 with the access pattern A1, it appears that 27% of the students (58) who accessed the first three exercises did not solve at least one of them or even many of them; such a percentage increases (46.4%, 105 students) while also considering the fourth exercise (hence comparing S3 with A2). This means than more than half of the students who accessed the first four exercises failed at least one of them.
The
out-of-order patterns do not show the students who accessed an exercises without solving the previous ones, as one might think; they only show the students that accessed and solved the exercises contained in the pattern, without explicitly revealing that they did not solve the exercises that do not appear in the pattern. This is mainly due to the peculiar characteristics of the sequential patterns [
15]. This means that all sequences that contain
S2 also contain
S6, and therefore we can derive the percentage of students who solved exercises 1 and 3, but not exercise 2, by computing
.
In a similar way, we can compute , , and . The latter result clearly indicates that the difference between the students who solved exercises 1, 3, and 4 and the ones who solved all four exercises is only one student. Therefore, the second task was the easiest one for the students who solved these subset of exercises.
The successful pattern sequences can be related to the
“Concentration” key indicator of cognitive engagement, as discussed later on in
Section 6.
5.3. Assistance Patterns
This pattern category helps to analyze the students’ requests for help and the assistants’ responses. The patterns are divided into two subcategories:
Assistance request patterns and
Assistance intervention patterns. The former one reveals when and how often students ask for help, whereas the latter discloses when and how often assistants take action and quantifies the consequent effect.
Table 5 reports the top-ranked patterns separately for each subcategory.
Pattern H1 shows that some students asked for help more than once. This particular situation happened only for exercise 1; the students’ attitude in the case of the first exercise is different with respect to the next exercises, considering also that most of students requested assistance only once in the whole lab session.
Of the students who requested assistance, 86% (80 students out of 93) then solved it (pattern H2); by comparing H2 and H4, it turns out that 61 of them solved it after the assistance, while 19 of them succeeded autonomously.
The difference between students who succeeded after requesting assistance (H3, sup(H3) = 54) and the students who succeeded after assistant interventions (pattern H5, sup(H5) = 52) is less significant for exercise 2: only two students who asked for help solved the exercise autonomously. Notably, in exercise 3, all students that succeeded after requesting help have been assisted.
Patterns H10, H11, and H12 show the number of errors after assistants’ interventions for exercises 1, 2, and 3, respectively. As the exercise number increases, the support decreases; this is because exercises 2 and 3 generally were perceived as easier than exercise 1 (this situation will clearly emerge later on in the analysis of the time-constrained patterns). Note also that as the exercise identifier increases, the number of students who accessed it decreases (as previously discussed in the Accesses patterns analysis).
Pattern H10 identifies the students who received assistance, committed errors, and finally succeeded in exercise 1; by comparing the support value of such a pattern with those of H4, we can conclude that only 13 students succeeded immediately after receiving help.
The pattern of type “intervention–error–success” occurs only for exercise 1. For the next exercises, the minimum support threshold was not reached. Both Request effectiveness and Assistance effectiveness decrease as the exercises identifiers increase because the exercises become more difficult and the effects of assistants’ interventions are probably less evident in the very short-term.
The assistance patterns can be related to the
“Confidence” key indicator of cognitive engagement (assistance request patterns) and to the
“Autonomy” key indicator of affective engagement (assistance intervention patterns), as analyzed later on in
Section 6.
5.4. Error Patterns
This type of pattern is useful for describing the way students react to errors. We distinguish between
single errors patterns, which give a general overview about error distribution, and
repeated errors patterns, which describe how many time an error occurred. The most frequent sequences of both categories are reported in
Table 6.
The support value of the single errors patterns from E1 to E6 shows the number of students who solved a specific exercise after making at least one error. The Students (%) column in the table shows that most of the students who initially failed succeeded in the first three exercises; on the contrary, this is not true for exercises 4 and 5. Students (%) tends to decrease as the exercise number increase, because the queries become gradually more and more complex.
Pattern E7 indicates that 59.5% of students made at least one mistake for the exercises from 1 to 3. Many errors are relative to these exercises, considering that 94.9% accessed them (see pattern A1). Pattern E8 reveals a similar behavior; in fact, the percentage of students who committed errors in all the first four exercises is high (47.9%).
Patterns
E9,
E10, and
E11 show that at least half of the students committed errors before succeeding in at least one of the first three exercises, and this is consistent with the fact that students are currently learning the SQL language. In [
51], the authors stated that most query errors are simply trial-and-error inputs as incomplete attempts derived by lack of attention and syntax understanding. The trial-and-error schema is quite a common method in SQL learning.
The repeated errors patterns confirm this behavior; in fact, patterns from E12 to E21 highlight that many wrong queries are relative to the same exercise, whereas patterns E22 and E23 show that this may happen more than once for the same student.
The difference between single errors and repeated errors patterns can be related to the
“Reflection" key indicator of cognitive engagement, as discuses later on in
Section 6.
5.5. Time-Constrained Patterns
Time-constrained patterns are exploited to answer specific questions related to the timing of the laboratory activities. They can be related to the
“Understanding” indicator of cognitive engagement, as discussed later on in
Section 6.
We set
mingap to 10 and varied the
maxgap values from 10 s to 5 min (i.e., 10 s, 60 s, 120 s, 180 s, 240 s, 300 s). Hence, here we focus on small time intervals to capture short-term student behaviors. The extracted patterns are reported in
Table 7.
Most of the attempts submitted in the very first minutes failed. Thirty students who accessed exercise 1 made a mistake in less than one minute (see pattern T1). By increasing the maximum gap threshold to 2 min, the number of failures for exercise 1 increases and some wrong queries for exercises 2 and 3 start to appear (patterns T4 and T3). By setting maxgap to 180, access-error patterns appear for most exercises (from T6 to T12), revealing that the practice to try to submit a solution very quickly is quite popular; in addition, T5 shows that 13% of students solved exercise 2 in less than 3 min (this particular exercise is the one that was solved, on average, in the shortest amount of time). Even though the required competences are slightly more advanced than in the previous exercise, students have already become familiar with the learning environment.
By increasing the maximum gap threshold to 4 min, the access–success patterns related to exercise 2 become more frequent (pattern T13), and similar patterns occur for exercise 3 and 4 (pattern T14 and T15). When the maximum threshold is set to 5 min, the same pattern also occurs for exercise 6 (see pattern T19). Access–success patterns for exercises 1 and 5 do not appear when maxgap is set to 300, since they required more than 5 min to be solved.
Patterns T16 to T19 show the percentage of students who solved exercises 2, 3, 4, and 6 in less than five minutes; considering such a time constrain, exercise 2 was solved by 21.4%, exercise 3 by 14.0%, exercise 4 by 17.7%, and exercise 6 by 10.7%.
By setting
mingap to 600 and
maxgap to 900 (time intervals between 10 and 15 min), the extracted patterns (reported in
Table 8) are all related to exercises 1, 3, and 5. This shows that these are the exercises for which the students encountered most of the issues.
The difficulty level experienced by the students is not always directly related to the actual difficulty level of the exercises because other factors can have an influence, such as the familiarity with the learning environment, which plays an important role when the approach is mainly a trial-and-error one.
To detect the lab activities that required a longer time, we set
mingap to 1800 (30 min) and did not enforce any
maxgap constraint.
Table 9 reports the extracted patterns.
Of the students, 15.8% spent more than 30 min on exercise 1 before accessing exercise 2 (pattern L1). This points out once again the problems discussed previously about exercise 1. Another interesting pattern is L2: it reveals that 73.5% of students spent at least 30 min before accessing exercise 5 after having accessed exercise 1. Considering that the laboratory session lasted 90 min and consisted of 13 exercises of increasing difficulty, students proceeded very slowly (notice however that they are not supposed to finish all exercises in the lab, but to finish them as homework). The comparison between pattern L2 and pattern A2 shows that only 21 students accessed exercise 5 after 30 min (9.7% of all students, 10.3% of those who accessed exercise 1).
Pattern
L3 confirms the difficulties in solving the first exercises of the lab; 24 students (11.2%) who accessed exercise 1 accessed exercise 4 after at least half an hour and exercise 6 after another 30 min. Eighty-two students (38.1%) who accessed exercise 3 accessed exercise 5 after 30 min (pattern
L4); this means that solving both exercise 3 and 4 took a long time. Considering the difficulty rank deduced before, and the error patterns in
Table 6, this is mainly due to the high number of errors and the time spent on exercise 3.
5.6. Discussion
The extracted patterns can be used to gain insights into the students’ learning experience during the SQL laboratory sessions. Very few students completed all the assigned exercises: most of them completed only the first six exercises. The results confirm that the proposed practice was too long for a 90-min session. The teachers’ objective, in fact, was to challenge the students with more exercises than were strictly required in order to encourage them to complete the practice at home.
Access patterns show that as exercise number increases, the number of students accessing it decreases, because most of them are struggling on the previous ones, whereas Successful patterns and Error patterns show that few students who solved exercise 4 pass all of the first four exercises; these findings reveal the general difficulty in solving the first part of the lab session.
In a time interval of 5 min after access to the exercises (see
Table 7), a significant number of students could solve only exercises 2, 4, 3, and 6. Exercises 1, 3, and 5 were the ones where students had more problems (see
Table 8). Furthermore,
Table 9 shows that approximately 16% of students spent more than 30 min on exercise 1 before accessing exercise 2, and that approximately 3 out of 4 students spent at least 30 min before accessing exercise 5 after having accessed exercise 1. A difficulty disparity between exercises 2, 3, and 4 and exercises 1 and 5 is therefore evident. Regarding exercise 1, this is understandable because most students were using the learning environment for the first time, and this was also the first time they had practiced with SQL. Exercise 5 caused many problems for most of the students because it introduced new SQL language structures.
Assistance patterns show that the requests for help and the assistants interventions were usually useful for solving the exercises, and that the students succeeded in most cases after being helped. Students were used to asking for help after a few minutes from the exercise accesses, and often many students asked for assistance simultaneously; this caused a waiting time of up to 10 min before being assisted. In addition, they rarely required assistance twice for the same exercise. The assistants usually intervened after 10 min, due to the high number of assistance requests. In addition to the startup delay, there are some specific exercises (especially number 5) that required a long time to be solved. Some of the students solved the exercise before the assistant interventions (especially for exercise 1).
In general, students submitted several wrong queries before the correct one, showing a trial-and-error approach that is typical for a laboratory session in computer science courses.
Through sequential pattern analysis, teachers could reinforce the lab experience by considering the discovered issues. First of all, an introduction of the lab environment could be suitable for limiting the startup problems; some exercises could be solved step-by-step by the assistants to prepare the students for the autonomous work. The sequence of the proposed exercises could also be modified to better reflect the students’ perceived difficulties.
6. Engagement Analysis
The extracted sequences can be conveniently used to describe the engagement characteristics of the students who participated to the SQL laboratory sessions. Specifically, we consider the key engagement indicators described in
Table 1 and the association between KEIs and the sequential pattern types reported in
Table 2 (see
Section 4.4). In the following, we present both the results of the students’ profiling step according to their engagement characteristics and the outcomes of the correlation analysis between different KEIs.
6.1. Students’ Profiling
Students can be described according to their level associated with each of the six KEIs. For the indicators
Concentration,
Reflection, and
Autonomy, we define two levels (
High or
Low), whereas for
Persistence,
Confidence, and
Understanding we exploit a three-level categorization (
High,
Medium, or
Low).
Table 10 contains details of the sequences used to assign the students to a specific level of a given KEI.
The graph in
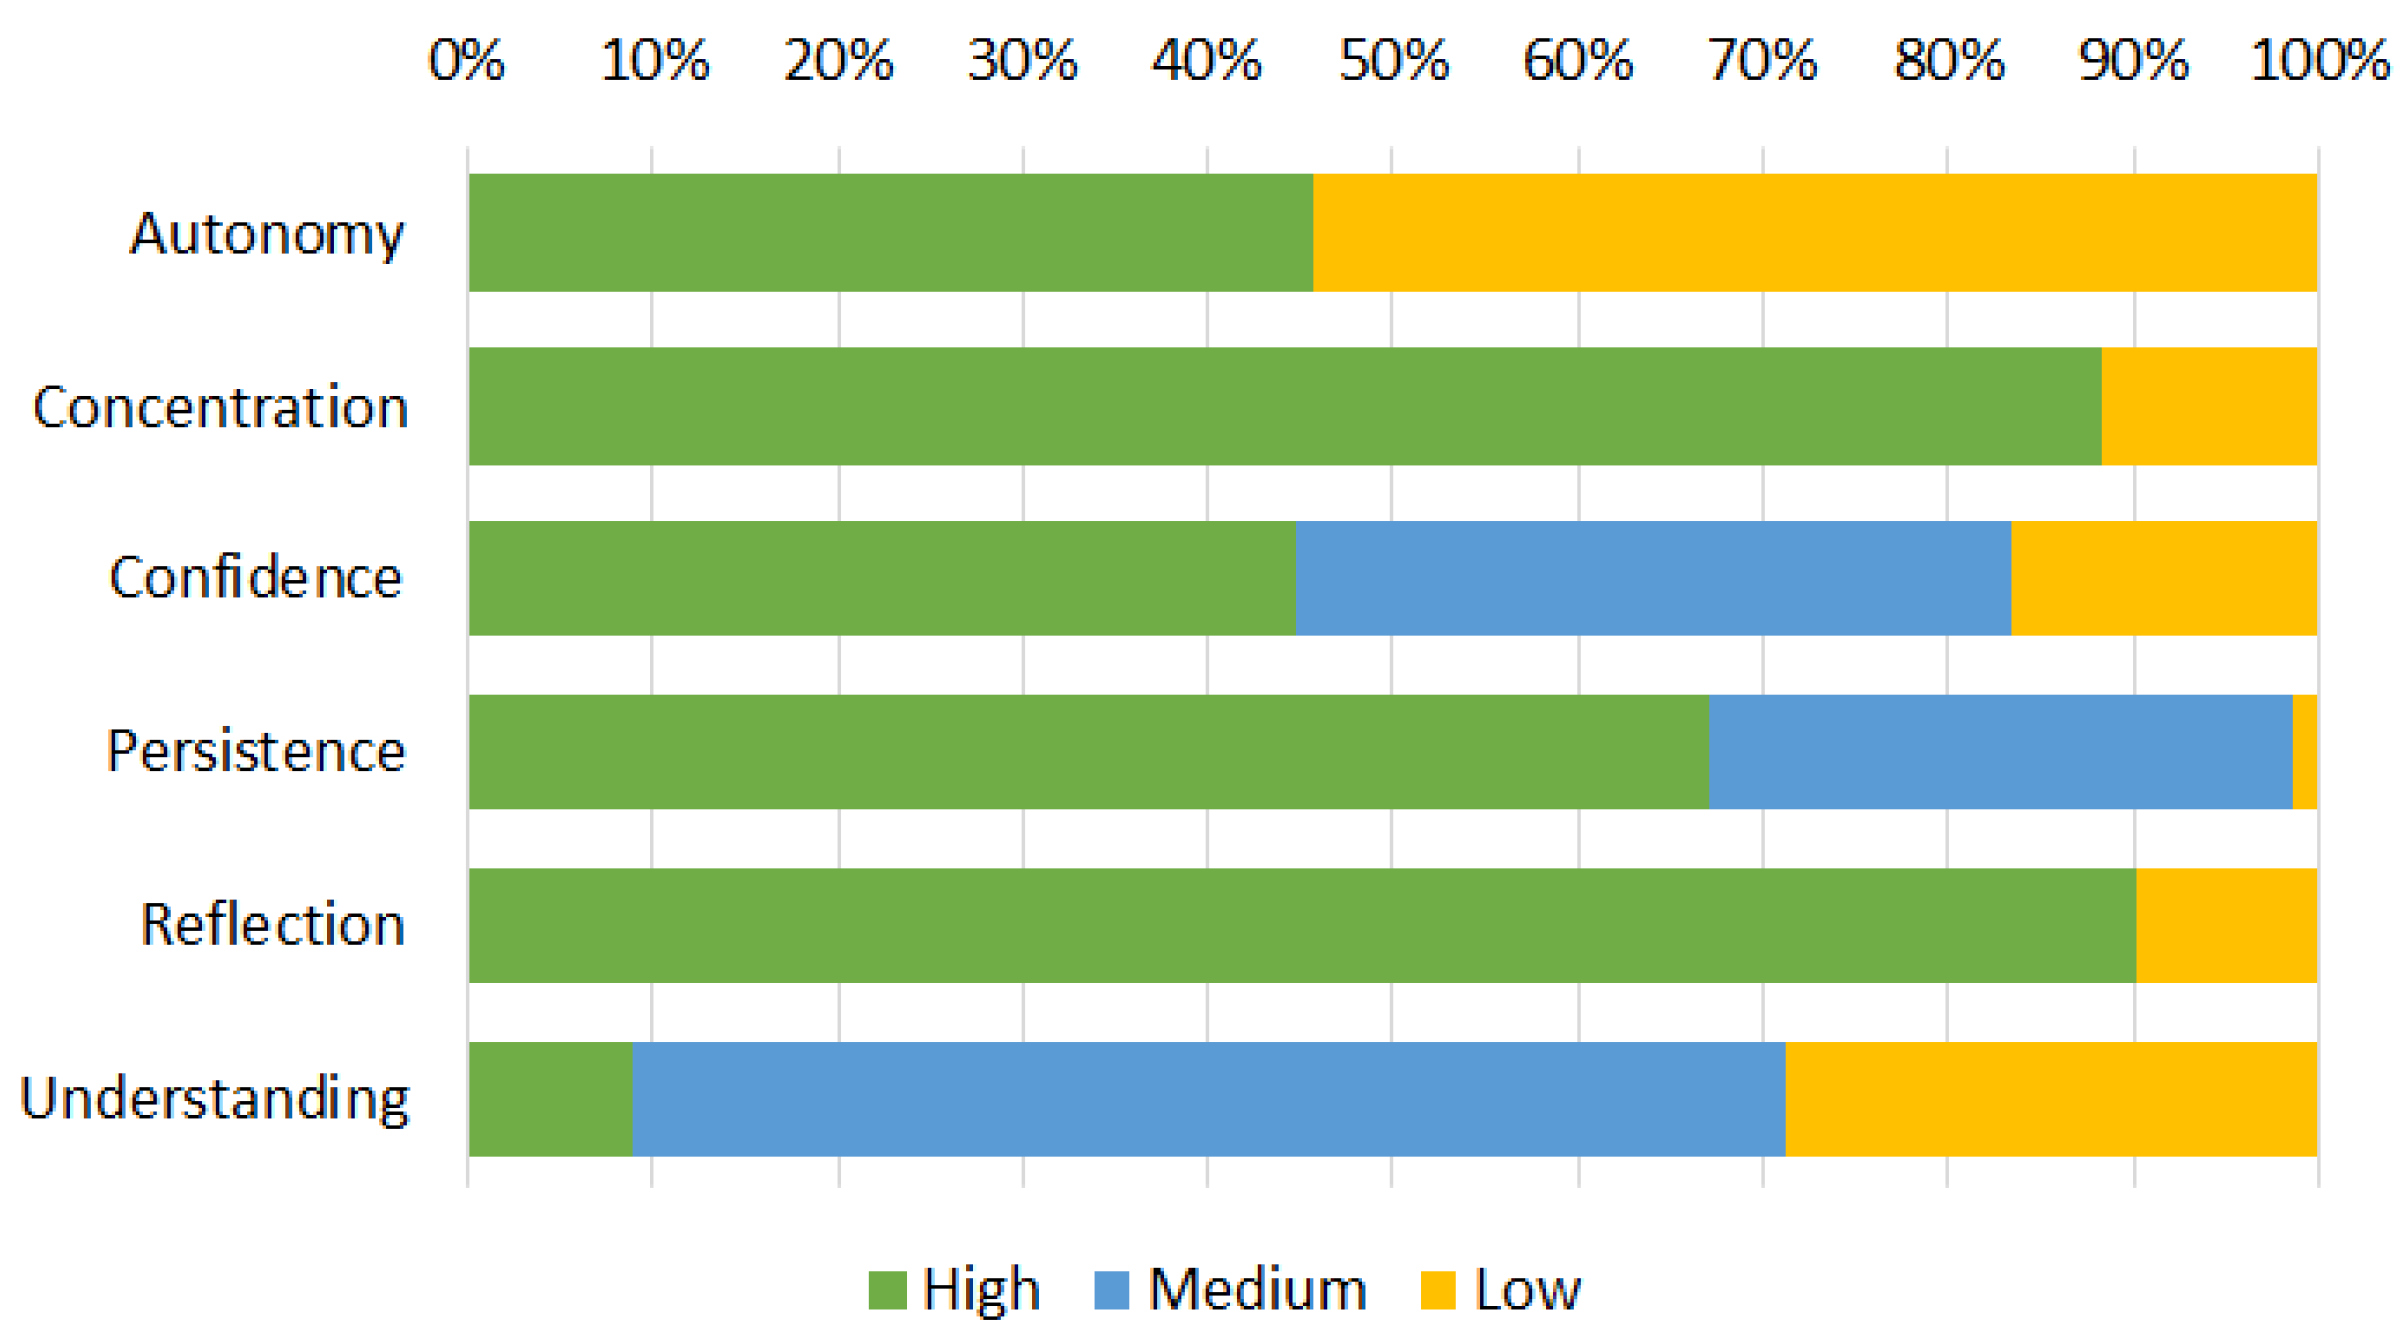
Figure 2 shows the distribution of the engagement characteristics of the students under the six identified dimensions.
Persistence,
Concentration, and
Reflection are high for most of the students, denoting a fairly high commitment to the task for the majority of the students, whereas
Confidence,
Autonomy, and
Understanding show rather variable distributions. This is understandable since the level of individual competence and skill can be different, and this influences individual self-confidence and results.
Understanding, in particular, shows quite significant variations: few students were very quick to solve exercises (
High Understanding), whereas most of them were able to solve them in a larger interval of time (
Medium Understanding); the rest of the students were not able to solve the exercise in a predefined interval of time (
Low Understanding).
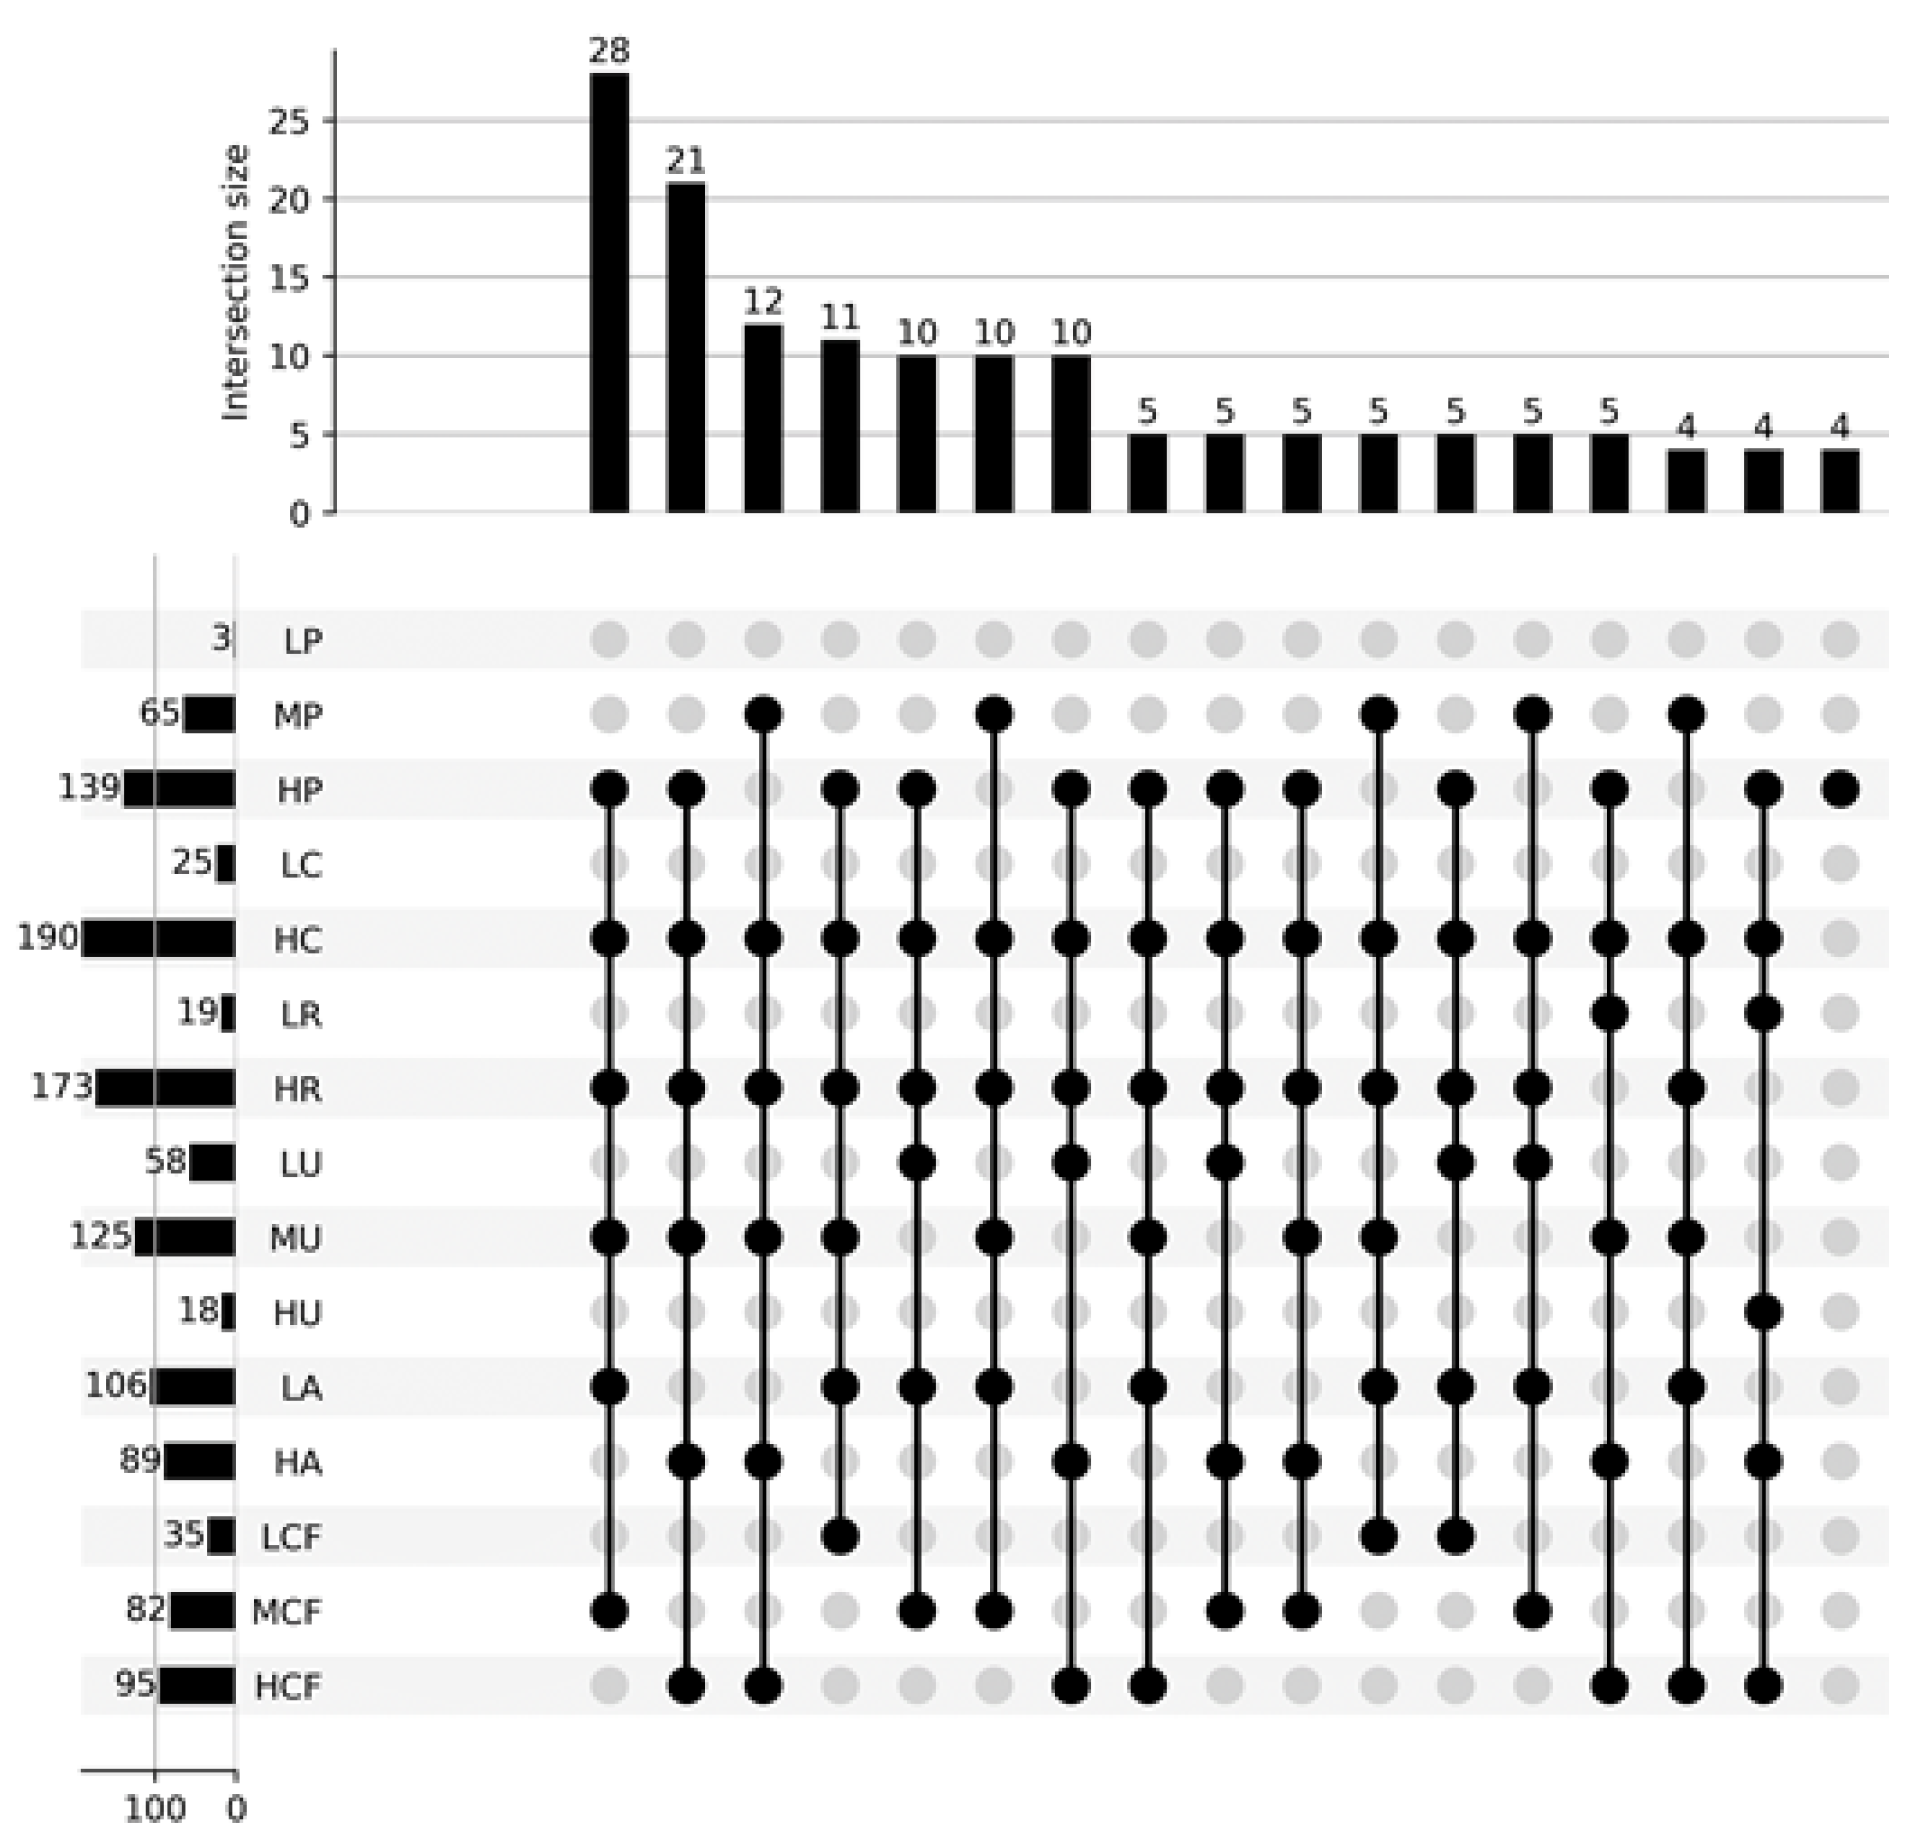
Figure 3 shows the distribution of the students according to the chosen dimensions: each vertical bar represents the number of students who have the same characteristics, which are described by the black dots below (e.g., 28 students have LA =
Low Autonomy, HU =
High Understanding, HR =
High Reflection, MCF =
Medium Confidence, HC =
High Concentration, and HP =
High Persistence). The horizontal bars represent the number of students who have that particular characteristics (e.g., 106 students have LA =
Low Autonomy). The figure shows only the groups composed of at least four students.
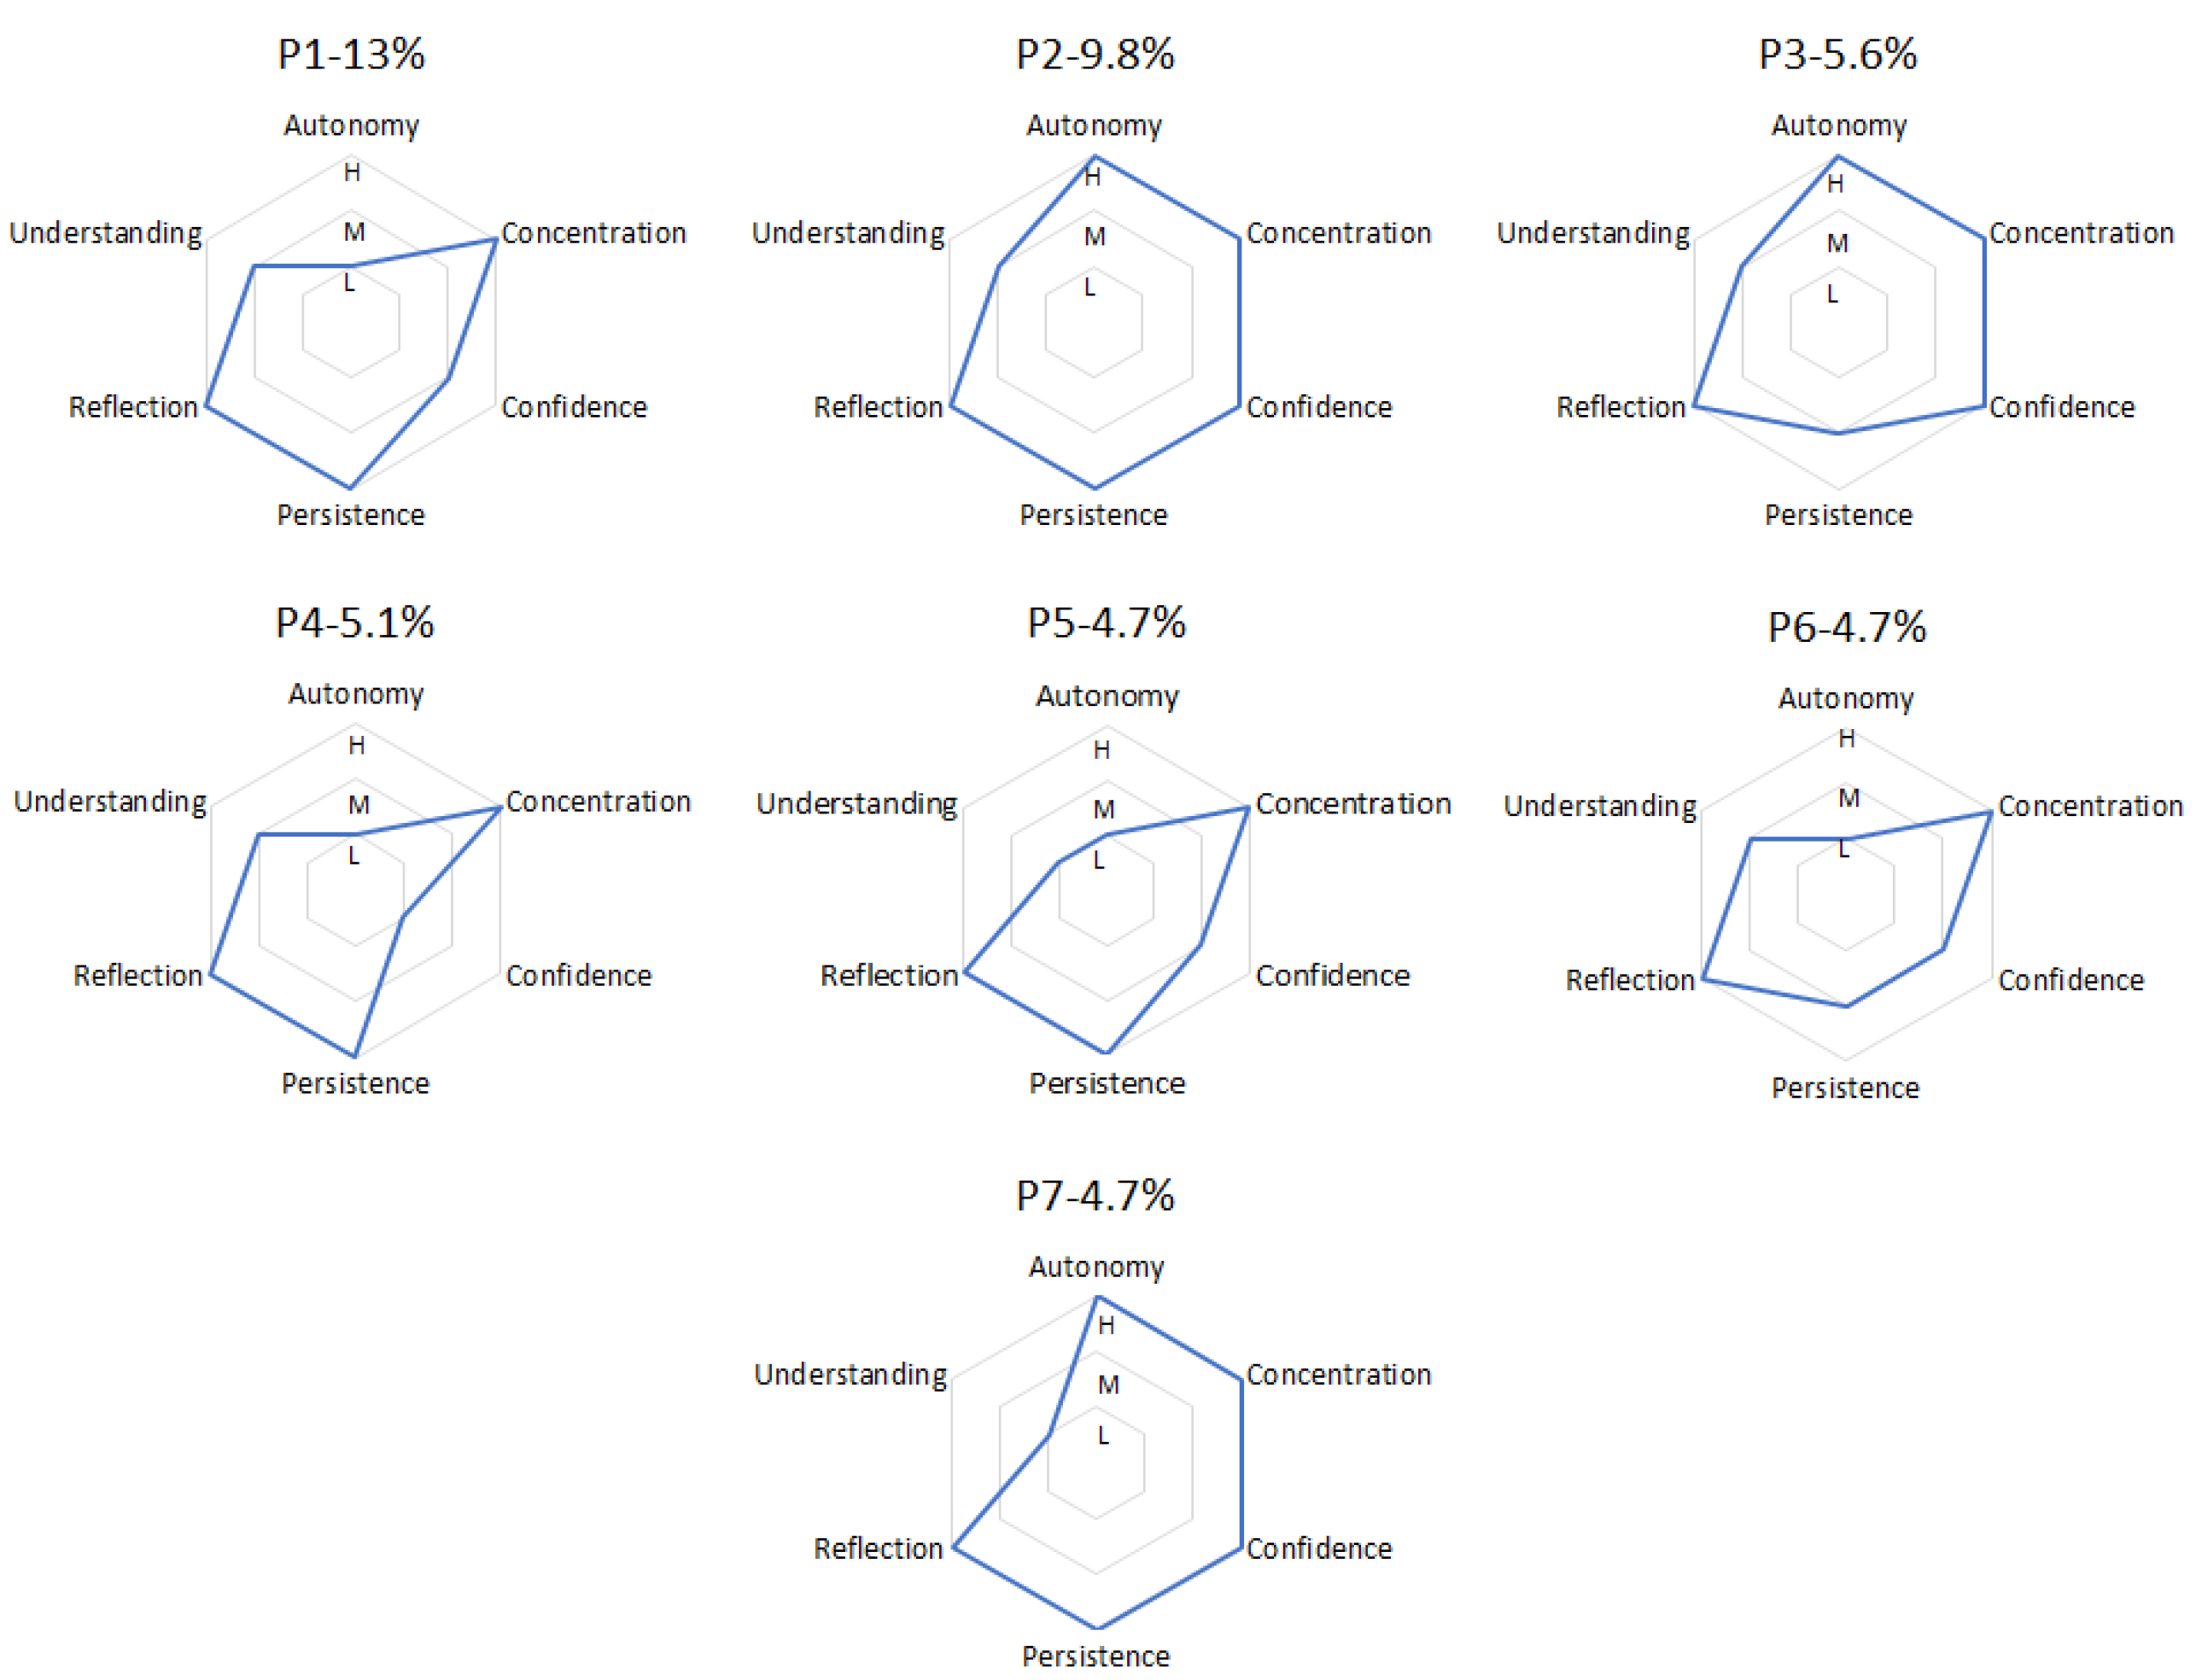
Each student group represents a specific student profile. The radar plots in
Figure 4 show the details of the most common profiles. The percentage of students who belong to profile P1, for example, is 13% of the total number of students (215). The considered profiles, together, account for almost 50% of the students (47.4%). Each radar plot shows the level (H =
High, M =
Medium, L =
Low) of the engagement dimensions for the students belonging to a specific profile.
The takeaways from the student profile distributions presented above are summarized below.
Autonomy and Confidence are correlated with each other (see all profiles): either they are both High or they are both Medium/Low. This situation makes sense because Confidence is related to students’ help request, and High Confidence means few help requests, whereas Autonomy to correct solutions with or without help (High Autonomy means few or no help interventions), and most of the times help requests lead to help interventions.
In general, all profiles show High levels of Concentration and of Reflection: students are able to stay focused during the whole laboratory session and they are challenged by the proposed exercises.
Students with profile P2 show high commitment (High Persistence and High Concentration), good self-confidence (High Confidence and High Autonomy), and good results (Medium Understanding).
Students with profile P7 show high commitment (High Persistence and High Concentration), good self-confidence (High Confidence and High Autonomy), but worse results (Low Understanding).
Students with profiles P1 and P4 need some help (Medium/Low Confidence and Low Autonomy) but still demonstrate the capability to focus on the task (High Persistence and High Reflection) and to obtain good results (Medium Understanding).
Students with profiles P3 and P6 show some indecision, going back and forth among exercises (Medium Persistence), or simply they want to get an overall idea of what they are requested to do in the whole lab session. This behavior does not compromise their performance: they focus on the task (High Persistence and High Reflection) and obtain good results (Medium Understanding), with more (profile P3) or less (profile P6) self-confidence and autonomy.
Students with profile P5 show serious difficulties in performing the requested tasks (Low Understanding) despite their commitment (High Concentration and High Reflection) and the help they request and obtain (Medium Confidence and Low Autonomy).
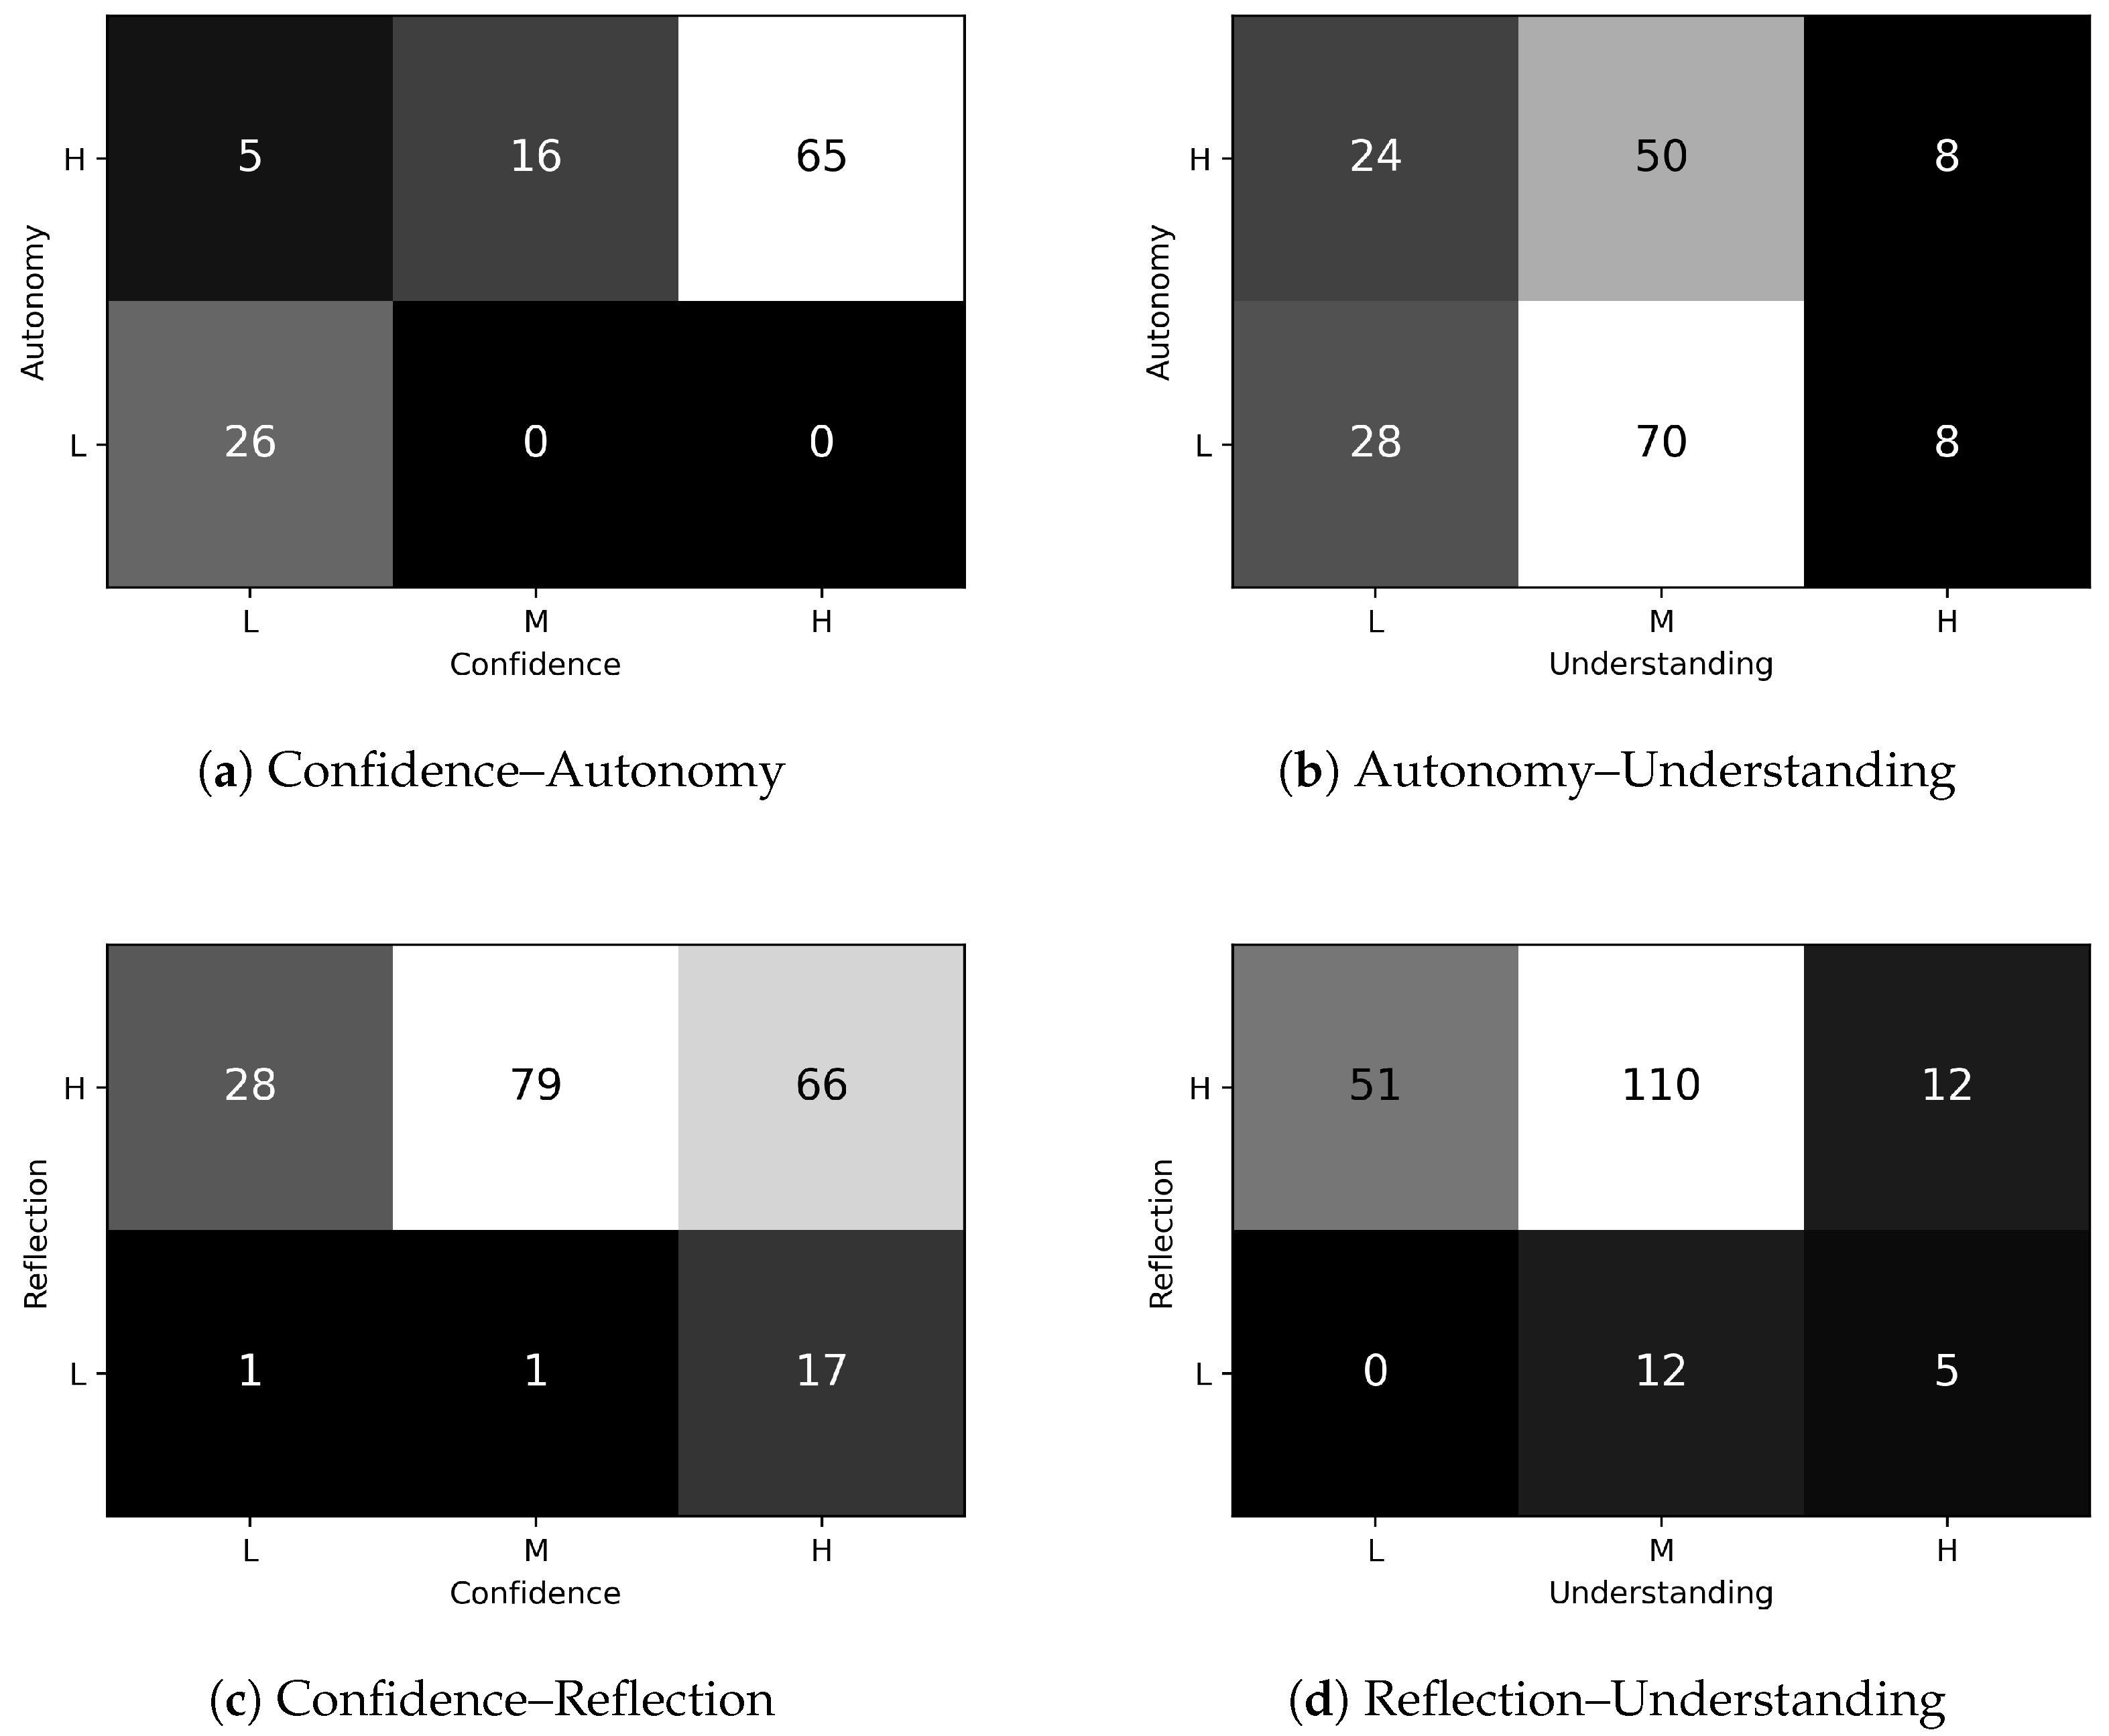
6.2. Correlation Analysis among the Engagement Dimensions
Here we analyze the pairwise intersections of the six engagement dimensions. Although we considered the pairwise intersections in
Figure 5, we show only the most representative ones. The numbers in the matrices represent the number of students who have the characteristics of the corresponding areas, where
H =
High,
M =
Medium, and
L =
Low.
The intersections between Autonomy and Confidence offer valuable insights into how these two indicators interact. Notably, when High Autonomy aligns with Low Confidence, we observe a dimensionality of 5. Interestingly, the most substantial intersection occurs when High Autonomy combines with High Confidence, resulting in a dimensionality of 65. This indicates a strong correlation, implying that individuals with high autonomy levels often coexist with high confidence levels, potentially reinforcing each other.
Conversely, Autonomy and Understanding are independent. This shows that help interventions, while they are generally sufficient to solve the specific task for what they were requested, are not always effective for supplying a more comprehensive level of understanding, applicable to all the tasks. Furthermore, they show that the perceived need for external support is very personal and not always related to the actual need.
Similarly, Reflection and Understanding are not correlated.
Confidence positively influences Reflection. Specifically, 66 of the students who have High Confidence also have High Reflection. Conversely, only 26 of the students have Low Reflection. This is justifiable because self-confidence helps students to rely on their own capability and to address problems with a reflective approach (compared to a trial-and-error one).
6.3. Discussion
The results shows that the SQL laboratory session involved students who were quite interested and motivated for the whole duration of the session. This is consistent with the fact that laboratory sessions were not compulsory, so students participated because they wanted to practice and learn, and the lab duration was not excessive (90 min).
Students came to the lab sessions with different backgrounds of competence and skill, depending on the practice they did before the lab. This reflects on the different levels of confidence and autonomy demonstrated by the analysis. This background, together with the individual attitude for reflection, influences the understanding dimension, measured in relation to the performance in the assigned task.
We detected some specific student behaviors that were useful for solving the exercises. Specifically, the first one is defined by copying and practice, which is a common feature in programming, because it is focused on logical thinking rather than on the memorization of the complete code syntax. The second practice is the trial-and-error schema (also know as “what if”); it reveals the students’ attitude of learning from mistakes. It is really common in computer programming learning and it is also typical of gaming thinking. In addition, students generally prefer to proceed step by step, and avoid skipping; however, considering the complexity of some specific exercises (e.g., 5), they risk being stuck for a long time. We also noticed that most students who participated in the lab had a reflective attitude compared to a trial-and-error one, consistent with what is encouraged during the course.
The analysis of the correlation between the different engagement dimensions considered in the present paper shows that there is a strong link between cognitive and affective engagement, and that that they influence one another. Specifically, Autonomy and Confidence are strongly correlated, as are Confidence and Reflection. A good level of affective engagement reflects on cognitive engagement, and vice-versa: self-confidence positively influences the capability to focus effectively on a problem, and in turn good results obviously enhance self-confidence.
The results also show a fairly high correlation between some cognitive engagement dimensions, namely Concentration, Reflection, and Understanding: this reflects the steps in which the students face and solve the proposed exercises, focusing on them, reflecting on the possible solutions, and then submitting the answer.
7. Conclusions
This work proposes a method to deeply analyze student’s behavior during laboratory sessions. It relies on data collected in the context of a B.S. degree course on database design and management. The collected data describe the main activities performed by the participants during a computer laboratory session.
Confidence and
Autonomy are strongly correlated with each other, as shown in diagram (a). Specifically, 68% of students who have
High Confidence also have
High Autonomy, whereas 74% of the students who have
Low Confidence also have
Low Autonomy. This evidence confirms what previously emerged in the analysis of the most frequent profiles (see
Section 6.1), and it is explained by the fact that, commonly, when students asked for help (
Confidence) they received it (
Autonomy).
Concentration and
Autonomy, on the other hand, are independent: 47% of students who have
High Concentration have
High Autonomy as well, and 53% have
Low Autonomy. The general level of
Concentration is
High (see
Figure 2), but
Autonomy is a characteristic of the students that is mainly influenced by self-confidence rather than by the capability to focus on a given task.
Autonomy and Understanding are also independent, as shown in diagram (b). Specifically, 44% of students who have High Understanding also have High Autonomy and 44% of them have Low Autonomy, while 41% of students who have Low Understanding have High Autonomy and 48% of them have Low Autonomy. This shows that help interventions, while they are generally sufficient to solve the specific task for what they were requested, are not always effective for providing a more comprehensive level of understanding applicable to all the tasks. Furthermore, they show that the perceived need for external support is very personal and not always related to the actual need.
Most students have
High Concentration and
High Reflection (as shown in
Figure 2), and they are correlated with each other: 87% of students who have
High Concentration also have
High Reflection, and only 9% of them also have
Low Reflection. This is understandable, because the capability to focus on a task influences the attitude to apply a more reflective approach in problem solving.
Confidence positively influences Reflection, as shown in diagram (c). Specifically, 69% of students who have High Confidence also have High Reflection. Conversely, only 18% of the students have Low Reflection, and 84% of students who have High or Medium Confidence also have High Reflection. This is justifiable because self-confidence helps students to rely on their own capability and to address problems with a reflective approach (compared to a trial-and-error one).
The implication that Reflection positively influences Understanding clearly emerges from the performed analyses, as shown in diagram (d). Specifically, 71% of students with High Reflection have High or Medium Understanding, whereas only 29% have Low Understanding, and only 28% of students who have High Understanding have Low Reflection. The attitude to face a problem in a more reflective way has a positive influence to apply what has been learned in the following problems. The sequence of exercises was proposed by the teacher with this goal in mind, to progressively build competence and skills in the specific subject.
No specific correlation was found between Persistence and the other dimensions, possibly because the persistence level was high for almost all the students: the laboratory was not compulsory so the participating students were mainly committed to it, with a good level of behavioral engagement. If the laboratory would be compulsory, the results would probably have been different, with a variable level of behavioral engagement that could have influenced cognitive and affective engagement aspects.
Discussion
The results shows that the SQL laboratory session involved students who were quite interested and motivated for the whole duration of the session. This is consistent with the fact that laboratory sessions were not compulsory, so students participated because they wanted to practice and learn, and the lab duration was not excessive (90 min).
Students came to the lab session with different backgrounds of competence and skill, depending on the practice they did before the lab. This reflects on the different levels of confidence and autonomy demonstrated by the analysis. This background, together with the individual attitude for reflection, influences the understanding dimension, measured in relation to the performance in the assigned task.
We detected some specific student behaviors that were useful for solving the exercises. Specifically, the first one is defined by copying and practice, which is a common feature in programming, because it is focused on logical thinking rather than on the memorization of the complete code syntax. The second practice is the trial-and-error schema (also know as “what if”); it reveals the students’ attitude of learning from mistakes. It is very common in computer programming learning and it is also typical of gaming thinking in the SQL language. The experiment considered various types of events, such as the accesses to exercises, the correct answer submissions, the errors, the assistance requests, and the teaching assistants’ interventions.
The paper explores the use of sequential pattern mining techniques to analyze the temporal correlations between the student-related events that occurred during the lab sessions. Based on the extracted patterns, students were profiled according to their levels of engagement in various dimensions. By examining the most significant extracted patterns and profiles, it was possible to obtain a detailed view of the students’ activities. This allowed us to recognize cause–effect correlations, positive aspects, and points of criticism in order to improve the lab experience.
The pattern extraction phase allowed us to define a number of key engagement indicators that are useful for assessing the level of behavioral, cognitive, and affective engagement of the students during the computer lab sessions. The students demonstrated a very good level of behavioral engagement (Persistence), a satisfactory level of cognitive engagement (Concentration, Reflection, Understanding, and Autonomy), where Autonomy and Understanding are the most variable dimensions, being dependent on the individual background of competence and skills. Regarding the level of affective engagement (Confidence), it is highly variable, depending on the individual capability to face the proposed tasks. Furthermore, the engagement analysis highlighted some interesting correlations between the identified engagement dimensions. The latter findings, in particular, showed that the cognitive dimensions of engagement are strictly correlated with the affective dimensions, and that they positively influence one another.
Future works will focus on tracing, collecting, and analyzing students’ data in laboratories related to different courses. The key goal is to discover which patterns are universal and which ones are subject-dependent. We will also explore the use of different learning environments (both online and in person) and the application of a similar approach to event sequence mining to data acquired in different learning contexts, such as persuasive and recruitment games.


 〉 represents a student that accesses exercise 1, fails it, and then subbits the correct solution.

