1. Introduction
With the rapid development of intelligent transportation systems (ITSs) in the big data era, a huge amount of up-to-date data are being collected, archived, and analyzed from a variety of sources such as smart phones, probe vehicles, video cameras, and infrastructure-based detectors. Traditional detector loops and more advanced technologies, such as radar and microwave detectors, have been widely deployed in large metropolitan areas to monitor the traffic flow in a real-time manner. These systems deal with thousands of detector stations with high temporal resolution at 20 to 30 s per update, which poses great challenges for the efficiency and computational cost of analyzing ITS data. One of the main challenges is to assess the road network condition quickly and accurately for a given moment and efficiently infer and forecast meaningful spatial and temporal trends for the future, which can be useful for many ITS applications such as monitoring networks, planning traffic, and mitigating congestion [
1,
2].
Previous research has aimed to model the road network by considering every road segment within it. However, this approach may not be practical for large traffic networks and real-time applications. Furthermore, missing data will significantly impair the effectiveness of this method. To address this issue, our focus is on creating low-dimensional network models that only require monitoring of a selected subset of road segments.
To develop accurate low-dimensional models for large and diverse road networks, prior research has primarily focused on techniques such as principal component analysis (PCA) [
3,
4,
5,
6,
7]. However, PCA models are difficult to interpret in terms of individual links in the network. Djukic et al. used PCA to analyze OD pair data in a small network [
4,
5], while Asif et al. applied various subspace methods to compress traffic speed data [
8]. These studies demonstrated that subspace methods like PCA and DCT (discrete cosine transform) can effectively reduce the size of traffic data. However, they do not provide detailed insights into traffic patterns for specific roads and time periods. In addition, implementing PCA online still requires information from all detectors in the network because the principal component is basically a linear combination of all columns of the original data, which greatly reduces the efficiency of data processing. This is the reason why PCA is mostly used offline for dimension reduction purposes.
In contrast, the CUR decomposition [
9] considers selecting subsets from individual links and time instances, enabling us to directly extract underlying spatial and temporal patterns in large road networks. In 2013, Mitrovic et al. explored the use of the CUR matrix decomposition method for compressing and sensing traffic speed data. They compared this method to PCA and showed that the resulting low-dimensional models from CUR are much more easily interpretable. They also demonstrated how CUR can be used for compressed sensing of traffic data [
2]. In 2015, Mitrovic et al. employed column-based (CX) low-dimensional models based on their previous research to improve the scalability of compressed sensing and prediction. The researchers broke down the compressed prediction error into different parts and examined how they related to each other, and their numerical findings demonstrate that this approach considerably lowers computational expenses with little effect on prediction accuracy [
10]. The benefits of the CUR method are achieved with a trade-off of greater prediction errors as the compression ratio (the ratio of original number of columns to number of columns in a low-dimensional representation) increases. Nevertheless, there is significant room for improving the process of selecting columns based on statistical leverage [
9] calculated from singular value decomposition (SVD) [
11]. Another issue is that the author only tested a limited range of compression ratios from 2 to 10 [
2,
10], which is not sufficient to depict the performance of the proposed method. In addition to leverage-based column selection, Couras et al. proposed [
12] an algorithm to perform the approximation of the tensors based on the CX decomposition for matrices. Han and Huang [
13] proposed a road network compression method to improve the efficiency of data processing based on correlation analysis and CX decomposition, which is then integrated into a deep learning network to predict the short-term traffic flow.
Apart from matrix decomposition, transformation techniques such as discrete Fourier transform (DFT) and discrete wavelet transform (DWT), which are commonly used for compressing signals and images, can be adapted for spatiotemporal data. In the context of road traffic data compression, methods involving DCT and SVD are utilized, leveraging Kronecker product and tensor decomposition [
14]. Additionally, by organizing the data in a multidimensional format, algorithms based on DWT are integrated to achieve dimensionality reduction [
15]. To harness the benefits provided by signal processing methods from other data types, the field of graph signal processing (GSP) [
16] has been developed to conceptualize spatiotemporal data as a two-dimensional graph signal and establishes operations like linear filtering and linear prediction. Furthermore, Chindanur et al. [
1] adopted graph Fourier transform (GFT) and achieved less than one percent reconstruction error (RE) on California’s Interstate 605 (I-605) freeway data. Although the GFT-based method outperformed other methods, the problems are twofold: (1) it is difficult to interpret in terms of individual detectors, and (2) the model is too complex, possessing a mathematical form which is unlikely to be deployed and understood by practitioners in real world situations.
To summarize, previous studies have focused on the PCA approach, matrix decomposition methods, and signal transformation techniques to compress large datasets and represent the overall network condition using low-dimensional approximations. Three major research gaps were identified, as follows. First, the CUR decomposition method is widely used due to its strong interpretability, whereas the approach to selecting the optimal subset of columns remains to be improved. To this end, the clustering method is explored in this study to enhance the representing performance. Second, most previous studies failed to compare their method of selecting columns with a random sampling approach with equal probabilities. Finally, most studies only evaluated their algorithms in a limited range of compression ratios, but more interesting insights could be discovered if more cases, especially those under a high compression ratio, are tested.
To address these issues, this paper aims to utilize a column-based CUR matrix decomposition technique integrated with a clustering method to represent the original traffic network as a smaller subset of original columns with acceptable errors. The experiment was conducted using radar detector outputs (speed) aggregated at 5 min resolution from Nashville, TN. A group of representative detectors are selected using the proposed weighted average method to establish a relationship with the original network by analyzing the historical data and calculating the relationship matrix offline. In addition, this study incorporates clustering analysis into CUR decomposition inspired by the methodology of computing stock indexes such as the S&P 500 and Nasdaq. Analogous to selecting stocks from different sectors to represent the whole market, a clustering analysis was first conducted, followed by the normal CUR decomposition within each cluster, and results from each cluster would be merged as the final outputs. In this regard, we also reviewed several papers applying clustering algorithms to tackle problems in the traffic domain. Nguyen et al. [
17] applied clustering algorithms to obtain labels automatically from the data and presented the results of clustering analysis using both point-based and area-based features, highlighting the superiority of the area-based approach in producing meaningful clusters. Cheng et al. [
18] proposed an improved fuzzy c-means clustering method to classify urban traffic states with real world traffic flow data. Chen et al. [
19] utilized dynamic time warping (DTW) k-means clustering to classify lane-changing risk profiles into several categories. In the traffic domain, clustering methods are mostly used to categorize time series over different locations.
2. Materials and Methods
2.1. Data and Study Area
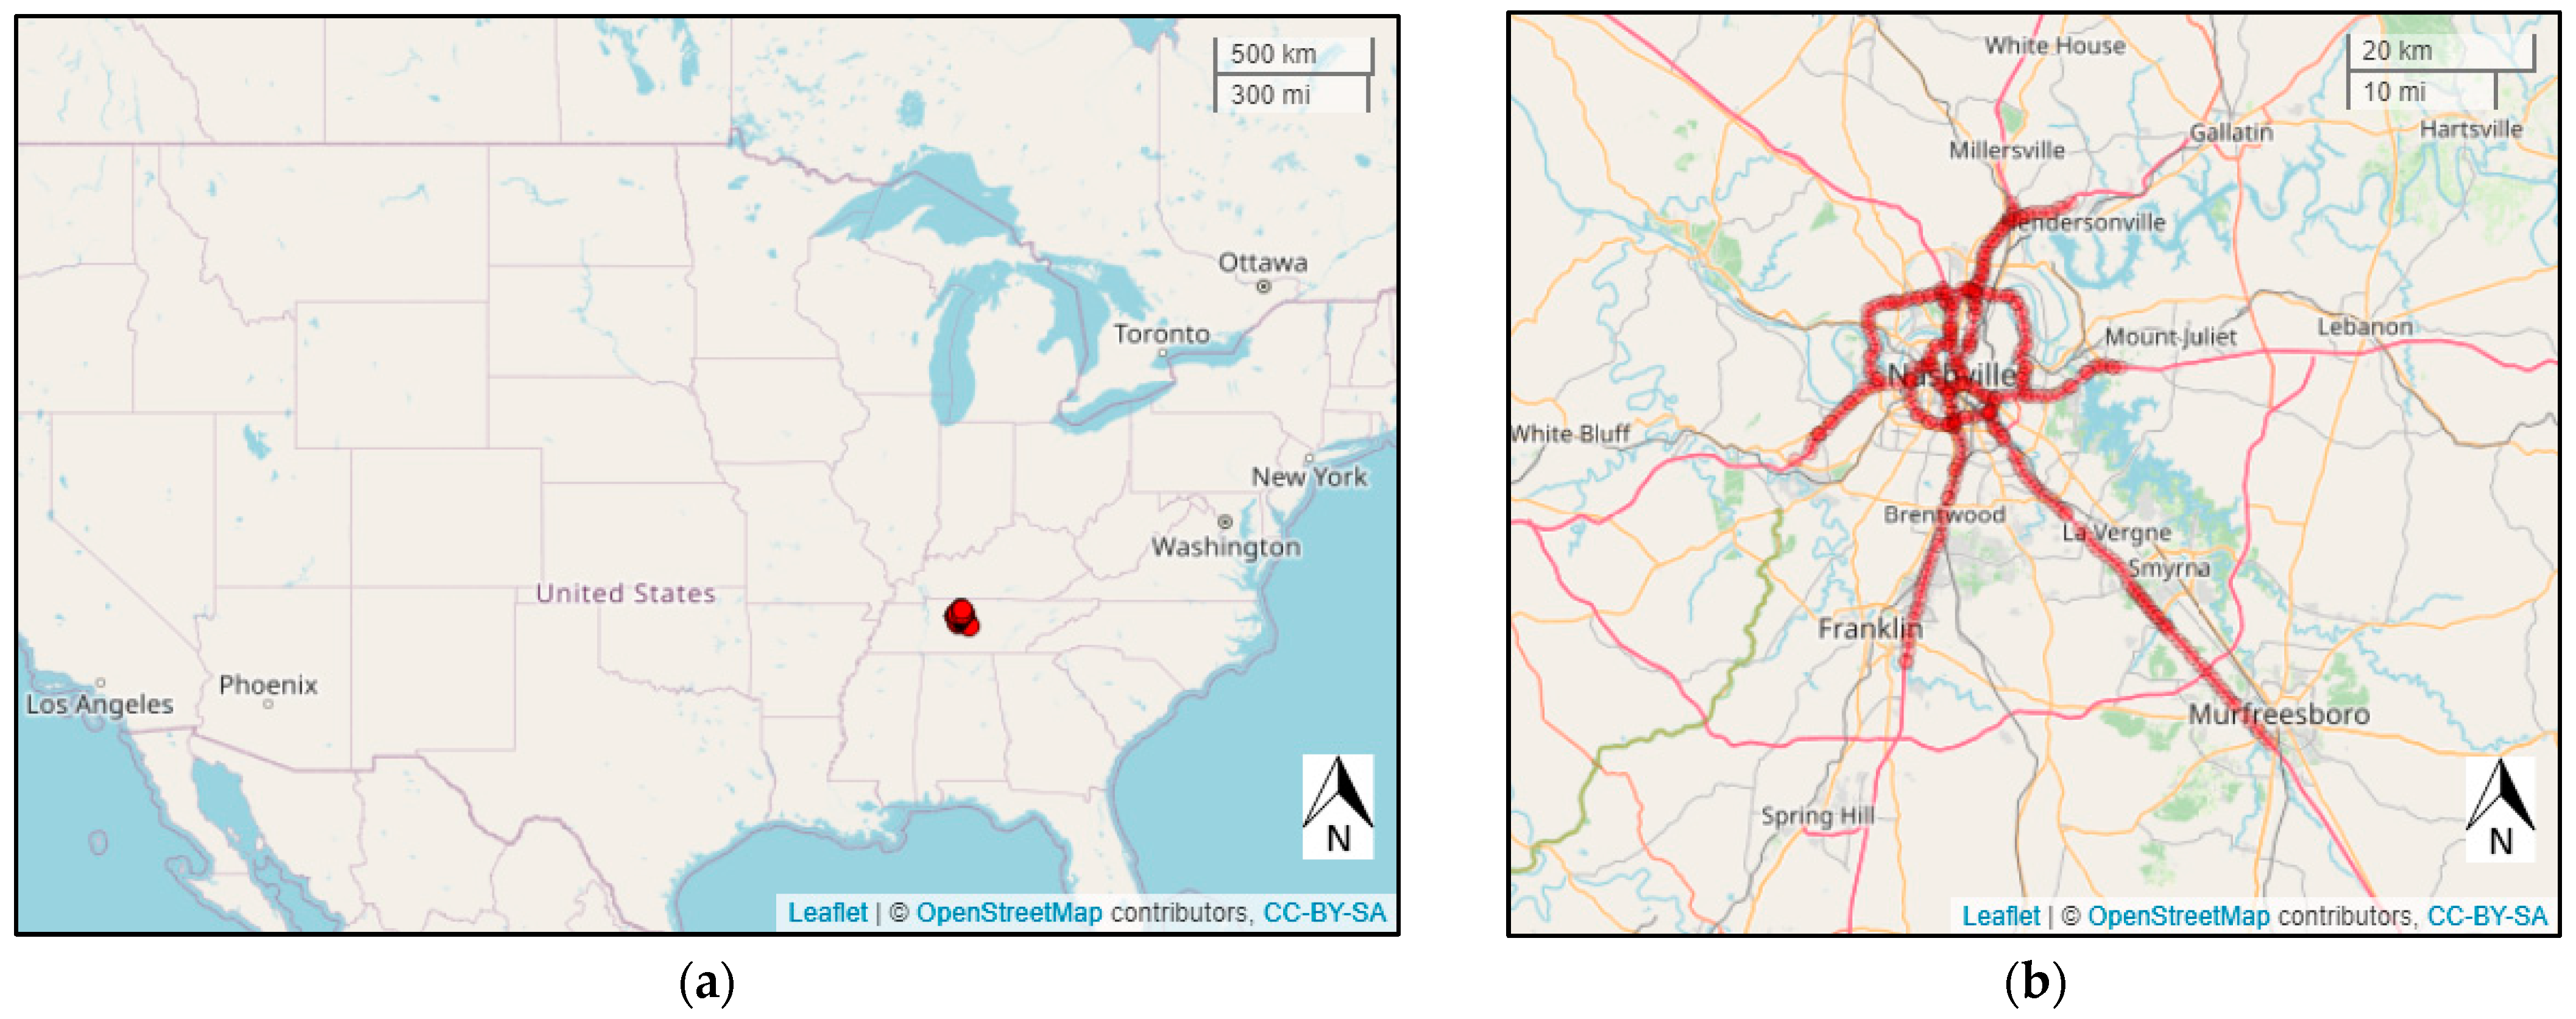
The radar detector system (RDS) in Nashville consists of 349 detectors covering 564 directional links. The geographic locations of the detectors used in this study and the shape of input data matrix are displayed in
Figure 1.
Figure 1a displays where Nashville, TN, is in the US, and
Figure 1b shows the location of all detectors in Nashville, TN.
The objective of this study is to represent the traffic condition of a massive network, and traffic speed is one of the most widely used and most intuitive characteristics to reflect the traffic condition at a specific location. Thus, traffic speed data were sampled from 9 July 2023, to 29 July 2023. The first two weeks of data were used as training data to select the most representative detectors and learn the relationship matrix, while the remaining one week was used to evaluate the performance of the proposed framework on new data.
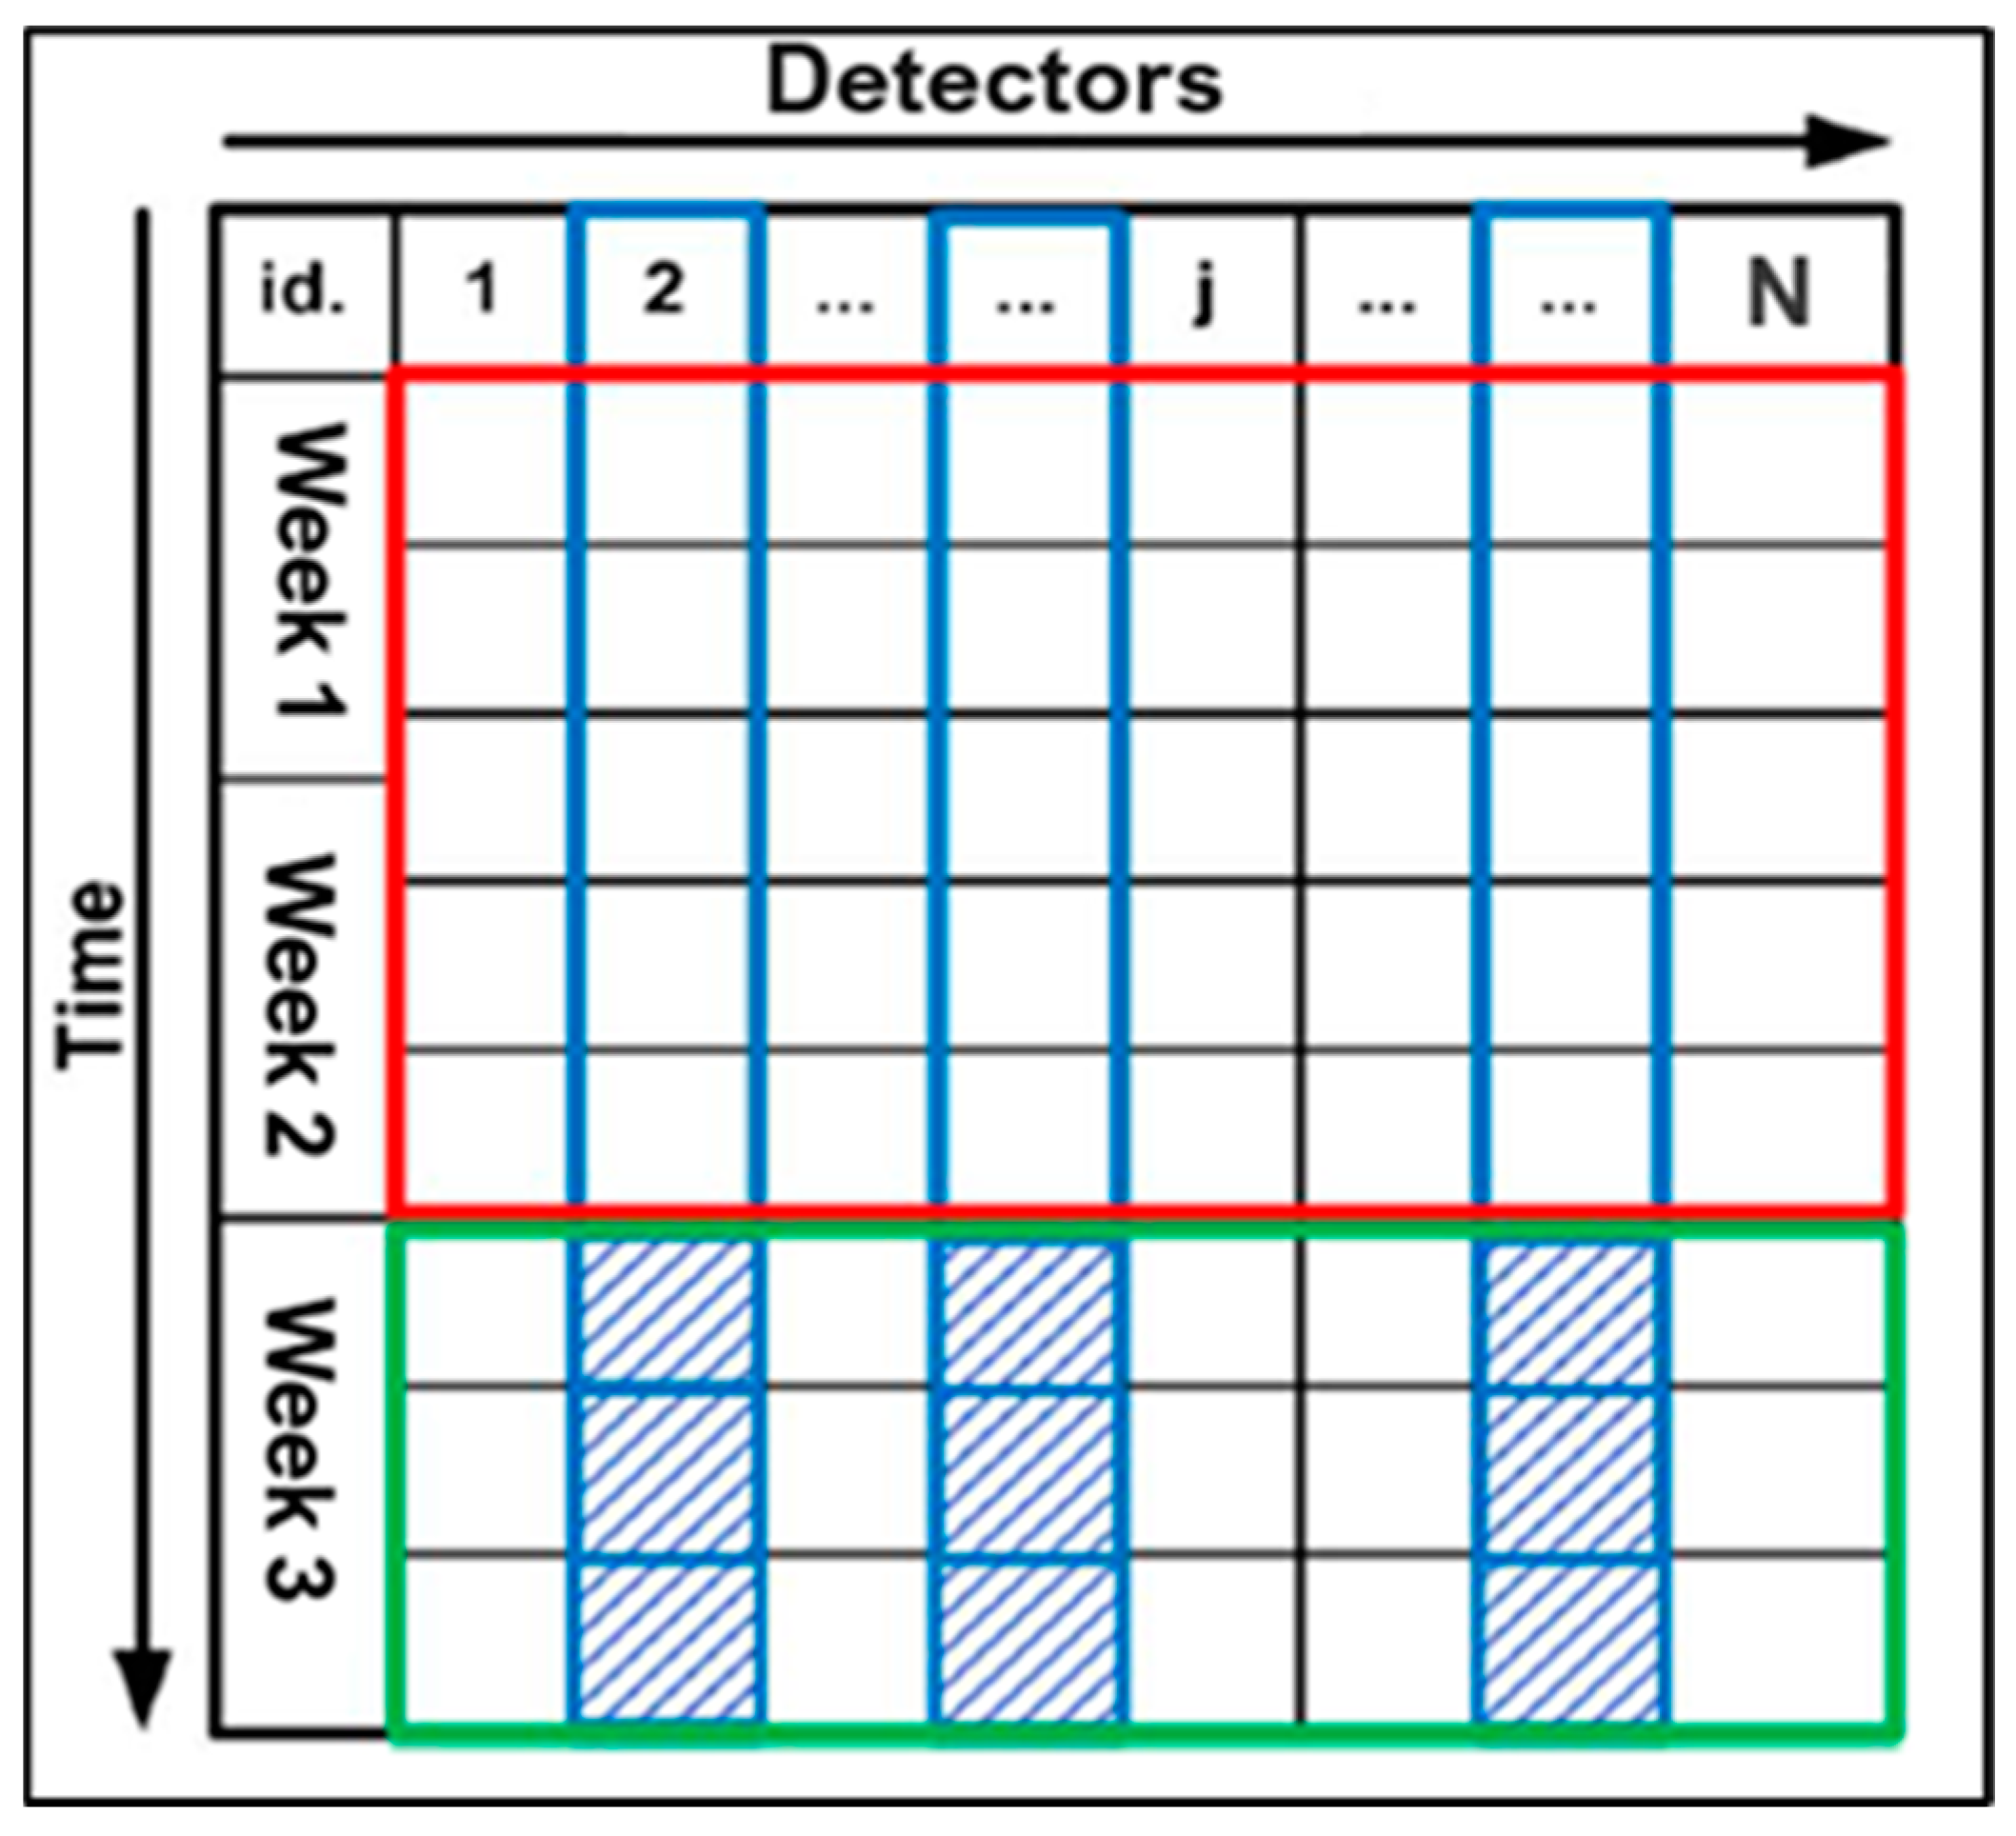
Figure 2 shows the input data matrix.
The raw data, updated each 30 s, were first aggregated to 5 min to reduce randomness and variability, which will greatly reduce the computational cost as well. We will also implement an online application scenario by applying the relationship matrix learned from 5 min data to 30 s raw data in a near “real-time” manner.
2.2. CUR Decomposition
This section will briefly describe the details of different CUR decomposition methods and present the proposed column-based CUR decomposition algorithm integrated with clustering method.
As shown in
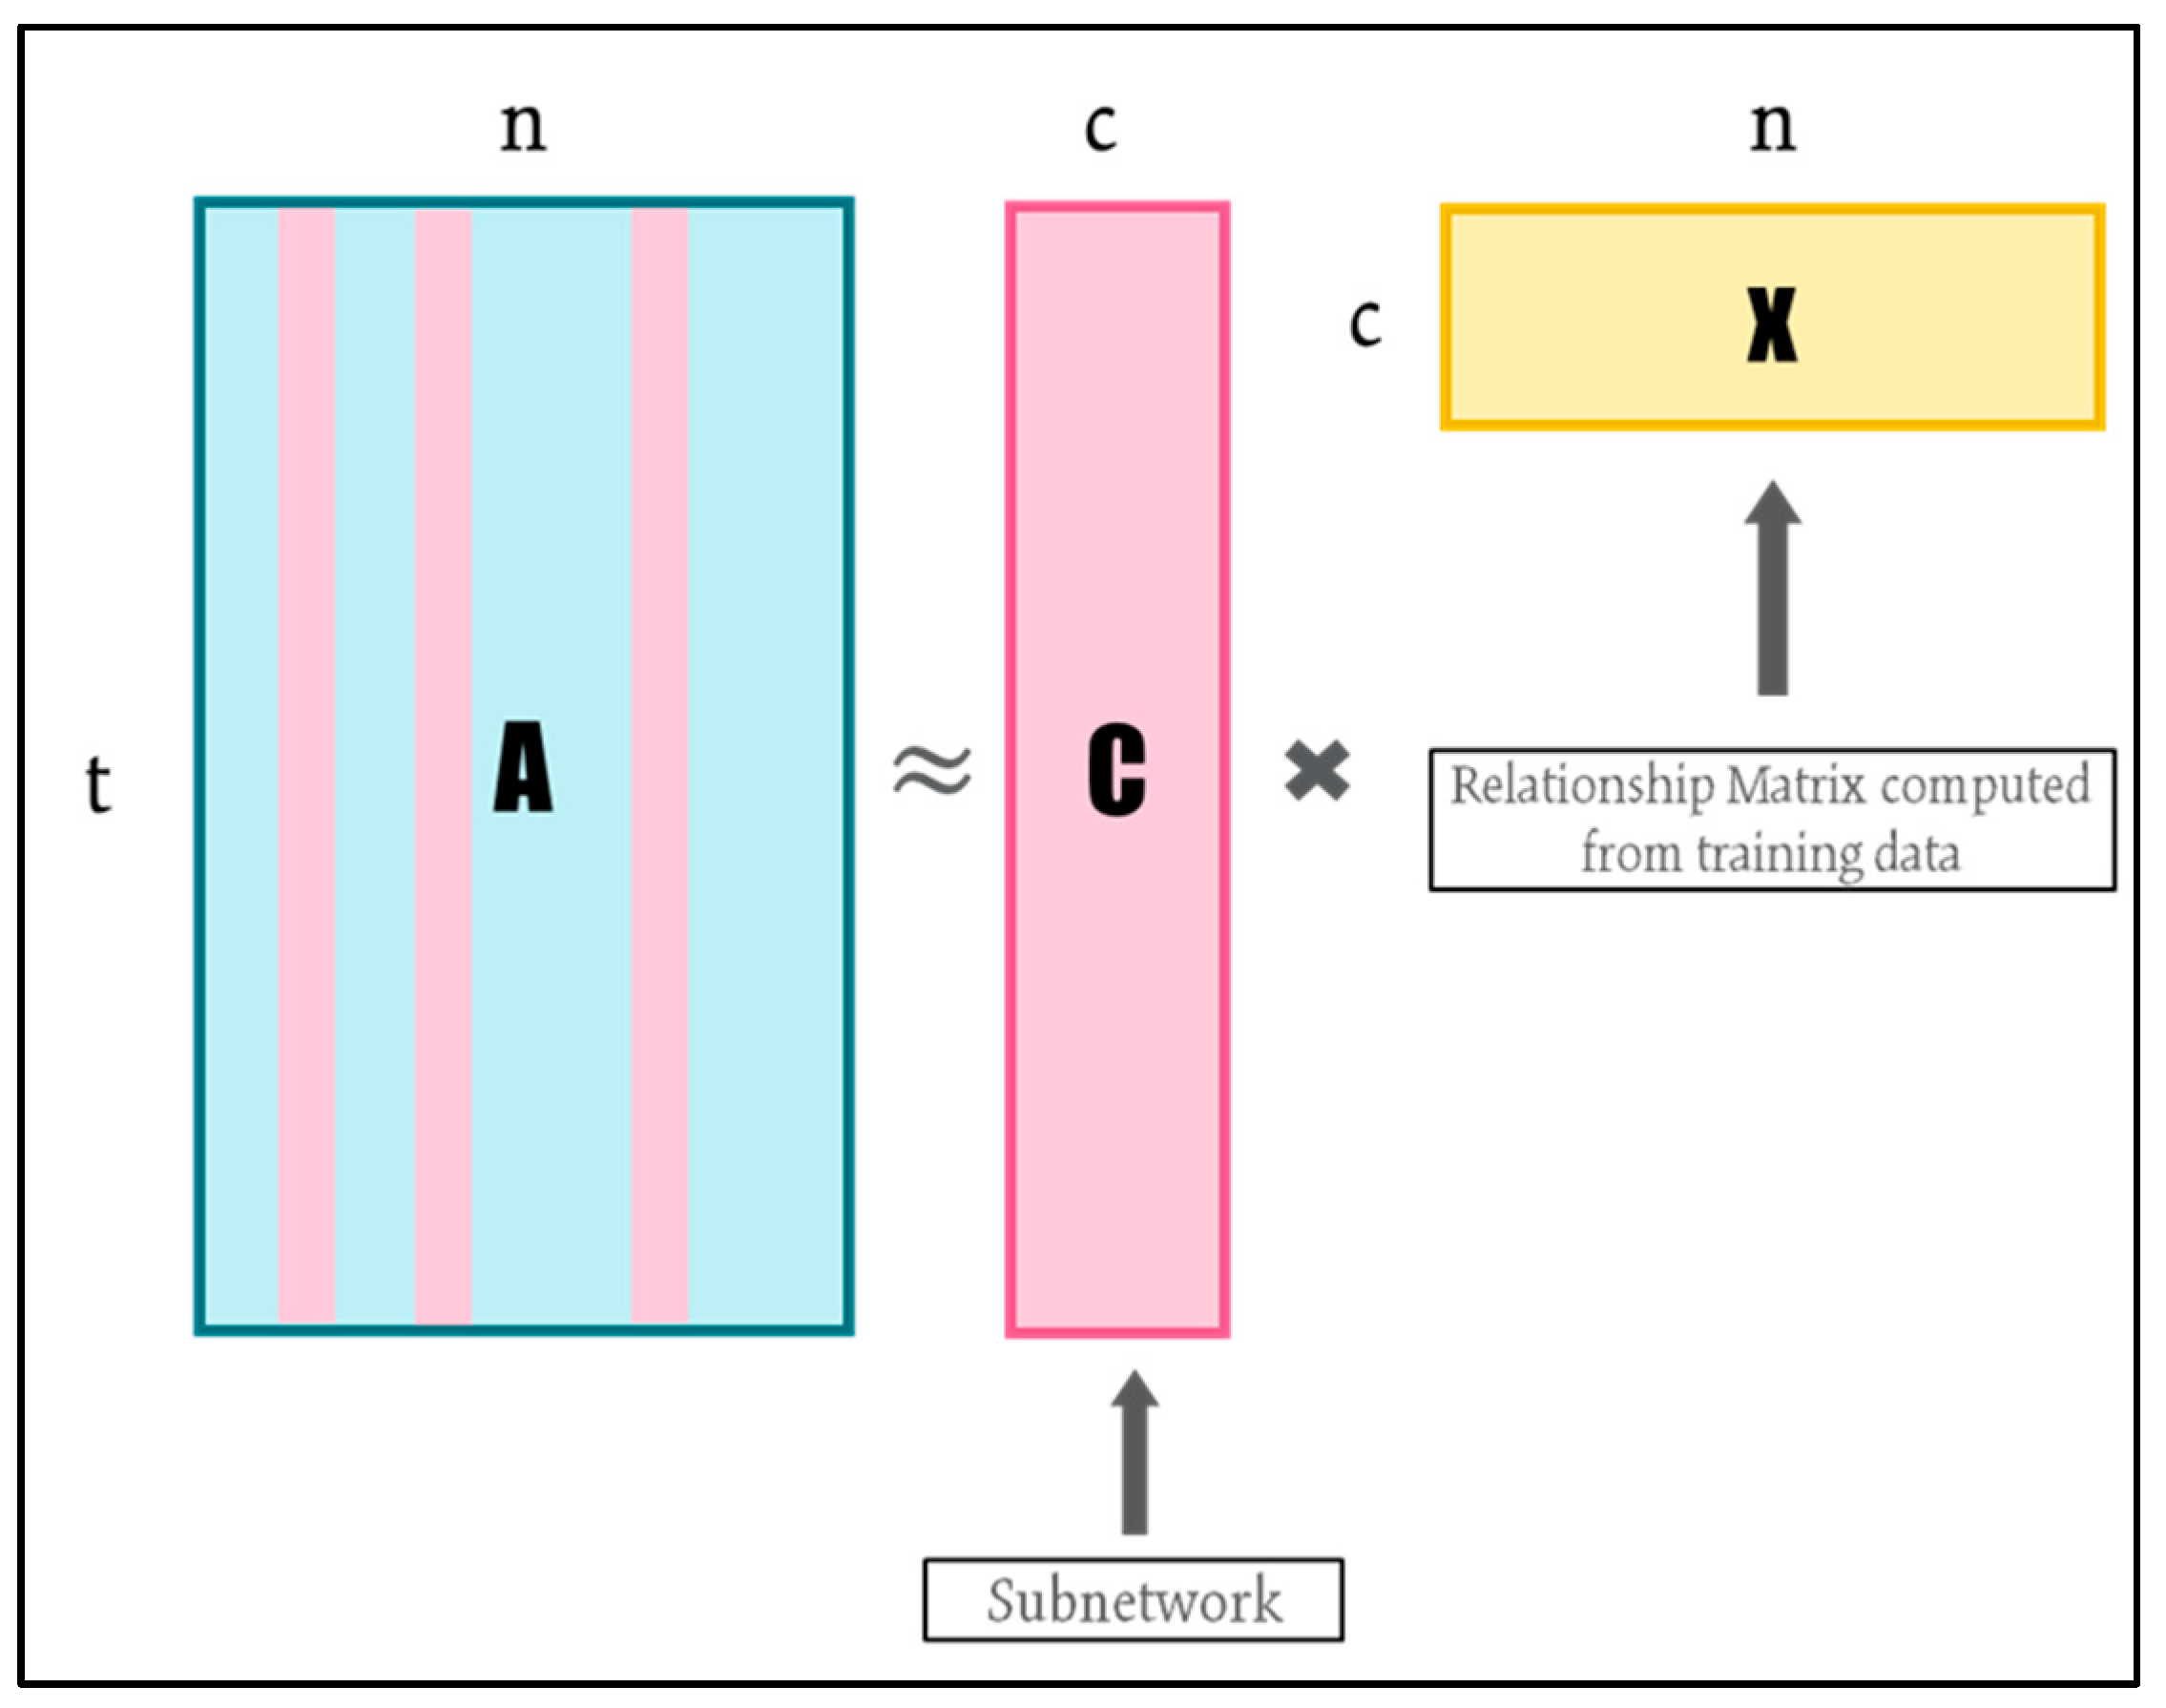
Figure 3, let
denote the original data matrix with t time instances in row and n detector links in column. Firstly, we define a compression rate as the ratio of number of selected columns to the total number of columns in matrix
(CR = c/n). The objective of column-based CUR is to find a submatrix
consisting of c columns of
to create a low-rank approximation
as shown in Equation (1):
where
is Moore–Penrose pseudo-inverse of matrix
[
20].
is the relationship matrix which projects the selected columns back onto all the columns in original data space [
21]. For the given matrices
and
, the relationship matrix is computed as the matrix product of
and
.
The crucial problem with CUR method is how to select the most representative columns so that the relative error between approximation matrix and original matrix is as small as possible. The goal is to capture the essential information in the data while reducing dimensionality. To evaluate the approximation result, we calculated the percent-root-mean-square distortion (PRD), which is commonly used to assess reconstruction performance [
22], provided by the following formula:
where
And it represents the Frobenius norm of matrix . A lesser PRD represents a better compression result.
More specifically, we can break down the column-based CUR method into the following steps:
Determine the importance score of each column in the network matrix. Each column in the matrix is assigned a probability score indicating its likelihood of being selected;
Create matrix by selecting top c columns from matrix in the descending order of probability scores calculated in the first step;
Calculate the relationship matrix ;
Assume traffic is stationary, infer the future traffic speed for the entire network using only speed measurements at the selected link, and calculate PRD for the testing data as the performance measurement.
Step 1 is clearly the most essential step in the CUR process. To identify the optimal set of columns for a specified number of columns, one would normally need to evaluate all possible
combinations. Nevertheless, employing a brute-force approach entails a computational complexity of
[
23]. Given this computational burden, it is usually impractical to assess every potential selection of c columns. To tackle this challenge, two major randomized algorithms have been introduced [
21,
24] to compute the importance score of each column and then sample columns based on the score:
where j = 1, 2, 3, …, n. The concept behind this method is to select detector links with high speed. L2 norm-based sampling offers benefits like rapid computation and a better understanding of the column magnitudes. The drawback lies in the neglect of detectors that record a significant portion of low-speed intervals, leading to substantial estimation errors during congestion periods.
Leverage-based: this method utilizes statistical leverage [
9], which measures the contribution of each column to the overall variance of the data, as the importance score for each column. The importance score can be conceptually understood as quantifying the “statistical leverage” or “impact” of a specific column on achieving the most accurate low-rank approximation of the data matrix. By prioritizing the selection of columns that has a disproportionately significant influence over the low-rank approximation, as opposed to L2 norm method that samples columns with higher Euclidean distances, we can ensure that CUR performs nearly as effectively as the best rank-k approximation
in capturing the predominant portion of the spectrum of A [
9]. Columns with high leverage scores are often considered important. The underlying concept is to consider detector links with large variations in speed, thus covering various traffic conditions and providing a better capture of the detectors with different traffic states. However, the limitations associated with this approach include the substantial computational cost. The detailed steps are described as follows.
Firstly, singular value decomposition (SVD) is performed on the original data matrix
[
11] to represent
as:
where
and
are unitary matrices, and the columns of
and
are left and right singular vectors of
, respectively. Matrix
is a rectangular diagonal matrix with non-negative diagonal entries, known as the singular values of matrix
. Then, the best rank-k approximation can be obtained by keeping top k columns of
,
, and
so that the explained variance is at least 80%:
Then, the leverage score of column j can be calculated as:
where
is the
coordinate of
right singular vector. It is obvious that the sum of
is equal to one because matrix
is unitary.
Based on the two previous options, we propose a weighted method considering both L2 norm and statistical leverage, expressed as Equation (8):
where w is a weight parameter, and w is set to be 0.5 in this study to assign equal weights to column magnitude and column variation.
In addition to the three options, a random sampling method to select c columns with equal probability for each column is also implemented. This process was repeated five times, and average performance was recorded. Prior research failed to consider the comparison with the simplest random sampling method, thus making the performance less persuasive.
2.3. CUR Integrated with Clustering
The primary objective of this study is to explore the effects of incorporating clustering method into CUR sampling process. The reason for considering clustering method is to investigate whether homogenous subnetworks can enhance the overall performance of the network representation. The idea of integrating clustering analysis into CUR method is inspired by the methodology of devising a composite index for stock market such as Nasdaq-100.
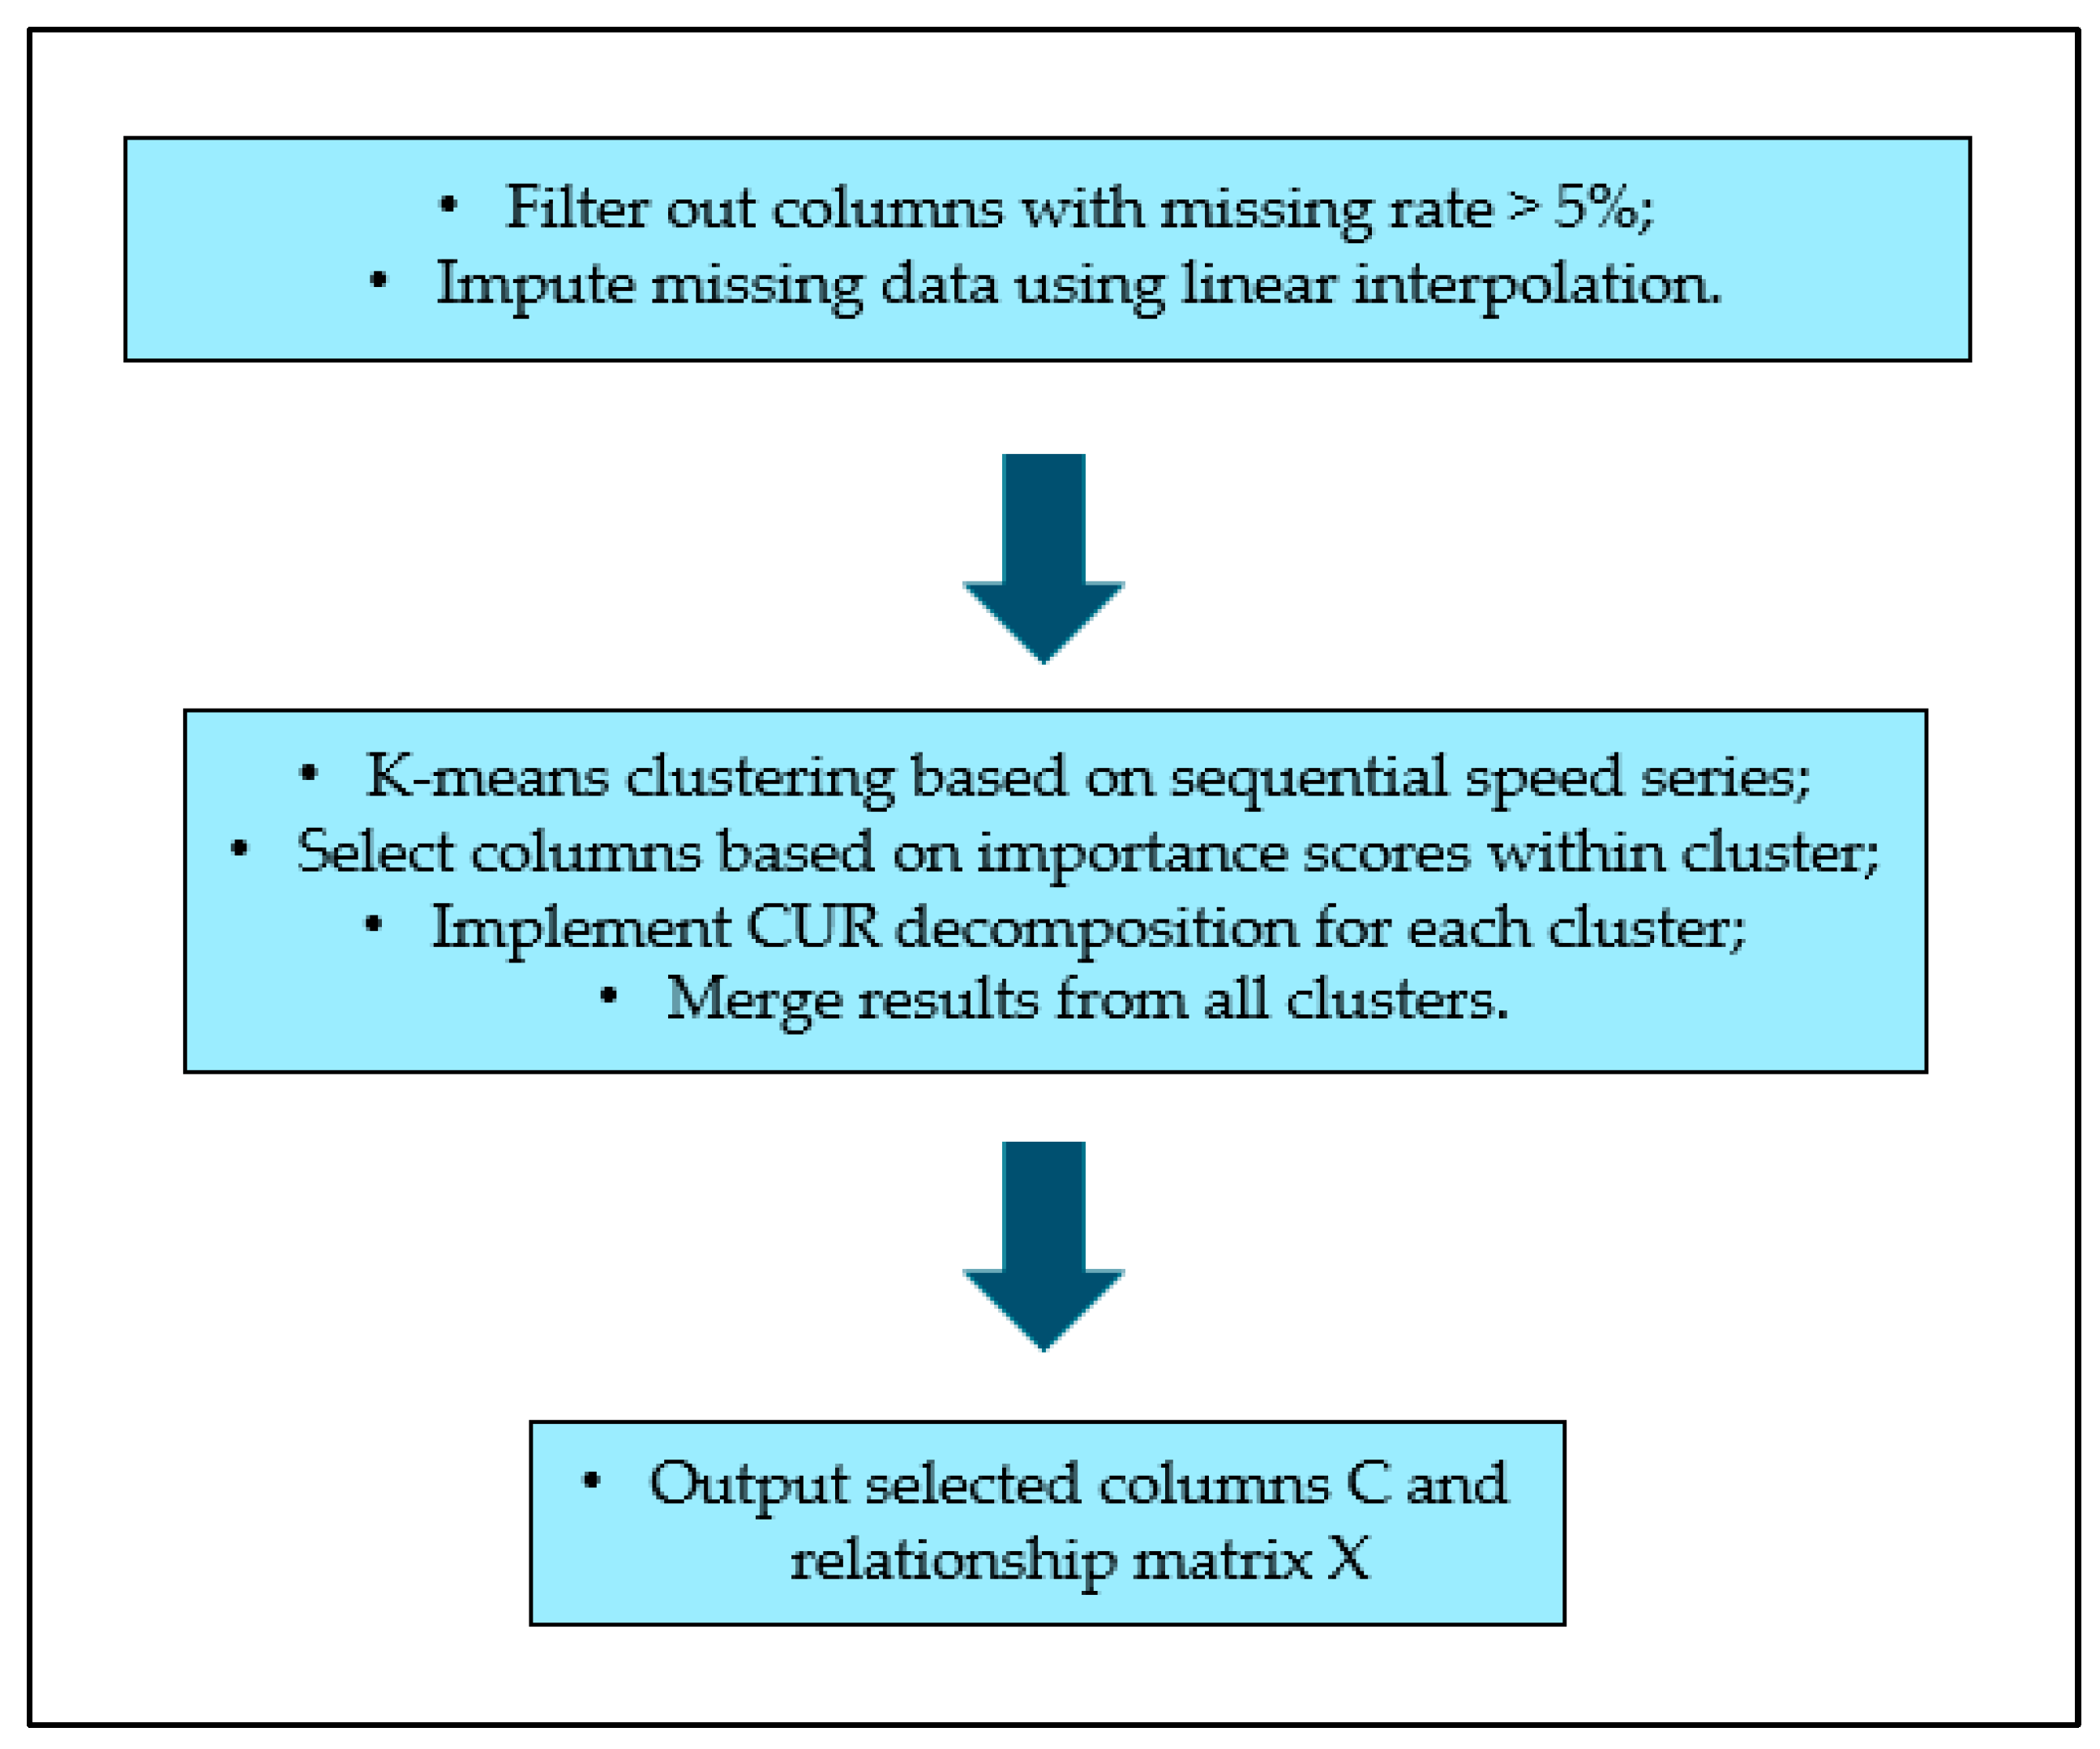
Stocks from different sectors will go through a rigorous screening process and then be selected to represent the whole market using a weighted average index. Similarly, to select most representative traffic detectors in a massive road network, the first step is to filter out columns with missing rate greater than 5% and to impute the remaining columns using data from adjacent time intervals (linear interpolation). Then, we can classify the detectors into different clusters based on their speed during the training period, followed by the normal CUR decomposition process within each individual cluster given a fixed compression rate (CR). Finally, the selected columns and corresponding relationship matrix will be merged as the final CUR outputs. The entire column selection process is displayed in
Figure 4.
Mitrovic et al. has taken into account the clustering method to compress large-scale traffic data [
10]; however, they simply clustered the network according to road category instead of using a real clustering method based on the speed condition on the road. It is obvious that roads in the same category do not necessarily have similar traffic conditions.
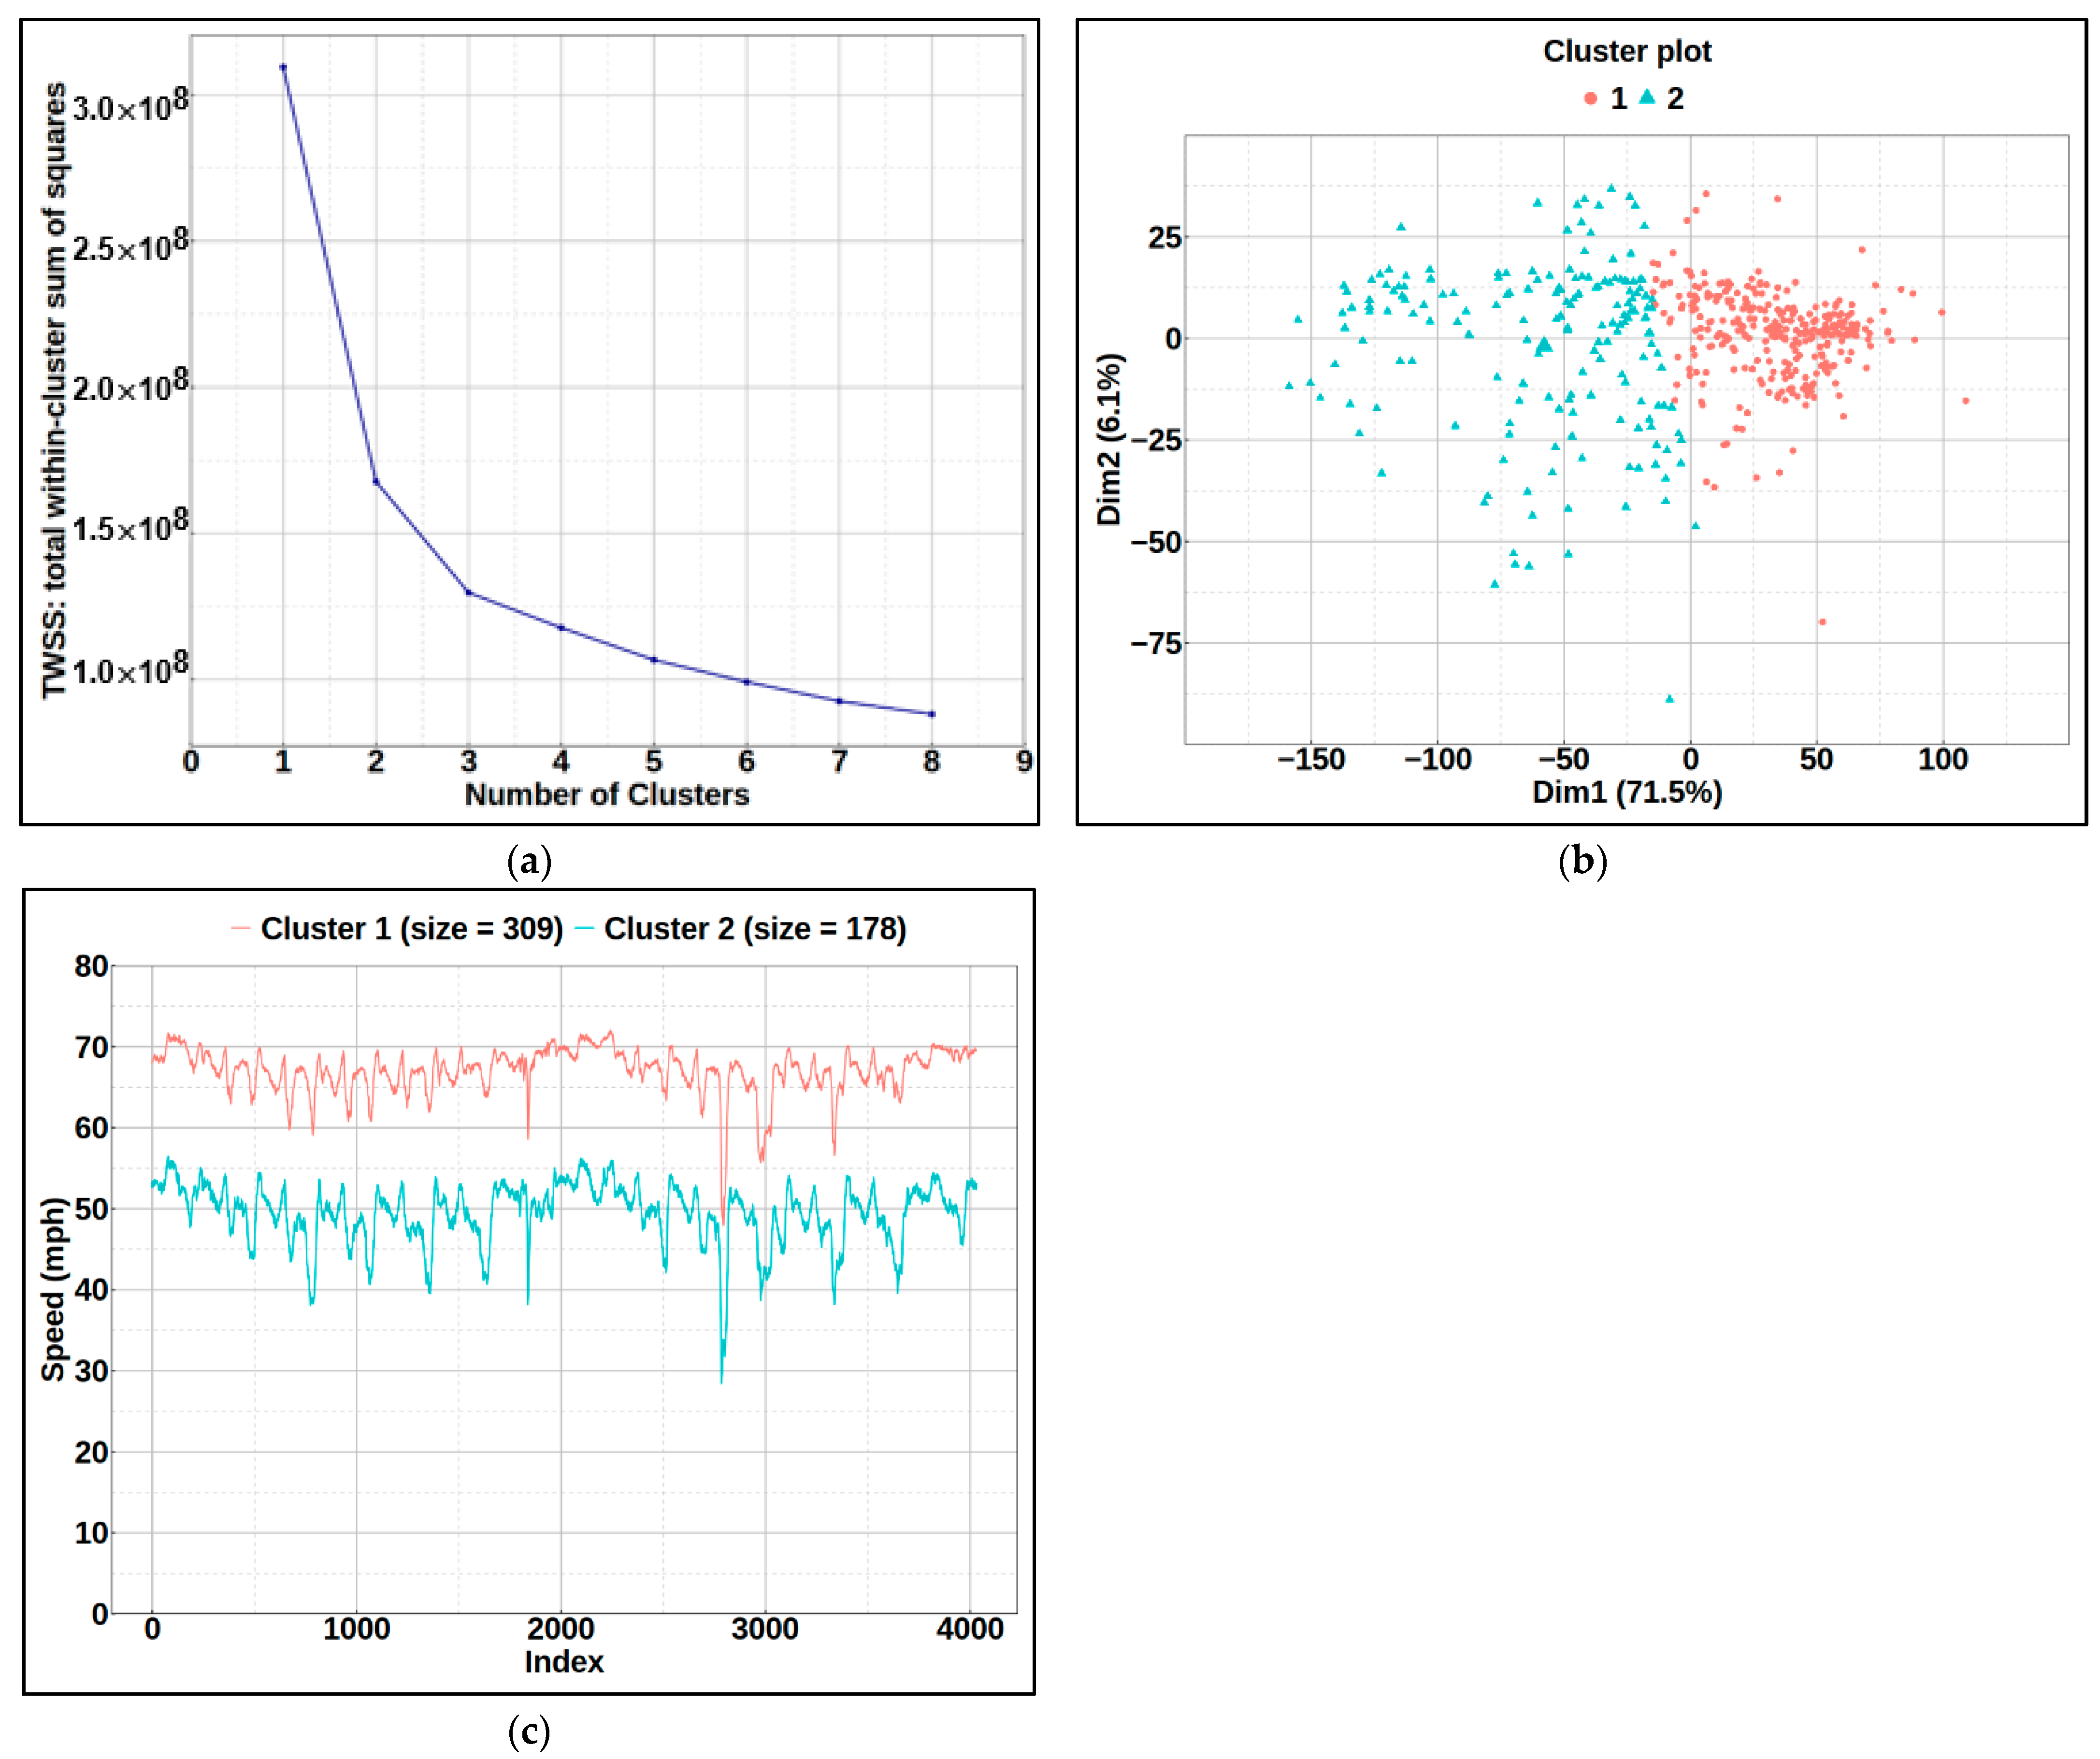
In this study, k-means clustering was adopted due to its simplicity, computational efficiency, and interpretability. A detailed description of k-means clustering is provided as follows.
In k-means, clusters are defined so that the total intra-cluster variation (known as total within-cluster variation) is minimized. Within-cluster variation is defined as: where we only consider x of a given cluster , and is the mean (centroid) of points in cluster . Then, total within-cluster variation is to perform the previous calculation for each cluster and take the sum of all clusters.
There are five overall steps in naïve k-means method:
Step 1: specify k (number of clusters).
Step 2: randomly select k instances from the data as the initial cluster centroids.
Step 3: assign each instance to its closest centroid based on Euclidean distance.
Step 4: for each of the k clusters, recompute the centroid by calculating the new mean of all the instances in the cluster.
Step 5: repeat step 3 and 4 until centroids converge or the max number of iterations is reached.
4. Discussion
As shown in
Figure 5 and
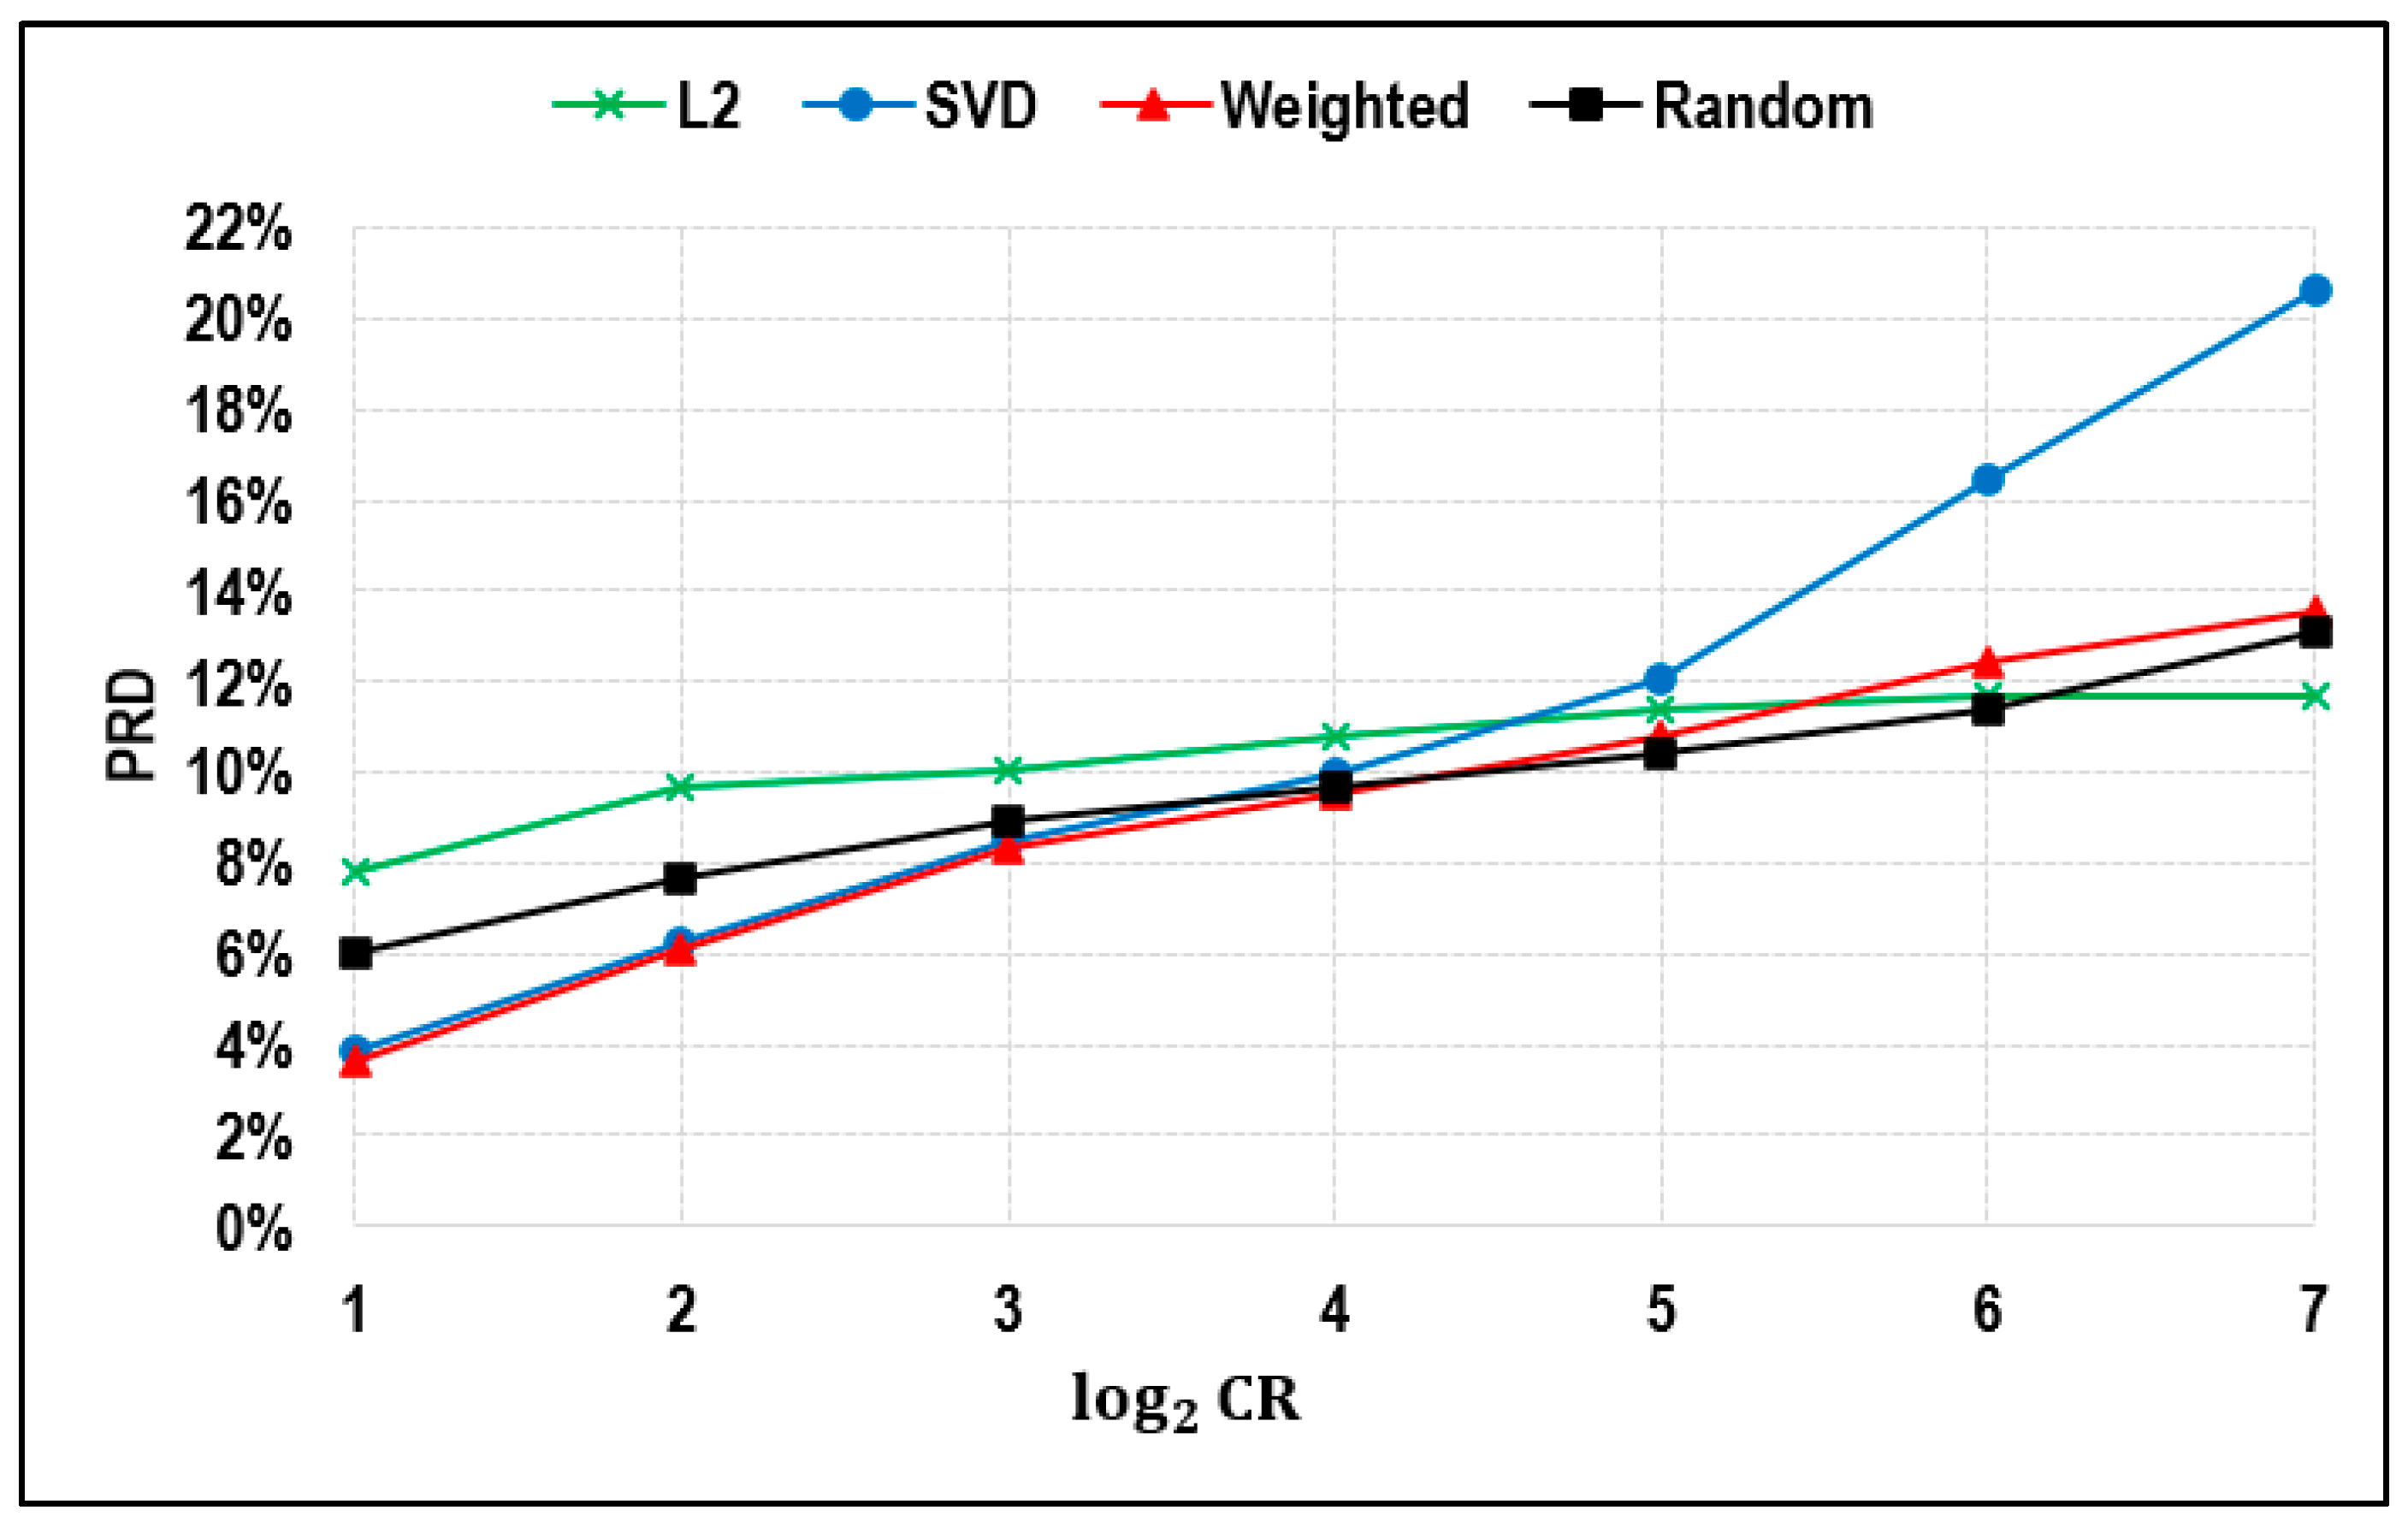
Table 1, the proposed weighted approach demonstrated lower PRD compared to alternative methods when the CR remained below 32. However, the downside of employing the weighted sampling method is the comparatively longer computational time. When the CR threshold surpasses 32, the proposed weighted method only outperforms the SVD-based leverage method, partially because the default weight value (w) is set at 0.5, assigning too much weight to the SVD-based leverage approach. A possible future direction could be tuning the hyperparameter w to achieve better performance over the L2 norm-based and SVD-based leverage methods on training data, followed by an evaluation of the method on the testing period. The PRD of the L2 norm-based method remains relatively stable (between 8% and 12%) as the CR increases from 2 to 128, while the SVD-based leverage method yields good performance with a CR lesser than 16, but its error rises very quickly as the CR becomes greater than 16.
It is worth noting that the performance of the random sampling method is even better than that of the other three methods when the CR changes between 16 and 64. Previous researchers either failed to consider testing their method within this range or forgot to compare with the performance of the random sampling method.
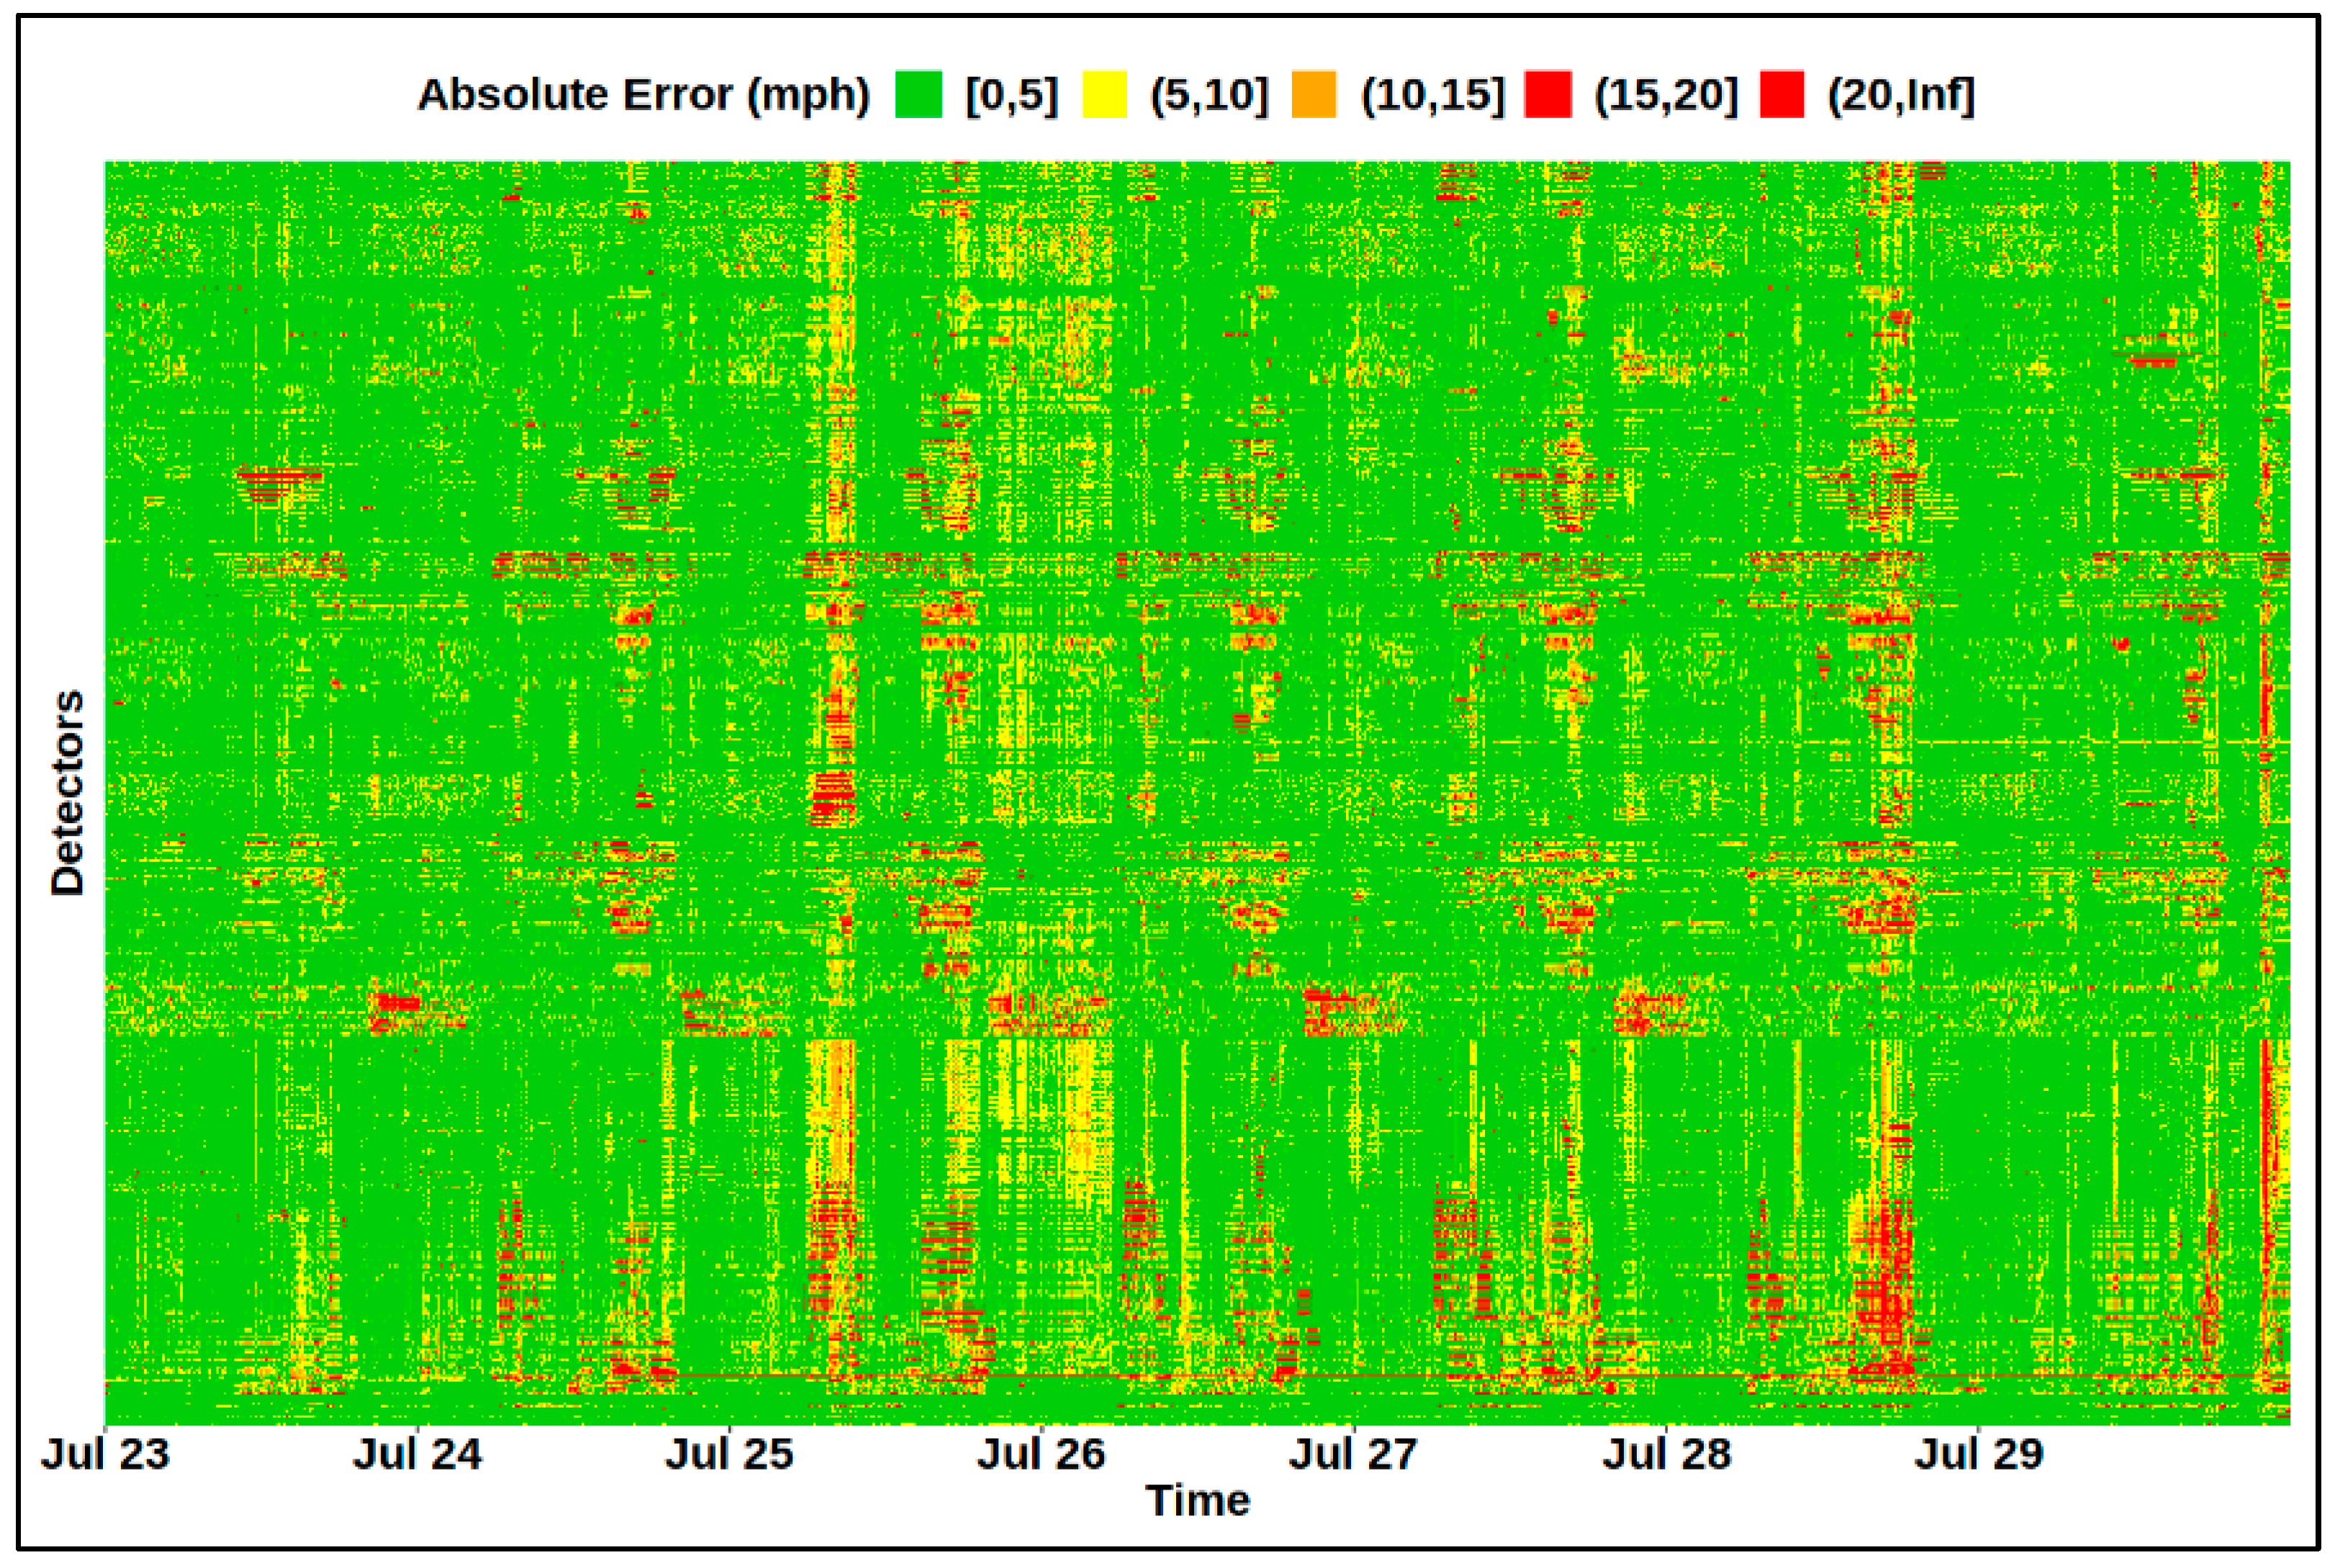
Figure 6 displays the heatmap of the absolute error between the original and inferred test data. A compression rate of 16 yields a PRD of 9.5%, and the absolute error is within 10 mph for 94% of the time and detectors. Additionally, the largest error always occurred recurrently during the peak hour at some specific detectors, which implies that the CUR decomposition method does not perform well during congestion periods. There also exist some non-recurring large errors, which might be due to the occurrence of some atypical incidents such as severe weather, special events, and scheduled road work.
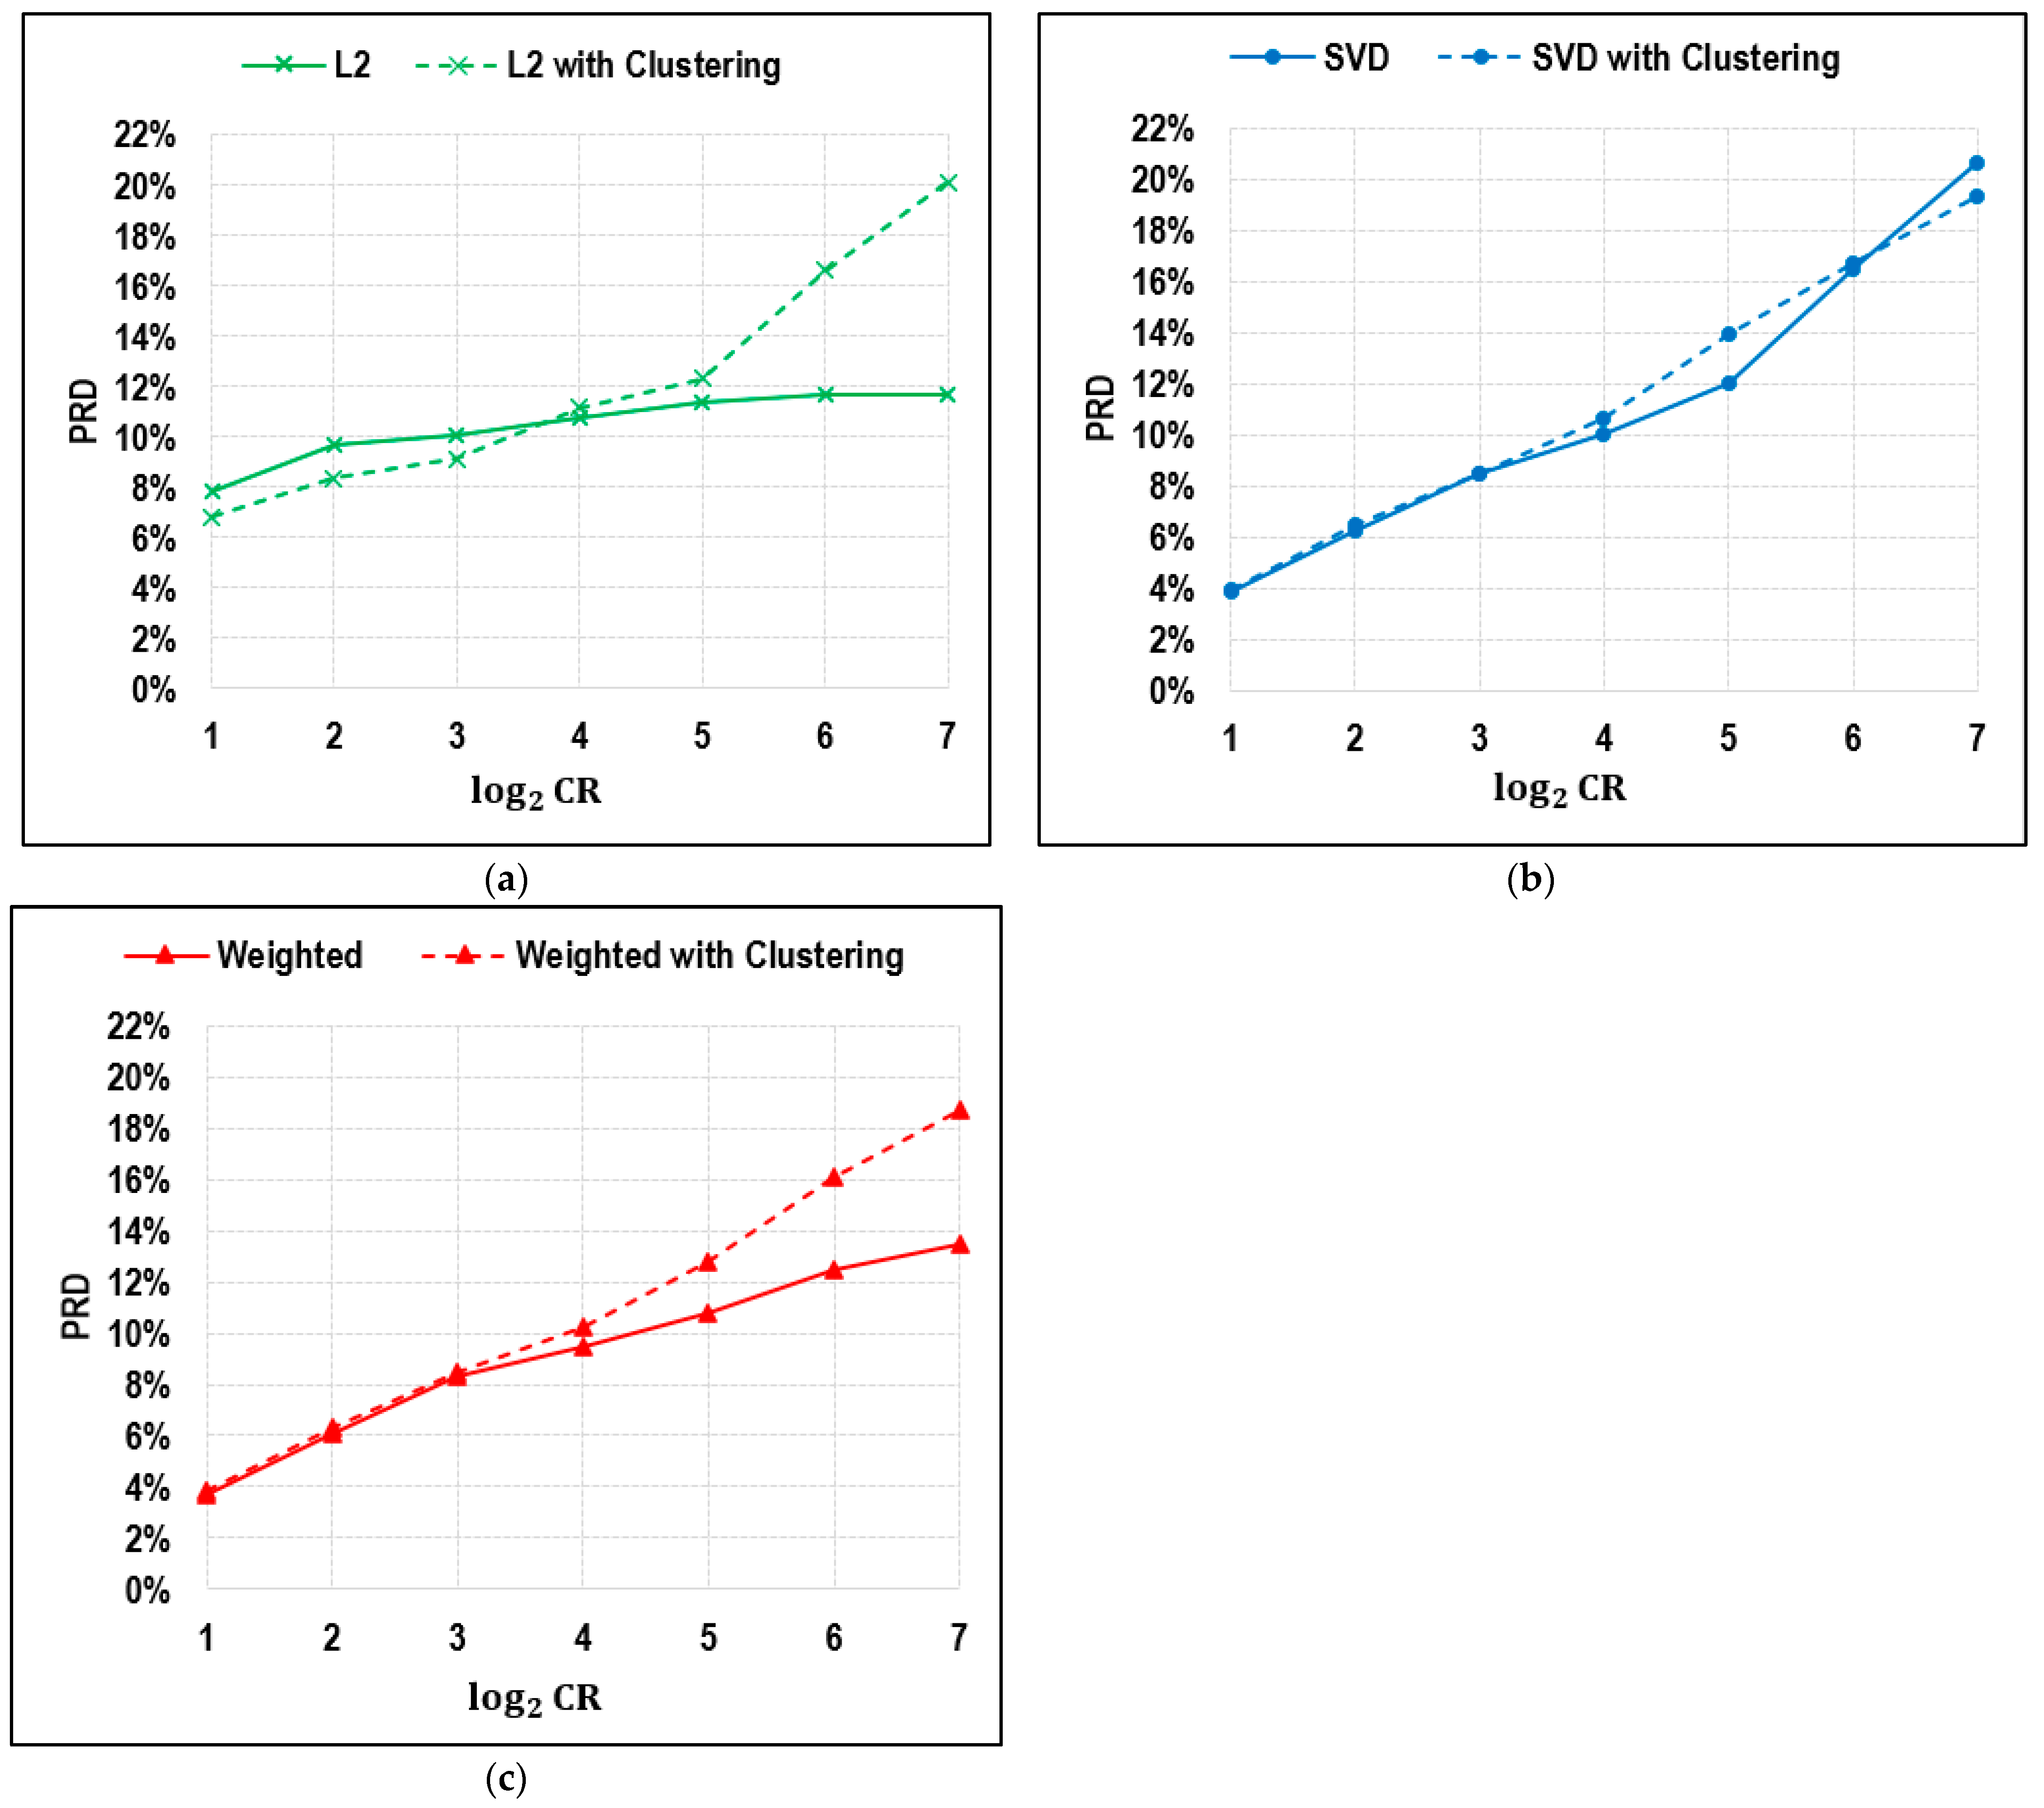
Another interesting finding is that clustering almost has no room for improvement for SVD-based leverage and the proposed weighted average method. As for the L2 norm-based method, clustering helps reduce the error to as low as 1% to 2%. Integrated with the clustering method, all three methods even demonstrated an increase in error when the CR was greater than 16, except for the SVD method with CR = 128.
There might be various reasons accounting for this phenomenon. First, if the data do not exhibit clear clusters or if the clusters are not well defined, clustering algorithms may not yield meaningful or useful groupings. CUR decomposition relies on selecting representative columns and rows, and if the data do not naturally cluster, selecting clusters may not provide an advantage. Second, determining the optimal number of clusters (k) is challenging. Choosing an incorrect value for k can lead to poor cluster quality and, consequently, suboptimal CUR selection. Another reason could be the choice of the clustering algorithm. If the clustering algorithm is not well-suited to the data or the specific goals of CUR decomposition, it may not lead to improvements. Since we are clustering time series in the context of traffic speed, a dynamic time warping distance could be considered as the similarity metric to perform the clustering analysis. In addition, k-means clustering is simple and basic, so it might be beneficial to try other advanced clustering algorithms, such as hierarchical clustering or DBSCAN, to yield better clustering results and compare the CUR performance with different clustering methods. This study opens the door to various intriguing possibilities for further investigation of how to improve clustering results.
The detectors used in this study are all from interstates without disruption by signal timing. Future work could be carried out to include different types of road networks to analyze their traffic speed patterns and investigate how clustering will impact the CUR decomposition performance on different types of road networks. As has been discussed in Mitrovic’s work [
10], clustering by different road categories improved the inferring performance for the entire network when the CR was between 2 and 10. Our future work could focus on analyzing the speed patterns on different road types and clustering based on speed profile and road type together.
Due to the data availability issues, this study only focused on a case study in Nashville, TN, and all detectors are located on urban interstates. To comprehensively evaluate the practical applicability, additional research could be carried out to investigate the generalizability of the proposed framework to other cities or regions and for other time periods. It is essential to extend this research to different locations and time frames to assess its spatial and temporal transferability.
In this study, external factors, such as adverse weather, special events and scheduled road work, were not included in the framework, which might impact the representing and inferring performance when there happened to be many non-recurring incidents during the training and testing period. One area for future work involves exploring the impact of external factors in greater depth to gain a more comprehensive understanding of its applications.
Another interesting avenue for future research is to explore the possibility of incorporating other traffic data, such as vehicle count and vehicular types, into the methodology for a more comprehensive representation of the traffic condition at specific detectors, thus resulting in a better representation of the entire network. This involves methods like column-based decomposition for multidimensional tensors, proposed by Couras et al. [
12] in 2019.
5. Conclusions
In conclusion, this research addresses important research gaps in the field of massive road network compression and representation. The utilization of a column-based CUR matrix decomposition technique with a column selection method based on weighted average of L2 norm importance and SVD-based leverage provides a novel approach to efficiently represent the original traffic network with a reduced subset of columns while maintaining acceptable error levels. This approach offers enhanced interpretability and a more refined column selection process compared to previous methods. Moreover, by conducting a comprehensive comparison with random sampling, this study contributes to a better understanding of the advantages of the proposed approach.
Furthermore, the extension of the evaluation to a wider range of compression ratios adds valuable insights into the scalability and performance of the method. The application of these techniques to radar detector data from Nashville, TN demonstrates their practical utility in real-world scenarios. By drawing inspiration from stock market index computation methodology, the integration of clustering analysis into CUR decomposition is investigated with the anticipation of performance enhancements. Clustering was found to enhance performance, but, notably, this improvement was confined to a limited range of compression ratios. Interestingly, once the compression ratio exceeded a certain threshold, the application of clustering not only ceased to improve performance but also adversely affected it.
Overall, this research not only contributes to the advancement of data compression and network representation but also highlights the potential of combining CUR decomposition with clustering for various applications in the field of big data analytics and network science.


