1. Introduction
Business processes in service-oriented organisations are managed by their service management systems, which are responsible for systematising offered services in the form of business processes [
1]. These management systems are also responsible for executing business processes in the most effective manner so that customers (both internal and external) receive the best services possible. Service-related business processes are the direct interaction links between an organisation and its service recipients, such as healthcare services interacting with patients and physicians, banking services interacting with their customers, and telecommunications services interacting with their clients. The data generated during the execution of these processes is used to analyse and enhance their execution. The objective of such an analysis is to enhance the quality of the customer experience, thereby increasing the competitive advantage of the business and contributing directly to its success.
Over the last few decades, corporations have become increasingly competitive in their pursuit of regulatory compliance. There has been a continuous interest in research for business process improvement, particularly in forecasting business process outcomes and their implications on process improvement. Businesses must predict the expected outcomes of business processes with the utmost degree of precision possible. Early prediction can have a significant impact on customers’ satisfaction with the services they are receiving [
2]. The biggest challenge for organisations is the timely identification of the abnormalities or deviations in their process executions. These deviations from the usual process execution may result in the inability to achieve the desired business objectives driven by the process. Failure to execute a process could be caused by a number of factors, the identification of which requires a thorough investigation and root cause analysis. On the other hand, the success criteria of any process could be dependent on a variety of elements, such as the prompt completion of an order and delivery for an online purchase process. In other words, the process is executed successfully when its services’ objectives are met, and vice versa.
Process mining techniques enable organisations to gain insight into their processes by utilising the event data captured by services management systems. A process is a collection of discrete activities or events designed to achieve a particular business objective. Process mining techniques are focused on three main areas: (i) process discovery, dealing with the discovery of the process models based on the behaviour of events [
3], (ii) conformance analysis, identifying inconsistencies between actual process executions and behaviour of the process observed through the discovered process model [
4], and (iii) process enhancement, establishing a feedback mechanism for the improvement of the process model through the learning of conformance analysis. Once a process model is discovered, conformance checking apprehends the reality of synchronisation between the recorded logs and the discovered model. Customer-centric organisations are focused on using the collected data to measure the conformance of their business processes. This is one of the ways to make sure that their service level is up to the standards for customer satisfaction. We further explored the conformance checking techniques in this work to identify, spot on and classify the anomalies and their severity in the execution of the business process. Furthermore, customer-centric organisations use service management systems that interact with their customers and execute the business processes. This execution generates a large amount of data as events in the executing process are recorded by the system and these data are used for gauging the performance of the process. The recorded events may be logged at more than one information system, it is vital to first convert the raw process data recorded by heterogeneous systems in the form of an event log, which enables data to be used for process mining.
The concept of anomaly encompasses a wide range of definitions. An anomaly may be an unusual execution, a noise in the log caused by an adverse event or a data input error or even a fraud attempt [
5]. We applied our methodology using a case study of a telecommunication organisation’s call centre business process. A customer uses the online diagnostic service to interact with an organisation’s customer services centre. Every time the customer is interacting with the organisation, the process for the diagnosis of the customer complaint is initiated. End to end interaction of each customer is recorded in the system as an instance and based upon the outcome, labelled as failed or successful. For example, if a customer’s service-related query is resolved then the case is successful, otherwise it is failed. The failure of a process in such an environment can have many repercussions on the business. It is vital to diagnose the reasons for process failure, identify the improvement areas and provide root cause analysis for the abnormal behaviour in the process.
Conformance analysis is the technique in process mining, during which events in the event log are replayed on to the activities in the process model. Examining the synchronisation between the recorded logs and the learned process models, conformance analysis techniques provide an in-depth analysis of real-world, complex business processes. The conventional approach to conformance analysis is the identification of deviations from routine execution; however, routine execution of a business process is not necessarily referred to as “optimal execution”. Using historical logs, we determined the ideal execution of a business process so that conformance analysis techniques can accurately investigate deviations in faulty instances. This technique led to the identification of the root cause analysis for predicting business process execution abnormalities.
In this paper, we provided a 360-degree perspective of process mining for profiling abnormal behaviour in business process execution. First, we proposed a mechanism for converting services-related process data generated from heterogeneous sources into an event log. This event log is the starting point for the application of process mining techniques. Secondly, we split the process log into successful and failed process instances. This allowed us to individually understand the behaviour of the cases that leads to either of the process outcomes. Thirdly, we discovered the optimal process model using the successfully executed cases representing the best-case scenario of the process. Finally, this discovered model is then used as a standard to compare the behaviour of recently executed cases through several conformance checking techniques [
4]. We used three techniques of conformance checking to profile the difference between the behaviours of successful cases and failed cases. We identified the existence of anomalies in the process execution by performing causality analysis, and then performed a deep analysis of the different behaviours between successful and failed cases using trace level and event-level alignment-based conformance testing. Finally, root cause analysis is presented for business users to identify and rectify the causes of process deviations resulting in process failure. We found that cases with higher fitness scores are most likely to be successful while decreasing fitness scores during instance execution predicts the trace will lead to the failed instance.
The main contributions in this research are highlighted as follows:
We demonstrated the method to convert the heterogeneous sourced services-related business process data into an event log. The starting point for data to be considered for process mining is the event log. Using a real-world example, we demonstrated how services management system data can be converted into an event log.
We used several techniques of conformance analysis to identify the reason for failures in process execution. This is a non-traditional application of conformance analysis for identifying and analysing the root causes of process anomalies.
The concept of a conformance lifeline is introduced to measure the fitness score throughout the process. The decline in fitness in failure cases relative to the optimal process reflects the underlying execution anomaly.
The remainder of the paper is structured as follows.
Section 2 gives an overview of related research. In
Section 3, the methodology is described in detail and
Section 4 mentions the preparation of the dataset. The discovery of the optimal process model describing the behaviour of perfectly executed process instances is presented in
Section 5. In
Section 6, conformance analysis techniques are applied using the optimal process model and recent logs with a mixture of successful and failed instances for abnormality detection.
Section 7 presents the concept of the conformance lifeline for a deep dive into the evaluation of abnormal behaviour.
2. Literature Review
Process mining techniques are generally used by far to analyse the execution of business processes and suggest process improvements. There are three main types of techniques considered in process mining: process discovery, conformance analysis and process enhancement [
6]. Techniques for process discovery use an event log as an input to produce a process model without having any prior knowledge about the process and its execution steps. Four highly commended process discovery techniques are presented in the literature: Alpha Miner [
7], ILP Miner [
8], Inductive Miner [
9] and Heuristic Miner [
10]. The second type is conformance checking, which compares the event log with the discovered process model to identify the conformance of the log concerning the behaviour of the process exhibited in the identified process model [
11]. The third type of process mining is an enhancement that covers the improvement in an existing business process using the results of the conformance analysis. Identified issues in the process execution are presented back to the information systems in the form of suggestions/feedback. This feedback, when incorporated into the systems results in the rectification of the concerns leading to improved process execution. Although process mining promises a more in-depth analysis of executing processes, managing actual business processes is a challenging task. The authors of [
12] proposed a solution to extract meaningful knowledge from complex business processes, termed ‘Contrail processes’. The proposed solution is based on hierarchical clustering to break down large process logs into more manageable sub logs.
The recent literature demonstrates that process mining techniques have been utilised for anomaly detection and root cause analysis of business processes. In [
13], the performance sequence diagram analysis algorithm is used to derive behavioural characteristics from both successful and failed business process event logs. Both pattern sets are evaluated from the viewpoints of control flow and time, with the identified variations indicating possible shortcomings in the respective business processes. The authors of [
13] were able to find the cause of failures in the business process when the technique was implemented on several synthetic logs. In a recent work by Maeyens et al. [
14], behaviour profiling of machine logs is presented using the process mining techniques. A successful events log is used to construct a process model which presents the ideal scenario of the machine. The model was then used as a benchmark to analyse the difference in behaviour by other machines. The difference in execution between successful and failed cases are used to derive root cause analysis of failures. In similar work, Tariq et al. [
15] proposed an online process prediction framework using process mining features. The authors discovered the process using heuristic mining. Conformance analysis was used to model features presenting process context. The authors of [
15] picked highly predictive features using machine learning in real-world business algorithms. Through machine learning, these features are used to predict the future outcome of the executing process. After the initial clustering of cases, process mining techniques are augmented to extract features. The prediction is then tested at four different stages of the process, referred to as cut-off times of the process, and it is demonstrated that the proposed solution is very promising for the earliest prediction. In a systematic review, Silva et al. [
16] mentioned the complexities of the machine-oriented industrial equipment inspection. This emphasises the need for clustering techniques, such as segmentation of the large-scale industrial event logs and timely prediction of abnormalities, especially in the context of Industry 4.0.
Our work can be seen as an extension of [
14,
15] in which we presented the conformance in several depths for pinpoint identification of the fault, making it easier for business users to identify the root cause of the failure in process execution. In contrast to [
13,
14], our work is focused on the generic implementation of anomaly detection using conformance analysis. The conformance lifeline technique allows for a further breakdown of process traces and allows analysis of the event log at any given stage of the process. Gupta et al. in [
17] proposed a multi-stage method to identify anomalous traces and executions of event logs generated by process-aware information systems and a root cause analysis technique for anomalous traces. To detect deviations, the event log is converted into a sequential dataset and application of window-based and Markovian techniques are presented. The authors of [
17] used decision tree classifiers to obtain the rules explaining the root causes of anomalous transactions, while in this work we used several model-related properties such as fitness score, misalignment and causality analysis to determine the cause of abnormality in the business process. Root cause analysis by enriching the process log and application of the classification techniques is presented in [
18] by Suriadi et al. Relevant information about root cause analysis is determined and the event log is enriched with this information. As for classification techniques, the J.48 vlassification tree is applied on an enriched log and data mining analysis is performed. In contrast, we solely used process mining techniques, such as conformance checking, to present RCA to business users which allowed the knowledge about the case abnormality to be extracted from within the event log. In another work [
19], techniques based upon the mixture of process mining and machine learning are described. Security violations in the audit trail are identified using the
-algorithm and any behavioural deviations from the identified model are classified as violations. The methodology focuses on the security domain in a business process environment, which differs from a services-related business environment, we also considered four process discovery algorithms to compete for the best model.
3. Proposed Methodology
This section presents the methodology for anomaly detection using process mining techniques on the services-related business process data. This section describes the innovative technique proposed in this study for detecting anomalous behaviour during the execution of real-world business processes. Successful business process execution is used as a benchmark to detect irregularity in the process execution. The behaviour of the events in the successful cases is compared with the behaviour of unsuccessful cases. This comparison is made at several checkpoints during the execution of the process instance. These checkpoints are based on the time spent on a specific case from the process start, referred to as the time threshold.
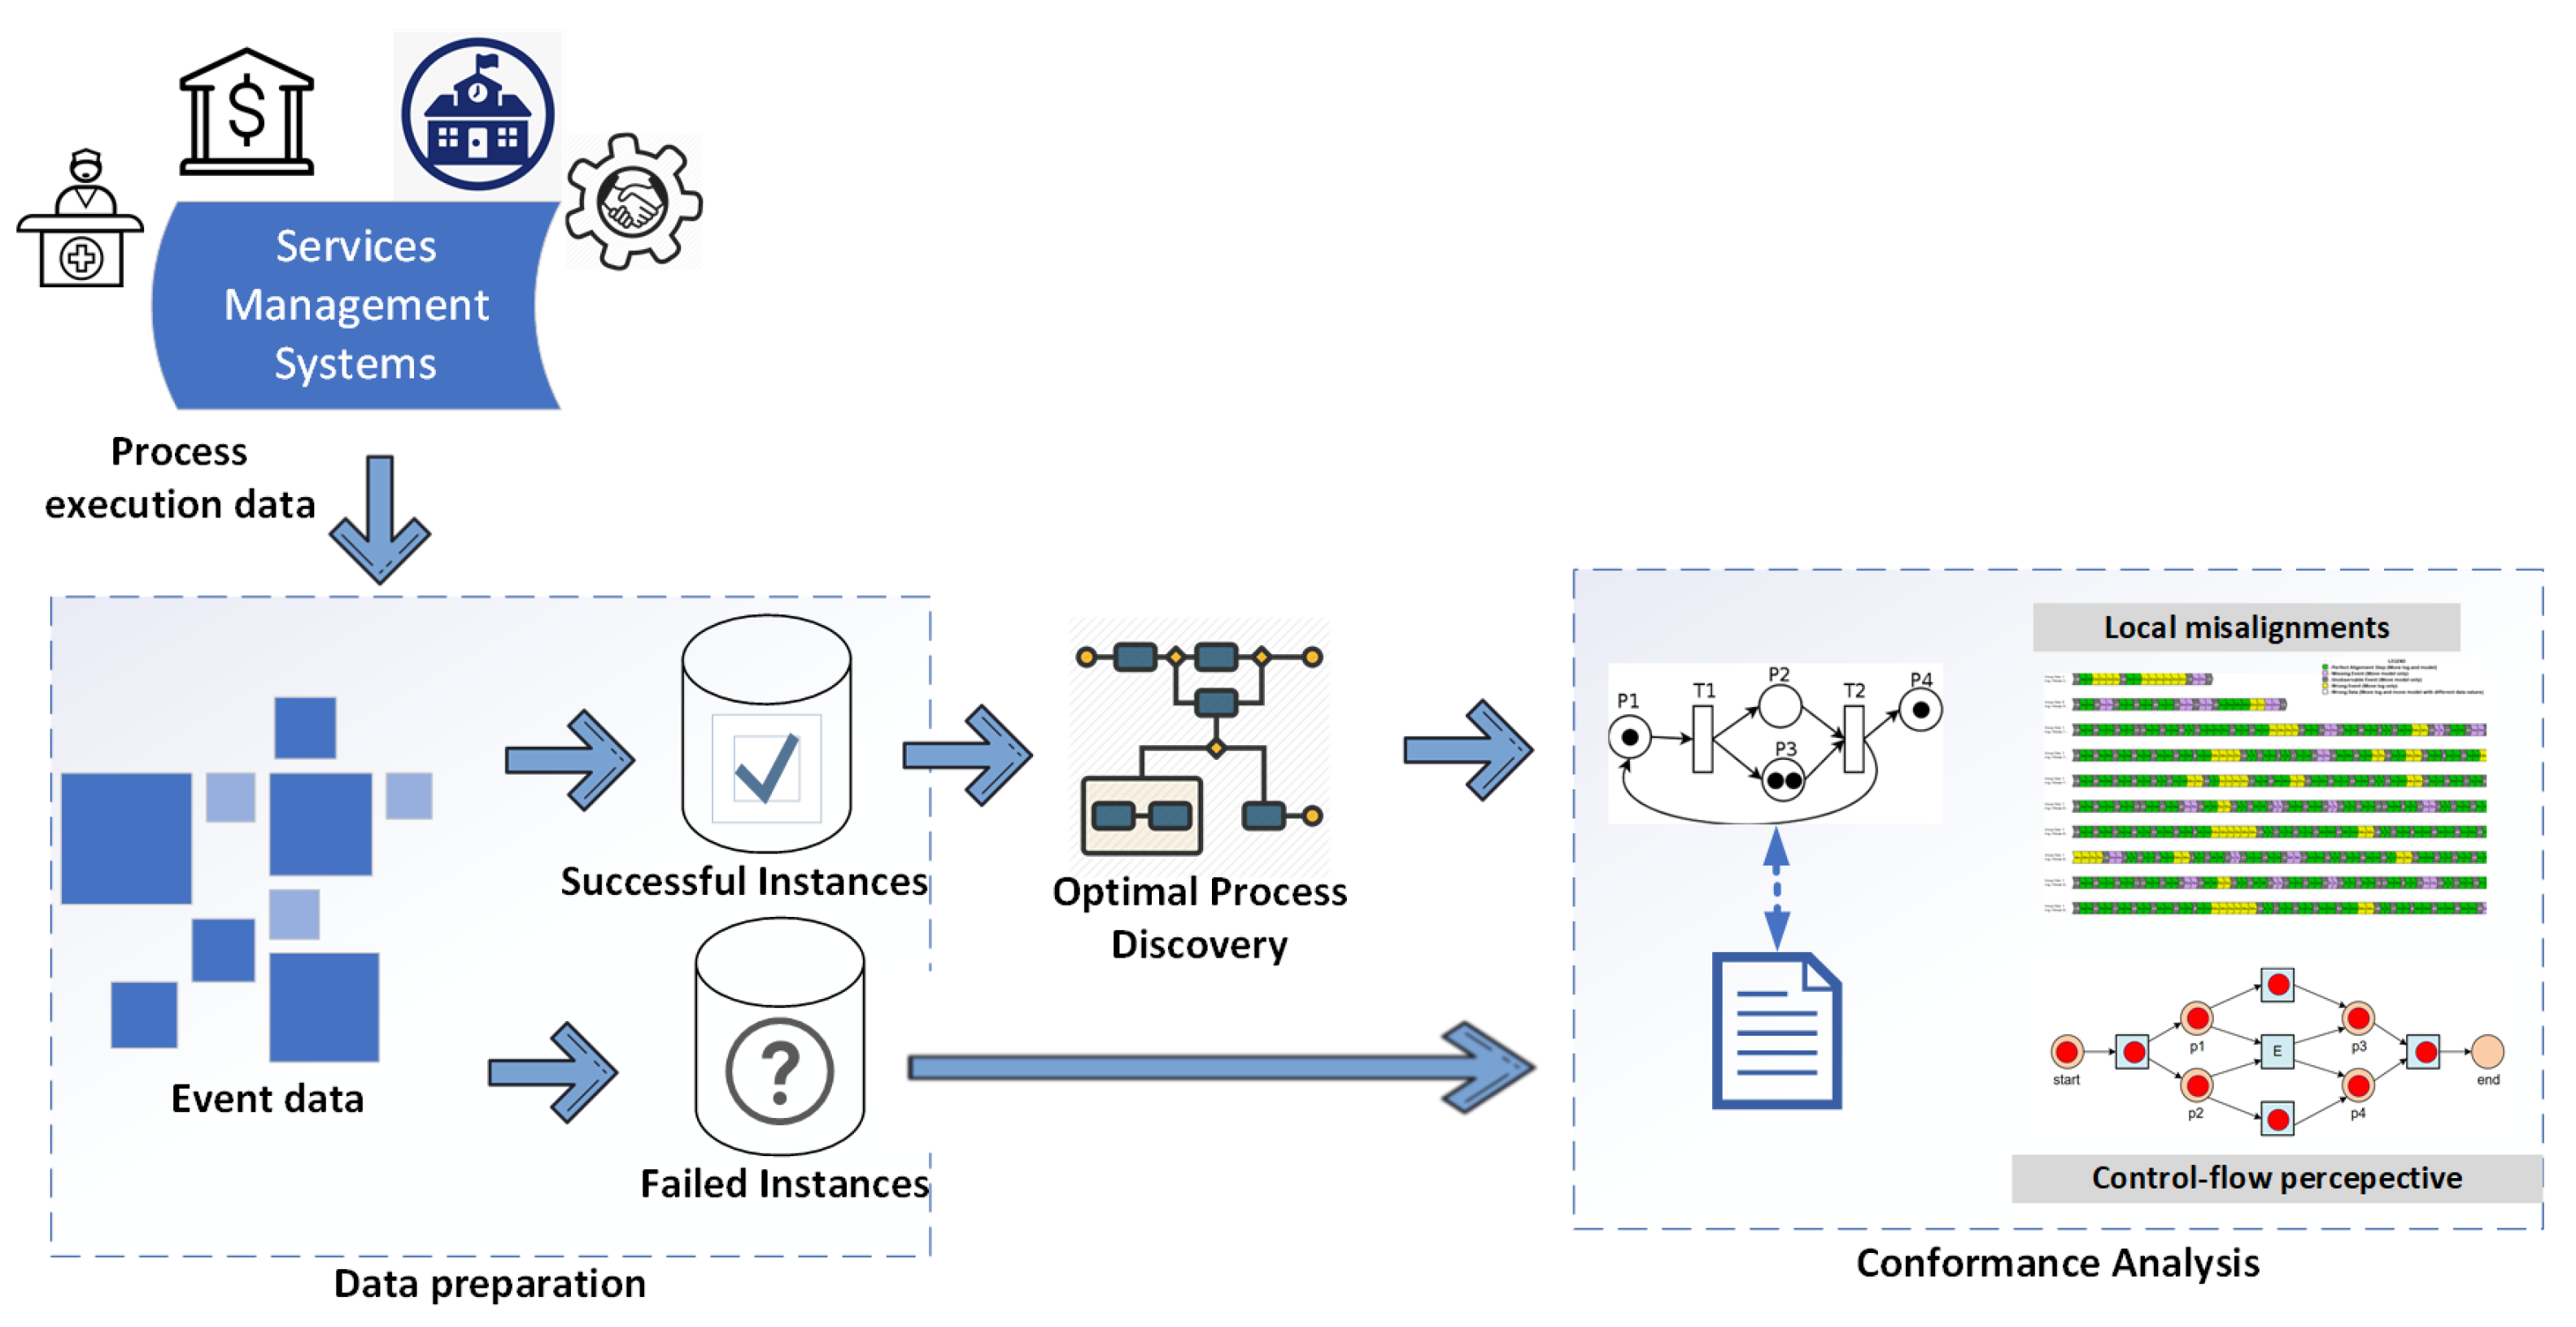
At first, the raw event log is filtered into two variants, successful and failed instances. The successfully executed cases are used to discover an optimal process model, which represents the ideal behaviour of execution by process instances.Later, the process model has been used as a behavioural benchmark to classify the abnormality in the failed instances. Abnormal behaviour is compiled, grounded on three dimensions of conformance, which are control-flow based, case-level alignment and event-level alignment. The proposed framework is detailed in
Figure 1. An optimal process discovery is performed using the sub-log containing successful cases. Conformance analysis techniques are used to identify the abnormal behaviour of the cases which lead to the failure of the process execution and process improvement is established using knowledgeable feedback from the business users.
A trend of fitness
f, calculated as Equation (
2), is used as a normalised trend for the fitness of events within the duration threshold. It is expected that in complex real-world processes, the fitness score of all the traces is higher at the start of the process. The reason is that generally, the early portion of the process is very similar in behaviour for both successful and unsuccessful execution of process instances. As the process executes, the fitness score is expected to decrease for the unsuccessful cases, as it is likely that there must be a deviation from the ideal behaviour of process instances.
The fitness score of all the cases should be high at the start of the process and also near the end. The reason for the increased fitness of unsuccessful instances both at the beginning and at the end is that all types of cases behave similarly in both scenarios. This is because process initiation is generally the same for all cases, and practically all cases eventually converge on the same end classes. Therefore, it is hard to differentiate between successful and unsuccessful cases at start and endpoints. Thus, the fitness score of unsuccessful cases is expected to be the same as successful cases.
The fitness score drops with a difference in the behaviour of unsuccessful cases when aligned with the optimum process model. Hence, it is expected that the portion of the process which is well aligned with the same portion of successful instances will have a higher fitness score. At the same time, more deviation of fitness score should be observed during other portions of the process between successful and failed cases.
4. Data Preparation
This section presents the pre-processing steps to utilise the raw event data. Data from services-oriented processes are collected from their respective service management systems [
20]. Data are then converted to the form of an event log, making it feasible for deeper analysis.
4.1. Event Log Generation
Service-related data are generated when a business process is executed using several heterogeneous information systems. These data are generally in the form of unorganised information, which is usable as an input to other information systems such as analytical tools and dashboards. Data are mainly in several scattered output files; thus, combining them into a sequential data structure is vital for further analysis. Therefore, raw event data generated from real-world business process execution are not suitable for running process mining techniques without converting the data into a standard event log format. A sample event log from a public dataset BPI challenge ‘Process Discovery Contest event log’ 2019 is represented in
Table 1.
Three primary attributes must exist for an event log to be considered for process mining: (i) unique Case_ID, representing a single process instance including multiple events in an ordered sequence, (ii) Event_ID, the representation of a single event that belongs to a specific case. (iii) Timestamp, a description of the time when a particular event occurred during the execution of a process’s instance. Event data extracted in this step are not specific to an underlying process model; thus, this is a generic approach that should be taken for all types of service-oriented business processes.
A Case_ID may contain several Event_IDs, and each Event_ID may have several attributes reflecting the nature of an event, including Timestamp, description of the activity performed, resources involved during those activities and cost factor. Generally, events belonging to a specific Case_ID have similar attributes throughout the process log, and they are also in the form of an order.
The term ‘trace’ refers to an execution path of events that are part of a unique process instance. The trace reflects the order in which the activities of this path are executed from the start of the process till the end. Thus, a trace
shows activities where
and
z are related events. Event
x is completed before starting an event
y, and that event
y is executed before event
z. So an event log is an ordered execution of events that belongs to a case. Definitions of events, trace and event log are described by Van der Aalst in [
6] as:
Definition 1 (Event, attribute). Let θ be the set of all possible events e in a trace. A trace t represents a sequence of activities or events such that θ. Events can be characterised by a variety of attributes, for example, an event may have an executor, as well as a cost and time stamp. Let be a set of names for attributes belonging to an event e. Then, eϵθ, and name of an attribute nϵ,
= value of attribute n for event e,
it is also possible that event e has no attribute named n, then
For understanding, the following standard attributes of e are considered:
is the activity associated with event e.
is the timestamp associated with event e.
is the resource associated with event e.
is the transaction type associated with event e.
Definition 2 (Case, Trace). Let κ be the set of all possible case identifiers in an event log. Like events, cases can also be characterised by various attributes, e.g., an event may have an executor, an associated cost and time stamp.
For any case c in a given log, cϵκ and name nϵ so is a value of attribute n for c.
Each case has a mandatory attribute trace, ϵ ,
A trace is a finite sequence of events σ ϵ . Each trace should have at least one event and each event may repeat itself in a trace.
Definition 3 (Event log). An event log L is a set of cases where L ⊆ κ, such that each log contain at least one case and each case has at least one event, i.e., …ϵL.
Using these definitions, an event log is generated for the real-world data extracted from a CDP. The set of questions is treated as the events and each end-to-end individual customer interaction is considered as a unique case c, such that c where .
4.2. Customer Diagnostic Process as an Example of Real-World Business Processes
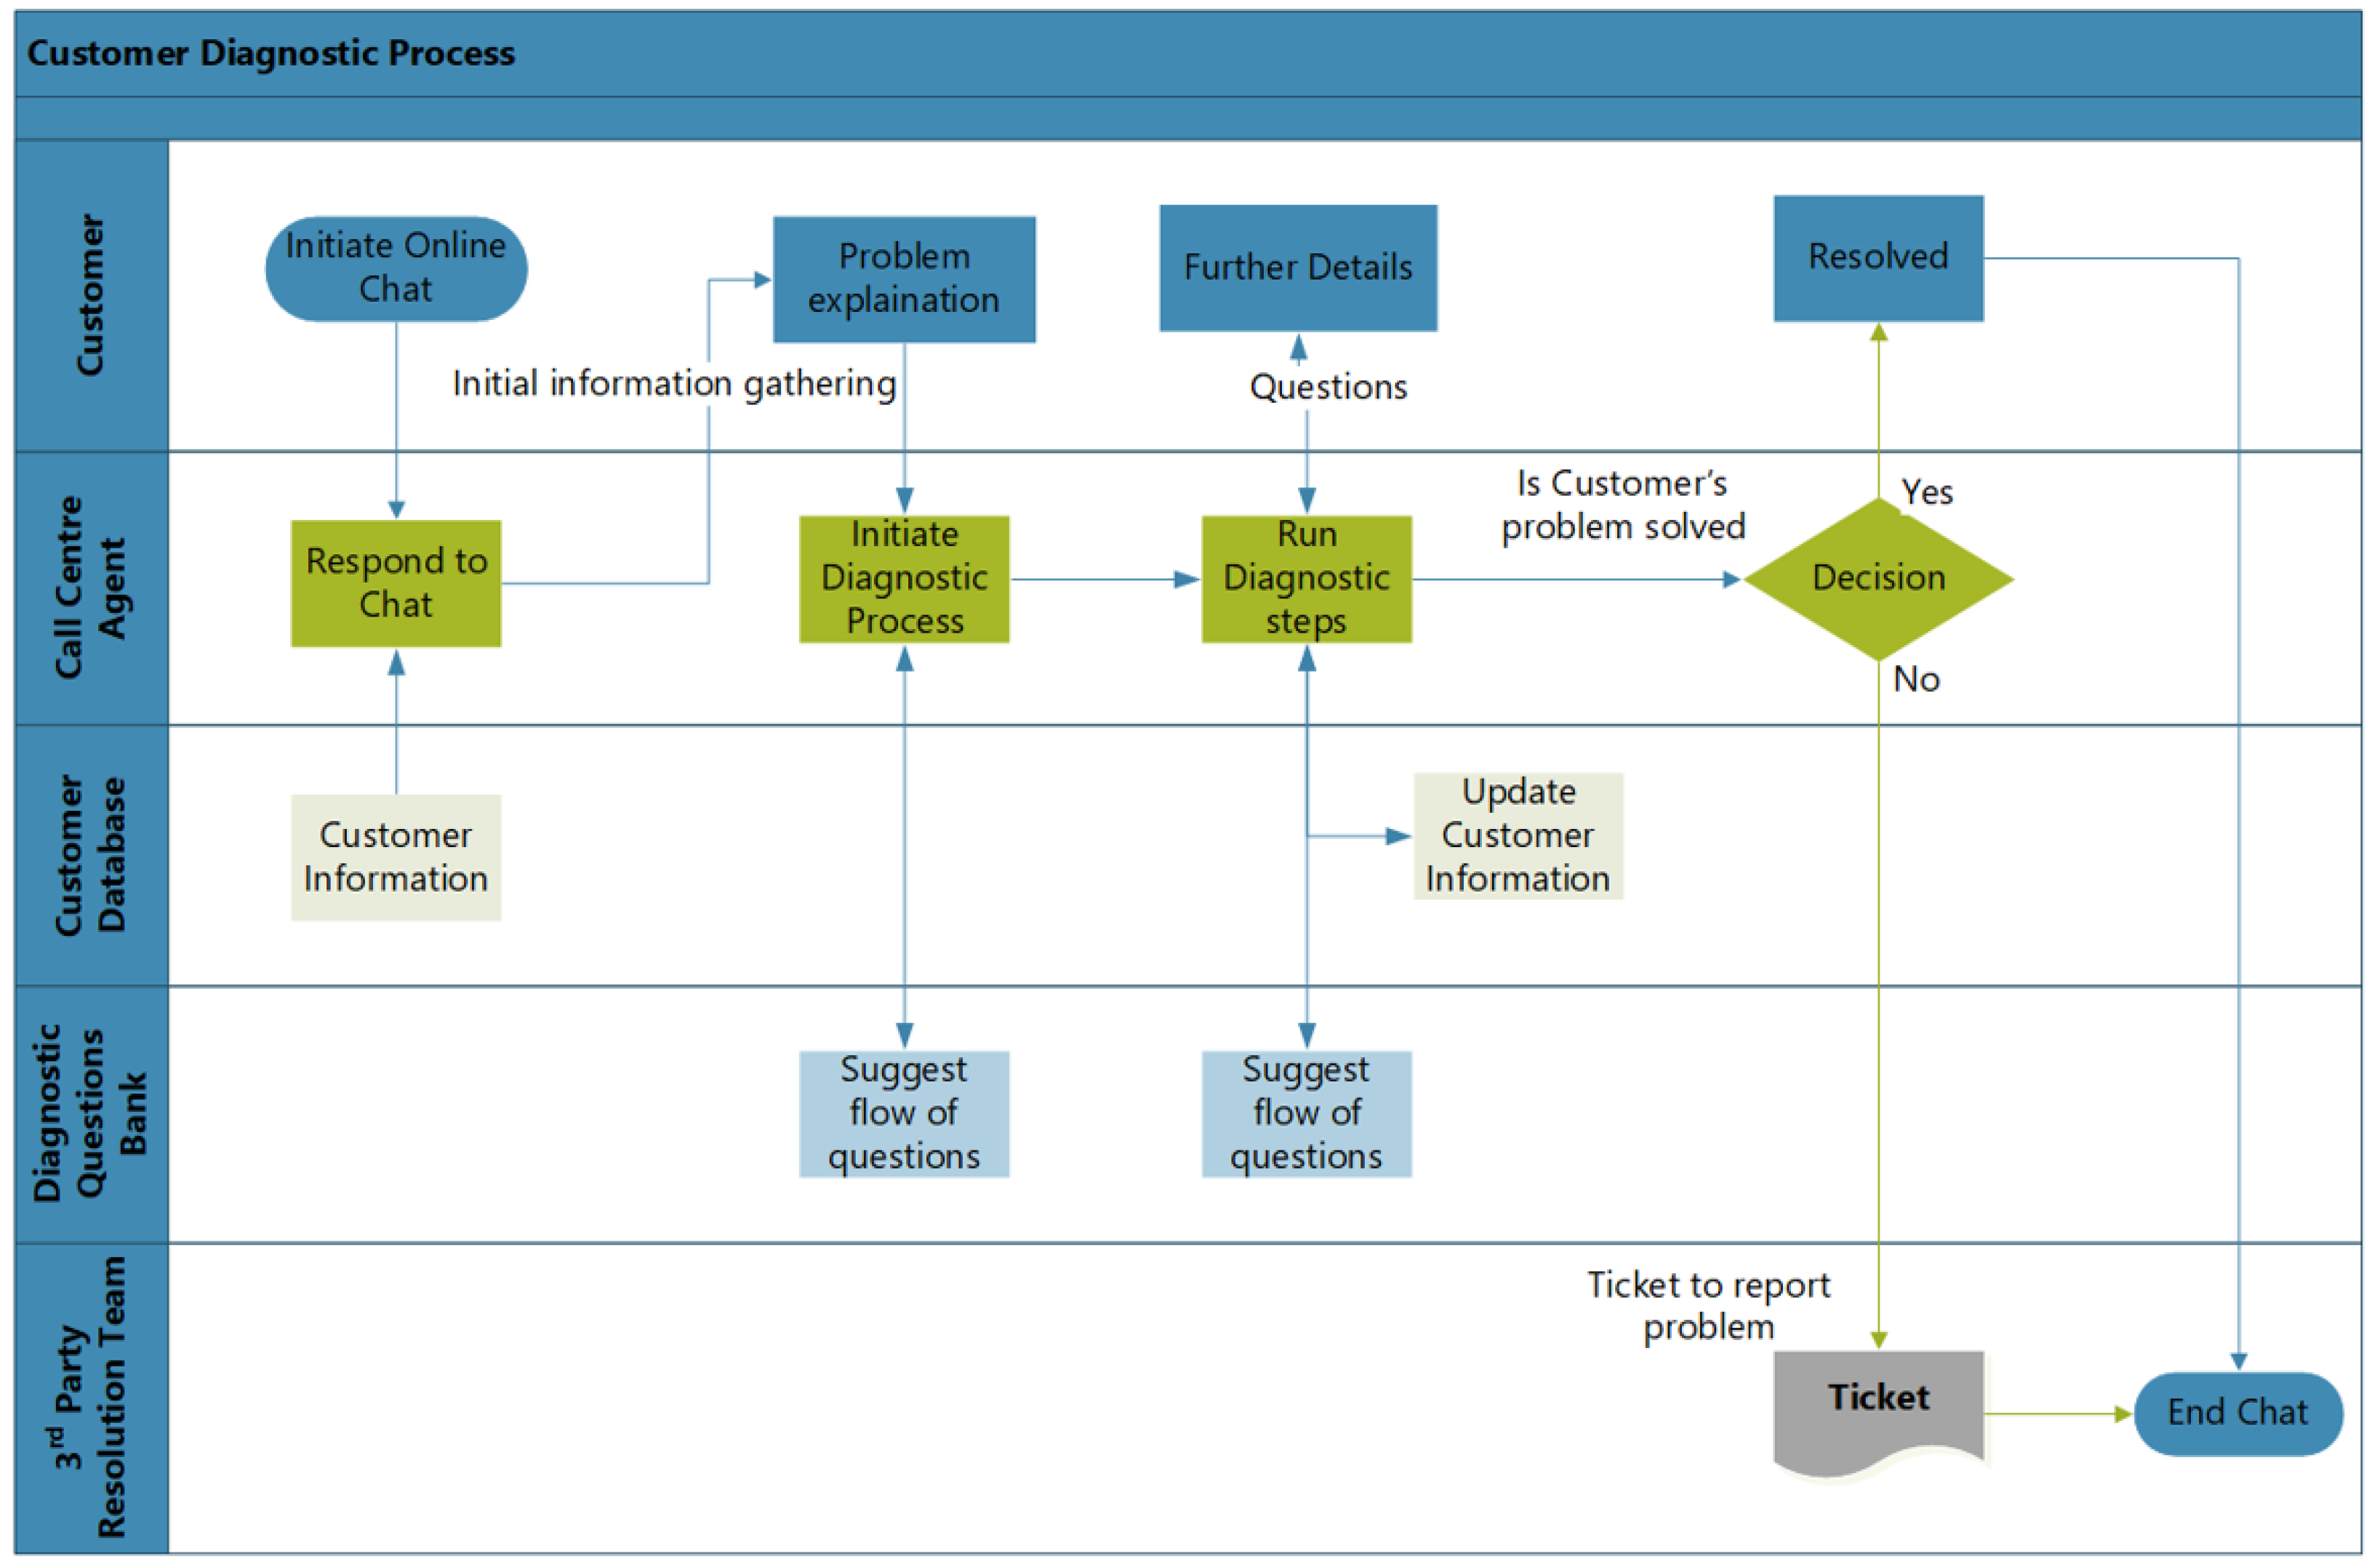
In this paper, a real-world customer diagnostic process (CDP) at BT is considered as a case study to, (a) determine how to extract the data from a complex business environment, and (b) analyse the underlying process execution. Data are extracted from the business process management system (BPMS) installed at the customer relationship department (CRD). CDP is a term referred to the service-related business process where customers interact with service providers for the solution of their service-related queries, using a semi-automated chat service.
The event log generated as a result of the execution of CDP is collected at the database servers of the relevant department of the organisation. Customers use this semi-automated chat facility to contact CRD to solve their service-related queries. These queries could be of different types, compassing different products and services. A predefined set of system-generated questions is used to conduct diagnostics of the problem that customers face. As with chat servers, customers are initially asked for the standard information, such as their service type, location and nature of the problem they are currently facing. The flow of the questions depends on the answers given by the customer, so the flow of questions generated by the system is highly variable. During the series of questions and customer replies, the system identifies the possible workaround to resolve the service-related complaint. In
Figure 2 the generic flow of CDP is presented.
The majority of customers get their issues handled during the call, and this is considered successful execution of the diagnostic process. Whereas, it is also possible that the customer’s query is not resolved during this process, which may happen due to several reasons. These reasons could include the customers failing to respond to the questions within the allotted time period or not providing discreet information about the problem. It is also possible that the system could not identify the root cause of the customer’s problem, or a solution is not possible to be implemented remotely.
In all such scenarios, process execution is considered either completely failed in resolving the issues or partially failed as the customers have been given some timeline for the diagnosis by involving human engineers. It is observed that the execution of such a diagnostic process can have a direct impact on customer satisfaction with the organisation, or even customer churn out in some cases. Each customer’s interaction with CDP is referred to as a process instance, and it is recorded in the log by a unique case identifier.
Each question in the process is a trigger that defines the execution of the process from that point; thus, each question is referred to as an
event that occurred during a process. A
Case_ID can have multiple events and each event belongs to a single
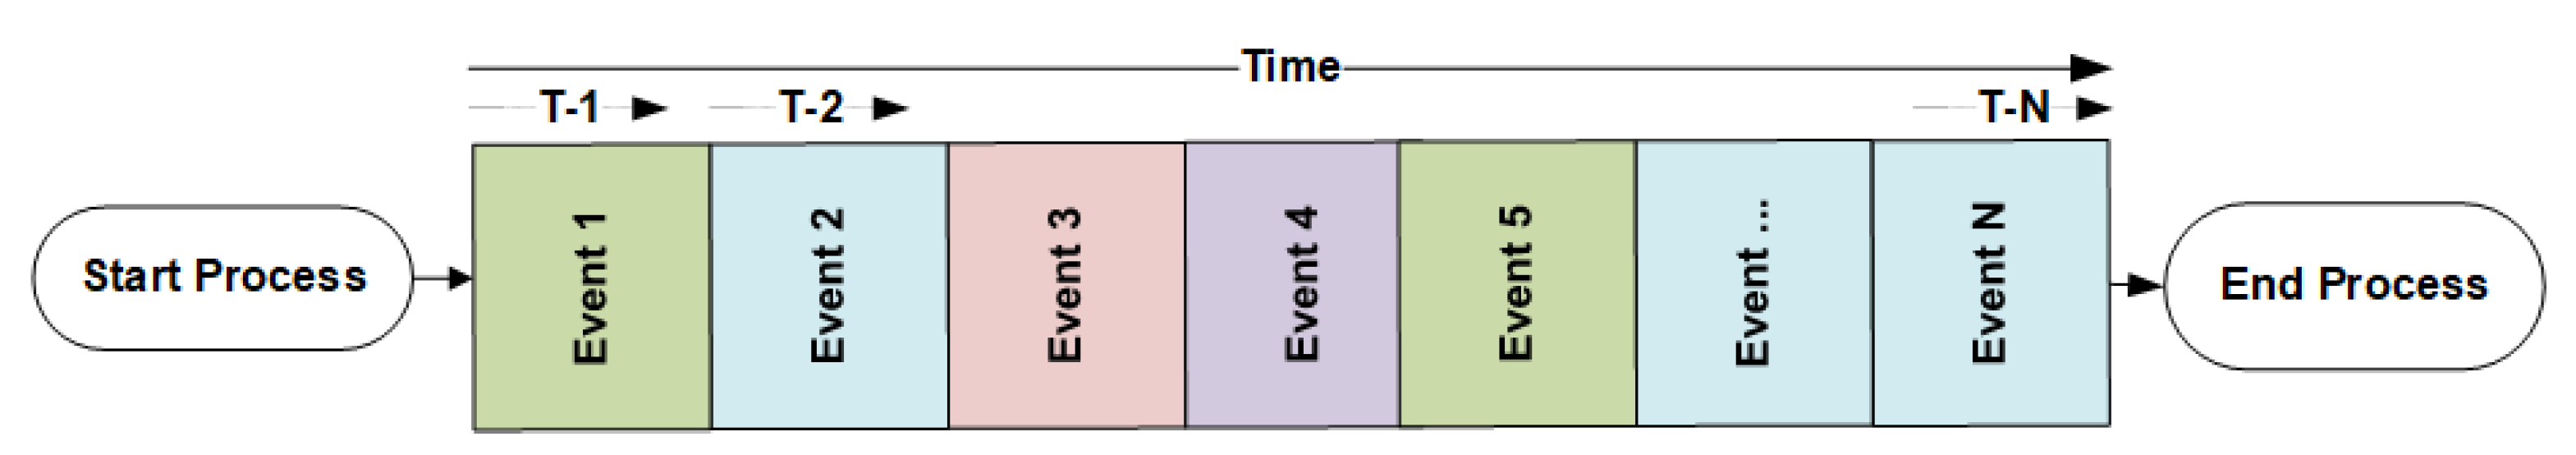
Case_ID. The sample flow of events is presented in
Figure 3 where each event is a representation of the questions initiated from the system and customers as required to reply. It is observed that events may repeat themselves within a process instance (represented as
Case_ID). A series of these questions lead to the completion of the diagnostic process.
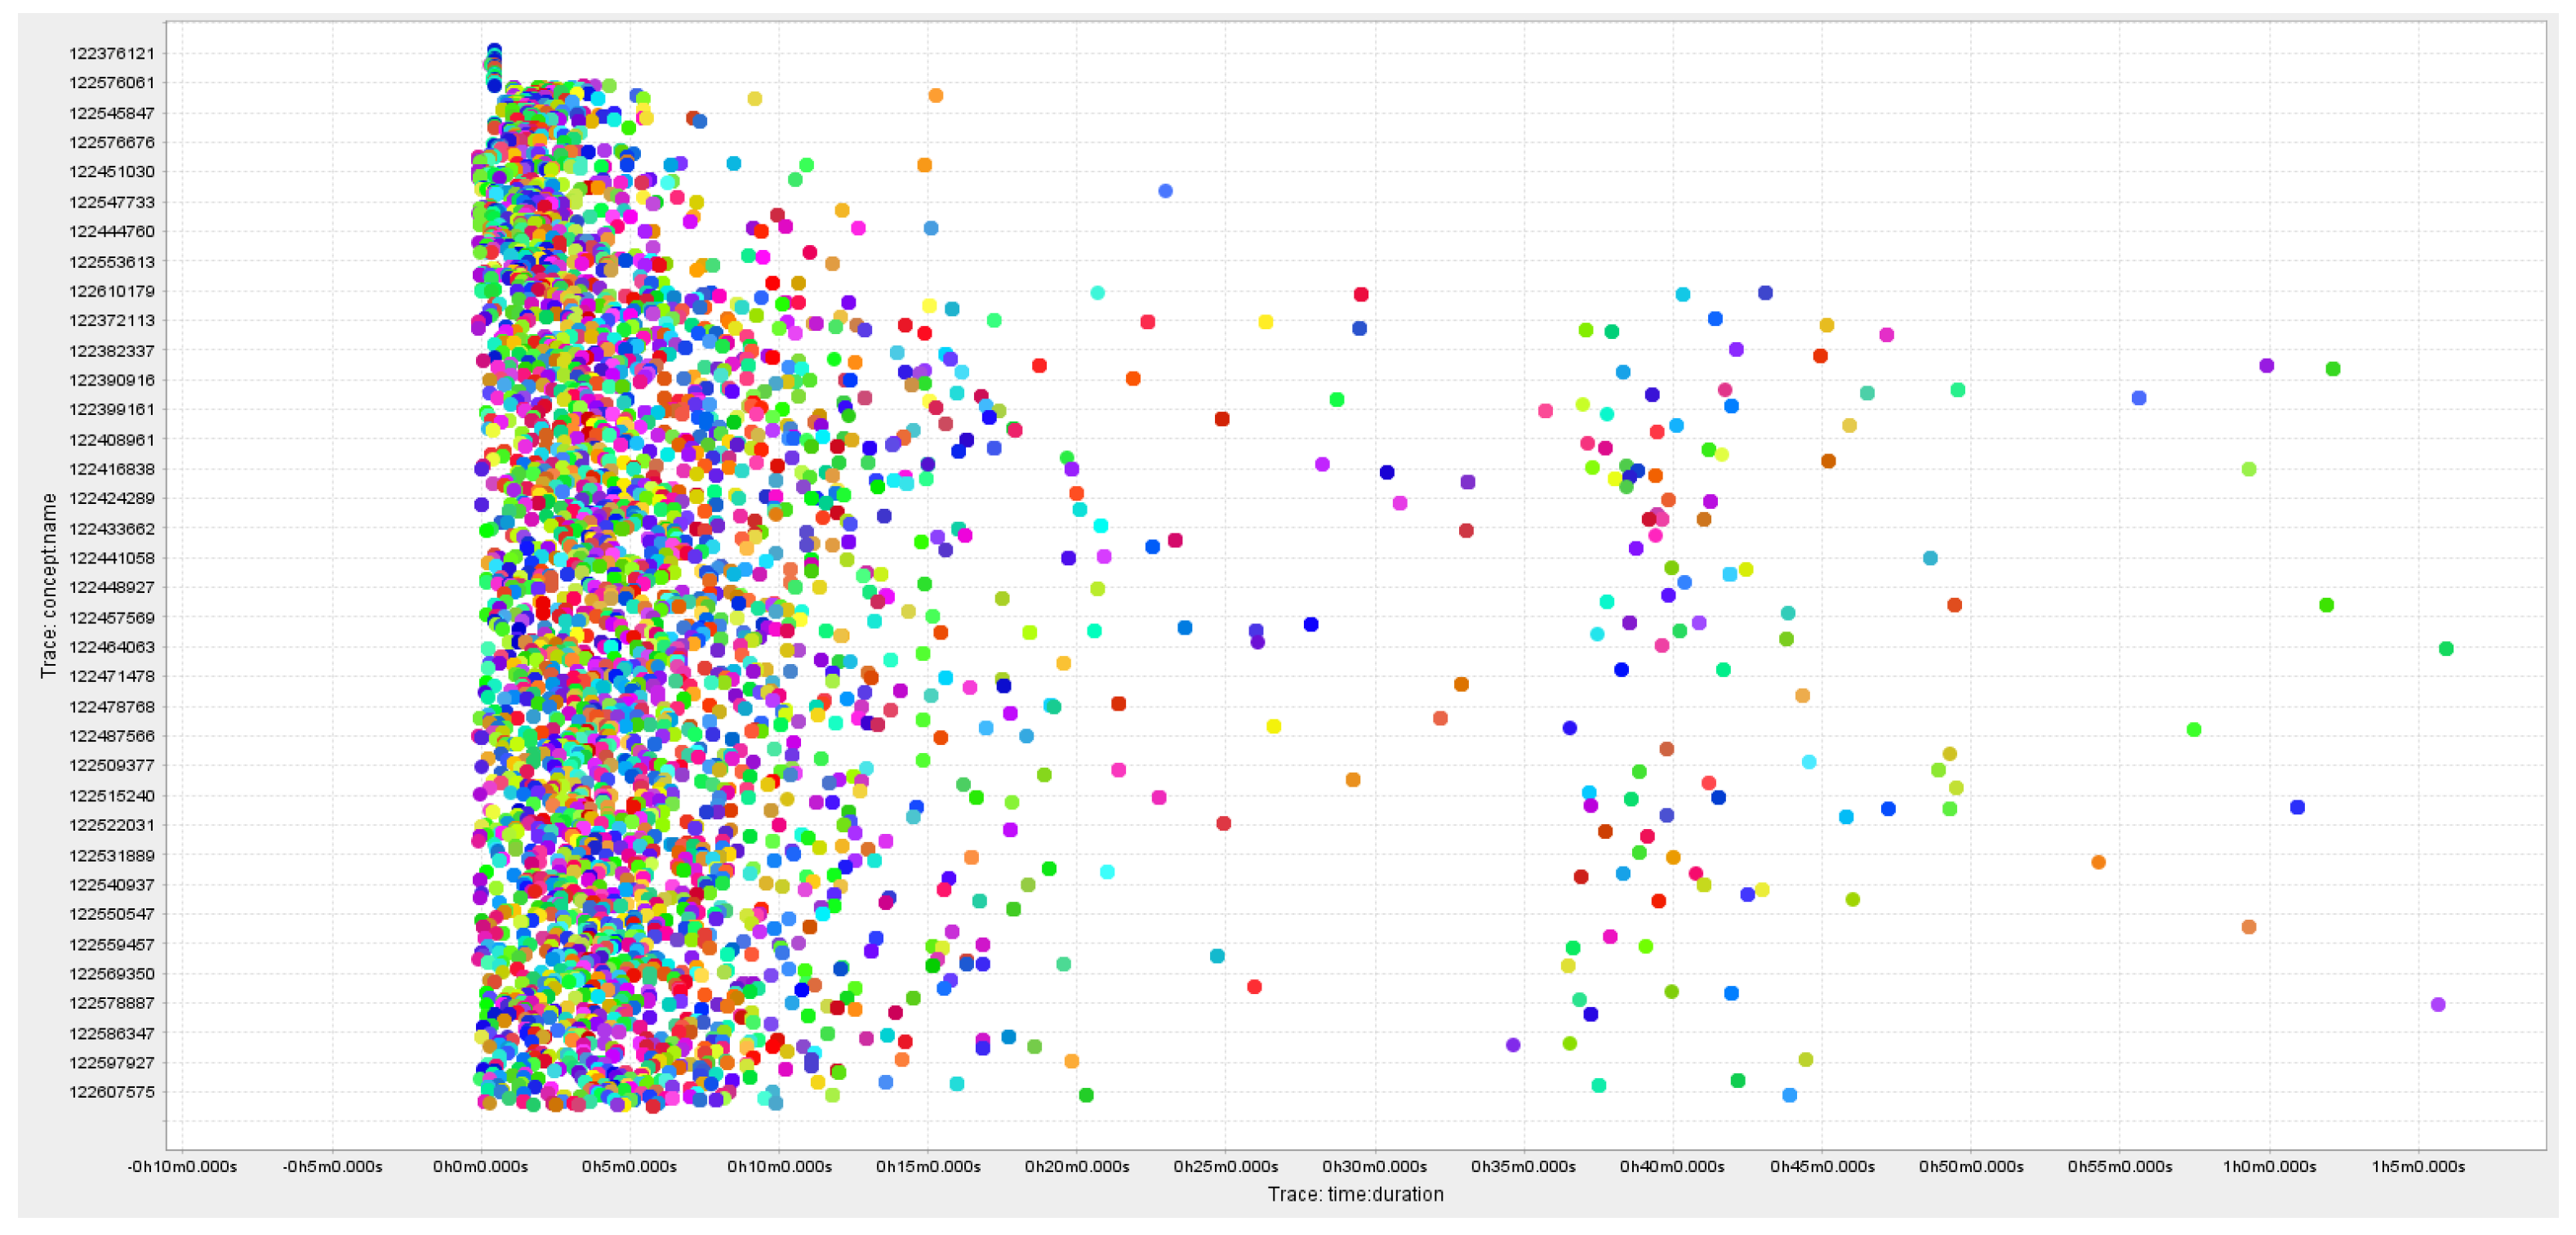
The raw event log contained around 4155 instances referred to as cases in the collected dataset, 2,776,635 total events and 1933 unique events. These cases are related to several customer categories that interact with the organisation’s call centre. The details of the products with the abstracted product names are mentioned in
Table 2. The duration of the cases varied between 1 min and 280 min. approx.
Figure 4 shows the time of customer instances in seconds.
4.3. Checkpoints during Process Execution
This section presents the steps to create checkpoints in the executing instances. Several techniques can be used to divide the complete trace of the process into several segments. The technique used by Khan et al. in [
21] used the percentage of the time spent from the starting date and time
of the process until target date and time
, where
is an initial target for the process to be completed, as defined at the start of the process. Another technique is to create checkpoints based on the fixed duration checkpoints for the executing process instance. However, both of these techniques do not consider the domain knowledge of businesses. Process owners should be able to identify certain points in the process execution at which the identification of possible anomalies may be beneficial.
In this work, a hybrid approach to checkpoint creation is used. Time-based thresholds are used as suggested in [
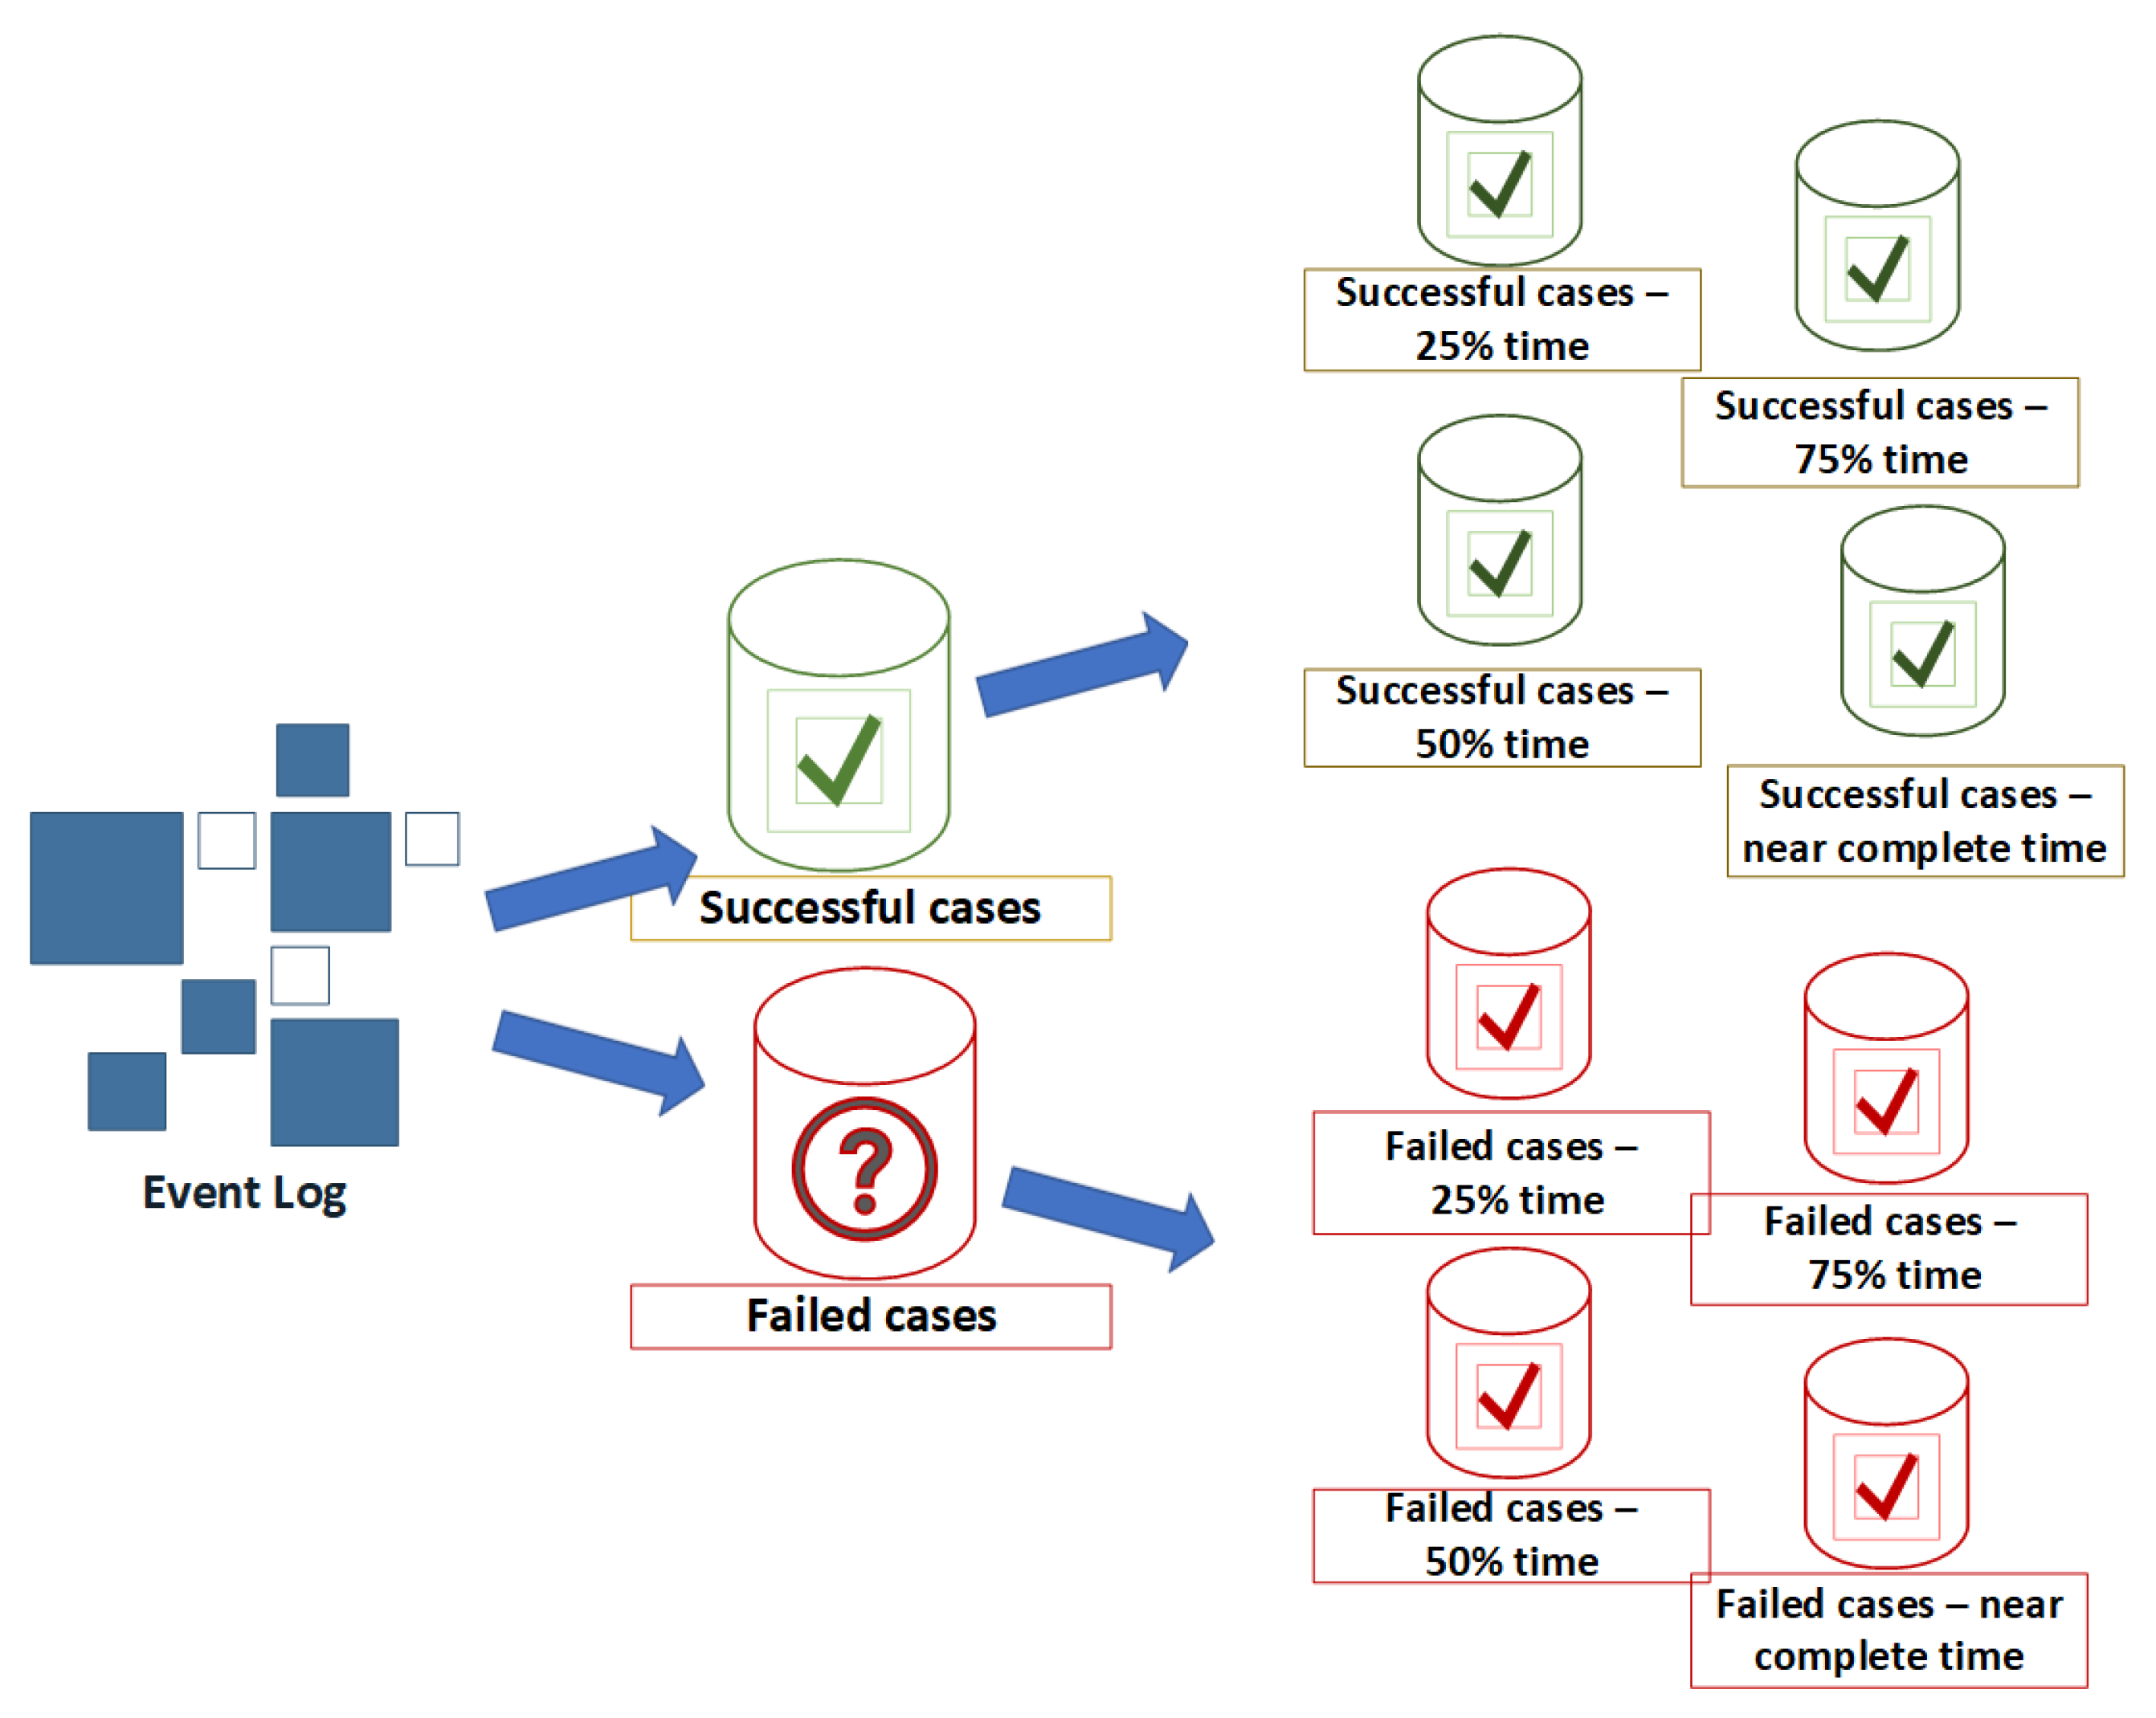
21], and domain knowledge of business users provides major steps in the process of marking the time-based checkpoints. For experiments, two sub-logs are created from the event log of CDP as illustrated in
Figure 5: one sub-log with only successful cases and the other with unsuccessful (failed) cases. Subsequently, each of these individual event logs is split into several segments contains the events that occurred during the identified period. The end-state of each case in the considered event log is labelled as either
successful or
failed.
4.4. Time-Based Division of Process Instances
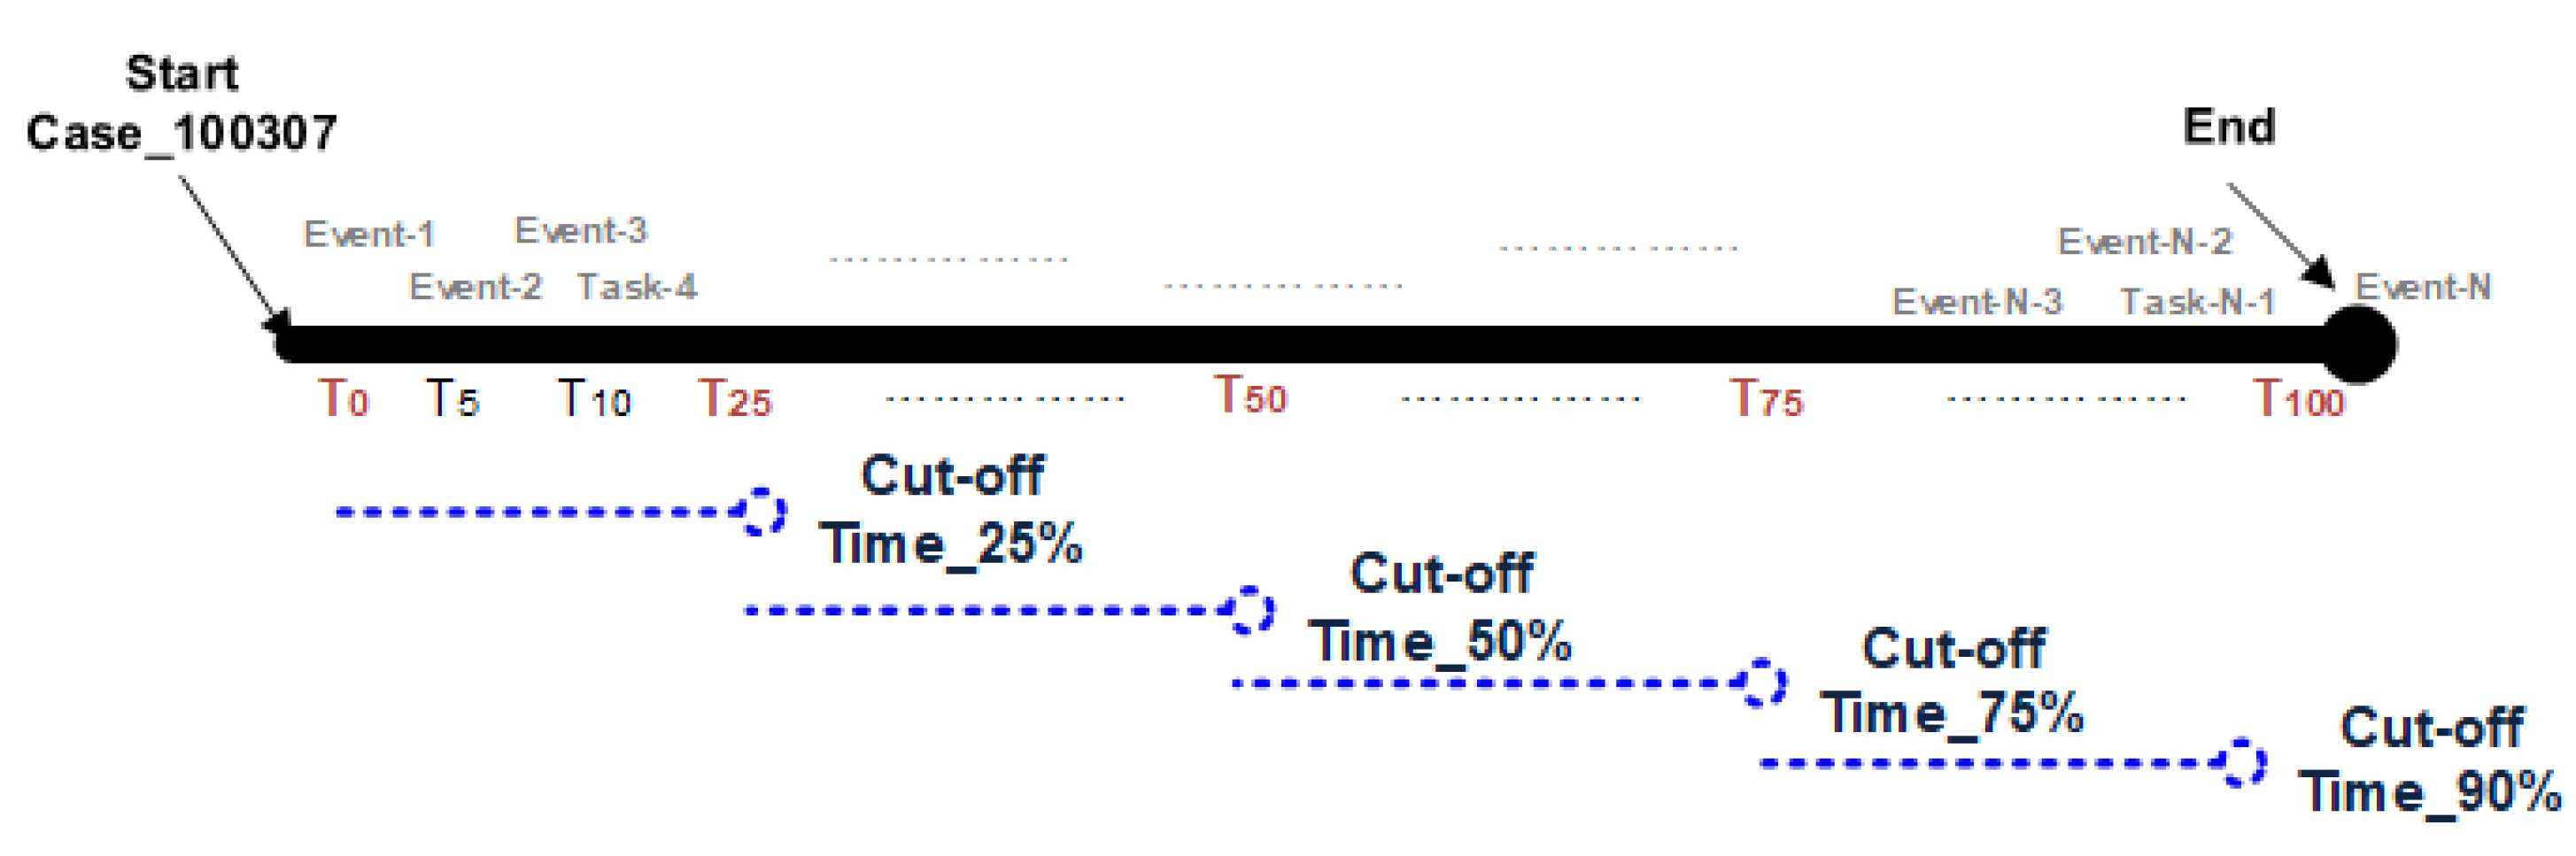
Successful and failed cases are segmented into several sub-logs based upon the time-based threshold presenting the duration of cases since the start of execution. The threshold is a cut-off time that refers to the duration of the process’s portion used as an ‘active phase’ of the case for future outcome prediction. In the rest of the section, the cut-off time (25%, 50%, 75% and 90%) is expressed as time thresholds, calculated as Equation (
1).
For each i:
= Cut off time threshold
= Start time of the 1st event in the log
= End time of the last event of i
Figure 6 shows the cut-off time mentioned in comparison to the total time
. For each of the cut-off portions of the process instance, where
i = threshold % of the time.
5. Optimal Process Discovery
This section illustrates how an ideal model is generated from a highly variable and heterogeneous business process log. This optimal process model most closely approximates the behaviour of cases as they are executed in the event log. Since an optimal process model should support the majority of possible behaviours in an event log, it should not be over-generalised to allow every behaviour in an actual business process. In the experimental setup, a noise threshold to filter out the lower frequency events is set as 10%. This threshold is to avoid the behaviour of those cases to contribute to process discovery which is less frequent.
Several process discovery algorithms are used to play-in the event log of successful cases to discover the process model which correctly represents the ideal behaviour, leading to the successful execution of a business process. This optimal process model tends to represent the behaviour of execution of those instances which directly leads to the success of the process. Yet, there could be some behaviour not captured in the event log which can lead to successful execution and an optimal process model should provide a buffer to accommodate such behaviours. To avoid the representational biases, we used DPN (data Petri nets) for the representation of all models generated through several algorithms during the discovery phase.
The quality of the discovered models is vital to be verified as each process discovery algorithm has its strengths and limitations [
3]. The quality of any process model can be analysed with the help of four quality criteria:
fitness,
precision,
generalisation and
simplicity. As generalisation and simplicity are not easy to quantify using any statistical methods and they are proportional to the fitness and precision, the purpose is mainly served by considering two main quality criteria, presented as below:
(a) Fitness is formally defined as a measure used to evaluate the quality of the process model by calculating the events mismatch when an actual log is replayed with the discovered process model. If a process model can replay all the traces in the process log without any inconsistencies, it is said to have perfect fitness. The fitness (also referred to as replay fitness) of a process model is defined in [
3] as the validity of the conformance of the log events when a replay of the events in the log is performed using Petri net tokens over its discovered model. Equation (
2) presents the fitness
f of the trace
for a given event log
L on pre-discovered process model
N.
where
m = missing tokens,
c = number of consumed tokens,
r = number of tokens remaining after replay and
p = total number of tokens produced for a Petri net.
In Equation (
2),
presents the considered trace of the process log for replaying the log into the process model, and
presents the Petri net model discovered through a miner algorithm. The number of missing tokens
m, number of consumed tokens
c, number of remaining tokens
r and number of produced tokens
p are all associated with the log
. The first part represents the proportion of missing tokens relative to the number of tokens consumed. The second part calculates the remaining token fraction relative to the total tokens generated through the log. The closer the value of fitness
f to 1, the higher the fitness of the model and the better the conformance related to the considered event log. Fitness is the most vital metric for gauging the quality of the process model [
3].
(b) Precision is a measure to quantify the behaviour allowed by the process model. A discovered process model is considered 100% precise if replay only allows the behaviour which is present in the event log. The overall precision of the model is presented in the range of 0–1, where 1 is the highest precision average. A precision close to zero refers to the underfitting behaviour of the model where not all possible traces can be mapped into the model. In contrast, the model allows the behaviour in the process that does not exist in the log. If precision is too high, equal or close to 1, the process model does not allow more behaviours than the one already observed in the log.
To define precision, the approach presented in [
22] is used. Let
be the set of events in an event log
L.
M is the corresponding process model having a set of states
S. Let
A be the set of activities and assume the default classifier
is the
activity associated with event
. Precision of overall can be defined as follows in Equation (
3): assume that
M is the process model that represents the event log
L, such that each event
e fits into the
M. The
state before occurrence of
e can be computed as
. Now, let
be the set of activities enabled in
M in
. Similarly,
is the set of activities that were earlier executed in the model M, thus having the same history.
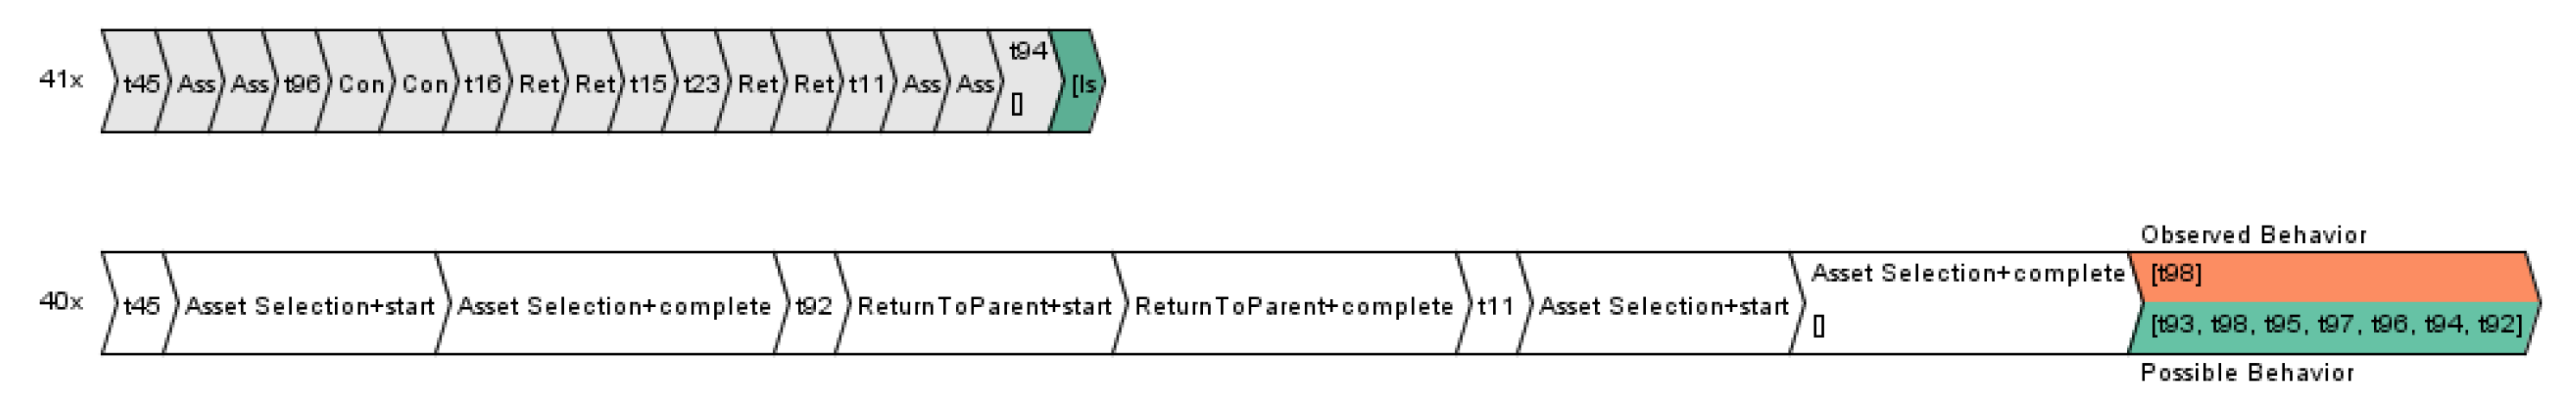
The precision of the trace is calculated based on the behaviour which is observed vs. the behaviour which is possible. If the precision is very high then model does not allow for much more behaviour then originally observed in the log, thus
. If the precision is very low then it means that model allows for much more behaviour than observed in the log, thus
.
Figure 7 presents the two trace variations from CDP with 40 and 41 instances respectively, generated through ProM tool. Possible behaviour in the given trace variant is t93, t98, t95, t97, t96, t94 and t92 whereas observed behaviour is t98.
Optimal Model for Service-Oriented Business Processes
It is vital that the process model used for compliance analysis be of the highest possible quality. This section applies four well-known process discovery algorithms from the literature to discover the model encapsulating the behaviour of log instances.
Alpha miner is one of the earliest algorithms developed for detecting concurrency in event logs. It was the first in kind algorithm to discover several properties of event log such as loops, parallel parts, and the conditional joins [
23]. Heuristic miner mines the perspective of the control flow in the event log. It focuses on the order of events with a specific case, irrespective of the order of events in the overall event log. The timestamp of the events identifies the control-flow perspective. The Inductive miner identifies the behavioural split in the control flow of an event log and marks it with an operator. For the split sub-logs, the same step is repeated, thus forming a process tree. The formation of a process tree allows improved soundness of a process model. ILP Miner, derived from integer linear programming (ILP) based replay algorithm. It uses the strategy of decomposing, which merges the smaller fragments of decomposed event logs into a single event log [
8].
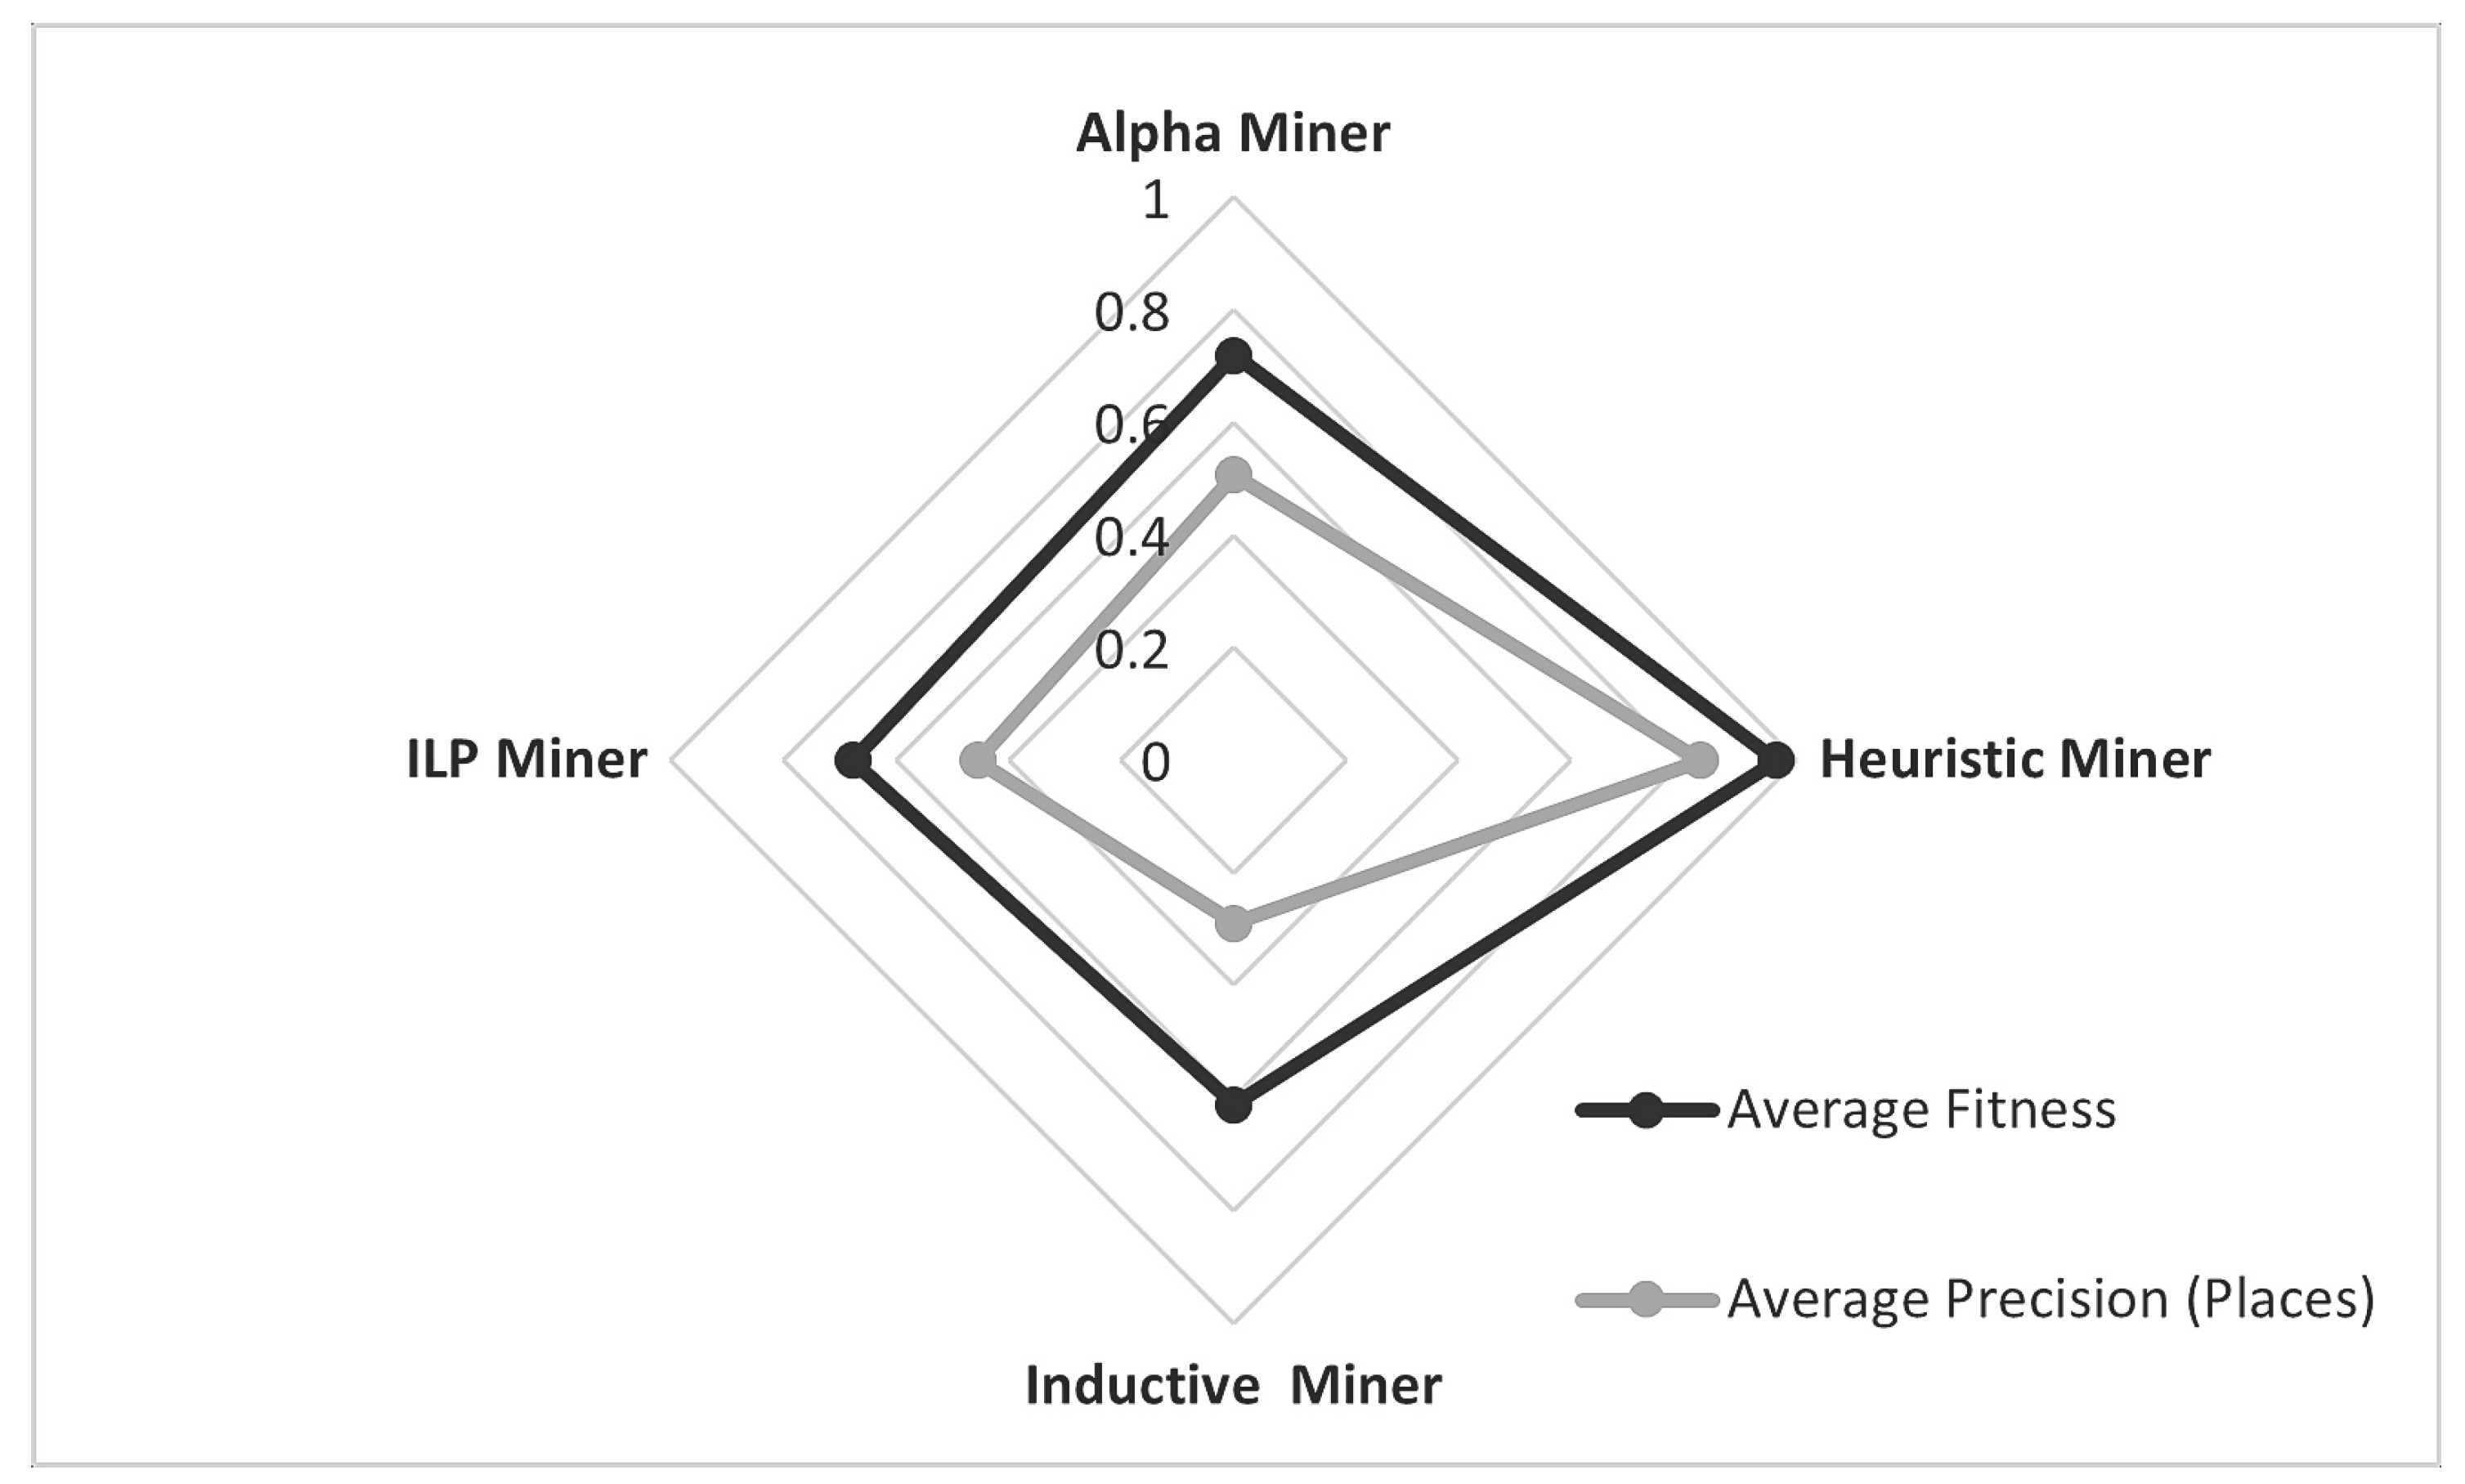
A comparison of the average fitness and precision of the four process models discovered using successful cases from the event log is shown in
Figure 8. Based on the best quality parameters, one of these models is selected, representing the behaviour of process instances. A fitness close to 1 indicates that the maximum number of behaviours observed in the log is re-playable from the process model. Precision should ideally be between 0.7 and 0.8, which shows that model is not too precise to reject any new legitimate behaviour nor too general to allow any possible behaviours. As shown in
Figure 8, fitness calculated through the Heuristic miner algorithm is 96.4, which is the highest among others, Alpha miner had the second highest fitness score of 0.71 and Inductive miner resulted in the lowest fitness score, which is an average of 0.61. The most increased fitness of the Heuristic miner represents the directly followed behaviour of the events in the log.
On the other hand, the Inductive miner could not handle the incomplete traces from the event log, which is a common scenario with real-world business processes. Like fitness, the best average precision of the log is 0.83 with a Heuristic miner, and the lowest is 0.29 with the Inductive miner.
6. Setup for Conformance Analysis
A subset of the CDP event log is used for experiments including three different classes of customers, ‘Product-A’, ‘Product-B’ and ‘Product-C’. After initial pre-processing, 3000 cases of varying lengths are used for experiments. The length of a trace ranges from 2 events in a trace to the max of 192 events in a trace, with an average size of 113 events per trace. The number of unique event classes in the dataset is 64, and the total number of events in the process log is 8100. A diverse variety of cases are among the event log, with the number of starting event classes between 1 to 3 and end-event classes up to 7. Starting event classes present the number of the starting point of traces in the event log, and similarly, end-event classes define the number of endpoints in the traces.
The cases are labelled as either successful or failed, depending on how they have been executed and their outcome. Balanced classes for both successful and failed cases are used to evaluate the event log. For conformance testing, the ProM tool is used (v 6.10) on a 3.3 GHz Intel Core i5 8th generation desktop machine with 16 GB of RAM.
6.1. Fitness Calculation for Different Checkpoints
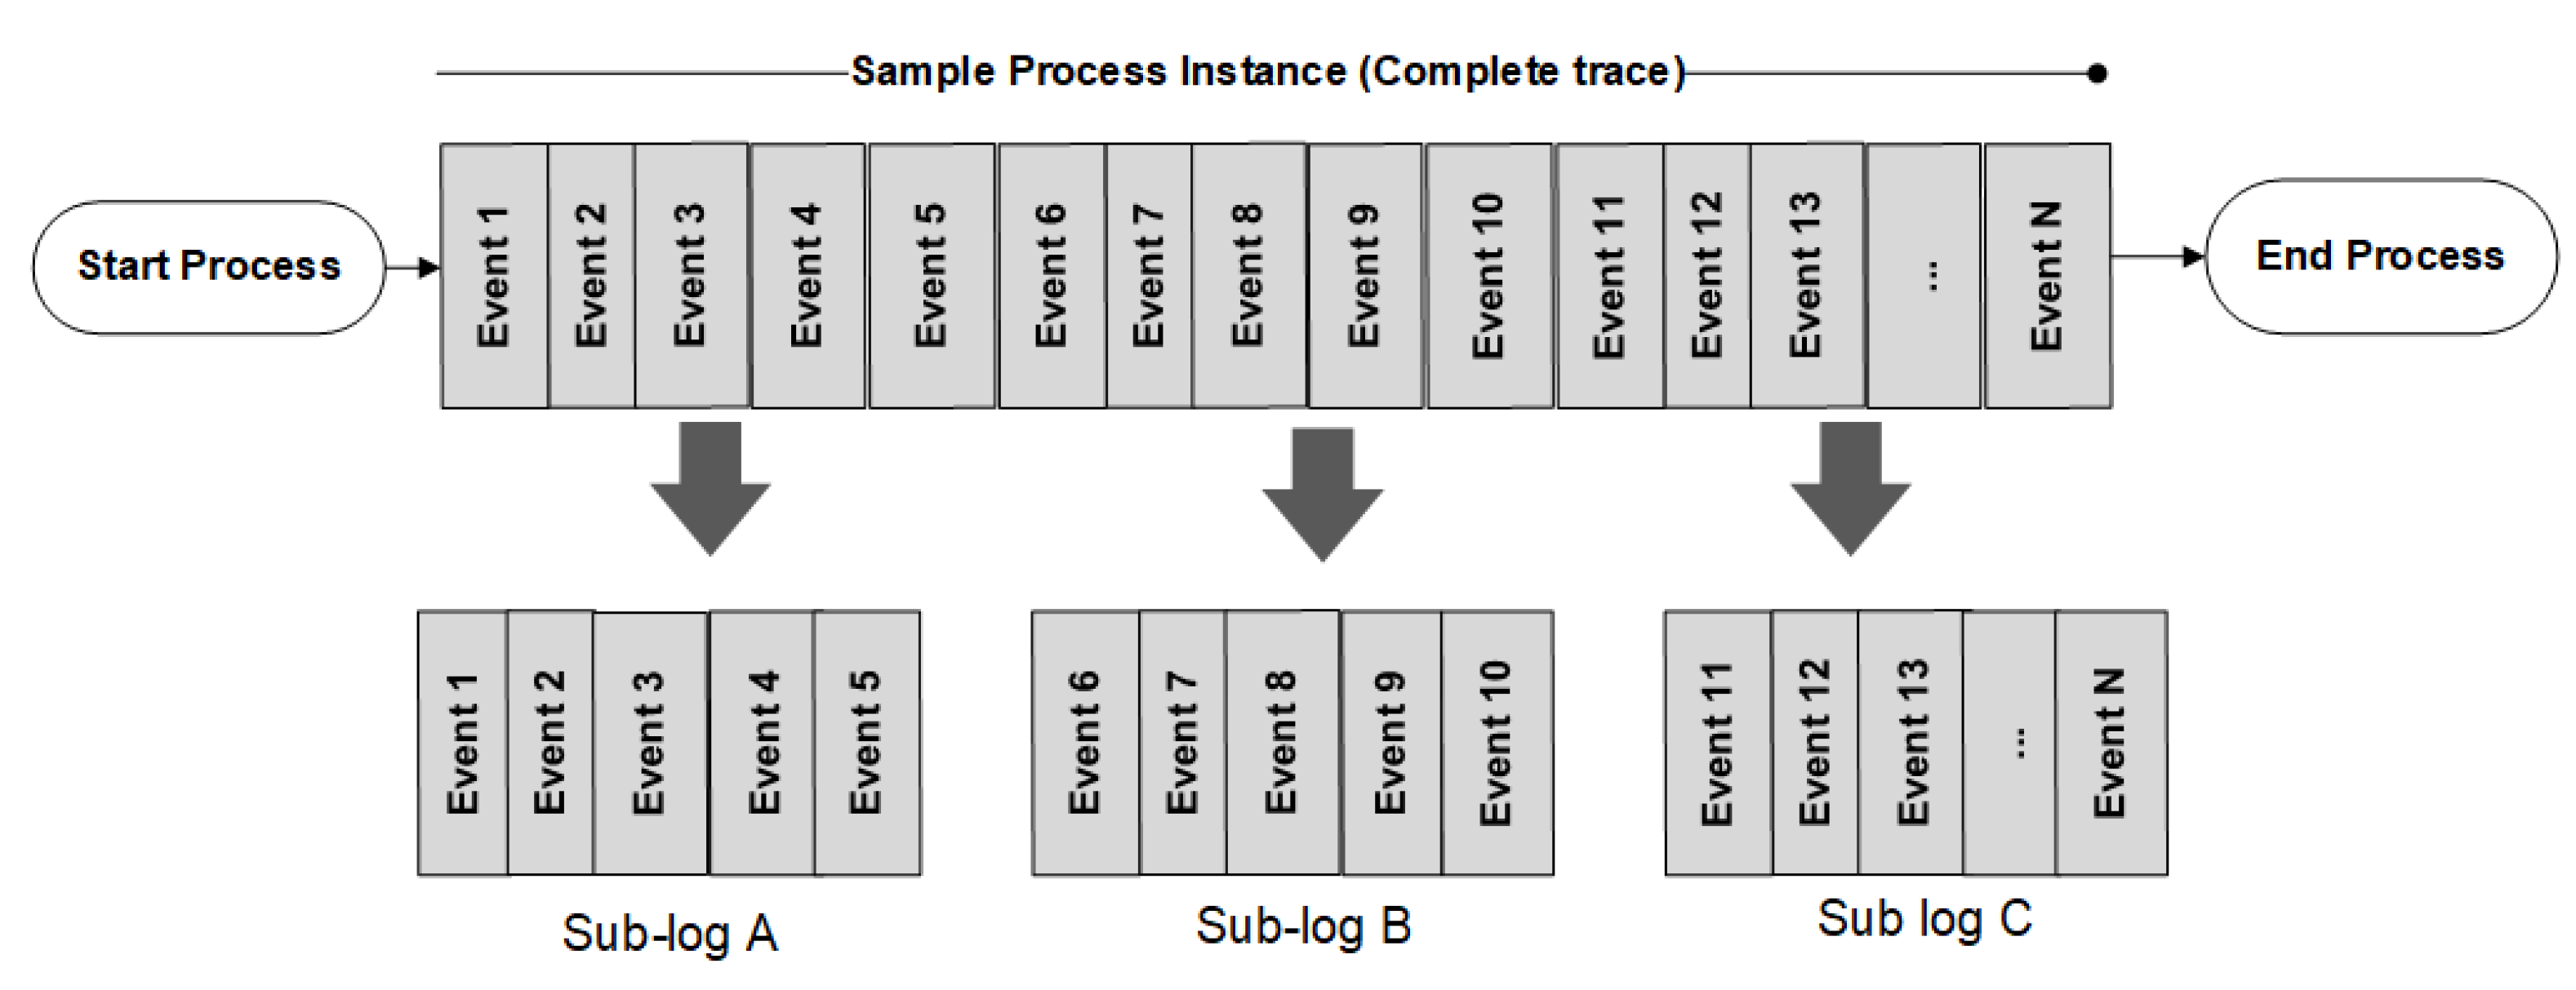
As presented in an earlier section, the event log is divided into several sub-logs based on the time threshold using the cut-off time (25%, 50%, 75% and 100%). Each sub log contains traces of the length
of length
where
n is the total length of the trace and
m is the number of segments as shown in the
Figure 9.
In this work, for CDP the presented value of m is three as the domain experts recommend three logical portions. Each sub-log may contain a different number of events. For instance, sub-log A contains traces with the start of the process till around 33% of the trace execution, sub-log B includes the middle portion of the trace, and sub-log C contains the final 33% of the trace. The goal is to identify the failure by earliest identifying the decreasing trend of the fitness score. The value of fitness is generated using the ProM tool through the following steps:
Convert XES file for each of the sub-log. The plug-in used is the ‘XES converter’ in ProM Lite 1.2.
Use XES log to discover the process model using the Heuristic miner algorithm through the plug-in ‘Interactive Heuristic Miner’ in Prom 6.9.
Extract the data Petri net for each sub-log.
Use the ‘Multidimensional Conformance Analysis’ plug-in in ProM 6.10 to extract case-level fitness.
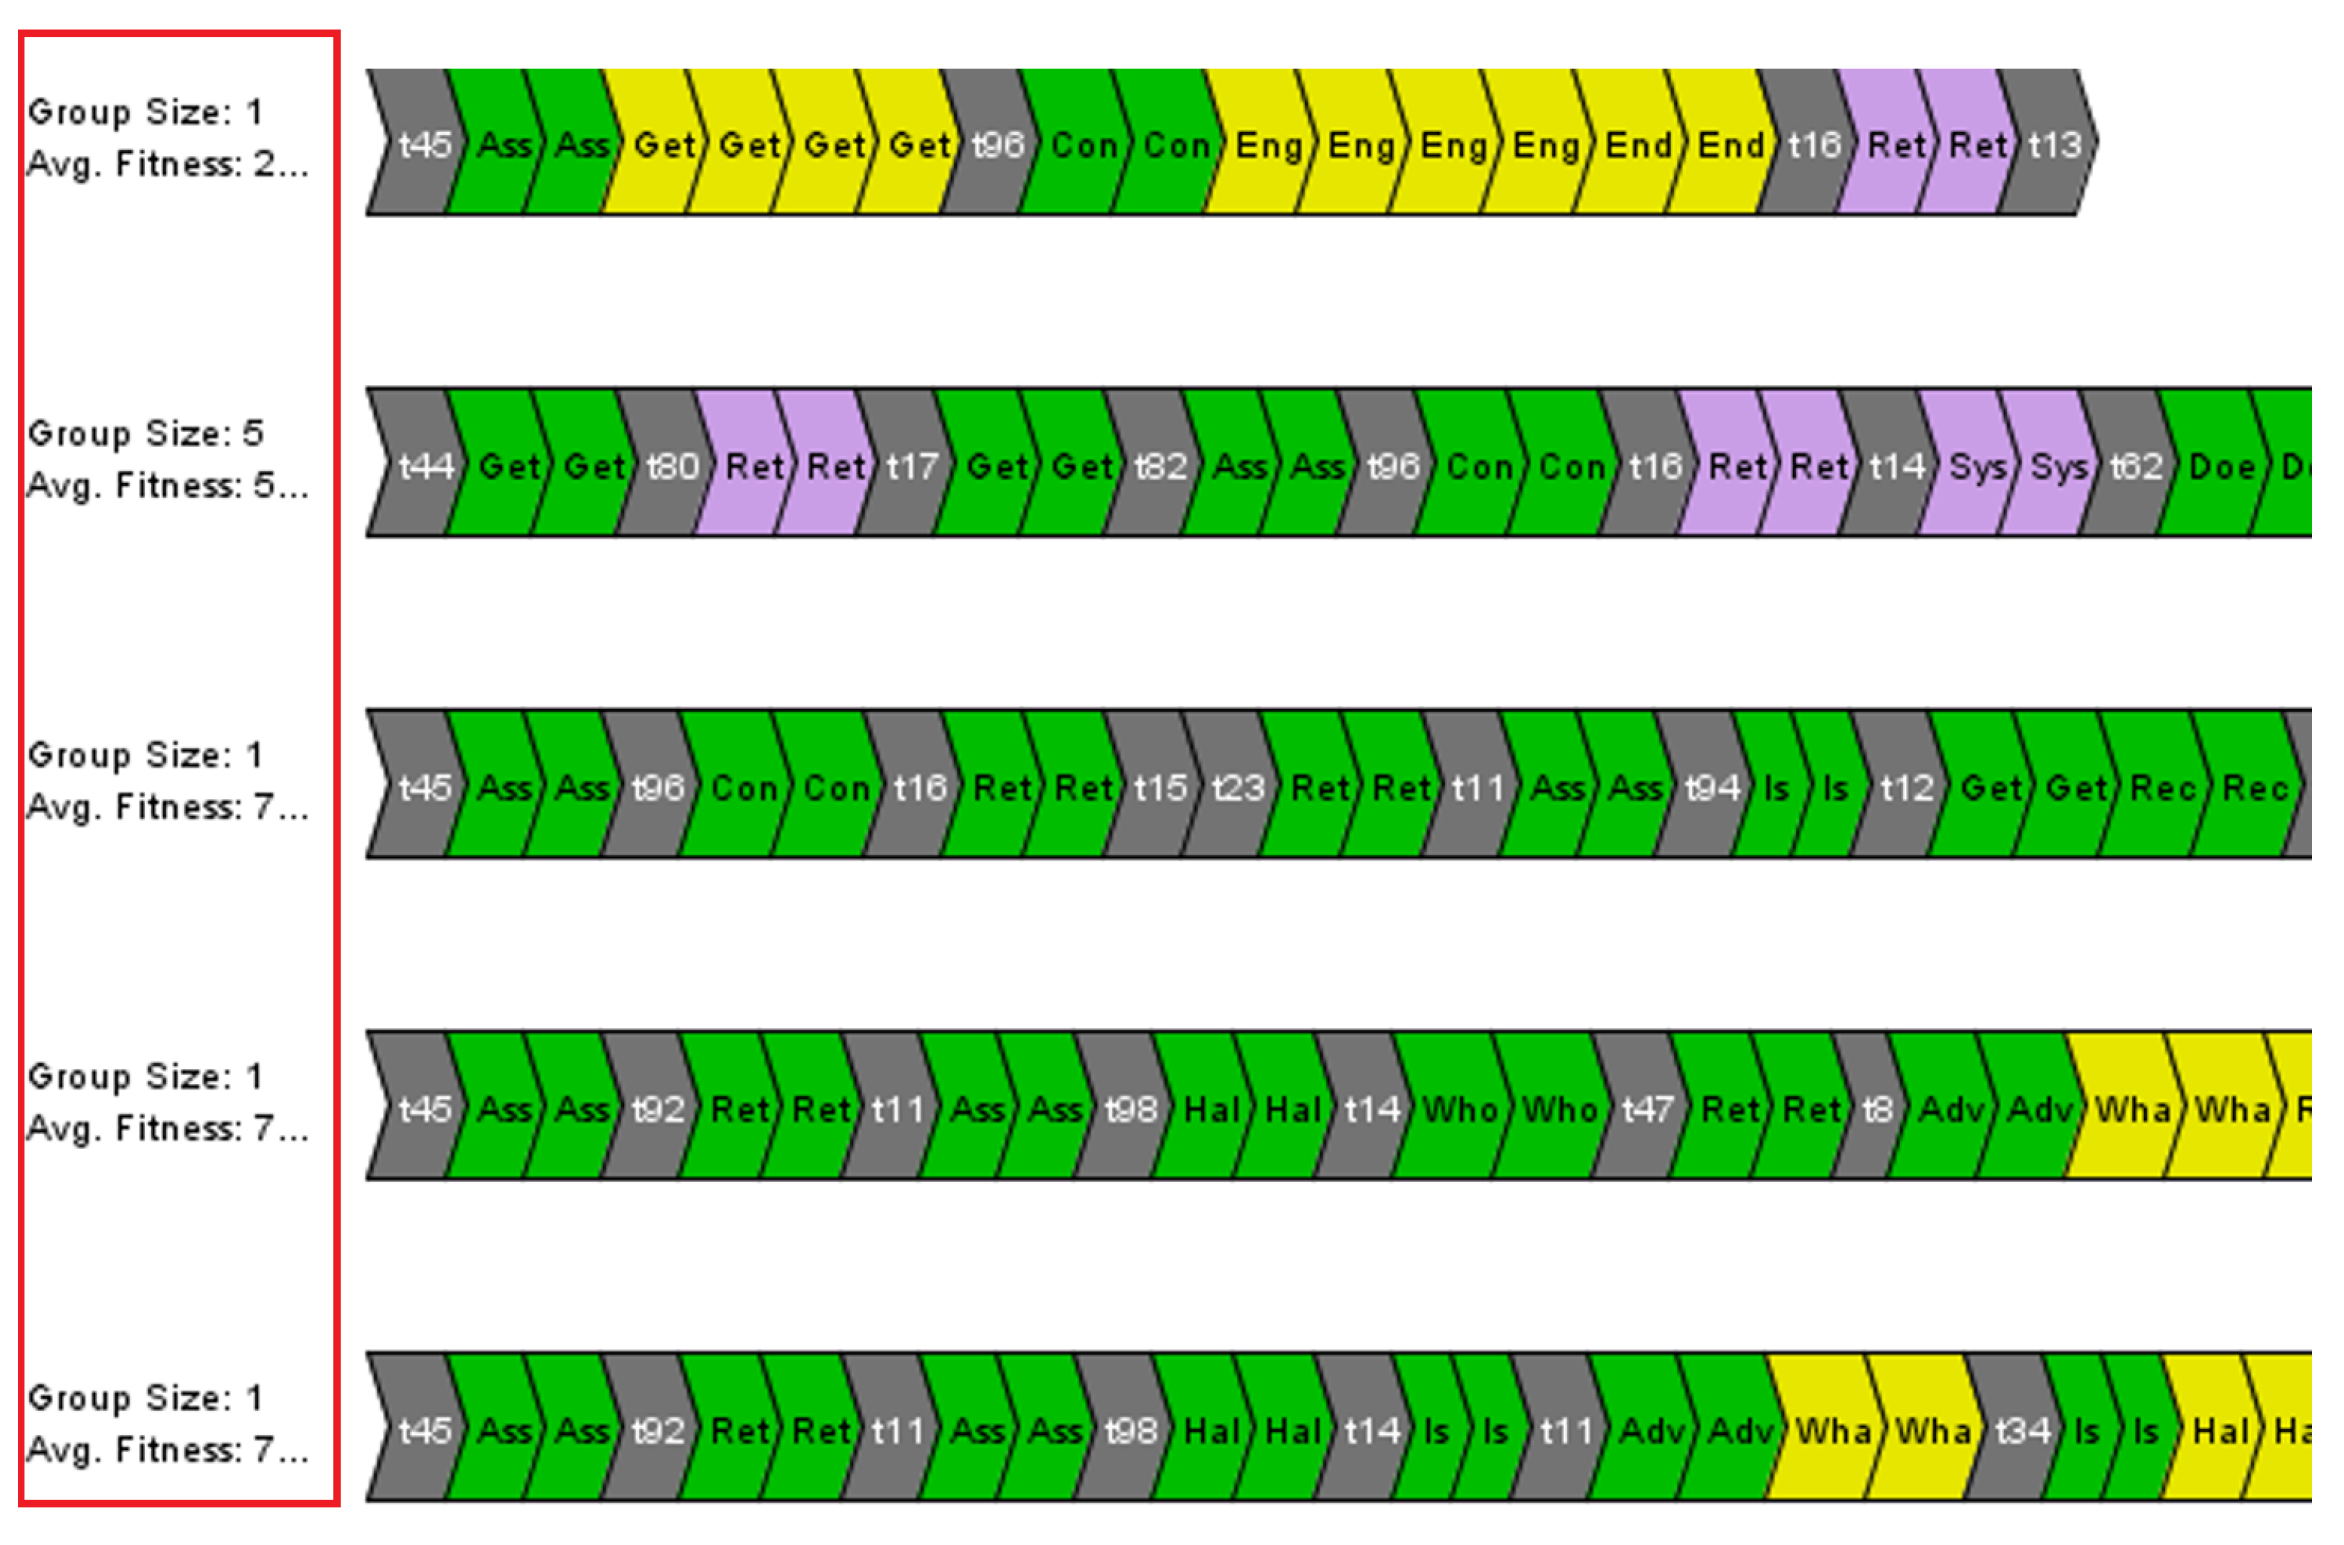
Figure 10 shows the screenshot with each row presenting a sub-log, and the fitness score is mentioned at the left corner.
Table 3 presents the fitness score of some traces in tabular form. Each row in the
Table 3 presents the complete trace, divided into the three phases.
6.2. Causality Analysis for Abnormality Detection
This section presents the methodology for anomaly detection using process mining techniques on the services-related business process data. Three conformance testing approaches from the literature are adapted in this study to be applicable to complex business processes. The first technique is ‘causality analysis’, presented initially by Verbeek et al. in [
24].
Causality analysis focuses on the characterisation of all possible paths in an event log. For this, process instances are required to be expressed in terms of process model notation. Causality analysis is independent of the type of notation used, e.g., Petri net, BPMN or UML activity diagrams. This work focuses primarily on Petri nets as it is the most comprehensive used notation of the process model for mining processes. Additionally, Petri nets support the heterogeneity present in service oriented business processes. We have proposed our technique using the standard concept of causality matrix to find the difference in behaviour between different variations of the process instances. Causality analysis is performed on the CDP event log for each of the two types of instances (successful and failed cases). The causality matrix is advantageous for analysing the direct relationship between activities to establish credible causal connections between events in each class. The objective is to compare the matrices of each type of instance to extract the behavioural differences between them. The behaviour of events in successful cases provides the optimal scenario for executing business operations. As indicated in unsuccessful cases, any variation from successful cases’ behaviour is critical to analyse the root cause for improving the efficiency of the processes. This suggests that instances that fail to execute successfully are undesirable for business users and that fixing these deviations will indeed enhance process efficiency.
The causality relationship is converted to numbers and normalised using min-max normalisation to project the value in the range of +1 and −1. A plug-in in ProM Lite 1.1 ‘Convert Data-aware Causal Net’ by Maandhardt et al. is used to generate the matrix in
Figure 11. For instance, the directly followed relationship is mentioned in the form of dependency measure value in
Figure 11 as a causal activity matrix’s strengths scaled between −1.0 (weakest-red) to 1.0 (strongest-green). The characteristics of the causal activity matrix are as follows:
A value of 1.0 shows that a direct causal relationship exists with certainty. These values are represented as dark green in the matrix.
A score between 0.5 and 0.9 implies that there is a strong likelihood of a direct causal relationship. These values are represented with different shades of green from lighter to dark, dependent upon the value.
A value of 0.0 to 0.4 implies that it is not clear whether a direct causal relationship exists or not. These values are represented with different shades of green from lighter to dark, dependent upon the value.
A score between −0.1 and −0.5 implies that there is a high probability that no direct causal relationship exists. These values are represented with different shades of yellow from lighter to dark, dependent upon the value.
A value of −0.6 to −1.0 indicates that there is a certainty that no direct causal relationship exists. These values are represented with different shades of red from lighter to dark, dependent upon the value.
By using the plug-in ‘Discovery of Resources Causal Matrix’ plugin in the ProM tool, causality matrices are generated for each of the variants of the event log, i.e., successful and failed cases.
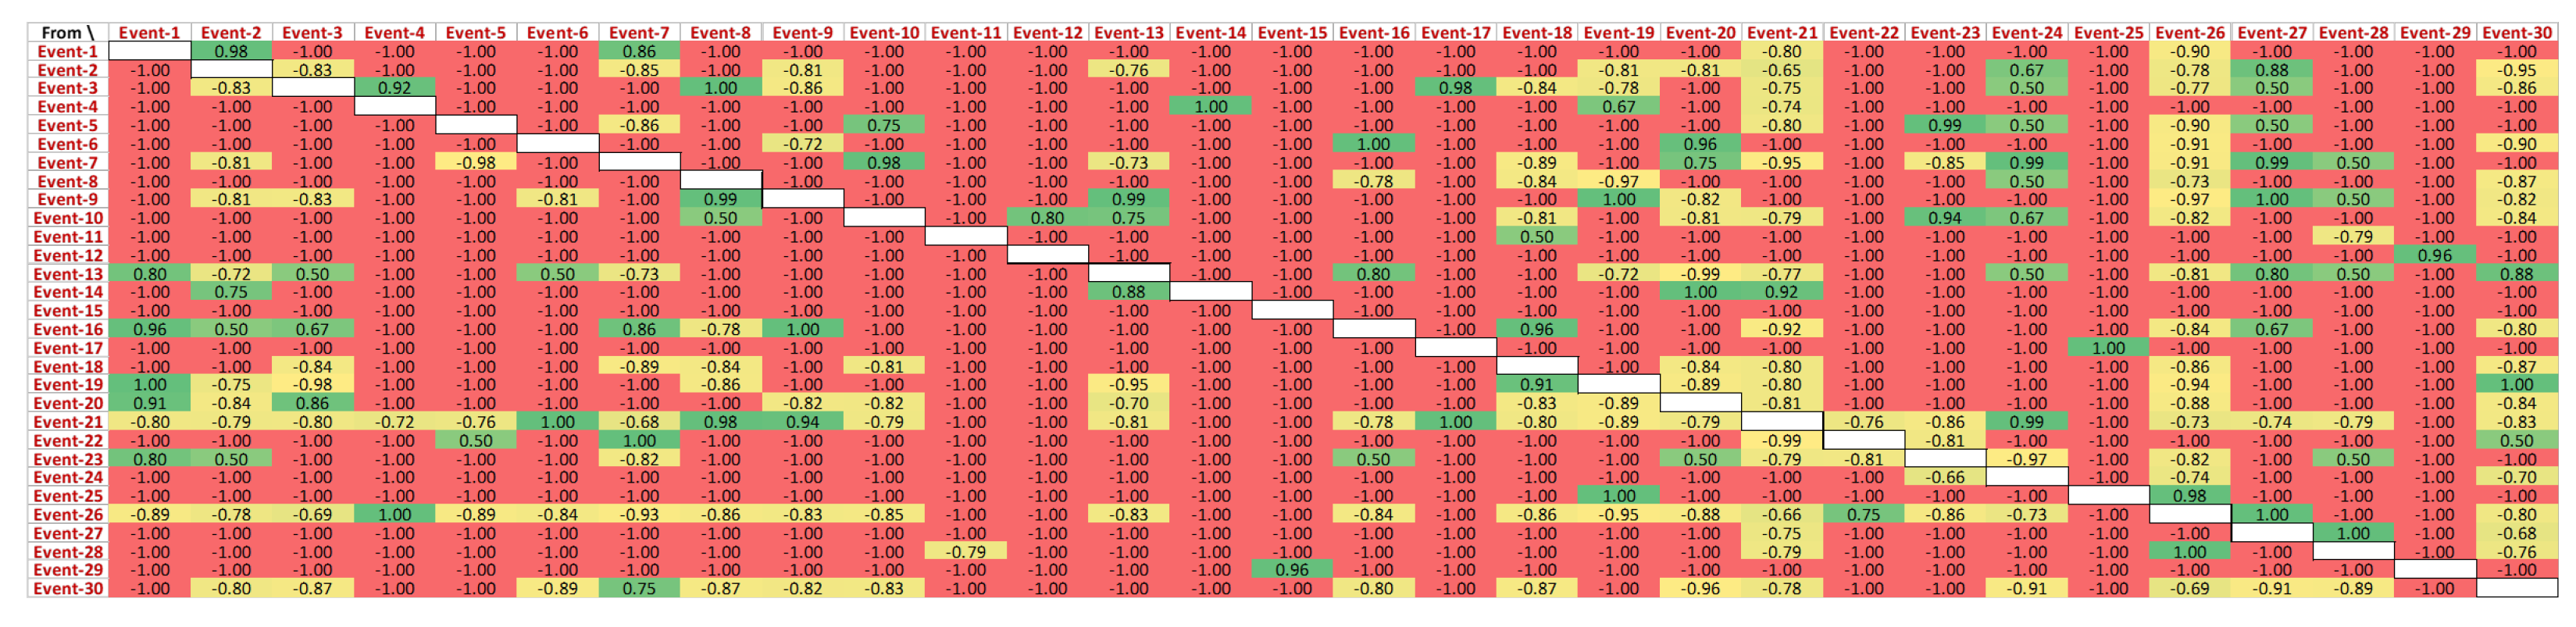
Figure 11 presents the behaviour of events directly following each other in the successful cases. The exhaustive list of unique events in the CDP process log is shown in
Figure 11.
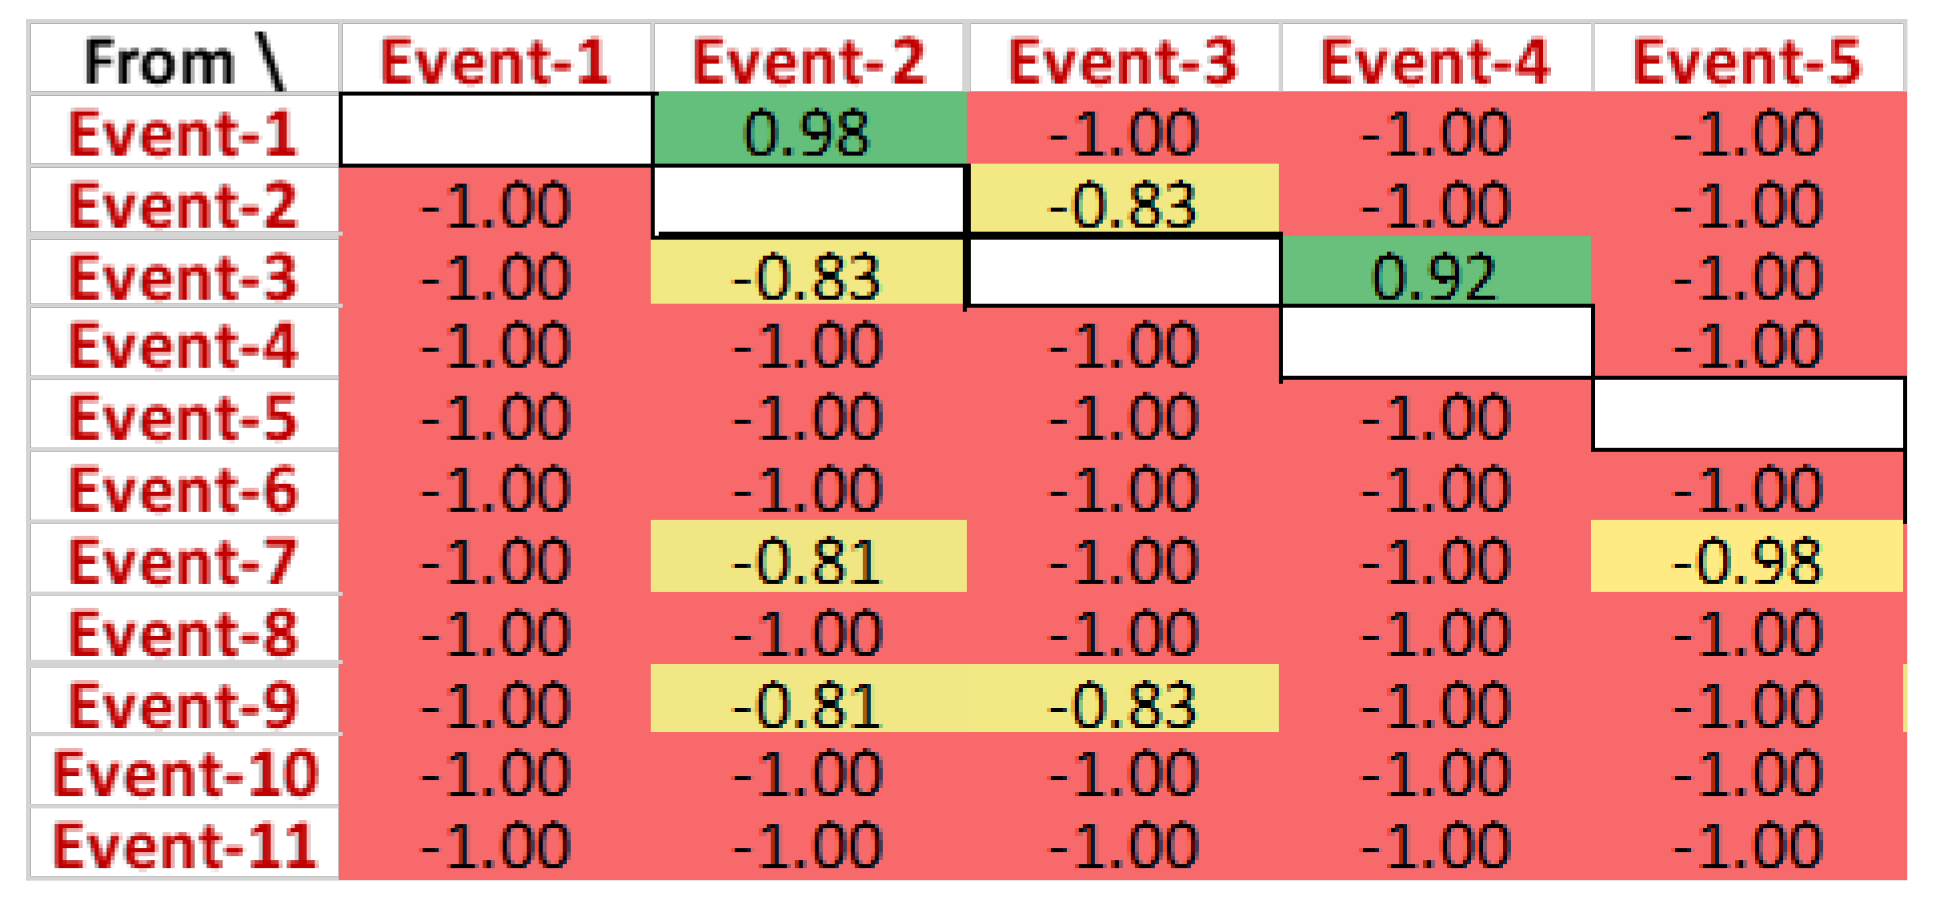
A closer view of this causality matrix is shown in
Figure 12, yet the actual IDs of the events are abstracted due to data protection purposes. It can be observed that ‘Event-1’ directly follows ‘Event-2’ for 98% of the cases. Additionally, ‘Event-1’ is never followed by any of the events in the log. ‘Event-7’ never follows ‘Event-1’, while ‘Event-1’ followed ‘Event-7’ for 81% of the cases in the event log. Like ‘Event-6’, some events do not have any preceding events.
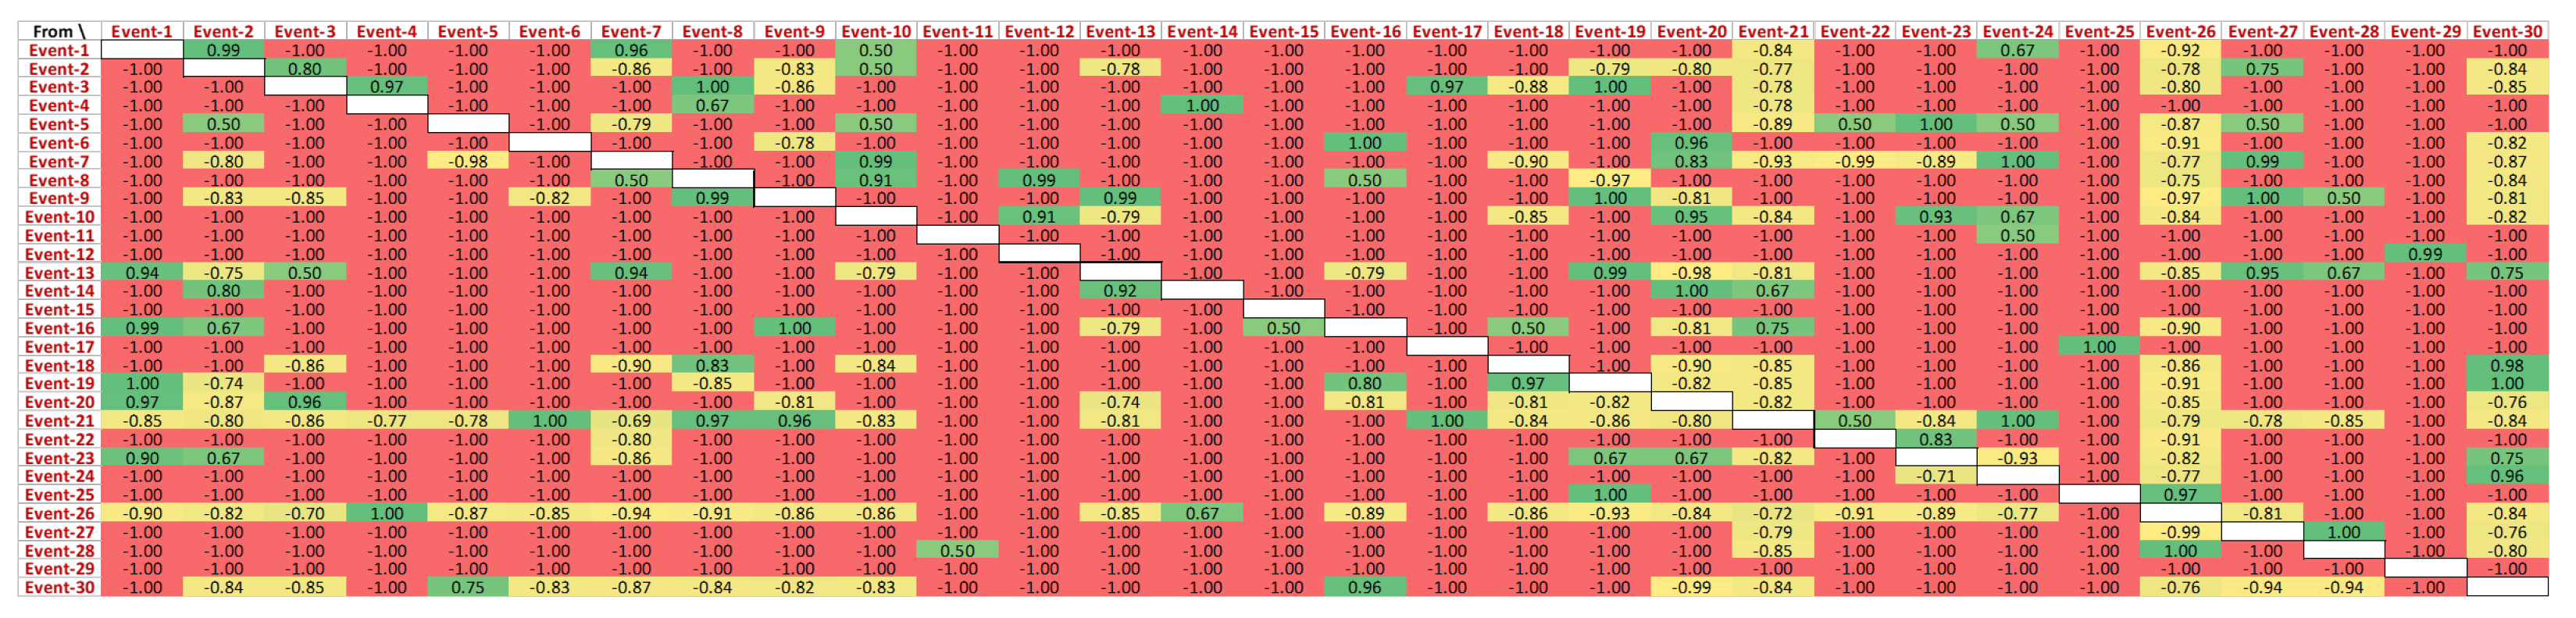
Similarly, the behaviour of events in the failure cases is presented in
Figure 13. Cases in the CDP log labelled as ‘failed’ are used to construct this causality matrix.
Figure 13 clearly indicates that the behaviour of events in unsuccessful situations is not comparable to that in successful cases. For instance, ‘Event-13’ follows ‘Event-1’ for 94% of cases. This is opposed to the behaviour observed in successful cases, where there was no direct predecessor of ‘Event-1’. Additionally, there is a very weak correlation between ‘Event-26’ and ‘Event-6’.
6.3. Difference between Causality Matrices
This section presents the distinction between instances that are referred to as successful and instances that are referred to as failed.
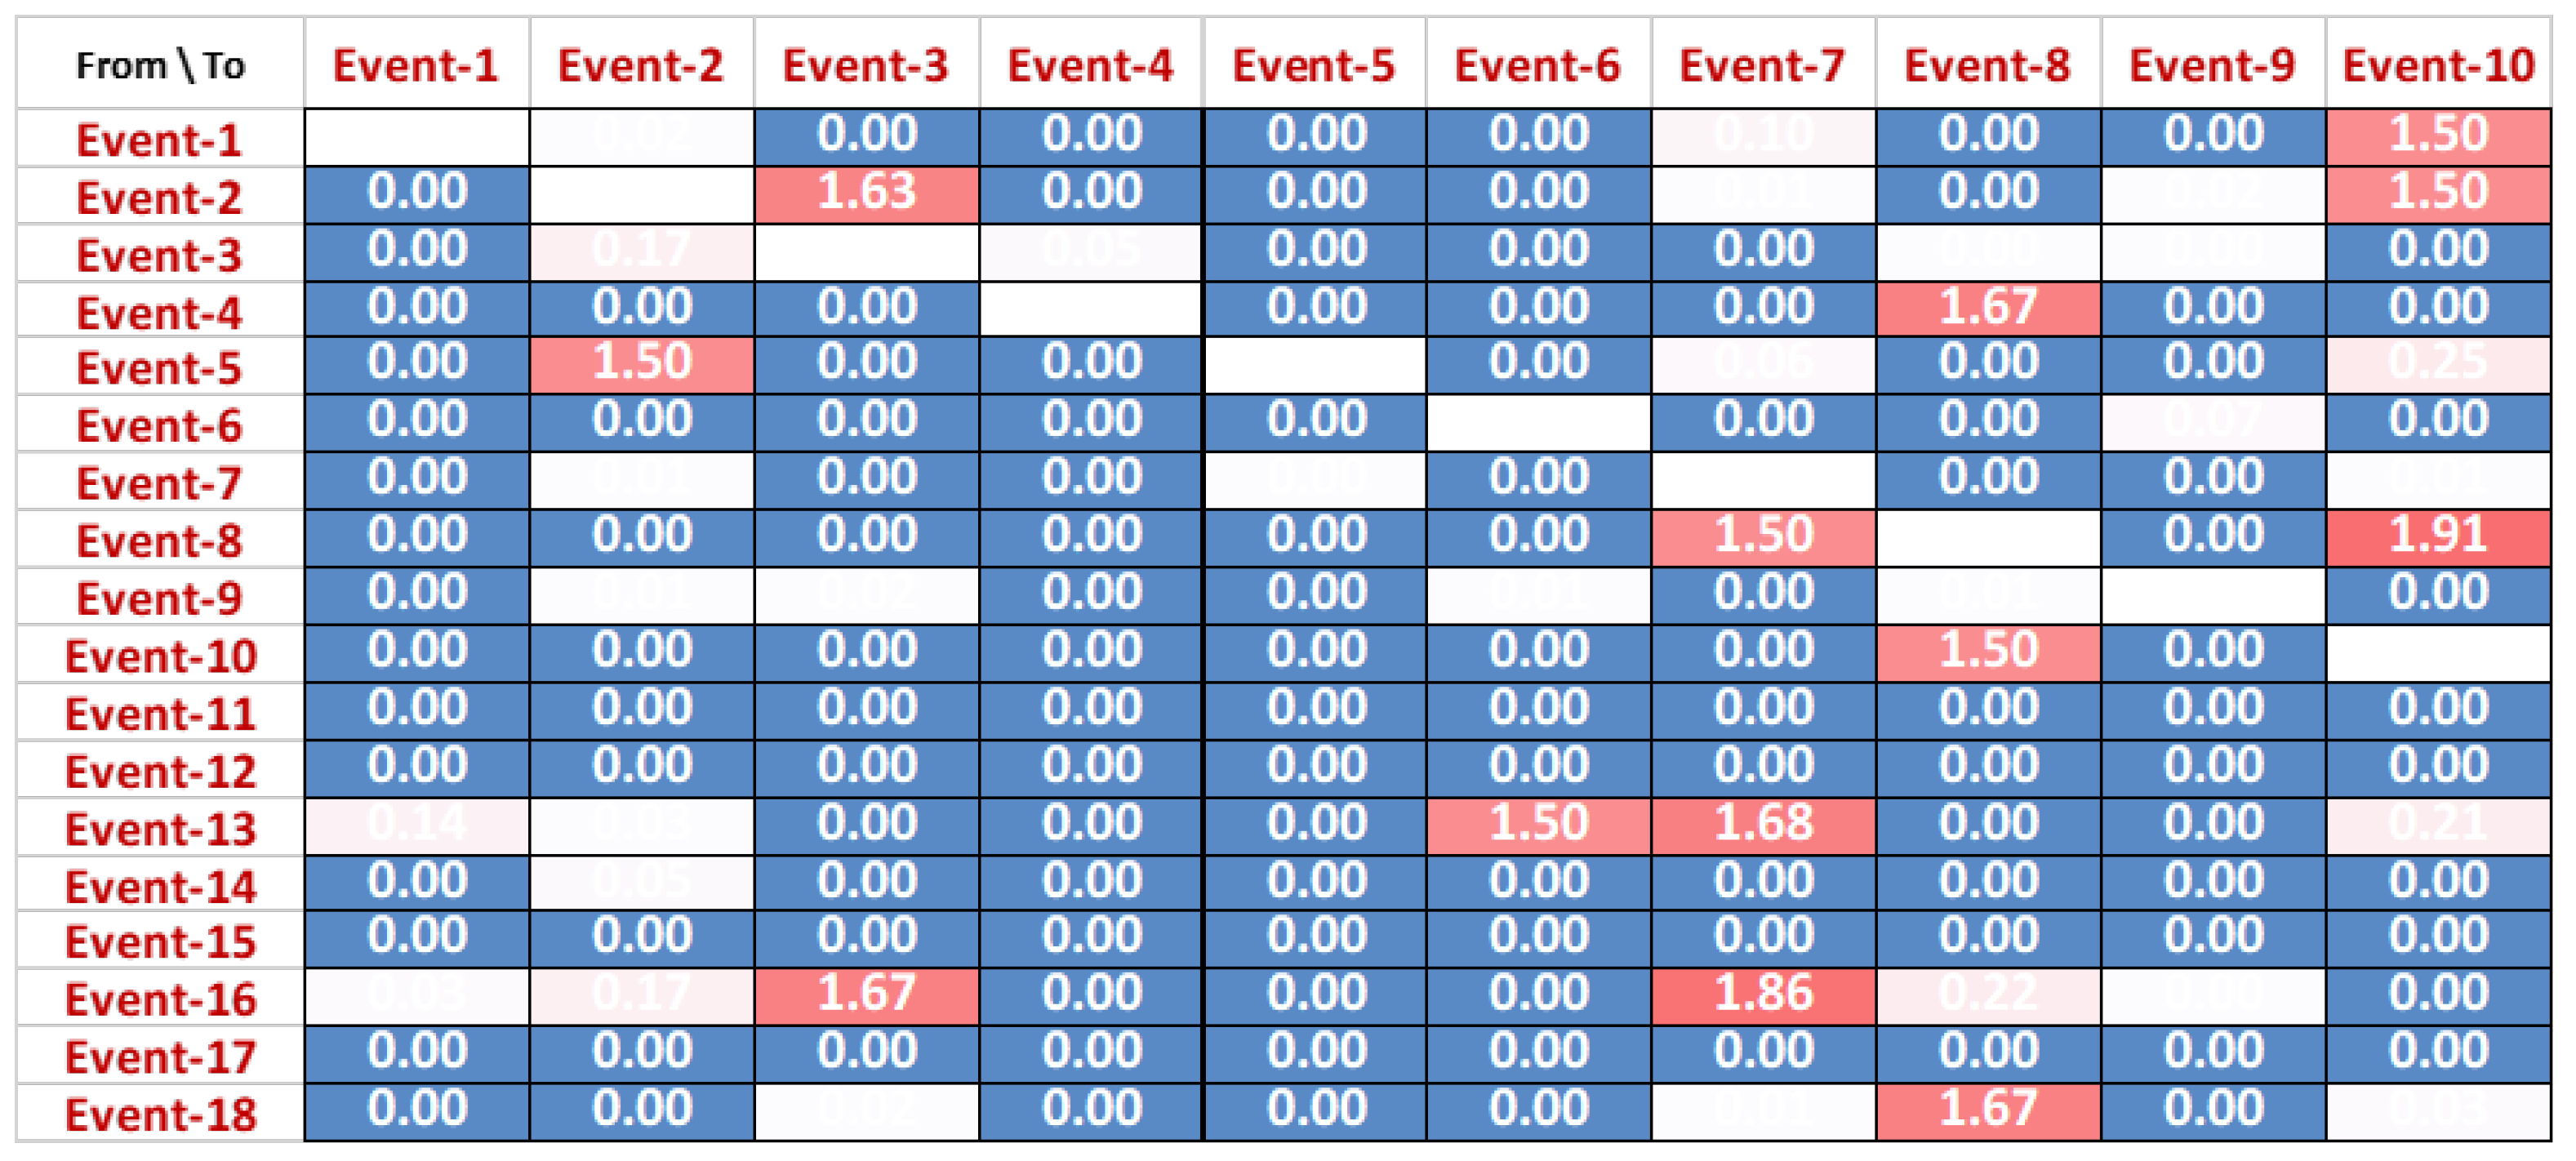
Figure 14 shows the difference between the direct relationships of both successful
Figure 11 and unsuccessful cases
Figure 13. Values in
Figure 14 are calculated as a difference between causality scores in both matrices of successful and failed instances. Details of the scores in
Figure 14 are as follows:
A value of score 0 shows that there is no difference in sequence for the corresponding activities. These values are represented as dark blue in the matrix.
A value of score 2 presents the maximum difference between corresponding actives in successful and unsuccessful matrices. This means that there exists a totally opposite behaviour of events to each other such that, if relation in one class of instances, its exists in the other class.
Values between 0.01 and 1.99 are represented with different shades of blue to red, dependent upon the scores. Higher scores show a greater difference in the causality of the corresponding events, and vice versa.
The dark blue colour presents that there is no difference between the direct relationship of events, whereas the colour ranging from white to red shows the difference in the causal relation ranging between 0.01 and 1.99. For instance, a dissimilarity of 1.99 is observed between ‘Event-8’ and ‘Event-12’. The reason for this divergence is that the former event never directly followed the later event in any of the successful cases but always followed in the failed cases.
Although causality analysis provides a difference in directly followed relationships between two variants of cases, there are still several limitations. First, to compare two causality matrices belonging to different categories of instances (successful and failed), it is essential that both matrices are of equal size. It means that the same number of event classes should be there in both types of instances. This is very rare in a business process environment as one set of cases may have fewer or more event classes than another. The next two sections present techniques to interpret such complex event data.
6.4. Trace-Level Alignment for Abnormality Detection
In this section, trace-level alignment details are used to measure the variation between the optimal process model and the replay of the event log with the failed cases (
Section 6). Control flow-based approaches, like the one in
Section 6.2, usually do not look at the timestamps of the events or other event properties that are usually found in real-world logs. All of the properties of events in the log are important for a thorough process mining analysis. One such aspect of the analysis is observing the ‘overall behaviour’ of the complete trace, which is discussed in this section.
At the trace level, several types of deviations are possible from an optimal process, as presented by Van der Aalst in [
6]. The trace-level analysis is performed on following characteristics:
- (i)
Model move: an activity that should have occurred in accordance with the ideal process model but is not recorded in the log.
- (ii)
Log move: an event which is present in the log but cannot be mapped to any activity in the process model, incorrect data: data which are there in the log but not possible to map with a process model,
- (iii)
Missing data: refers to some missing data in the log.
Separate cost functions can be specified for each type of deviation identified because of the conformance analysis. The default value of
cost function is used, which is 1 for all type of deviations [
25]. A screenshot of the ProM plug-in ‘Multi-perspective Conformance Analysis’ for alignment calculation is shown in
Figure 15.
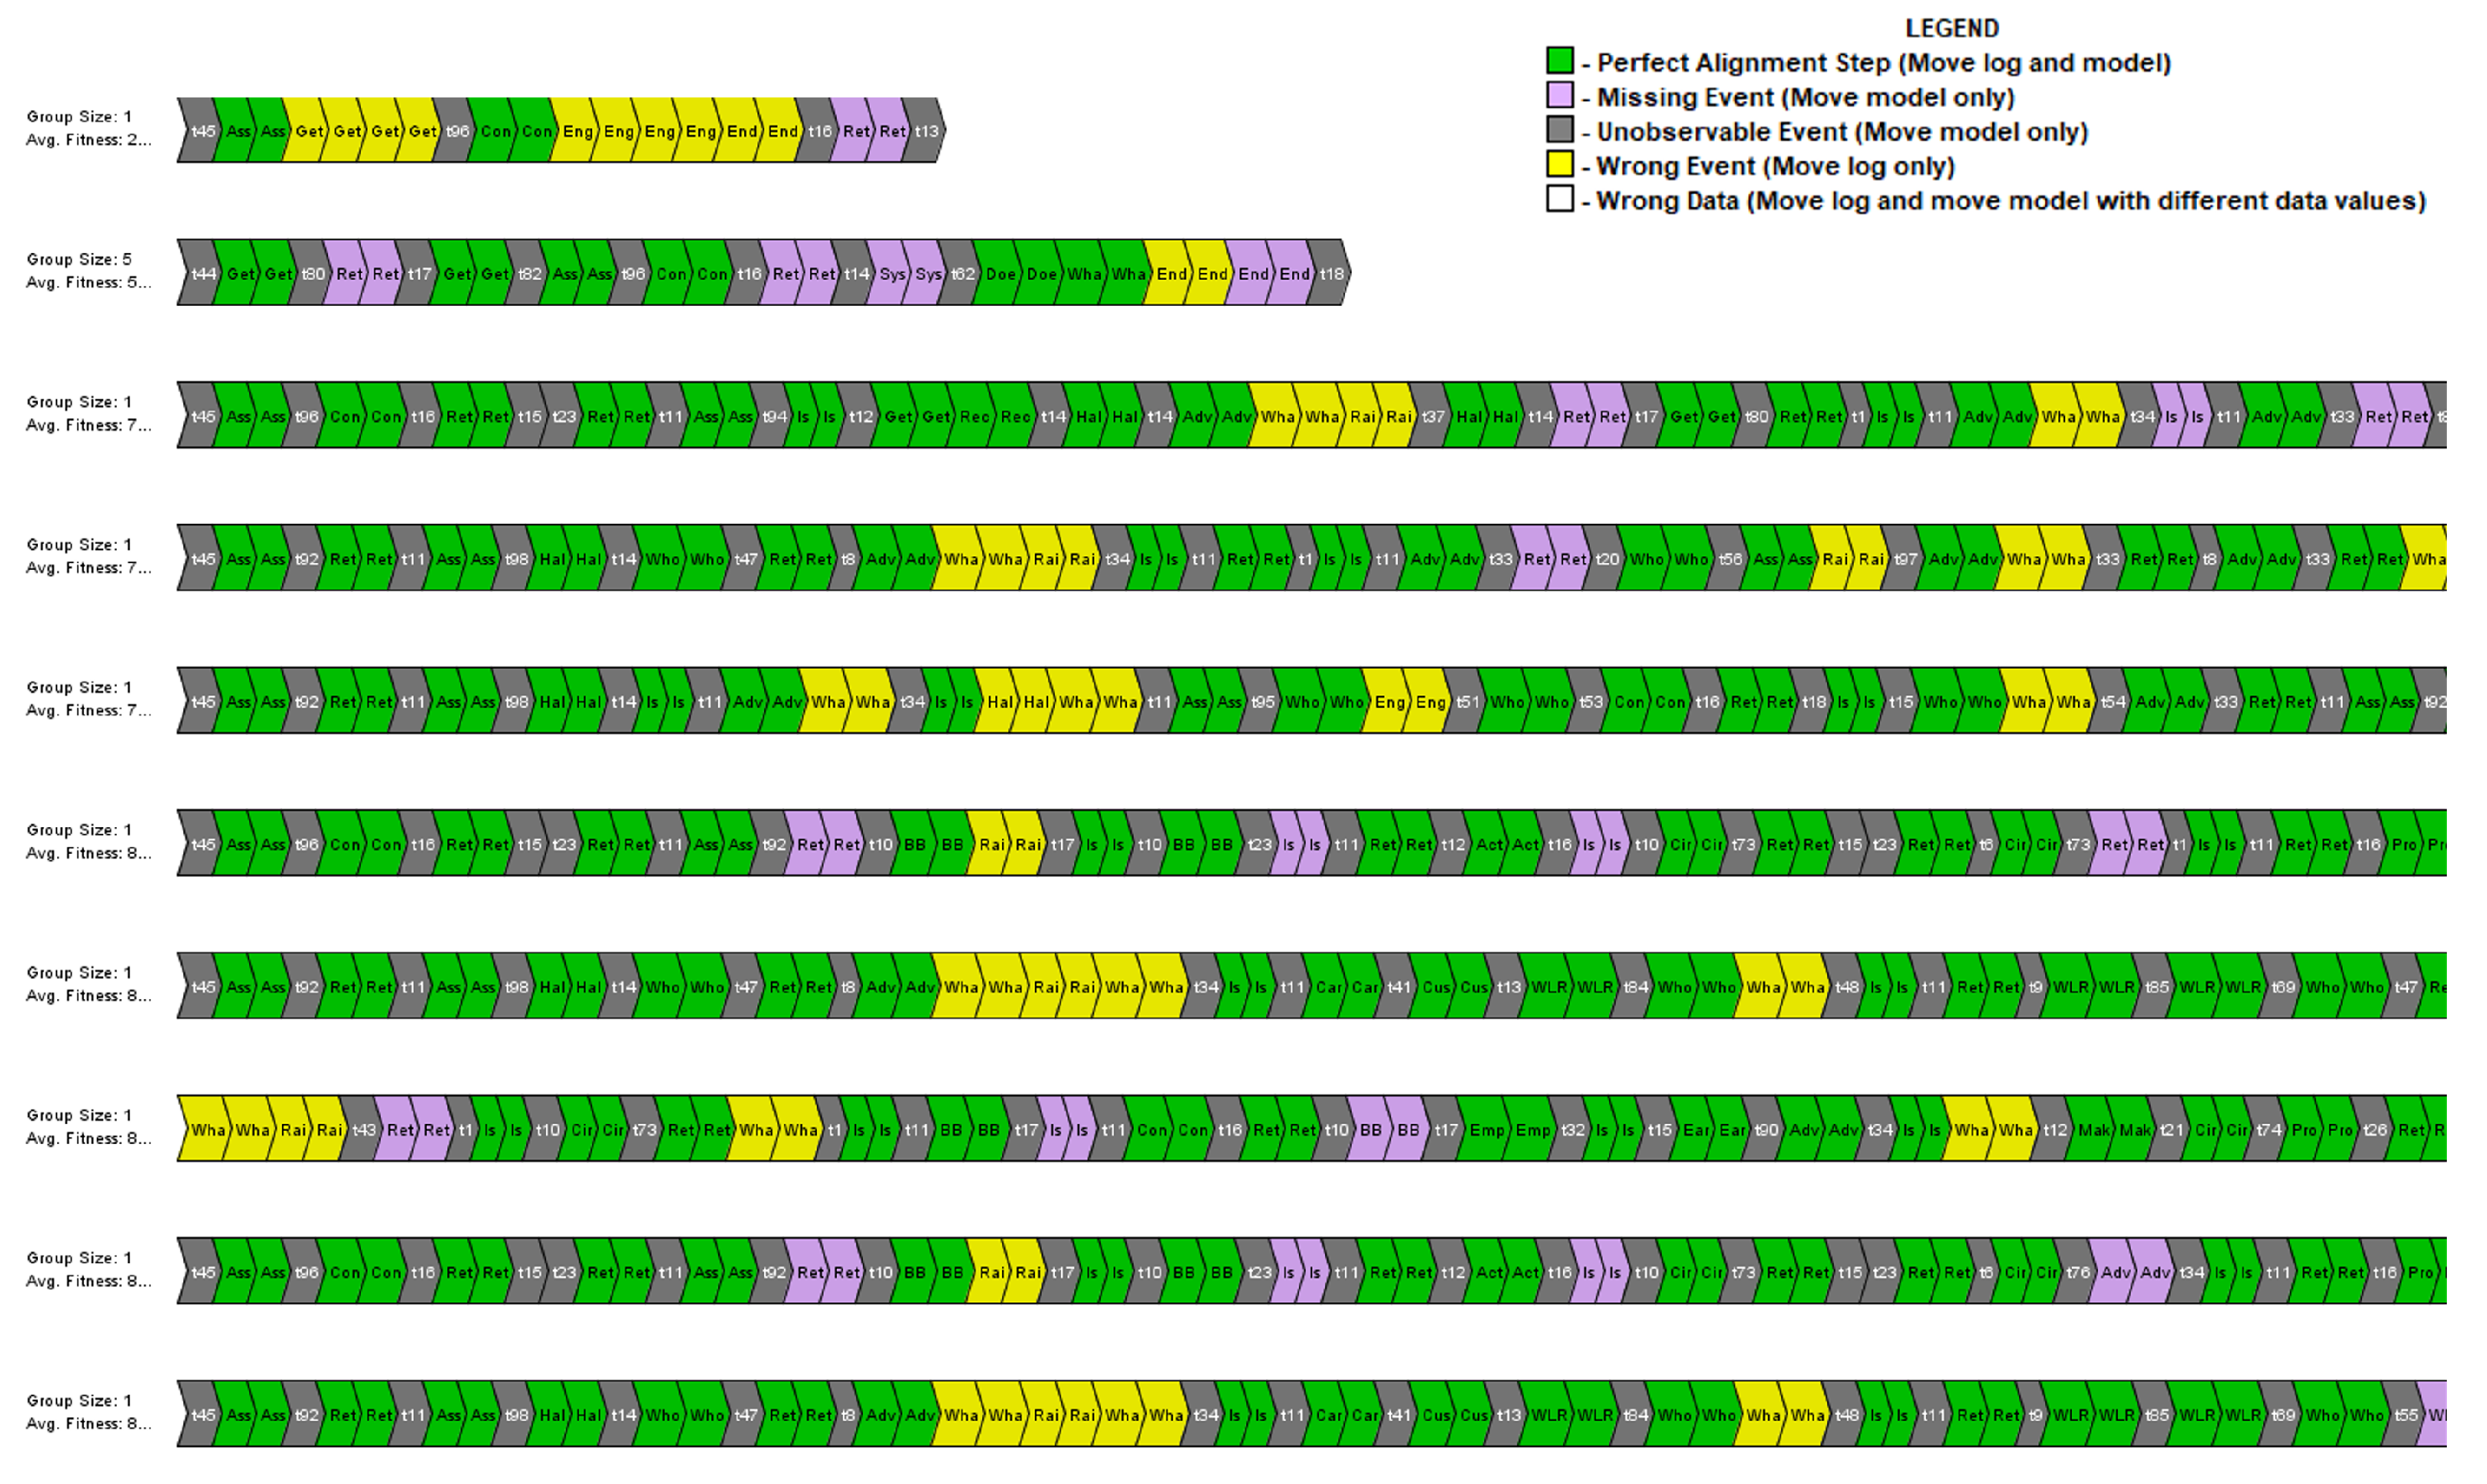
For each of the traces which are part of the event log with failed cases, the corresponding alignment is calculated over the Petri net discovered for the successful cases. In
Figure 15, a coloured view of the log presents the alignment checking results generated through the ProM 6.10 tool. Each row represents a group of an end-to-end execution of similarly executed traces with events classes highlighted with a specific colour. The green colour represents the exact alignment of the event with the optimal process model, whereas log moves and model moves are highlighted with yellow and purple. Model moves (grey and purple) identify those events present in the log with successful cases; thus, this behaviour is replicated in the optimal process model.
There may be several reasons for missing events in the log with failed cases, such as failed cases miss those essential events which must be present in the instance for successful execution. The start of the process is generally misaligned as the model is expected to have a starting point with an event ‘Asset selection’, but failed instances (highlighted as grey in
Figure 15) are skipping the starting event. This information may not always be helpful to consider such behaviour as an abnormality as the process starting point for failed cases could deliberately be different. Yet this information is useful for further in-depth analysis of each specific case. Similarly, model moves (highlighted as yellow in
Figure 15) are explicitly such events that are present in the failed cases but never observed in the successful log. These events could be the most important to analyse as they could lead to the failure of the process. Detailed analysis of the trace alignment is presented with several other matrices for the conformance in
Table 4.
Three different subsets of real-world logs captured at different timings, including successful and failed cases, are used for detailed experiments. Each log is mentioned in
Table 4 as A, B, C. For each of the logs, an optimal process model is generated, and failed cases are used to analyse the conformance. In
Table 4, ‘A’ presents the results from the log containing cases for customers with a mixture of BT product services. The average fitness of the model is very high in successful cases, which is around 9% improved than the failed cases. This difference is a direct repercussion of the behaviour which is present in the failed cases. Fitness is computed against the alignment between the optimal process model and failed cases.
The change in fitness results from the deviations that caused the nonconformity in the failed cases. Degradation in fitness directly relates to the event violations, rising from 2.3% to 11% in the failed cases. Event violations represent those events that are present in the failed cases but have not been able to be replayed using a process model constructed by the successful cases. It is clear that the presence of misalignments in the failed cases has increased the number of wrong events (the events which are not in the log but expected according to the model) from 36 to 762 and the number of missing events (the events which are in the log but not expected according to the model) from 150 to 220.
A similar trend is observed in
Table 4 for B and C event logs. In B, the model’s fitness replayed with failed cases showing a decrease from 90% to 88.8%, and % event violations increase from 5.9% to 8.8%. More obvious degradation in the process model’s quality is observed when the third event log is analysed. With average fitness decreasing to around 17%, the highest difference of wrong events is observed with the increase from 264 to 960 events.
6.5. Event-Level Alignment for Abnormality Detection
There is a noticeable difference in the control flow and alignment of the successful and failed cases. As a business user, this information is helpful, but it does not incorporate the exact details of the abnormalities in the execution, which causes the process to be unsuccessful.
To locate the exact position in the process where abnormality exists, the ‘multi-perspective process explorer’ is used as mentioned in [
25]. This plugin for ProM is developed to get insights into the process instances by measuring fitness and precision at each event level. One of the ways to find abnormalities in the overall process execution can be to look at the difference in event-level behaviour between the cases with anomalies (failed cases) and correctly executed cases (successful cases). The techniques presented in [
25] are exploited in this work for the identification of the deviations at the event level from the optimal process model. For instance, consider
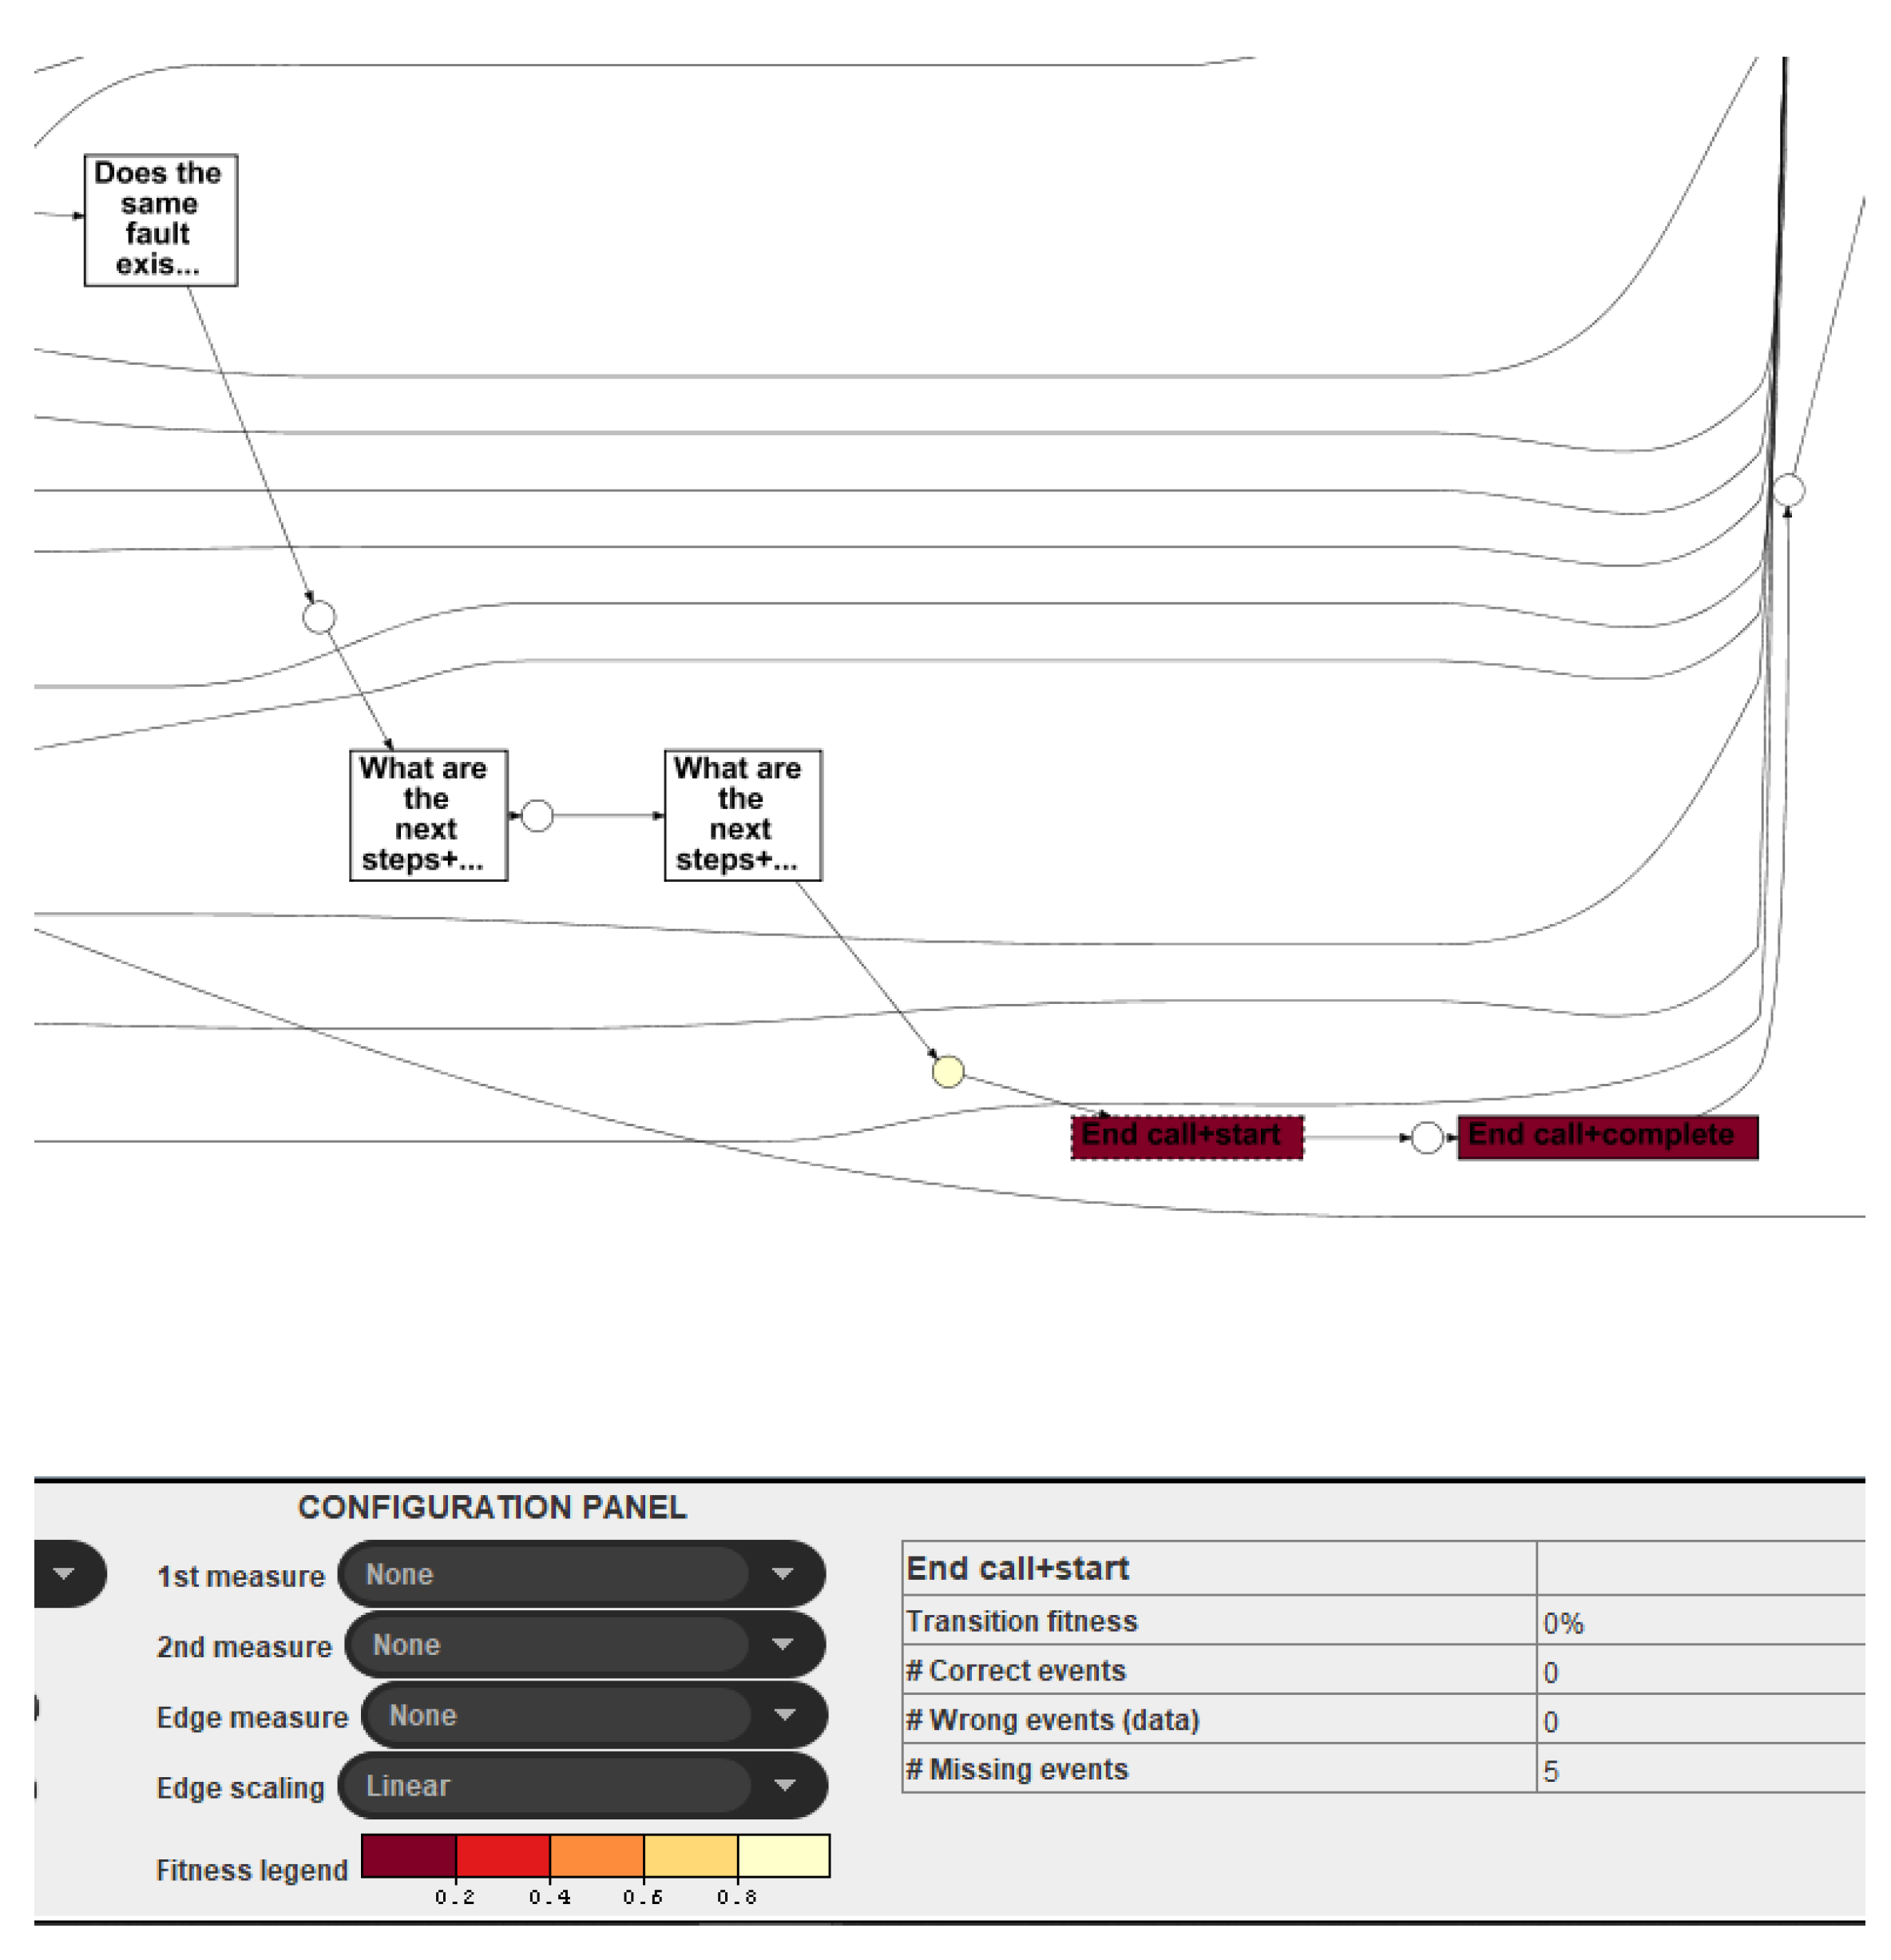
Figure 16 showing the identified events (with life-cycle transition) in red.
An event ‘End Call’ is a part of an optimal process model, but its transaction fitness is 0%, which means that no instance of the failed event log traversed this portion of the model. This information is useful when considering deep investigation for the abnormality analysis.
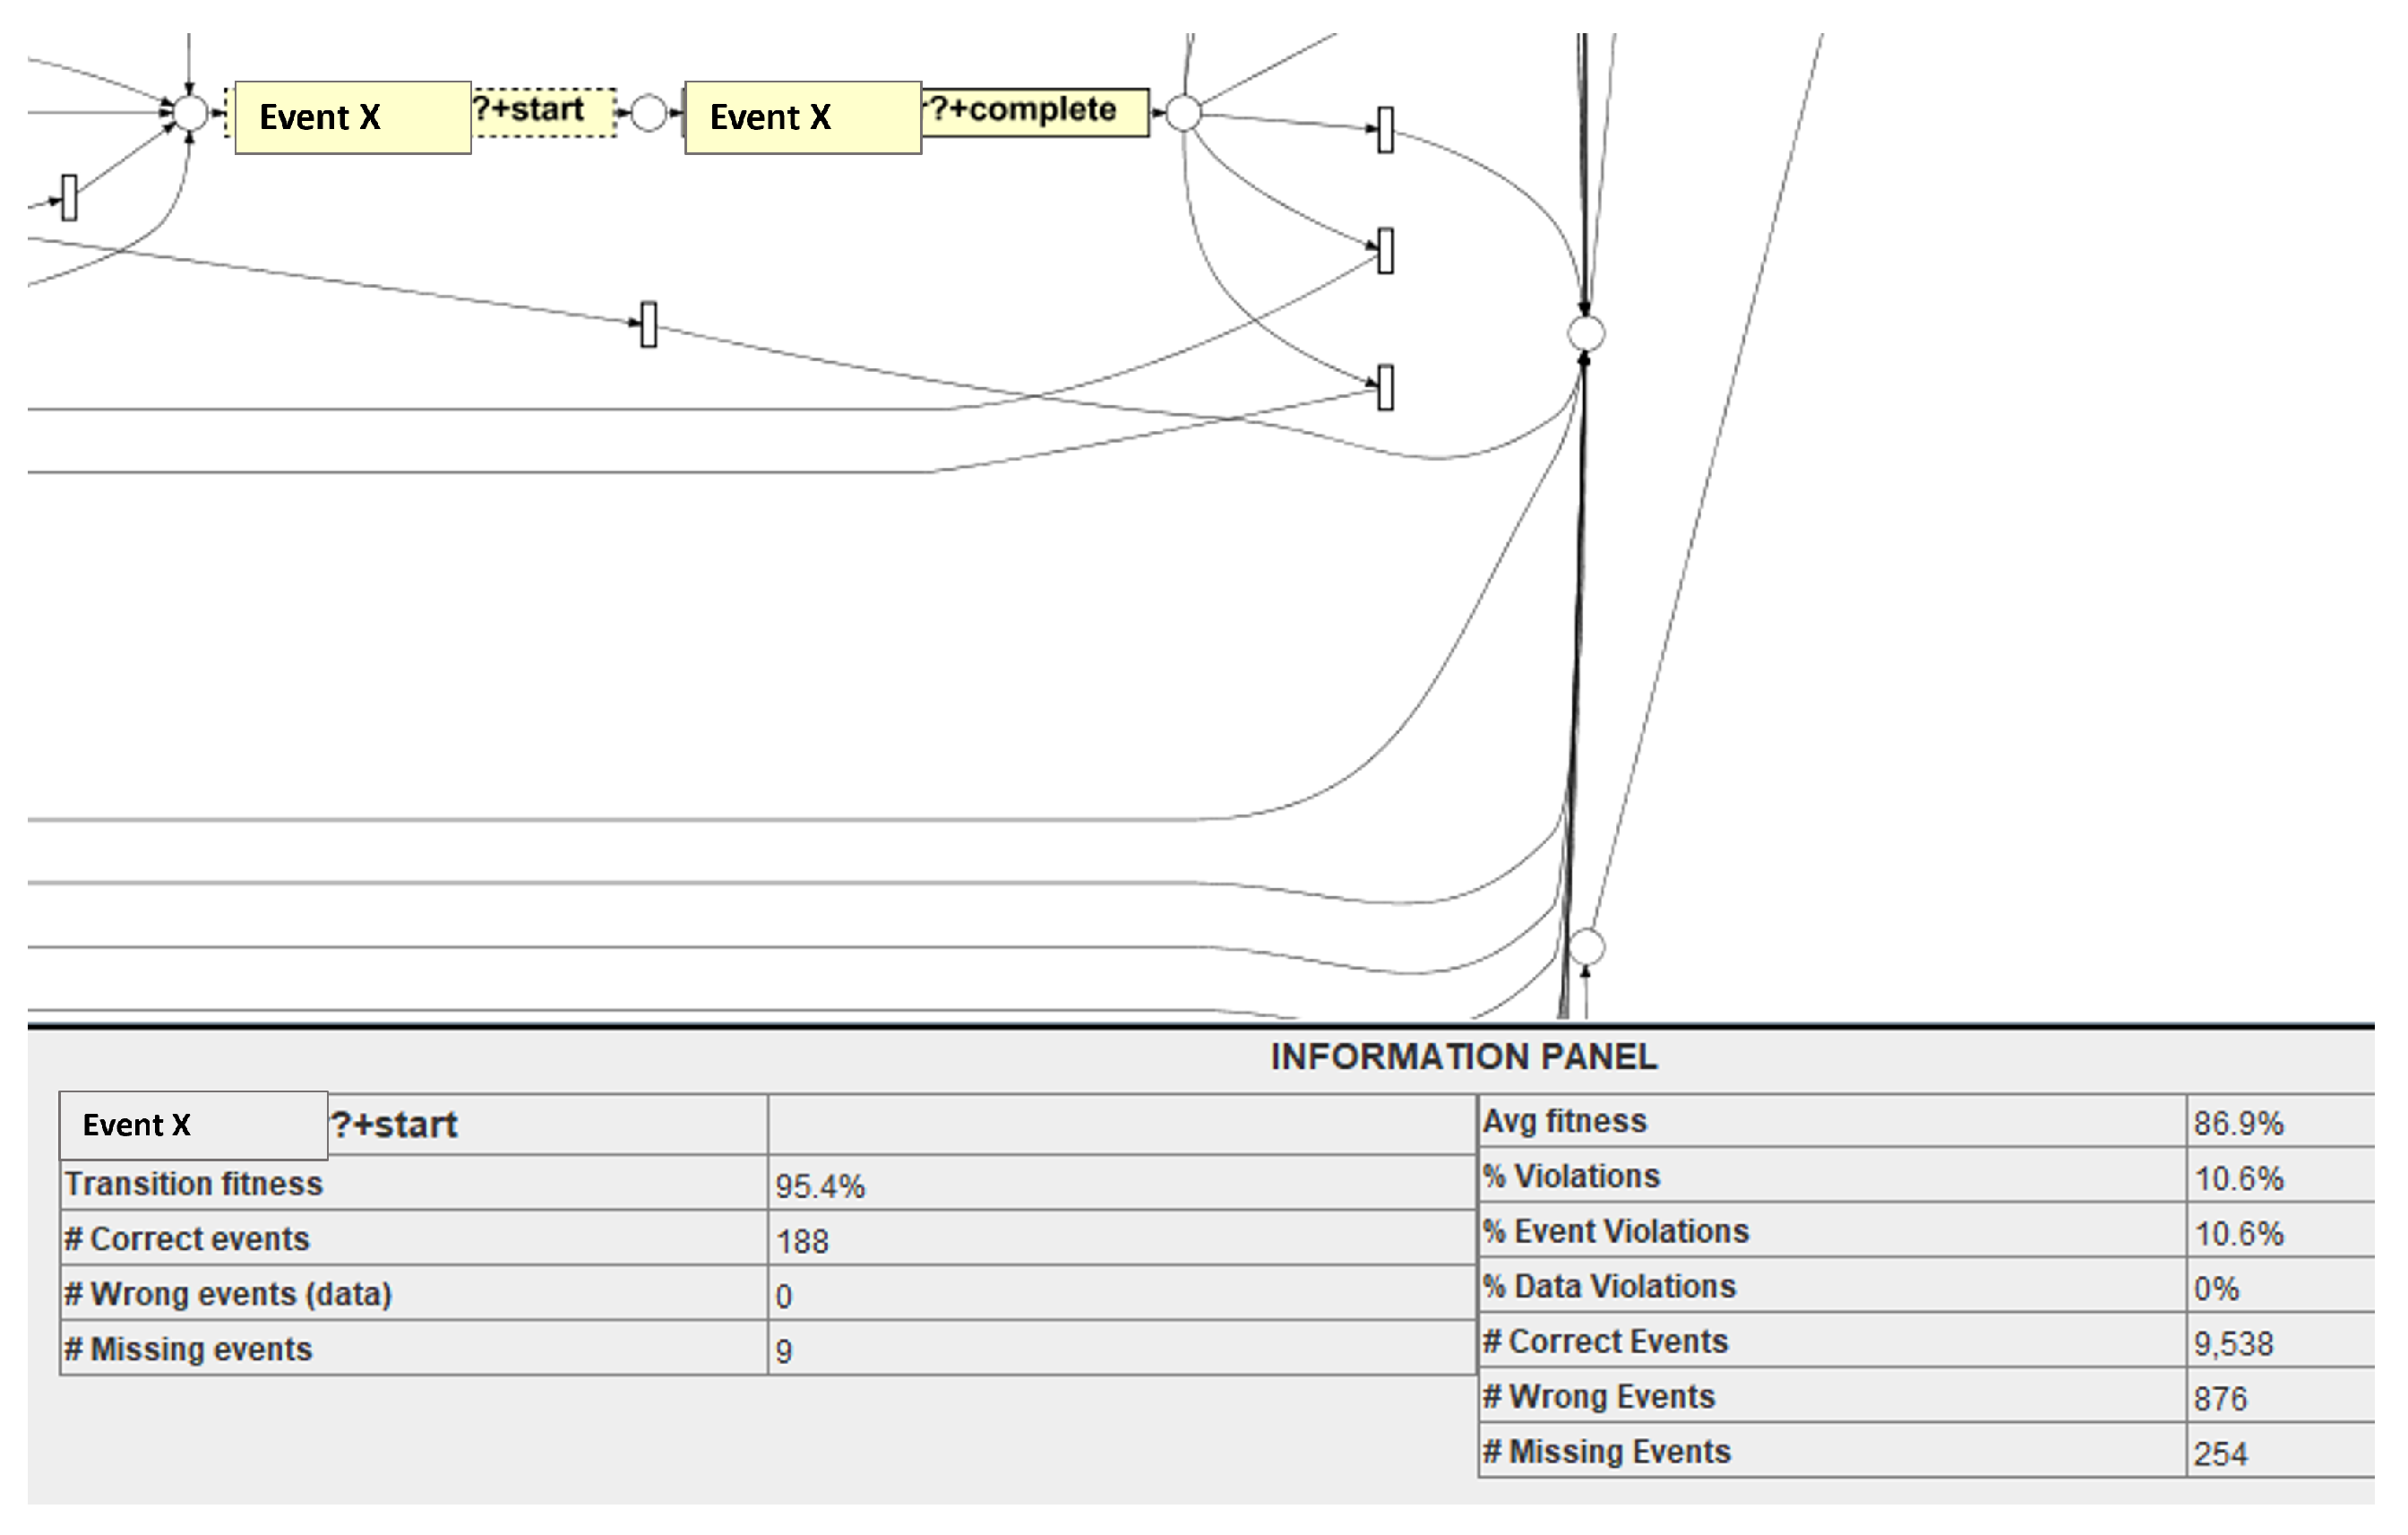
It is possible to analyse the event level fitness of the process model, highlighting the impact of the alignment of failed event log on the optimal model. In
Figure 17, another event, ‘Event-X’, is reviewed where the transition fitness is 95.45%, with 188 correct events (the events which are present in the log and expected from the model). 5.5% fitness decreases (in
Figure 17) at this transition resulted due to 9 missing events. IDs of the missing events can be extracted from the ProM plug-in ‘multi-perspective process explorer’. This analysis is helpful for business users to identify several missed events at the level of each transaction. Further assessing those cases where there are nine missing events, a behaviour can be observed, leading to the failure of the cases. Another level of analysis is place-level analysis where the fitness is measured at the places in the Petri net model where transition fitness is less than the average fitness of the overall event log.
In CDP, the average fitness of the log is 96.4, as shown in
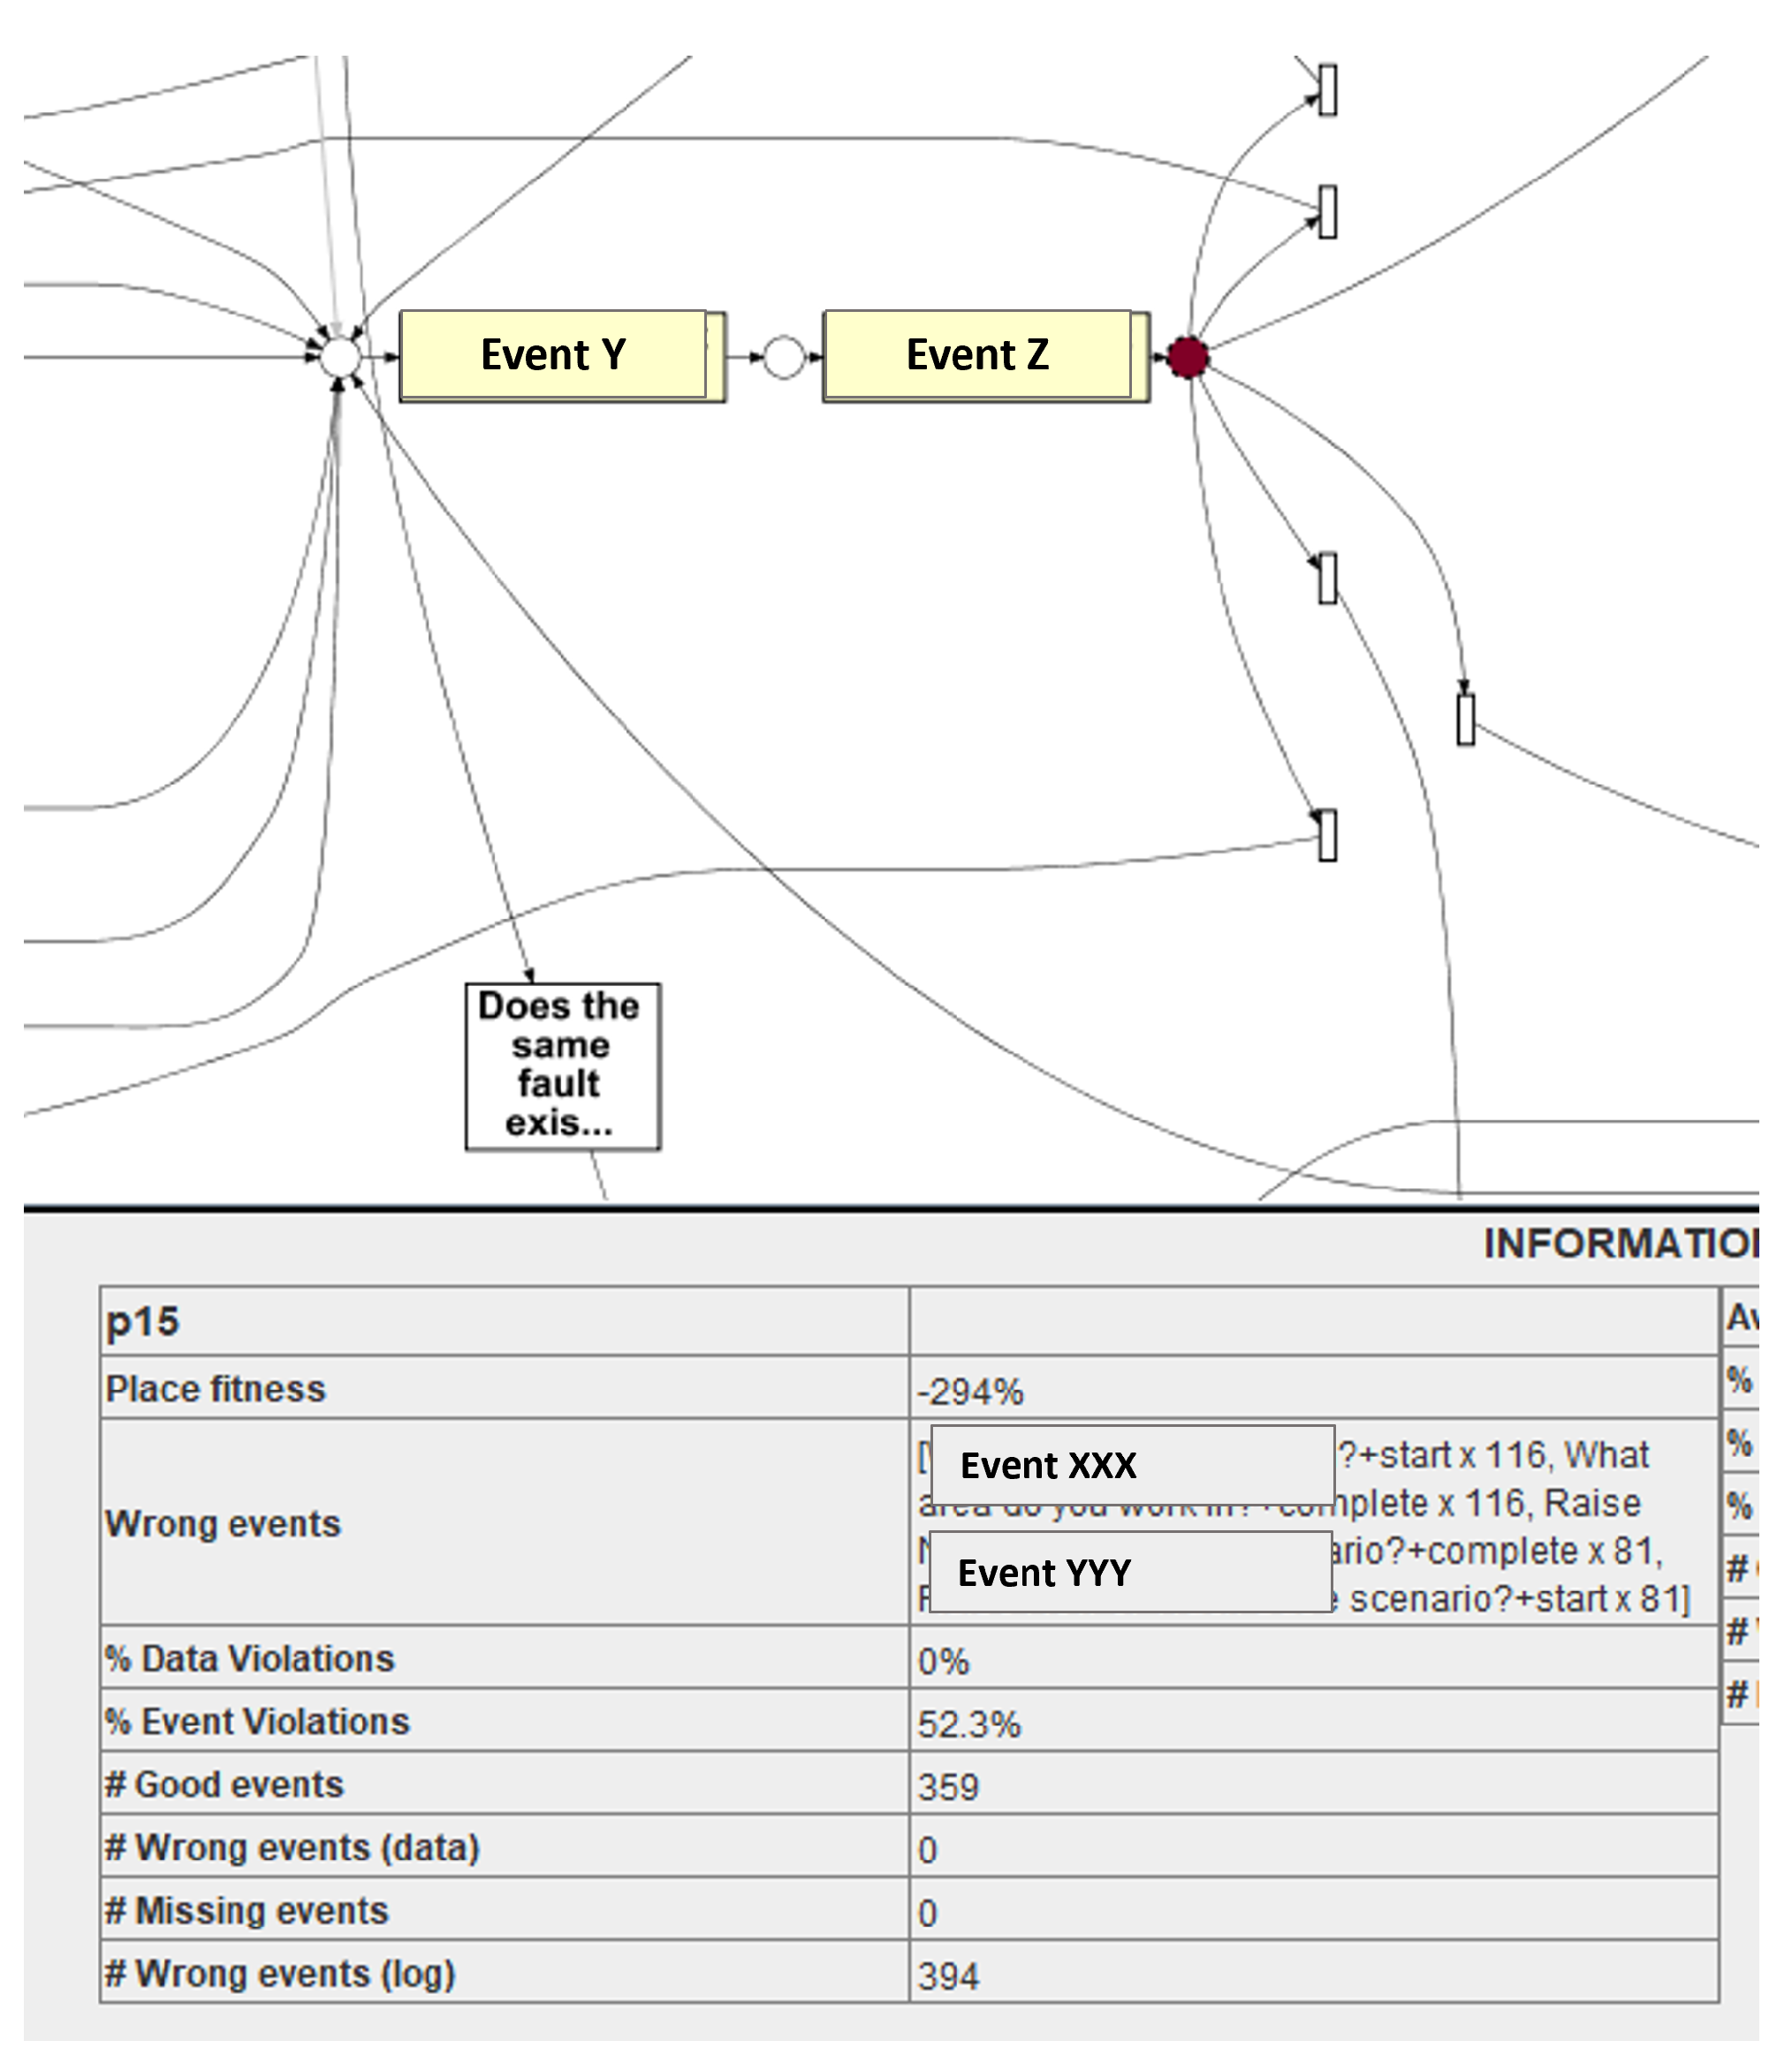
Table 4. The next step is to further explore all of the event classes where event-level fitness is less than 96.4. In
Figure 18, an event class ‘Event-Y’ has a place fitness of 94.3%, thus place level analysis is performed. It is identified that at place p15, the event violation is 52.3%. This means that for each 52 out of 100 cases, misalignment is observed. A total of 394 wrong events are identified at p15, and details of these wrong events are also determined to be presented to the business users. At p15, the event ‘XXX’ is observed 232 times and ‘YYY’ is monitored 162 times. A behavioural deviation in failed cases, along with the information about its placement, is essential for business users to rectify of these deviations.
7. Conformance Lifeline
As seen in an earlier section, the fitness of the unsuccessful cases varies from the fitness of successful cases, showing that there is a behaviour change in the control flow of the failed cases. When this change is checked at several checkpoints during the process execution, a fitness score line is projected, which can be further analysed to provide root cause analysis in the next section.
This section presents the difference in fitness score between successful and failed cases as a conformance lifeline. The term ‘Conformance lifeline’ is adopted from healthcare where an electrocardiogram (ECG) is used as a test to check a patient’s heart’s rhythm and electrical activity.
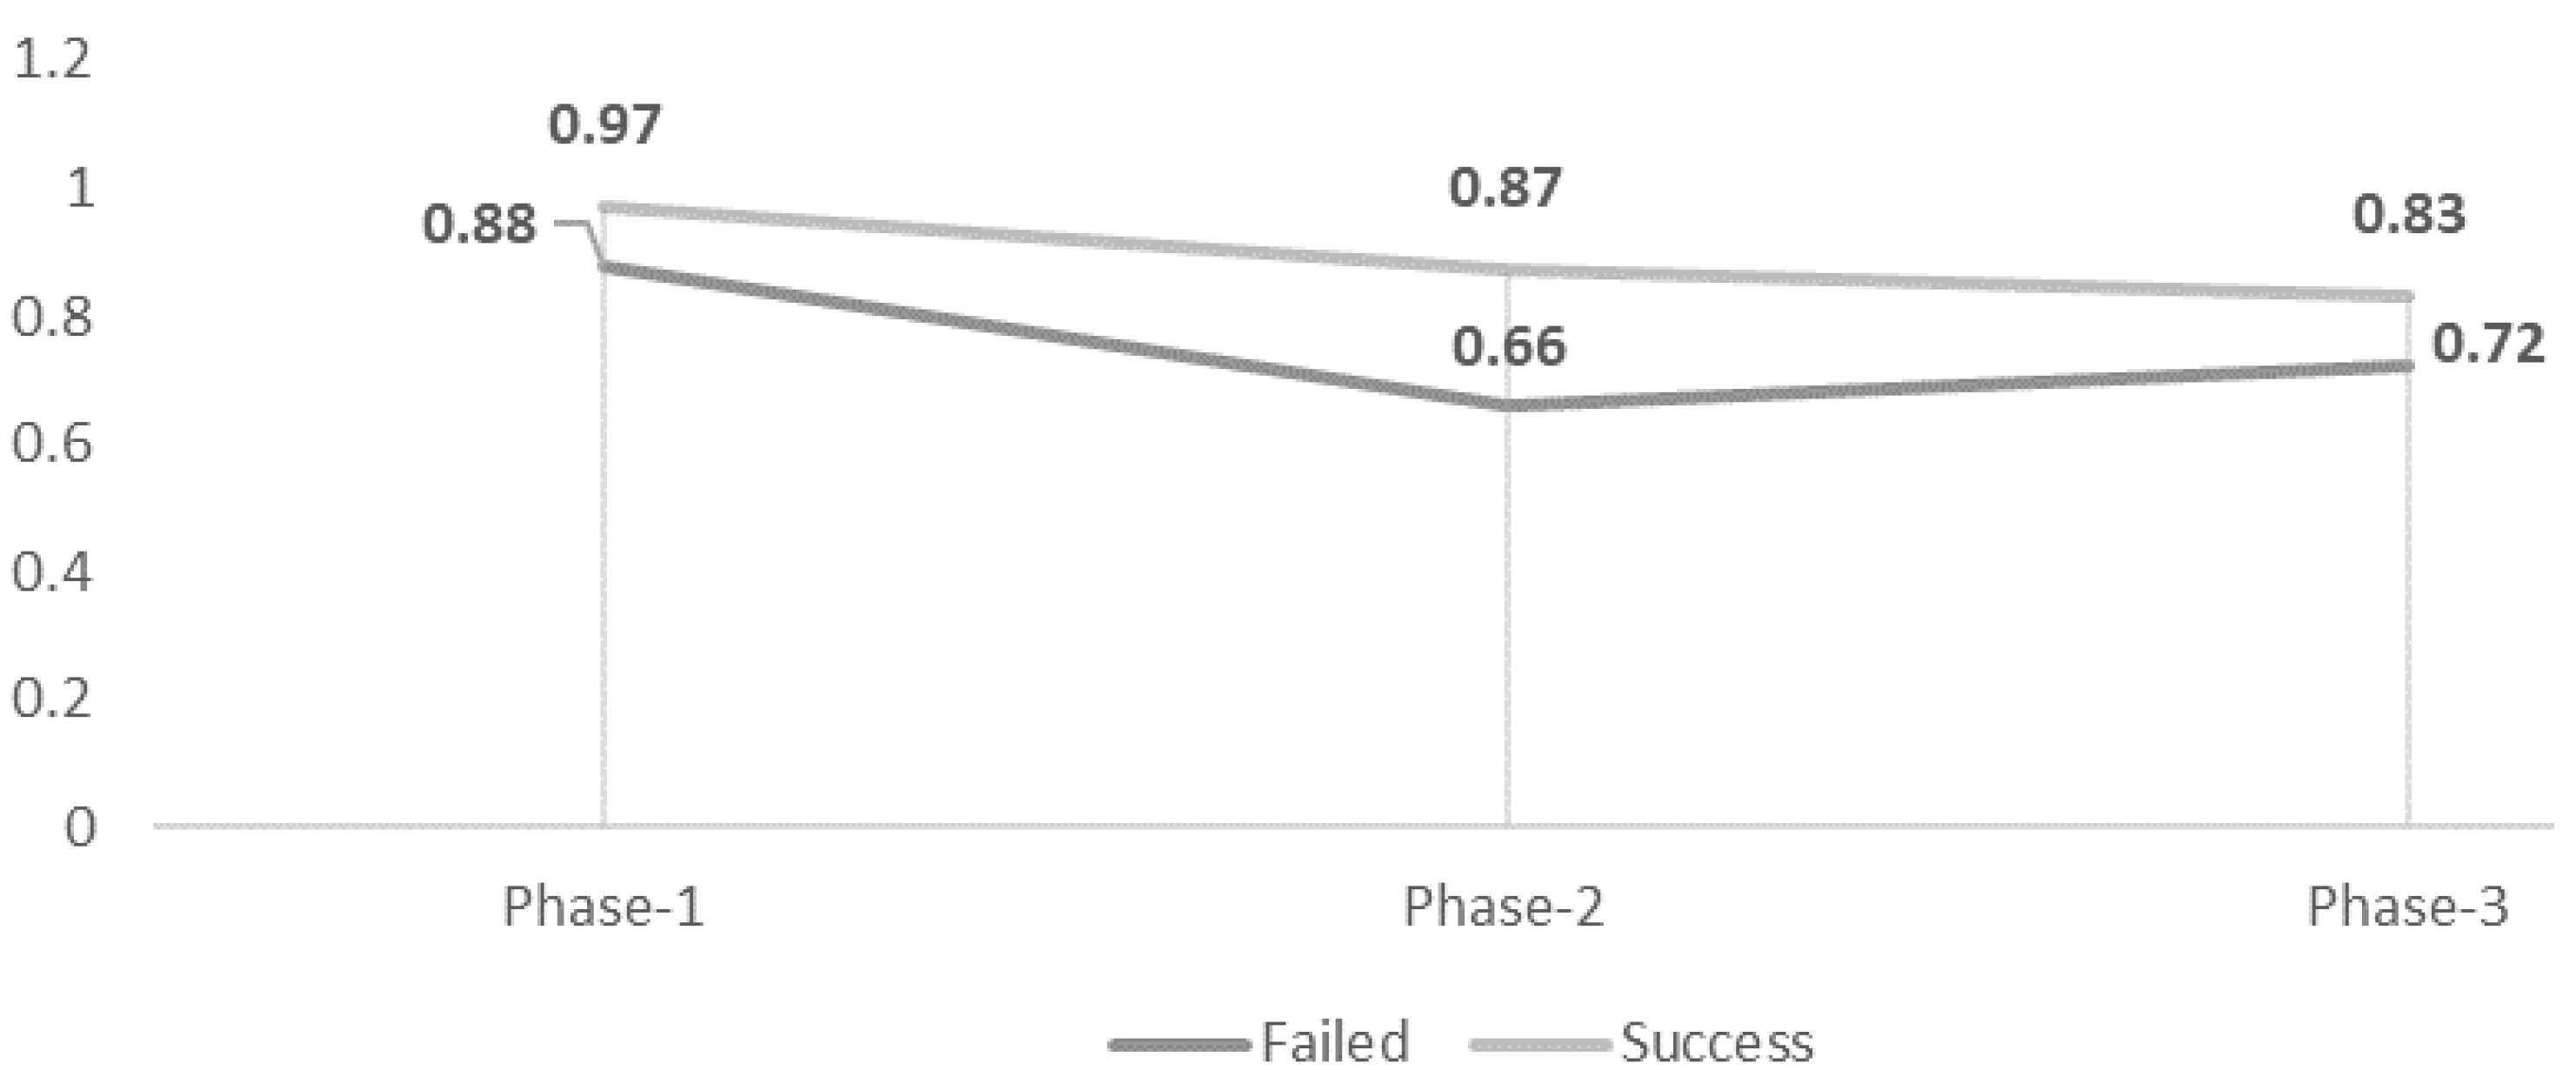
In
Figure 19, the average fitness scores of successful cases with the failed cases are compared for all the instances belonging to an individual sub log. It can be seen that there is an apparent difference between fitness scores for events at the very start of the process execution. Successful cases had a fitness score of 0.97 compared to 0.88 for the failed cases. This gap further opened up when the process was almost halfway completed. At 50% of the process execution, the overall fitness of the failed cases had a steep degradation. The average fitness score of the failed cases is around 20% less than the score of successful cases. The fitness gap again shrinks back to around 10% near the end of the process. Successful cases present an average fitness score of 83% with a score of 72% for failed cases.
8. Conclusions
Process mining techniques enable organisations to gain insights into their processes through the use of event data collected during the execution of those processes. Process mining techniques are focused on three main areas, (i) process discovery, dealing with the discovery of the process models based on the behaviour of events, (ii) conformance analysis, identifying inconsistencies between actual process executions and behaviour of the process observed through the discovered process model, and (iii) process enhancement, establishing a feedback mechanism for the improvement of process model through learnings gained from the conformance analysis. Conformance analysis gives a 360-degree view of the retrieved event log for analysing anomalous business process behaviour. This paper presents novel techniques of conformance analysis for a deep dive analysis of the real-world complex business processes for service-oriented organisations. Individual fitness trends for process instances in the event log are examined for early detection of abnormalities in real-world business processes. The fitness trend enables failure forecasting as well as root cause investigation of issues that cause failure in a business process. Three conformance analysis techniques from the literature are used to find similarities and relevant discrepancies between simulated and observed behaviour in process logs. Using a real-world business process, the proposed framework and conformance techniques are validated. This work focuses on service-oriented business processes whose execution traces are challenging to mine. The results of ‘case-level’ and ‘event-level’ conformance testing are presented to illustrate the variances in patterns across various types of process instances. A conformance analysis solution is augmented with root cause analysis for abnormality prediction based on a decreasing fitness score. The concept of a ‘conformance lifeline’ is introduced for the early prediction of process instance execution anomalies. As the proposed techniques are based on historic event logs with a labelled outcome, yet in the future, we will explore the opportunities to include autonomous techniques for the identification of the success or failure of an execution business process.
Author Contributions
Conceptualisation, Z.T.; methodology, Z.T.; software, Z.T.; validation, Z.T., D.C. and S.M.; formal analysis, Z.T. and S.M.; investigation, Z.T.; resources, Z.T.; data curation, Z.T. and P.T.; writing—original draft preparation, Z.T.; writing—review and editing, Z.T., D.C., S.M., I.M. and P.T.; visualisation, Z.T.; supervision, D.C., S.M., I.M. and P.T.; project administration, S.M. and P.T.; funding acquisition, S.M. and P.T. All authors have read and agreed to the published version of the manuscript.
Funding
This research is sponsored by BTIIC (BT Ireland Innovation Centre) project, funded by BT and Invest Northern Ireland.
Institutional Review Board Statement
Not applicable.
Informed Consent Statement
Not applicable.
Data Availability Statement
Not applicable.
Acknowledgments
This research is supported by the BTIIC (BT Ireland Innovation Centre) project, funded by BT and Invest Northern Ireland.
Conflicts of Interest
Sally McClean and Ian McChesney are guest editors of the Special Issue “Process Mining and Its Applications” and are also co-authors in this research.
Abbreviations
The following abbreviations are used in this manuscript:
| PAIS | Process-Aware Information Systems |
| BTIIC | BT Ireland Innovation Centre |
| BT | British Telecom |
| CDP | Customer Diagnostic Process |
| CBA | Classification Based on Association |
| CRD | Customer Relationship Department |
References
- Dumas, M.; Fournier, F.; Limonad, L.; Marrella, A.; Montali, M.; Rehse, J.R.; Accorsi, R.; Calvanese, D.; De Giacomo, G.; Fahland, D.; et al. Augmented business process management systems: A research manifesto. arXiv 2022, arXiv:2201.12855. [Google Scholar]
- Kratsch, W.; Manderscheid, J.; Röglinger, M.; Seyfried, J. Machine learning in business process monitoring: A comparison of deep learning and classical approaches used for outcome prediction. Bus. Inf. Syst. Eng. 2021, 63, 261–276. [Google Scholar] [CrossRef]
- Buijs, J.C.; van Dongen, B.F.; van Der Aalst, W.M. On the role of fitness, precision, generalization and simplicity in process discovery. In OTM Confederated International Conferences “On the Move to Meaningful Internet Systems”; Springer: Berlin/Heidelberg, Germany, 2012; pp. 305–322. [Google Scholar]
- Rozinat, A.; Van der Aalst, W.M. Conformance checking of processes based on monitoring real behavior. Inf. Syst. 2008, 33, 64–95. [Google Scholar] [CrossRef]
- Mannhardt, F. Multi-perspective Process Mining. In Proceedings of the BPM (Dissertation/Demos/Industry), co-located with 16th International Conference on Business Process Management (BPM 2018), Sydney, Australia, 9–14 September 2018; pp. 41–45. [Google Scholar]
- Van Der Aalst, W. Data science in action. In Process Mining; Springer: Berlin/Heidelberg, Germany, 2016; pp. 3–23. [Google Scholar]
- Nafasa, P.; Waspada, I.; Bahtiar, N.; Wibowo, A. Implementation of alpha miner algorithm in process mining application development for online learning activities based on moodle event log data. In Proceedings of the 2019 3rd International Conference on Informatics and Computational Sciences (ICICoS), Semarang, Indonesia, 29–30 October 2019; pp. 1–6. [Google Scholar]
- Verbeek, H.; van der Aalst, W.M. Decomposed process mining: The ILP case. In International Conference on Business Process Management; Springer: Berlin/Heidelberg, Germany, 2014; pp. 264–276. [Google Scholar]
- Bogarín Vega, A.; Cerezo Menéndez, R.; Romero, C. Discovering learning processes using inductive miner: A case study with learning management systems (LMSs). Psicothema 2018, 30, 322–329. [Google Scholar]
- Weijters, A.; van Der Aalst, W.M.; De Medeiros, A.A. Process mining with the heuristics miner-algorithm. Tech. Univ. Eindh. Tech. Rep. WP 2006, 166, 1–34. [Google Scholar]
- Dunzer, S.; Stierle, M.; Matzner, M.; Baier, S. Conformance checking: A state-of-the-art literature review. In Proceedings of the 11th International Conference on Subject-Oriented Business Process Management, Seville, Spain, 26–28 June 2019; pp. 1–10. [Google Scholar]
- Tariq, Z.; Khan, N.; Charles, D.; McClean, S.; McChesney, I.; Taylor, P. Understanding Contrail Business Processes through Hierarchical Clustering: A Multi-Stage Framework. Algorithms 2020, 13, 244. [Google Scholar] [CrossRef]
- Calderón-Ruiz, G.; Sepúlveda, M. Automatic discovery of failures in business processes using Process Mining techniques. In Anais do IX Simpósio Brasileiro de Sistemas de Informação; SBC: Porto Alegre, Brazil, 2013; pp. 439–450. [Google Scholar]
- Maeyens, J.; Vorstermans, A.; Verbeke, M. Process mining on machine event logs for profiling abnormal behaviour and root cause analysis. Ann. Telecommun. 2020, 75, 563–572. [Google Scholar] [CrossRef]
- Tariq, Z.; Charles, D.; McClean, S.; McChesney, I.; Taylor, P. Proactive business process mining for end-state prediction using trace features. In Proceedings of the 2021 IEEE SmartWorld, Ubiquitous Intelligence & Computing, Advanced & Trusted Computing, Scalable Computing & Communications, Internet of People and Smart City Innovation (SmartWorld/SCALCOM/ UIC/ATC/IOP/SCI), Atlanta, GA, USA, 18–21 October 2021; pp. 647–652. [Google Scholar]
- Silva, R.L.; Canciglieri Junior, O.; Rudek, M. A road map for planning-deploying machine vision artifacts in the context of industry 4.0. J. Ind. Prod. Eng. 2022, 39, 167–180. [Google Scholar] [CrossRef]
- Gupta, N.; Anand, K.; Sureka, A. Pariket: Mining business process logs for root cause analysis of anomalous incidents. In International Workshop on Databases in Networked Information Systems; Springer: Berlin/Heidelberg, Germany, 2015; pp. 244–263. [Google Scholar]
- Suriadi, S.; Ouyang, C.; van der Aalst, W.M.; ter Hofstede, A.H. Root cause analysis with enriched process logs. In International Conference on Business Process Management; Springer: Berlin/Heidelberg, Germany, 2012; pp. 174–186. [Google Scholar]
- Van der Aalst, W.M.; de Medeiros, A.K.A. Process mining and security: Detecting anomalous process executions and checking process conformance. Electron. Notes Theor. Comput. Sci. 2005, 121, 3–21. [Google Scholar] [CrossRef]
- Al-Hawari, F.; Barham, H. A machine learning based help desk system for IT service management. J. King Saud Univ.-Comput. Inf. Sci. 2021, 33, 702–718. [Google Scholar] [CrossRef]
- Khan, N.; Ali, Z.; Ali, A.; McClean, S.; Charles, D.; Taylor, P.; Nauck, D. A generic model for end state prediction of business processes towards target compliance. In International Conference on Innovative Techniques and Applications of Artificial Intelligence; Springer: Berlin/Heidelberg, Germany, 2019; pp. 325–335. [Google Scholar]
- Van der Aalst, W.M. Process Mining: Data Science in Action; Springer: Berlin/Heidelberg, Germany, 2016. [Google Scholar]
- Banerjee, A.; Gupta, P. Extension to alpha algorithm for process mining. Int. J. Eng. Comput. Sci. 2015, 4, 14383–14386. [Google Scholar] [CrossRef]
- Verbeek, H.; van der Aalst, W.M.; Munoz-Gama, J. Divide and conquer: A tool framework for supporting decomposed discovery in process mining. Comput. J. 2017, 60, 1649–1674. [Google Scholar] [CrossRef]
- Mannhardt, F.; De Leoni, M.; Reijers, H.A. The Multi-perspective Process Explorer. BPM 2015, 1418, 130–134. [Google Scholar]
Figure 1.
Proposed framework for anomaly detection using conformance analysis.
Figure 1.
Proposed framework for anomaly detection using conformance analysis.
Figure 2.
Cross functional diagram of a customer diagnostic process—an example of service-related business process.
Figure 2.
Cross functional diagram of a customer diagnostic process—an example of service-related business process.
Figure 3.
Flow of events in the customer diagnostic process—start point, end point and events.
Figure 3.
Flow of events in the customer diagnostic process—start point, end point and events.
Figure 4.
Duration of cases in collected dataset from CDP. Screenshot of data explorer in ProM 6.10.
Figure 4.
Duration of cases in collected dataset from CDP. Screenshot of data explorer in ProM 6.10.
Figure 5.
The process of event log splitting.
Figure 5.
The process of event log splitting.
Figure 6.
Cut-off times for end-state prediction.
Figure 6.
Cut-off times for end-state prediction.
Figure 7.
Two trace variations from CDP with 40 and 41 instances respectively, generated through the ProM tool.
Figure 7.
Two trace variations from CDP with 40 and 41 instances respectively, generated through the ProM tool.
Figure 8.
Comparison of fitness and precision—process discovery by four techniques.
Figure 8.
Comparison of fitness and precision—process discovery by four techniques.
Figure 9.
Segmentation of the entire process trace into several sub logs.
Figure 9.
Segmentation of the entire process trace into several sub logs.
Figure 10.
Trace level average fitness. Group size represents the number of traces with same events and sequence. Screenshot of Multi-perspective Conformance Analysis plugin for ProM Lite 1.3.
Figure 10.
Trace level average fitness. Group size represents the number of traces with same events and sequence. Screenshot of Multi-perspective Conformance Analysis plugin for ProM Lite 1.3.
Figure 11.
Causal activity matrix for successful cases. Matrix’s strengths scaled between −1.0 (weakest-red) to 1.0 (strongest-green).
Figure 11.
Causal activity matrix for successful cases. Matrix’s strengths scaled between −1.0 (weakest-red) to 1.0 (strongest-green).
Figure 12.
Closer view of the activity matrix for successful cases. Matrix’s strengths scaled between −1.0 (weakest-red) to 1.0 (strongest-green).
Figure 12.
Closer view of the activity matrix for successful cases. Matrix’s strengths scaled between −1.0 (weakest-red) to 1.0 (strongest-green).
Figure 13.
Causal activity matrix for failed cases. Matrix’s strengths scaled between −1.0 (weakest-red) to 1.0 (strongest-green).
Figure 13.
Causal activity matrix for failed cases. Matrix’s strengths scaled between −1.0 (weakest-red) to 1.0 (strongest-green).
Figure 14.
Difference between two causality matrices. A small portion of the matrix is presented. Matrix’s strengths scaled between 0.00 (No difference-Blue) to 2.00 (Max difference-red).
Figure 14.
Difference between two causality matrices. A small portion of the matrix is presented. Matrix’s strengths scaled between 0.00 (No difference-Blue) to 2.00 (Max difference-red).
Figure 15.
Case-level alignment: the optimal model is replayed with the log of failed cases.
Figure 15.
Case-level alignment: the optimal model is replayed with the log of failed cases.
Figure 16.
Event-level alignment at the identified events (with life-cycle transition) in red. Screenshot of Multi-perspective Conformance Analysis plugin for ProM Lite 1.3.
Figure 16.
Event-level alignment at the identified events (with life-cycle transition) in red. Screenshot of Multi-perspective Conformance Analysis plugin for ProM Lite 1.3.
Figure 17.
Event-level alignment at the identified events when failed cases are traversed with optimal process model. Screenshot of Multi-perspective Conformance Analysis plugin for ProM Lite 1.3.
Figure 17.
Event-level alignment at the identified events when failed cases are traversed with optimal process model. Screenshot of Multi-perspective Conformance Analysis plugin for ProM Lite 1.3.
Figure 18.
A behavioural deviation in failed cases. Screenshot of Multi-perspective Conformance Analysis plugin for ProM Lite 1.3.
Figure 18.
A behavioural deviation in failed cases. Screenshot of Multi-perspective Conformance Analysis plugin for ProM Lite 1.3.
Figure 19.
Difference between average fitness of successful and failed instances at each phase of process.
Figure 19.
Difference between average fitness of successful and failed instances at each phase of process.
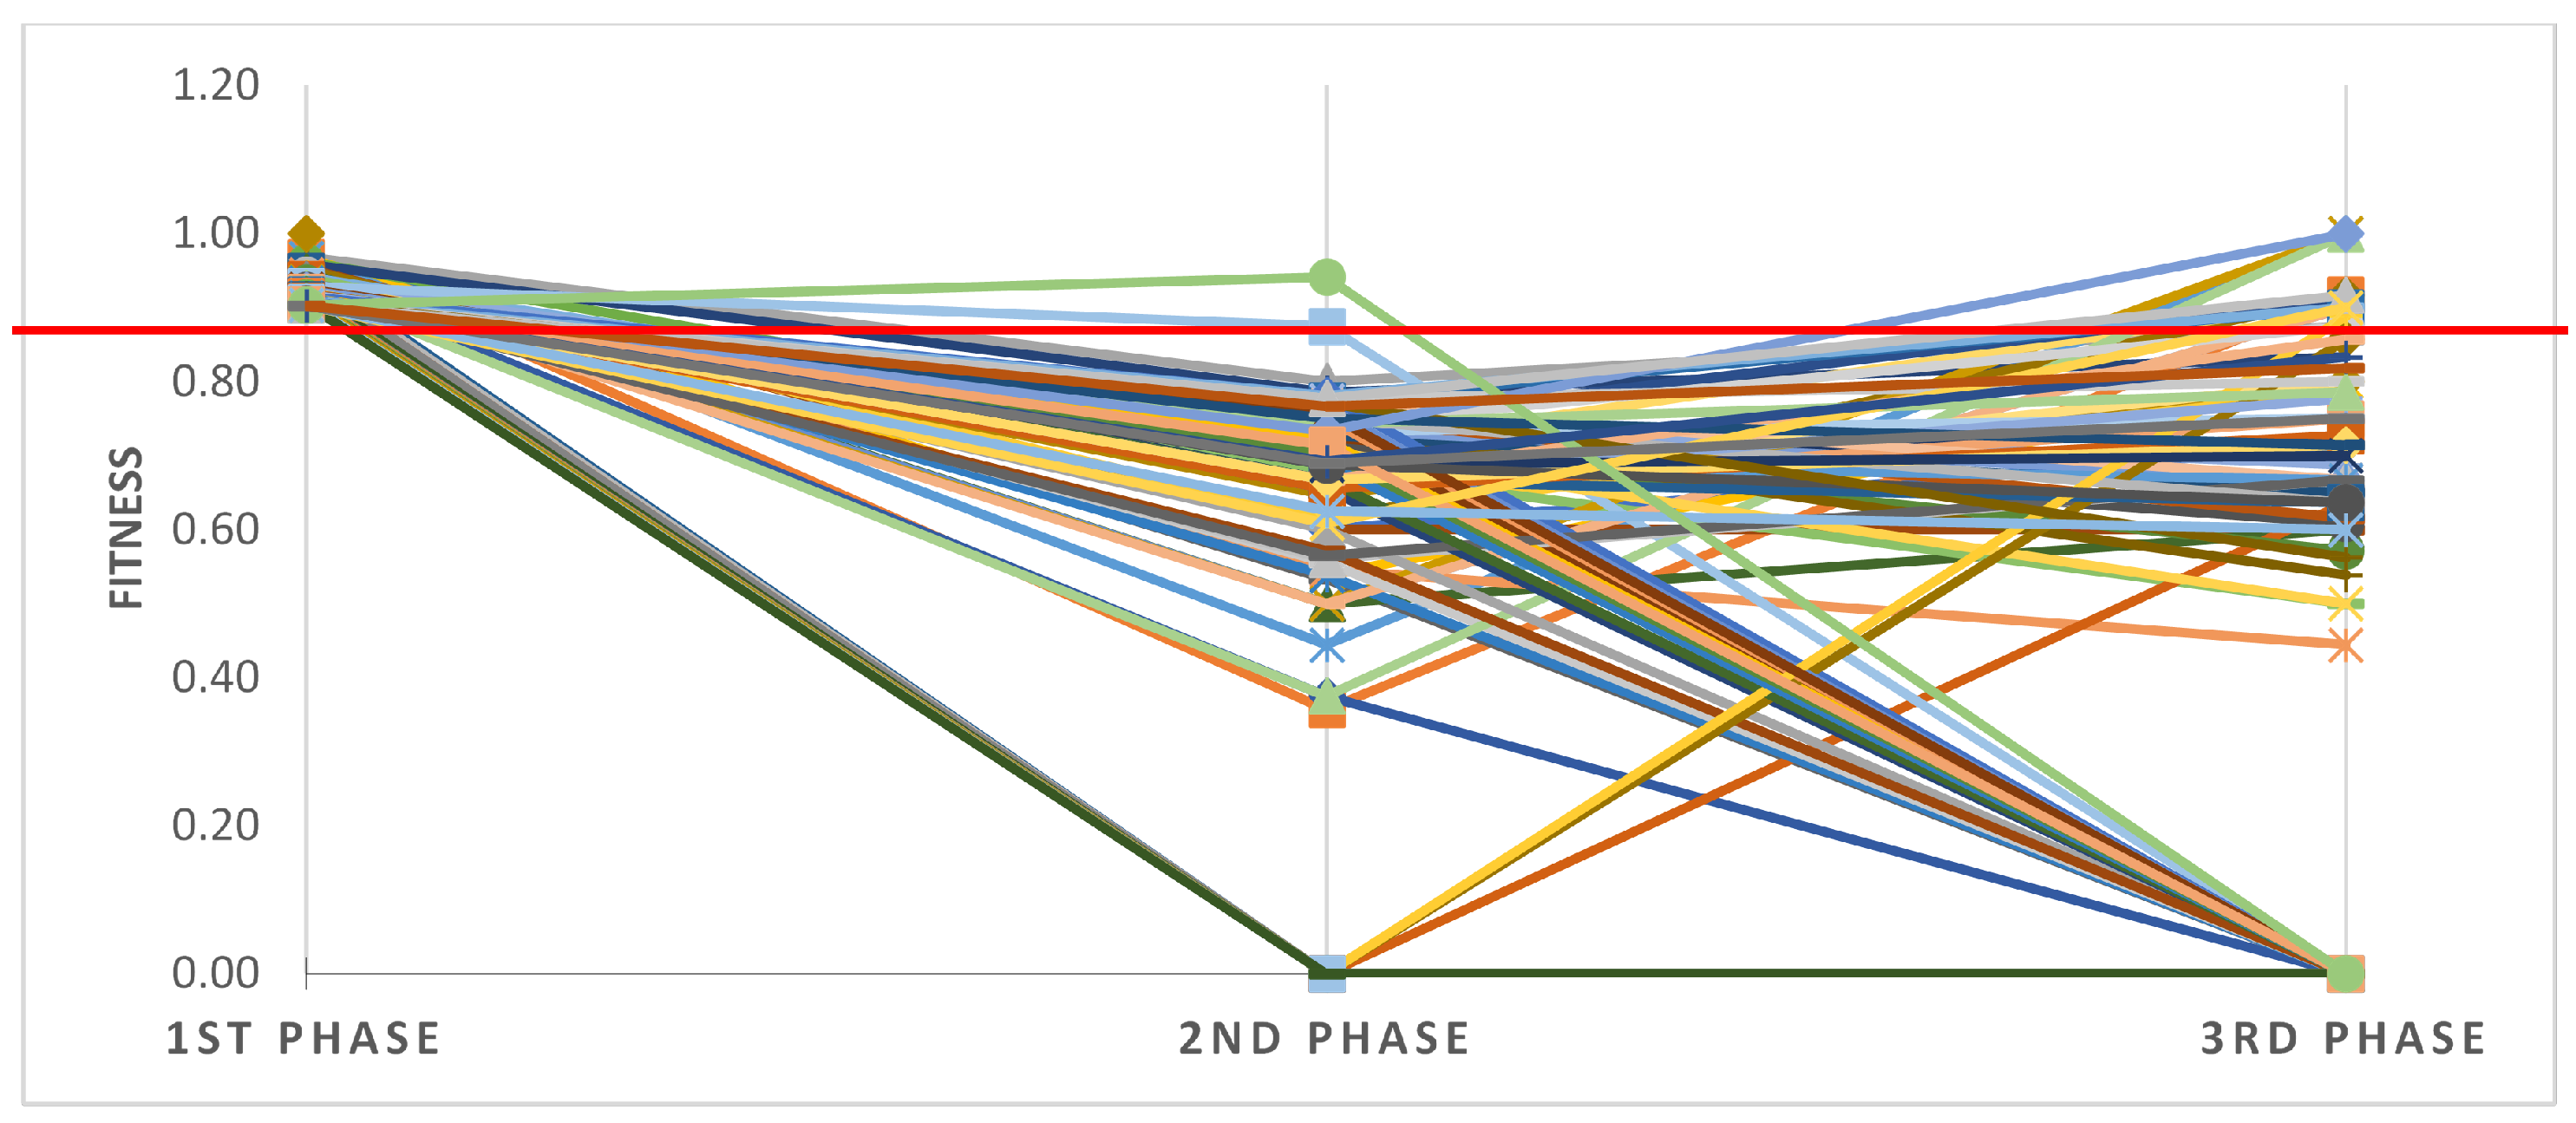
Figure 20.
Fitness of individual failed cases generated for three sub-logs and presented in the form of a coloured plot. Calculated through Multi-perspective Conformance Analysis plugin for ProM Lite 1.3.
Figure 20.
Fitness of individual failed cases generated for three sub-logs and presented in the form of a coloured plot. Calculated through Multi-perspective Conformance Analysis plugin for ProM Lite 1.3.
Table 1.
Sample Log From Process_Discovery_Contest_2019 (Single case).
Table 1.
Sample Log From Process_Discovery_Contest_2019 (Single case).
|
Case ID | Activity | Variant | Variant Index | z_2 | z_1 | z_4 | z_3 | z_6 | z_5 | z_8 | z_7 | z_9 | lifecycle:transition | z_10 | z_11 |
|---|
| 10001 | Start | Variant 1 | 1 | Start | Start | Start | Start | Start | Start | Start | Start | Start | Start | Start | Start |
| 10001 | c | Variant 1 | 1 | 0.848165 | 0.797125 | 0.680985 | 0.195904 | FALSE | 0.229026 | 0.612067 | 0.384933 | TRUE | complete | 0.821351 | FALSE |
| 10001 | h | Variant 1 | 1 | 0.848165 | 0.797125 | 0.680985 | 0.195904 | FALSE | 0.229026 | 0.612067 | 0.384933 | TRUE | complete | 0.821351 | FALSE |
| 10001 | j | Variant 1 | 1 | 0.848165 | 0.797125 | 0.680985 | 0.195904 | FALSE | 0.229026 | 0.612067 | 0.384933 | TRUE | complete | 0.821351 | FALSE |
| 10001 | af | Variant 1 | 1 | 0.848165 | 0.797125 | 0.680985 | 0.195904 | FALSE | 0.229026 | 0.612067 | 0.384933 | TRUE | complete | 0.821351 | FALSE |
| 10001 | ao | Variant 1 | 1 | 0.848165 | 0.797125 | 0.680985 | 0.195904 | FALSE | 0.229026 | 0.612067 | 0.384933 | TRUE | complete | 0.821351 | FALSE |
| 10001 | m | Variant 1 | 1 | 0.848165 | 0.797125 | 0.680985 | 0.195904 | FALSE | 0.229026 | 0.612067 | 0.384933 | TRUE | complete | 0.821351 | FALSE |
| 10001 | d | Variant 1 | 1 | 0.848165 | 0.797125 | 0.680985 | 0.195904 | FALSE | 0.229026 | 0.612067 | 0.384933 | TRUE | complete | 0.821351 | FALSE |
| 10001 | a | Variant 1 | 1 | 0.848165 | 0.797125 | 0.680985 | 0.195904 | FALSE | 0.229026 | 0.612067 | 0.384933 | TRUE | complete | 0.821351 | FALSE |
| 10001 | g | Variant 1 | 1 | 0.848165 | 0.797125 | 0.680985 | 0.195904 | FALSE | 0.229026 | 0.612067 | 0.384933 | TRUE | complete | 0.821351 | FALSE |
| 10001 | an | Variant 1 | 1 | 0.848165 | 0.797125 | 0.680985 | 0.195904 | FALSE | 0.229026 | 0.612067 | 0.384933 | TRUE | complete | 0.821351 | FALSE |
|
10001 | End | Variant 1 | 1 | End | End | End | End | End | End | End | End | End | End | End | End |
Table 2.
Categories of customers in the diagnostic process dataset.
Table 2.
Categories of customers in the diagnostic process dataset.
| Category | Number of Instances |
|---|
| Product-A customers | 2737 |
| Product-B customers | 232 |
| Product-C customers | 2 |
| Product-D customers | 68 |
| Product-E customers | 10 |
| Product-F customers | 19 |
| Product-G customers | 1036 |
| Undetermined customers | 51 |
Table 3.
Fitness of cases in each relative phase of process execution.
Table 3.
Fitness of cases in each relative phase of process execution.
| Case_ID | 1st Phase | 2nd Phase | 3rd Phase |
|---|
| 122512092 | 0.97 | 0.60 | 0.71 |
| 122373345 | 0.97 | 0.36 | 0.92 |
| 122449625 | 0.97 | 0.80 | 0.88 |
| 122474226 | 0.97 | 0.54 | 0.80 |
| 122576970 | 0.97 | 0.44 | 1.00 |
| 122548386 | 0.96 | 0.73 | 0.00 |
| 122455056 | 0.96 | 0.79 | 0.83 |
| 122515716 | 0.95 | 0.60 | 0.60 |
| 122535683 | 0.95 | 0.53 | 0.00 |
| 122535651 | 0.95 | 0.61 | 0.92 |
| 122599947 | 0.95 | 0.00 | 0.00 |
| 122404265 | 0.95 | 0.50 | 0.60 |
| 122422896 | 0.94 | 0.50 | 0.90 |
Table 4.
Trace-level alignment results from the log containing cases for customers belonging to mixture of BT products.
Table 4.
Trace-level alignment results from the log containing cases for customers belonging to mixture of BT products.
| | A: All Customers | B: Product-A Customers | C: Product-B Customers |
|---|
| | Successful Cases | Failure Cases | Successful Cases | Failure Cases | Successful Cases | Failure Cases |
|---|
| Event classes | 64 | 64 | 64 | 64 | 62 | 62 |
| Number of moves observed | 14,021 | 14,073 | 17,118 | 11,623 | 9255 | 7243 |
| Number of moves possible | 57,070 | 56,140 | 69,397 | 43,704 | 22,964 | 17,748 |
| Average fitness % | 96.4 | 87.6 | 90 | 88.8 | 87.7 | 70.4 |
| % Event violations | 2.3 | 11 | 5.9 | 8.8 | 8.6 | 24.1 |
| Number of correct events | 8064 | 7978 | 9532 | 6094 | 5118 | 3908 |
| Number of wrong events | 36 | 762 | 200 | 178 | 264 | 960 |
| Number of missing events | 150 | 220 | 394 | 408 | 216 | 278 |
| Publisher’s Note: MDPI stays neutral with regard to jurisdictional claims in published maps and institutional affiliations. |
© 2022 by the authors. Licensee MDPI, Basel, Switzerland. This article is an open access article distributed under the terms and conditions of the Creative Commons Attribution (CC BY) license (https://creativecommons.org/licenses/by/4.0/).


