
Efficient Machine Learning Models for Early Stage Detection of Autism Spectrum Disorder

 , ,
, ,  , and
, and 
Abstract
:1. Introduction
- We proposed an efficient machine learning method that has the potential to identify ASD with high accuracy at an early stage.
- We concentrated on identifying important feature subsets and explained different features to know how individual features are responsible to generate the best result to diagnose ASD or not.
- To justify the performance of the classifier, we used a non-parametric statistical method and checked the classifier’s pairwise significance.
- This method is helpful to identify ASD in a simple and flexible way.
2. Literature Review
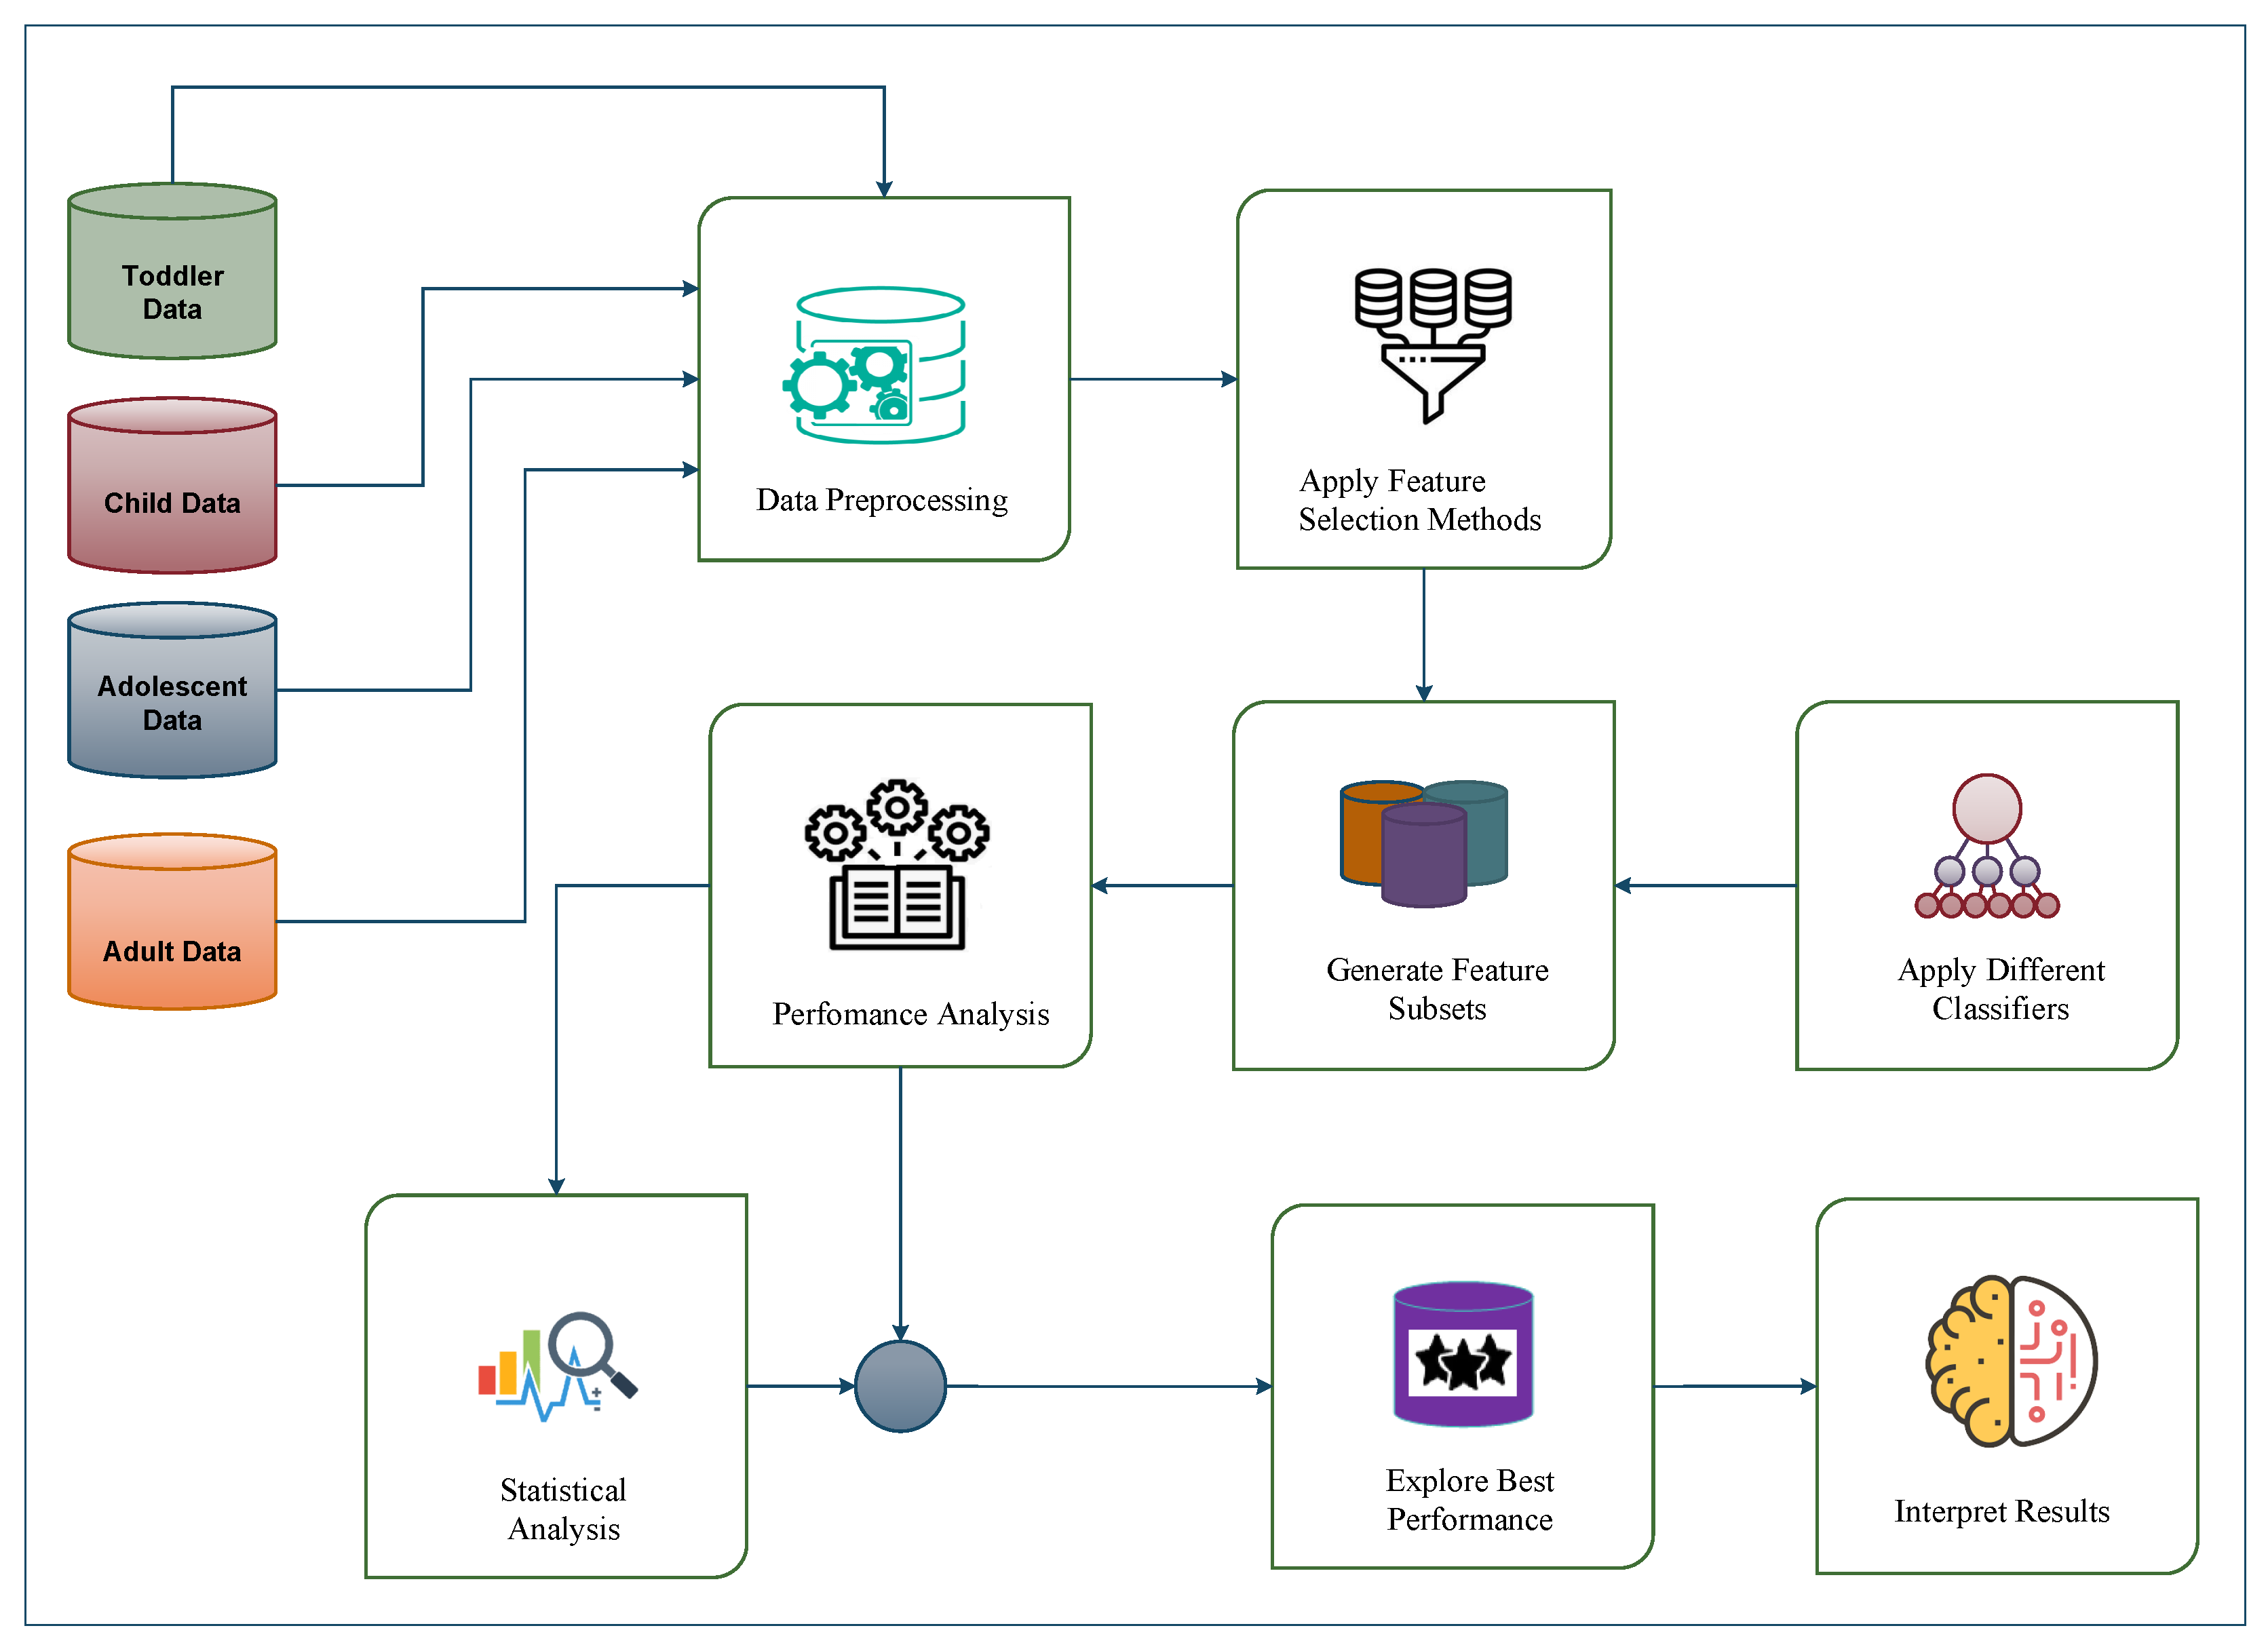
3. Methodology
3.1. Data Preprocessing
3.2. Implementing Feature Selection Methods
- Boruta algorithm is a wrapper algorithm based on the random forest [28] where it finds the importance of a feature by creating shadow features [29]. It is an extended system where each feature of the given data set is replicated. Then, the values of replicated variables are randomly combined, which are called shadow features. It performs its feature selection process using RF on the extended data set and evaluates the importance of each feature. Additionally, it computes the z-score of real and shadow features. It compares higher z-score values of real features than the maximum z-score value of its shadow features at every iteration. In this process, it constantly eliminates features that are deemed highly unimportant. Finally, the algorithm ends either when all features are approved or rejected or it obtains a particular limit of RF runs [30].
- Correlation-based Feature Selection (CFS–Harmony Search) is a heuristic function that evaluates the ranks of features based on their correlation [31]. For harmony search, it illustrates the point of intersection with the following parameters: the number of harmonies in memory N, the number of indicator M, the number of possible values of indicator D, the number of optimal indicator i in the harmony memory = , and the rate of harmony memory . The probability is calculated by the following equation,
- Repeated Incremental Pruning to Produce Error Reduction (RIPPER) is the rule induction algorithm that was introduced by W. Cohen in 1995 [32]. It is generated as a set of if-then-else rules that evolves several iterations of the rule learning algorithm. This model is maintained by three-steps such as grow, prune, and optimize [33] where the evaluation process is denoted as,where = the initial rule, = the rule after adding conjunct, c = the number of true instances covered by and , = the number of true instances covered by , = the number of false instances covered by , = the number of true instances covered by , and = the number of false instances covered by [34].
- Recursive Feature Elimination (RFE) is a feature selection technique that discards the least important features recursively. In this process, the initial features are trained where each important feature is acquired through any selected attributes [35]. Then, the least important features are eliminated from the initial feature set. This process is recursively repeated until the desired number of feature subsets are obtained [36]. The steps of RFE are given as follows [37]:
- Train the classifier.
- Calculate the score for all features with the ranking.
- Eliminate the feature with the lowest score.
3.3. Apply Individual Classification Methods
- Naïve Bayes (NB) is a most constructive probabilistic classifier based on Bayes theorem [38]. It predicts target output more efficiently according to the foundation of the probability of an entity. The formula of Bayes theorem is given as,The derivation form for NB is:Here, is the subsequent probability of the target class; is the earlier probability of the class; is the prospect of the predictor specified class; and is the earlier probability of the predictor (see Equation (3)).
- K-Star (KS) is an instance-based classifier that categorizes samples or instances by differentiating it based on pre-categorized samples [39]. Some similar functions are used to determine the class of test instances. It uses an entropy-based function, which differentiates from other instance-based learners [40].
- Decision Tree (C4.5) is the extension version of the ID3 algorithm that uses the recursive divide and conquer method to produce the C4.5 decision tree [41]. When unknown data are found, this method predicts a target class by satisfying several conditions. C4.5 uses Information Gain (IG) that calculates the gain ratio by the following equation [42],
- Classification and Regression Trees (CART) use several classification and regression trees where classification trees are used to accumulate the finite number of unsorted values and determine the prediction errors. Besides, regression trees are employed for grouping sorted or ordered values and determining the prediction error by calculating the root squared difference between target and predicted values [43].
- Support Vector Machine (SVM) generates some vectors to create a decision boundary that separates n-dimensional space into classes. This decision boundary is called a hyperplane. In the general situation, two parallel hyperplanes are generated, which concurrently minimizes the classification error and maximizes the margin of classes. It is called a maximum margin classifier [46].
- Bagging Classifier (BG) is a parallel ensemble method that generates several random subsets from substitution of the original dataset. Then, we analyzed them using the base classifier and aggregated their predictions by voting [47]. It decreases the variance and correctly predicts the target outcome.
- Random Tree (RT) is a decision tree where a set of possible trees are randomly generated with K random features. The combination of large sets of random trees is generally produced with accurate predictions more efficiently [48].
3.4. Use Evaluation Metrics for Performance Analysis of Classifiers
- Accuracy: It is a measure of how effective the model is used to predict outcomes [49], in terms of the total number of predictions:
- Kappa statistics (Kp): It measures observer agreement for categorical data and expected accuracy and has received considerable attention [50].
- Precision: It is a measure of true-positive predictions against all retrieved positive instances [51].
- Recall: It is a measure of correctly predicted positive observations against all relevant positive classes [51].
- F1 score: It is the harmonic average of precision and recall [52]:
3.5. Determining the Performance of Classifiers Using Statistical Tests
- Wilcoxon Signed-Rank Test is a non-parametric statistical test that is used to compare two independent samples. This method is considered an alternative of the t-test when the population mean is not of interest. The working formula of this method is given as follows:where W denotes test statistics; N indicates the sample size; denotes a sign function; both represent the ranked pairs of the two distributions; and indicates the rank.
3.6. Interpretation of the Results of Machine Learning Models
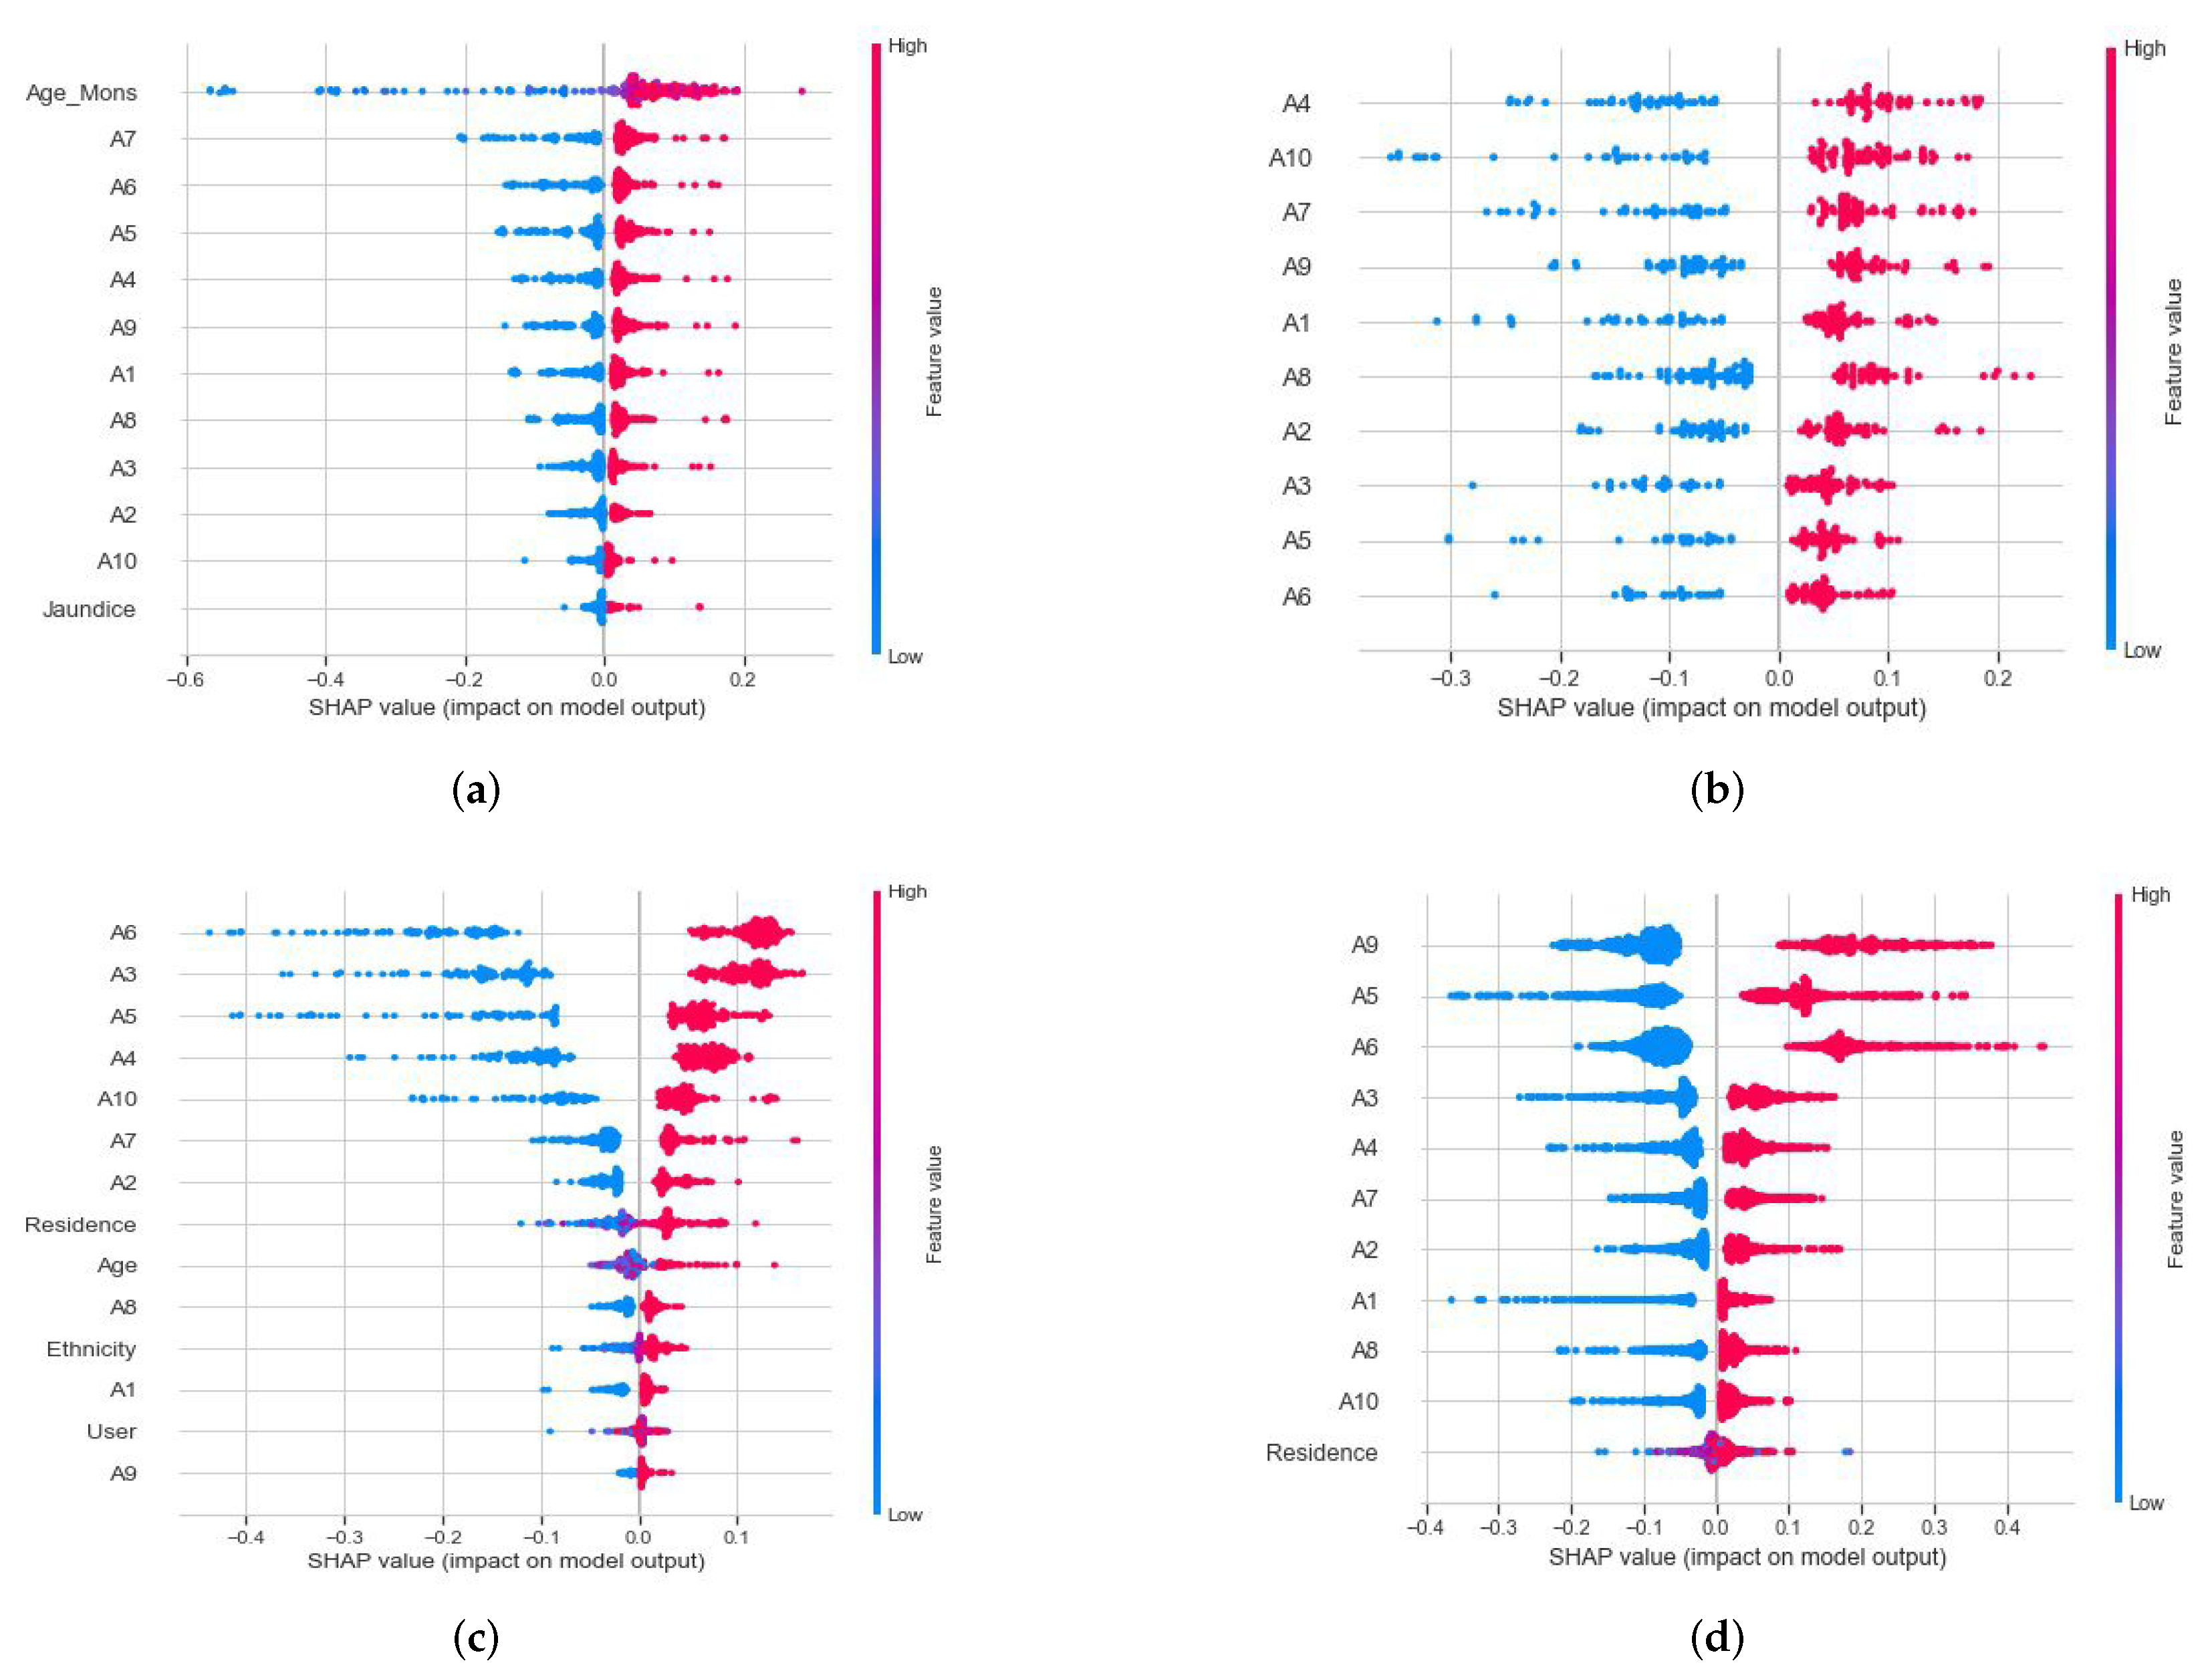
- The SHAP method is a game-theoretic process to explain the output of any individual model. This model was developed by Lundberg and Lee [53]. The purpose of this method is to compute the contribution of each feature for an instance’s prediction. It associates optimal credit allocation with a local explanation using Shapley values. The simplest general SHAP values are represented as follows [54]:
- Select an objective feature function.
- Calculate the Shapley value for all features.
- Choose the highest-ranking features.
4. Experimental Results
4.1. Generating Several Feature Subsets
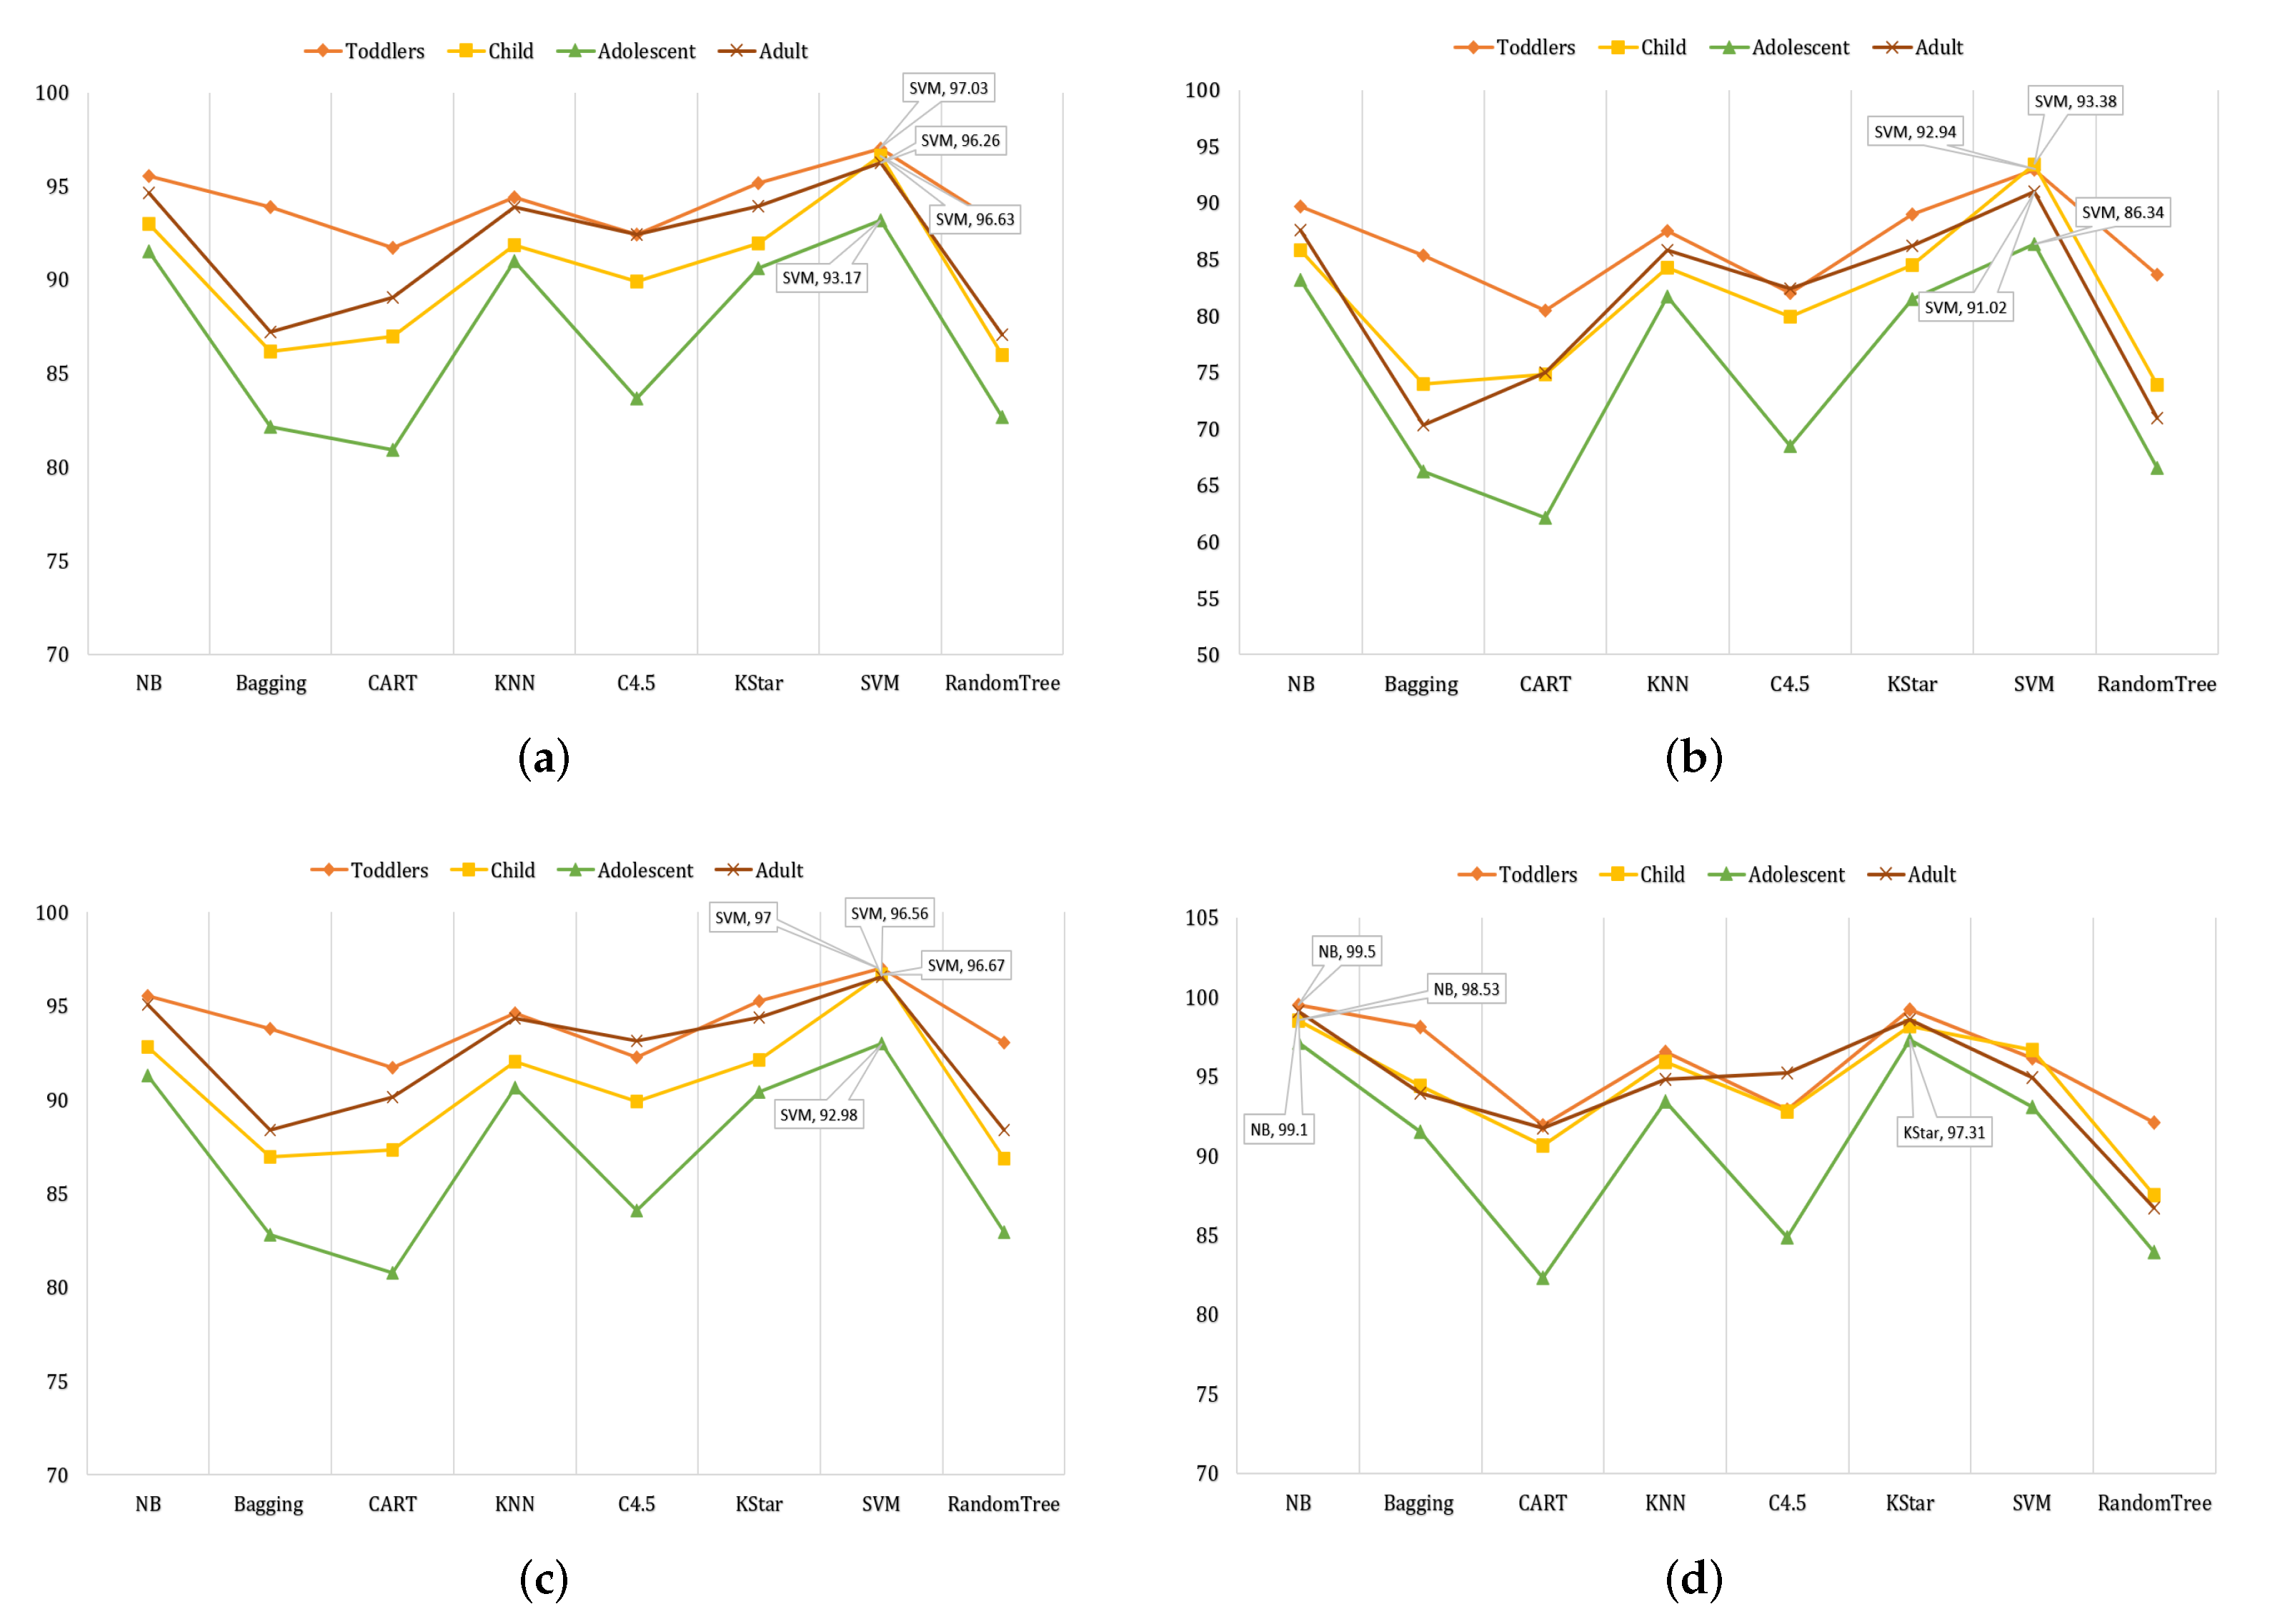
4.2. Result Analysis of Accuracy
4.3. Result Analysis of Kappa Statistics
4.4. Result Analysis of F1-Score
4.5. Result Analysis of AUROC
4.6. Result Analysis of Non-Parametric Statistical Analysis
4.7. Exploring Significant Feature Sets and Discriminatory Factors of Individual Age Groups
5. Discussion and Conclusions
Author Contributions
Funding
Informed Consent Statement
Data Availability Statement
Conflicts of Interest
References
- Landa, R.J.; Gross, A.L.; Stuart, E.A.; Faherty, A. Developmental trajectories in children with and without autism spectrum disorders: The first 3 years. Child Dev. 2013, 84, 429–442. [Google Scholar] [CrossRef] [PubMed] [Green Version]
- Belmonte, M.K.; Allen, G.; Beckel-Mitchener, A.; Boulanger, L.M.; Carper, R.A.; Webb, S.J. Autism and abnormal development of brain connectivity. J. Neurosci. 2004, 24, 9228–9231. [Google Scholar] [CrossRef] [PubMed]
- GBD 2019 Diseases and Injuries Collaborators. GBD 2019 Diseases and Injuries Collaborators Global burden of 369 diseases and injuries in 204 countries and territories, 1990–2019: A systematic analysis for the Global Burden of Disease Study 2019. Lancet 2020, 396, 1204–1222. [Google Scholar] [CrossRef]
- Usta, M.B.; Karabekiroglu, K.; Sahin, B.; Aydin, M.; Bozkurt, A.; Karaosman, T.; Aral, A.; Cobanoglu, C.; Kurt, A.D.; Kesim, N.; et al. Use of machine learning methods in prediction of short-term outcome in autism spectrum disorders. Psychiatry Clin. Psychopharmacol. 2019, 29, 320–325. [Google Scholar] [CrossRef] [Green Version]
- Hyde, K.K.; Novack, M.N.; LaHaye, N.; Parlett-Pelleriti, C.; Anden, R.; Dixon, D.R.; Linstead, E. Applications of supervised machine learning in autism spectrum disorder research: A review. Rev. J. Autism Dev. Disord. 2019, 6, 128–146. [Google Scholar] [CrossRef] [Green Version]
- Thabtah, F.; Kamalov, F.; Rajab, K. A new computational intelligence approach to detect autistic features for autism screening. Int. J. Med. Inform. 2018, 117, 112–124. [Google Scholar] [CrossRef] [PubMed]
- Satu, M.S.; Azad, M.S.; Haque, M.F.; Imtiaz, S.K.; Akter, T.; Barua, L.; Rashid, M.; Soron, T.R.; Al Mamun, K.A. Prottoy: A smart phone based mobile application to detect autism of children in Bangladesh. In Proceedings of the 2019 4th International Conference on Electrical Information and Communication Technology (EICT), Khulna, Bangladesh, 17–19 December 2019; pp. 1–6. [Google Scholar]
- Akter, T.; Ali, M.H.; Khan, M.I.; Satu, M.S.; Moni, M.A. Machine learning model to predict autism investigating eye-tracking dataset. In Proceedings of the 2021 2nd International Conference on Robotics, Electrical and Signal Processing Techniques (ICREST), Online, 5–7 January 2021; pp. 383–387. [Google Scholar]
- Akter, T.; Ali, M.H.; Khan, M.I.; Satu, M.S.; Uddin, M.; Alyami, S.A.; Ali, S.; Azad, A.; Moni, M.A. Improved transfer-learning-based facial recognition framework to detect autistic children at an early stage. Brain Sci. 2021, 11, 734. [Google Scholar] [CrossRef]
- Omar, K.S.; Mondal, P.; Khan, N.S.; Rizvi, M.R.K.; Islam, M.N. A machine learning approach to predict autism spectrum disorder. In Proceedings of the 2019 International Conference on Electrical, Computer and Communication Engineering (ECCE), Bazar, Bangladesh, 7–9 February 2019; pp. 1–6. [Google Scholar]
- Sharma, M. Improved autistic spectrum disorder estimation using Cfs subset with greedy stepwise feature selection technique. Int. J. Inf. Technol. 2019, 14, 1251–1261. [Google Scholar] [CrossRef]
- Satu, M.S.; Sathi, F.F.; Arifen, M.S.; Ali, M.H.; Moni, M.A. Early detection of autism by extracting features: A case study in Bangladesh. In Proceedings of the 2019 International Conference on Robotics, Electrical and Signal Processing Techniques (ICREST), Dhaka, Bangladesh, 10–12 January 2021; pp. 400–405. [Google Scholar]
- Erkan, U.; Thanh, D.N. Autism spectrum disorder detection with machine learning methods. Curr. Psychiatry Res. Rev. Former. Curr. Psychiatry Rev. 2019, 15, 297–308. [Google Scholar] [CrossRef]
- Thabtah, F.; Abdelhamid, N.; Peebles, D. A machine learning autism classification based on logistic regression analysis. Health Inf. Sci. Syst. 2019, 7, 1–11. [Google Scholar] [CrossRef]
- Akter, T.; Satu, M.S.; Khan, M.I.; Ali, M.H.; Uddin, S.; Lio, P.; Quinn, J.M.; Moni, M.A. Machine learning-based models for early stage detection of autism spectrum disorders. IEEE Access 2019, 7, 166509–166527. [Google Scholar] [CrossRef]
- Hossain, M.D.; Kabir, M.A.; Anwar, A.; Islam, M.Z. Detecting Autism Spectrum Disorder using Machine Learning. arXiv 2020, arXiv:2009.14499. [Google Scholar]
- Raj, S.; Masood, S. Analysis and Detection of Autism Spectrum Disorder Using Machine Learning Techniques. Procedia Comput. Sci. 2020, 167, 994–1004. [Google Scholar] [CrossRef]
- Thabtah, F.; Peebles, D. A new machine learning model based on induction of rules for autism detection. Health Inform. J. 2020, 26, 264–286. [Google Scholar] [CrossRef] [PubMed] [Green Version]
- Chowdhury, K.; Iraj, M.A. Predicting Autism Spectrum Disorder Using Machine Learning Classifiers. In Proceedings of the 2020 International Conference on Recent Trends on Electronics, Information, Communication & Technology (RTEICT), Bangalore, India, 12–13 November 2020; pp. 324–327. [Google Scholar]
- Akter, T.; Khan, M.I.; Ali, M.H.; Satu, M.S.; Uddin, M.J.; Moni, M.A. Improved machine learning based classification model for early autism detection. In Proceedings of the 2021 2nd International Conference on Robotics, Electrical and Signal Processing Techniques (ICREST), Online, 5–7 January 2021; pp. 742–747. [Google Scholar]
- Akter, T.; Ali, M.H.; Satu, M.S.; Khan, M.I.; Mahmud, M. Towards Autism Subtype Detection Through Identification of Discriminatory Factors Using Machine Learning. In Proceedings of the International Conference on Brain Informatics, Online, 17–19 September 2021; pp. 401–410. [Google Scholar]
- Thabtah, F. Autism Screening Data for Toddlers. 2019. Available online: https://fadifayez.com/ (accessed on 28 March 2022).
- Thabtah, F. Autism Screening Data for Child. 2019. Available online: https://fadifayez.com/ (accessed on 28 March 2022).
- Thabtah, F. Autism Screening Data for Adolescent. 2019. Available online: https://fadifayez.com/ (accessed on 28 March 2022).
- Thabtah, F. Autism Screening Data for Adult. 2019. Available online: https://fadifayez.com/ (accessed on 28 March 2022).
- Alzubi, R.; Ramzan, N.; Alzoubi, H. Hybrid feature selection method for autism spectrum disorder SNPs. In Proceedings of the 2017 IEEE Conference on Computational Intelligence in Bioinformatics and Computational Biology (CIBCB), Piscataway, NJ, USA, 23–25 August 2017; pp. 1–7. [Google Scholar]
- Thabtah, F.; Zhang, L.; Abdelhamid, N. NBA game result prediction using feature analysis and machine learning. Ann. Data Sci. 2019, 6, 103–116. [Google Scholar] [CrossRef]
- Liaw, A.; Wiener, M. Classification and regression by randomForest. R News 2002, 2, 18–22. [Google Scholar]
- Kursa, M.B.; Jankowski, A.; Rudnicki, W.R. Boruta—A system for feature selection. Fundam. Inform. 2010, 101, 271–285. [Google Scholar] [CrossRef]
- Kursa, M.B.; Rudnicki, W.R. Feature selection with the Boruta package. J. Stat. Softw. 2010, 36, 1–13. [Google Scholar] [CrossRef] [Green Version]
- Howlader, K.C.; Satu, M.; Awal, M.; Islam, M.; Islam, S.M.S.; Quinn, J.M.; Moni, M.A. Machine learning models for classification and identification of significant attributes to detect type 2 diabetes. Health Inf. Sci. Syst. 2022, 10, 2. [Google Scholar] [CrossRef]
- Cohen, W.W.; Singer, Y. A simple, fast, and effective rule learner. AAAI/IAAI 1999, 99, 3. [Google Scholar]
- Yang, J.; Tiyyagura, A.; Chen, F.; Honavar, V. Feature subset selection for rule induction using RIPPER. In Proceedings of the Genetic and Evolutionary Computation Conference, Berlin, Germany, 15–19 July 1999; Volume 2, p. 1800. [Google Scholar]
- Seerat, B.; Qamar, U. Rule induction using enhanced RIPPER algorithm for clinical decision support system. In Proceedings of the 2015 Sixth International Conference on Intelligent Control and Information Processing (ICICIP), Wuhan, China, 26–28 November 2015; pp. 83–91. [Google Scholar]
- Pedregosa, F.; Varoquaux, G.; Gramfort, A.; Michel, V.; Thirion, B.; Grisel, O.; Blondel, M.; Prettenhofer, P.; Weiss, R.; Dubourg, V.; et al. Scikit-learn: Machine Learning in Python. J. Mach. Learn. Res. 2011, 12, 2825–2830. [Google Scholar]
- Ahammed, K.; Satu, M.S.; Khan, M.I.; Whaiduzzaman, M. Predicting Infectious State of Hepatitis C Virus Affected Patient’s Applying Machine Learning Methods. In Proceedings of the 2020 IEEE Region 10 Symposium (TENSYMP), Online, 5–7 June 2020; pp. 1371–1374. [Google Scholar]
- Guyon, I.; Weston, J.; Barnhill, S.; Vapnik, V. Gene selection for cancer classification using support vector machines. Mach. Learn. 2002, 46, 389–422. [Google Scholar] [CrossRef]
- John, G.H.; Langley, P. Estimating continuous distributions in Bayesian classifiers. arXiv 2013, arXiv:1302.4964. [Google Scholar]
- Witten, I.H.; Frank, E. Data mining: Practical machine learning tools and techniques with Java implementations. Acm Sigmod Rec. 2002, 31, 76–77. [Google Scholar] [CrossRef]
- Painuli, S.; Elangovan, M.; Sugumaran, V. Tool condition monitoring using K-star algorithm. Expert Syst. Appl. 2014, 41, 2638–2643. [Google Scholar] [CrossRef]
- Alam, F.; Pachauri, S. Detection using weka. Adv. Comput. Sci. Technol. 2017, 10, 1731–1743. [Google Scholar]
- Trabelsi, M.; Meddouri, N.; Maddouri, M. A new feature selection method for nominal classifier based on formal concept analysis. Procedia Comput. Sci. 2017, 112, 186–194. [Google Scholar] [CrossRef]
- Lee, B.K.; Lessler, J.; Stuart, E.A. Improving propensity score weighting using machine learning. Stat. Med. 2010, 29, 337–346. [Google Scholar] [CrossRef] [Green Version]
- Sayad, S. K Nearest Neighbors—Classification. Available online: http://www.saedsayad.com/k_nearest_neighbors.htm (accessed on 28 March 2022).
- Hastie, T.; Tibshirani, R.; Friedman, J. The Elements of Statistical Learning: Data Mining, Inference, and Prediction; Springer: Berlin/Heidelberg, Germany, 2009. [Google Scholar]
- Keerthi, S.S.; Shevade, S.K.; Bhattacharyya, C.; Murthy, K.R.K. Improvements to Platt’s SMO algorithm for SVM classifier design. Neural Comput. 2001, 13, 637–649. [Google Scholar] [CrossRef]
- Lee, S.J.; Xu, Z.; Li, T.; Yang, Y. A novel bagging C4. 5 algorithm based on wrapper feature selection for supporting wise clinical decision making. J. Biomed. Inform. 2018, 78, 144–155. [Google Scholar] [CrossRef]
- Ali, J.; Khan, R.; Ahmad, N.; Maqsood, I. Random forests and decision trees. Int. J. Comput. Sci. Issues (IJCSI) 2012, 9, 272. [Google Scholar]
- Hasnain, M.; Pasha, M.F.; Ghani, I.; Imran, M.; Alzahrani, M.Y.; Budiarto, R. Evaluating trust prediction and confusion matrix measures for web services ranking. IEEE Access 2020, 8, 90847–90861. [Google Scholar] [CrossRef]
- Kalkhan, M.; Reich, R.; Czaplewski, R. Variance estimates and confidence intervals for the Kappa measure of classification accuracy. Can. J. Remote Sens. 1997, 23, 210–216. [Google Scholar] [CrossRef]
- Davis, J.; Goadrich, M. The relationship between Precision-Recall and ROC curves. In Proceedings of the 23rd International Conference on Machine Learning, Pittsburgh, PA, USA, 25–29 June 2006; pp. 233–240. [Google Scholar]
- Powers, D.M. Evaluation: From precision, recall and F-measure to ROC, informedness, markedness and correlation. arXiv 2020, arXiv:2010.16061. [Google Scholar]
- Lundberg, S.M.; Lee, S.I. A unified approach to interpreting model predictions. In Proceedings of the 31st International Conference on Neural Information Processing Systems, Long Beach, CA, USA, 4–9 December 2017; pp. 4768–4777. [Google Scholar]
- Fryer, D.; Strümke, I.; Nguyen, H. Shapley values for feature selection: The good, the bad, and the axioms. arXiv 2021, arXiv:2102.10936. [Google Scholar] [CrossRef]
- Kuhn, M. The Caret Package. Available online: https://topepo.github.io/caret/ (accessed on 27 March 2019).
- Satu, M.; Zoynul Abedin, M.; Khanom, S.; Ouenniche, J.; Shamim Kaiser, M. Application of feature engineering with classification techniques to enhance corporate tax default detection performance. In Proceedings of the International Conference on Trends in Computational and Cognitive Engineering, Online, 21–22 October 2021; Springer: Berlin/Heidelberg, Germany, 2021; pp. 53–63. [Google Scholar]
- McNamara, B.; Lora, C.; Yang, D.; Flores, F.; Daly, P. Machine Learning Classification of Adults with Autism Spectrum Disorder. Available online: http://rstudio-pubs-static.s3.amazonaws.com/383049_1faa93345b324da6a1081506f371a8dd.html (accessed on 29 April 2018).
- Bala, M.; Prova, A.A.; Ali, M.H. Prediction of Autism Spectrum Disorder Using Feature Selection and Machine Learning Algorithms. In Proceedings of the International Conference on Computational Intelligence and Emerging Power System, Ajmer, India, 9–10 March 2021; Springer: Berlin/Heidelberg, Germany, 2022; pp. 133–148. [Google Scholar]


| Dataset Name | Instances | Attributes | Male/Female | Age (Years) | Average Age | ASD/Normal |
|---|---|---|---|---|---|---|
| Toddler Autism dataset | 1054 | 18 | 735/319 | 12–36 (mons) | 27.86 (mons) | 735/319 |
| Autism Child Dataset (Version-2) | 509 | 23 | 363/146 | 11-Apr | 6.39 | 257/252 |
| Autism Adolescent Dataset (Version-2) | 248 | 23 | 117/131 | 16-Dec | 14.04 | 127/121 |
| Autism Adult Dataset (Version-2) | 1118 | 23 | 596/522 | 17–80 | 30.143 | 358/760 |
| Feature | Type | Description |
|---|---|---|
| Age (Year) | Number | Toddlers (months), children, adolescent, and adults (year) |
| Gender | String | Male or female |
| Ethnicity | String | List of common ethnicities |
| Born with jaundice | Boolean | Whether the case was born with jaundice |
| Family member with PDD | Boolean | Whether any immediate family member has a PDD history |
| Who is completing the test | String | Parent, self, caregiver, medical staff, clinician, etc. |
| Country of residence | String | List of countries |
| Used the screening app before | Boolean | Whether the user has formerly used the screening app |
| Language | String | The user’s language details |
| A1: Answer of Q1 | Binary(0,1) | Does your child look at you when you call his/her name? (Toddler) S/he often notices small sounds when others do not. (Child) S/he notices patterns in things all the time. (Adolescent) I often notice small sounds when others do not. (Adult) |
| A2: Answer of Q2 | Binary(0,1) | How easy is it for you to get eye contact with your child? (Toddler) S/he usually concentrates more on the whole picture rather than the small details. (Child, adolescent, adult) |
| A3: Answer of Q3 | Binary(0,1) | Does your child point to indicate that s/he wants something? (Toddler) In a social group, s/he can easily keep track of several different people’s conversations. (Child) In a social group, s/he can easily keep track of several different people’s conversations. (Adolescent) I find it easy to do more than one thing at once. (Adult) |
| A4: Answer of Q4 | Binary(0,1) | Does your child point to share interest with you? (Toddler) S/he finds it easy to go back and forth between different activities. (Child) If there is an interruption, s/he can switch back to what s/he was doing very quickly. (Adolescent) If there is an interruption, I can switch back to what I was doing very quickly (Adult) |
| A5: Answer of Q5 | Binary(0,1) | Does your child pretend? (Toddler) S/he does not know how to keep a conversation going with his/her peers. (Child, Adolescent) I find it easy to “read between the lines” when someone is talking to me. (Adult) |
| A6: Answer of Q6 | Binary(0,1) | Does your child follow where you are looking? (Toddler) S/he is good at social chit-chat (Child, Adolescent). I know how to tell if someone listening to me is getting bored (Adult) |
| A7: Answer of Q7 | Binary(0,1) | If you or someone else in the family is visibly upset, does your child show signs of wanting to comfort them? (Toddler) When s/he is read a story, s/he finds it difficult to work out the character’s intentions or feelings (Child). When s/he was younger, s/he used to enjoy playing games involving pretending with other children (Adolescent). When I am reading a story I find it difficult to work out the characters’ intentions (Adult). |
| A8: Answer of Q8 | Binary(0,1) | Would you describe your child’s first words as: (Toddler) When s/he was in preschool, s/he used to enjoy playing pretending games with other children (Child). S/he finds it difficult to imagine what it would be like to be someone else (Adolescent). I like to collect information about categories of things (Adult). |
| A9: Answer of Q9 | Binary(0,1) | Does your child use simple gestures? (Toddler). S/he finds it easy to work out what someone is thinking or feeling just by looking at their face (Child). S/he finds social situations easy (Adolescent). I find it easy to work out what someone is thinking or feeling just by looking at their face (Adult). |
| A10: Answer of Q10 | Binary(0,1) | Does your child stare at nothing with no apparent purpose? (Toddler). S/he finds it hard to make new friends (Child, Adolescent). I find it difficult to work out people’s intentions (Adult). |
| Screening score | Integer | It is based on the scoring algorithm of the screening method used |
| Class | String | ASD or No ASD |
| Target | Predicted | |
|---|---|---|
| ASD | No ASD | |
| ASD | TP | FN |
| No ASD | FP | TN |
| FS Method | Selected Features | ||
|---|---|---|---|
| Toddler | Boruta | A1, A2, A3, A4, A5, A6, A7, A8, A9, A10, Age, Jaundice, Family_ASD | |
| CFS | A1, A2, A4, A5, A6, A7, A8, A9, A10, Age, User | ||
| RIPPER | A1, A2, A3, A4, A5, A6, A7, A8, A9, A10, Age, Jaundice | ||
| RFE | A1, A2, A3, A4, A6, A7, A8, A9, A10, Gender, User | ||
| Intersect | A1, A2, A3, A4, A5, A6, A7, A8, A9, A10, Age | ||
| Child | Boruta | A1, A2, A3, A4, A5, A6, A7, A8, A9, A10, Age, Gender, Residence | |
| CFS | A1, A2, A3, A4, A5, A6, A7, A8, A9, A10 | ||
| RIPPER | A1, A2, A3, A4, A5, A6, A7, A8, A9, A10, Jaundice | ||
| RFE | A1, A4, A6, A7, A8, A9, A10, Ethnicity, Jaundice, Family_ASD | ||
| Intersect | A1, A2, A3, A4, A5, A6, A7, A8, A9, A10 | ||
| Adolescent | Boruta | A1, A2, A3, A4, A5, A6, A7, A8, A9, A10, Age, Ethnicity, Residence, User | |
| CFS | A1, A2, A3, A4, A5, A6, A7, A10, Ethnicity | ||
| RIPPER | A1, A2, A3, A4, A5, A6, A7, A8, A10, Age, Gender | ||
| RFE | A1, A2, A3, A4, A5, A6, A8, A10, Age, Gender, Ethnicity, Jaundice, Residence | ||
| Intersect | A1, A2, A3, A4, A5, A6, A7, A8, A10, Age | ||
| Adult | Boruta | A1, A2, A3, A4, A5, A6, A7, A8, A9, A10, Age, Ethnicity, Residence, User | |
| CFS | A1, A2, A3, A4, A5, A6, A7, A8, A9, A10, Residence | ||
| RIPPER | A1, A2, A3, A4, A5, A6, A7, A8, A9, A10, Age, Residence, User | ||
| RFE | A1, A2, A4, A6, A7, A8, A9, A10, Age, Residence, Used_App_Before | ||
| Intersect | A1, A2, A3, A4, A5, A6, A7, A8, A9, A10, Age, Residence, User |
| NB | BG | CART | KNN | C4.5 | KS | SVM | RT | ||
|---|---|---|---|---|---|---|---|---|---|
| Accuracy | 95.44 | 93.16 | 90.89 | 92.69 | 92.31 | 94.21 | 96.67 | 92.12 | |
| 95.45 | 94.40 | 92.03 | 94.30 | 92.59 | 95.25 | 97.62 | 92.78 | ||
| 96.39 | 92.59 | 91.17 | 94.97 | 91.74 | 95.16 | 96.67 | 92.97 | ||
| 95.45 | 94.49 | 92.12 | 95.25 | 92.59 | 95.63 | 97.82 | 92.88 | ||
| 95.25 | 93.92 | 92.12 | 94.30 | 92.31 | 95.25 | 95.63 | 93.73 | ||
| 95.16 | 94.21 | 92.12 | 95.92 | 92.78 | 95.92 | 97.62 | 93.45 | ||
| Kappa Stat. | 89.50 | 83.88 | 78.32 | 83.20 | 81.84 | 86.62 | 92.21 | 81.46 | |
| 89.55 | 86.71 | 81.09 | 86.90 | 82.47 | 89.08 | 94.43 | 83.18 | ||
| 91.59 | 82.41 | 79.15 | 88.38 | 80.60 | 88.78 | 92.20 | 83.46 | ||
| 89.85 | 86.92 | 81.30 | 89.08 | 82.47 | 89.96 | 94.87 | 83.44 | ||
| 88.80 | 85.62 | 81.55 | 86.96 | 81.84 | 89.01 | 89.54 | 85.52 | ||
| 88.91 | 86.28 | 81.27 | 90.57 | 82.92 | 90.59 | 94.43 | 84.77 | ||
| F1-Score | 95.50 | 93.10 | 90.80 | 92.80 | 92.30 | 94.20 | 96.70 | 92.10 | |
| 95.50 | 94.40 | 92.00 | 94.40 | 92.60 | 95.30 | 97.60 | 92.80 | ||
| 96.40 | 92.50 | 91.10 | 95.00 | 91.70 | 95.20 | 96.70 | 93.00 | ||
| 95.50 | 94.50 | 92.10 | 95.30 | 92.60 | 95.70 | 97.80 | 92.90 | ||
| 95.20 | 93.90 | 92.10 | 94.40 | 92.30 | 95.30 | 95.60 | 93.80 | ||
| 95.20 | 94.20 | 92.10 | 95.90 | 92.70 | 95.90 | 97.60 | 93.50 | ||
| AUROC | 99.50 | 98.00 | 91.70 | 94.20 | 92.50 | 98.80 | 96.00 | 90.70 | |
| 99.70 | 98.20 | 92.30 | 96.00 | 93.00 | 99.30 | 97.00 | 91.70 | ||
| 99.50 | 97.80 | 91.60 | 96.90 | 92.40 | 99.20 | 95.90 | 91.40 | ||
| 99.60 | 98.20 | 92.30 | 96.60 | 93.00 | 99.40 | 97.20 | 9.20 | ||
| 99.10 | 98.20 | 91.30 | 98.50 | 93.20 | 99.20 | 93.70 | 94.20 | ||
| 99.60 | 98.20 | 92.40 | 97.30 | 93.30 | 99.50 | 97.00 | 92.60 |
| NB | BG | CART | KNN | C4.5 | KS | SVM | RT | ||
|---|---|---|---|---|---|---|---|---|---|
| Accuracy | 93.12 | 80.94 | 83.71 | 88.61 | 89.39 | 87.22 | 95.48 | 80.74 | |
| 94.69 | 81.92 | 83.69 | 92.92 | 89.78 | 93.12 | 95.87 | 78.58 | ||
| 93.51 | 90.96 | 90.37 | 94.69 | 90.76 | 95.48 | 99.61 | 92.92 | ||
| 93.51 | 90.96 | 89.98 | 92.73 | 89.98 | 93.12 | 98.23 | 90.77 | ||
| 88.99 | 86.05 | 87.22 | 89.19 | 88.99 | 89.19 | 91.35 | 85.65 | ||
| 93.51 | 90.96 | 90.37 | 94.69 | 90.77 | 95.48 | 99.61 | 92.93 | ||
| Kappa Stat. | 86.24 | 61.88 | 65.45 | 77.19 | 78.78 | 74.43 | 90.96 | 61.47 | |
| 89.38 | 63.85 | 67.39 | 85.85 | 79.57 | 86.23 | 91.74 | 57.13 | ||
| 87.02 | 81.92 | 80.75 | 89.38 | 81.53 | 90.95 | 99.21 | 85.85 | ||
| 87.02 | 81.92 | 79.96 | 85.45 | 79.96 | 86.23 | 96.46 | 81.53 | ||
| 77.99 | 72.10 | 74.46 | 78.38 | 77.99 | 78.37 | 82.71 | 71.31 | ||
| 87.02 | 81.92 | 80.75 | 89.38 | 81.53 | 90.95 | 99.21 | 85.85 | ||
| F1-Score | 93.01 | 80.90 | 82.70 | 88.60 | 89.04 | 87.20 | 95.50 | 80.70 | |
| 94.70 | 81.90 | 83.70 | 92.60 | 89.80 | 93.10 | 95.90 | 78.50 | ||
| 93.20 | 90.90 | 90.40 | 94.50 | 90.70 | 95.20 | 99.60 | 92.90 | ||
| 93.50 | 91.00 | 90.00 | 92.70 | 90.00 | 93.10 | 98.20 | 90.80 | ||
| 88.80 | 86.10 | 87.20 | 89.00 | 88.80 | 88.50 | 91.20 | 85.40 | ||
| 93.50 | 91.00 | 90.04 | 94.70 | 90.80 | 95.50 | 99.60 | 92.90 | ||
| AUROC | 98.40 | 88.60 | 85.20 | 90.70 | 91.70 | 95.80 | 95.40 | 81.90 | |
| 99.00 | 89.20 | 85.90 | 94.50 | 93.00 | 98.10 | 95.80 | 79.40 | ||
| 99.20 | 97.80 | 94.00 | 99.00 | 93.60 | 99.60 | 99.60 | 92.90 | ||
| 99.20 | 97.90 | 93.60 | 98.10 | 92.70 | 99.40 | 98.20 | 90.80 | ||
| 96.20 | 95.20 | 91.40 | 94.20 | 92.10 | 96.50 | 91.30 | 87.40 | ||
| 99.20 | 97.80 | 94.00 | 99.00 | 93.80 | 99.60 | 99.60 | 92.90 |
| NB | BG | CART | KNN | C4.5 | KS | SVM | RT | ||
|---|---|---|---|---|---|---|---|---|---|
| Accuracy | 93.12 | 80.94 | 82.71 | 88.61 | 89.39 | 87.22 | 95.48 | 80.74 | |
| 94.69 | 81.92 | 83.69 | 92.92 | 89.78 | 93.12 | 95.87 | 78.58 | ||
| 89.91 | 85.08 | 81.04 | 91.93 | 82.66 | 91.53 | 89.51 | 86.69 | ||
| 91.94 | 87.90 | 79.84 | 91.52 | 80.65 | 92.74 | 94.76 | 86.29 | ||
| 87.09 | 75.00 | 78.22 | 88.30 | 81.85 | 88.70 | 89.51 | 78.22 | ||
| 92.74 | 87.90 | 81.05 | 91.94 | 81.05 | 91.13 | 93.95 | 89.11 | ||
| Kappa Stat. | 89.24 | 61.88 | 65.45 | 77.19 | 78.78 | 74.43 | 90.96 | 61.47 | |
| 89.38 | 63.85 | 67.39 | 85.85 | 79.57 | 86.23 | 91.74 | 57.13 | ||
| 79.78 | 70.14 | 62.08 | 83.84 | 65.31 | 83.00 | 79.02 | 73.31 | ||
| 83.84 | 75.79 | 59.69 | 83.04 | 61.30 | 85.44 | 89.50 | 72.55 | ||
| 74.12 | 49.89 | 56.34 | 76.56 | 63.70 | 77.34 | 78.95 | 56.41 | ||
| 85.44 | 75.79 | 62.11 | 83.85 | 62.10 | 82.20 | 87.90 | 78.19 | ||
| F1-Score | 93.10 | 80.90 | 82.70 | 88.60 | 89.40 | 87.20 | 95.50 | 80.70 | |
| 94.70 | 81.90 | 83.70 | 92.90 | 89.80 | 93.10 | 95.90 | 78.50 | ||
| 89.20 | 84.60 | 80.70 | 91.50 | 82.30 | 90.70 | 89.30 | 85.70 | ||
| 91.90 | 87.90 | 79.80 | 91.50 | 80.60 | 92.70 | 94.80 | 86.30 | ||
| 86.10 | 73.50 | 76.70 | 87.60 | 81.50 | 87.70 | 88.40 | 77.50 | ||
| 92.70 | 87.90 | 81.00 | 91.90 | 81.10 | 91.10 | 94.00 | 89.10 | ||
| AUROC | 98.40 | 88.60 | 85.20 | 90.70 | 91.70 | 95.80 | 95.40 | 81.90 | |
| 99.00 | 89.20 | 85.90 | 94.50 | 93.00 | 98.10 | 95.80 | 79.40 | ||
| 93.20 | 96.90 | 82.00 | 95.60 | 81.70 | 97.90 | 89.50 | 87.00 | ||
| 98.60 | 95.70 | 79.60 | 94.60 | 79.80 | 98.30 | 94.70 | 86.30 | ||
| 95.50 | 83.00 | 81.90 | 90.20 | 82.50 | 5.20 | 89.30 | 80.10 | ||
| 98.30 | 95.70 | 79.50 | 94.90 | 80.60 | 98.60 | 94.00 | 89.10 |
| NB | BG | CART | KNN | C4.5 | KS | SVM | RT | ||
|---|---|---|---|---|---|---|---|---|---|
| Accuracy | 94.18 | 87.56 | 89.26 | 91.94 | 93.02 | 92.66 | 96.06 | 85.15 | |
| 94.38 | 87.57 | 89.17 | 93.2 | 92.75 | 93.29 | 96.60 | 87.20 | ||
| 95.52 | 87.47 | 89.53 | 96.69 | 93.02 | 97.31 | 99.82 | 87.83 | ||
| 95.34 | 87.50 | 88.99 | 94.99 | 92.66 | 94.45 | 96.42 | 88.90 | ||
| 92.30 | 85.51 | 88.46 | 90.78 | 90.33 | 91.05 | 91.68 | 85.51 | ||
| 95.34 | 87.50 | 88.99 | 94.99 | 92.66 | 94.45 | 96.42 | 88.90 | ||
| Kappa Stat. | 86.93 | 71.16 | 75.45 | 81.86 | 83.81 | 83.52 | 90.89 | 66.29 | |
| 87.31 | 71.21 | 75.30 | 84.52 | 83.25 | 84.87 | 92.13 | 70.77 | ||
| 89.85 | 71.02 | 76.12 | 92.44 | 83.76 | 93.93 | 99.59 | 72.30 | ||
| 89.46 | 71.21 | 74.90 | 88.60 | 83.05 | 87.52 | 91.67 | 74.49 | ||
| 82.46 | 66.12 | 73.28 | 78.76 | 77.58 | 79.58 | 80.21 | 67.11 | ||
| 89.46 | 71.21 | 74.90 | 88.60 | 83.05 | 87.52 | 91.67 | 74.49 | ||
| F1-Score | 94.20 | 87.50 | 89.30 | 92.00 | 93.00 | 92.70 | 96.00 | 85.20 | |
| 96.70 | 90.80 | 92.80 | 97.60 | 94.90 | 98.00 | 99.90 | 91.00 | ||
| 95.40 | 87.51 | 89.00 | 95.00 | 92.60 | 94.50 | 96.40 | 88.90 | ||
| 94.30 | 89.50 | 91.60 | 93.20 | 93.00 | 93.40 | 94.10 | 89.20 | ||
| 95.40 | 87.51 | 89.00 | 95.00 | 92.60 | 94.50 | 96.40 | 88.90 | ||
| AUROC | 99.00 | 94.20 | 91.90 | 92.70 | 95.70 | 97.70 | 95.10 | 85.70 | |
| 99.20 | 94.21 | 92.50 | 93.70 | 95.80 | 98.50 | 95.70 | 86.40 | ||
| 99.50 | 94.40 | 92.70 | 99.10 | 96.10 | 99.70 | 99.80 | 87.00 | ||
| 99.50 | 94.30 | 91.60 | 95.70 | 95.80 | 99.00 | 95.20 | 88.20 | ||
| 97.90 | 92.20 | 90.10 | 91.90 | 92.30 | 97.50 | 88.70 | 85.00 | ||
| 99.50 | 94.30 | 91.60 | 95.70 | 95.80 | 99.00 | 95.20 | 88.20 |
| NB | BG | CART | KNN | C4.5 | KS | SVM | RT | |
|---|---|---|---|---|---|---|---|---|
| NB | 0.0211 ** | 0.0211 ** | 0.0592 * | 0.0179 ** | 0.2643 | 1.0000 | 0.0211 ** | |
| BG | 1.0000 | 0.0211 ** | 1.0000 | 0.0211 ** | 1.0000 | 1.0000 | 0.0592 * | |
| CART | 1.0000 | 1.0000 | 1.0000 | 1.0000 | 1.0000 | 1.0000 | 1.0000 | |
| KNN | 1.0000 | 0.1422 | 0.0179 ** | 0.0211 ** | 1.0000 | 1.0000 | 0.1787 | |
| C4.5 | 1.0000 | 1.0000 | 0.0211 ** | 1.0000 | 1.0000 | 1.0000 | 1.0000 | |
| KS | 1.0000 | 0.0211 ** | 0.0211 ** | 0.0256 ** | 0.0211 ** | 1.0000 | 0.1787 | |
| SVM | 0.0211 ** | 0.0211 ** | 0.1787 | 0.1787 | 0.0211 ** | 0.0211 ** | 0.0211 ** | |
| RT | 1.0000 | 1.0000 | 0.0211 ** | 1.0000 | 0.0408 ** | 1.0000 | 1.0000 |
| NB | BG | CART | KNN | C4.5 | KS | SVM | RT | |
|---|---|---|---|---|---|---|---|---|
| NB | 0.0211 ** | 0.0211 ** | 0.0592 * | 0.0211 ** | 0.4017 | 1.0000 | 0.0211 ** | |
| BG | 1.0000 | 0.0211 ** | 1.0000 | 0.0211 ** | 1.0000 | 1.0000 | 0.0592 * | |
| CART | 1.0000 | 1.0000 | 1.0000 | 1.0000 | 1.0000 | 1.0000 | 1.0000 | |
| KNN | 1.0000 | 0.0592 * | 0.0211 ** | 0.0211 ** | 1.0000 | 1.0000 | 0.0211 ** | |
| C4.5 | 1.0000 | 1.0000 | 0.0211 | 1.0000 | 1.0000 | 1.0000 | 1.0000 | |
| KS | 1.0000 | 0.0211 ** | 0.0211 ** | 0.0211 ** | 0.0211 ** | 1.0000 | 0.0211 ** | |
| SVM | 0.0211 ** | 0.0211 ** | 0.0211 ** | 0.0211 ** | 0.0211 ** | 0.0211 ** | 0.0211 ** | |
| RT | 1.0000 | 1.0000 | 0.0211 | 1.0000 | 0.0360 ** | 1.0000 | 1.0000 |
| NB | BG | CART | KNN | C4.5 | KS | SVM | RT | |
|---|---|---|---|---|---|---|---|---|
| NB | 0.0179 ** | 0.0179 ** | 0.0592 * | 0.0100 *** | 0.4511 | 1.0000 | 0.0179 ** | |
| BG | 1.0000 | 0.0179 ** | 1.0000 | 0.0179 ** | 1.0000 | 1.0000 | 0.5917 | |
| CART | 1.0000 | 1.0000 | 1.0000 | 1.0000 | 1.0000 | 1.0000 | 1.0000 | |
| KNN | 1.0000 | 0.0591 * | 0.0211 ** | 0.0211 ** | 1.0000 | 1.0000 | 0.0211 ** | |
| C4.5 | 1.0000 | 1.0000 | 0.0179 ** | 1.0000 | 1.0000 | 1.0000 | 1.0000 | |
| KS | 1.0000 | 0.0211 ** | 0.0211 ** | 0.0256 ** | 0.0211 ** | 1.0000 | 0.0211 ** | |
| SVM | 0.0211 ** | 0.0211 ** | 0.0211 ** | 0.0211 ** | 0.1787 | 0.0211 ** | 0.0211 ** | |
| RT | 1.0000 | 1.0000 | 0.0211 ** | 1.0000 | 0.0408 ** | 1.0000 | 1.0000 |
| NB | BG | CART | KNN | C4.5 | KS | SVM | RT | |
|---|---|---|---|---|---|---|---|---|
| NB | 0.0149 ** | 0.0179 ** | 0.0211 ** | 0.0211 ** | 0.0592 * | 0.0211 ** | 0.0211 ** | |
| BG | 1.0000 | 0.0179 ** | 0.0360 ** | 0.0179 ** | 1.0000 | 0.0179 ** | 0.0211 ** | |
| CART | 1.0000 | 1.0000 | 1.0000 | 1.0000 | 1.0000 | 1.0000 | 0.3326 | |
| KNN | 1.0000 | 1.0000 | 0.0211 ** | 0.0211 ** | 1.0000 | 0.9143 | 0.0179 ** | |
| C4.5 | 1.0000 | 1.0000 | 0.0179 ** | 1.0000 | 1.0000 | 1.0000 | 0.0672 * | |
| KS | 1.0000 | 0.0211 ** | 0.0179 ** | 0.0211 ** | 0.0179 ** | 0.0211 ** | 0.0211 ** | |
| SVM | 1.0000 | 1.0000 | 0.0211 ** | 0.9143 | 0.0179 ** | 1.0000 | 0.0313 ** | |
| RT | 1.0000 | 1.0000 | 1.0000 | 1.0000 | 1.0000 | 1.0000 | 1.0000 |
| NB | BG | CART | KNN | C4.5 | KS | SVM | RT | |
|---|---|---|---|---|---|---|---|---|
| NB | 0.0100 *** | 0.0179 ** | 0.5183 | 0.0310 ** | 0.8295 | 1.0000 | 0.0211 ** | |
| BG | 1.0000 | 1.0000 | 1.0000 | 1.0000 | 1.0000 | 1.0000 | 0.6750 | |
| CART | 1.0000 | 0.2817 | 1.0000 | 1.0000 | 1.0000 | 1.0000 | 0.5294 | |
| KNN | 1.0000 | 0.0179 ** | 0.0179 ** | 0.0592 * | 1.0000 | 1.0000 | 0.0211 ** | |
| C4.5 | 1.0000 | 0.2945 | 0.0310 ** | 1.0000 | 1.0000 | 1.0000 | 0.2945 | |
| KS | 1.0000 | 0.0179 ** | 0.0179 ** | 0.4024 | 0.0592 ** | 1.0000 | 0.0211 ** | |
| SVM | 0.0149 ** | 0.0179 ** | 0.0179 ** | 0.0179 ** | 0.0179 ** | 0.0179 ** | 0.0211 ** | |
| RT | 1.0000 | 1.0000 | 1.0000 | 1.0000 | 1.0000 | 1.0000 | 1.0000 |
| NB | BG | CART | KNN | C4.5 | KS | SVM | RT | |
|---|---|---|---|---|---|---|---|---|
| NB | 0.0100 *** | 0.0179 ** | 0.5183 | 0.0256 ** | 0.8295 | 1.0000 | 0.0179 ** | |
| BG | 1.0000 | 1.0000 | 1.0000 | 1.0000 | 1.0000 | 1.0000 | 0.6668 | |
| CART | 1.0000 | 0.2817 | 1.0000 | 1.0000 | 1.0000 | 1.0000 | 0.8295 | |
| KNN | 1.0000 | 0.0179 ** | 0.0179 ** | 0.0527 * | 1.0000 | 1.0000 | 0.0179 ** | |
| C4.5 | 1.0000 | 0.2817 | 0.0256 ** | 1.0000 | 1.0000 | 1.0000 | 0.2817 | |
| KS | 1.0000 | 0.0179 ** | 0.0179 ** | 0.3891 | 0.0527 * | 1.0000 | 0.0179 ** | |
| SVM | 0.0149 ** | 0.0179 ** | 0.0179 ** | 0.0179 ** | 0.0179 ** | 0.0179 ** | 0.0179 ** | |
| RT | 1.0000 | 1.0000 | 1.0000 | 1.0000 | 1.0000 | 1.0000 | 1.0000 |
| NB | BG | CART | KNN | C4.5 | KS | SVM | RT | |
|---|---|---|---|---|---|---|---|---|
| NB | 0.0179 ** | 0.0179 ** | 0.5294 | 0.0310 ** | 0.6668 | 1.0000 | 0.0211 ** | |
| BG | 1.0000 | 0.0850 * | 1.0000 | 1.0000 | 1.0000 | 1.0000 | 0.6668 | |
| CART | 1.0000 | 1.0000 | 1.0000 | 1.0000 | 1.0000 | 1.0000 | 1.0000 | |
| KNN | 1.0000 | 0.0211 ** | 0.0211 ** | 0.0592 * | 1.0000 | 1.0000 | 0.0211 ** | |
| C4.5 | 1.0000 | 0.2817 | 0.0211 ** | 1.0000 | 1.0000 | 1.0000 | 0.2945 | |
| KS | 1.0000 | 0.0211 ** | 0.0179 ** | 0.5904 | 0.0935 * | 1.0000 | 0.0179 ** | |
| SVM | 0.0211 ** | 0.0211 ** | 0.0179 ** | 0.0211 ** | 0.0211 ** | 0.0211 ** | 0.0179 ** | |
| RT | 1.0000 | 1.0000 | 0.1318 | 1.0000 | 1.0000 | 1.0000 | 1.0000 |
| NB | BG | CART | KNN | C4.5 | KS | SVM | RT | |
|---|---|---|---|---|---|---|---|---|
| NB | 0.0179 ** | 0.0100 *** | 0.0179 ** | 0.0211 ** | 0.8295 | 0.0850 * | 0.0211 ** | |
| BG | 1.0000 | 0.0179 ** | 1.0000 | 0.1617 | 1.0000 | 1.0000 | 0.0211 ** | |
| CART | 1.0000 | 1.0000 | 1.0000 | 1.0000 | 1.0000 | 1.0000 | 1.0000 | |
| KNN | 1.0000 | 0.0527 * | 0.0179 ** | 0.0360 ** | 1.0000 | 1.0000 | 0.0211 ** | |
| C4.5 | 1.0000 | 1.0000 | 0.0211 ** | 1.0000 | 1.0000 | 1.0000 | 0.0211 ** | |
| KS | 1.0000 | 0.0179 ** | 0.0179 ** | 0.0179 ** | 0.0211 ** | 0.0464 ** | 0.0211 ** | |
| SVM | 1.0000 | 0.1318 | 0.0179 ** | 0.1964 | 0.0360 ** | 1.0000 | 0.0211 ** | |
| RT | 1.0000 | 1.0000 | 0.0935 * | 1.0000 | 1.0000 | 1.0000 | 1.0000 |
| NB | BG | CART | KNN | C4.5 | KS | SVM | RT | |
|---|---|---|---|---|---|---|---|---|
| NB | 0.0179 ** | 0.0100 *** | 0.0179 ** | 0.0211 ** | 0.8295 | 0.0850 * | 0.0211 ** | |
| BG | 1.0000 | 0.0179 ** | 1.0000 | 0.1617 | 1.0000 | 1.0000 | 0.0211 ** | |
| CART | 1.0000 | 1.0000 | 1.0000 | 1.0000 | 1.0000 | 1.0000 | 1.0000 | |
| KNN | 1.0000 | 0.0527 * | 0.0179 ** | 0.0360 ** | 1.0000 | 1.0000 | 0.0211 ** | |
| C4.5 | 1.0000 | 1.0000 | 0.0211 ** | 1.0000 | 1.0000 | 1.0000 | 0.0211 ** | |
| KS | 1.0000 | 0.0179 ** | 0.0179 ** | 0.0179 ** | 0.0211 ** | 0.0464 * | 0.0211 ** | |
| SVM | 1.0000 | 0.1318 | 0.0179 ** | 0.1964 | 0.0360 ** | 1.0000 | 0.0211 ** | |
| RT | 1.0000 | 1.0000 | 0.0935 * | 1.0000 | 1.0000 | 1.0000 | 1.0000 |
| NB | BG | CART | KNN | C4.5 | KS | SVM | RT | |
|---|---|---|---|---|---|---|---|---|
| NB | 0.0211 ** | 0.0211 ** | 0.5294 | 0.0211 ** | 0.5183 | 1.0000 | 0.0211 ** | |
| BG | 1.0000 | 0.2945 | 1.0000 | 1.0000 | 1.0000 | 1.0000 | 0.8339 | |
| CART | 1.0000 | 1.0000 | 1.0000 | 1.0000 | 1.0000 | 1.0000 | 1.0000 | |
| KNN | 1.0000 | 0.0211 ** | 0.0211 ** | 0.0360 ** | 0.5294 | 1.0000 | 0.0211 ** | |
| C4.5 | 1.0000 | 0.4017 | 0.0360 ** | 1.0000 | 1.0000 | 1.0000 | 0.6750 | |
| KS | 1.0000 | 0.0211 ** | 0.0211 ** | 1.0000 | 0.0360 ** | 1.0000 | 0.0211 ** | |
| SVM | 0.0360 | 0.0211 ** | 0.0211 ** | 0.0935 | 0.0211 ** | 0.0592 * | 0.0211 ** | |
| RT | 1.0000 | 1.0000 | 0.2084 | 1.0000 | 1.0000 | 1.0000 | 1.0000 |
| NB | BG | CART | KNN | C4.5 | KS | SVM | RT | |
|---|---|---|---|---|---|---|---|---|
| NB | 0.0211 ** | 0.0211 ** | 0.5294 | 0.0211 ** | 0.3488 | 1.0000 | 0.0211 ** | |
| BG | 1.0000 | 0.2817 | 1.0000 | 1.0000 | 1.0000 | 1.0000 | 1.0000 | |
| CART | 1.0000 | 1.0000 | 1.0000 | 1.0000 | 1.0000 | 1.0000 | 1.0000 | |
| KNN | 1.0000 | 0.0211 ** | 0.0211 ** | 0.0360 ** | 0.5294 | 1.0000 | 0.0211 ** | |
| C4.5 | 1.0000 | 0.2945 | 0.0211 ** | 1.0000 | 1.0000 | 1.0000 | 0.5294 | |
| KS | 1.0000 | 0.0211 ** | 0.0211 ** | 1.0000 | 0.0360 ** | 1.0000 | 0.0211 ** | |
| SVM | 0.0211 ** | 0.0211 ** | 0.0211 ** | 0.0935 * | 0.0211 ** | 0.0592 * | 0.0211 ** | |
| RT | 1.0000 | 0.8339 | 0.2945 | 1.0000 | 1.0000 | 1.0000 | 1.0000 |
| NB | BG | CART | KNN | C4.5 | KS | SVM | RT | |
|---|---|---|---|---|---|---|---|---|
| NB | 0.0935 * | 0.0211 ** | 0.0360 ** | 0.0211 ** | 0.0360 ** | 0.0211 ** | 0.0211 ** | |
| BG | 1.0000 | 0.0211 ** | 1.0000 | 0.0208 ** | 1.0000 | 1.0000 | 0.0211 ** | |
| CART | 1.0000 | 1.0000 | 1.0000 | 1.0000 | 1.0000 | 1.0000 | 1.0000 | |
| KNN | 1.0000 | 0.2945 | 0.0211 ** | 0.0360 ** | 1.0000 | 0.8295 | 0.0211 ** | |
| C4.5 | 1.0000 | 1.0000 | 0.0592 * | 1.0000 | 1.0000 | 1.0000 | 0.6750 | |
| KS | 1.0000 | 0.2945 | 0.2945 | 0.2945 | 0.2945 | 0.2945 | 0.2945 | |
| SVM | 1.0000 | 0.6750 | 0.0211 ** | 1.0000 | 0.0211 ** | 1.0000 | 0.0211 ** | |
| RT | 1.0000 | 1.0000 | 0.4017 | 1.0000 | 1.0000 | 1.0000 | 1.0000 |
| NB | BG | CART | KNN | C4.5 | KS | SVM | RT | |
|---|---|---|---|---|---|---|---|---|
| NB | 0.0179 ** | 0.0179 ** | 0.0850 * | 0.0179 ** | 0.2817 | 1.0000 | 0.0179 ** | |
| BG | 1.0000 | 1.0000 | 1.0000 | 1.0000 | 1.0000 | 1.0000 | 1.0000 | |
| CART | 1.0000 | 0.0179 ** | 1.0000 | 1.0000 | 1.0000 | 1.0000 | 0.0179 ** | |
| KNN | 1.0000 | 0.0179 ** | 0.0179 ** | 0.0767 * | 1.0000 | 1.0000 | 0.0179 ** | |
| C4.5 | 1.0000 | 0.0179 ** | 0.0179 ** | 1.0000 | 1.0000 | 1.0000 | 0.0179 ** | |
| KS | 1.0000 | 0.0179 ** | 0.0179 ** | 0.3891 | 0.0313 ** | 1.0000 | 0.0179 ** | |
| SVM | 0.0313 ** | 0.0179 ** | 0.0179 ** | 0.0179 ** | 0.0179 ** | 0.0179 ** | 0.0179 ** | |
| RT | 1.0000 | 0.7802 | 1.0000 | 1.0000 | 1.0000 | 1.0000 |
| NB | BG | CART | KNN | C4.5 | KS | SVM | RT | |
|---|---|---|---|---|---|---|---|---|
| NB | 0.0179 ** | 0.0179 ** | 0.0850 * | 0.0179 ** | 0.2817 | 1.0000 | 0.0179 ** | |
| BG | 1.0000 | 1.0000 | 1.0000 | 1.0000 | 1.0000 | 1.0000 | 1.0000 | |
| CART | 1.0000 | 0.0179 ** | 1.0000 | 1.0000 | 1.0000 | 1.0000 | 0.0179 ** | |
| KNN | 1.0000 | 0.0179 ** | 0.0179 ** | 0.0767 * | 1.0000 | 1.0000 | 0.0179 ** | |
| C4.5 | 1.0000 | 0.0179 ** | 0.0179 ** | 1.0000 | 1.0000 | 1.0000 | 0.0179 ** | |
| KS | 1.0000 | 0.0179 ** | 0.0179 ** | 0.3891 | 0.0313 ** | 1.0000 | 0.0179 ** | |
| SVM | 0.0313 | 0.0179 ** | 0.0179 ** | 0.0179 ** | 0.0179 ** | 0.0179 ** | 0.0179 ** | |
| RT | 1.0000 | 0.3891 | 1.0000 | 1.0000 | 1.0000 | 1.0000 | 1.0000 |
| NB | BG | CART | KNN | C4.5 | KS | SVM | RT | |
|---|---|---|---|---|---|---|---|---|
| NB | 0.0256 ** | 0.0256 ** | 0.1629 | 0.0256 ** | 0.2643 | 1.0000 | 0.0256 ** | |
| BG | 1.0000 | 1.0000 | 1.0000 | 1.0000 | 1.0000 | 1.0000 | 1.0000 | |
| CART | 1.0000 | 0.0256 ** | 1.0000 | 1.0000 | 1.0000 | 1.0000 | 0.0256 ** | |
| KNN | 1.0000 | 0.0256 ** | 0.0256 ** | 0.0940 | 1.0000 | 1.0000 | 0.0256 ** | |
| C4.5 | 1.0000 | 0.0256 ** | 0.0256 ** | 1.0000 | 1.0000 | 1.0000 | 0.0256 ** | |
| KS | 1.0000 | 0.0256 ** | 0.0256 ** | 0.7802 | 0.0507 * | 1.0000 | 0.0256 ** | |
| SVM | 0.0507 * | 0.0256 ** | 0.0256 ** | 0.0256 ** | 0.0256 ** | 0.0126 ** | 0.0256 ** | |
| RT | 1.0000 | 0.7802 | 1.0000 | 1.0000 | 1.0000 | 1.0000 | 1.0000 |
| NB | BG | CART | KNN | C4.5 | KS | SVM | RT | |
|---|---|---|---|---|---|---|---|---|
| NB | 0.0179 ** | 0.0179 ** | 0.0179 ** | 0.0149 ** | 0.0313 ** | 0.0313 ** | 0.0179 ** | |
| BG | 1.0000 | 0.0179 ** | 1.0000 | 1.0000 | 1.0000 | 1.0000 | 0.0179 ** | |
| CART | 1.0000 | 1.0000 | 1.0000 | 1.0000 | 1.0000 | 1.0000 | 0.0179 ** | |
| KNN | 1.0000 | 0.5183 | 0.0179 ** | 1.0000 | 1.0000 | 1.0000 | 0.0179 ** | |
| C4.5 | 1.0000 | 0.0100 *** | 0.0179 ** | 0.2236 | 1.0000 | 0.2817 | 0.0179 ** | |
| KS | 1.0000 | 0.0149 ** | 0.0100 *** | 0.0179 ** | 0.0179 ** | 0.0313 ** | 0.0179 ** | |
| SVM | 1.0000 | 0.1964 | 0.0313 ** | 0.6668 | 1.0000 | 1.0000 | 0.0179 ** | |
| RT | 1.0000 | 1.0000 | 1.0000 | 1.0000 | 1.0000 | 1.0000 | 1.0000 |
| Dataset | Version | Feature Reduction | Reference | Accuracy (%) | Kappa. (%) | F1 (%) | AUROC (%) |
|---|---|---|---|---|---|---|---|
| Toddler | v1 | No | [57] | - | - | - | - |
| v1 | No | [58] | - | - | - | - | |
| v2 | No | [14] | - | - | - | - | |
| v2 | Yes | Proposed Model | 97.82 | 94.87 | 97.80 | 99.70 | |
| Child | v1 | No | [57] | - | - | - | - |
| v1 | No | [58] | 98.62 | 98.60 | - | - | |
| v2 | No | [14] | - | - | - | - | |
| v2 | Yes | Proposed Model | 99.61 | 99.21 | 99.60 | 99.60 | |
| Adolescent | v1 | No | [57] | - | - | - | - |
| v1 | No | [58] | - | - | - | - | |
| v2 | No | [14] | 99.91 | - | - | - | |
| v2 | Yes | Proposed Model | 95.87 | 91.74 | 95.90 | 99.00 | |
| Adult | v1 | No | [57] | 91.74 | - | - | - |
| v1 | No | [58] | 99.73 | 99.38 | - | - | |
| v2 | No | [14] | 97.58 | - | - | - | |
| v2 | Yes | Proposed Model | 99.82 | 99.59 | 99.90 | 99.80 |
Publisher’s Note: MDPI stays neutral with regard to jurisdictional claims in published maps and institutional affiliations. |
© 2022 by the authors. Licensee MDPI, Basel, Switzerland. This article is an open access article distributed under the terms and conditions of the Creative Commons Attribution (CC BY) license (https://creativecommons.org/licenses/by/4.0/).
Share and Cite
Bala, M.; Ali, M.H.; Satu, M.S.; Hasan, K.F.; Moni, M.A. Efficient Machine Learning Models for Early Stage Detection of Autism Spectrum Disorder. Algorithms 2022, 15, 166. https://doi.org/10.3390/a15050166
Bala M, Ali MH, Satu MS, Hasan KF, Moni MA. Efficient Machine Learning Models for Early Stage Detection of Autism Spectrum Disorder. Algorithms. 2022; 15(5):166. https://doi.org/10.3390/a15050166
Chicago/Turabian StyleBala, Mousumi, Mohammad Hanif Ali, Md. Shahriare Satu, Khondokar Fida Hasan, and Mohammad Ali Moni. 2022. "Efficient Machine Learning Models for Early Stage Detection of Autism Spectrum Disorder" Algorithms 15, no. 5: 166. https://doi.org/10.3390/a15050166
APA StyleBala, M., Ali, M. H., Satu, M. S., Hasan, K. F., & Moni, M. A. (2022). Efficient Machine Learning Models for Early Stage Detection of Autism Spectrum Disorder. Algorithms, 15(5), 166. https://doi.org/10.3390/a15050166