1. Introduction
Parathyroid adenoma belongs to parathyroid proliferative disorders, including parathyroid hyperplasia, parathyroid adenoma, and parathyroid carcinoma [
1]. Approximately 85 per cent of primary hyperparathyroidism (HPPT) is caused by a parathyroid adenoma, followed by parathyroid hyperplasia with a percentage of 15. Parathyroid carcinoma is rare [
2]. However, recent evidence no longer supports the entity of hyperplasia in primary HPPT with multiple abnormal glands and, in this setting, suggests the presence of two or more parathyroid adenomas. Therefore, according to the WHO 2022 classification, the term “hyperplasia” should be confined to secondary HPPT, while primary HPPT should be replaced by “primary HPPT-related multiglandular parathyroid disease” [
3]. Severe secondary HPPT is caused primarily by end-stage renal failure. In this situation, all parathyroid glands (PGs) are enlarged, each to a different degree. Tertiary HPTT denotes the persistence of HPPT after successful renal transplantation.
Despite the current use of calcimimetic drugs, which succeed in lowering serum calcium and parathyroid hormone levels, the definitive cure of HPPT is the surgical excision of abnormal PGs. The surgical approach relies heavily on the imaging modalities’ preoperative localisation of enlarged glands. Preoperative localising methods include neck ultrasound (U/S), parathyroid scintigraphy, dynamic contrast-enhanced computerised tomography, 4-D CT, and magnetic resonance imaging (MRI). Depending on local experience and expertise, U/S and scintigraphy are used first, while 4-D CT and MRI are usually reserved for negative or ambiguous cases.
The radiotracer
99mTc-Sestamibi (MIBI) is injected to perform the dual-phase method in parathyroid scintigraphy. This method involves early acquisition and late acquisition image of the neck and the mediastinum. The early image is acquired 10 min after the MIBI administration and the late image is acquired 2 h post-injection. MIBI uptake by the thyroid gland in the early image may impede the detection of an adenoma. In many abnormal PG cases, prolonged tracer retention is observed. False negative scans may appear due to false clearance of MIBI from particular adenomas or hyperplastic glands. In some cases, the thyroid subtraction method is followed. The latter involves the administration of a second radioactive tracer
123I or
99mTc-pertechnetate for alienating the thyroid gland. The digital subtraction of the thyroid image from the early MIBI and the late MIBI images produces the result. Besides planar images, SPECT or SPECT/CT can increase the method’s sensitivity and offer a more precise localisation of findings in the 3-D space [
4].
Computer-aided diagnostic (CAD) assistance in parathyroid adenoma identification could alleviate human tiredness and routine in everyday clinical practice, allowing medical staff to concentrate on other tasks. Still, human expertise is indispensable to evaluating computer suggestions, which is a much simpler task.
Deep learning (DL) methods have showed great performance in classification and object detection challenges involving medical images. This is due to the encapsulation of myriad potentially essential image features. An intuitive example of the DL implementation is cancer detection frameworks [
5,
6,
7].
Recent clinical studies report novel optical technologies that enhance PGs’ localisation or viability assessment. These technologies could complement the surgeon’s eyes and improve surgical outcomes in thyroidectomy and parathyroidectomy [
8].
McWade et al. [
9] developed an intraoperative technique with near-infrared (NIR) fluorescence for in vivo, real-time detection of the parathyroid glands. Forty-five patients participated in the experiment where NIR fluorescence was measured intraoperatively from patients undergoing parathyroidectomy and thyroidectomy. NIR fluorescence detected the parathyroid in 100% of patients.
Halicek et al. [
10] investigated the precision of hyperspectral imaging (HIS) in 82 ex vivo study cases regarding tumour detection of the thyroid and salivary glands. Tissues were imaged with HSI in broadband reflectance and autofluorescence modes. For comparison, the tissues were imaged with two fluorescent dyes. Deep learning algorithms were developed for tumour detection using histological ground truths. For the classification of thyroid tumours, HSI-synthesized RGB images achieved the best performance with an AUC score of 0.90.
Chen [
11] applied transfer learning [
12] to automatically detect HTTP from ultrasound images annotated by senior radiologists. The authors employed three well-established convolutional neural networks to analyse the images and suggest potential features underlying the presence of HPPT. As a result, they achieved the best recall of 0.956 using a Single shot multibox detector (SSD) [
13].
LeBlack [
14] performed a retrospective review of patients who underwent parathyroidectomy for a single adenoma between 2010–2017. SPECT/CT images were inspected by senior medical staff. The intraoperative report was used as reference for assessing the accuracy obtained by a novel method for localisation using SPECT/CT, which operates by determining the anterior–posterior relationship of the adenoma to a horizontal line in the coronal plane through the tracheoesophageal groove. The study achieved 80% accuracy and 0.706 Cohen’s Kappa score, which verifies the agreement between the method and the original radiology report.
Most of the studies focus on developing surgeon-assisting tools for accurately detecting PGs. Those studies’ contribution to the field is beyond question. However, little has been investigated regarding the non-invasive detection of the parathyroid glands using medical image acquisition devices and before the surgery [
15]. This study extends the reported results in [
16], a study conducted by the same research team.
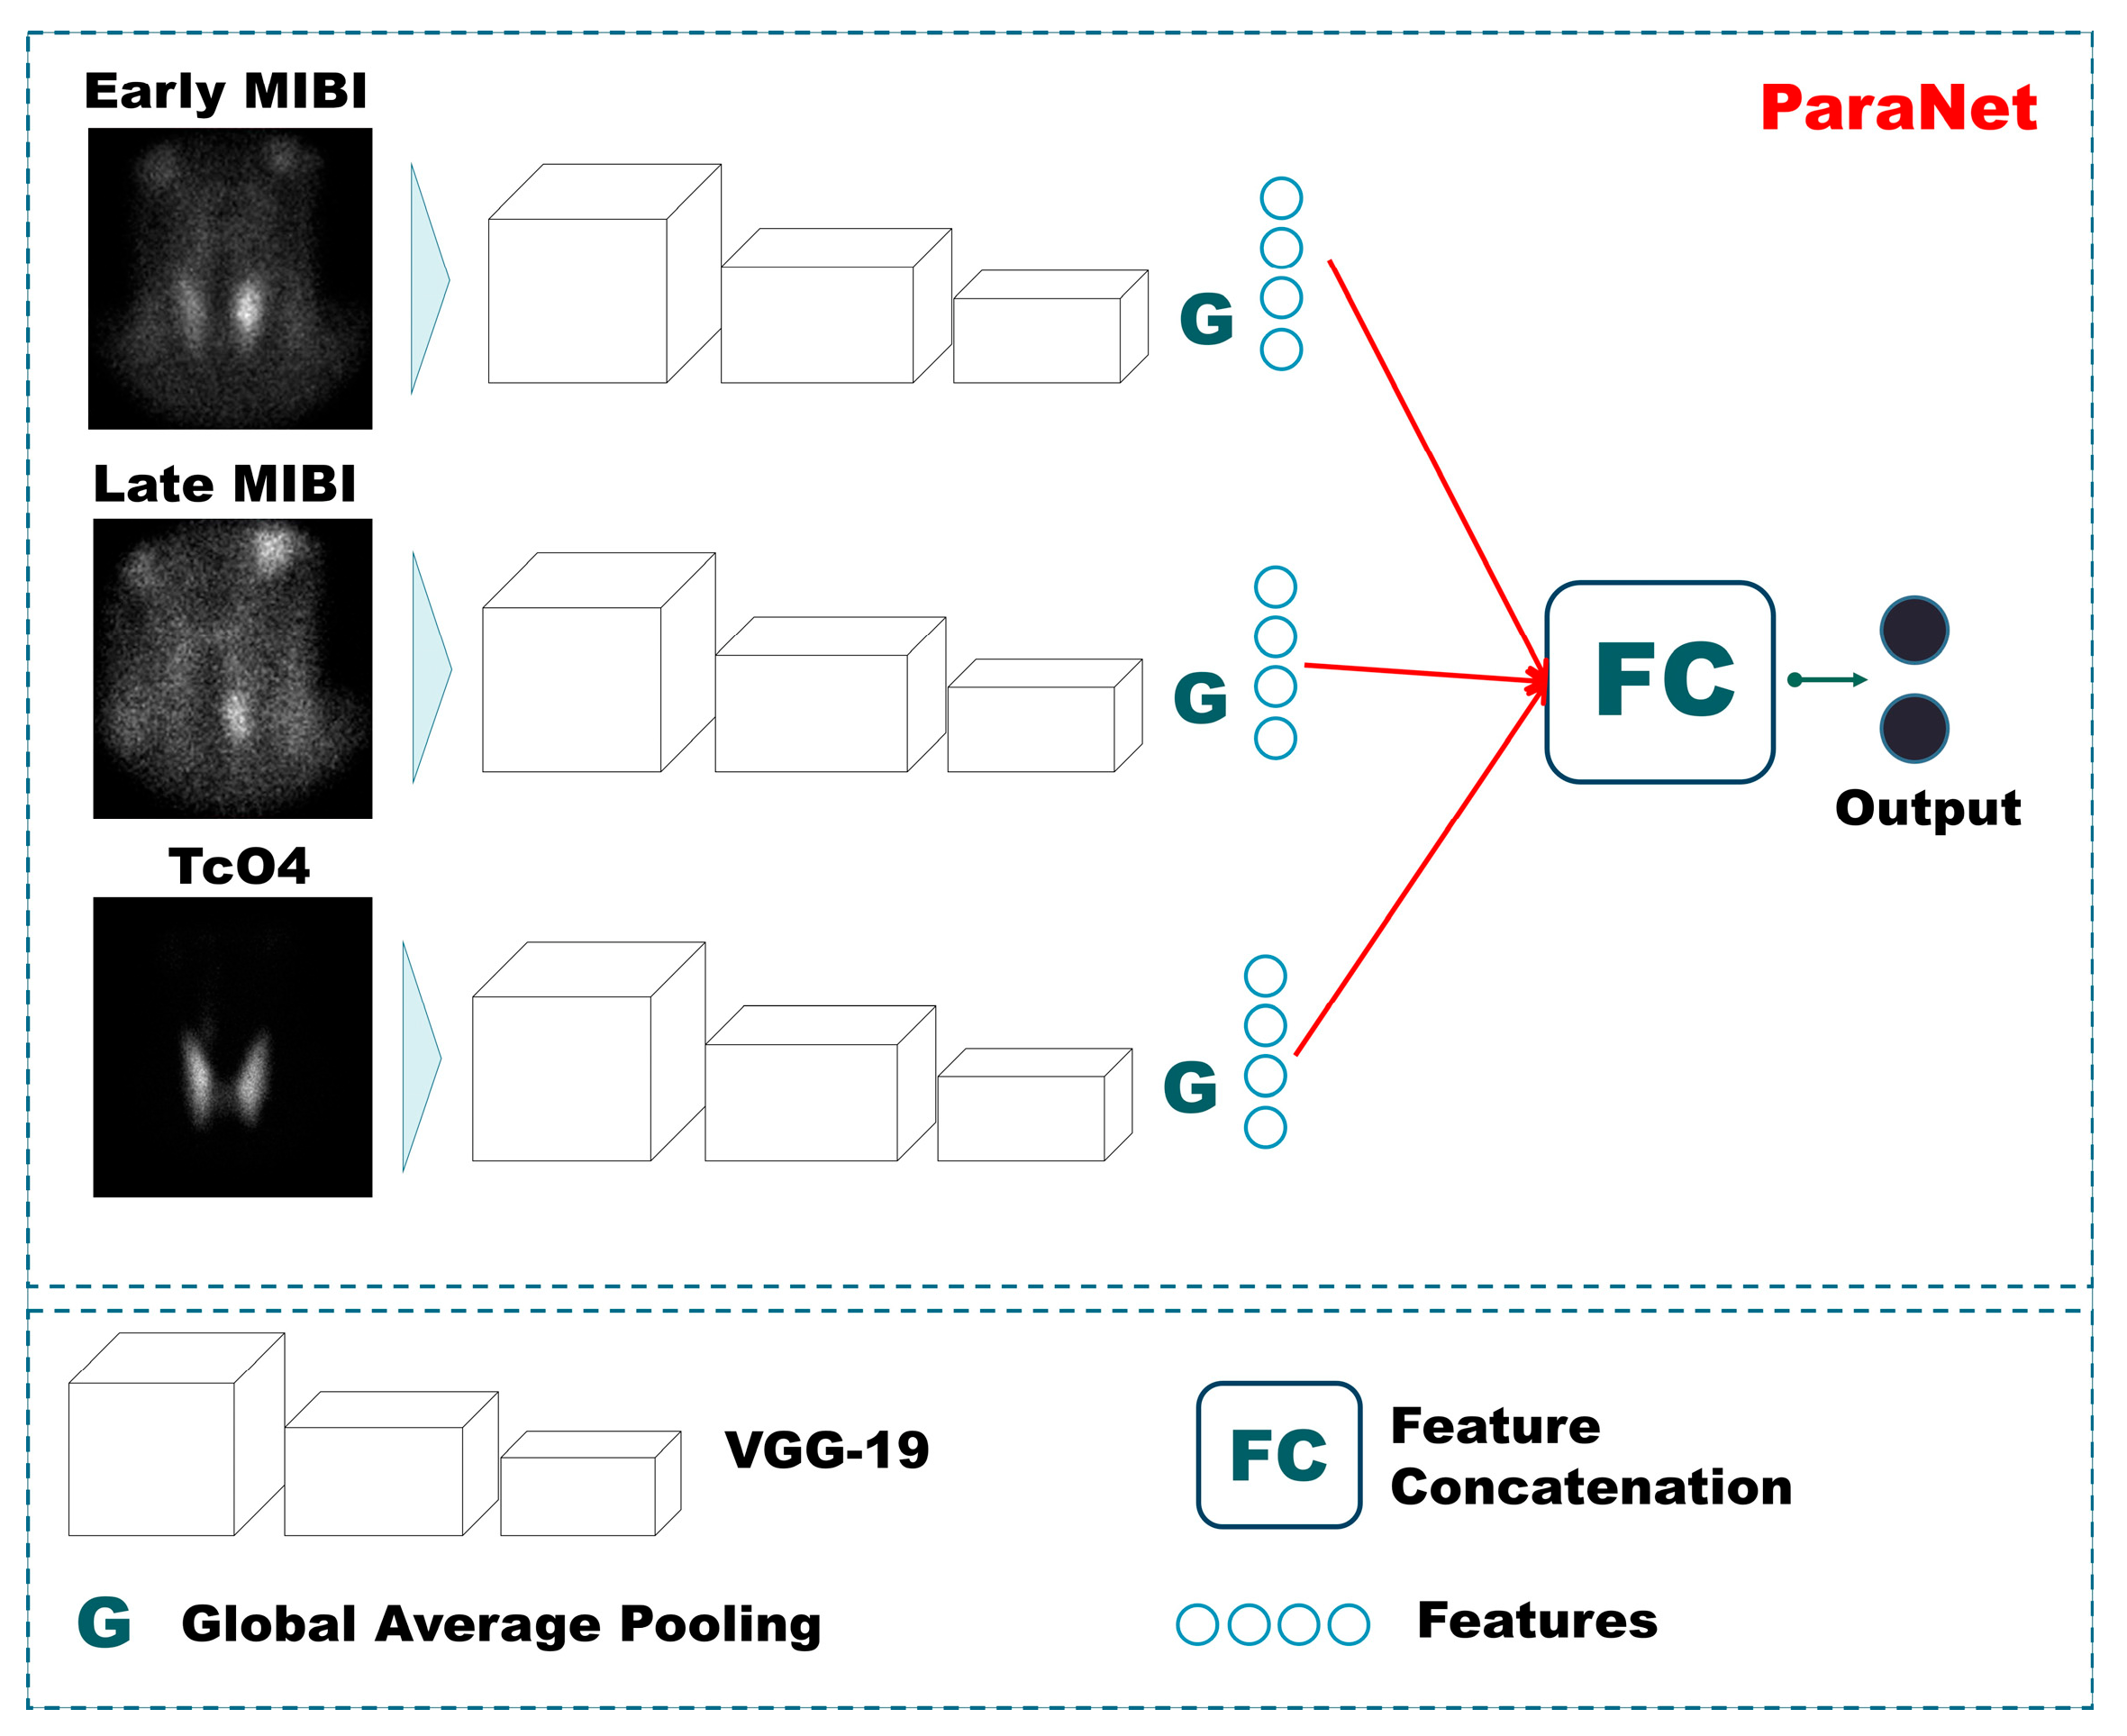
The study proposes a multi-path DL pipeline to simultaneously process the MIBI early phase, MIBI late phase, and the 99mTcO4 thyroid scan. To this end, the study employs the state-of-the-art convolutional neural network (CNN) called Virtual Geometry Group (VGG) to furnish a multi-path pipeline, which performs a per-patient classification between normal and abnormal scans. Furthermore, the Grad-CAM algorithm is employed to visualise the critical local areas of each image according to the model.
2. Materials and Methods
2.1. Dataset and Imaging Techniques
The experiment involves 632 HPPT patients subjected to parathyroid scintigraphy in the Department of Nuclea Medicine of the University Hospital of Patras, Greece. The participants were enrolled from January 2010 to December 2021. Biochemical HPPT evidence was present in 607 participants, whilst refractory secondary of tertiary HPPT was detected in 25 patients. The dataset is detailed in
Table 1. The planar dual-phase method was applied to all participants. However, when judged essential, the thyroid subtraction method was applied as well (81.3% of the participants). Planar imaging was applied using a pinhole collimator, which was placed 10 cm over the neck. Half an hour after the injection of the radioactive tracer, a high-sensitivity parallel-hole collimator was used for SPECT/CT imaging of the neck and the mediastinum. The present study involves only planar imaging, performed by the Hawkey-4 system (GE Healthcare). Two senior medical experts retrospectively evaluated the planar scintigraphic studies. In a few ambiguous cases, the final decision was achieved by consensus.
The medical experts (DA, NP, TS, with more than 20 years of experience) assigned the labels of this study. Instances with at least one abnormal PG are labelled as “Positive”, whilst the rest are labelled as “Negative”. An abnormal PG may imply various diseases, such as primary, secondary, and tertiary HPPT. Detailed information from operated cases was available in 472 patients treated surgically at our hospital. The gender imbalance of the dataset reflects the male–female distribution of traffic in our department. Gender, other demographic, and even clinical attributes are not anticipated to dictate changes in the image. Gender and age signatures are not discovered in such images.
2.2. VGG-Based Three-Path CNN (ParaNet)
CNNs are capable of portraying high-level abstract representations from non-linear information. CNNs belong to the broader area of deep neural networks [
17]. CNNs utilise convolution layers to process and filter the input data distributions. Convolution layers transform the input data distributions and extract many image-related features [
18]. Auxiliary layers, such as pooling layers, aid in dimensionality reduction, overfitting prevention, regularisation, and more [
19]. In classification problems, the extracted feature maps are commonly processed by densely connected layers that filter out the irrelevant features based on a pre-defined desired outcome.
The problem of abnormal PG identification is addressed by cross-examining three images, as presented earlier. To this end, a three-path CNN is suggested. The MIBI early phase image, MIBI late phase image, and the 99mTcO4 thyroid image are processed independently by the three paths of the network, and the extracted features from each path are fused at the later processing stages. Each path is responsible for extracting meaningful information from a single input image. Therefore, the overall approach contains three independent CNN components.
For each CNN component, the VGG architecture with 19 convolutional layers (VGG19) is suggested (
Figure 1). VGG19 is a very consistent and successful CNN for relevant medical imaging tasks. Initially, this network is designed to perform multi-class classification on non-medical images. However, its uniform architecture and feature extraction capabilities have also made it suitable for medical imaging tasks.
VGG19 has been employed, with the final layer being trainable. The rest of the layers utilise pre-defined weights defined by initial training on non-medical images [
20]. We argue that this conception can reduce the number of trainable parameters significantly. The Triple-VGG19, called ParaNet, contains 3,079,628 trainable parameters and 52,999,836 non-trainable. At the top (the last convolutional layer) of each VGG19 component, a global average pooling layer has been applied. The input image size (350 × 350 × 1) is incrementally reduced to (21 × 21 × 512), where 512 represents the number of filters of the last convolutional layer. The output of the average max pooling layer is connected to a dense layer of 750 nodes, which is followed by a dropout layer that randomly disconnects half of the nodes. Next, a dense layer of 256 nodes is connected to the previous layer, and a final densely connected layer of two nodes (as many as the output classes) follows. The entire Python 3.6+ code is available on GitHub (
https://github.com/apjohndim/Parathyroid-Initiative/blob/main/3P-VGG19-Paper.py accessed on 11 August 2022). The parameters and the hyperparameters of ParaNet are summarised in
Table 2. A visual overview of ParaNet is presented in
Figure 1.
2.3. Data Pre-Processing
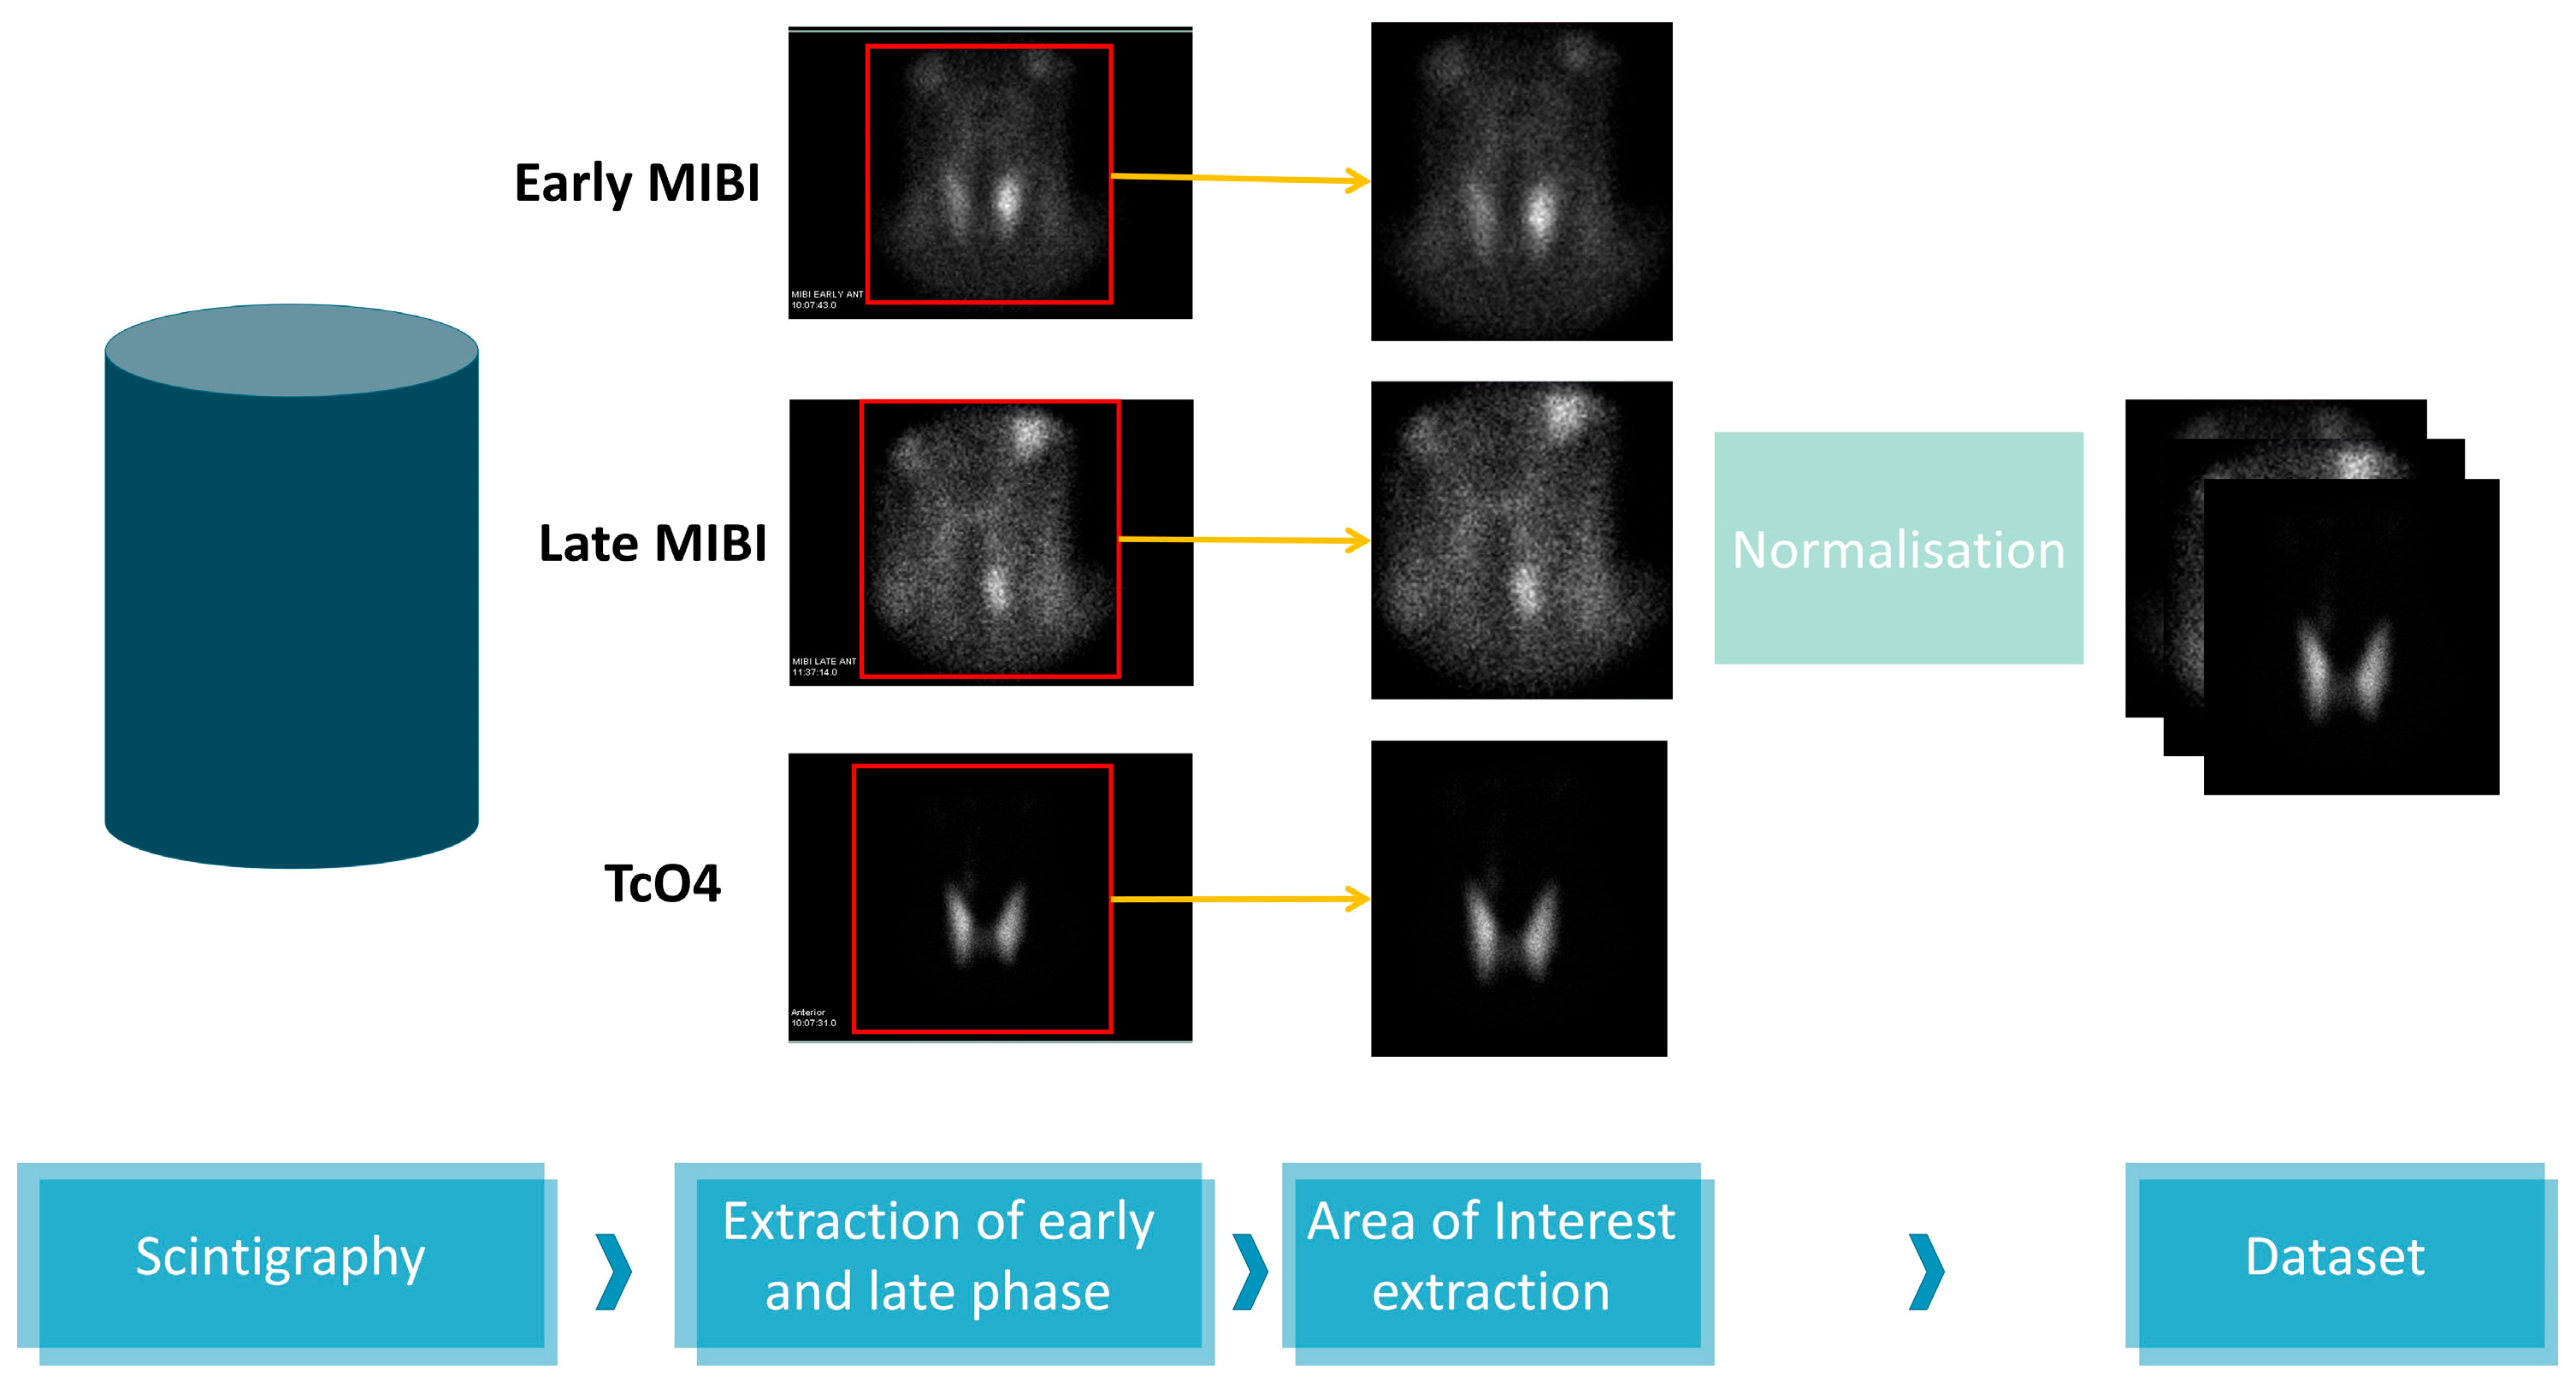
The image acquisition device software output is an image containing five sub-figures. Sensitive information is included in two of the images, which are discarded. The scintigraphy details appear in the rest figures, which correspond to the early MIBI, Late MIBI, and thyroid TcO4 image.
Figure 2 illustrates the data processing steps for the creation of the dataset. In the first step, the three images are delineated and the area of interest is extracted. Each new image is of 350 × 350 pixel size in jpeg format. Data pre-processing has been performed using the OpenCV library, written for the Python programming language.
2.4. Data Augmentation
CNNs can learn to ignore spatial, geometrical, and texture variations and focus on revealing more critical information in tasks where such characteristics are irrelevant [
17]. In addition, noise can be harmful to network training. CNNs can benefit from augmented data on this front. Moreover, data augmentation is the dominant strategy for circumventing class imbalance issues [
22]. For the above reasons, data augmentation is essential in DL applications.
The present experiments are conducted using online data augmentation. In essence, synthetic image examples are produced during the training phase for each training fold. The synthetic data is used solely for training purposes and is discarded after the training. Each three-image group of the training set is randomly augmented using a function that allows horizontal flips, random rotations (by a maximum of 20 degrees), height and width image shifts, and Gaussian noise additions.
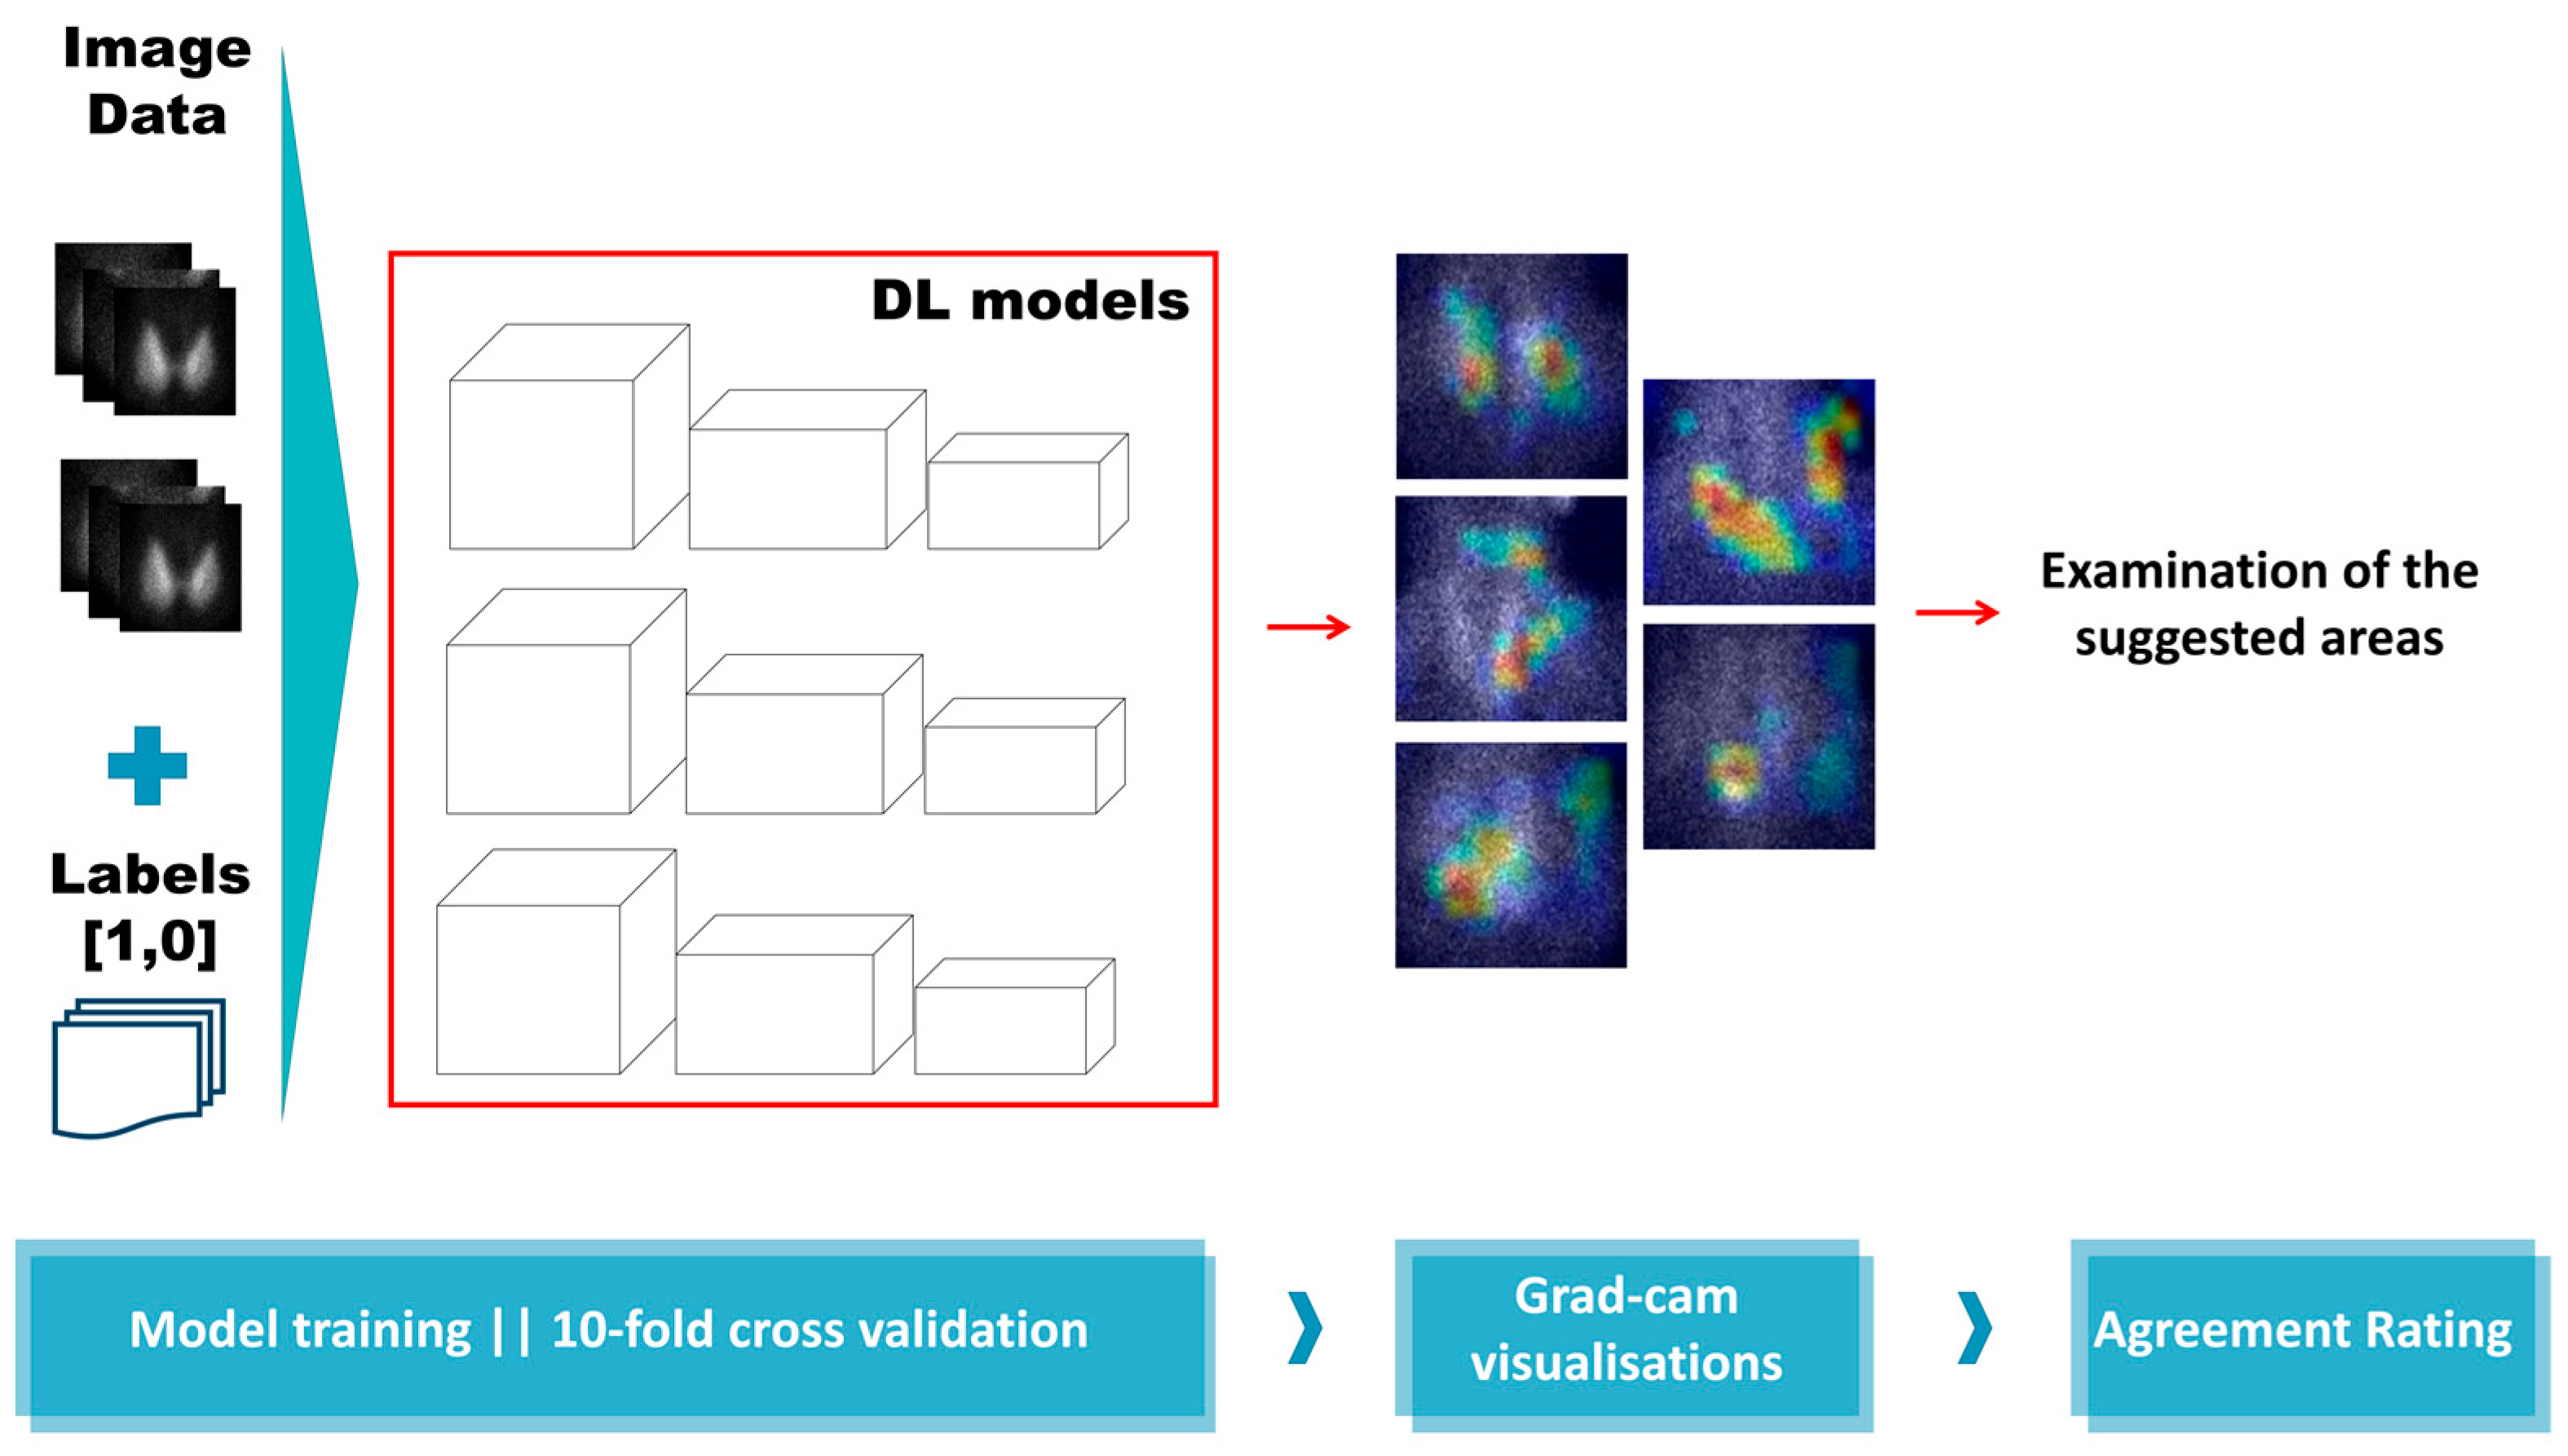
2.5. Visualising the Model’s Suggested Areas of Interest
CNNs are notorious for acting as black boxes [
23]. This characteristic is unavoidable in situations where several layers of processing are involved. Moreover, such deep networks reveal and analyse millions of features. Recently, the Grad-CAM algorithm [
24] has been introduced to circumvent this issue and offer a glimpse of explainability. Grad-CAM algorithm tracks the decision process of the trained CNN and visualises the most crucial image areas, as suggested by the feature weights. Unfortunately, CNNs are susceptible to learning irrelevant features from the input data. On some occasions, this disadvantage may not be reflected in the metrics. Hence, evaluating the efficiency of such methods based on performance metrics may obscure the reality. The experiments of this work are presented in
Figure 3.
2.6. Experiment Setup and Network Training
Training and evaluating the proposed DL method is performed under a 10-fold stratified cross-validation. An early stopping function is applied during training, which lasts for a maximum of 400 epochs. Early stopping occurs if the validation accuracy has reached 0.94. The batch size has been selected according to the computational resources of the infrastructure as is 50.
During each fold, we record the total number of true positive (TP), true negative (TN), false positive (FP), and false negative (FN). Based on these metrics, we compute the accuracy, which reflects the agreement between the model and the labels assigned by the experts. We also record sensitivity, specificity, positive predicting value (PPV), negative predicting value (NPV), F1 score, and area under curve score (AUC). The overall metrics are an aggregation of the folds’ metrics.
3. Results
According to medical experts’ decisions, 180 cases were classified as negative (28.48%). In the remaining 452 patients, 545 abnormal PGs were identified in various positions.
3.1. Assessment on a Patient-Level Basis
The model has been evaluated on a patient-level basis following 10-fold stratified cross-validation. In this section, the model’s metrics are presented. It is highlighted that the present evaluation takes place by opposing the predicted labels to the actual labels. It does not refer to cross-examination using the resulting suggested areas, as illustrated by Grad-CAM.
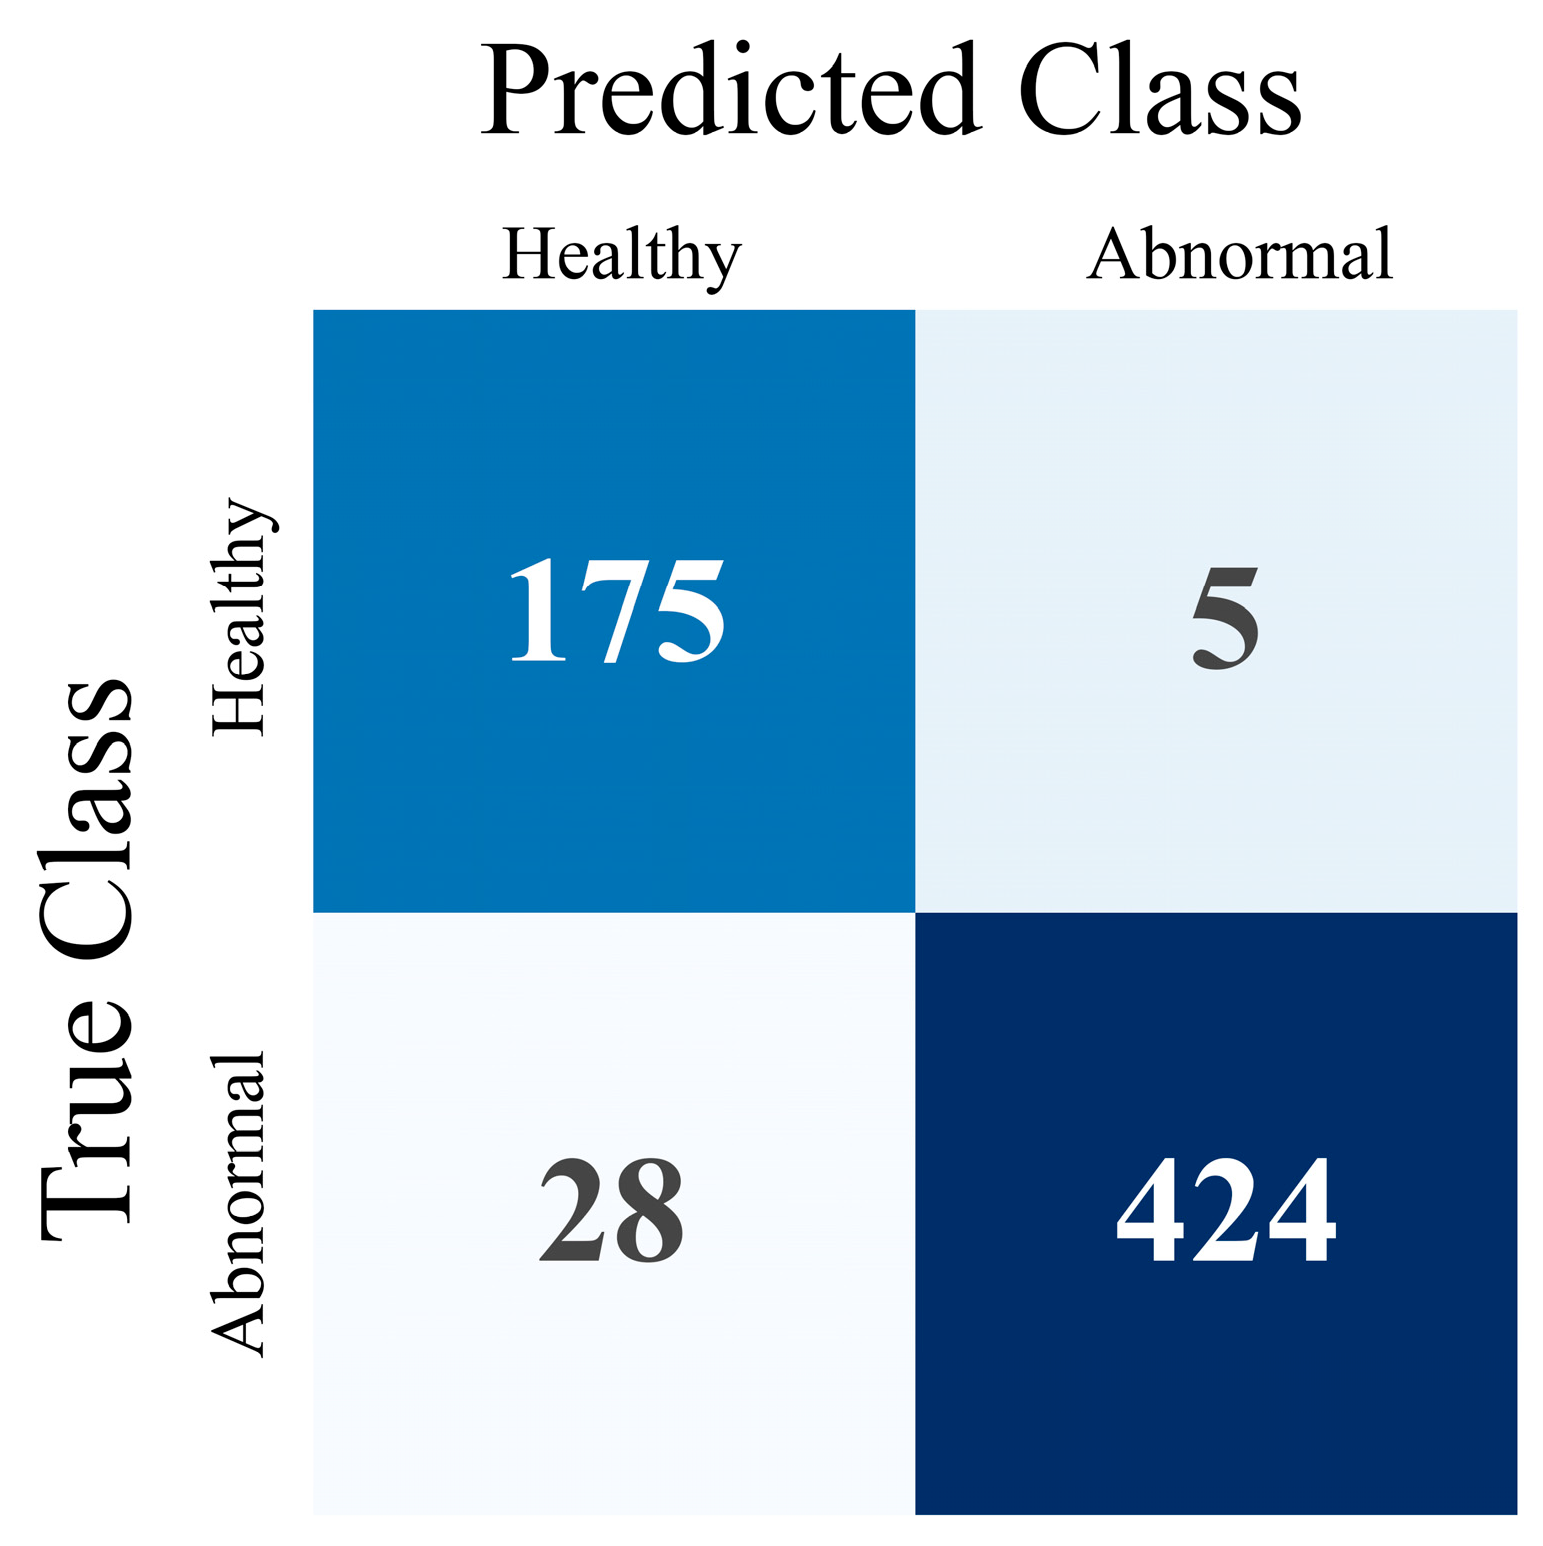
The results demonstrate significant agreement between the model and the human experts. More specifically, the DL model obtains 94.8% accuracy and an F1 score of 0.96. The model achieves high sensitivity and specificity rates (93.8% and 97.2%, respectively). PPV and NPV values are 98.8% and 86.2%, respectively. Cohen’s Kappa statistic score is found to be 0.91. Those results are presented in
Table 3. The significantly low false positives (5) indicate the model’s efficiency regarding the parathyroid-positive prediction. The lower sensitivity rate suggests that a parathyroid-negative prediction is not that reliable. The complete confusion matrix is visualised in
Figure 4.
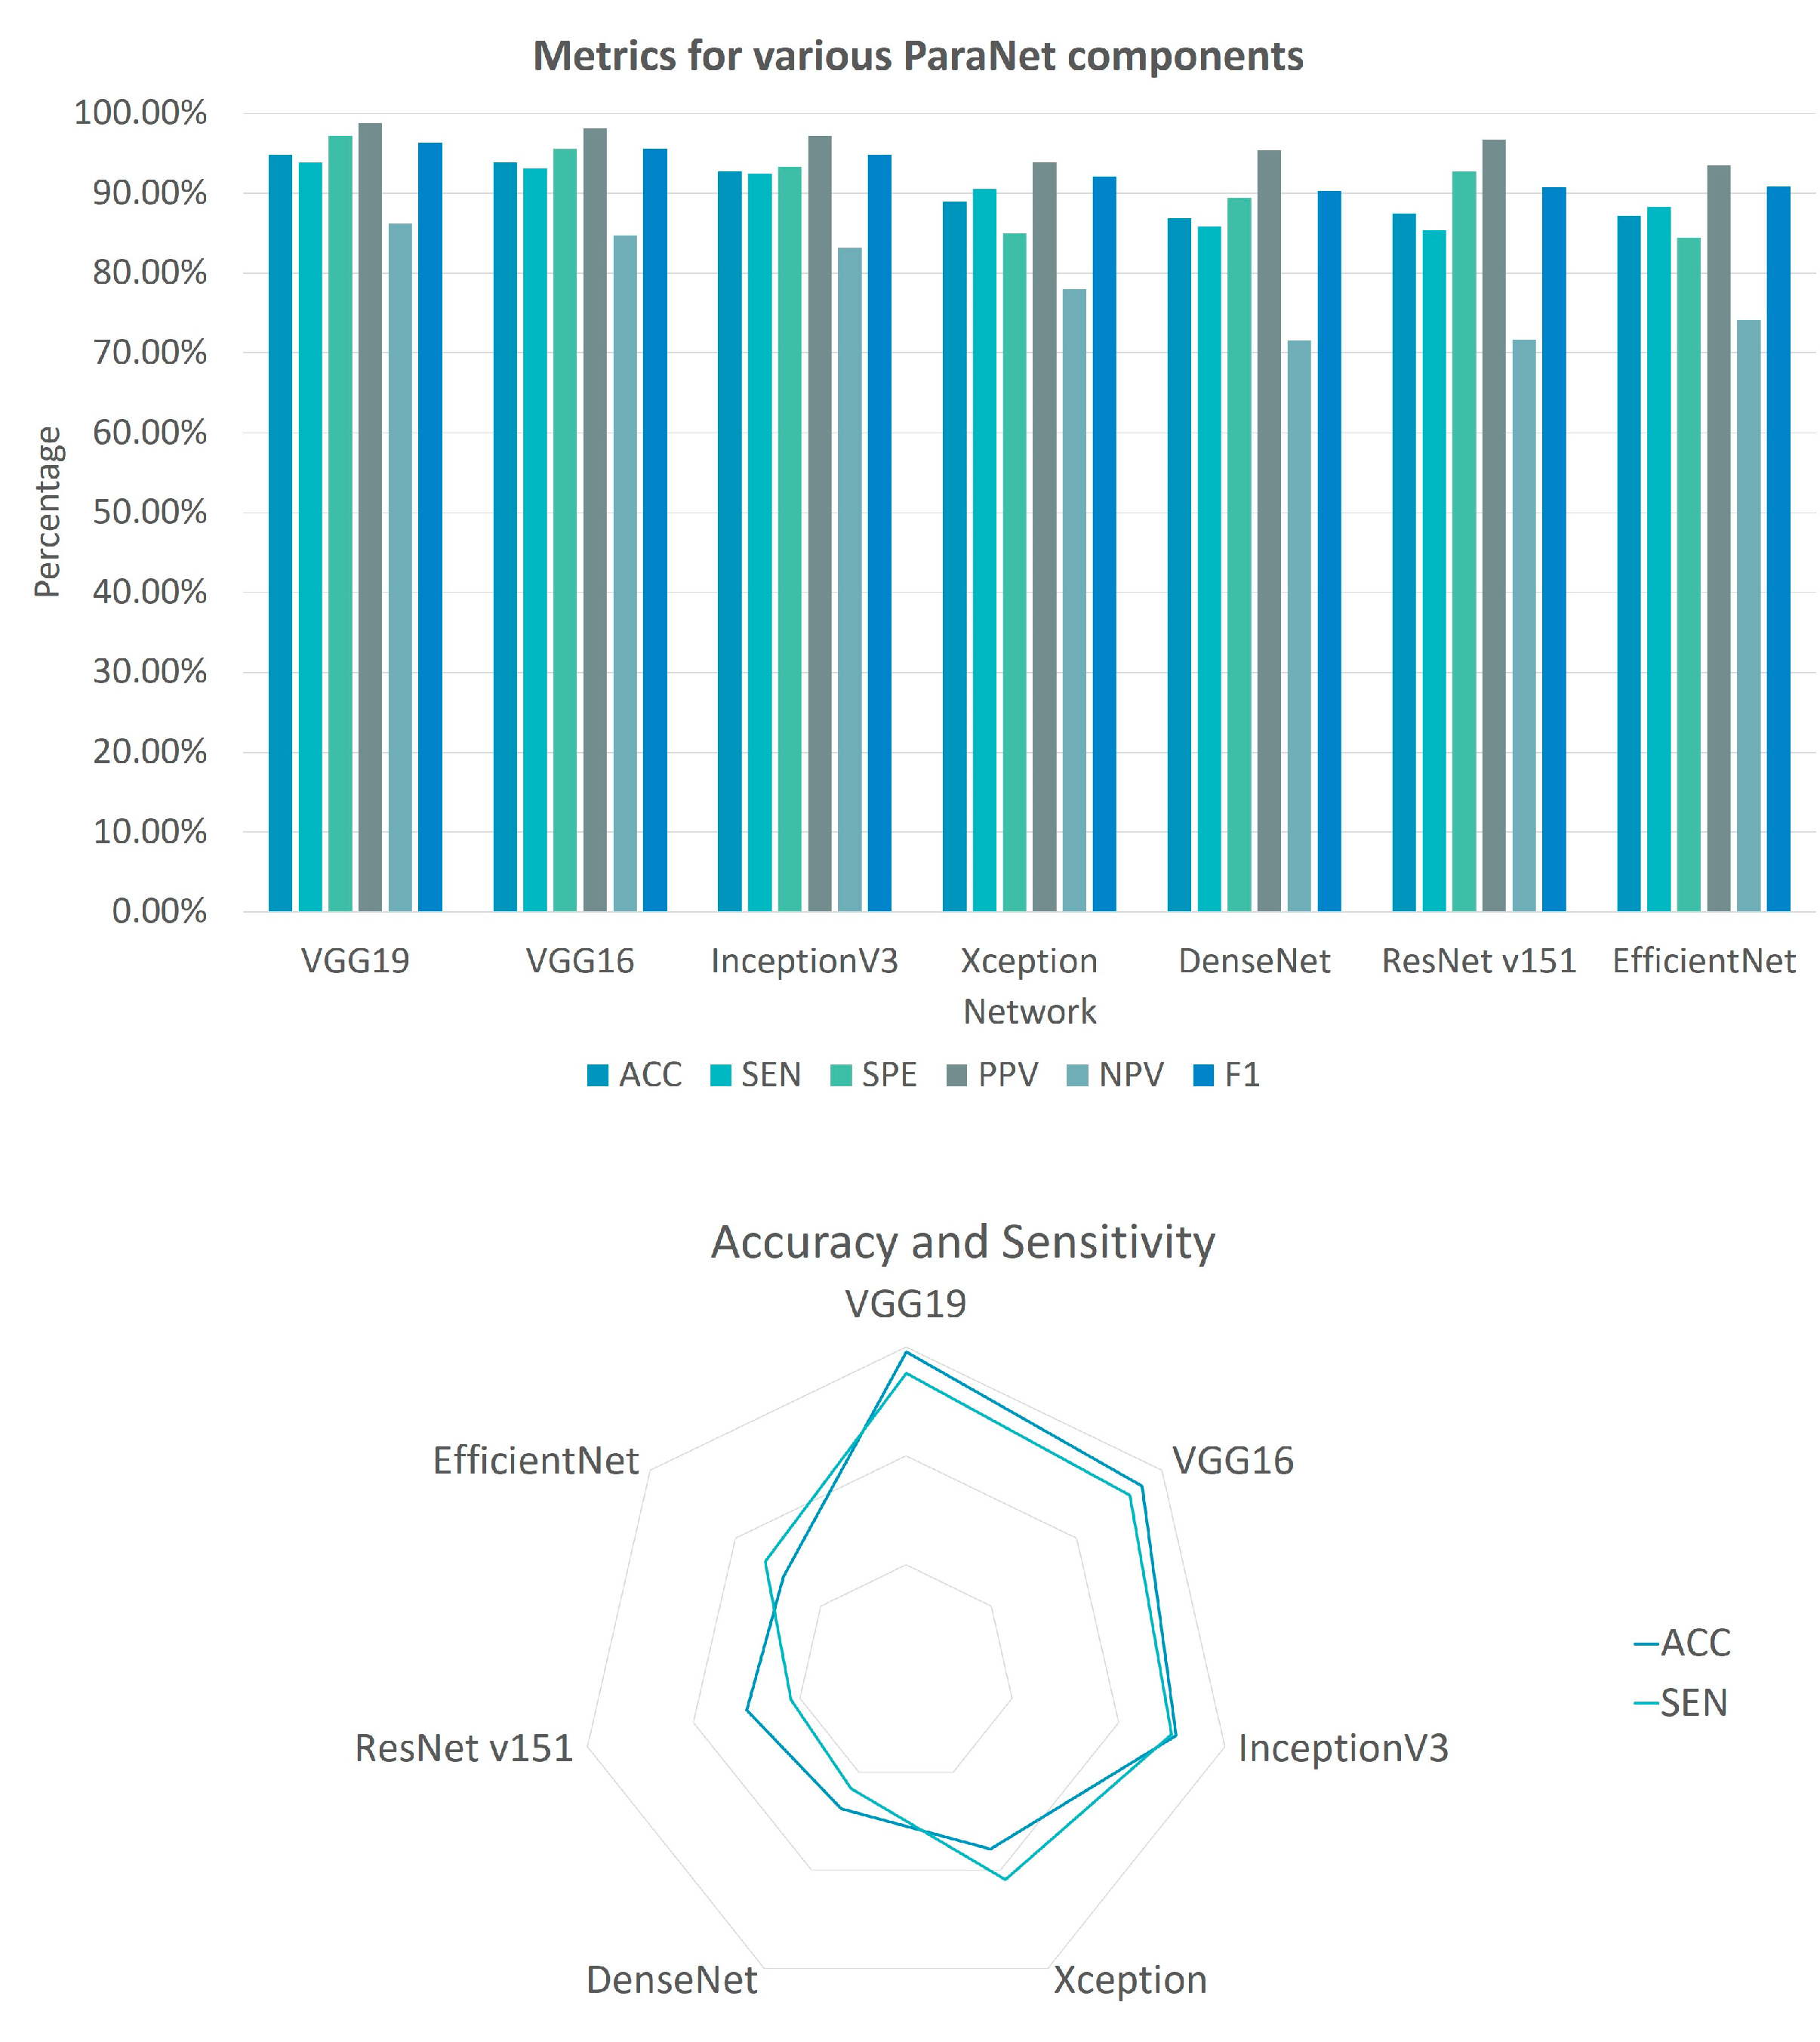
In
Table 3, the metric results of ParaNet are accompanied by results from alternative experimental Triple-CNNs. It is verified that VGG19 is superior to other state-of-the-art pre-trained CNNs when serving as the main component of the three-path network. The results are summarised in
Figure 5. The reader should notice that the deployment of the rest of the networks shares the same parametrisation with VGG19. The last convolutional layer is trainable, and a global average pooling layer is added. The densely connected layers at the top of each network are the same.
3.2. Grad-CAM Visualisation Results
During the stratified 10-fold cross-validation, the ten test sets are used to evaluate the model’s accuracy. The Grad-CAM algorithm integration ensures that the model identifies each test image group’s suggested areas of interest. At the end of the ten iterations, each fold participated in the evaluation set only once. In this section, selected samples from the Grad-CAM results are visually provided and discussed.
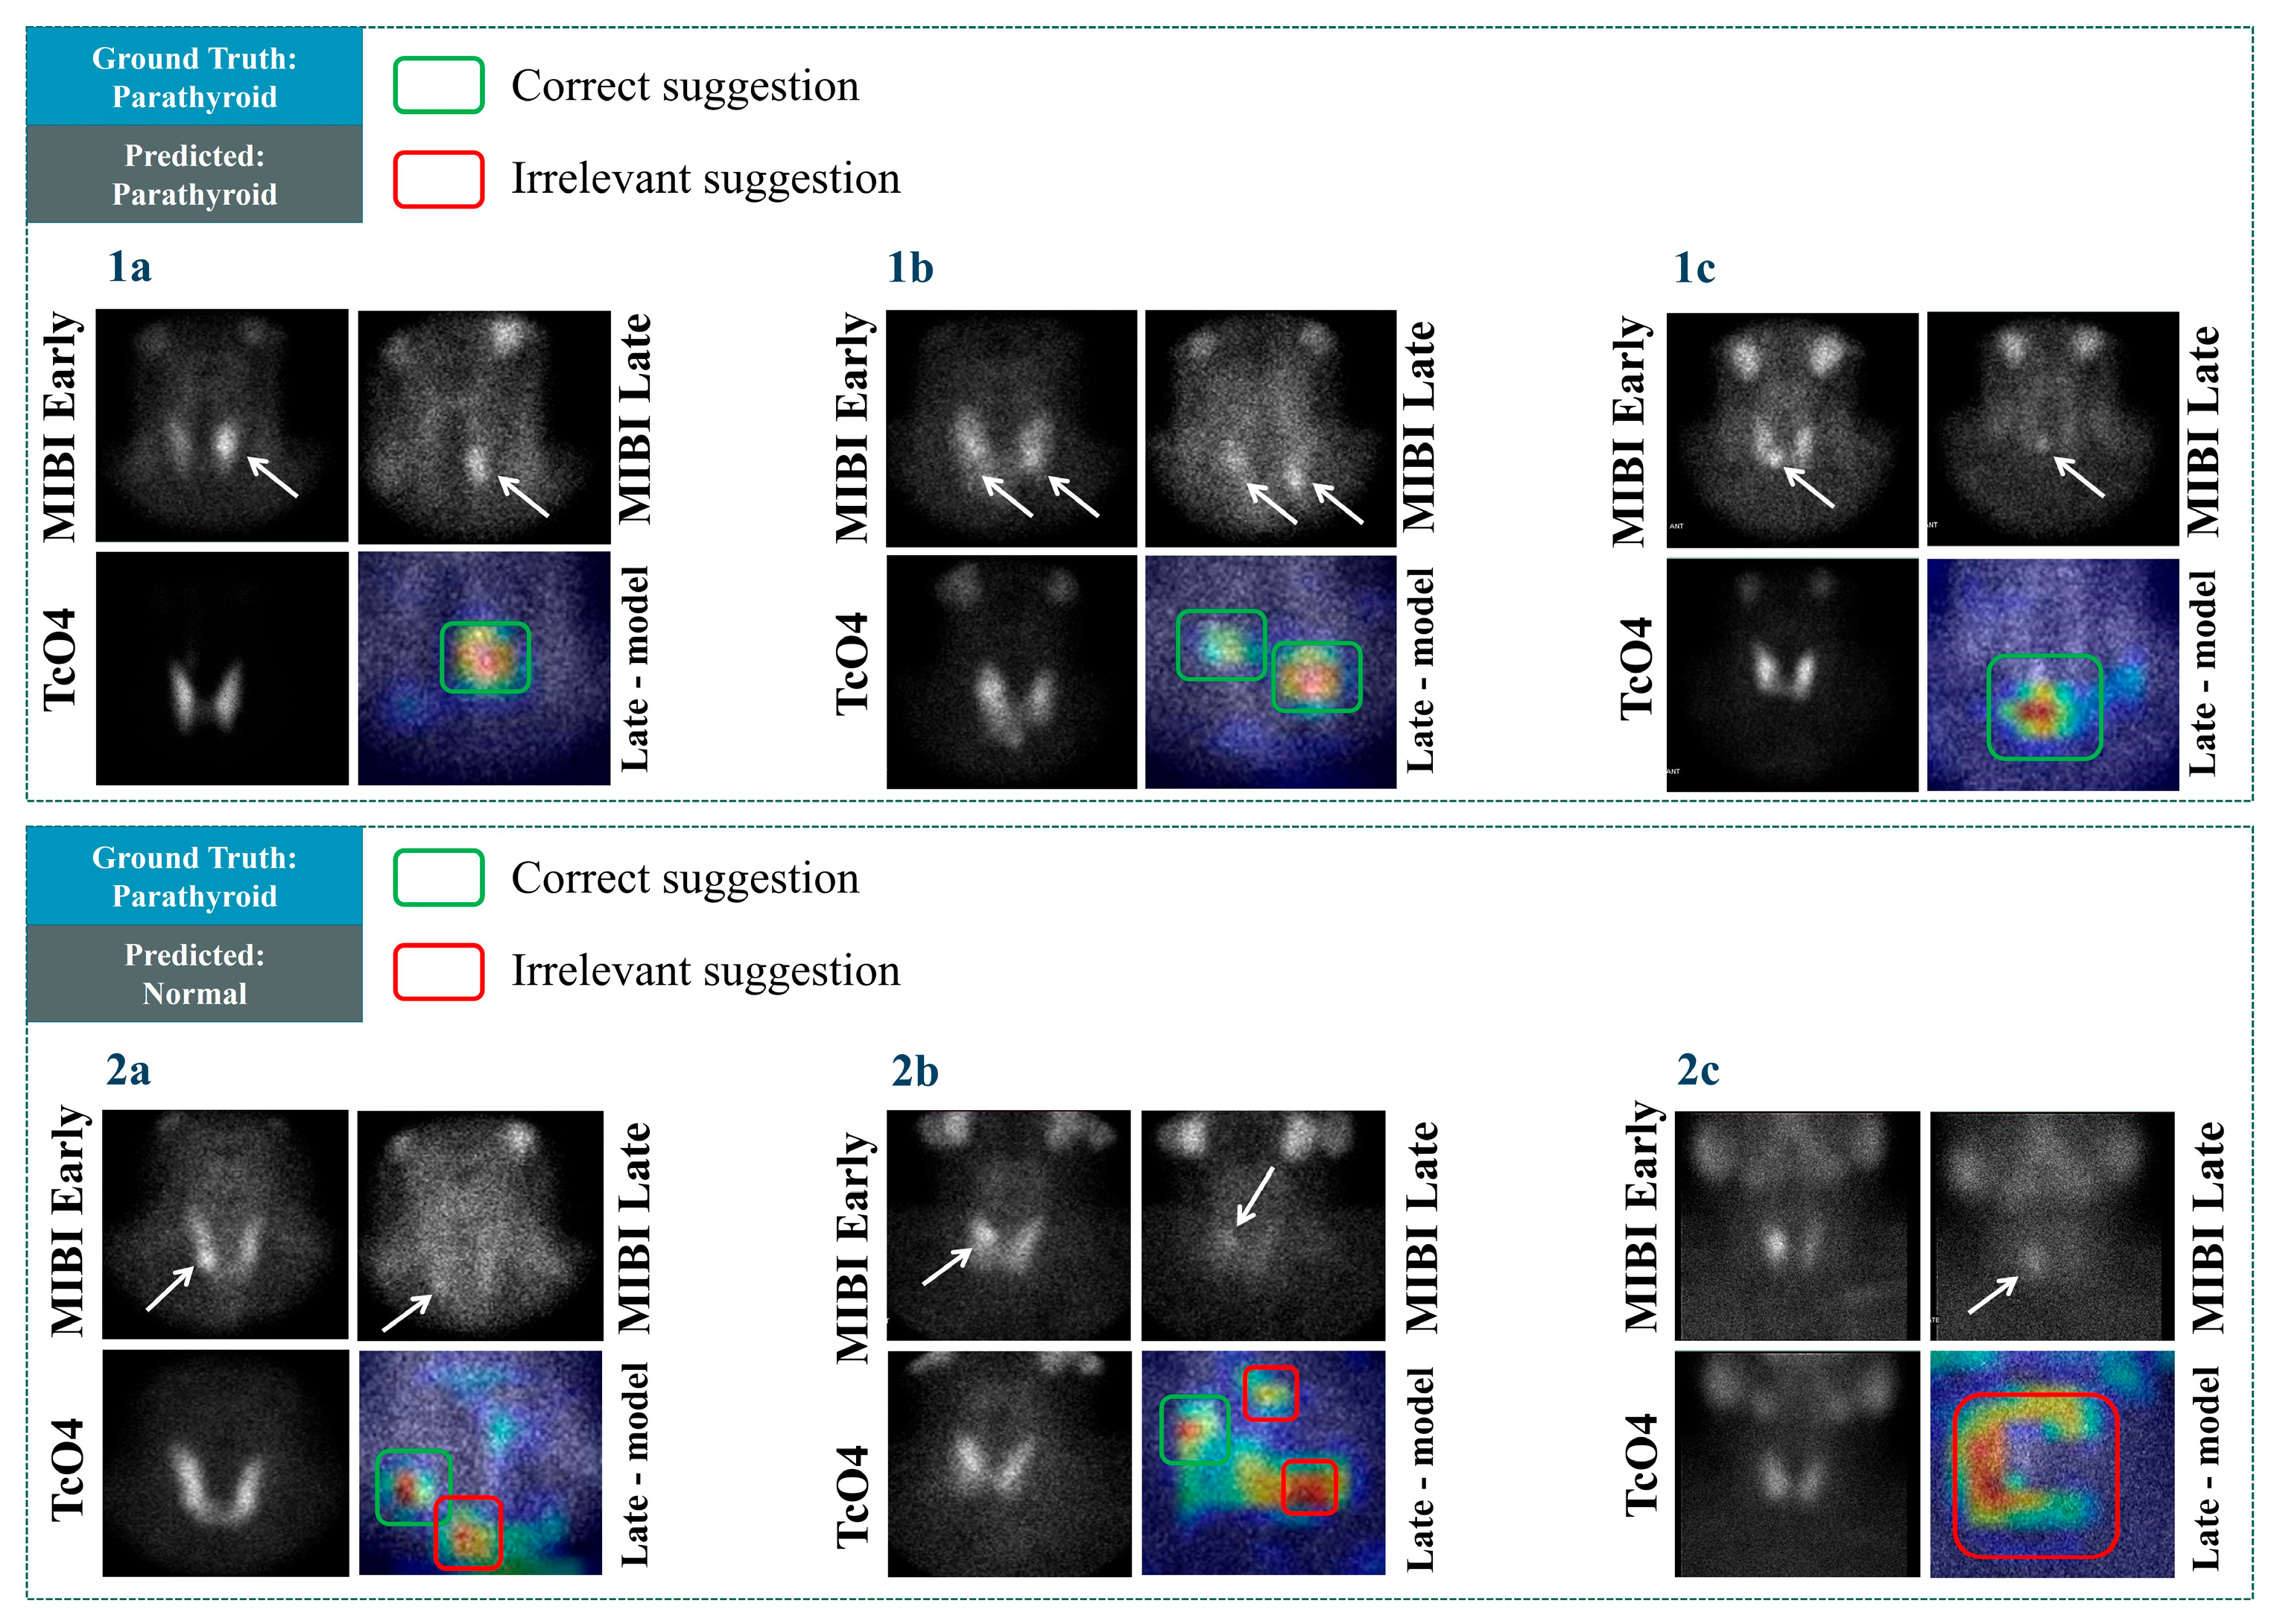
In
Figure 6, confirmed abnormal PGs are presented. The arrows point to positive scintigraphic findings. As observed from case 1b, the visualisation reveals irrelevant areas suggested by the model, even in cases where the model’s predicted class is correct (“Normal” class). The model correctly identifies multiple positive findings in cases 1a–1c. In case 2a, which corresponds to positive cases, the model predicts them as normal. Still, the model identifies some PGs (e.g., case 2b). However, those findings of the model are not correctly characterised as abnormal. Therefore, the overall effectiveness of the model has to be re-assessed following the inspection of the Grad-CAM results. Nevertheless, the model demonstrates some promising visualisation results, as observed from 1a and 1c.
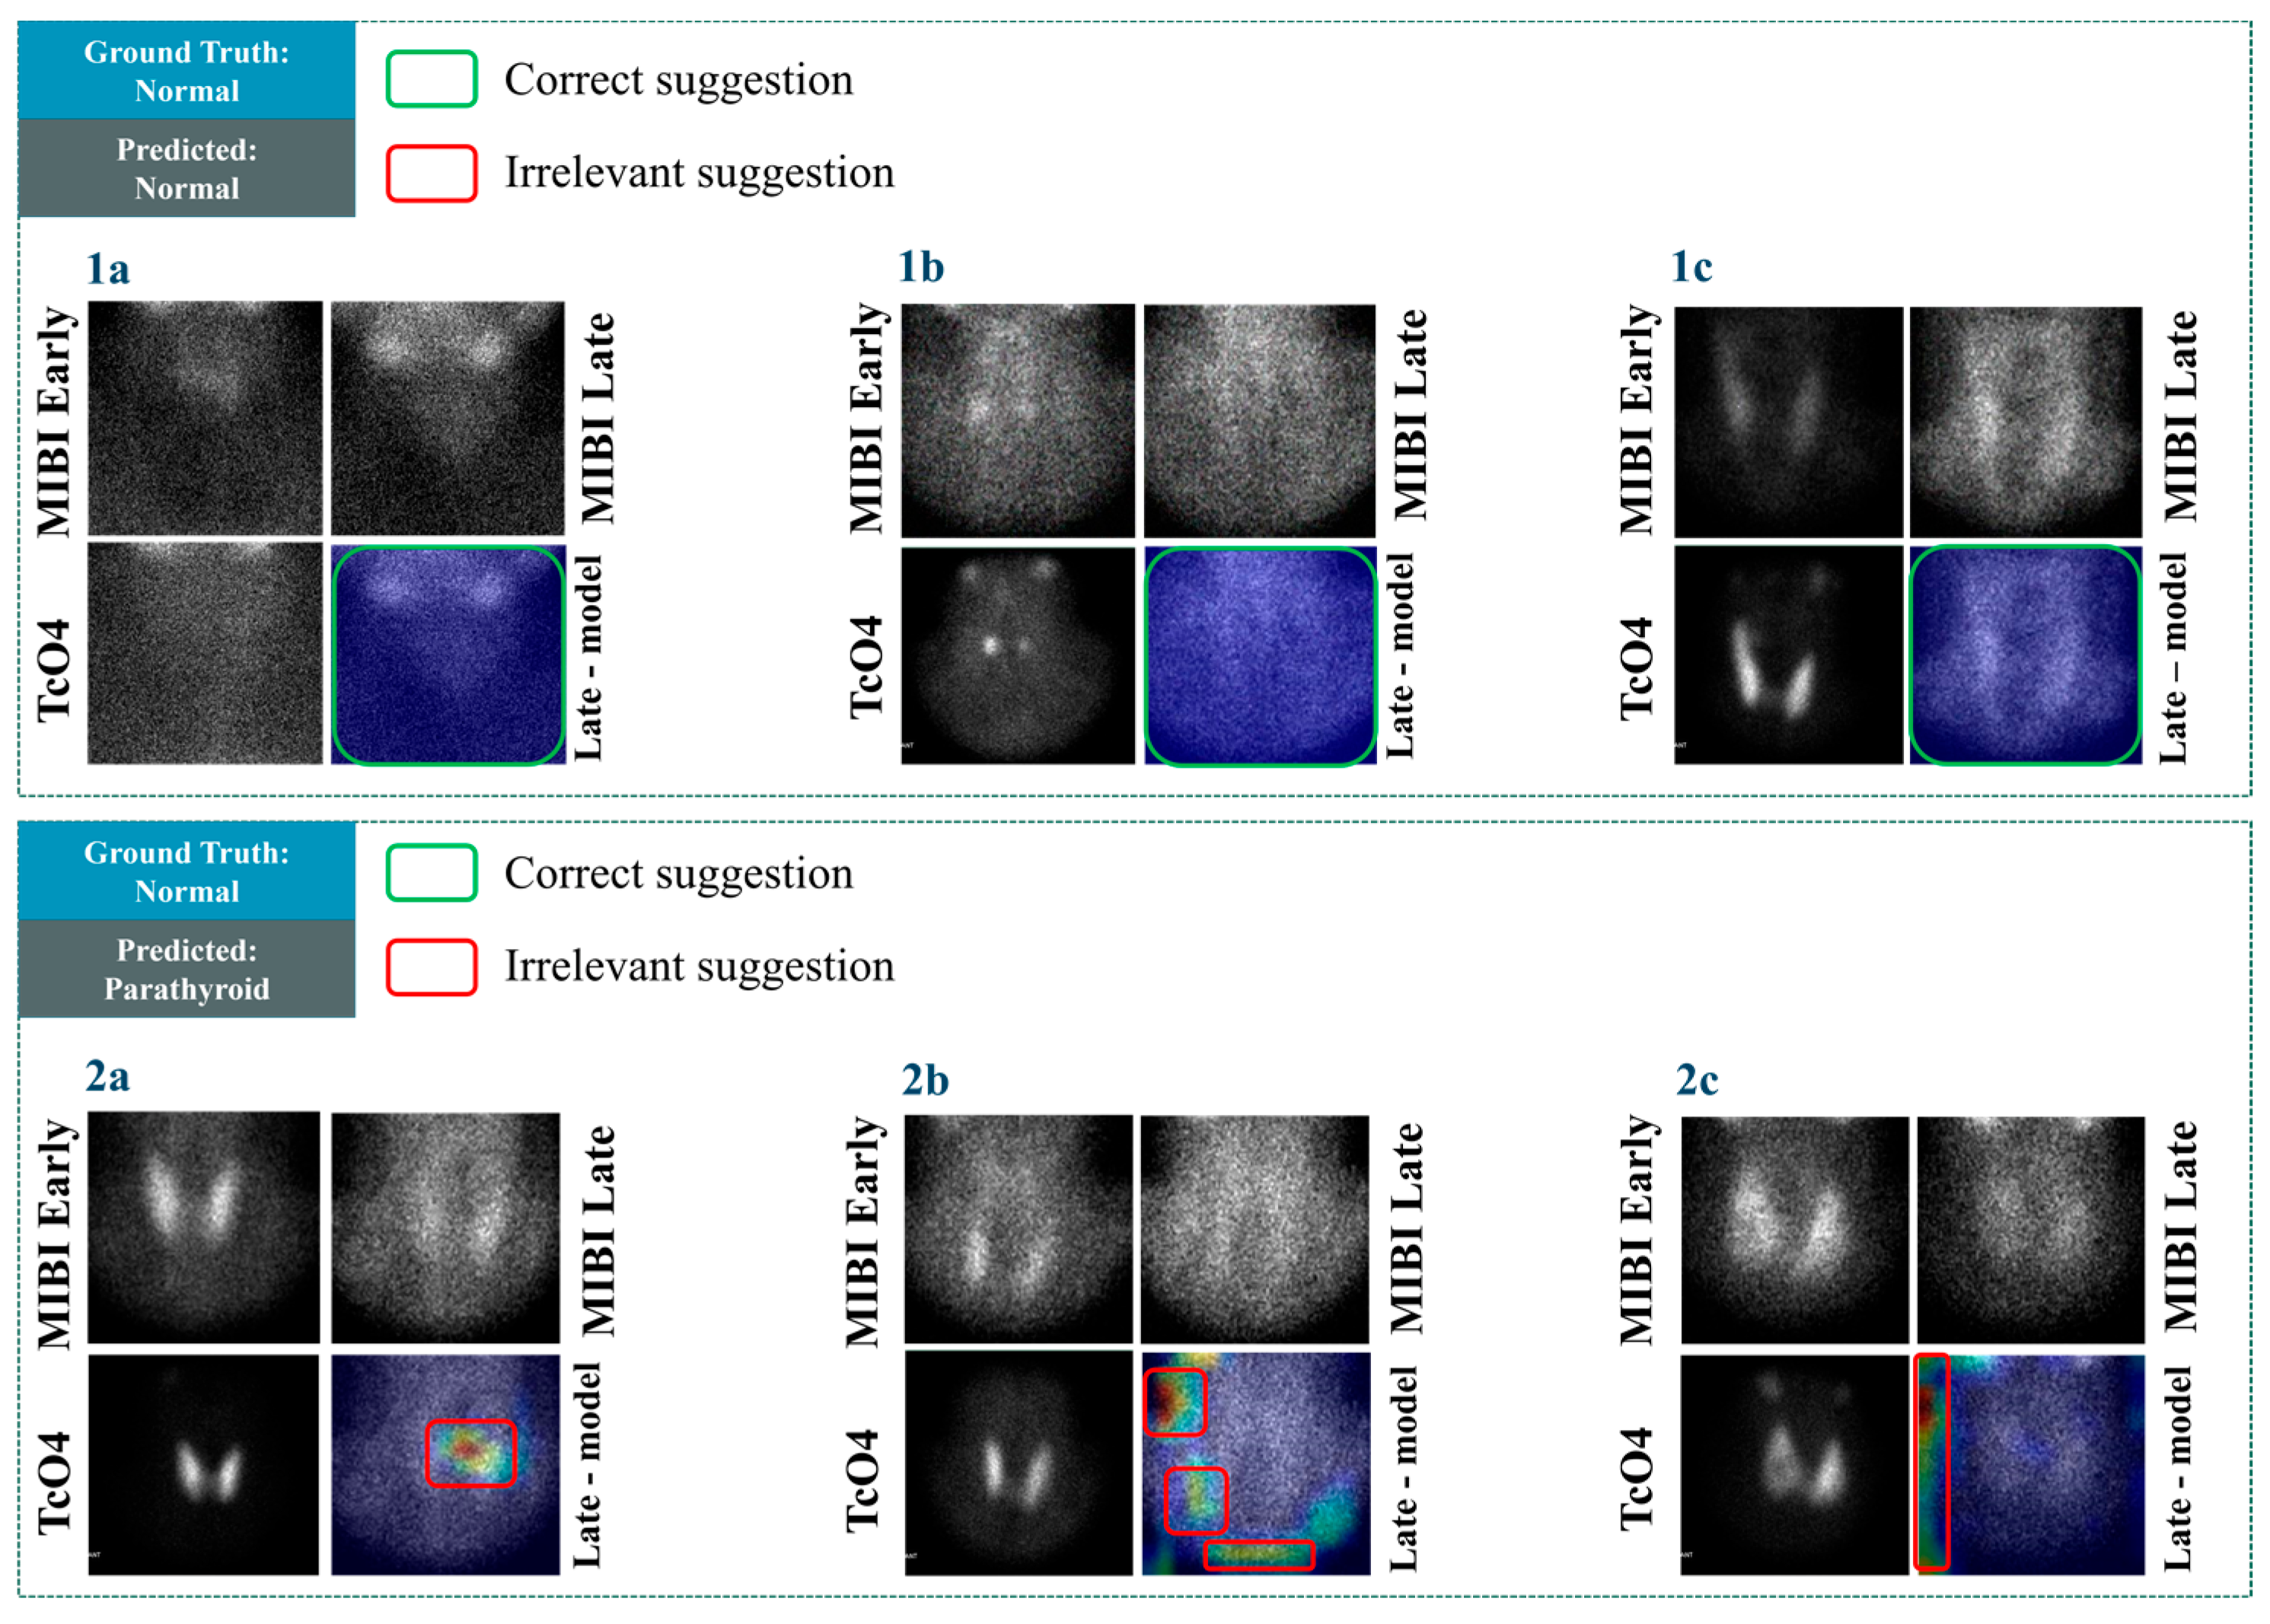
In
Figure 7, cases with negative scintigraphic results are presented. The visualisation results in
Figure 7, cases 1a–1c reveal that the model identifies these negative cases correctly and does not suggest any areas of the image for potential findings. The above reliably highlights the model’s ability to identify negative cases. However, the model suggests some potential findings in irrelevant areas in cases 2a–2c. For example, in case 2c, the highlighted area does not even border the area where positive findings could hypothetically exist, i.e., roughly in the centre of the image. The same issue applies to case 2b. An interesting observation is that particular cases do not belong to ambiguous examples. Identifying abnormal PG would be considered a trivial task for most nuclear medicine experts. However, the model yielded unexpected results in the particular examples. This matter and a large number of false positives shall be investigated further in future studies.
In
Figure 7, case 2a, the model’s suggestion, though incorrect, is at least referring to a location where a potential finding could be. Therefore, such mistakes are acceptable.
3.3. Assessment on a PG-Level Basis
The authors of the study have evaluated the Grad-CAM visualisations. It is highlighted that the initial agreement of 94.8%, as presented in the earlier sections, has decreased to 76.5% on a PG-level basis. In addition, the visualisations revealed cases wherein the model yielded correct predictions, and the suggested area of interest was irrelevant. Re-assessment of the agreement rating between the experts and the model’s suggestions has been performed following this observation. The reader shall recall that the PG level assessment involves a case-to-case examination of the 545 PGs in the images. The results are compared to the patient-level assessment outcomes in
Table 4.
ParaNet identified 453 TP findings, localising the exact PG location in agreement with the expert annotations. However, a total of 92 PGs are overlooked by the model, which decreases its specificity significantly. The model also exhibits 101 FP findings, distributed in many locations of the image.
3.4. Parametrisation of ParaNet
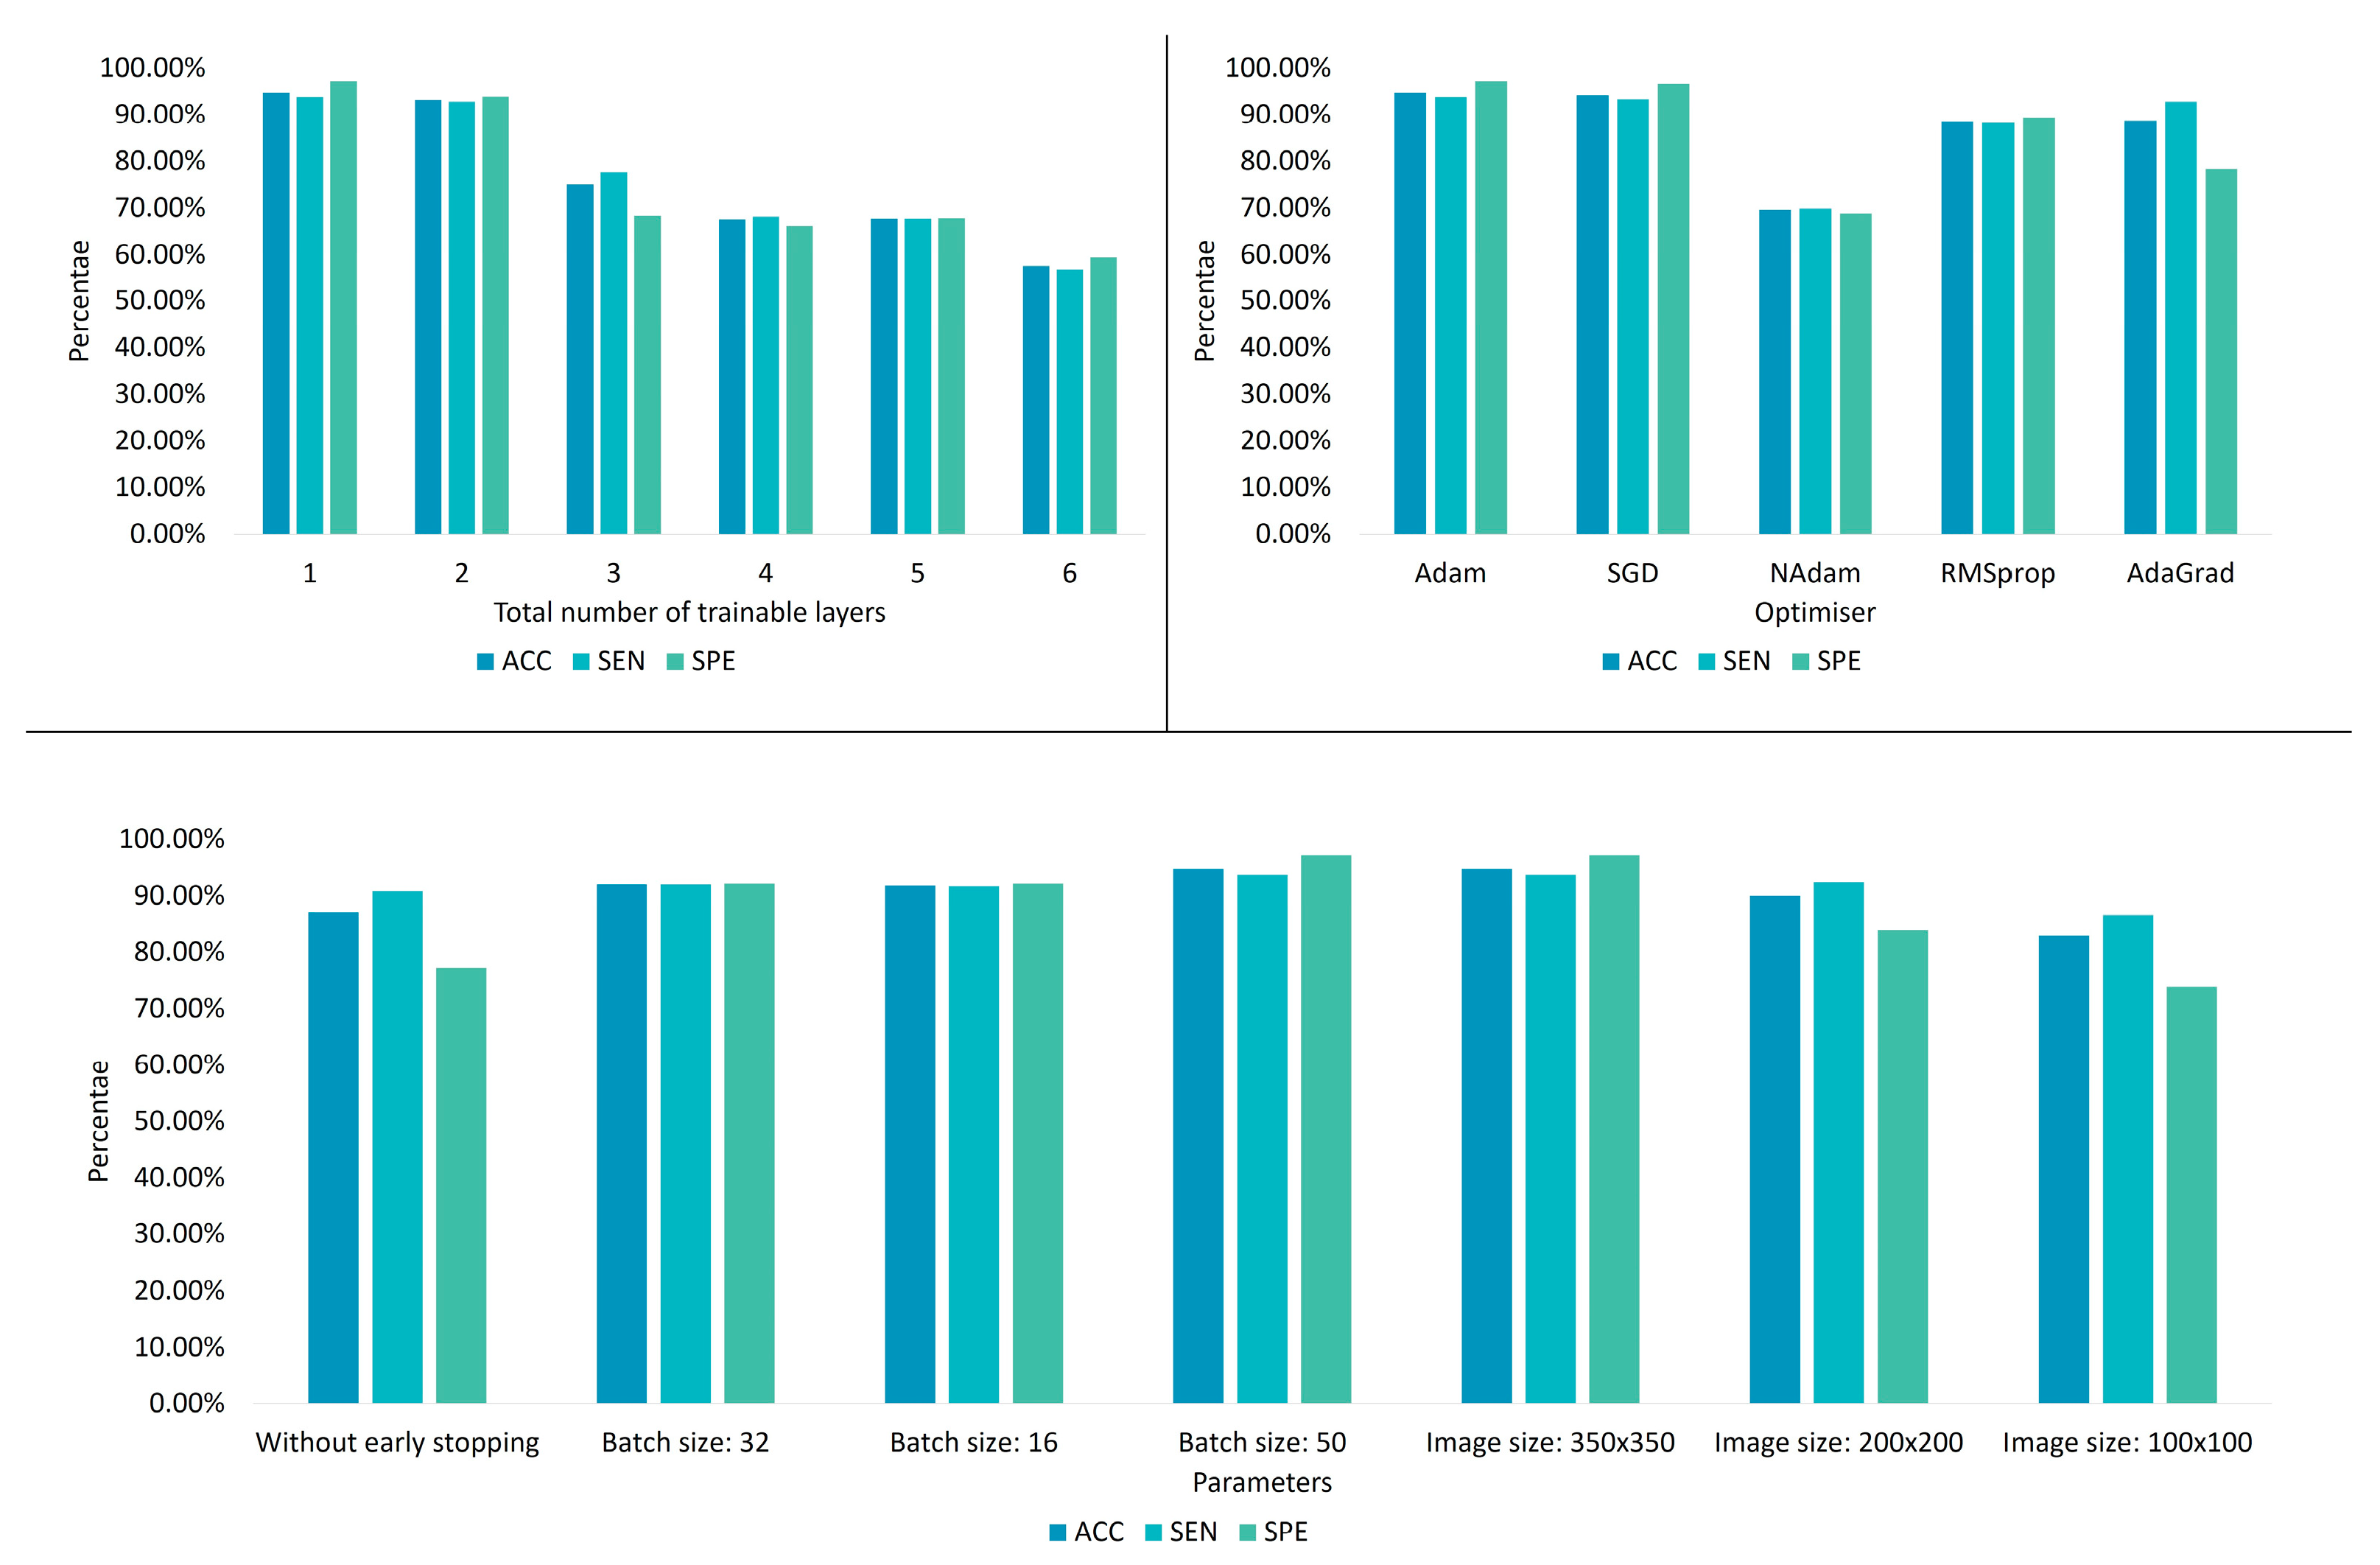
This section benchmarks various ParaNet modifications to verify the correct selection of its parameters and hyperparameters. The overall results are summarised in
Figure 8.
3.4.1. Fine-Tuning the Trainable Layers of the VGG19 Component
Learning is incrementally allowed starting from the final convolutional layer. It is observed that allowing the last convolutional layer to be trainable is preferable (
Table 5, because more trainable layers cause underfitting.
The reader should note that the number of trainable layers can also depend on the size of the training dataset. Hence, this experiment defines the optimal number of trainable convolutional layers under specific data availability.
Training the entire network from scratch led to an apparent underfitting problem, as observed by the obtained accuracy (55.7%). On the other side, performing a pure transfer learning procedure by freezing the entire network and letting it work with predefined weights yielded an accuracy of 87%. The latter results imply that the initial training on the ImageNet [
20] challenge was beneficial. The learned features from non-medical images were adequate to distinguish 87% of the thyroid dataset, whilst the last convolutional layer played a vital role in increasing this accuracy to 94.8% when becoming trainable.
This behaviour is expected because the particular medical imaging problem does not involve any underlying and nontrivial features contributing to the outcome. Therefore, DL is not expected to discover new knowledge but to extract standard image features and perform the classification. In this particular problem, the changes in distinct features in shape, texture, and volume of findings between the three images determine the outcome.
3.4.2. Optimisation
The previous comparisons define the total number of trainable layers in this experiment. Various optimisation algorithms are evaluated. The Adam optimiser stands out, exhibiting the best accuracy (
Table 6). However, the stochastic gradient descent (SGD) algorithm yields similar results. Statistical significance tests are required to define if the selection between Adam and SGD is essential. However, this test is beyond the scope of this work.
3.4.3. Other
In this experiment, ParaNet is optimised using the Adam algorithm, whilst the last convolutional layer is trainable. The current setup evaluates various parameters, such as the batch size and the image size. It is observed that the optimal batch size is 50, while the best image input size is that of 350 × 350 (width × height). Therefore, an early stopping strategy is preferable, as
Table 7 suggests. The reader shall note that experimenting with batch sizes larger than 50 is not allowed due to computational capability constraints.
3.5. Investigation of the Impact of Each of the Three Images
The MIBI early phase image, MIBI late phase image, and the 99mTcO4 thyroid image have been processed independently by the three paths of the network in the previous experiments. In this section, the impact of each image on the outcome is investigated.
For this experiment, ParaNet is employed using the optimal parameter and hyperparameter selection, as determined from the previous sections. However, ParaNet is deployed using two paths to process the image pair.
Table 8 showcases the results.
ParaNet performs better when trained with the MIBI early phase image, MIBI late phase image, and the 99mTcO4 thyroid image (94.8%). The MIBI early phase image and the 99mTcO4 thyroid image are enough for the network to obtain an accuracy of 90%. A similar result (accuracy of 89%) is observed when training with the MIBI Late phase and the 99mTcO4 thyroid image. As expected, training with the MIBI Early phase image and the 99mTcO4 thyroid image produces sub-optimal results (41.1% accuracy). This performance is anticipated because the MIBI Late phase image visualises the response of the PG to the administered drug.
3.6. Results Are from Surgically Confirmed Cases
Detailed information from operated cases was available in 472 patients treated surgically at our hospital. According to surgical and histopathological findings, 372 patients had solitary parathyroid neoplasms (369 adenomas and three carcinomas), whereas 97 patients (17 with secondary or tertiary and 80 with primary HPPT) carried two or more abnormal PGs. In three cases, no abnormal PG could be identified during surgery. In four patients, the parathyroid adenoma was located in the mediastinum. These cases were excluded from further evaluation because, with a pinhole collimator, only a small or no part of the mediastinum was included in the imaging field of planar scintigraphy. The results of Nuclear Medicine experts’ diagnosis and the ParaNet model in 465 patients with positive surgical findings in the neck are listed in
Table 9. Only the sensitivity and the false positive rate of tested methods could be examined in this group.
On a patient basis, the sensitivity of the ParaNet model is close to that of medical experts. However, concerning abnormal PGs, ParaNet sensitivity is falling behind experts by about 10% in both solitary neoplasm and multi-glandular disease subgroups. Similar to the findings in the study cohort of 632 patients, the ParaNet’s false positive rate in the operated group is also high.
4. Discussion
The contributions of this study are two-fold. Firstly, a practical DL framework has been proposed to detect abnormal parathyroid scintigraphy images of patients with suspected HTTP. The efficiency of the presented ParaNet topology reached approximately 95% in detecting images with abnormal PGs.
Secondly, the Grad-CAM algorithm is successfully employed to assist human experts in explaining the model’s decisions. However, an extensive evaluation on a PG-level basis revealed that the model could not correctly identify the factual findings’ actual location while producing several false positive findings. Furthermore, an extensive evaluation on a PG level basis revealed that the model exhibited lower sensitivity than the experts in the whole study cohort (83.1%) and surgically confirmed cases (67.6% vs. 77.6% of the experts) while producing several false positive findings (18.2% and 16.9% vs. 4.5% of the experts).
The findings of this study revealed that deep networks might yield remarkable accuracy and minimum losses in terms of metrics, but their proper understanding may be limited. False positive reduction is necessary to improve the diagnostic efficiency of the model and is a matter of future research. The sub-optimal specificity caused by the overwhelming number of FP findings can be explained by two decisive factors constraining the model’s learning capacity. Firstly, there is a substantial data imbalance issue. Normal scans are under-represented (28.48%) in the dataset, thereby introducing susceptibility to biased training and results. Data augmentation has reduced the effect of this issue in model training. However, the imbalance issue remains and may not be circumvented entirely. Secondly, the efficiency of the Grad-CAM algorithm is questionable in a variety of cases, as reported in the literature [
25]. More specifically, Grad-CAM may fail to recognise multiple findings of the same class in the same image. In addition, grad-CAM may poorly visualise the exact location of the important features on some occasions. Therefore, future research involves employing more sophisticated approaches, such as the Grad-CAM++ algorithm [
25].
Nevertheless, the actual agreement with the human expertise reached an acceptable rate (76.5% agreement on a PG level and roughly 95% on a patient level).
The study suffers some limitations. Firstly, the study employed state-of-the-art models solely. Though such models are of undeniable robustness, designing task-specific DL topologies and training them from scratch would potentially exhibit better results and reveal more significant regions of interest. For example, integrating an attention mechanism may enhance the model’s ability to seek important features in vital areas of the image. Moreover, designing a three-component Siamese network [
26], which aggregates the distances of the three input images and computes the gradients based on a carefully designed loss function, may improve the results further.
Moreover, extensive fine-tuning has not been performed for all networks. The selection of VGG19 was based on the performance of all networks under the same setup (i.e., with approximately 3–4 million trainable parameters). Some networks, however, may perform better under more in-depth fine-tuning. Experimenting with various optimisers is also a future research opportunity.
Secondly, the study used the experts’ diagnostic yield as the ground truth. This limitation constrains the horizons of the experiments because we can only measure the agreement with the experts and not the prediction’s precision compared to surgical and histopathologic results. On the other hand, surgical results can provide a minimal number of negative cases, which poses severe limitations for the training purposes of every DL model.
Thirdly, the study uses only planar views for the diagnosis. Future work should consider more views when available. Finally, more data could aid in the re-assessment of the proposed method.
These limitations cannot degrade the importance of the findings. With the absence of related works that use the same image source, this study is the first attempt to introduce DL approaches for localising PGs in parathyroid scintigraphy with 99mTc-sestamibi (MIBI) studies. It is demonstrated that DL can at least compete with human expertise in the specific task, which is very desirable when developing medical decision support systems.


 ,
, 


