Article

Hybrid InceptionV3-SVM-Based Approach for Human Posture Detection in Health Monitoring Systems

by
Roseline Oluwaseun Ogundokun
1,
Rytis Maskeliūnas
1,
Sanjay Misra
2,* and
Robertas Damasevicius
1
1
Faculty of Informatics, Kaunas University of Technology, 51368 Kaunas, Lithuania
2
Department of Computer Science and Communication, Østfold University College, 1757 Halden, Norway
*
Author to whom correspondence should be addressed.
Algorithms 2022, 15(11), 410; https://doi.org/10.3390/a15110410
Submission received: 26 September 2022 / Revised: 31 October 2022 / Accepted: 1 November 2022 / Published: 4 November 2022
(This article belongs to the Special Issue Artificial Intelligence Algorithms for Medicine)

Abstract

:
Posture detection targets toward providing assessments for the monitoring of the health and welfare of humans have been of great interest to researchers from different disciplines. The use of computer vision systems for posture recognition might result in useful improvements in healthy aging and support for elderly people in their daily activities in the field of health care. Computer vision and pattern recognition communities are particularly interested in fall automated recognition. Human sensing and artificial intelligence have both paid great attention to human posture detection (HPD). The health status of elderly people can be remotely monitored using human posture detection, which can distinguish between positions such as standing, sitting, and walking. The most recent research identified posture using both deep learning (DL) and conventional machine learning (ML) classifiers. However, these techniques do not effectively identify the postures and overfits of the model overfits. Therefore, this study suggested a deep convolutional neural network (DCNN) framework to examine and classify human posture in health monitoring systems. This study proposes a feature selection technique, DCNN, and a machine learning technique to assess the previously mentioned problems. The InceptionV3 DCNN model is hybridized with SVM ML and its performance is compared. Furthermore, the performance of the proposed system is validated with other transfer learning (TL) techniques such as InceptionV3, DenseNet121, and ResNet50. This study uses the least absolute shrinkage and selection operator (LASSO)-based feature selection to enhance the feature vector. The study also used various techniques, such as data augmentation, dropout, and early stop, to overcome the problem of model overfitting. The performance of this DCNN framework is tested using benchmark Silhouettes of human posture and classification accuracy, loss, and AUC value of 95.42%, 0.01, and 99.35% are attained, respectively. Furthermore, the results of the proposed technology offer the most promising solution for indoor monitoring systems.

1. Introduction

It is crucial to maintain an upright posture if you want to live a healthy life. The location of your limbs and how you hold your body make up your posture. With the development of new technologies, human employment has become more sedentary, resulting in a decrease in mobility and physical activity [1]. Long periods of sitting while working or studying cause muscular weakness and make maintenance extremely difficult. People have experienced a variety of problems as a result of not taking care of or not maintaining a proper posture. Musculoskeletal complications are more common to affect the spine, neck, back, and shoulder. Today, health problems caused by poor posture are becoming more widespread in all age groups. Some of the variables that contribute to posture-related bad situations include sedentary work habits, lack of exercise, and poor or uneven sitting positions [1]. For example, Kang et al. [2] examined electromyogram data from 12 patients to assess how the neck and upper extremities were affected by the height of the computer desk. When 18 participants used a smartphone for a variety of tasks, Lee, Kang, and Shin [3] used a motion capture device to measure the frequency with which their heads flexed, finding that this was the main source of neck pain. According to a study conducted on 126 students and published in [4], there is a link between a poor forward posture of the neck, that is, a frontward head posture, and neck discomfort, including neck impairment. According to Ruiz et al. [5], sitting positions have an impact on people’s breathing and electrocardiograms. In research on bad head positions, Koseki et al. [6] reported that, compared to neutral head posture, respiratory performance decreased. According to [7], research with 88 school students found that slumped seating severely reduces children’s ability to breathe. To live in good health and an uninfected life, it is important to maintain proper posture when sitting and standing. Different technologies can be employed to detect posture, with wearable [2,8] and non-wearable pieces of machinery being two of the most popular methods [6,9]. For posture monitoring, non-wearable equipment has been utilized, including the Kinect [9] depth camera and the Vicon MX motion analyzer system [6]. The non-wearable technique for posture monitoring is quite efficient, but its use is limited by the viewing angle of the camera. Furthermore, installing depth sensors for posture monitoring in a smart home context would involve a substantial cost outlay. Wearable posture detection systems enable movement flexibility while enabling posture monitoring. An electromyogram, for example, is used in Kang [2] to check posture. In [8], a smart shirt with components of dual inertial dimensions having 9 degrees of freedom is described as being used to monitor back posture. With ML approaches such as decision trees (DT), K nearest neighbors (KNN), and support vector machines (SVM) [5,9,10], the data collected from various sensor technologies could be processed to classify various postures. For example, in [4], the authors classified two postures with up to 99.5% accuracy using DT, KNN, and SVM techniques using ECG and respirational movement. In [9], a max-margin classifier with up to 88.67% accuracy was used to detect position from the video data set. It was based on the traditional SVM technique. According to [10], the classification precision for five sitting positions was greater than 98% using data from 13 piezoresistive devices mounted on a chair. These classifiers included DT, KNN, and SVM. Based on time series data, deep learning has also been used to categorize human activities [11,12,13,14,15]. Many robust and systematic classifiers are available for use with deep learning; some of these are covered later in the article.
Position detection is used in a variety of applications, including health care, surveillance, virtual environments, internal and open-air surveillance, authenticity for animation, detection of human postures, and entertainment [16,17,18,19,20,21,22,23]. Additionally, position recognition can be used within the framework of the human-to-home interface. It is imperative to suggest expertise that can allow distant observation of old and sensitive individuals to live more freely, given the increasing number of aging people and limited medical resources [24,25,26]. It is imperative to maintain a decent posture if you want to live in good condition. Pose refers to the way the body is held and the limbs are arranged. As technology has advanced, people have chosen a sedentary lifestyle, resulting in a decrease in physical activity and mobility [27,28,29,30,31]. The prolonged sitting required for work or study causes a loss of muscle strength. A sedentary lifestyle harms the human body, and poor posture can cause neck, back, and shoulder discomfort if ignored.

Contribution

The prolonged sitting required for work or study causes a loss of muscle strength. A sedentary lifestyle harms the human body, and poor posture can cause neck, back, and shoulder discomfort if ignored.
Consequently, it is significant to manage human behavior to ensure safety and health at work and in the field of studies. The study describes five significant contributions that are described in the following, considering the need:
  • This study implemented an innovative InceptionV3 and SVM technique to automatically identify the posture of a human. It is worth stating that the deep learning TL technique does not require hand-crafted features, unlike the ML models.
  • The proposed technique used an L2 regularizer of 0.01 and L1 regularization (LASSO FS).
  • To advance the accuracy of the suggested method, the study used different techniques during the data preprocessing phase. The techniques include the use of data augmentation to prevent model overfitting and the use of the LASSO (L1 regularization) feature selection (FS) algorithm to improve model training, validation, and testing accuracy.
  • The layers of the DCNN model (InceptionV3) were also fine-tuned to achieve better training, validation, and testing accuracy.
  • A thorough comparison of the experimental results is made using cutting-edge methods to assess how well our suggested technique performs.
The DCNN technique utilized in this work project is to improve the performance of human posture recognition. The sitting, bending, standing, and laying positions can be identified. The ability of humans to monitor their activities when sitting for an extended time or standing for a short period makes sitting and standing postures crucial to detect.
The remaining portions of this article are arranged as follows: Related work in the area of sensor-based motion detection is described in depth in Section 2. The approach used for the experimentation of this research is presented in Section 3. The results are covered in Section 4, and the conclusion is found in Section 5.

2. Related Works

Numerous studies have been conducted in the literature to develop various postural models. Here, the authors provide an overview of the most recent methods for detecting human postures.
Using smart technology and portable systems to anticipate and monitor human health is a crucial component of smart cities. As a result, multisensory and LoRa (long-range) technologies are used in this work to decide posture recognition in this work. Low cost and extended communication range are two benefits of LoRa WAN technology. Wearable clothing is created with the help of these two technologies, multisensory and LoRa so that it is comfortable in any position. Due to LoRa’s low transmitting frequency and short data transfer size, multiprocessing was employed in this research. For multiprocessing, sliding windows are used, and Random Forest (RF) is used for feature extraction, data processing, and feature selection. Three testers from a 500-group data set are used to improve performance and accuracy [32]. Along with body language, gestures, and postures are nonverbal ways of communicating. This study uses cutting-edge body tracking technologies and augmented reality to detect static posture. Furthermore, group collaboration and learning are detected using unsupervised machine learning using Kinect body position sensors [33]. Accurate yoga practice has been made possible by posture detection. The real-time basis and limited data sets make posture identification a difficult task. Therefore, a sizable data set containing at least 5500 photographs of various yoga positions have been produced to address this problem. The tf-pose estimation technique, which depicts the human body’s skeleton in real-time, has been utilized for posture identification. The tf-pose skeleton is used as a feature to create multiple ML techniques and it is used to extract the positions of the joints in the human body (SVM, KNN, logistic regression, DT, NB, and RF). The highest precision of all is provided by the RF model [34,35,36]. Because people spend most of their time sitting, there is also another posture issue that affects them.
Physical and mental health are affected by inadequate and prolonged sitting. Data collection for sitting posture and stretch posture is done with the help of a posture training system. Subsequently, a smart cushion that combines pressure sensors and artificial intelligence (AI) to identify posture. Supervised machine learning models that produce higher results are taught for more than 13 different postures [37]. The pressure sensor on the chair works to prevent unhealthy sitting positions. The analysis is in contrast to DT and RF in this posture detection. The RF classifier [38] is the one that performs best. Sitting posture monitoring systems (SPMSs) are utilized to improve sitting posture. Sensors have been installed. Six different sitting positions are taken into account for this experiment. Then, several ML techniques (such as SVM with RBF kernel, SVM linear, RF, QDA, LDA, NB, and DT) are employed for the body weight ratio, which is determined by SPMS. The results of SVM using the RBF kernel are more accurate than those of other methods [39]. The posture of a person sitting in a wheelchair may also be detected using sophisticated devices. Data are collected from a network of sensors using the neighborhood rule (CNN), balanced using the Kennard-stone technique, and then the dimensions are reduced using principal component analysis. Finally, preprocessed and balanced data are subjected to the KNN algorithm. The amount of data in this study is substantially less, but the results are astonishing [40].

3. Materials and Methods

This section discusses the suggested model for the detection of human posture. The data set used and each of the TL algorithms implemented. Figure 1 shows the framework for the suggested system. The models used in this study are also discussed in this section.

3.1. Data Collection

The study used silhouettes from the human posture dataset. It was obtained from the Kaggle repository. Four postures, sitting, standing, bending, and lying, are included in the data, which were compiled to identify human poses. Each of the mentioned postures had a total of 1200 photos, each of which was 512 pixels wide and high. The link to the data set is https://www.kaggle.com/datasets/deepshah16/silhouettes-of-human-posture (accessed on 23 August 2022). Table 1 presents the data distribution for each of the postures in the data set. A total of 768 images of bending, lying, sitting, and standing were used for the model training (in total 3072 images). A total of 768 images, which are 192 images each for the bending, lying, sitting, and standing positions. Lastly, the test data set was 960 images in total, with each of the postures being 240.

3.2. Model Selection

Through the classification process, we selected the right deep convolutional neural network and machine learning methods from the available choices. The performance of different DCNN models was examined during the model selection process and the DCNN technique that performed the best was chosen. On a separate test set, the effectiveness of the chosen DCNN model (model evaluation) was examined. The weights of the target model were initialized with a transfer data set to perform transfer learning [41]. Consequently, the target model had previously received object recognition training. However, these objects were not those of the intended task (bending, lying, sitting, and standing human postures). As a result, our training set of annotated human images was used to fine-tune the baseline techniques.
SVM has been tested in a variety of computer vision applications, including image identification and handwritten digit identification, with positive outcomes (support vector machines for remote sensing image classification). Since SVM can manage both semi-structured and structured data, as well as advanced functions if the right kernel function can be generated, it was also applied. The adoption of generalization in SVM reduces the likelihood of overfitting and allows scaling with high-dimensional data. It is not trapped in a local optimum [42].
Deep convolutional neural networks serve as the foundation networks for deriving abstract feature maps from input data. Baseline networks are common architectural building blocks that can be used with different data sets for image categorization [41,43]. LASSO FS was selected due to its automatic selection of features and its ability to reduce overfitting in models [44].
In this study, we evaluate the base networks InceptionV3 [45], DenseNet121 [46], and ResNet50 [47].

3.3. Proposed Model

This study proposed a hybrid approach that involves the combination of three algorithms. The algorithms are Inception V3 and SVM. The posture data set was first preprocessed by normalizing and augmenting the images for classification. The LASSO FS algorithm was then used in the image data set to select features, after which it was passed for modeling training and validation. The study used the Inception V3 TL model, which was already fine-tuned, and the last layer of the model was replaced with the SVM classifier for hybridization purposes. The flow of this suggested model is revealed in Figure 1.

3.4. Selection Based on Least Absolute Shrinkage and Selection Operator (LASSO)

The least absolute shrinkage and the selection operator are referred to as LASSO. It is a statistical formula for the selection and regularization of features of data models (FS). LASSO regression is a regularization technique. Regression methods are favored for a more precise forecast. This model takes advantage of shrinkage. Shrinkage is the term for when data values decrease in magnitude as they approach the mean. The LASSO approach (that is, models with fewer parameters) stimulates easy light models [48]. This certain category of regression is suitable when a model displays high levels of multicollinearity or when you want to systematize key aspects in the model selection procedure, such as variable selection and parameter removal. The L1 regularization method is used by the LASSO regression when there are more features, as the feature selection process is automated [48].
i = 1 n ( Y i j = 1 p X i j β j ) 2 + λ j = 1 p | β j |
In Equation (1), if lambda is zero then we will receive OLS while the very large value will make coefficients zero henceforth it will under-fit [49].

3.5. Deep-Transfer Learning Based on InceptionV3

A new classification platform called transfer learning (TL) can classify and identify images. This technique improves the accuracy of network performance while requiring less training time. For this investigation, the Inception V3 network was chosen. More than a million photos from the ImageNet collection are included in its pre-trained weights. The network can classify photos into 1000 different classes, each of which represents a different item. A total of 5 convolutional layers, 1 average pool layer, 2 maximum pooling layers, 1 FC layer, and 11 inception modules that constituted an image-wise categorization make up the V3 inception V3 architecture.
The author transferred pre-trained weights from the inceptionV3 network and further fine-tuned the layers. InceptionV3 has 189 layers and freezes the layers from 180 to the top and then unfrozen from layer 180 to the output layer. In the study, the authors added two dense layers and an output layer after flattening the network. A dropout of 0.5 was introduced after each dense layer to prevent the model from overfitting. At the output layer, 1000 classes of the conventional inception V3 mode were reduced to 4 classes representing human postures due to the fine-tuning process, whereas the rained weight before the dense layers was unchanged. The tuning process increases the accuracy, precision, recall, AUC, and other metrics used for the evaluation of the TL model. The figure shows the working flow of the fine-tuned inceptionV3. This study utilized the relu activation function for the two dense layers and softmax for the dense FC dense layer.

3.6. Support Vector Machine

SVM is an effective computational mathematical model for classification tasks. SVM is a supervised learning methodology used in the areas of classification and regression [50]. It is highly effective and has a strong statistical basis [50]. The classification function of an SVM is carried out by creating a hyperplane in higher dimensions. The support vector method (SVM) looks for those vector points that form the decision border and provide a significant marginal separation between classes [51]. In the decision plane, SVM separates classes with the largest possible marginal distance possible [51,52,53].

3.7. L2 Regularization

Regularization is a key idea that helps prevent the model from overfitting, particularly when training and test sets of data have large differences. Regularization is used to reduce the variance with the training data by adding a “penalty” term to the best fit obtained from the training data. It similarly restricts the impact of forecaster variables on the output variable by condensing their coefficients [54]. By requiring weights to be minimal but not exactly zero, L2 regularization, also known as the L2 norm or Ridge (in regression issues), combats overfitting. This implies that if the suggested models were to estimate home prices again, the less important variables would still have some impact, although a minor one. When conducting the L2 regularization, the authors add a regularization term equal to the totality of the squares of all characteristic weights to the loss function [54].
i = 1 n ( y i j = 1 p x i j β j ) 2 + λ j = 1 p β j 2
At this point, if the Lambda is zero, you can envisage that we will get the OLS once more. However, if Lambda is very large, it enhances too much weight and causes inadequate adaptation. Having stated that, the method used to select lambda is crucial. This method is quite effective in preventing the overfitting problem [49].

3.8. Hyperparameter Optimization

The learning process and the structural structure are controlled by several hyperparameters, which may be classified as either structural or algorithmic hyperparameters [55]. The structure and topology are characterized by structural hyperparameters, which include the number of layers of the network, the number of neurons in each layer, the degree of connection, the neuron transfer function, and others. They alter the network’s structure, which affects the effectiveness and computational complexity. The learning process is driven by algorithmic parameters, including the size of the training set, the training method, the learning rate, and other factors. Although these variables do not belong to the neural network model and do not affect how well it performs, they do affect how quickly and effectively the training step goes.
A machine learning model’s hyperparameter settings are a predetermined set of choices that directly affect the learning process and the output of the prediction, which shows how well the model works. Model training is the process of instructing a model to find patterns in training data and predict the outcome of incoming data based on these patterns. In addition to the hyperparameter selections, model architecture, which reflects the model’s complexity, has a direct bearing on how long it takes to train and test a model. The setting has become a crucial and challenging problem in the application of ML algorithms due to their influence on model performance and the fact that the ideal collection of values is unknown. In the literature, there are several methods to adjust the hyperparameters.
Manual search is one way to improve these hyperparameters. This may be used when the researcher has a solid understanding of neural network structure and learning data since it determines the hyperparameter value based on the researcher’s intuition or skill. However, the standards for choosing hyperparameters are ambiguous and require several experiments.
To choose the ideal hyperparameter values for ML algorithms, designs of experiment (DOE) methods are utilized. DOE evaluates the effects of several experimental components simultaneously, with each experiment consisting of many experimental runs at various hyperparameter values that should be evaluated collectively. The experimental data are statistically examined when the tests are finished to ascertain how the hyperparameters affect the performance of the classifiers. In other words, a model that empirically connects classification performance to hyperparameters, such as prediction errors (as a response variable) (as predictors of classifier performance).
In the domain of DL, it is established that a technique is trained straight from the data in an end-to-end way, meaning that time-consuming manual feature extraction is not necessary from the human (domain experts). However, the model selection procedure in deep learning requires significant human work. Discovering the hyperparameter settings that result in the optimum performance is the first step in this procedure. The best hyperparameter values can typically be found using one of three methods: manually built on previous knowledge; arbitrarily selected from a set of candidate hyperparameter values; or in-depth grid search. Based on previous research, the authors applied the manual method in this paper. The learning rate is reduced when it is noticed during the model training that there is no improvement in the validation training value. The learning rate is set to be reduced every 10 epochs.
The proposed CNN architecture includes several hyperparameters. These hyperparameters should be carefully selected because they control the performance of the suggested technique. The details of the hyperparameter settings are given in Table 2. The study experimentally finds that these are the best suitable values of hyperparameters for the proposed Inception V3-SVM model and other pre-trained networks for this application.

3.9. Performance Metrics

The confusion matrix (CM) can be utilized to evaluate the effectiveness of an approach or its parameters. A table called a confusion matrix contains data on categorization outcomes. It is also a technique for evaluating how well a model performs in distinguishing data from various classes.
Several performance measures, including training and validation accuracies, training and validation losses, precision, recall, f1 score, and AUC, were used in this work to evaluate the effectiveness of the suggested and cutting-edge models [56,57,58,59,60,61,62,63,64,65].
The results of the confusion matrix table (Table 3) can calculate the precision, precision, recall, and f1 score. Techniques have been created with the following equations.
Accuracy: This is one parameter for accessing classification models and is referred to as the percentage of correct forecasts made by the proposed model. The equation is shown in Equation (3).
A c c u r a c y = T P + T N T P + T N + F P + F N
Precision: Precision is the degree to which the forecast of a model is correct. When calculating precision, one divides the total number of positive predictions by the proportion of genuine positives. This is illustrated in Equation (4).
P r e c i s i o n = T P T P + F P
Recall: Recall is a metric that determines the proportion of accurate true positives among all possible positive forecasts.
R e c a l l = T P T P + F N
F1 score: One of the most crucial evaluation measures in machine learning is the F1 score. Through the combination of two previously opposing indicators, it elegantly summarizes the prediction performance of a model.
F 1 - s c o r e = 2 × P r e c i s i o n × R e c a l l P r e c i s i o n + R e c a l l

3.10. Model Uncertainty

Deep learning techniques have received a great deal of attention in practical machine learning. Such methods for regression and classification do not, unfortunately, account for model uncertainty. In comparison, Bayesian models offer a mathematically sound framework for evaluating model uncertainty and often have exorbitant processing costs [9]. At the software level, the effectiveness of the model cannot be easily quantified as accuracy. To demonstrate how certain we are in our detection and classification, we, therefore, add a new indicator: the confidence score. A confidence score is a great tool to quantify uncertainty. Our model in this research is a non-Bayesian network. For estimating uncertainty, Monte Carlo Dropout (MC Dropout) [66] and Deep Ensembles [67] are the two primary non-Bayesian approaches. One of the most widely used methods to avoid overfitting is the dropout technique. Gal et al. [66] show that by selecting the Bernoulli distribution with a probability such as a dropout probability, we can determine the model uncertainty. With MC Dropout, the dropout layer is used during the training and then testing phases, and many predictions are made on a single image to calculate the degree of uncertainty. We decided to use MC Dropout for this research. It uses smaller hyperparameters and uses fewer processing resources [68].
There are only two dropout layers in the study since the dropout layer was added to the model after each fully connected (FC) layer. The dropout layer is often implemented throughout the training procedure to prevent overfitting. The dropout will be automatically performed during the analysis process to guarantee consistency in the prediction outcome for the same image. We must activate the dropout layer in MC Dropout’s prediction phase so that each prediction’s softmax value changes, affecting how it is classified. The following stage involves making 100 predictions with each target image, with the majority of the estimates’ findings serving as the categorization for the subsequent forecasts. The proportion of the confidence score will be determined by the number of forecasts. If the confidence score value is less than a predetermined threshold, such as 80%, none of the positive and negative forecasts will be greater than 80 times in a sample of 100 predictions. We believe that this circumstance is difficult to anticipate and calls for accurate manual processing.
The study initially chose the ideal MC dropout rate to quantify the uncertainty of the model. The dropout rate should be balanced so that it is neither too high nor too low. The estimated confidence intervals for the distribution will be excessively large if the dropout rate is too high since this will result in a very diversified predictive distribution. If it is too small, the confidence intervals will be narrow, and the forecast distribution will be too similar. We conducted experiments to determine the ideal dropout rate for this application, which is 0.452. Finally, the confidence interval, standard deviation (SD), and entropy may be used to calculate the uncertainty of the model.

4. Results

Here, the study evaluates the efficiency of the recommended technique and contrasts it with cutting-edge approaches. To assess the performance of our suggested model, the authors applied three different cutting-edge models, including the inceptionV3, resnet50, and densenet121 models on the posture dataset.
This section has three parts. In Section 4.1, the implementation authors first provide the settings and assessment methods. In Section 4.2, the authors compare the performance of the suggested technique with many current-generation models that are often cited in the literature. In addition, Section 4.2 provides information on how well the suggested model performs in detection settings.

4.1. Implementation Settings

To make the evaluation more authentic, the authors used the same data set to implement three existing techniques, including the conventional inceptionV3. The workstation used for the implementation of this study is as follows: Dell laptop, Intel Core i7 with 16 GB of RAM. The Jupyter Notebook in Anaconda Navigation was used with the TensorFlow application.
All necessary libraries were imported into the Jupyter environment, after which the dataset was uploaded, and their width and height sizes were resized to 150 × 150. The images were normalized by making sure that all numeric values are in the same range between 0 and 1, and this helps the large values not overwhelm the smaller values. The normalization function receives an array as an input, uses a formula to normalize the array’s values in the range of 0 to 1, and outputs the normalized array. The data set was divided into 3072 for training, 768 for validation, and 960 for testing (already explained in Section 3.1). The next step was the introduction of image-augmentation techniques, which are rotation_range (20), width_shift (0.3), height_shift (0.3), shear_range (30), zoom_range (0.2), and horizontal_flip (0.2). The L1 and L2 regularization was then defined and implemented, after which the model was defined for training, validation, and testing of the data set. A batch size of 32 and epochs of 50 were used for model training. The early stopping technique was called and set to avert the model from overfitting. The LR was also set to reduce when there is no improvement in the metrics or the performance is stagnant, this will assist to improve the model metrics.

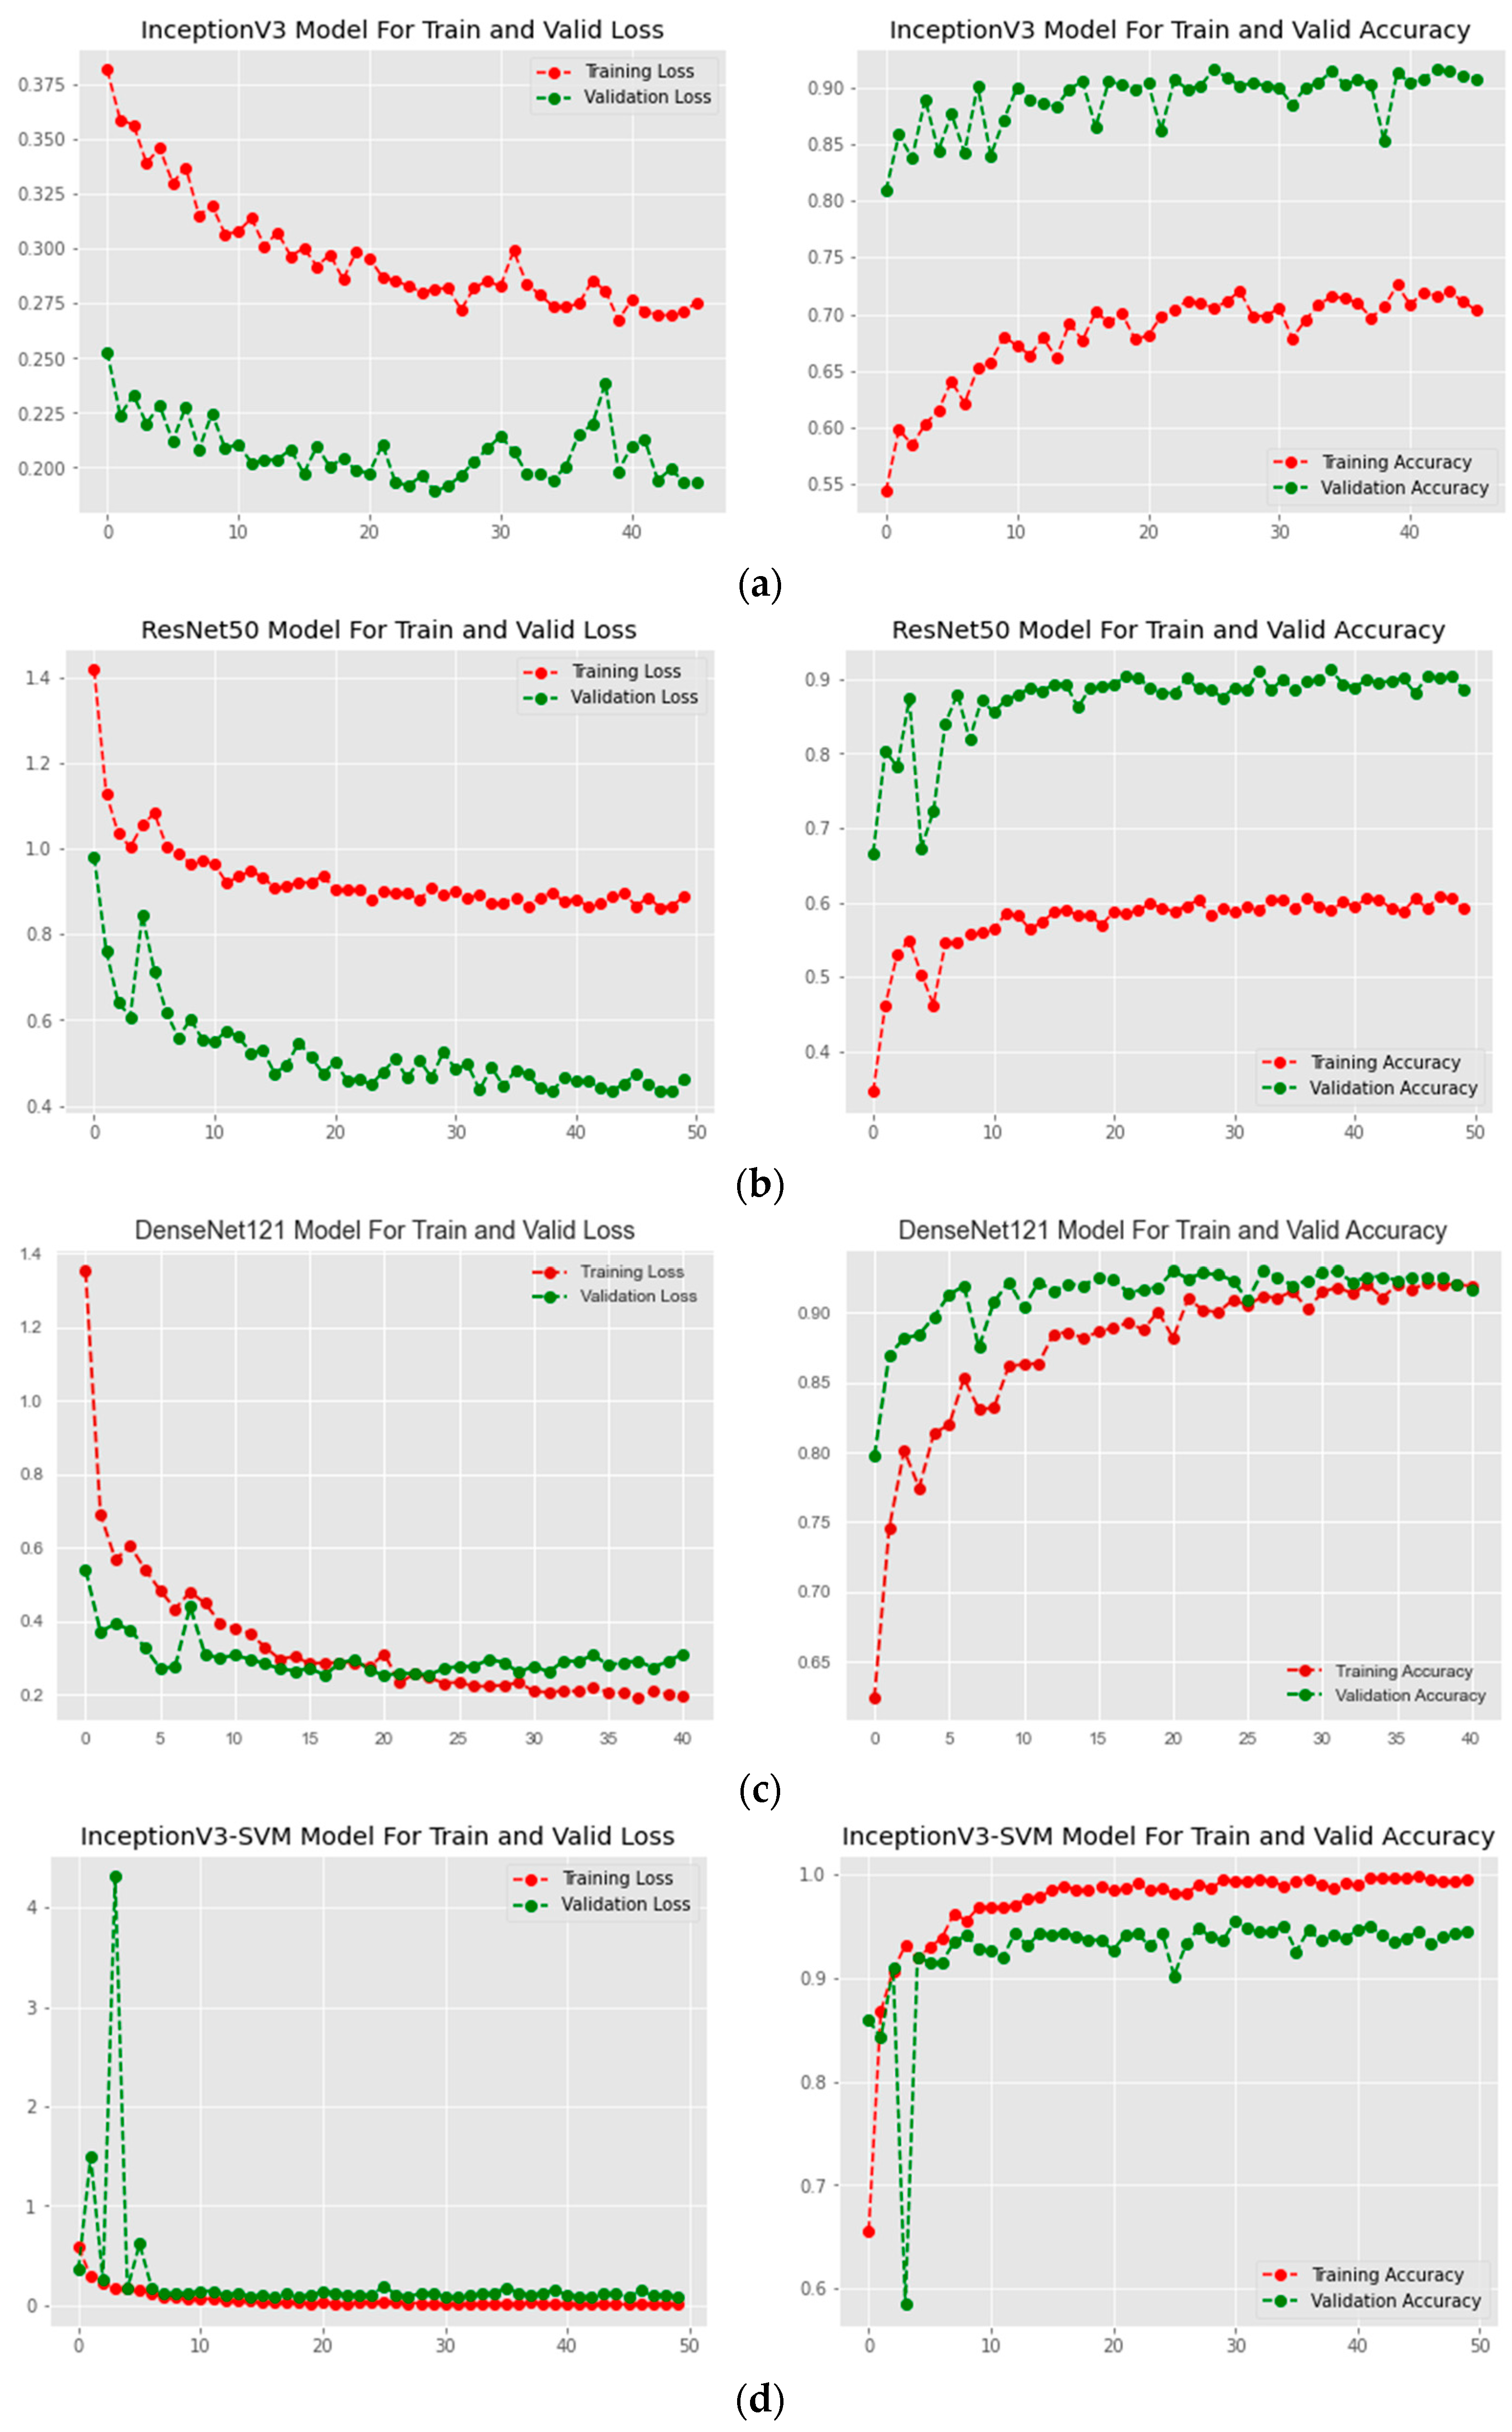
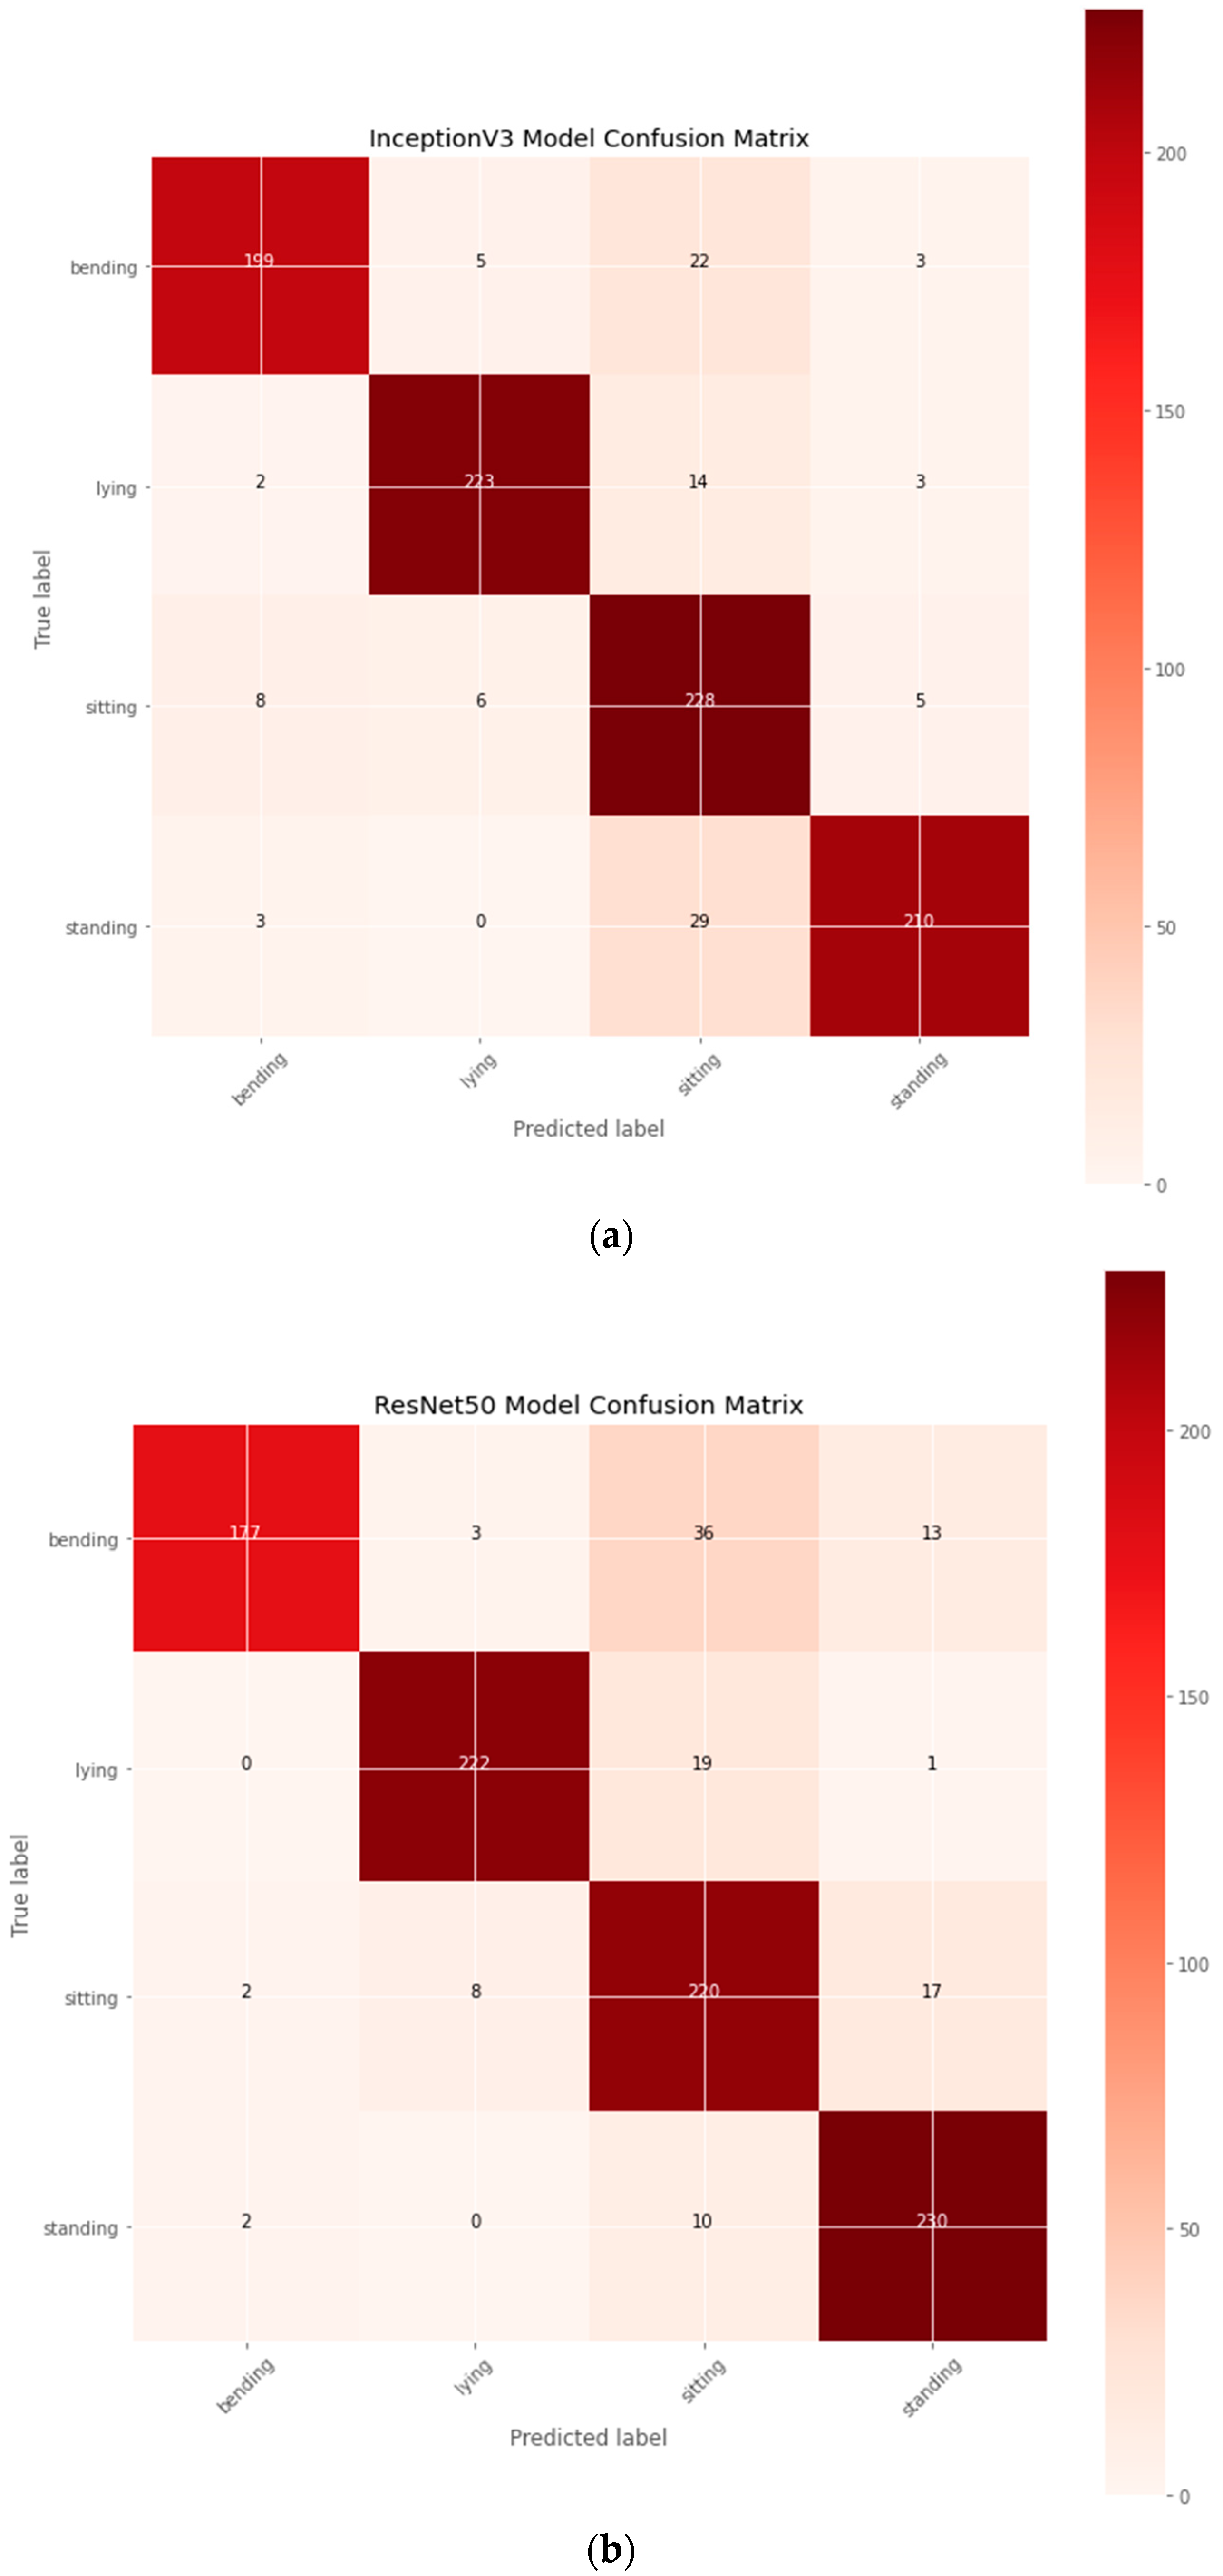
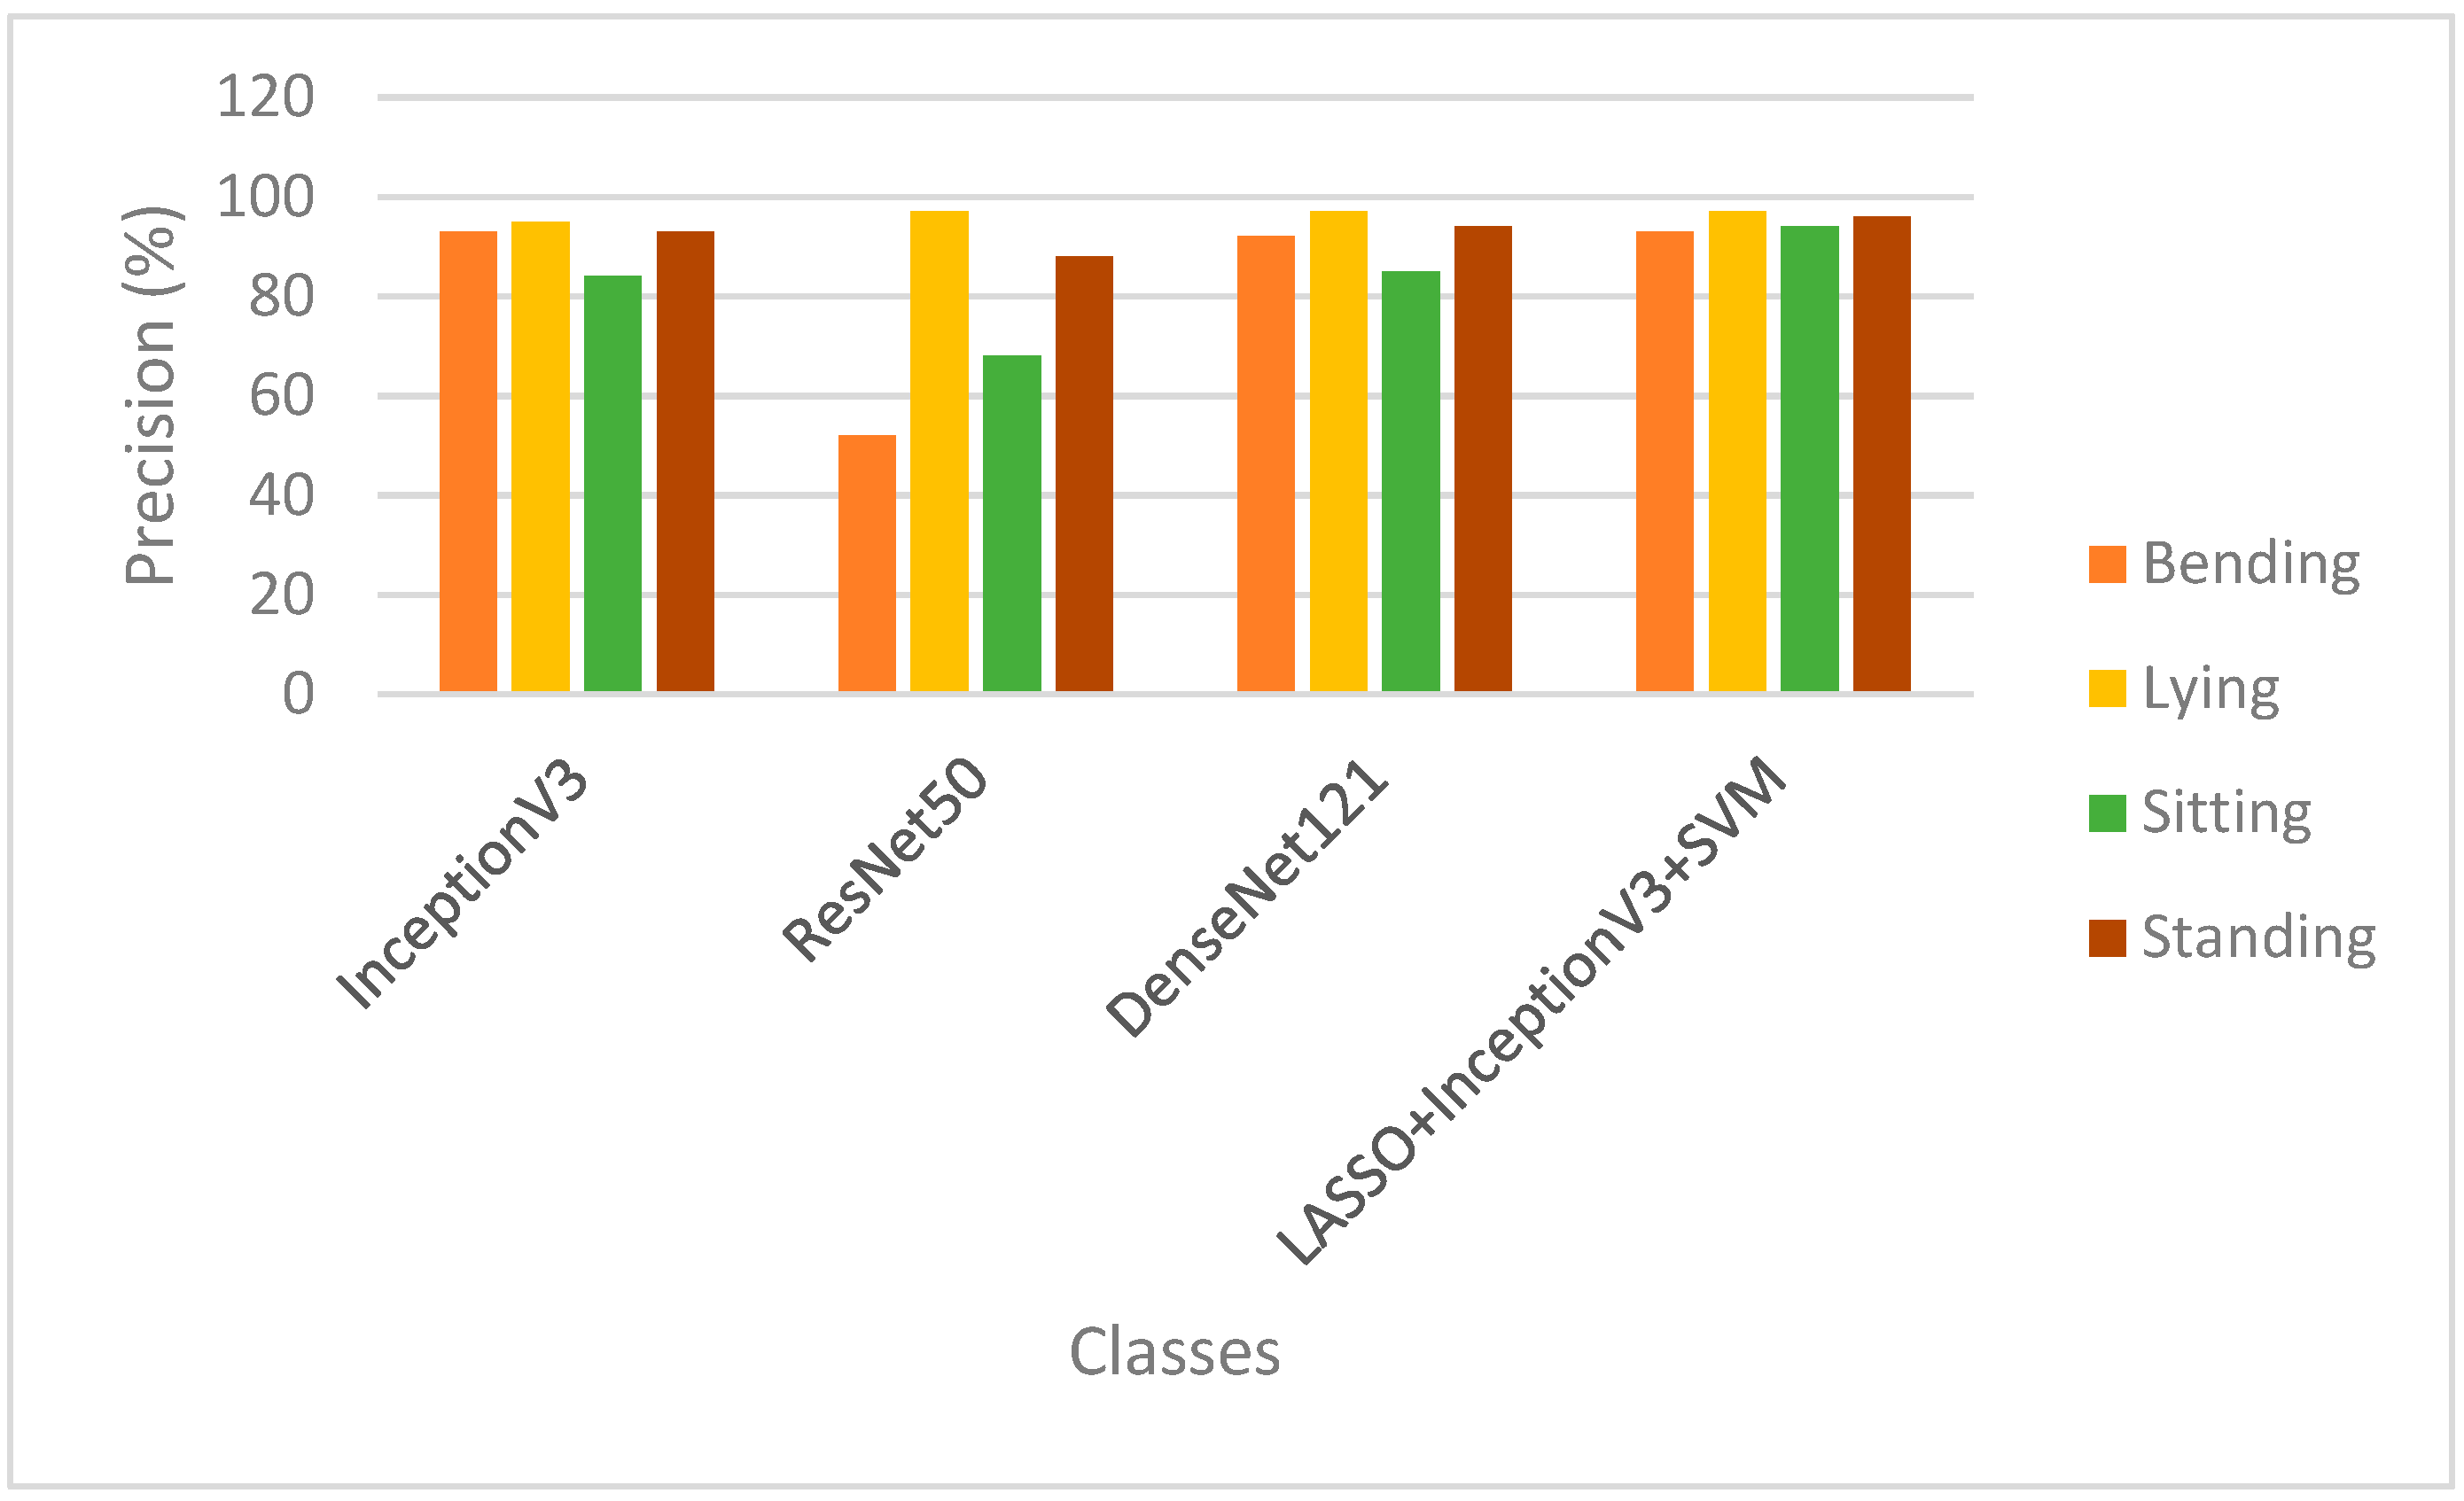
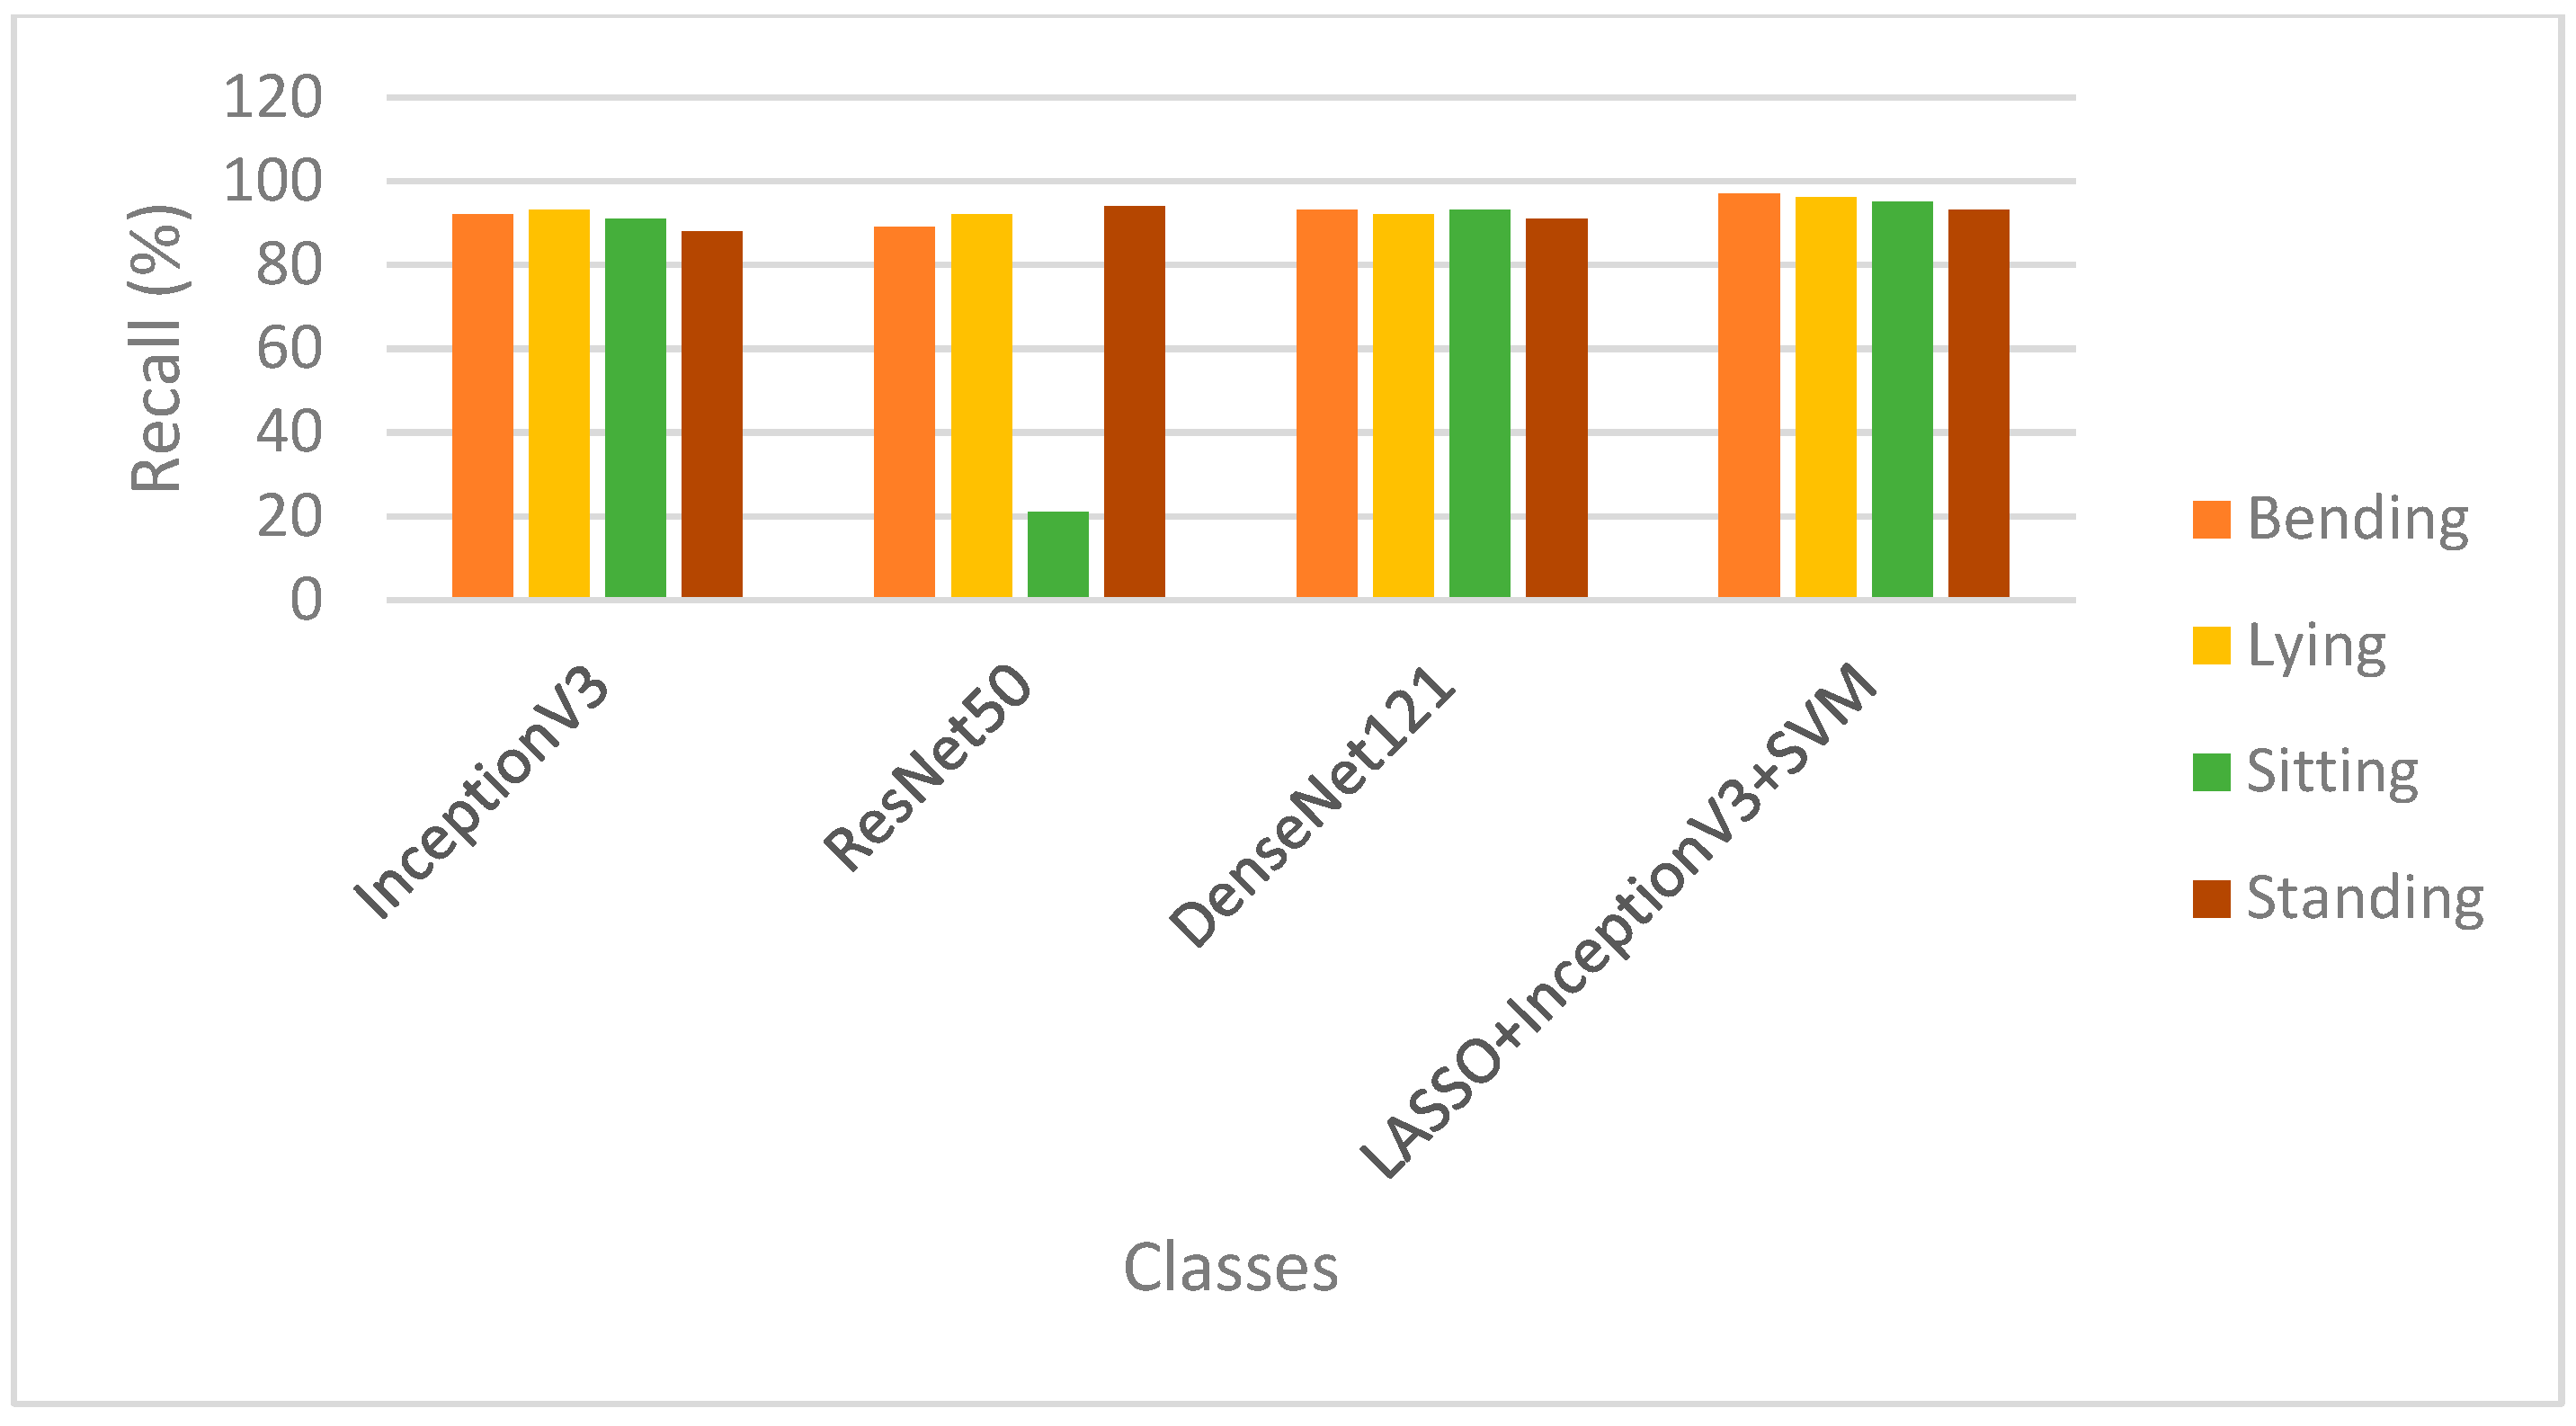
4.2. Performance Evaluation

The study offered the results for the execution and the suggested model’s training performance was assessed in terms of crucial metrics, such as training accuracy, validation accuracy, training loss, and validation loss at 50 epochs for the suggested models and the three cutting-edge models. The learning rates of 0.0010, 0.0007, 0.00049, 0.00034 and 0.00024 were optimized with adaptive moment estimation (Adam). According to Table 4, the suggested model achieved better results with an LR of 0.0010 and an Adam optimizer. These variables are generated to evaluate trained models with an Adam-optimized learning rate of 0.001. These parameters are calculated to estimate the excess fit of the trained model. The graphs of the training loss/validation loss and the training accuracy/validation accuracy of the proposed model and the baseline models are shown in Figure 2. Furthermore, the test data set was used for the testing process, and the testing loss and accuracy can be seen in the table. A confusion matrix was also produced for all the models implemented to calculate performance metrics such as precision, recall, f1 score, and accuracy. Each model parameter used for the training and validation of the model is shown in Table 5. The results of the models in the training and validation data set are shown in Table 6. Table 7 displays the results of the proposed models in the test dataset, and each class consists of 240 instances. It can also be shown in Table 7 that the proposed InceptionV3-SVM and DenseNet121 outperform the other baseline models with an ACU of 0.99. The proposed model had TP and FP values of 916 and 44, respectively.
The confusion matrix was produced utilizing a sample of the test dataset samples from the human posture dataset used for the implementation. These test data sets were not used for model training and validation. The confusion matrix for DCNN models is represented in Figure 3, and the labels are represented as bending, lying, sitting, and standing, respectively.
Figure 4 shows the AUC-ROC curves for the four DCNN models implemented, and it was seen that the proposed InceptionV3-SVM performs best compared to the baseline models.
The suggested model produced average values of 0.95 precision, 0.96 recall, and 0.95 f1 scores. The suggested model per class classification report is fully displayed in Figure 5, Figure 6, Figure 7 and Figure 8 based on precision, recall, f1 score, and precision, respectively. By looking at the number of postures categorized correctly and wrongly, the suggested model was also examined to determine if the anticipated label matched the actual label.

5. Discussion

The suggested model has nominal training and validation losses compared to the three other conventional TL models implemented. The best training and validation accuracy was obtained with the suggested hybrid model with a dropout of 0.5, an L2 value of 0.01, and an LR of 0.0010. Figure 2d shows that the training precision was stable between epochs 15 to 25. This points to the fact that the model was not learning anymore, after which the model started learning again from Epochs 26. Similarly, the validation accuracy remained the same after Epoch 15 and continued to increase after epoch 25. Although conventional TL models were capable of performing satisfactorily with the utilization of a dropout of 0.5, the precision was lower than that of the proposed model with a dropout of 0.5, LR of 0.0010, and L2 of 0.01. The overfit was reduced to minimal with the use of dropout and regularization of L2 (as in the suggested model). In Table 4, the suggested model obtained the best training and validation accuracy at epochs 39 for the classification of human posture classification. As revealed in Table 8, the proposed model created on the set parameters produced a test result with a classification accuracy of 0.95. It was obvious from the results that the suggested model accurately classified the four classes of bending, lying, sitting, and standing. As seen in Table 6, for all classification problems, the test accuracy of the suggested technique (InceptionV3-SVM) is superior to the other CTL models. From the result of the class classification in Figure 5, ResNet50, DenseNet121, and the proposed models had the highest precision of 97% to differentiate lying posture from other postures. In Figure 6, the proposed model had the highest recall of 97% and 96% to distinguish bending and laying accordingly from other postures. In Figure 7, the proposed InceptionV3-SVM model has the highest f1 score of 97% and 95% in differentiating lying, bending, sitting, and standing, respectively. Finally, in Figure 8, the proposed model outperformed other CTL models with an accuracy of 95% in the test data set.

6. Comparative Analysis with Existing Models

To the authors know, the suggested approach is the first to combine a CTL model with an FS method and a machine learning algorithm for the categorization of human posture detection. The authors tested the proposed model on related research that used the same parameters (test dataset), as given in Table 9, to evaluate our model. As can be observed, the suggested model produced the best results for all criteria. Gochoo et al. [69] and Dedeoglu et al. [70] used human silhouette and object silhouette data, respectively, and had a classification accuracy of 92.50% and 76.88% while the proposed model similarly used human silhouette data and obtained a classification accuracy of 95.42%, which means the model performed better than the existing systems.
As presented in Section 1, most of the research used DL and ML methods for posture classification. As revealed in Table 8, the multiclass classification of the suggested model outperformed the results in Ghazal & Khan [71], Luna-Perejón, Montes-Sánchez et al. [72], and Wai et al. [73], attaining an accuracy of 95%, which is 2% higher than the accuracy attained obtained by the study in Ghazal & Khan [71] and Wai et al. [73], as well as 14% higher than Luna-Perejón, Montes-Sánchez et al. [72]. This indicates how useful our model is. Furthermore, in our comparison research, the authors found that the suggested model outperformed the most recent models, achieving classification accuracy and precision of 95% and 95%, respectively.

7. Conclusions

In this research, the authors implemented an FS technique, a pre-trained model, and an ML algorithm to earn features simultaneously from human posture (HP) images, and the learned features were hybridized for posture classification. Future work will expand on this technology to detect additional postures in images and image sequences to help interpret behavior in surveillance recordings. Using human posture images from the Silhouettes of Human Posture collection as a baseline, which contains four types of HP: bending, laying, sitting, and standing, the authors conducted extensive trials to verify our theory. To classify HP accurately and precisely, the authors examine the efficacy of employing hybridized models. The findings of our investigation were provided in depth along with their relationship to the number of classes needed to classify HP. The findings of the proposed model indicated that HP classification using the suggested model increases both the training and validation accuracy. The accuracy of HP classification issues improved by between 2% and 14% when our results were examined in contrast to those of three other existing conventional DCNN approaches implemented. In conclusion, the suggested technique was shown to achieve much better results than the other three techniques when tested using the 20% test data set aside.
Future work will expand on this technology to detect additional postures in images and image sequences to help interpret behavior in surveillance recordings. In future research, model uncertainties and external data validation are proposed. The model predictions will also be conducted in the future using the test dataset set aside.

Author Contributions

Conceptualization, R.M.; methodology, R.O.O.; software, R.O.O.; validation, R.O.O., R.M. and R.D.; formal analysis, R.O.O., R.M., R.D. and S.M.; investigation, R.O.O., R.M. and R.D.; resources, R.M.; data curation, R.O.O.; writing—original draft preparation, R.O.O. and R.M.; writing—review and editing, S.M. and the study R.D.; visualization, R.O.O.; supervision, R.M.; project administration, S.M. and R.M. All authors have read and agreed to the published version of the manuscript.

Funding

This research received no external funding.

Institutional Review Board Statement

Not applicable.

Informed Consent Statement

Not applicable.

Data Availability Statement

The data presented in this study are openly available in the Kaggle repository https://ieee-dataport.org/ (accessed on 23 August 2022). https://www.kaggle.com/datasets/deepshah16/silhouettes-of-human-posture (accessed on 23 August 2022). The codes required to execute this study have already been posted to the GitHub repository and can be found in the repository: https://github.com/Roseybaby/LASSO-InceptionV3-SVM.git (accessed on 23 August 2022).

Conflicts of Interest

The authors declare no conflict of interest.

References

  1. Gupta, R.; Saini, D.; Mishra, S. Posture detection using deep learning for time series data. In Proceedings of the 2020 Third International Conference on Smart Systems and Inventive Technology (ICSSIT), Tirunelveli, India, 20–22 August 2020; pp. 740–744. [Google Scholar]
  2. Kang, B.R.; Her, J.G.; Lee, J.S.; Ko, T.S.; You, Y.Y. Effects of the Computer Desk Level on the musculoskeletal discomfort of Neck and Upper Extremities and EMG activities in Patients with Spinal Cord Injuries. Occup. Ther. Int. 2019, 2019, 3026150. [Google Scholar] [CrossRef] [PubMed] [Green Version]
  3. Lee, S.; Kang, H.; Shin, G. Head flexion angle while using a smartphone. Ergonomics 2015, 58, 220–226. [Google Scholar] [CrossRef] [PubMed]
  4. Kim, E.-K.; Kim, J.S. Correlation between rounded shoulder posture, neck disability indices, and degree of forward head posture. J. Phys. Ther. Sci. 2016, 28, 2929–2932. [Google Scholar] [CrossRef] [PubMed] [Green Version]
  5. Ruiz, A.D.; Juan, M.S.; Juan, L.M.; Beatriz, G.F. Characterization of the cardiovascular and respiratory system of healthy subjects in Supine and sitting position. In Iberian Conference on Pattern Recognition and Image Analysis; Springer: Cham, Switzerland, 2019; pp. 367–377. [Google Scholar]
  6. Koseki, T.; Kakizaki, F.; Hayashi, S.; Nishida, N.; Itoh, M. Effect of forwarding head posture on thoracic shape and respiratory function. J. Phys. Ther. Sci. 2019, 31, 63–68. [Google Scholar] [CrossRef] [Green Version]
  7. Haque, M.F.; Akhter, S.; Tasnim, N.; Haque, M.; Paul, S.; Begum, M.; Chittagong, B. Effects of Different Sitting Postures on Forced Vital Capacity in Healthy School Children. Bangladesh Med. Res. Counc. Bull. 2019, 45, 117–121. [Google Scholar] [CrossRef] [Green Version]
  8. Bootsman, R.; Markopoulos, P.; Qi, Q.; Wang, Q.; Timmermans, A.A. Wearable technology for posture monitoring at the workplace. Int. J. Hum. Comput. Stud. 2019, 132, 99–111. [Google Scholar] [CrossRef]
  9. Ho, L.E.S.; Chan, J.C.P.; Chan, D.C.K.; Shum, H.P.H.; Cheung, Y.; Pong, Y.C. Improving posture classification accuracy for depth sensor-based human activity monitoring in smart environments. Comput. Vis. Image Underst. 2016, 148, 97–110. [Google Scholar] [CrossRef] [Green Version]
  10. Fragkiadakis, E.; Dalakleidi, K.V.; Nikita, K.S. Design and Development of a Sitting Posture Recognition System. In Proceedings of the 41st Annual International Conference of the IEEE Engineering in Medicine and Biology Society (EMBC), Berlin, Germany, 23–27 July 2019; pp. 3364–3367. [Google Scholar]
  11. Wang, Z.; Yan, W.; Oates, T. Time series classification from scratch with deep neural networks: A strong baseline. In Proceedings of the 2017 International Joint Conference on Neural Networks (IJCNN), Anchorage, AK, USA, 14–19 May 2017; pp. 1578–1585. [Google Scholar]
  12. Ogundokun, R.O.; Maskeliūnas, R.; Damaševičius, R. Human Posture Detection Using Image Augmentation and Hyperparameter-Optimized Transfer Learning Algorithms. Appl. Sci. 2022, 12, 10156. [Google Scholar] [CrossRef]
  13. Nunez, J.C.; Cabido, R.; Pantrigo, J.J.; Montemayor, A.S.; Velez, J.F. Convolutional neural networks and long-term memory for skeleton-based human activity and hand gesture recognition. Pattern Recognit. 2018, 76, 80–94. [Google Scholar] [CrossRef]
  14. Xu, J.; He, Z.; Zhang, Y. CNN-LSTM Combined Network for IoT Enabled Fall Detection Applications. J. Phys. Conf. Ser. 2019, 1267, 012044. [Google Scholar] [CrossRef]
  15. Dorbe, N.; Jaundalders, A.; Kadikis, R.; Nesenbergs, K. FCN and LSTM Based Computer Vision System for Recognition of Vehicle Type, License Plate Number, and Registration Country. Autom. Control. Comput. Sci. 2018, 52, 146–154. [Google Scholar] [CrossRef]
  16. Taylor, W.; Abbasi, Q.H.; Dashtipour, K.; Ansari, S.; Shah, S.A.; Khalid, A.; Imran, M.A. A Review of the State of the Art in Noncontact Sensing for COVID-19. Sensors 2020, 20, 5665. [Google Scholar] [CrossRef] [PubMed]
  17. Gogate, M.; Dashtipour, K.; Hussain, A. Visual Speech in Real Noisy Environments (VISION): A Novel Benchmark Dataset and a Baseline System Based on Deep Learning-Based Baseline System. Proc. Interspeech 2020, 2020, 4521–4525. [Google Scholar]
  18. Ahmed, R.; Dashtipour, K.; Gogate, M.; Raza, A.; Zhang, R.; Huang, K.; Hawalah, A.; Adeel, A.; Hussain, A. Offline Arabic Handwriting Recognition Using Deep Machine Learning: A Review of Recent Advances. In International Conference on Brain-Inspired Cognitive Systems; Springer: Berlin/Heidelberg, Germany, 2019; pp. 457–468. [Google Scholar]
  19. Gogate, M.; Adeel, A.; Hussain, A. Deep learning-driven multimodal fusion for automated deception detection. In Proceedings of the 2017 IEEE Symposium Series on Computational Intelligence (SSCI), Honolulu, HI, USA, 27 November–1 December 2017; pp. 1–6. [Google Scholar]
  20. Ozturk, M.; Gogate, M.; Onireti, O.; Adeel, A.; Hussain, A.; Imran, M.A. A novel deep learning-driven, low-cost mobility prediction approach driven by deep learning for 5G cellular networks: The case of the Control/Data Separation Architecture (CDSA). Neurocomputing 2019, 358, 479–489. [Google Scholar] [CrossRef]
  21. Adeel, A.; Gogate, M.; Hussain, A.; Whitmer, W.M. Lip-reading driven deep learning approach for speech enhancement. IEEE Trans. Emerg. Top. Comput. Intell. 2019, 5, 481–490. [Google Scholar] [CrossRef] [Green Version]
  22. Ogundokun, R.O.; Maskeliunas, R.; Misra, S.; Damaševičius, R. Improved CNN Based on Batch Normalization and Adam Optimizer. In International Conference on Computational Science and Its Applications; Springer: Cham, Switzerland, 2022; pp. 593–604. [Google Scholar]
  23. Gogate, M.; Hussain, A.; Huang, K. Random features and random neurons for Brain-Inspired Big Data Analytics. In Proceedings of the 2019 International Conference on Data Mining Workshops (ICDMW), Beijing, China, 8–11 November 2019; pp. 522–529. [Google Scholar]
  24. Yu, Z.; Machado, P.; Zahid, A.; Abdulghani, A.M.; Dashtipour, K.; Heidari, H.; Imran, M.A.; Abbasi, Q.H. Energy and performance trade-off optimization in heterogeneous computing through reinforcement learning. Electronics 2020, 9, 1812. [Google Scholar] [CrossRef]
  25. Gogate, M.; Adeel, A.; Dashtipour, K.; Derleth, P.; Hussain, A. Av Speech Enhancement Challenge Using a real noisy corpus. arXiv 2019, arXiv:1910.00424. [Google Scholar]
  26. Dashtipour, K.; Raza, A.; Gelbukh, A.; Zhang, R.; Cambria, E.; Hussain, A. Persent 2.0: Persian sentiment lexicon enriched with domain-specific words. In International Conference on Brain-Inspired Cognitive Systems; Springer: Berlin/Heidelberg, Germany, 2019; pp. 497–509. [Google Scholar]
  27. Taylor, W.; Shah, S.A.; Dashtipour, K.; Zahid, A.; Abbasi, Q.H.; Imran, M.A. An intelligent noninvasive real-time human activity recognition system for next-generation healthcare. Sensors 2020, 20, 2653. [Google Scholar] [CrossRef]
  28. Koubaa, A.; Ammar, A.; Benjdira, B.; Al-Hadid, A.; Kawaf, B.; Al-Yahri, S.A.; Babiker, A.; Assaf, K.; Ba Ras, M. Activity monitoring of Islamic Prayer (Salat) postures using Deep Learning. In Proceedings of the 2020 6th Conference on Data Science and Machine Learning Applications (CDMA), Riyadh, Saudi Arabia, 4–5 March 2020; pp. 106–111. [Google Scholar]
  29. Adeel, A.; Gogate, M.; Farooq, S.; Irecitano, C.; Dashtipour, K.; Larijani, H.; Hussain, A. A survey on the role of wireless sensor networks and IoT in disaster management. In Geoological Disaster Monitoring Based on Sensor Networks; Springer: Berlin/Heidelberg, Germany, 2019; pp. 57–66. [Google Scholar]
  30. Lee, J.; Joo, H.; Lee, J.; Chee, Y. Automatic Classification of Squat Posture Using Inertial Sensors: Deep Learning Approach. Sensors 2020, 20, 361. [Google Scholar] [CrossRef] [Green Version]
  31. Jiang, F.; Kong, B.; Li, J.; Dashtipour, K.; Gogate, M. Robust visual saliency optimization based on bidirectional Markov chains. Cogn. Comput. 2020, 13, 69–80. [Google Scholar] [CrossRef]
  32. Han, J.; Song, W.; Gozho, A.; Sung, Y.; Ji, S.; Song, L.; Wen, L.; Zhang, Q. Lora-based smart IoT application for smart city: An example of human posture detection. Wirel. Commun. Mob. Comput. 2020, 2020, 8822555. [Google Scholar] [CrossRef]
  33. Radu, I.; Tu, E.; Schneider, B. Relationships between body postures and collaborative learning states in an Augmented Reality Study. In International Conference on Artificial Intelligence in Education; Springer: Berlin/Heidelberg, Germany, 2020; pp. 257–262. [Google Scholar]
  34. Agrawal, Y.; Shah, Y.; Sharma, A. Implementation of the machine learning technique for the identification of Yoga Poses. In Proceedings of the IEEE 9th International Conference on Communication Systems and Network Technologies (CSNT), Gwalior, India, 10–12 April 2020; pp. 40–43. [Google Scholar]
  35. Imran, M.A.; Ghannam, R.; Abbasi, Q.H. Engineering and Technology for Healthcare; John Wiley & Sons: Hoboken, NJ, USA, 2020. [Google Scholar]
  36. Hussien, I.O.; Dashtipour, K.; Hussain, A. Comparison of sentiment analysis approaches using modern Arabic and Sudanese dialects. In International Conference on Brain-Inspired Cognitive Systems; Springer: Berlin/Heidelberg, Germany, 2018; pp. 615–624. [Google Scholar]
  37. Bourahmoune, K.; Amagasa, T. AI-powered posture training: Application of machine learning in Sitting Posture Recognition Using the LifeChair Smart Cushion. In Proceedings of the Twenty-Eighth International Joint Conference on Artificial Intelligence (IJCAI-19), Macao, China, 10–16 August 2019; pp. 5808–5814. [Google Scholar]
  38. Sandybekov, M.; Grabow, C.; Gaiduk, M.; Seepold, R. Posture tracking using a machine learning algorithm for a home AAL environment. In Intelligent Decision Technologies 2019; Springer: Berlin/Heidelberg, Germany, 2019; pp. 337–347. [Google Scholar]
  39. Roh, J.; Park, H.-j.; Lee, K.J.; Hyeong, J.; Kim, S.; Lee, B. Sitting posture monitoring system based on a low-cost load cell using machine learning. Sensors 2018, 18, 208. [Google Scholar] [CrossRef] [PubMed]
  40. Rosero-Montalvo, P.D.; Peluffo-Ordóñez, D.H.; López Batista, V.F.; Serrano, J.; Rosero, E.A. Intelligent system for identifying the posture of wheelchair users using machine learning techniques. IEEE Sens. J. 2018, 19, 1936–1942. [Google Scholar] [CrossRef]
  41. Kornblith, S.; Shlens, J.; Le, Q.V. Do better imagenet models transfer better? In Proceedings of the IEEE/CVF Conference on Computer Vision and Pattern Recognition, Long Beach, CA, USA, 15–20 June 2019; pp. 2661–2671. [Google Scholar]
  42. Ray, S. A quick review of machine learning algorithms. In Proceedings of the 2019 International Conference on Machine Learning, Big Data, Cloud and Parallel Computing (COMITCon), Faridabad, India, 14–16 February 2019; pp. 35–39. [Google Scholar]
  43. Riekert, M.; Opderbeck, S.; Wild, A.; Gallmann, E. Model selection for 24/7 pig position and posture detection by 2D camera imaging and deep learning. Comput. Electron. Agric. 2021, 187, 106213. [Google Scholar] [CrossRef]
  44. When to Use LASSO. Available online: https://crunchingthedata.com/when-to-use-lasso/ (accessed on 19 October 2022).
  45. Szegedy, C.; Vanhoucke, V.; Ioffe, S.; Shlens, J.; Wojna, Z. Rethinking the inception architecture for computer vision. In Proceedings of the IEEE Conference on Computer Vision and Pattern Recognition, Las Vegas, NV, USA, 26 June–1 July 2016; pp. 2818–2826. [Google Scholar]
  46. Huang, G.; Liu, Z.; Van Der Maaten, L.; Weinberger, K.Q. Densely connected convolutional networks. In Proceedings of the IEEE Conference on Computer Vision and Pattern Recognition, Honolulu, HI, USA, 21–26 July 2017; pp. 4700–4708. [Google Scholar]
  47. He, K.; Zhang, X.; Ren, S.; Sun, J. Deep residual learning for image recognition. In Proceedings of the IEEE Conference on Computer Vision and Pattern Recognition, Las Vegas, NV, USA, 27–30 June 2016; pp. 770–778. [Google Scholar]
  48. What is LASSO? What is LASSO Regression Definition, Examples, and Techniques (mygreatlearning.com)? Available online: https://www.mygreatlearning.com/blog/understanding-of-lasso-regression/ (accessed on 17 October 2022).
  49. Nagpal, A. L1 and L2 Regularization Methods. 2017. Available online: https://towardsdatascience.com/l1-and-l2-regularization-methods-ce25e7fc831c (accessed on 17 October 2022).
  50. Cortes, C.; Vapnik, V. Support vector networks. Mach. Learn. 1995, 20, 273–297. [Google Scholar] [CrossRef]
  51. Guyon, I.; Weston, J.; Barnhill, S.; Vapnik, V. Gene selection for cancer classification using support vector machines. Mach. Learn. 2002, 46, 389–422. [Google Scholar] [CrossRef]
  52. Prajapati, G.L.; Patle, A. When performing classification using SVM with radial basis and polynomial kernel functions. In Proceedings of the 2010, Third International Conference on Emerging Trends in Engineering and Technology, Goa, India, 19–21 November 2010; pp. 512–515. [Google Scholar]
  53. Kuo, B.C.; Ho, H.H.; Li, C.H.; Hung, C.C.; Taur, J.S. A kernel-based feature selection method for SVM with RBF kernel for hyperspectral image classification. IEEE J. Sel. Top. Appl. Earth Obs. Remote Sens. 2013, 7, 317–326. [Google Scholar] [CrossRef]
  54. L2 Fighting Overfitting with L1 or L2 Regularization: Which One Is Better?-Neptune.ai. Available online: https://neptune.ai/blog/fighting-overfitting-with-l1-or-l2regularization#:~:text=The%20differences%20between%20L1%20and,regularization%20solution%20is%20non%2Dsparse (accessed on 17 October 2022).
  55. Lattanzi, E.; Donati, M.; Freschi, V. Exploring Artificial Neural Networks Efficiency in Tiny Wearable Devices for Human Activity Recognition. Sensors 2022, 22, 2637. [Google Scholar] [CrossRef]
  56. Islam, M.R.; Nahiduzzaman, M. Complex features extraction with deep learning model for the detection of COVID19 from CT scan images using ensemble based machine learning approach. Expert Syst. Appl. 2022, 195, 116554. [Google Scholar] [CrossRef]
  57. Gadekallu, T.R.; Khare, N.; Bhattacharya, S.; Singh, S.; Maddikunta, P.K.R.; Ra, I.H.; Alazab, M. Early detection of diabetic retinopathy using a PCA-firefly-based deep learning model. Electronics 2020, 9, 274. [Google Scholar] [CrossRef] [Green Version]
  58. Al Imran, A.; Amin, M.N.; Johora, F.T. Classification of chronic kidney disease using logistic regression, feedforward neural network, and wide & deep learning. In Proceedings of the 2018 International Conference on Innovation in Engineering and Technology (ICIET), Dhaka, Bangladesh, 27–28 December 2018; pp. 1–6. [Google Scholar]
  59. Ogundokun, R.O.; Misra, S.; Douglas, M.; Damaševičius, R.; Maskeliūnas, R. Medical Internet-of-Things Based Breast Cancer Diagnosis Using Hyperparameter-Optimized Neural Networks. Future Internet 2022, 14, 153. [Google Scholar] [CrossRef]
  60. Bharati, S.; Podder, P.; Mondal, M.R.H. Hybrid deep learning for detecting lung disease from X-ray images. Inform. Med. Unlocked 2020, 20, 100391. [Google Scholar] [CrossRef] [PubMed]
  61. Gupta, H.; Varshney, H.; Sharma, T.K.; Pachauri, N.; Verma, O.P. Comparative performance analysis of quantum machine learning with deep learning for diabetes prediction. Complex Intell. Syst. 2022, 8, 3073–3087. [Google Scholar] [CrossRef]
  62. Kumar, R.; Arora, R.; Bansal, V.; Sahayasheela, V.J.; Buckchash, H.; Imran, J.; Naryanan, N.; Pandian, G.N.; Raman, B. Accurate prediction of COVID-19 using chest X-ray images through deep feature learning model with SMOTE and machine learning classifiers. MedRxiv 2020. [Google Scholar] [CrossRef] [Green Version]
  63. Alalharith, D.M.; Alharthi, H.M.; Alghamdi, W.M.; Alsenbel, Y.M.; Aslam, N.; Khan, I.U.; Shahin, S.Y.; Dianiskova, S.; Alhareky, M.S.; Barouch, K.K. A deep learning-based approach for the detection of early signs of gingivitis in orthodontic patients using faster region-based convolutional neural networks. Int. J. Environ. Res. Public Health 2020, 17, 8447. [Google Scholar] [CrossRef] [PubMed]
  64. Le, N.Q.K.; Ho, Q.T.; Nguyen, V.N.; Chang, J.S. BERT-Promoter: An improved sequence-based predictor of DNA promoter using BERT pre-trained model and SHAP feature selection. Comput. Biol. Chem. 2022, 99, 107732. [Google Scholar] [CrossRef]
  65. Le, N.Q.K.; Ho, Q.T. Deep transformers and convolutional neural network in identifying DNA N6-methyladenine sites in cross-species genomes. Methods 2022, 204, 199–206. [Google Scholar] [CrossRef]
  66. Gal, Y.; Ghahramani, Z. Dropout as a Bayesian approximation: Representing model uncertainty in deep learning. In Proceedings of the 33rd International Conference on Machine Learning, New York, NY, USA, 20–22 June 2016; Volume 48, pp. 1050–1059. [Google Scholar]
  67. Zhang, C.; Ma, Y. (Eds.) Ensemble Machine Learning: Methods and Applications; Springer Science & Business Media: Berlin/Heidelberg, Germany, 2012. [Google Scholar]
  68. Chu, G. Machine learning for Automation of Chromosome based Genetic Diagnostics. Master’s Thesis, KTH, School of Electrical Engineering and Computer Science (EECS), Stockholm, Sweden, 2020. [Google Scholar]
  69. Gochoo, M.; Akhter, I.; Jalal, A.; Kim, K. Stochastic remote sensing event classification over adaptive posture estimation via multifused data and deep belief network. Remote Sens. 2021, 13, 912. [Google Scholar] [CrossRef]
  70. Dedeoğlu, Y.; Töreyin, B.U.; Güdükbay, U.; Çetin, A.E. Silhouette-based method for object classification and human action recognition in video. In European Conference on Computer Vision; Springer: Berlin/Heidelberg, Germany, 2006; pp. 64–77. [Google Scholar]
  71. Ghazal, S.; Khan, U.S. Human posture classification using skeleton information. In Proceedings of the 2018 International Conference on Computing, Mathematics and Engineering Technologies (iCoMET), Sukkur, Pakistan, 3–4 March 2018; pp. 1–4. [Google Scholar]
  72. Luna-Perejón, F.; Montes-Sánchez, J.M.; Durán-López, L.; Vazquez-Baeza, A.; Beasley-Bohórquez, I.; Sevillano-Ramos, J.L. IoT device for Classification Using Artificial Neural Networks. Electronics 2021, 10, 1825. [Google Scholar] [CrossRef]
  73. Wai, A.P.; Foo, S.F.; Huang, W.; Biswas, J.; Hsia, C.C.; Liou, K.; Yap, P. Classification of lying posture for pressure ulcer prevention. J. Healthc. Eng. 2010, 1, 217–238. [Google Scholar] [CrossRef]
Figure 1. Proposed system block diagram.
Algorithms 15 00410 g001
Figure 2. Accuracy and loss graphs of DCNN models: (a) InceptionV3; (b) ResNet50; (c) DenseNet121; and (d) Proposed Inception-SVM.
Algorithms 15 00410 g002
Figure 3. Confusion matrix of DCNN models: (a) InceptionV3; (b) ResNet50; (c) DenseNet121; and (d) Proposed InceptionV3-SVM.
Algorithms 15 00410 g003aAlgorithms 15 00410 g003b
Figure 4. AUC-ROC curve of the DCNN models: (a) InceptionV3; (b) ResNet50; (c) DenseNet121; and (d) Proposed InceptionV3-SVM.
Algorithms 15 00410 g004aAlgorithms 15 00410 g004b
Figure 5. Results of the classification of a particular class classification result.
Algorithms 15 00410 g005
Figure 6. Recall the result of the classification per class classification result.
Algorithms 15 00410 g006
Figure 7. F1 score per class classification result.
Algorithms 15 00410 g007
Figure 8. Accuracy Per Class Classification Result.
Algorithms 15 00410 g008
Table 1. Distribution over the posture of the Data Set.
Posture ClassNumber of InstancesTrainingValidationTesting
Bending1200768192240
Lying1200768192240
Sitting1200768192240
Standing1200768192240
Total48003072768960
Table 2. Details of the hyperparameter settings.
DTL (s)Hyperparameters
OptimizerLearning RateBatch SizeEpochsDropoutActivation
InceptionV3Adam0.001032500.5Relu
ResNet50Adam0.000232500.5Relu
DenseNet121Adam0.000332500.5Relu
InceptionV3-SVMAdam0.001032500.5Relu
Table 3. Table of the confusion matrix Table.
Predicted Class
Actual ClassTrue Positive (TP)False Negative (FN)
False Positive (FP)True Negative (TN)
Table 4. Parameters Used for model training.
ModelLearning RateEpochsEarly StoppingLossOptimizerBatch Size
InceptionV30.0002450Epoch 45CategoricalCrossentropyAdam32
ResNet500.0002450Epoch 50CategoricalCrossentropyAdam32
DenseNet1210.0003450Epoch 40CategoricalCrossentropyAdam32
InceptionV3-SVM0.0010050Epoch 39Square_hingeAdam32
Table 5. Model Training Parameters.
ModelModel Parameters
InceptionV3Total params: 24,179,236
Trainable params: 2,376,452
Non-trainable params: 21,802,784
ResNet50Total params: 30,158,468
Trainable params: 6,570,756
Non-trainable params: 23,587,712
DenseNet121Total params: 9,151,812
Trainable params: 2,114,308
Non-trainable params: 7,037,504
InceptionV3-SVMTotal params: 24,179,236
Trainable params: 18,054,308
Non-trainable params: 6,124,928
Table 6. Results of the models on the training and validation data set.
ModelTraining Accuracy (%)Validation Accuracy (%)Testing Accuracy (%)Training LossValidation LossTesting Loss
InceptionV370.3890.7689.580.280.190.21
ResNet5059.1888.6788.440.890.460.49
DenseNet12191.8991.6792.290.190.310.33
InceptionV3-SVM99.5894.5395.420.010.090.09
Table 7. Results of the models on the test data set.
ModelAccuracyAUCTP
InceptionV30.900.96860
ResNet500.880.96849
DenseNet1210.920.99886
InceptionV3-SVM0.950.99916
Table 8. Model Average Performance Metrics.
ModelAverage PrecisionAverage RecallAverage F1-Score
InceptionV3PrecisionRecallF1-score
ResNet500.910.900.90
DenseNet1210.900.880.91
CNN0.930.920.93
InceptionV3-SVM0.950.960.95
Table 9. Evaluation of the test dataset.
AuthorsModelAccuracy (%)
Ghazal & Khan [71]Rule-based93.00
Luna-Perejón, Montes-Sánchez et al. [72]Artificial Neural Network81.00
Wai et al. [73]SVM93.00
Gochoo et al. [69]Gaussian Mixture Model92.50
Dedeoğlu et al. [70]Supervised learning algorithm76.88
Proposed ModelInceptionV3-SVM95.42
Publisher’s Note: MDPI stays neutral with regard to jurisdictional claims in published maps and institutional affiliations.

