Article

Investigating Shared Genetic Bases between Psychiatric Disorders, Cardiometabolic and Sleep Traits Using K-Means Clustering and Local Genetic Correlation Analysis

by
Gianpaolo Zammarchi
1,
Claudio Conversano
1 and
Claudia Pisanu
2,*
1
Department of Business and Economics, University of Cagliari, 09123 Cagliari, Italy
2
Department of Biomedical Sciences, Section of Neuroscience and Clinical Pharmacology, University of Cagliari, 09042 Cagliari, Italy
*
Author to whom correspondence should be addressed.
Algorithms 2022, 15(11), 409; https://doi.org/10.3390/a15110409
Submission received: 28 September 2022 / Revised: 28 October 2022 / Accepted: 31 October 2022 / Published: 3 November 2022
(This article belongs to the Special Issue Machine Learning in Mathematical and Computational Biology)

Abstract

:
Psychiatric disorders are among the top leading causes of the global health-related burden. Comorbidity with cardiometabolic and sleep disorders contribute substantially to this burden. While both genetic and environmental factors have been suggested to underlie these comorbidities, the specific molecular underpinnings are not well understood. In this study, we leveraged large datasets from genome-wide association studies (GWAS) on psychiatric disorders, cardiometabolic and sleep-related traits. We computed genetic correlations between pairs of traits using cross-trait linkage disequilibrium (LD) score regression and identified clusters of genetically correlated traits using k-means clustering. We further investigated the identified associations using two-sample mendelian randomization (MR) and tested the local genetic correlation at the identified loci. In the 7-cluster optimal solution, we identified a cluster including insomnia and the psychiatric disorders major depressive disorder (MDD), post-traumatic stress disorder (PTSD), and attention-deficit/hyperactivity disorder (ADHD). MR analysis supported the existence of a bidirectional association between MDD and insomnia and the genetic variants driving this association were found to affect gene expression in different brain regions. Some of the identified loci were further supported by results of local genetic correlation analysis, with body mass index (BMI) and C-reactive protein (CRP) levels suggested to explain part of the observed effects. We discuss how the investigation of the genetic relationships between psychiatric disorders and comorbid conditions might help us to improve our understanding of their pathogenesis and develop improved treatment strategies.

1. Introduction

Psychiatric disorders are among the top leading causes of burden worldwide, and around 450 million people in the world are estimated to suffer from these disorders according to the World Health Organization (WHO) [1]. Among severe mental disorders, major depressive disorder (MDD) is the most prevalent, affecting more than 250 million people worldwide [2], and represents the second-leading cause of disability globally [3]. Furthermore, during the COVID-19 pandemic many determinants of poor mental health were exacerbated, leading to a stark rise in depressive and anxiety disorders globally in 2020 [4]. While the molecular underpinnings of psychiatric disorders are still largely elusive, their development has been shown to be the result of a complex interplay between genetic and environmental factors. Indeed, psychiatric disorders show different degrees of heritability and genome-wide association studies (GWAS) have started to identify a number of genetic determinants associated with predisposition to these disorders [5,6,7]. Severe psychiatric disorders such as MDD, schizophrenia (SCZ) and bipolar disorder (BD) are associated with significant excess mortality as well as decreased life expectancy [8,9]. A large body of evidence suggests that this excess mortality is largely accounted for by a higher prevalence of comorbid chronic disorders compared to individuals without mental illness [10,11]. In particular, cardiometabolic disorders with an inflammatory component, such as cardiovascular and metabolic disorders, present significantly higher incidence in patients with psychiatric disorders than in the general population [12]. Physical comorbidities in patients with psychiatric disorders have been found to double the risk of premature mortality compared to the general population [9,13]. Different determinants such as lifestyle factors (e.g., diet, physical activity, alcohol intake) as well as adverse effects of psychotropic medications, have been suggested to contribute to the observed comorbidity between psychiatric and cardiometabolic disorders [14]. However, since both groups of disorders show significant heritability, shared genetic determinants might also play a role [15]. This hypothesis is corroborated by the fact that comorbidities have also been reported in adolescents and drug naïve patients [16,17], thus suggesting the existence of common pathophysiological processes, as well as potential genetic links between these conditions.
Psychiatric disorders also show relevant comorbidity with sleep disorders and disturbances of the circadian rhythms, which are 24-h rhythms autonomously driven by the internal biological clock and synchronized daily by environmental signals [18]. Psychiatric disorders have been associated with insomnia, hypersomnia, circadian rhythm disruption [19] as well as the evening circadian chronotype [20] (with the latter defined as an individual variation in the preferred timing of the sleep-wake cycle, associated with variations of physiological functions, such as body temperature and hormone secretion). As in the case of comorbidity with cardiometabolic disorders, genetic factors have been suggested to play a role in the molecular mechanisms driving the association between sleep and severe mental disorders such as MDD, BD and SCZ [21], post-traumatic stress disorder (PTSD) or neurodevelopmental disorders such as attention-deficit/hyperactivity disorder (ADHD) [22]. However, there is scarce information regarding other psychiatric disorders for which genetic data are available such as anorexia nervosa (AN) or Tourette syndrome (TS). In addition, no study has conducted a comprehensive analysis of psychiatric, cardiometabolic and sleep traits in order to assess whether it is possible to identify clusters of genetically correlated traits. In this study, we used different analytical approaches to investigate the correlation between genetic determinants of psychiatric disorders, cardiometabolic and sleep-related traits, aiming to identify clusters of genetically correlated traits. We used two-sample mendelian randomization (MR) to investigate the direction of effect of the observed relationships and different in-silico tools to characterize the potential functional relevance of the identified loci. Finally, we ran local genetic correlation analysis on loci suggested to drive the observed association between MDD and insomnia, also testing the potential effect of cardiometabolic traits.

2. Materials and Methods

2.1. GWAS Datasets

Analyses were conducted using the largest publicly available GWAS summary statistics for psychiatric disorders and cardiometabolic or sleep traits (Table S1). For psychiatric disorders, we used the latest release of datasets from the Psychiatric Genomics Consortium (PGC) for BD [5], SCZ [6], MDD [7], ADHD [23], autism spectrum disorders (ASD) [24], PTSD [25], obsessive-compulsive disorder (OCD) [26], TS [27], and AN [28]. For cardiometabolic traits, we included the largest publicly available GWAS summary statistics for body mass index (BMI) [29], type 2 diabetes (T2D) [30], coronary artery disease (CAD) [31] and the inflammatory marker C-reactive protein (CRP), based on the fact that cardiometabolic disorders are characterized by a substantial inflammatory component [32]. Finally, as regards to sleep traits, we used the largest publicly available GWAS summary statistics for insomnia [33], chronotype [34] and sleep duration [35]. In the case of studies including data from 23andMe, we used the publicly available version of genome-wide summary statistics that exclude data for 23andMe participants (as 23andMe policies only allow the publication of summary statistics including up to 10,000 variants). For all GWAS datasets, quality control procedures were performed by the original studies. In the case of datasets for which the number of participants for each genetic variant was not available, the effective sample size (Neff) was computed as [Neff = 4/(1/N controls + 1/N cases)], with N controls being the number of controls and N cases being the number of cases, as recommended for studies with unequal number of cases and controls [36].

2.2. Linkage Disequilibrium Score Regression (LDSC) and K-Means Clustering

We used LDSC to estimate genetic correlations between psychiatric, cardiometabolic and sleep traits [37,38]. The cross-trait LDSC method represents an extension of single-trait LDSC to estimate heritability and genetic correlation from GWAS summary statistics. This method allows studying the genetic correlation globally, considering the average of the shared signals across the genome (including the contribution of single nucleotide polymorphisms (SNP) that do not reach genome-wide significance [37], considering possible sample overlap and population stratification. Genetic correlation is computed by normalizing genetic covariance by SNP heritability as in Equation (1):
r g = ϱ g h 1 2 h 2 2  
where ϱ g indicates the genetic covariance and h i 2 indicates the SNP heritability from study i. For case-control studies, genetic covariance is on the observed scale [37]. There is no distinction between observed and liability scale genetic correlation for case-control traits, so genetic correlation can be estimated between a case-control trait and a quantitative trait or between pairs of case-control traits, without the need to specify a scale [37]. For each study, summary statistics were converted into the LDSC format. Quality control procedures included removal of strand-ambiguous variants, duplicated variants or variants that are not SNPs. Alleles were merged with the HapMap3 SNPs, as recommended. LD scores were based on 1000 genomes European data. Results were adjusted for multiple testing using the Bonferroni correction based on the number of tests (n = 120).
In order to identify clusters of genetically correlated traits, a pair-wise genetic correlation matrix including all traits was used to compute a distance matrix based on Euclidean distance, which was used as input for k-means clustering. K-means clustering is an unsupervised machine learning algorithm that aims to partition n observations into k clusters. The basic form of the k-means algorithm, in some cases also known as “naive k-means”, uses an iterative procedure. Basically, there are two steps: the assignment and the update. The problem this algorithm tries to solve is to assign each data point to a cluster, which should be as close as possible. The number of clusters must be provided. Each cluster will be represented by a centroid, a point that represents the mean position of all points in the cluster. The procedure can be summarized in the following two steps:
Step 1: Assignment
In the first iteration, k points ( m 1 ,…, m k ) are randomly generated. These will be considered the initial centroids, one for each of the k clusters. The clusters will be defined by assigning each data point to the closest centroid, as in Equation (2).
S i t = x p : x p m i t 2 x p m j t 2   j , 1 j k
where each point ( x p ) is assigned to one and only one cluster ( S t ).
Step 2: Update
In the second step the means computed in Step 1 can be discarded since we have already formed clusters based on those means, and we can compute the new means of those clusters as in Equation (3).
m i t + 1 = 1 S i t x j S i t x j
Since the centroid might have changed, we need to reassign data points to a cluster. This procedure will continue until convergence; that is, until points are permanently assigned to one cluster, and new iterations would not affect this assignment. K-means clustering was conducted using the cluster package (v. 2.1.4) [39] and the factoextra package in R [40]. The optimal number of clusters was estimated based on the silhouette coefficient, which allows to assess how close a data point in one cluster is to points in the neighboring clusters [41]. We resolved to use k-means clustering because it is a suitable method when working with Euclidean distances (in this case the genetic correlation matrix), it’s one of the most popular clustering methods in general [42] as well as in the genetic literature [43], and clustering results may be more easily interpreted. Moreover, unlike hierarchical clustering algorithms, observations are allowed to change cluster in every iteration. For this reason, hierarchical clustering due to its greedy approach, could provide locally optimized clusters, whereas k-means can produce globally optimized clusters.

2.3. Mendelian Randomization

Pair-wise associations found to be significant using cross-trait LDSC, and suggested to be part of the same clusters based on k-means clustering, were tested with two-sample MR using the TwoSampleMR R package [44,45]. MR uses genetic variants as instrumental variables (IV) to estimate the causal effects of an exposure on an outcome [46]. To infer the causal influence of the exposure, the ratio between the SNP effect on the outcome over the SNP effect on the exposure is computed [45]. The method relies on the fact that, based on Mendel’s laws of inheritance and the fixed nature of germline genotypes, the alleles at a SNP are expected to be random with respect to potential confounders [45]. The results obtained from multiple SNPs associated with the exposure allow us to obtain an overall estimate of the causal effect of a potential exposure on an outcome. Two-sample MR can be performed even if the SNP-exposure effects and the SNP-outcome effects are obtained from separate studies, thus allowing to leverage pre-existing large GWAS. In order to assess the direction of the association between the selected pairs of traits, we repeated the analyses twice for each pair, considering each trait to be the exposure or the outcome, alternatively. IVs were selected based on significant association with the exposure at a genome-wide threshold (p < 5 × 10⁻⁸). Since it is important to ensure that IVs are independent, significant genetic variants were clumped using European data from the IEU GWAS database as recommended [44]. Default parameters in the TwoSampleMR package were used for clumping (r2 > 0.001 in the range of 10,000 Mb) and the SNP with the lowest p-value was retained. After clumping, exposure and outcome genetic data were harmonized to obtain effects and standard errors for each instrument SNP available for the exposure and outcome traits, using the Two-SampleMR package. During this step, palindromic SNPs with intermediate allele frequencies are removed by the package.
One important assumption of MR is that genetic variants used as IVs should exert an effect on the outcome only through their effect on the exposure. A violation of this assumption is called horizontal pleiotropy (i.e., a condition in which a genetic variant exerts an effect on the outcome through different pathways) and can cause bias in the MR analysis. We checked the intercept term in MR Egger regression [47], as well as the global and the distortion tests implemented in the MR-PRESSO package [48], in order to assess whether directional horizontal pleiotropy was driving the results of the MR analysis. MR analyses were conducted with four widely used different methods implemented in the Two-sSampleMR package: MR-Egger regression, weighted median estimator, inverse-variance weighted (IVW) and simple mode. In addition, the MR analyses were conducted using the raw and outlier corrected estimates of the mendelian randomization pleiotropy residual sum and outlier (MR-PRESSO) test, implemented in the MR-PRESSO R package [48]. Based on the observation of a significant bidirectional association between MDD and insomnia, for these traits the analyses were also repeated using the different versions of the MDD and insomnia datasets which are publicly available. Specifically, we used as exposure SNPs extracted from the versions of the datasets limited to 10,000 variants selected by the authors of the two GWAS for which data for participants from 23andMe are also included, as well as the list of significant and independent genetic variants reported by the two GWAS (n = 102 for MDD [7] and n = 554 for insomnia [33]). Aim of these analyses was to verify whether a significant bidirectional association between the two traits could still be observed when using IVs extracted from datasets including a limited number of variants genotyped in a larger number of participants.

2.4. Functional Effect of SNPs Identified with MR

In order to obtain information on which SNPs contributed to the results observed with MR analysis, we used the mr_singlesnp function implemented in the TwoSampleMR package. The function obtains the MR estimates using each of the SNPs singly as it performs the analysis multiple times for each exposure-outcome combination, each time using a different single SNP. We used the default method to perform the single SNP MR (Wald ratio). Results from these analyses were shown with a forest plot in which we compared the MR estimates using different MR methods against single SNP tests (i.e., the MR estimates obtained using a single IV). SNPs showing a significant effect for a casual effect of the exposure on the outcome in single SNP tests were further investigated in order to obtain information on their potential functional effect. We searched variants in RegulomeDB to obtain the probability score. The RegulomeDB probability score is computed integrating functional genomics features along with continuous values such as ChIP-seq signal, DNase-seq signal, information content change, and DeepSEA scores. The score ranges from 0 to 1, with 1 being most likely to be a regulatory variant [49]. Furthermore, we searched whether SNPs acted as expression quantitative trait loci (eQTL) based on genotyping and gene expression data from Genotype-Tissue Expression (GTEx) v.8 in brain regions [50]. In the GTEx project, gene expression was measured in a range of 114–209 participants (based on the selected tissue) with Illumina TrueSeq RNA sequencing or Affymetrix Human Gene 1.1 ST Expression Array, while genotyping data were obtained with whole genome sequencing, whole exome sequencing, Illumina OMNI 5M, 2.5M or Exome SNP arrays. We reported cis eQTLs significant based on false discovery rate (FDR). In addition, we investigated whether proteins encoded by the genes for which significant eQTLs were identified showed a protein-protein interaction (PPI) enrichment using STRING [51]. A significant PPI indicates that the identified proteins have more interactions among themselves than would be expected for a random set of proteins of the same size and degree distribution drawn from the genome, suggesting they are at least partly biologically connected.

2.5. Local Genetic Correlation Analysis

Based on the previously described analyses suggesting a bidirectional association between MDD and insomnia, we further investigated the association between these two traits using local genetic correlation analysis, with Local Analysis of [co] Variant Association (LAVA) [52]. In addition, we investigated whether the cardiometabolic and inflammatory phenotypes (BMI, T2D, CRP and CAD) might moderate the association between MDD and insomnia at the identified loci.
MR analyses with MDD as the exposure and insomnia as the outcome conducted using single SNP tests as described in the previous section showed a significant causal effect of MDD on insomnia for 10 SNPs among the 39 selected as IVs. Similarly, MR analyses with insomnia as the exposure and MDD as the outcome conducted using single SNP tests were significant for 8 SNPs among the 12 selected as IVs. These 10 + 8 SNPs were located in 15 genetic loci based on the genome partition file developed by the authors of LAVA [52]. These 15 loci were used as input for the local genetic correlation analysis made with LAVA. The 1000 Genomes phase 3 European data were used as reference. For each locus, we converted the marginal SNP effects within the locus to their corresponding joint effects (in order to account for the linkage disequilibrium between SNPs). To give a brief overview, for any locus and for each quantitative phenotype p, we assume a linear model
𝑌𝑝 = 𝑋𝛼𝑝 + 𝜖𝑝
where Yp is the standardized phenotype vector, X the standardized genotype matrix, 𝛼𝑝 the vector of standardized joint SNP effects and 𝜖𝑝 the vector of normally distributed residuals with mean of 0 and variance η p 2 . We denote the SNP LD matrix as S = cor(X) and the vector of estimated marginal SNP effects β ^ p , and obtain the estimated joint effects as α ^ p = S−1 β ^ p , using the genotype reference to compute S. A more detailed explanation, as well as the procedure to obtain the joint SNP effects for binary phenotypes, are reported in the LAVA reference article [52].
For each locus, the genetic covariance matrix Ω was computed as in Equation (5).
Ω = t δ δ K     σ 2  
where K represents the number of SNPs/principal components (PC) within the locus, δ the estimated PC projected joint SNP effects and σ2 the sampling covariance.
To correct for sample overlap, we computed a sampling correlation matrix (i.e., a matrix reporting the phenotypic correlation that is due to sample overlap) using the intercept from cross-trait LDSC [38]. We used the univariate test implemented in LAVA to test the local heritability within each locus for MDD and insomnia, in order to determine the amount of local genetic signal for both phenotypes and filter out non-associated loci. Local heritability can be defined as the proportion of the variance of a trait that can be explained by the SNPs in that locus. Computation of local heritability has been detailed in [52]. For these analyses, p-values were adjusted according to Bonferroni based on 60 univariate tests (i.e., 15 loci × 6 investigated phenotypes). For loci for which we identified a significant heritability for both MDD and insomnia based on the univariate test, we computed the bivariate local genetic correlation between the two traits, resulting in 30 bivariate tests. For bivariate local genetic correlations, p-values were adjusted based on the 30 conducted tests. In case of significant bivariate local genetic correlations between either MDD or insomnia and a cardiometabolic trait, and in order to assess whether the latter explained the observed association between MDD and insomnia, a partial correlation analysis conditioned on the cardiometabolic trait(s) was also conducted.

3. Results

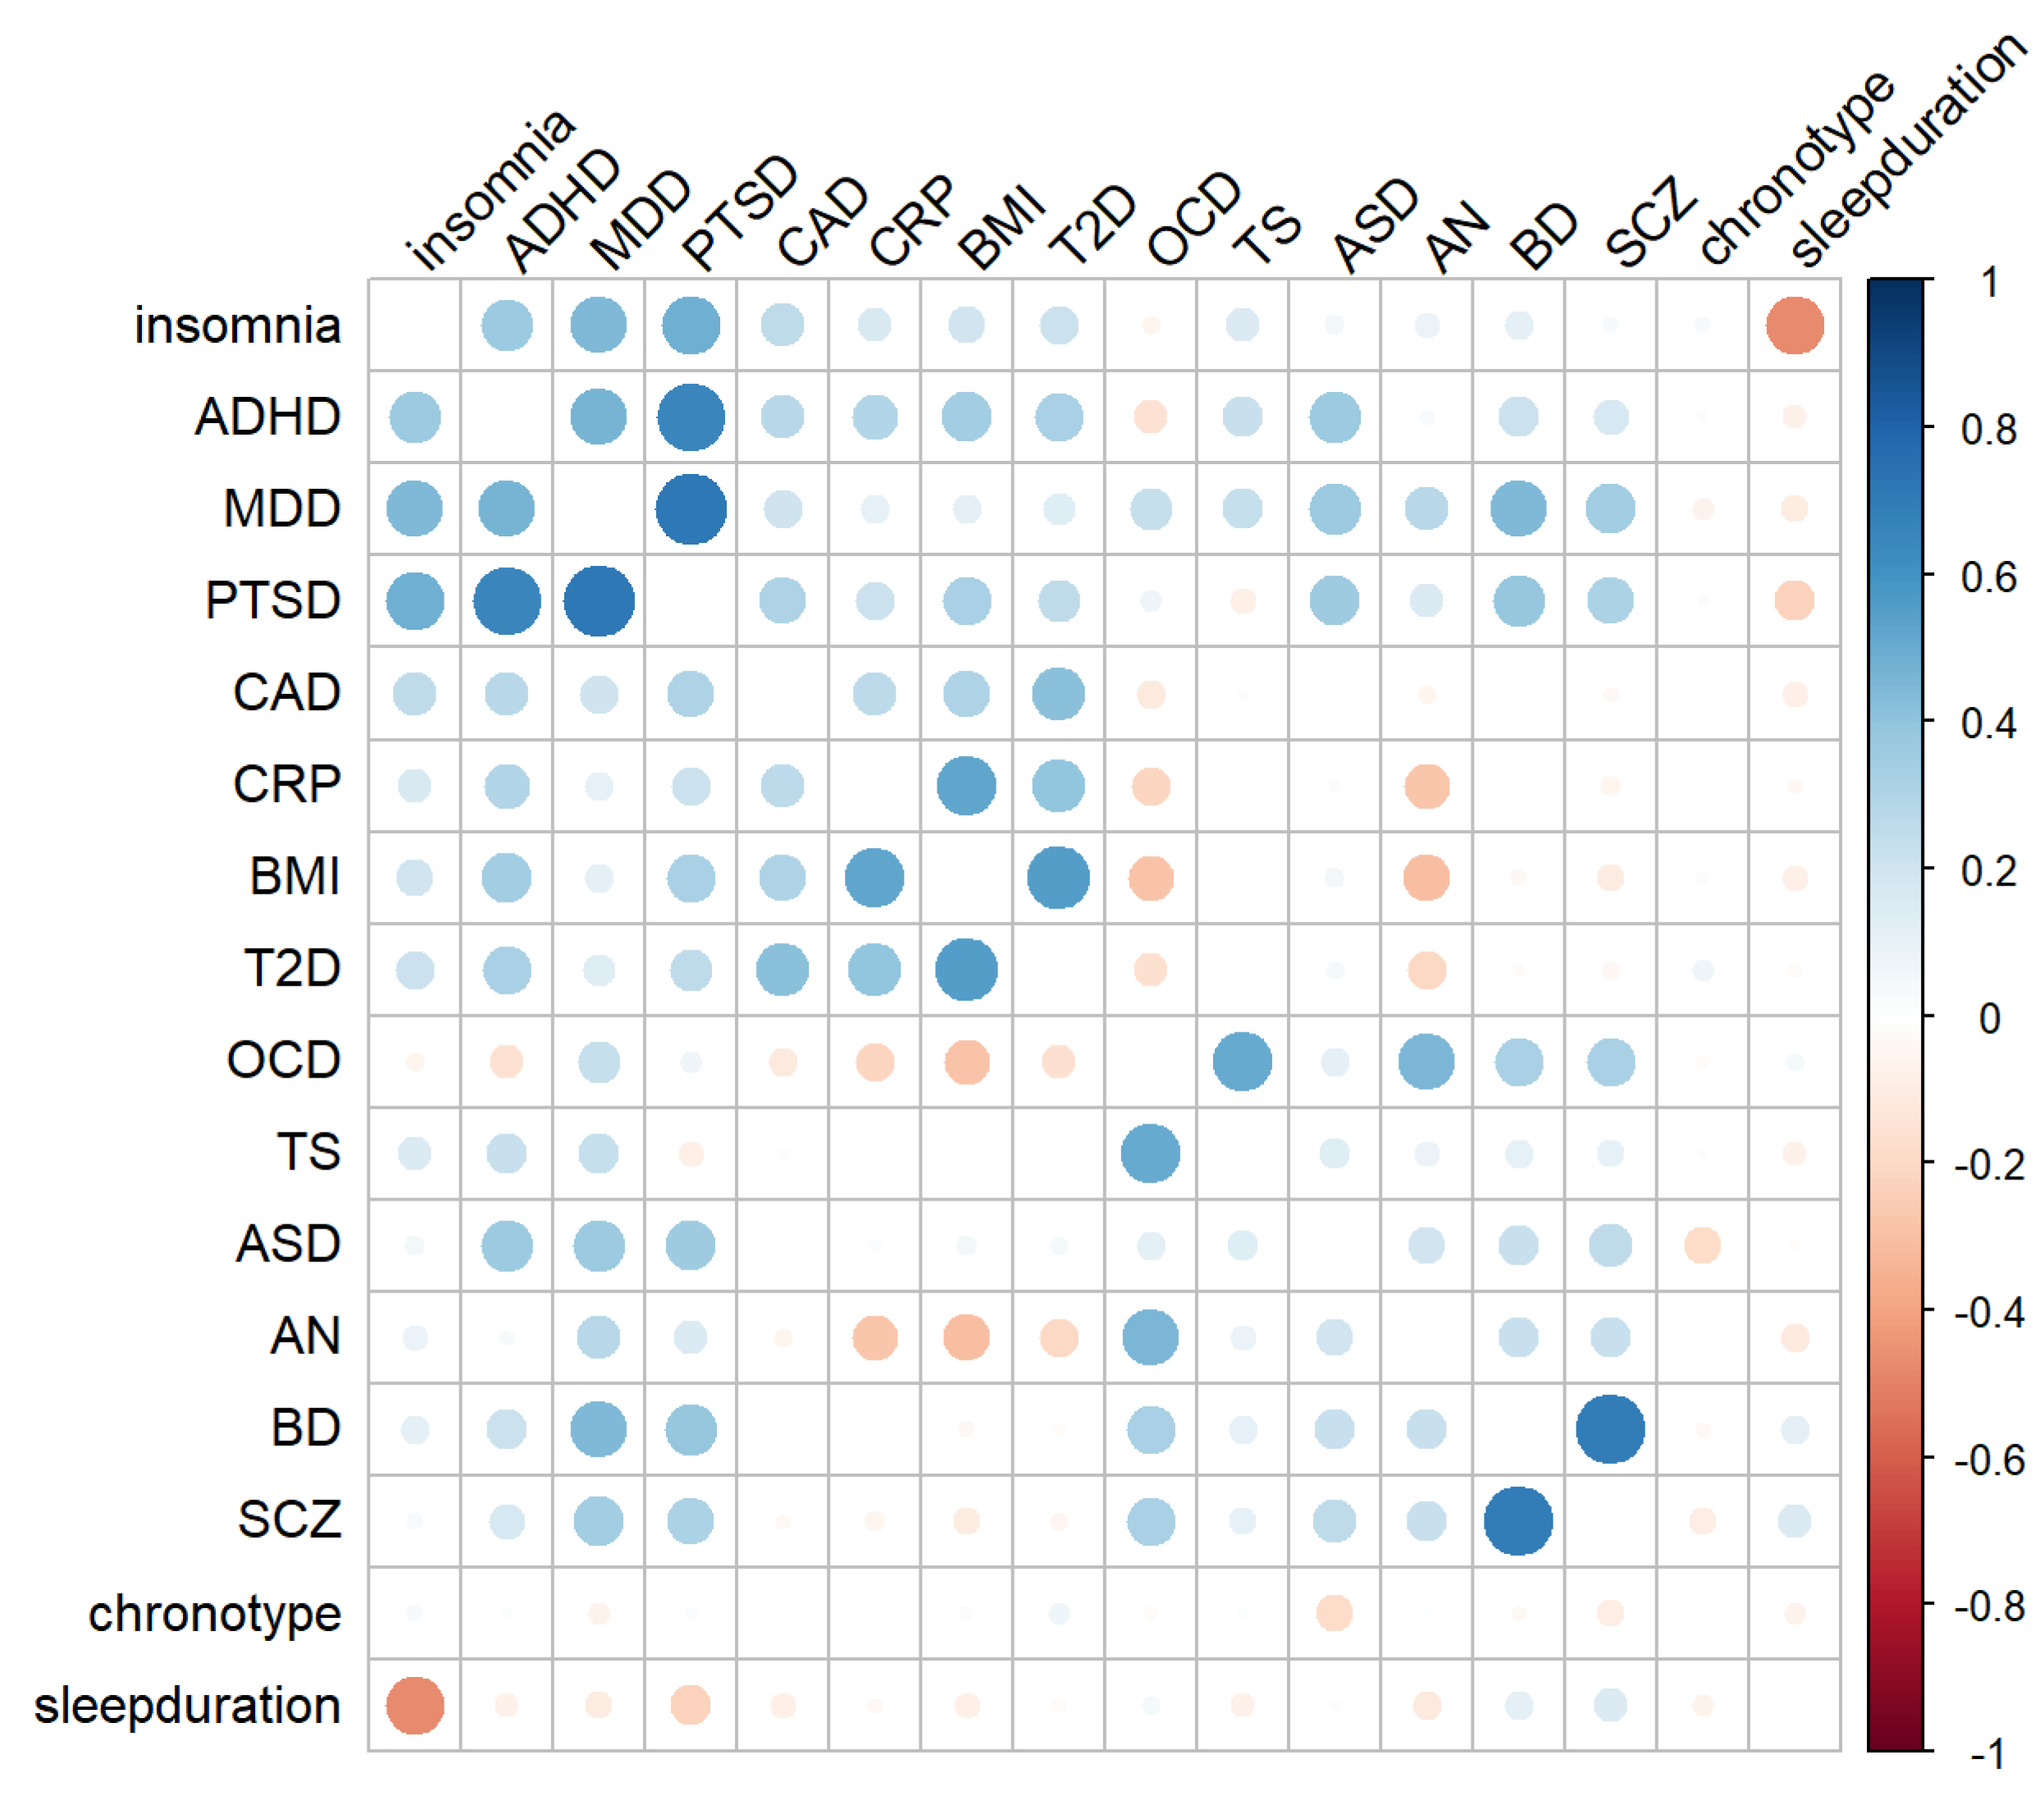
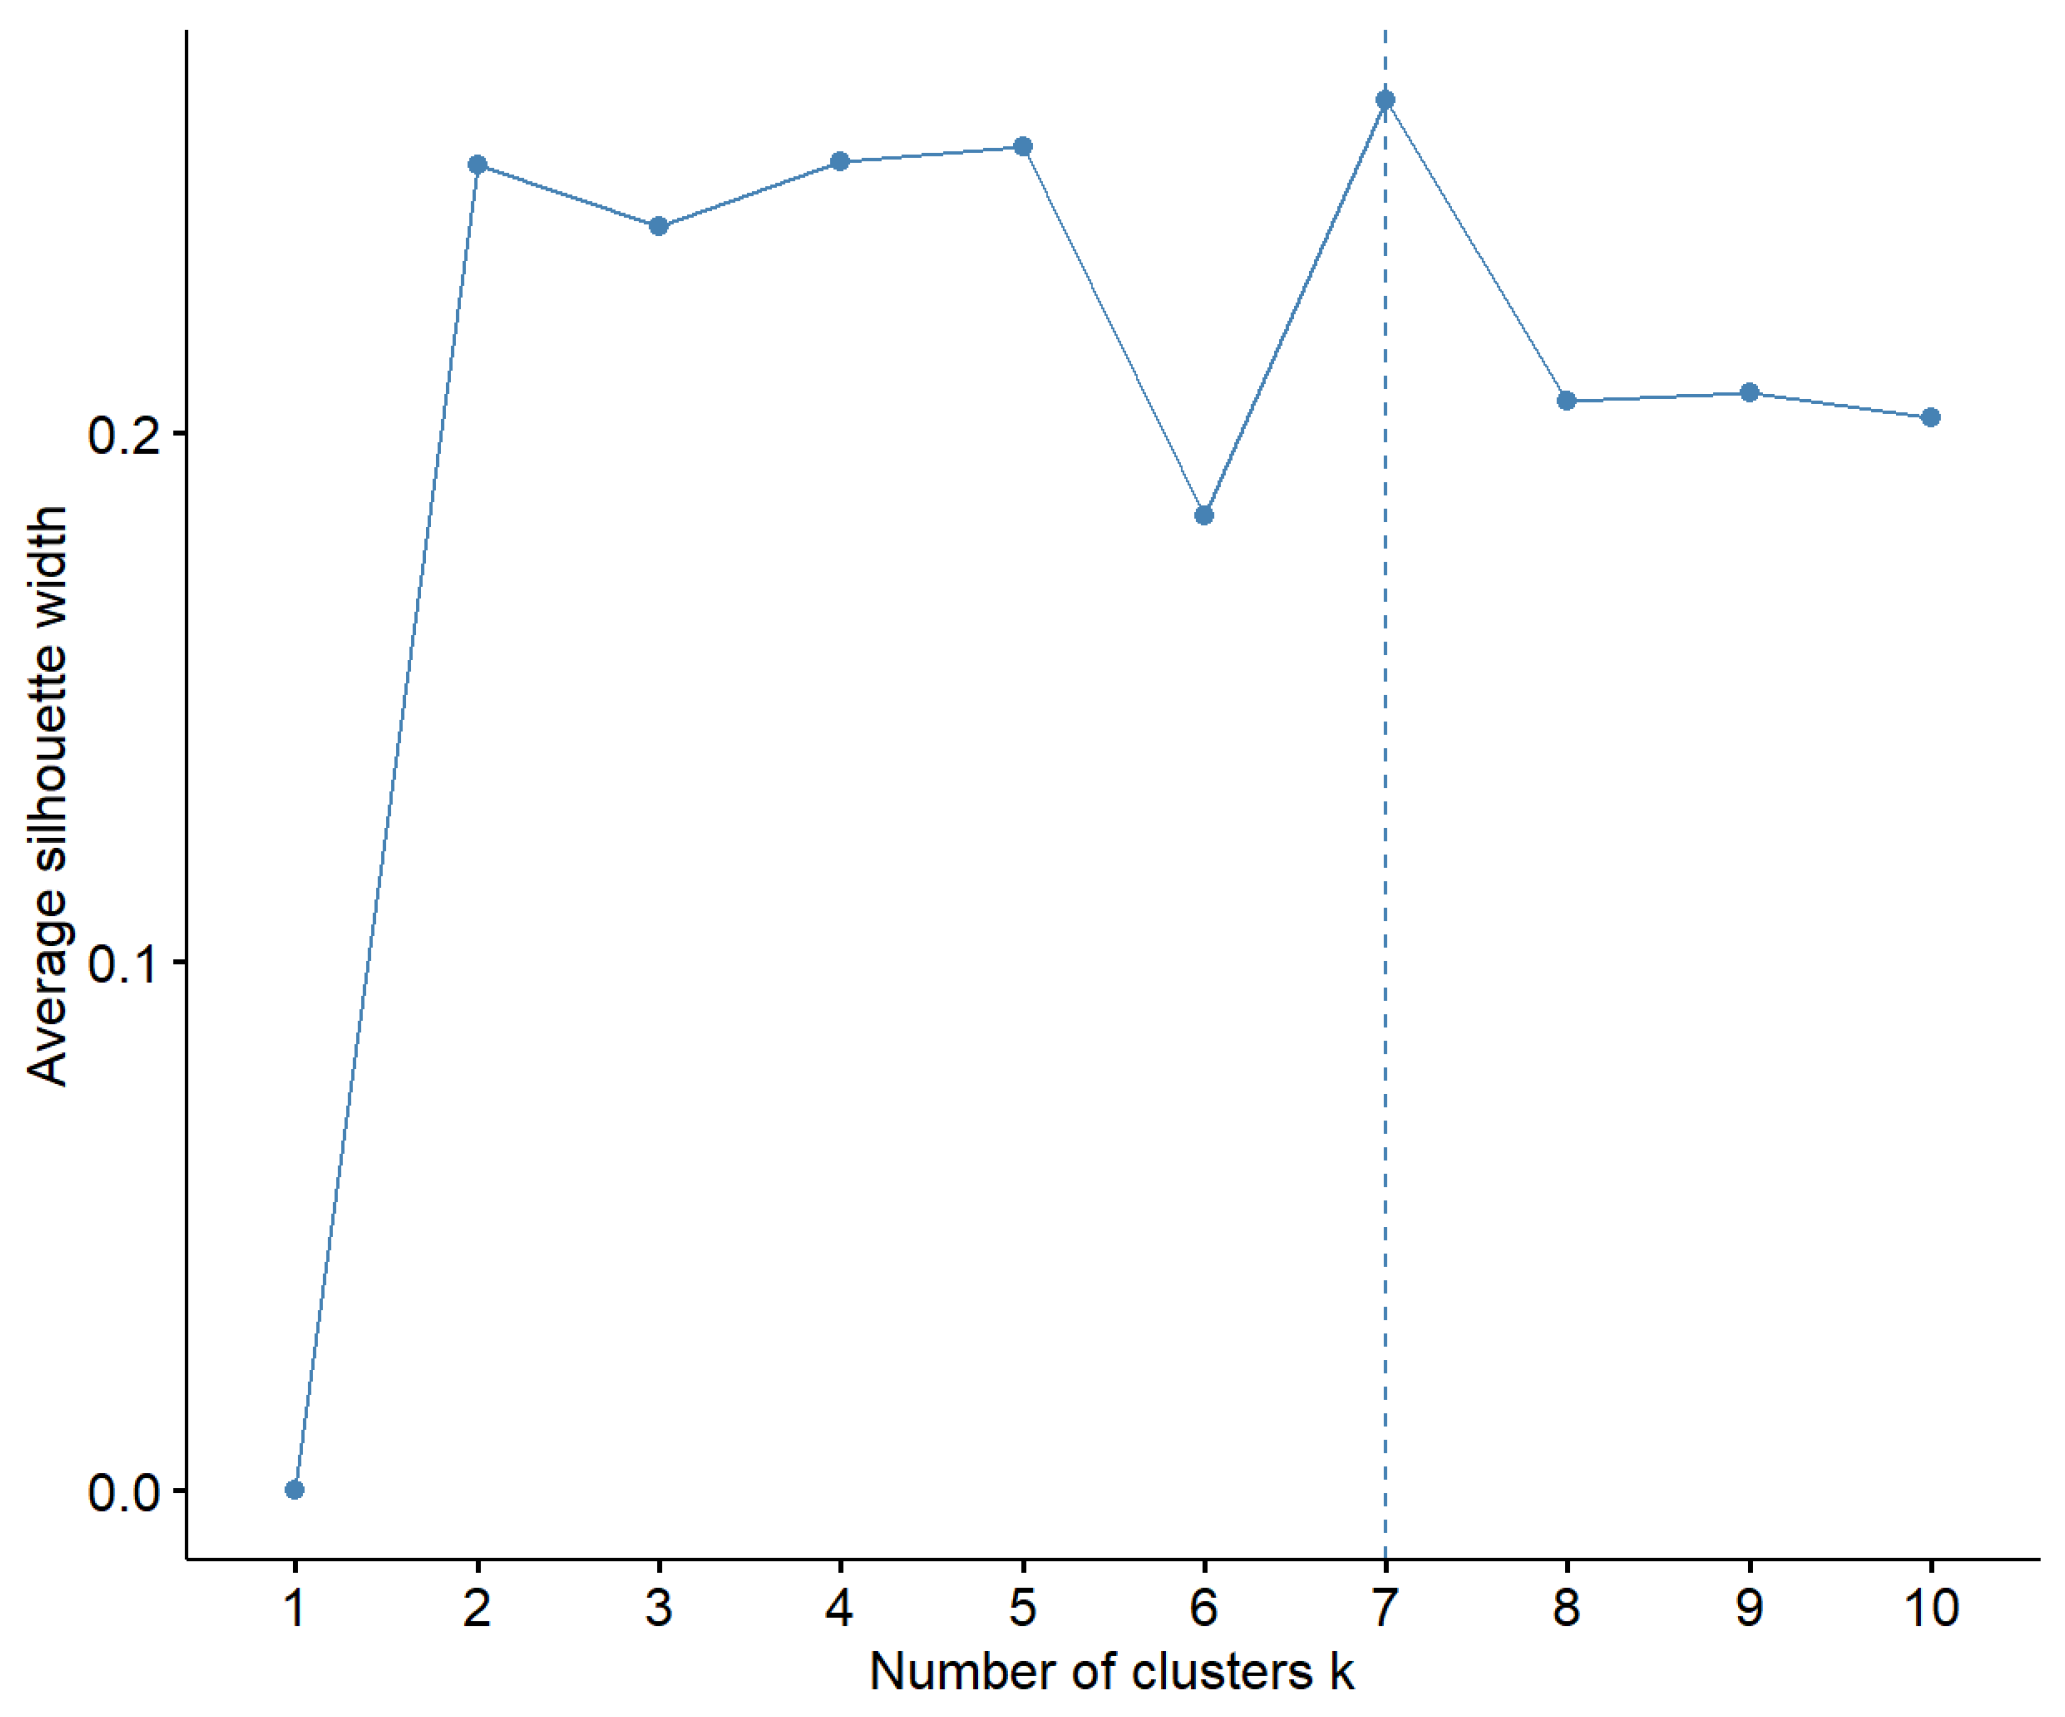
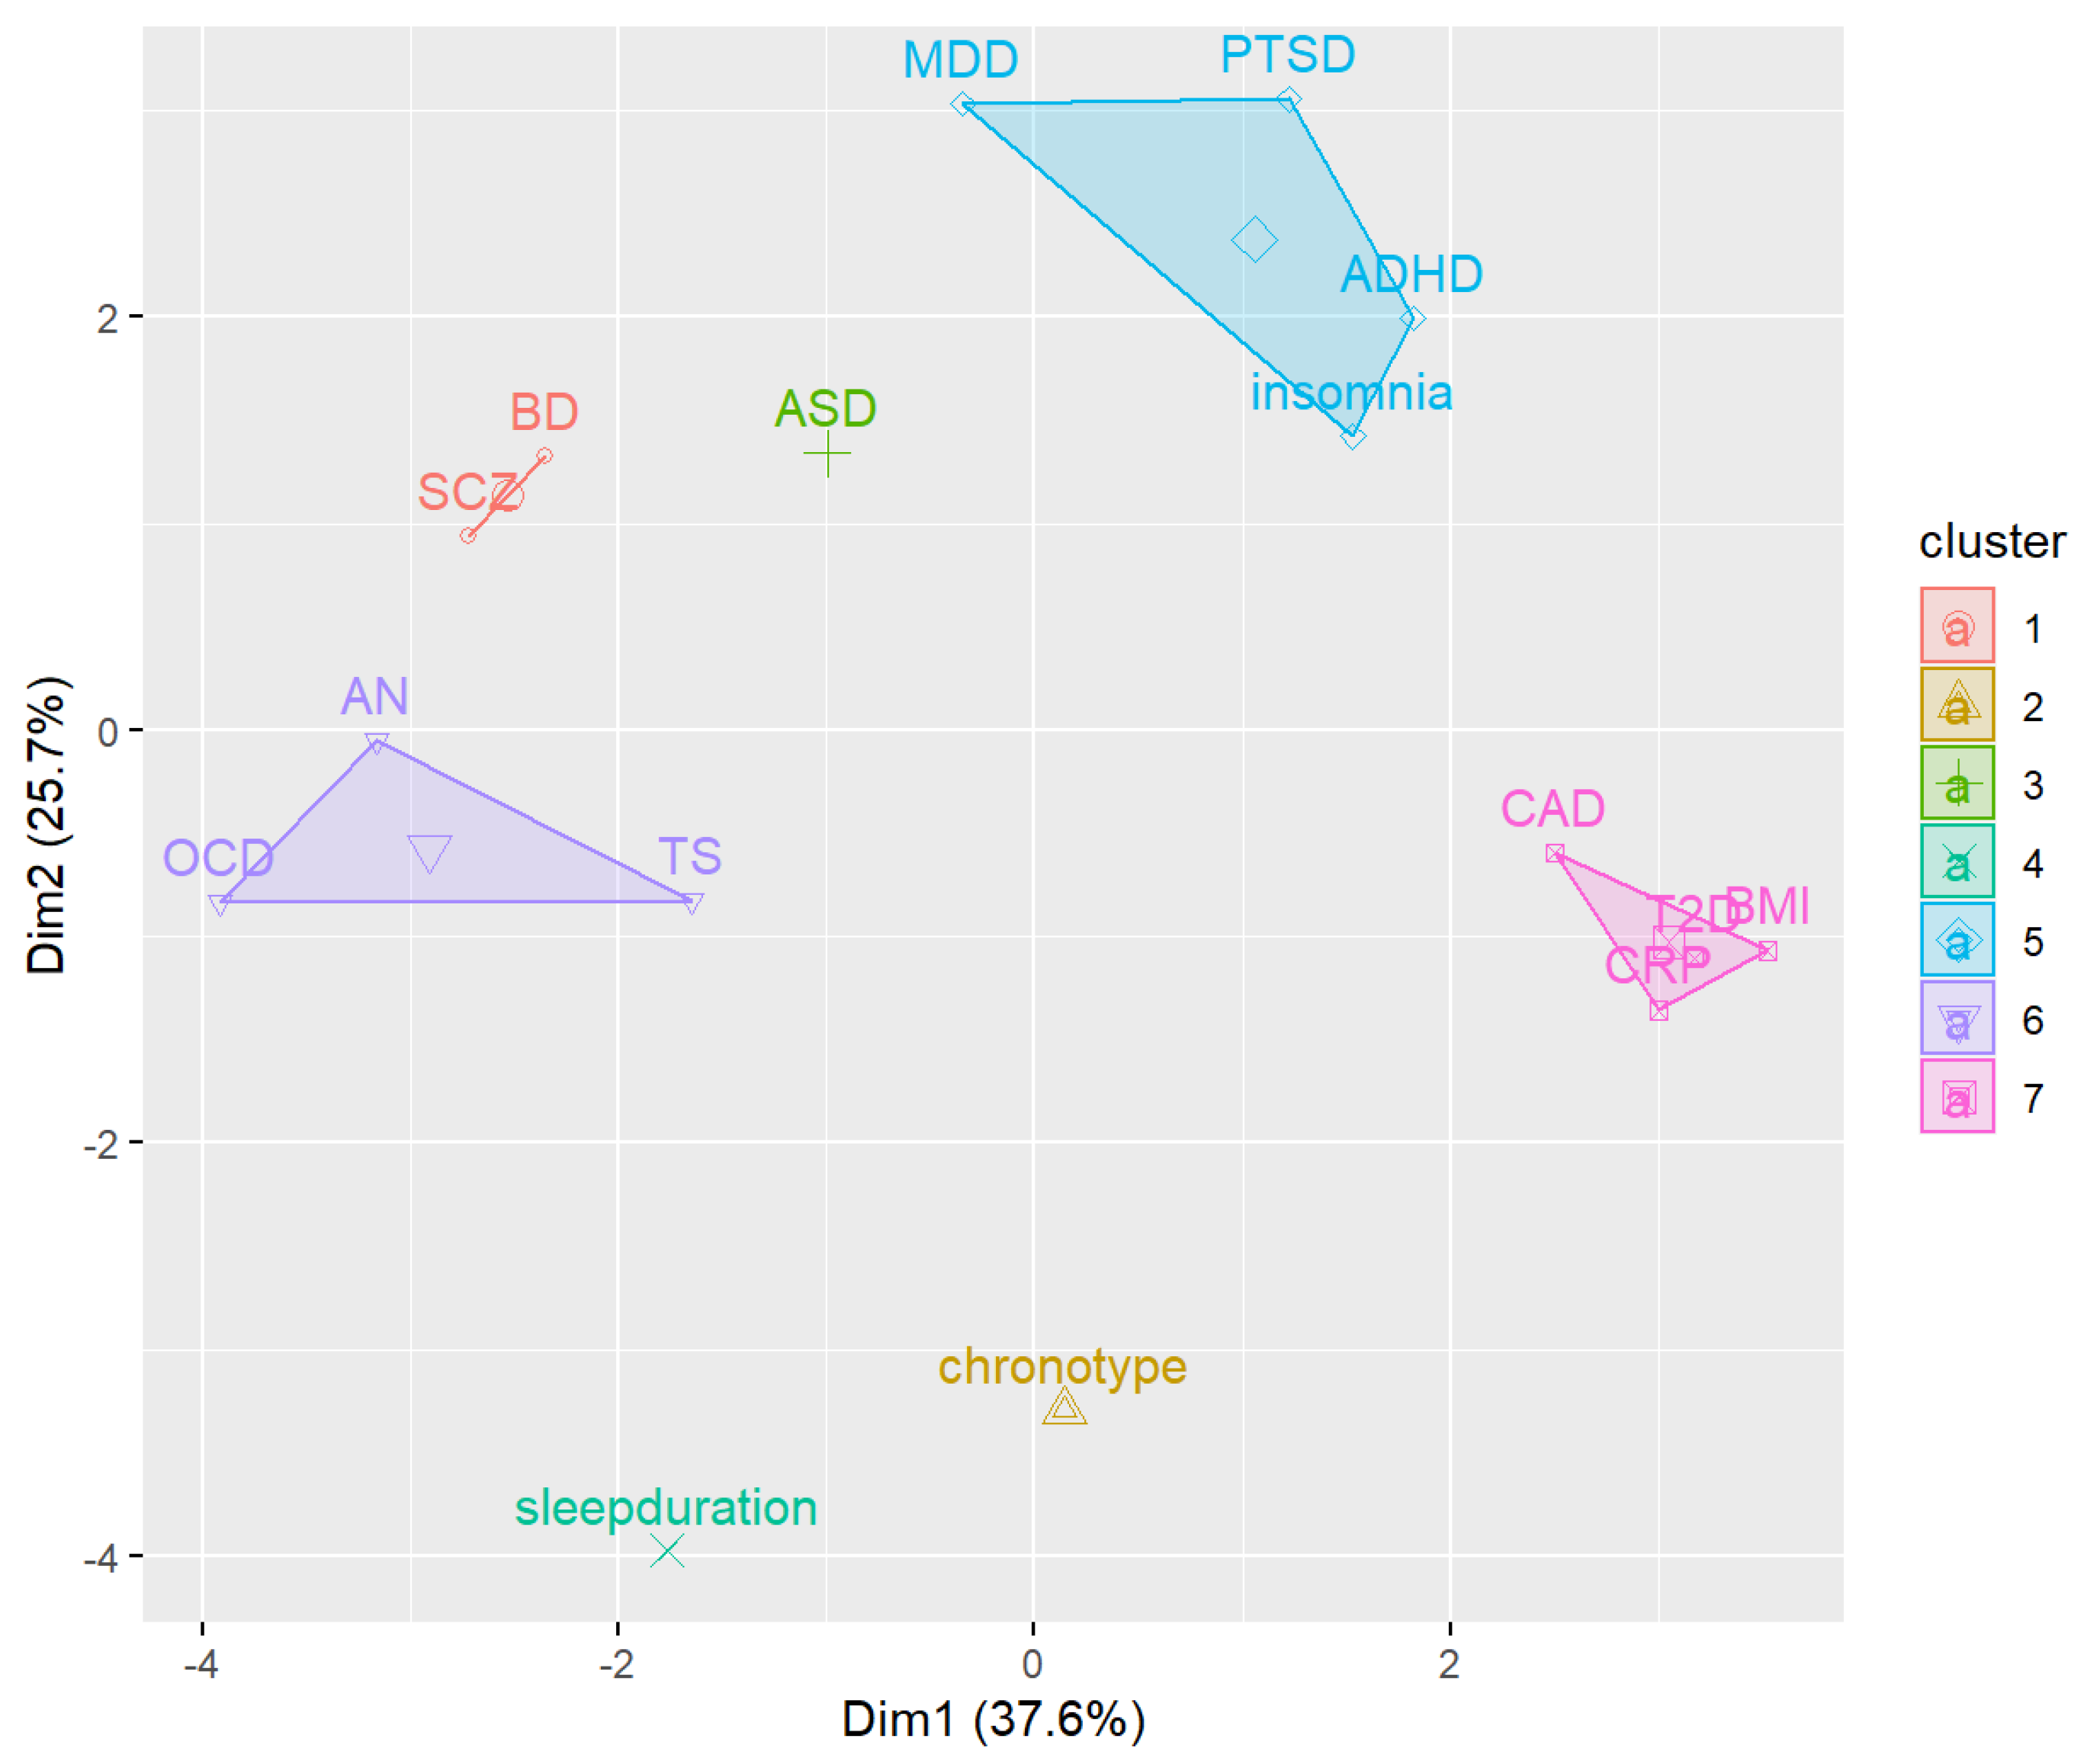
3.1. Linkage Disequilibrium Score Regression (LDSC) and K-Means Clustering

Figure 1 shows the genetic correlation matrix between psychiatric disorders, cardiometabolic and sleep traits. A total of 20 genetic correlations between psychiatric disorders and cardiometabolic traits (Table 1) and 11 between psychiatric disorders and sleep traits (Table 2) were significant after multiple testing correction. Significant correlations between cardiometabolic and sleep traits, or between psychiatric disorders, are reported in Table S2. We observed significant positive correlations between BMI or CRP levels and MDD, ADHD or PTSD. Conversely, BMI and CRP levels were negatively correlated with increased predisposition to SCZ, OCD and AN (Table 1). T2D was positively associated with increased predisposition to MDD, PTSD and ADHD, and negatively associated with predisposition to AN and OCD. Finally, CAD was positively associated with MDD, PTSD and ADHD (Table 1).
As regards to sleep traits, BD, MDD, ADHD, and PTSD showed positive genetic correlation with insomnia with rg ranging from 0.11 to 0.48 (Table 2). Several psychiatric disorders were associated with sleep duration, though in different directions: BD and SCZ showed a positive, while MDD, PTSD, and AN a negative correlation. Finally, SCZ and ASD showed a negative correlation with the morning person chronotype.
Next, we conducted k-means clustering using 7 clusters, which was suggested to be the optimal number by the silhouette coefficient (Figure 2). A visualization of the clusters in two dimensions is shown in Figure 3.
We observed a cluster including three psychiatric disorders (MDD, PTSD and ADHD) and insomnia. The three disorders were the ones showing largest effect size as regards to the cross-trait genetic correlation with insomnia (Table 2). Two other clusters only included psychiatric disorders (BD-SCZ, and OCD-TS-AN), while one cluster included all the cardiometabolic/inflammatory traits. Finally, three clusters included a single trait (ASD, sleep duration and chronotype). Results from k-means clustering support the relationship between insomnia and the three psychiatric disorders MDD, PTSD and ADHD. We further explored the relationship between these traits using MR.

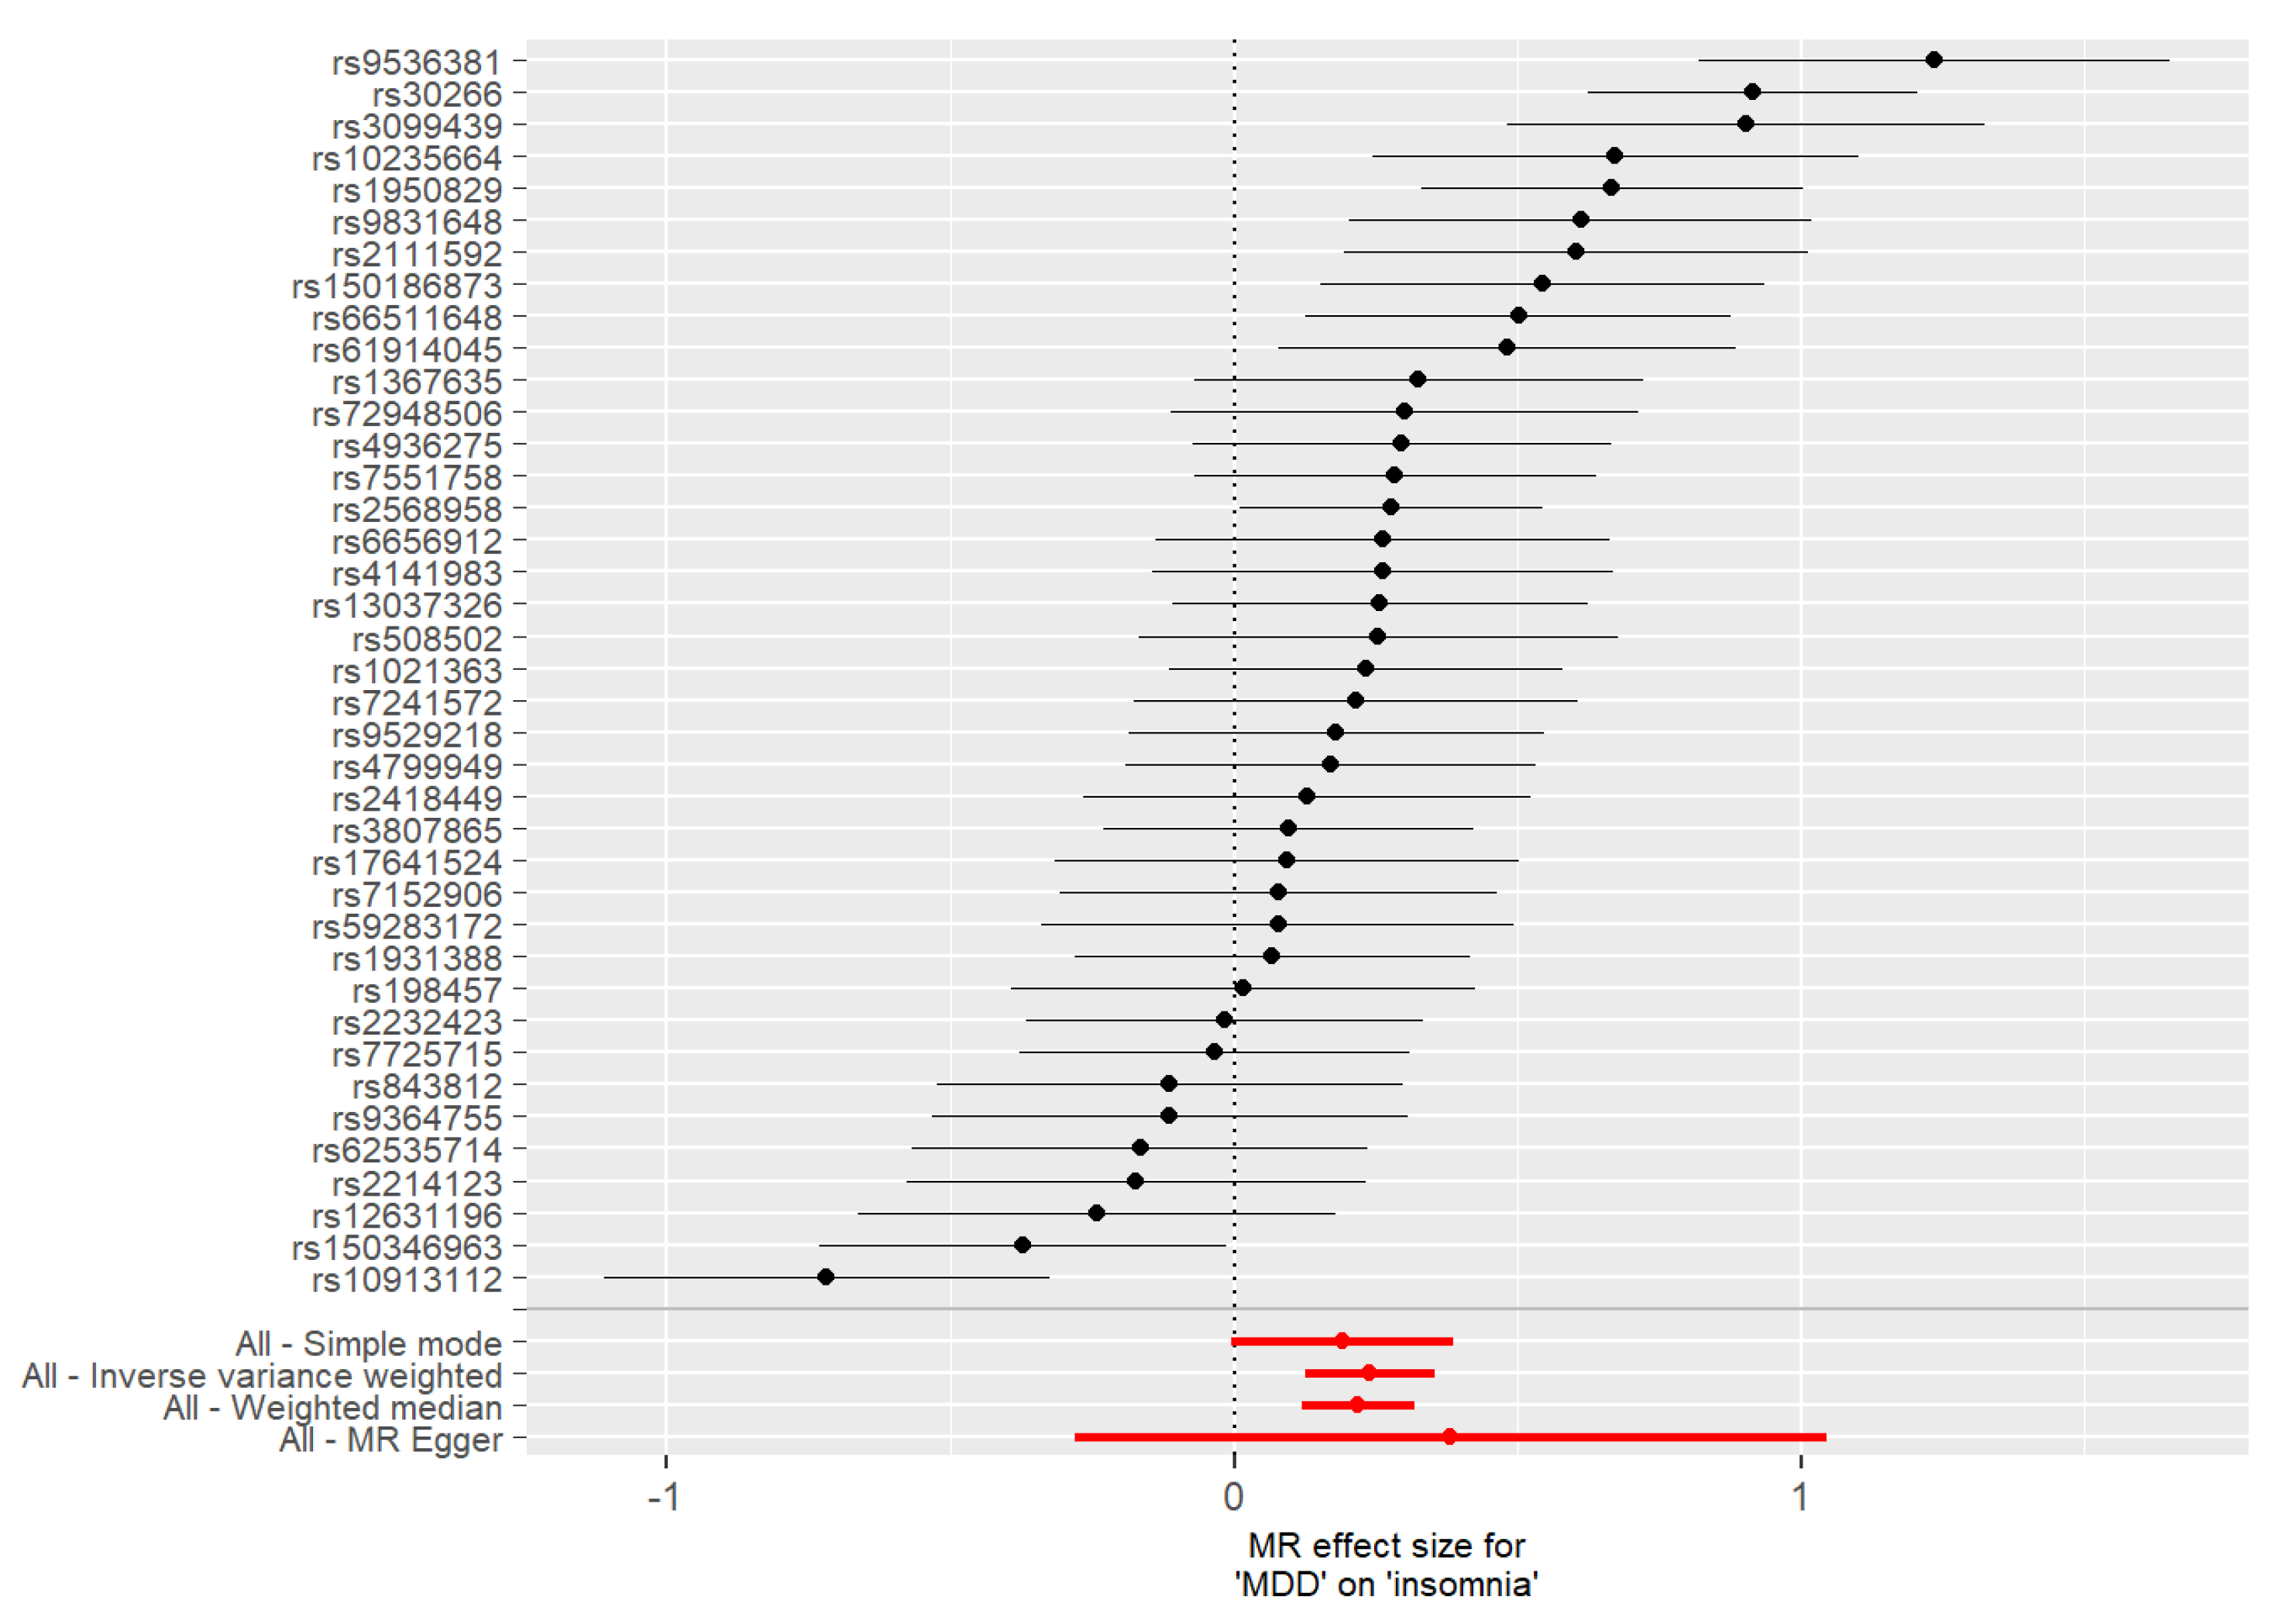
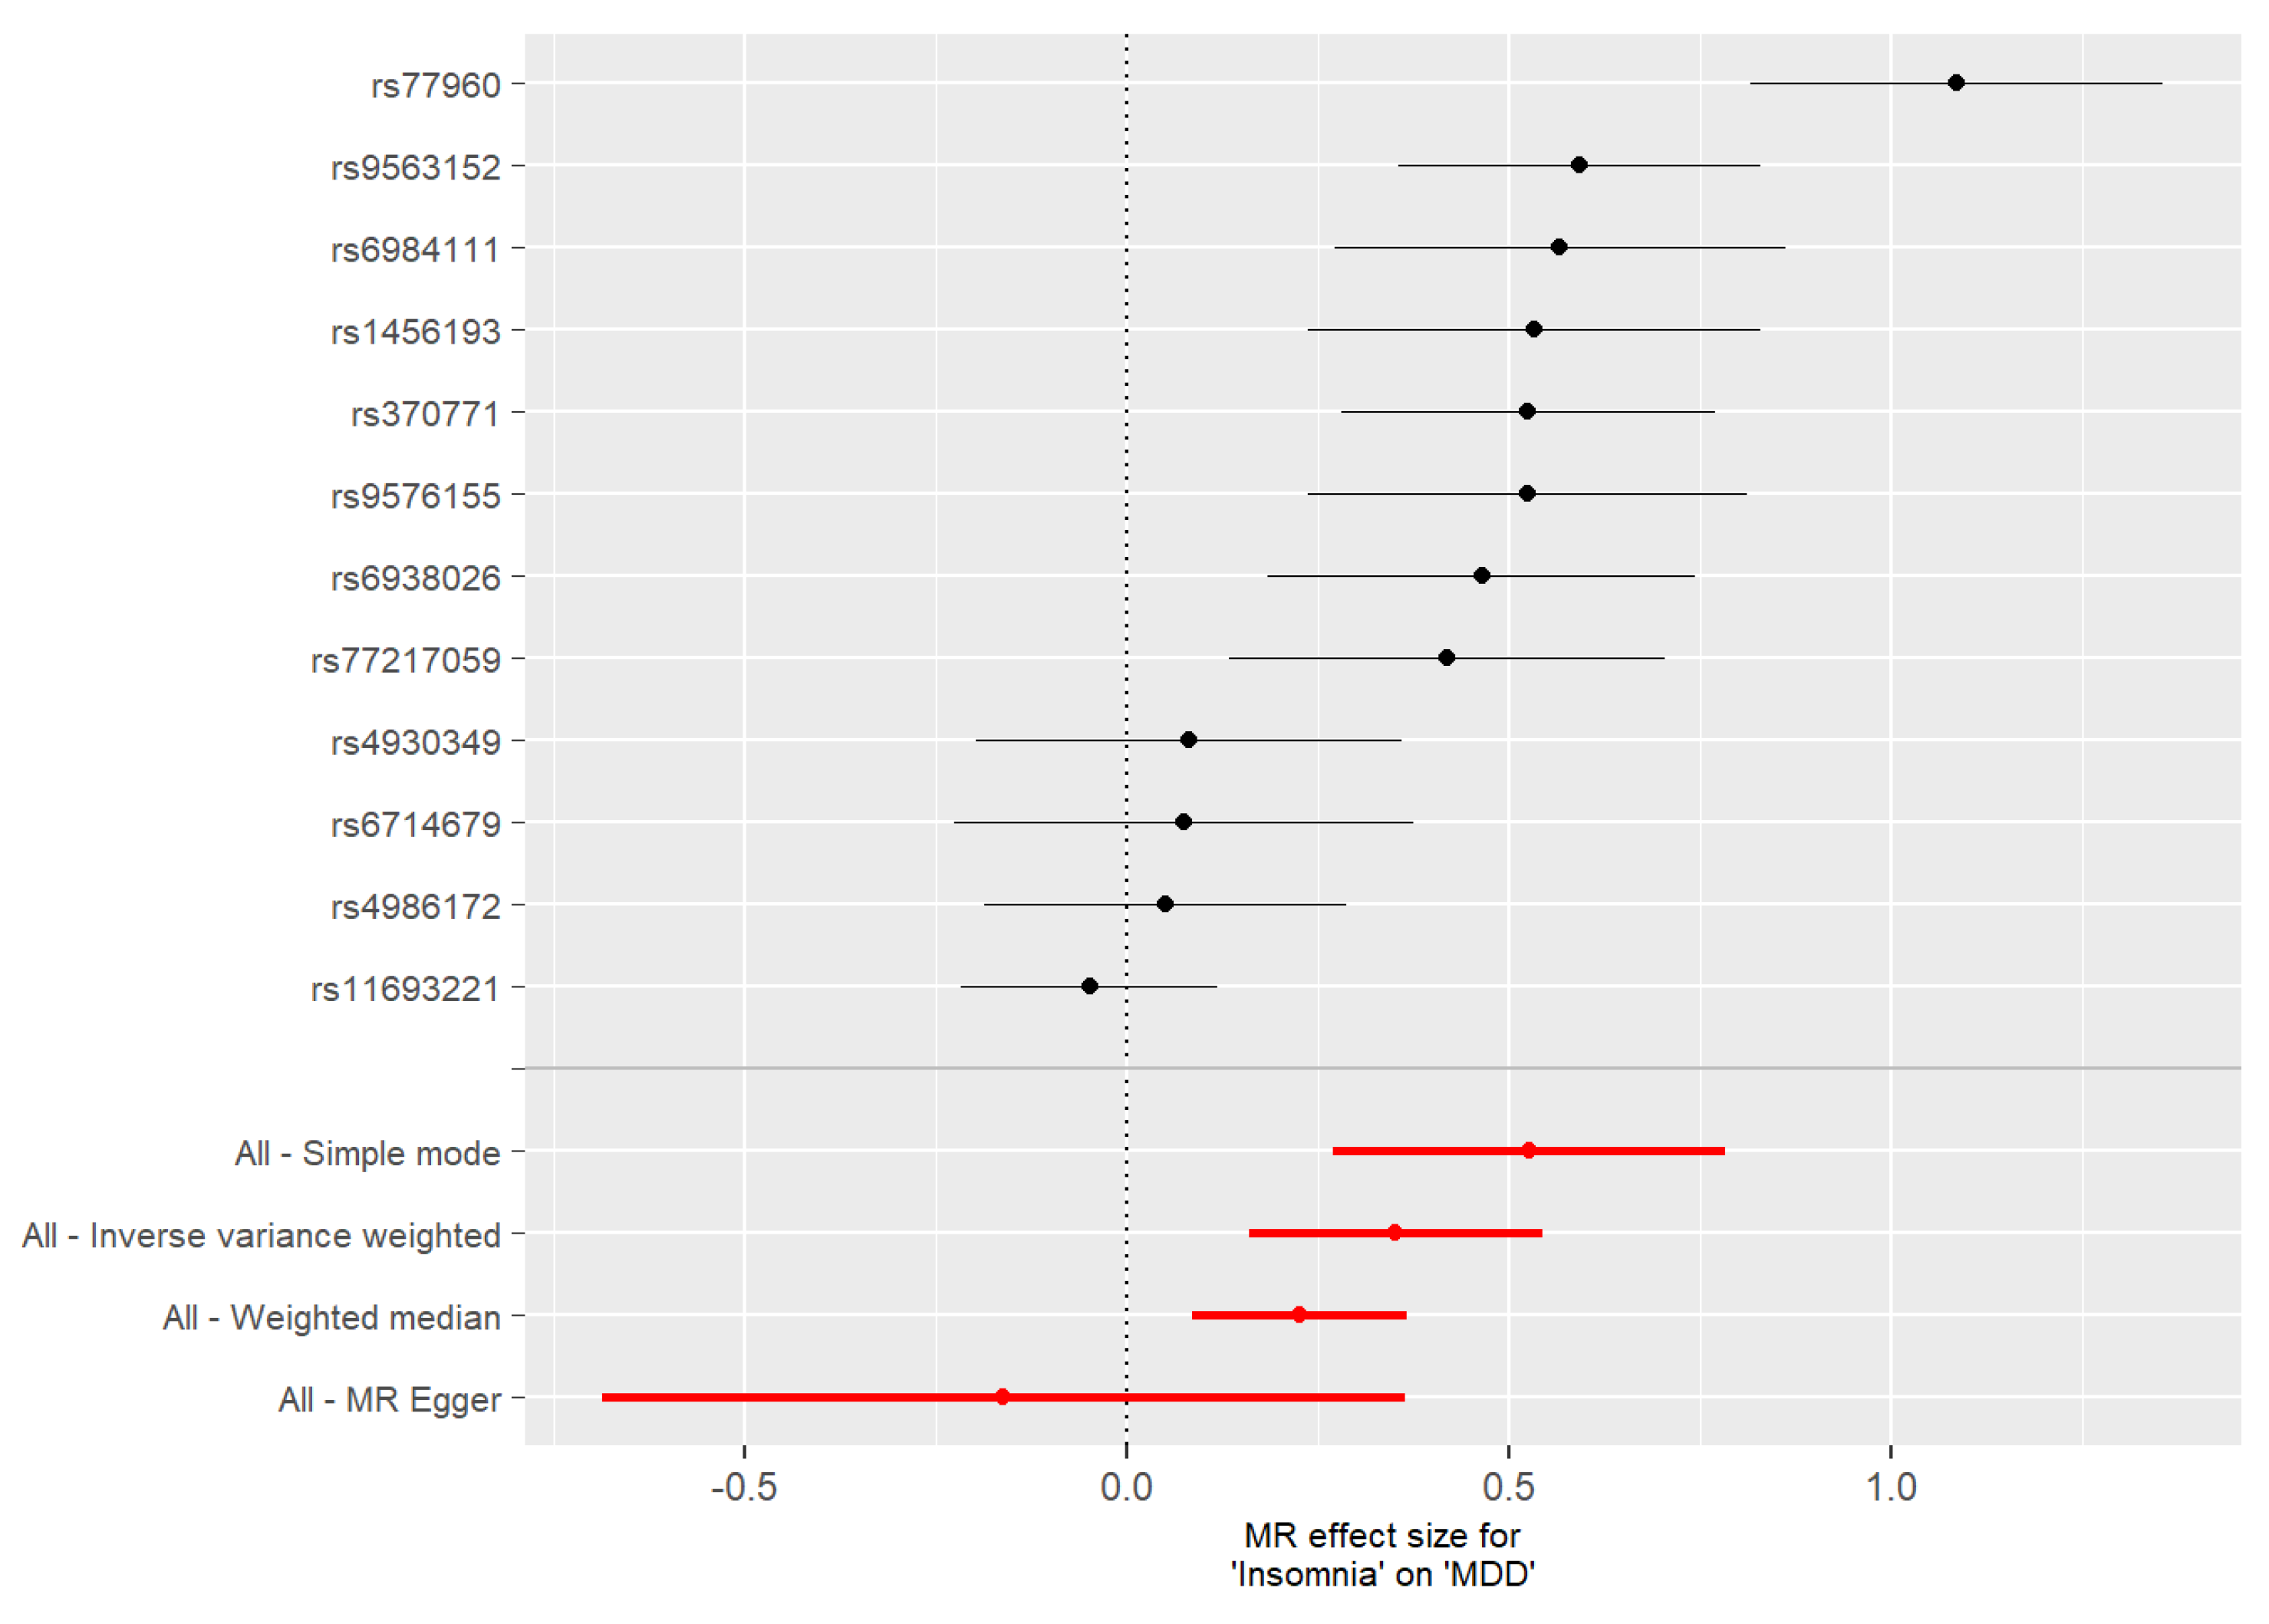
3.2. Mendelian Randomization

In the association between MDD (exposure) and insomnia (outcome), no significant evidence of horizonal pleiotropy was detected based on MR Egger intercept (egger intercept = 0.00, p = 0.67). Four of the tested methods (weighted median, inverse variance weighted, MR-PRESSO raw and MR-PRESSO outlier corrected) suggested the existence of a causal association between MDD and insomnia (Table 3). Conversely, only a trend was detected based on the simple mode and no significant association based on MR Egger (Table 3).
In the association between insomnia (exposure) and MDD (outcome), no significant evidence of horizonal pleiotropy was detected based on MR Egger intercept (egger intercept = 0.02, p = 0.07). All methods except MR Egger suggested the existence of a causal association between MDD and insomnia (Table 3). As regards to other psychiatric traits part of the same cluster, no significant horizontal pleiotropy was detected between insomnia (exposure) and either ADHD (Egger intercept = 0.04, p = 0.16), ASD (Egger intercept = 0.00, p = 0.89) or PTSD (Egger intercept = 0.03, p = 0.07). We observed no significant causal effect of insomnia on ADHD and ASD (Table S3) and very limited evidence for a potential effect of insomnia on PTSD, with only the inverse variance weighted method suggesting a significant association (Table S4). In addition, we observed no evidence of horizontal pleiotropy (Egger intercept = 0.02, p = 0.41) and no significant causal effect of ADHD on insomnia (Table S3), while the causal effect of PTSD and ASD on insomnia could not be tested due to the limited number of significant and independent SNPs associated with the two psychiatric disorders in the original datasets. The significant bidirectional association observed between MDD and insomnia was further confirmed with additional analyses conducted using the top 10,000 genetic variants of the datasets (including data from 23andMe participants) or the independent significant loci reported by the MDD (Tables S5–S8) or the insomnia GWAS (Tables S9–S12).
Since the most convincing results were obtained in the MR analysis investigating the association between MDD and insomnia, we chose these traits for further analyses. The forest plots in which we compared the MR estimates using different MR methods against single SNP tests are shown in Figure 4 and Figure 5. Ten and eight SNPs were significant using MR single-SNP tests when evaluating the effect of MDD on insomnia (Figure 4) or the effect of insomnia on MDD (Figure 5), respectively. These SNPs were further investigated to obtain information on their potential functional effect.

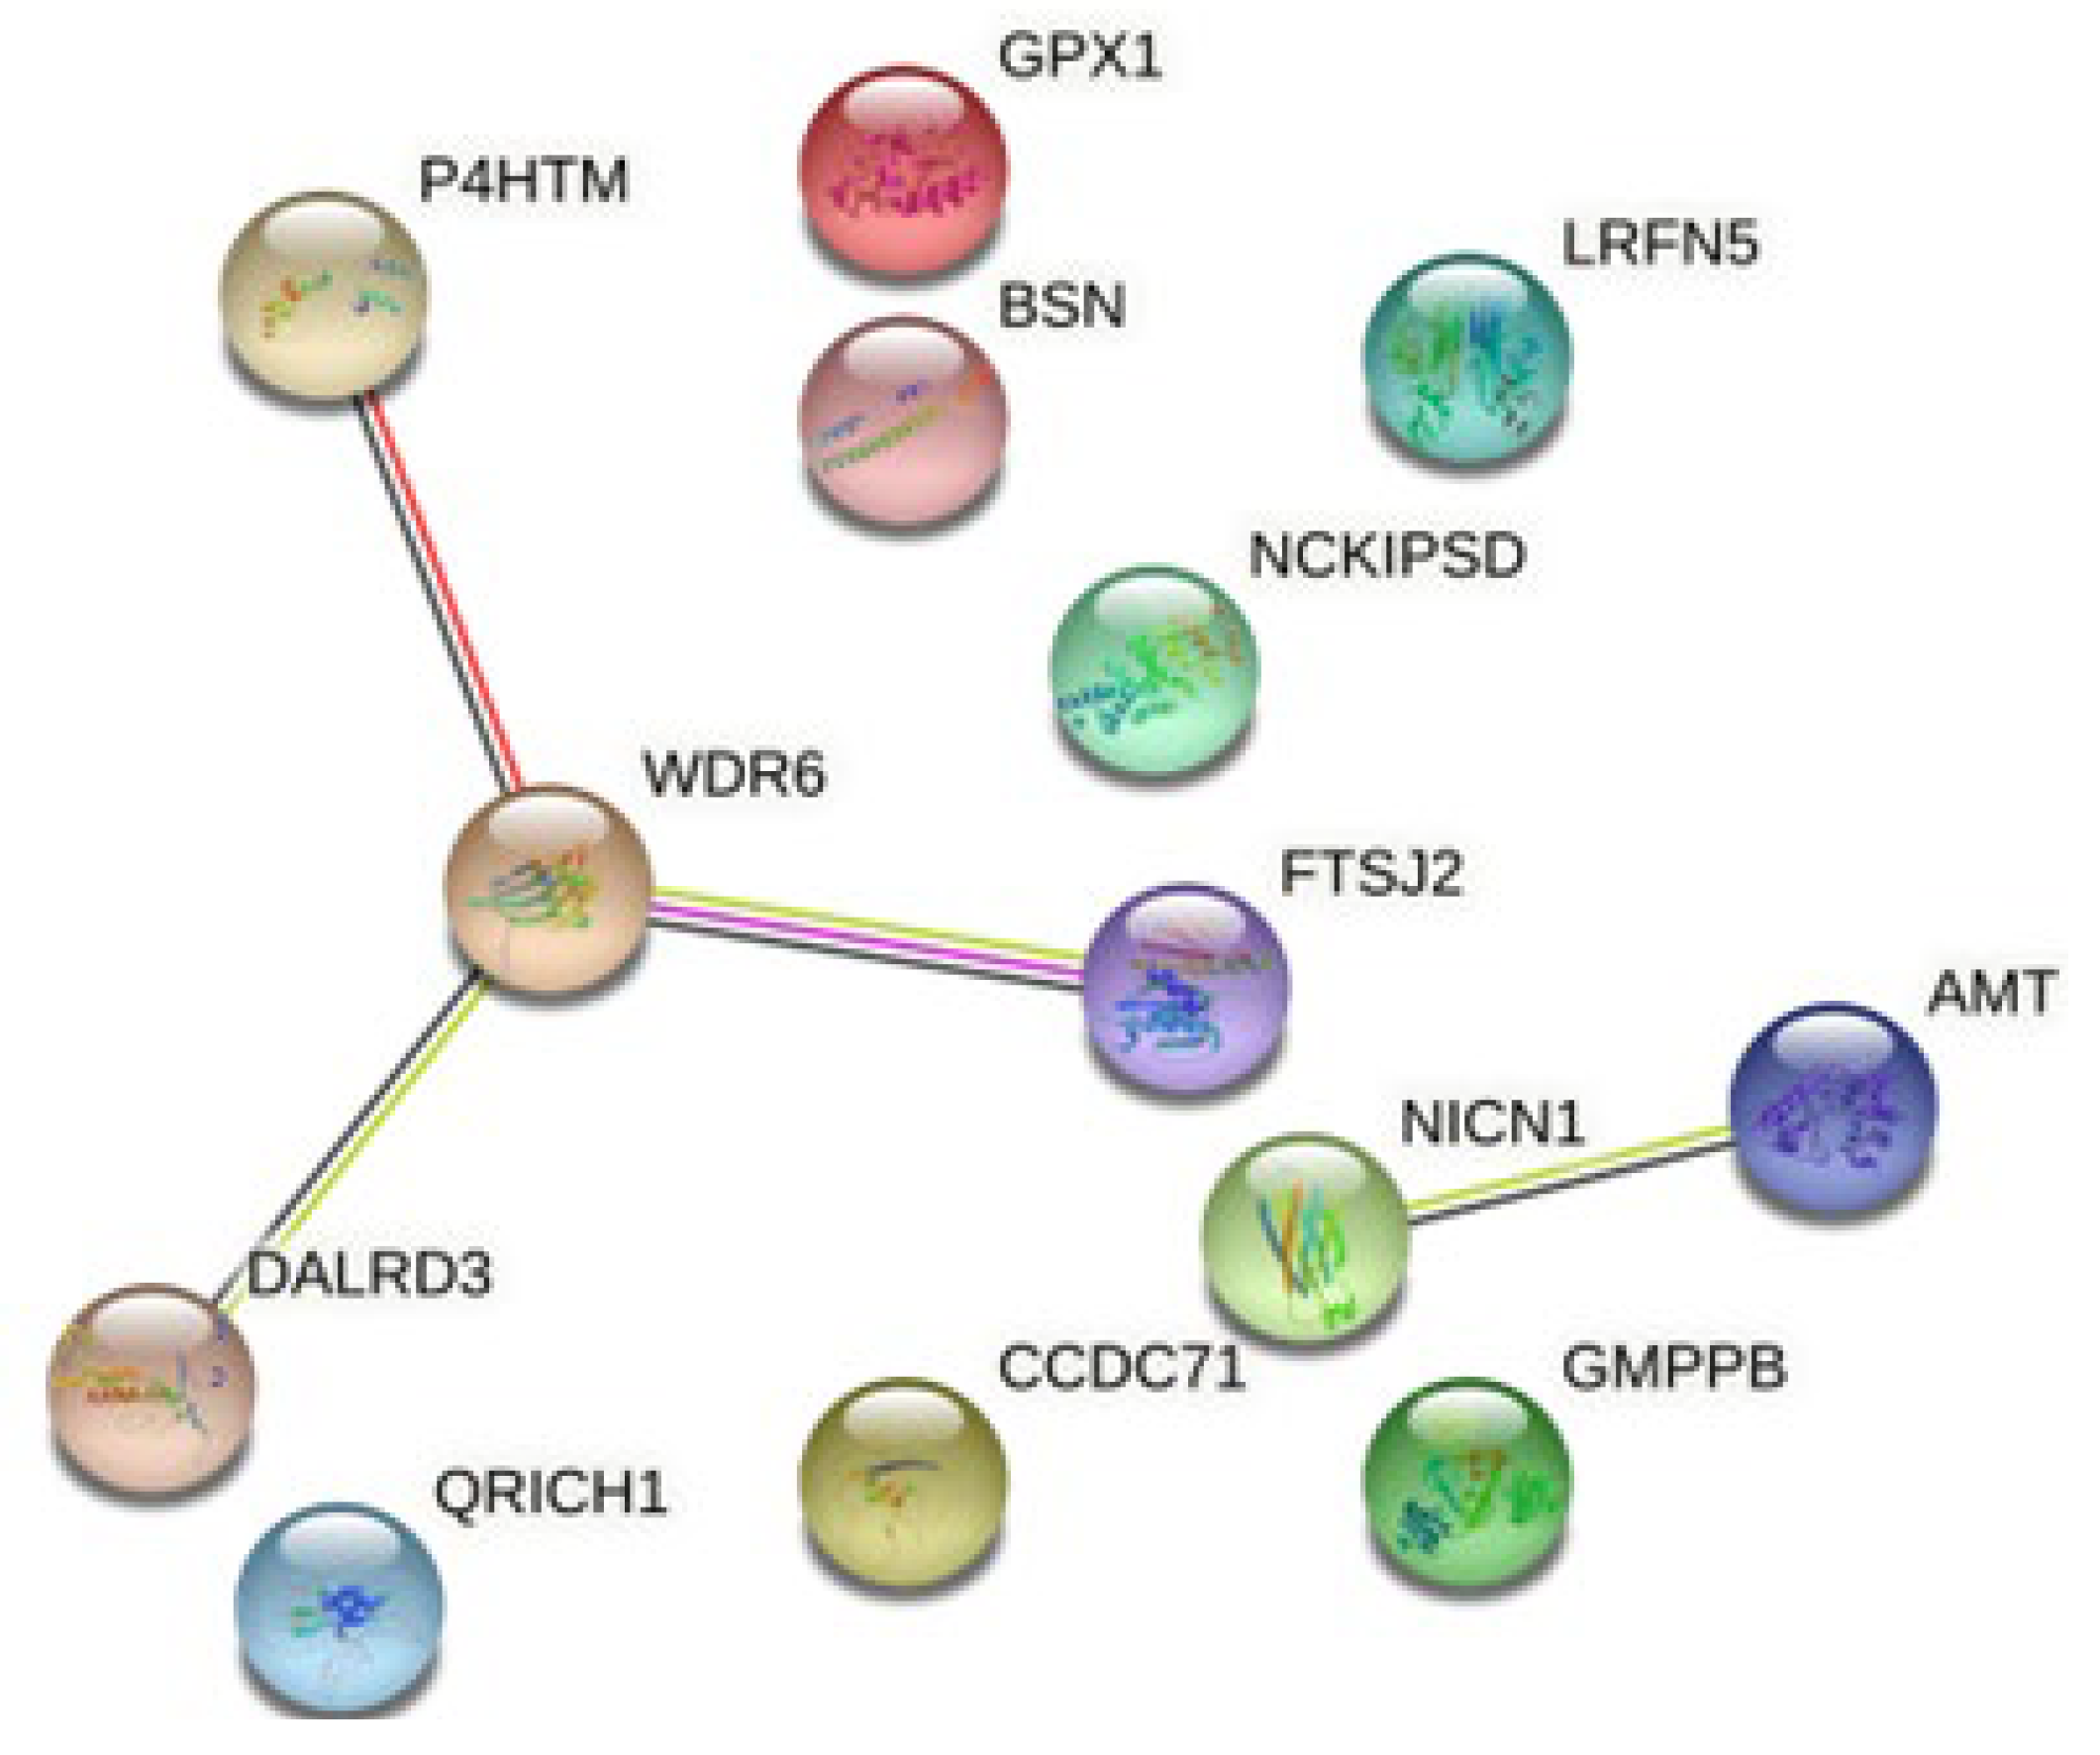
3.3. Functional Effect of SNPs Identified with MR in the Analysis with MDD and Insomnia

The forest plots in which we compared the MR estimates using different MR methods against single SNP tests are shown in Figure 4 and Figure 5. Ten and eight SNPs showed a significant effect when evaluating the effect of MDD on insomnia (Figure 4) or the effect of insomnia on MDD (Figure 5), respectively. These SNPs were further investigated to obtain information on their potential functional effect.
RegulomeDB scores for the ten SNPs driving the effect of MDD on insomnia ranged from 0.03 to 0.92 (Table 4). Six SNPs were found to act as eQTLs for a total of 20 genes in different brain regions (Table 4). We found that proteins encoded by these genes show more interactions among themselves compared to what would be expected for a random set of proteins of the same size and degree distribution drawn from the genome (PPI enrichment value = 0.001, Figure 6).
RegulomeDB scores for the eight SNPs driving the effect of insomnia on MDD ranged from 0.18 to 0.99 (Table 5). Four SNPs were found to act as eQTLs for a total of 5 genes in different brain regions (Table 5). Proteins encoded by these genes did not show a significant enrichment as regards to their interactions (PPI enrichment = 1).

3.4. Local Genetic Correlation Analysis

We used the univariate test implemented in LAVA to assess the local heritability of 15 loci in which the SNPs found to be significant in the MR analysis were located. Local heritability was small from all loci, ranging from 0.0001 to 0.0004 for MDD and from 0.0001 to 0.0005 for insomnia. After multiple testing adjustment, four loci showed significant heritability for both phenotypes, while six and two other loci showed significant heritability exclusively for MDD and insomnia, respectively (Table 6).
Of the four loci showing significant heritability for both MDD and insomnia, three showed a significant bivariate local genetic correlation (Table 7). For the locus on chr2, including the rs77217059 SNP, we observed a significant local positive genetic correlation between MDD and insomnia (rho = 0.64, r2 = 0.41, adj p = 0.002) and no significant correlation between these two phenotypes and any cardiometabolic trait (Table 7).
For the locus on chr 3 including the rs9831648 SNP, we observed a significant local positive genetic correlation between MDD and insomnia (rho = 0.60, r2 = 0.36, adj p = 0.045), as well as significant local bivariate genetic correlation between MDD and BMI (rho = 0.48, r2 = 0.23, adj p = 0.006) or between insomnia and BMI (rho = 0.69, r2 = 0.47, adj p = 1.7 × 10⁻⁹), CRP (rho = 0.66, r2 = 0.44, adj p = 4.2 × 10⁻⁵) and CAD (rho = 0.54, r2 = 0.29, adj p = 0.033). Partial correlation analysis between MDD and insomnia, adjusted for BMI, CRP or both variables, suggested that these variables account for a notable proportion of the local rg between MDD and insomnia. In fact, we observed that BMI and CRP levels explained a substantial proportion of the genetic variance for MDD and insomnia at this locus (e.g., BMI explained 23% and 47% of the proportion of genetic variance for MDD and insomnia, respectively, Table 8). Consistently, the correlation between MDD and insomnia was no longer significant when adjusting for these variables (Table 8). Results for partial correlation analysis between MDD and insomnia adjusting for CAD are not reported, as LAVA deemed estimates to be unreliable (estimate out of bounds).
Finally, we observed a significant positive genetic correlation between MDD and insomnia at the locus on chr 13 including the two SNPs rs9536381 and rs9563152 (rho = 1, r2 = 1, adj p = 9.9 × 10⁻⁵). At this locus, we also observed a significant positive genetic correlation between MDD and BMI (rho = 0.48, r2 = 0.23, adj p = 0.012), as well as between insomnia and BMI (rho = 0.55, r2 = 0.31, adj p = 0.001) or CRP (rho = 1, r2 = 1, adj p = 0.0002). When adjusting for BMI, the partial correlation analysis between MDD and insomnia was still significant (r2_MDD_BMI = 0.23, r2_MDD_BMI = 0.31, rho partial correlation = 1, p partial correlation = 0.0003). Results for partial correlation analysis between MDD and insomnia adjusting for CRP are not reported as LAVA deemed estimates to be unreliable (estimate out of bounds).

4. Discussion

In this study, we investigated the association between predisposition to psychiatric disorders and different cardiometabolic and sleep traits. Using k-means clustering on the global genetic correlation matrix computed between psychiatric, cardiometabolic and sleep-related traits, we identified a cluster including insomnia and the three psychiatric disorders MDD, ADHD and PTSD. While no cluster including both psychiatric and cardiometabolic traits was identified, several significant genetic correlations between psychiatric disorders and cardiometabolic traits were observed (Table 1). When we further investigated the relationships between disorders included in the identified cluster, MR analysis supported the existence of a bidirectional association between MDD and insomnia (Table 3). The majority of SNPs found to drive this association were observed to affect the expression of a number of genes in different brain regions (Table 4 and Table 5). Our results are in line with the study from Cai and colleagues, who observed a significant bidirectional association between MDD and insomnia using another MR method compared to the ones we used in the present analysis [53]. Some of these loci, such as the ones having as the nearest genes TMEM161B, LRFN5 or the RP11-6N13.1 non-coding RNA, were also found to be associated with both MDD and insomnia in a recent study conducted by O’Connell and colleagues, using the conjunctional FDR method to identify genetic loci associated with pairs of traits [21]. When we investigated the loci in which SNPs driving the MR association were located using local genetic correlation analysis, we observed a significant positive local genetic correlation between MDD and insomnia for three loci (Table 7). For two of these loci, cardiometabolic traits were not found to exert a significant effect on the association between MDD and insomnia. At the first locus, the SNP driving the MR results was rs77217059. This SNP is located in the LINC01122 long non-coding RNA, the biological role of which is still unknown. The other locus that showed a significant correlation between MDD and insomnia, also when adjusting for BMI, was at chromosome 13 and included the two SNPs rs9536381 and rs9563152 among those driving the MR results. Both SNPs are intergenic and the second was found to drive the expression of the RP11-24H2.3 long non-coding RNA in the anterior cingulate brain region in GTEx. Specifically, the T-allele of the rs9563152 SNP, which was associated with increased predisposition to both MDD and insomnia (Table 4), is also associated with reduced expression of RP11-24H2.3 in the anterior cingulate. While the biological relevance of this and of several long non-coding RNAs is not known, this class of transcripts has been increasingly investigated in relation to their potential role in the pathogenesis of psychiatric and neurological disorders [54,55].
For the locus on chr3:47588462-50387742 (SNP: rs9831648), genetically-predicted BMI and CRP levels were found to account for a notable proportion of the local rg between MDD and insomnia, and the association was no longer significant when adjusting for these variables (Table 8). In particular, BMI and CRP levels were able to explain a large part of the genetic variance for insomnia at this locus (47% and 44%, respectively) and the observed association between MDD and insomnia was probably due to a significant correlation between both MDD and insomnia with higher BMI (Table 7). Our results suggest that cardiometabolic traits such as increased BMI or inflammation might mediate the association between MDD and insomnia at some but not all loci associated with increased predisposition to both traits. Interestingly, a recent study including 1894 participants from the English Longitudinal Study of Ageing showed that sleep disturbances at baseline predicted depressive symptoms at eight-year follow-up [56], even when baseline depression was considered, in accordance with previous studies. In addition, high levels of the CRP inflammatory marker mediated the association between sleep disturbance and depressive symptoms in women [56], supporting the existence of a relationship between depression, cardiometabolic and sleep-related traits.
While PTSD and ADHD were included in the same cluster using the k-means algorithm, we found limited evidence or no significant association in the MR analyses in which we tested the bidirectional association between insomnia and these traits (Table S3). However, this result might be due to the relatively low number of patients included in these GWAS compared with the MDD study and the small number of genome-wide significant variants reported in the original datasets.
The identification of the molecular mechanisms underlying the association between psychiatric disorders and known comorbidities such as cardiometabolic and sleep disorders can improve our still limited understanding of the pathogenesis of psychiatric disorders. Moreover, it can also be of help to design treatment strategies aimed at reducing the impact that comorbidities exert on the clinical course of psychiatric disorders. Indeed, persistent insomnia has been shown to predict depression relapse and may contribute to poor clinical outcome [57]. The bidirectional causal association observed between MDD and insomnia using MR underlines the need of a more integrated assessment of sleep-related symptoms in patients with MDD as well as of mood symptoms in patients with sleep disorders. Indeed, based on the observed interplay between MDD, insomnia and metabolic traits, personalized treatment strategies addressing cardiometabolic and sleep disorders might benefit subgroups of patients with increased genetic predisposition to these phenotypes.
Our results should be interpreted in light of some limitations. Firstly, all identified genetic variants have small effect sizes and only explain a small part of the observed variability of the investigated traits. Secondly, we used publicly available datasets from different GWAS studies, some of which have included participants from the UK Biobank, and are thus characterized by sample overlap. While some of the methods we used are robust to sample overlap (e.g., the local genetic correlation analysis conducted with LAVA, in which all analyses were adjusted based on the computed sample overlap matrix), it cannot be excluded that this factor might have at least partly affected our results.
In conclusion, using the k-means clustering machine learning algorithm based on cross-trait genetic correlation, we identified a cluster including insomnia and the psychiatric disorders MDD, PTSD and ADHD. We confirmed the existence of a bidirectional association between MDD and insomnia using MR and outlined loci characterized by a significant local genetic correlation which was either found to be specific for MDD and insomnia or mediated by increased genetically predicted BMI and CRP levels. The identified loci, some of which were found to affect the brain expression of different RNAs in brain regions, might be further investigated as regards to their potential role as drug targets or to develop improved treatment approaches.

Supplementary Materials

The following supporting information can be downloaded at: https://www.mdpi.com/article/10.3390/a15110409/s1, Table S1: GWAS datasets included in the analyses; Table S2: Complete table of genetic correlations between psychiatric and metabolic or sleep traits, significant after multiple testing adjustment based on the number of tests (n = 120); Table S3: Mendelian randomization analysis between insomnia and ADHD, ASD and PTSD; Table S4: Mendelian randomization analysis between insomnia and ADHD, ASD and PTSD; Table S5: Mendelian randomization analyses between MDD (exposure) and insomnia (outcome) using 70 IVs; Table S6: Results of mendelian randomization single-SNP tests between MDD (exposure) and insomnia (outcome) using 70 IVs; Table S7: Mendelian randomization analyses between MDD (exposure) and insomnia (outcome) using 69 IVs; Table S8: Results of mendelian randomization single-SNP tests between MDD (exposure) and insomnia (outcome) using 69 IVs; Table S9: Mendelian randomization analyses between insomnia (exposure) and MDD (outcome) using 81 IVs; Table S10: Results of MR single-SNP tests between insomnia (exposure) and MDD (outcome) using 81 IVs; Table S11: Mendelian randomization analyses between insomnia (exposure) and MDD (outcome) using 223 IVs; Table S12: Results of MR single-SNP tests between insomnia (exposure) and MDD (outcome) using 223 IVs.

Author Contributions

Conceptualization, G.Z. and C.P.; methodology, G.Z. and C.P.; formal analysis, G.Z. and C.P.; writing—original draft preparation, G.Z.; writing—review and editing, C.C. and C.P.; supervision, C.C. and C.P. All authors have read and agreed to the published version of the manuscript.

Funding

This research received no external funding.

Institutional Review Board Statement

Not applicable.

Informed Consent Statement

Not applicable.

Data Availability Statement

All datasets used in this study are publicly available and can be retrieved in the original GWAS studies reported in the reference list.

Conflicts of Interest

The authors declare no conflict of interest.

References

  1. Who Mental Health. Available online: https://www.who.int/mental_health/management/en (accessed on 8 September 2022).
  2. WHO Mental Disorders. Available online: https://www.who.int/news-room/fact-sheets/detail/mental-disorders (accessed on 8 September 2022).
  3. GBD Compare Viz Hub. Available online: https://vizhub.healthdata.org/gbd-compare/# (accessed on 8 September 2022).
  4. Collaborators, C.-M.D. Global prevalence and burden of depressive and anxiety disorders in 204 countries and territories in 2020 due to the COVID-19 pandemic. Lancet 2021, 398, 1700–1712. [Google Scholar] [CrossRef]
  5. Mullins, N.; Forstner, A.J.; O’Connell, K.S.; Coombes, B.; Coleman, J.R.I.; Qiao, Z.; Als, T.D.; Bigdeli, T.B.; Borte, S.; Bryois, J.; et al. Genome-wide association study of more than 40,000 bipolar disorder cases provides new insights into the underlying biology. Nat. Genet. 2021, 53, 817–829. [Google Scholar] [CrossRef] [PubMed]
  6. Trubetskoy, V.; Pardinas, A.F.; Qi, T.; Panagiotaropoulou, G.; Awasthi, S.; Bigdeli, T.B.; Bryois, J.; Chen, C.Y.; Dennison, C.A.; Hall, L.S.; et al. Mapping genomic loci implicates genes and synaptic biology in schizophrenia. Nature 2022, 604, 502–508. [Google Scholar] [CrossRef] [PubMed]
  7. Howard, D.M.; Adams, M.J.; Clarke, T.K.; Hafferty, J.D.; Gibson, J.; Shirali, M.; Coleman, J.R.I.; Hagenaars, S.P.; Ward, J.; Wigmore, E.M.; et al. Genome-wide meta-analysis of depression identifies 102 independent variants and highlights the importance of the prefrontal brain regions. Nat. Neurosci. 2019, 22, 343–352. [Google Scholar] [CrossRef] [PubMed] [Green Version]
  8. Liu, N.H.; Daumit, G.L.; Dua, T.; Aquila, R.; Charlson, F.; Cuijpers, P.; Druss, B.; Dudek, K.; Freeman, M.; Fujii, C.; et al. Excess mortality in persons with severe mental disorders: A multilevel intervention framework and priorities for clinical practice, policy and research agendas. World Psychiatry 2017, 16, 30–40. [Google Scholar] [CrossRef] [Green Version]
  9. Nordentoft, M.; Wahlbeck, K.; Hallgren, J.; Westman, J.; Osby, U.; Alinaghizadeh, H.; Gissler, M.; Laursen, T.M. Excess mortality, causes of death and life expectancy in 270,770 patients with recent onset of mental disorders in Denmark, Finland and Sweden. PLoS ONE 2013, 8, e55176. [Google Scholar] [CrossRef] [Green Version]
  10. Lawrence, D.; Kisely, S.; Pais, J. The epidemiology of excess mortality in people with mental illness. Can. J. Psychiatry 2010, 55, 752–760. [Google Scholar] [CrossRef] [Green Version]
  11. Newcomer, J.W.; Hennekens, C.H. Severe mental illness and risk of cardiovascular disease. JAMA 2007, 298, 1794–1796. [Google Scholar] [CrossRef]
  12. De Hert, M.; Dekker, J.M.; Wood, D.; Kahl, K.G.; Holt, R.I.; Moller, H.J. Cardiovascular disease and diabetes in people with severe mental illness position statement from the European Psychiatric Association (EPA), supported by the European Association for the Study of Diabetes (EASD) and the European Society of Cardiology (ESC). Eur. Psychiatry 2009, 24, 412–424. [Google Scholar] [CrossRef] [Green Version]
  13. Osby, U.; Brandt, L.; Correia, N.; Ekbom, A.; Sparen, P. Excess mortality in bipolar and unipolar disorder in Sweden. Arch. Gen. Psychiatry 2001, 58, 844–850. [Google Scholar] [CrossRef]
  14. Calkin, C.V.; Gardner, D.M.; Ransom, T.; Alda, M. The relationship between bipolar disorder and type 2 diabetes: More than just co-morbid disorders. Ann. Med. 2013, 45, 171–181. [Google Scholar] [CrossRef] [PubMed]
  15. Pisanu, C.; Williams, M.J.; Ciuculete, D.M.; Olivo, G.; Del Zompo, M.; Squassina, A.; Schioth, H.B. Evidence that genes involved in hedgehog signaling are associated with both bipolar disorder and high BMI. Transl. Psychiatry 2019, 9, 315. [Google Scholar] [CrossRef] [PubMed] [Green Version]
  16. Maina, G.; Salvi, V.; Vitalucci, A.; D’Ambrosio, V.; Bogetto, F. Prevalence and correlates of overweight in drug-naive patients with bipolar disorder. J. Affect. Disord. 2008, 110, 149–155. [Google Scholar] [CrossRef] [PubMed]
  17. Petry, N.M.; Barry, D.; Pietrzak, R.H.; Wagner, J.A. Overweight and obesity are associated with psychiatric disorders: Results from the National Epidemiologic Survey on Alcohol and Related Conditions. Psychosom. Med. 2008, 70, 288–297. [Google Scholar] [CrossRef]
  18. Zou, H.; Zhou, H.; Yan, R.; Yao, Z.; Lu, Q. Chronotype, circadian rhythm, and psychiatric disorders: Recent evidence and potential mechanisms. Front. Neurosci. 2022, 16, 811771. [Google Scholar] [CrossRef]
  19. Harvey, A.G. A transdiagnostic approach to treating sleep disturbance in psychiatric disorders. Cogn. Behav. Ther. 2009, 38 (Suppl. 1), 35–42. [Google Scholar] [CrossRef]
  20. Taylor, B.J.; Hasler, B.P. Chronotype and Mental Health: Recent Advances. Curr. Psychiatry Rep. 2018, 20, 59. [Google Scholar] [CrossRef]
  21. O’Connell, K.S.; Frei, O.; Bahrami, S.; Smeland, O.B.; Bettella, F.; Cheng, W.; Chu, Y.; Hindley, G.; Lin, A.; Shadrin, A.; et al. Characterizing the Genetic Overlap Between Psychiatric Disorders and Sleep-Related Phenotypes. Biol. Psychiatry 2021, 90, 621–631. [Google Scholar] [CrossRef]
  22. Sun, X.; Liu, B.; Liu, S.; Wu, D.J.H.; Wang, J.; Qian, Y.; Ye, D.; Mao, Y. Sleep disturbance and psychiatric disorders: A bidirectional Mendelian randomisation study. Epidemiol. Psychiatr. Sci. 2022, 31, e26. [Google Scholar] [CrossRef]
  23. Demontis, D.; Walters, R.K.; Martin, J.; Mattheisen, M.; Als, T.D.; Agerbo, E.; Baldursson, G.; Belliveau, R.; Bybjerg-Grauholm, J.; Baekvad-Hansen, M.; et al. Discovery of the first genome-wide significant risk loci for attention deficit/hyperactivity disorder. Nat. Genet. 2019, 51, 63–75. [Google Scholar] [CrossRef]
  24. Grove, J.; Ripke, S.; Als, T.D.; Mattheisen, M.; Walters, R.K.; Won, H.; Pallesen, J.; Agerbo, E.; Andreassen, O.A.; Anney, R.; et al. Identification of common genetic risk variants for autism spectrum disorder. Nat. Genet. 2019, 51, 431–444. [Google Scholar] [CrossRef] [PubMed] [Green Version]
  25. Nievergelt, C.M.; Maihofer, A.X.; Klengel, T.; Atkinson, E.G.; Chen, C.Y.; Choi, K.W.; Coleman, J.R.I.; Dalvie, S.; Duncan, L.E.; Gelernter, J.; et al. International meta-analysis of PTSD genome-wide association studies identifies sex- and ancestry-specific genetic risk loci. Nat. Commun. 2019, 10, 4558. [Google Scholar] [CrossRef] [PubMed] [Green Version]
  26. Arnold, P.D.; Askland, K.D.; Barlassina, C.; Bellodi, L.; Bienvenu, O.J.; Black, D.; Bloch, M.; Brentani, H.; Burton, C.L.; Camarena, B.; et al. Revealing the complex genetic architecture of obsessive-compulsive disorder using meta-analysis. Mol. Psychiatry 2018, 23, 1181–1188. [Google Scholar] [CrossRef] [Green Version]
  27. Yu, D.; Sul, J.H.; Tsetsos, F.; Nawaz, M.S.; Huang, A.Y.; Zelaya, I.; Illmann, C.; Osiecki, L.; Darrow, S.M.; Hirschtritt, M.E.; et al. Interrogating the Genetic Determinants of Tourette’s Syndrome and Other Tic Disorders Through Genome-Wide Association Studies. Am. J. Psychiatry 2019, 176, 217–227. [Google Scholar] [CrossRef] [PubMed]
  28. Watson, H.J.; Yilmaz, Z.; Thornton, L.M.; Hubel, C.; Coleman, J.R.I.; Gaspar, H.A.; Bryois, J.; Hinney, A.; Leppa, V.M.; Mattheisen, M.; et al. Genome-wide association study identifies eight risk loci and implicates metabo-psychiatric origins for anorexia nervosa. Nat. Genet. 2019, 51, 1207–1214. [Google Scholar] [CrossRef] [Green Version]
  29. Pulit, S.L.; Stoneman, C.; Morris, A.P.; Wood, A.R.; Glastonbury, C.A.; Tyrrell, J.; Yengo, L.; Ferreira, T.; Marouli, E.; Ji, Y.; et al. Meta-analysis of genome-wide association studies for body fat distribution in 694 649 individuals of European ancestry. Hum. Mol. Genet. 2019, 28, 166–174. [Google Scholar] [CrossRef] [Green Version]
  30. Mahajan, A.; Spracklen, C.N.; Zhang, W.; Ng, M.C.Y.; Petty, L.E.; Kitajima, H.; Yu, G.Z.; Rueger, S.; Speidel, L.; Kim, Y.J.; et al. Multi-ancestry genetic study of type 2 diabetes highlights the power of diverse populations for discovery and translation. Nat. Genet. 2022, 54, 560–572. [Google Scholar] [CrossRef] [PubMed]
  31. van der Harst, P.; Verweij, N. Identification of 64 Novel Genetic Loci Provides an Expanded View on the Genetic Architecture of Coronary Artery Disease. Circ. Res. 2018, 122, 433–443. [Google Scholar] [CrossRef]
  32. Said, S.; Pazoki, R.; Karhunen, V.; Vosa, U.; Ligthart, S.; Bodinier, B.; Koskeridis, F.; Welsh, P.; Alizadeh, B.Z.; Chasman, D.I.; et al. Genetic analysis of over half a million people characterises C-reactive protein loci. Nat. Commun. 2022, 13, 2198. [Google Scholar] [CrossRef]
  33. Watanabe, K.; Jansen, P.R.; Savage, J.E.; Nandakumar, P.; Wang, X.; 23andMe Research Team; Hinds, D.A.; Gelernter, J.; Levey, D.F.; Polimanti, R.; et al. Genome-wide meta-analysis of insomnia prioritizes genes associated with metabolic and psychiatric pathways. Nat. Genet. 2022, 54, 1125–1132. [Google Scholar] [CrossRef]
  34. Jones, S.E.; Lane, J.M.; Wood, A.R.; van Hees, V.T.; Tyrrell, J.; Beaumont, R.N.; Jeffries, A.R.; Dashti, H.S.; Hillsdon, M.; Ruth, K.S.; et al. Genome-wide association analyses of chronotype in 697,828 individuals provides insights into circadian rhythms. Nat. Commun. 2019, 10, 343. [Google Scholar] [CrossRef] [Green Version]
  35. Dashti, H.S.; Jones, S.E.; Wood, A.R.; Lane, J.M.; van Hees, V.T.; Wang, H.; Rhodes, J.A.; Song, Y.; Patel, K.; Anderson, S.G.; et al. Genome-wide association study identifies genetic loci for self-reported habitual sleep duration supported by accelerometer-derived estimates. Nat. Commun. 2019, 10, 1100. [Google Scholar] [CrossRef] [PubMed] [Green Version]
  36. Willer, C.J.; Li, Y.; Abecasis, G.R. METAL: Fast and efficient meta-analysis of genomewide association scans. Bioinformatics 2010, 26, 2190–2191. [Google Scholar] [CrossRef] [PubMed] [Green Version]
  37. Bulik-Sullivan, B.; Finucane, H.K.; Anttila, V.; Gusev, A.; Day, F.R.; Loh, P.R.; ReproGen Consortium; Psychiatric Genomics Consortium; Genetic Consortium for Anorexia Nervosa of the Wellcome Trust Case Control Consortium 3; Duncan, L.; et al. An atlas of genetic correlations across human diseases and traits. Nat. Genet. 2015, 47, 1236–1241. [Google Scholar] [CrossRef] [PubMed] [Green Version]
  38. Bulik-Sullivan, B.K.; Loh, P.R.; Finucane, H.K.; Ripke, S.; Yang, J.; Schizophrenia Working Group of the Psychiatric Genomics Consortium; Patterson, N.; Daly, M.J.; Price, A.L.; Neale, B.M. LD Score regression distinguishes confounding from polygenicity in genome-wide association studies. Nat. Genet. 2015, 47, 291–295. [Google Scholar] [CrossRef] [PubMed] [Green Version]
  39. Maechler, M.; Rousseeuw, P.; Struyf, A.; Hubert, M.; Hornik, K. cluster: Cluster Analysis Basics and Extensions. R package version 2.1.4. 2019. Available online: https://cran.r-project.org/web/packages/cluster/index.html (accessed on 8 September 2022).
  40. R Core Team. R: A Language and Environment for Statistical Computing; R Foundation for Statistical Computing: Vienna, Austria, 2022. [Google Scholar]
  41. Rousseeuw, P.J. Silhouettes: A graphical aid to the interpretation and validation of cluster analysis. J. Comput. Appl. Math. 1987, 20, 53–65. [Google Scholar] [CrossRef] [Green Version]
  42. Franti, P.; Sieranoja, S. K-means properties on six clustering benchmark datasets. Appl. Intell. 2018, 48, 4743–4759. [Google Scholar] [CrossRef]
  43. Fave, M.J.; Lamaze, F.C.; Soave, D.; Hodgkinson, A.; Gauvin, H.; Bruat, V.; Grenier, J.C.; Gbeha, E.; Skead, K.; Smargiassi, A.; et al. Gene-by-environment interactions in urban populations modulate risk phenotypes. Nat. Commun. 2018, 9, 827. [Google Scholar] [CrossRef] [Green Version]
  44. Hemani, G.; Tilling, K.; Smith, G.D. Orienting the causal relationship between imprecisely measured traits using GWAS summary data. PLoS Genet. 2017, 13, e1007081. [Google Scholar] [CrossRef] [Green Version]
  45. Hemani, G.; Zheng, J.; Elsworth, B.; Wade, K.H.; Haberland, V.; Baird, D.; Laurin, C.; Burgess, S.; Bowden, J.; Langdon, R.; et al. The MR-Base platform supports systematic causal inference across the human phenome. Elife 2018, 7, e34408. [Google Scholar] [CrossRef]
  46. Sanderson, E.; Richardson, T.G.; Morris, T.T.; Tilling, K.; Smith, G.D. Estimation of causal effects of a time-varying exposure at multiple time points through multivariable mendelian randomization. PLoS Genet. 2022, 18, e1010290. [Google Scholar] [CrossRef] [PubMed]
  47. Burgess, S.; Thompson, S.G. Interpreting findings from Mendelian randomization using the MR-Egger method. Eur. J. Epidemiol. 2017, 32, 377–389. [Google Scholar] [CrossRef] [PubMed] [Green Version]
  48. Verbanck, M.; Chen, C.Y.; Neale, B.; Do, R. Detection of widespread horizontal pleiotropy in causal relationships inferred from Mendelian randomization between complex traits and diseases. Nat. Genet. 2018, 50, 693–698. [Google Scholar] [CrossRef] [PubMed]
  49. Dong, S.; Boyle, A.P. Predicting functional variants in enhancer and promoter elements using RegulomeDB. Hum. Mutat. 2019, 40, 1292–1298. [Google Scholar] [CrossRef] [PubMed] [Green Version]
  50. Consortium, G.T. The GTEx Consortium atlas of genetic regulatory effects across human tissues. Science 2020, 369, 1318–1330. [Google Scholar] [CrossRef]
  51. Szklarczyk, D.; Gable, A.L.; Nastou, K.C.; Lyon, D.; Kirsch, R.; Pyysalo, S.; Doncheva, N.T.; Legeay, M.; Fang, T.; Bork, P.; et al. The STRING database in 2021: Customizable protein-protein networks, and functional characterization of user-uploaded gene/measurement sets. Nucleic Acids Res. 2021, 49, D605–D612. [Google Scholar] [CrossRef]
  52. Werme, J.; van der Sluis, S.; Posthuma, D.; de Leeuw, C.A. An integrated framework for local genetic correlation analysis. Nat. Genet. 2022, 54, 274–282. [Google Scholar] [CrossRef]
  53. Cai, L.; Bao, Y.; Fu, X.; Cao, H.; Baranova, A.; Zhang, X.; Sun, J.; Zhang, F. Causal links between major depressive disorder and insomnia: A Mendelian randomisation study. Gene 2021, 768, 145271. [Google Scholar] [CrossRef]
  54. Hao, W.Z.; Chen, Q.; Wang, L.; Tao, G.; Gan, H.; Deng, L.J.; Huang, J.Q.; Chen, J.X. Emerging roles of long non-coding RNA in depression. Prog. Neuropsychopharmacol. Biol. Psychiatry 2022, 115, 110515. [Google Scholar] [CrossRef]
  55. Zhou, S.; Chen, R.; She, Y.; Liu, X.; Zhao, H.; Li, C.; Jia, Y. A new perspective on depression and neuroinflammation: Non-coding RNA. J. Psychiatr. Res. 2022, 148, 293–306. [Google Scholar] [CrossRef]
  56. Ballesio, A.; Zagaria, A.; Ottaviani, C.; Steptoe, A.; Lombardo, C. Sleep disturbance, neuro-immune markers, and depressive symptoms in older age: Conditional process analysis from the English Longitudinal Study of Aging (ELSA). Psychoneuroendocrinology 2022, 142, 105770. [Google Scholar] [CrossRef] [PubMed]
  57. Fang, H.; Tu, S.; Sheng, J.; Shao, A. Depression in sleep disturbance: A review on a bidirectional relationship, mechanisms and treatment. J. Cell. Mol. Med. 2019, 23, 2324–2332. [Google Scholar] [CrossRef] [PubMed]
Figure 1. Genetic correlation matrix of psychiatric disorders, cardiometabolic and sleep traits. The size of each circle corresponds to the strength of the relationship between pairs of traits based on the computed rg. The color of the circle indicates a positive (blue) or negative (red) correlation. Abbreviations: ADHD, attention deficit/hyperactivity disorder; AN, anorexia nervosa; ASD, autism spectrum disorders; BD, bipolar disorder; BMI, body mass index; CAD, coronary artery disease; CRP, C-reactive protein; MDD, major depressive disorder; OCD, obsessive-compulsive disorder; SCZ, schizophrenia; PTSD, post-traumatic stress disorder; T2D, type 2 diabetes; TS, Tourette syndrome.
Algorithms 15 00409 g001
Figure 2. Assessment of the optimal number of clusters based on the silhouette coefficient.
Algorithms 15 00409 g002
Figure 3. Cluster plot. Abbreviations: ADHD, attention deficit/hyperactivity disorder; AN, anorexia nervosa; ASD, autism spectrum disorders; BD, bipolar disorder; BMI, body mass index; CAD, coronary artery disease; CRP, C-reactive protein; MDD, major depressive disorder; OCD, obsessive-compulsive disorder; SCZ, schizophrenia; PTSD, post-traumatic stress disorder; T2D, type 2 diabetes; TS, Tourette syndrome.
Algorithms 15 00409 g003
Figure 4. Forest plot of SNP specific estimates of the MR analysis with MDD as the exposure and insomnia as the outcome. For each SNP selected as an IV (n = 39), the upper part of the figure shows results of MR analyses conducted using the single SNP test implemented in the TwoSampleMR package, while the lower part of the figure shows results for analyses including all SNPs selected as IVs (these results are reported in red). Single SNP tests showed a significant causal effect of MDD on insomnia for 10 of the 39 IVs.
Algorithms 15 00409 g004
Figure 5. Forest plot of SNP specific estimates of the MR analysis with insomnia as the exposure and MDD as the outcome. For each SNP selected as an IV (n = 12), the upper part of the figure shows results of MR analyses conducted using the single SNP test implemented in the TwoSampleMR package, while the lower part of the figure shows results for analyses including all SNPs selected as IVs (these results are reported in red). Single SNP tests showed a significant causal effect of insomnia on MDD for 8 of the 12 IVs.
Algorithms 15 00409 g005
Figure 6. Network of interactions among proteins encoded by genes for which SNPs driving the association between MDD (exposure) and insomnia (outcome) act as eQTLs.
Algorithms 15 00409 g006
Table 1. Significant genetic correlations between psychiatric and cardiometabolic traits.
Psychiatric TraitCardiometabolic TraitrgseZpadj p
SCZBMI−0.100.01−7.071.6 × 10−121.9 × 10⁻¹⁰
SCZCRP−0.060.02−3.750.00020.02
MDDBMI0.110.026.555.6 × 10−116.8 × 10⁻⁹
MDDCAD0.210.0210.335.1 × 10−256.1 × 10⁻²³
MDDCRP0.110.025.503.8 × 10−84.6 × 10⁻⁶
MDDT2D0.140.026.584.8 × 10−115.8 × 10⁻⁹
PTSDBMI0.320.047.778.1 × 10−159.7 × 10⁻¹³
PTSDCAD0.300.056.066.5 × 10−77.7 × 10⁻⁵
PTSDCRP0.210.044.981.4 × 10−91.7 × 10⁻⁷
PTSDT2D0.250.055.211.9 × 10−72.2 × 10⁻⁵
ANBMI−0.310.02−13.521.3 × 10−411.5 × 10−39
ANCRP−0.280.03−9.281.7 × 10−202.1 × 10⁻¹⁸
ANT2D−0.200.03−7.371.8 × 10−132.1 × 10⁻¹¹
ADHDBMI0.350.0214.651.4 × 10−481.7 × 10−46
ADHDCAD0.270.039.861.4 × 10−161.6 × 10⁻¹⁴
ADHDCRP0.300.048.275.9 × 10−237.1 × 10⁻²¹
ADHDT2D0.320.0312.165.0 × 10−346.0 × 10⁻³²
OCDBMI−0.290.04−6.973.2 × 10−123.8 × 10⁻¹⁰
OCDCRP−0.220.04−5.396.9 × 10−88.3 × 10⁻⁶
OCDT2D−0.170.04−3.810.00010.02
Abbreviations: ADHD, attention deficit/hyperactivity disorder; AN, anorexia nervosa; ASD, autism spectrum disorders; BD, bipolar disorder; BMI, body mass index; CAD, coronary artery disease; CRP, C-reactive protein; MDD, major depressive disorder; OCD, obsessive-compulsive disorder; SCZ, schizophrenia; se, standard error; PTSD, post-traumatic stress disorder; T2D, type 2 diabetes. The adj p column reports p-values adjusted according to Bonferroni based on the number of conducted tests (n = 120).
Table 2. Significant genetic correlations between psychiatric and sleep traits.
Psychiatric TraitSleep TraitrgseZpadj p
BDInsomnia0.110.034.232.4 × 10−50.0028
BDSleep duration0.110.024.919.0 × 10−70.0011
SCZChronotype−0.100.02−5.387.6 × 10−89.1 × 10⁻⁶
SCZSleep duration0.150.027.371.7 × 10−132.1 × 10⁻¹¹
MDDInsomnia0.440.0317.602.3 × 10−692.8 × 10−67
MDDSleep duration−0.110.02−4.439.4 × 10−60.0011
ADHDInsomnia0.370.0310.671.4 × 10−261.7 × 10⁻²⁴
PTSDInsomnia0.480.077.332.3 × 10−132.7 × 10⁻¹¹
PTSDSleep duration−0.230.06−3.860.00010.013
ASDChronotype−0.180.03−5.455.1 × 10−86.1 × 10⁻⁶
ANSleep duration−0.120.03−3.830.00010.015
Abbreviations: ADHD, attention deficit/hyperactivity disorder; AN, anorexia nervosa; ASD, autism spectrum disorders; BD, bipolar disorder; MDD, major depressive disorder; SCZ, schizophrenia; se, standard error; PTSD, post-traumatic stress disorder. The adj p column reports p-values adjusted according to Bonferroni based on the number of conducted tests (n = 120).
Table 3. Mendelian randomization analyses between insomnia and MDD.
OutcomeExposureMethodbetasep
InsomniaMDDMR Egger0.400.340.27
InsomniaMDDWeighted median0.220.052.1 × 10−5
InsomniaMDDInverse variance weighted0.240.064.1 × 10−5
InsomniaMDDSimple mode0.190.100.06
InsomniaMDDMR-PRESSO raw0.260.056.6 × 10−6
InsomniaMDDMR-PRESSO outlier corrected0.240.042.7 × 10−7
MDDInsomniaMR Egger−0.160.270.56
MDDInsomniaWeighted median0.230.080.0027
MDDInsomniaInverse variance weighted0.350.100.0003
MDDInsomniaSimple mode0.530.130.0018
MDDInsomniaMR-PRESSO raw0.380.100.0020
MDDInsomniaMR-PRESSO outlier corrected0.380.070.0004
Abbreviations: MDD, major depressive disorder; se, standard error. Significant results are reported in bold.
Table 4. SNPs driving the association between MDD (exposure) and insomnia (outcome).
SNPChrGeneEAOAb expb outeQTL for Gene (Tissue)RDB Score
rs21115922AC007879.1AG0.030.02GMPPB (Amygdala, anterior cingulate, caudate, cerebellum, cortex, frontal cortex, hippocampus, hypothalamus, nucleus accumbens, putamen, spinal cord, substantia nigra); GPX1 (Caudate, cerebellum, cortex, frontal cortex, accumbens, putamen); NCKIPSD (Amygdala, anterior cingulate, caudate, cerebellum, cortex, frontal cortex, hippocampus, hypothalamus, nucleus accumbens, putamen, spinal cord); NICN1 (Nucleus accumbens); P4HTM (Cerebellum, cortex, frontal cortex, nucleus accumbens, putamen, spinal cord); QRICH1 (Caudate, cerebellum, nucleus accumbens); RP11-3B7.1 (Anterior cingulate); RP11-694I15.7 (Cerebellum); WDR6 (Cerebellum, nucleus accumbens, putamen)0.03
rs665116483RP11-384F7.2TC0.030.02-0.65
rs98316483IntergenicTG−0.03−0.02AMT (Anterior cingulate, caudate, cerebellum, cortex, frontal cortex, hippocampus, hypothalamus, nucleus accumbens, putamen, spinal cord, substantia nigra); BSN (Cerebellum); BSN-AS2 (Putamen); CCDC71 (Amygdala, caudate, cerebellum, frontal cortex, putamen); DALRD3 (Cerebellum, cortex)0.92
rs302665RP11-6N13.1AG0.040.03-0.13
rs30994395TMEM161BTC−0.02−0.02CTC-467M3.3 (Anterior cingulate); CTC-498M16.4 (Amygdala, anterior cingulate, caudate, cerebellum, cortex, frontal cortex, hippocampus, hypothalamus, nucleus accumbens, putamen); TMEM161B-AS1 (Anterior cingulate, caudate, cerebellum, cortex, frontal cortex, hippocampus, hypothalamus, nucleus accumbens, putamen, spinal cord, substantia nigra)0.18
rs1501868736IntergenicAC−0.07−0.04BTN2A3P (Cortex)0.48
rs102356647MAD1L1TC0.030.02FTSJ2 (Cerebellum, caudate); AC110781.3 (Nucleus accumbens)0.13
rs6191404512ACVR1BAG0.030.02-0.18
rs953638113IntergenicTC0.030.03-0.08
rs195082914LRFN5AG0.030.02LRFN5 (Cerebellum)0.18
Abbreviations: b exp, beta exposure; b out, beta outcome; Chr, chromosome; EA, effect allele; eQTL, expression quantitative trait loci; OA, other allele; RDB, regulome DB; SNP, single nucleotide polymorphism.
Table 5. SNPs driving the association between insomnia (exposure) and MDD (outcome).
SNPChrGeneEAOAb expb outeQTL for GeneRDB Score
rs779605IntergenicAG0.030.04-0.99
rs956315213IntergenicTC0.040.02RP11-24H2.3 (Anterior cingulate)0.18
rs69841118MSRACT0.040.02-0.14
rs14561933RP11-384F7.2TC−0.04−0.02-0.18
rs3707716LIN28BGT−0.04−0.02LIN28B-AS1 (Caudate, putamen)
HACE1 (Cortex)
0.59
rs957615513SUPT20HAG0.030.02ALG5 (Caudate, cortex)0.18
rs69380266CUL9GA0.040.02CUL9 (Caudate, cortex, frontal cortex, nucleus accumbens, spinal cord)0.61
rs772170592LINC01122AT0.030.03-0.73
Abbreviations: b exp, beta exposure; b out, beta outcome; Chr, chromosome; EA, effect allele; eQTL, expression quantitative trait locus; OA, other allele; RDB, regulome DB; SNP, single nucleotide polymorphism.
Table 6. Results of the univariate tests to assess local heritability of selected loci for MDD and insomnia.
MDDInsomnia
SNP(s)ChrStart LocusStop Locuspadj ppadj p
rs77217059257952946592519963.6 × 10−72.2 × 10−56.8 × 10−114.1 × 10⁻⁹
rs211159222077265952086745884.7 × 10−122.8 × 10−100.0461
rs9831648347588462503877424.1 × 10−50.0027.3 × 10−104.4 × 10⁻⁸
rs66511648, rs145619331172416451180869290.06812.7 × 10−50.002
rs3099439587943483895844662.3 × 10−71.4 × 10−51.2 × 10−117.2 × 10⁻¹⁰
rs30266, rs7796051037884611048504904.0 × 10−60.00020.010.600
rs150186873626396201272610356.8 × 10−124.1 × 10−100.091
rs6938026642103739437706260.0060.3601.1 × 10−106.6 × 10⁻⁹
rs37077161049513451060539150.01710.0030.180
rs102356647136697324737490.00010.0060.0050.300
rs698411189835864104788510.0030.1800.0573.420
rs619140451251769420530399871.6 × 10−79.6 × 10−60.0070.420
rs95761551337499811382906890.00840.5040.00220.132
rs9536381, rs95631521353336572546848560.00010.0086.6 × 10−50.004
rs19508291441614834425625507.5 × 10−74.5 × 10−50.00210.126
The table reports significance of univariate tests to assess local heritability for the investigated loci for MDD and insomnia. The adj p columns report p-values adjusted according to Bonferroni based on the number of conducted tests (n = 60). Significant results are reported in bold. Abbreviations: Chr, chromosome; MDD, major depressive disorder; SNP, single nucleotide polymorphism.
Table 7. Bivariate local genetic correlation between MDD, insomnia and cardiometabolic traits.
Trait 1Trait 2rhor2padj p
Locus chr2:57952946-59251996 (SNP: rs77217059)
MDDInsomnia0.640.418.0 × 10−50.002
MDDBMI0.090.010.431
MDDCRP0.200.040.311
MDDT2D0.020.000.871
InsomniaBMI−0.280.080.0091
InsomniaCRP0.070.000.701
InsomniaT2D−0.200.040.191
Locus chr3:47588462-50387742 (SNP: rs9831648)
MDDInsomnia0.600.360.00150.045
MDDBMI0.480.230.00020.006
MDDCRP0.400.160.0150.44
MDDCAD0.360.120.081
InsomniaBMI0.690.475.6 × 10−111.7 × 10⁻⁹
InsomniaCRP0.660.441.4 × 10−64.2 × 10⁻⁵
InsomniaCAD0.540.290.0010.033
Locus chr5:87943483-89584466 (SNP: rs3099439)
MDDInsomnia−0.050.000.771
MDDBMI0.230.050.0481
MDDCRP−0.070.010.711
MDDT2D−0.160.020.461
MDDCAD0.350.120.030.9
InsomniaBMI−0.140.020.171
insomniaCAD−0.130.020.351
InsomniaCRP0.020.000.911
InsomniaT2D−0.250.060.191
Locus chr13:53336572-54684856 (SNPs: rs9536381, rs9563152)
MDDInsomnia1.001.003.3 × 10−69.9 × 10⁻⁵
MDDBMI0.480.230.00040.012
MDDCAD0.280.070.2081
MDDCRP0.540.300.0160.47
InsomniaBMI0.550.313.9 × 10−50.001
InsomniaCAD0.430.180.0421
InsomniaCRP1.001.007.3 × 10−60.0002
Abbreviations: BMI, body mass index; CAD, coronary artery disease; CRP, C-reactive protein; MDD, major depressive disorder; SNP, single nucleotide polymorphism; T2D, type 2 diabetes. The adj p column reports p-values adjusted according to Bonferroni based on the number of conducted tests (n = 30). Significant results are reported in bold.
Table 8. Partial correlation analysis between MDD and insomnia adjusted for BMI and CRP levels.
Trait 1Trait 2Zr2_Trait 1_Zr2_Trait 2_Zrho Partial Correlationp Partial Correlation
Locus chr3:47588462-50387742 (SNP: rs9831648)
MDDInsomniaBMI0.230.470.410.11
MDDInsomniaCRP0.160.440.480.08
MDDInsomniaBMI, CRP0.250.570.390.19
Publisher’s Note: MDPI stays neutral with regard to jurisdictional claims in published maps and institutional affiliations.

