Abstract
We study the relationship between the architectural form of tall buildings and their structural response to a conventional seismic load. A series of models are generated by varying the top and bottom plan geometries of the buildings, and a steel diagrid structure is mapped onto their skin. A supervised machine learning approach is then adopted to learn the features of the aforementioned relationship. Six different classifiers, namely k-nearest neighbour, support vector machine, decision tree, ensemble method, discriminant analysis, and naive Bayes, are adopted to this aim, targeting the structural response as the building drift, i.e., the lateral displacement at its top under the considered external excitation. By focusing on the classification of the structural response, it is shown that some classifiers, like, e.g., decision tree, k-nearest neighbour and the ensemble method, can learn well the structural behavior, and can therefore help design teams to select more efficient structural solutions.
1. Introduction
Synergy between form and structural response in the early stages of architectural design has been traditionally the playground for designers’ intuition. Though more in-depth analyses would be required by a proper quantitative definition, we claim here that a building is considered to be more efficient if the design is characterized by smaller total weight and drift, measured through the lateral displacement of its top story, when compared to other solutions. Even if a smaller drift does not necessarily imply that the building is more structurally efficient, the stiffness is considered here the main driver, provided that the stress state does not exceed any damage or yield threshold throughout the entire load resisting skeleton. The structural response can be therefore optimized (in principle) by increasing the stiffness and simultaneously reducing the total weight of the structural system, balancing the two in a kind of multi-objective optimization [1]. Alternatively, a good structural response refers to a structurally-informed design of the buildings: a suitable parameter to describe the structural response for an element is the utilization factor, defined as the ratio of the generalized force (i.e., axial/shear force or bending moment) in it and its loading carrying capacity [2]. Accordingly, a building with a larger average utilization of all its members shows a better structural response than others; a smaller value is due to the material being not stressed appropriately, with a possible waste of money.
Nowadays, the availability of increasing computational resources may allow an empowerment of creativity in relation to real-life, complex situations, thanks to the adoption of computer-assisted approaches based on machine learning (ML) algorithms. The current state-of-the-art in the use of ML algorithms for structural design is mainly focused on the prediction of the structural performance. By exploiting experimental data alone, or by fusing them with model-based predictions, efficient strategies for structural health monitoring have been extensively investigated [3,4]. Less frequent is instead the investigation of data-driven approaches to design, for example, in terms of construction geometries for specific purposes [5]. In this context, parametric design [6] proved to be a powerful tool to scrutinize alternative solutions within an architectural form-structural efficiency conundrum [7].
In this work, we consider a building category for which both structural performance and architectural form play a relevant role: tall buildings with outer diagrids [8,9]. In such cases, the structure strongly influences the architecture, because a significant vertical support and resistance to lateral loads are both needed [10]. We investigate here the use of supervised ML techniques to discriminate between different solutions, as tall buildings are structures requiring not only a considerable effort in terms of construction time and money, but also in terms of footprint related to materials and energy necessary during their entire life-cycle, an issue that is nowadays more and more a matter of concern [11]. Furthermore, the construction of tall buildings has become a collaborative effort: competences and expertise of different people, whose interests must be composed, are all considered. A number of decisions taken at the beginning of the design phase are known to affect the overall result, often leading to sub-optimal solutions at later project stages [6]: it has been estimated that 80% of material consumption in the construction is set by this early stage of the project, and construction costs can rise up to one-third of the total budget [9,12,13]. However, in several cases, structural issues are not adequately taken into account, and the architectural form drives the design [14]. Paradoxically, in [6], it was declared that in the past there was a more efficient collaboration between architects and structural engineers during the design of tall buildings: the John Hancock tower [15] is one of the outstanding examples in this regard. With the development of construction technology, architects and engineers have looked for more complex forms and structural solutions, and the structural response is sometimes detrimentally affected.
Regarding the exploration of the relationship between the architectural form and the structural behavior of tall buildings with outer diagrids, in [16] it was reported that the hyperboloid form is more efficient than the cylindrical one. Other investigations of the aforementioned relationship have considered geometries like e.g., shell and lattice towers, see [17,18,19]. Moreover, in [20] it was concluded that the tapering of tall buildings has a more significant effect under seismic loadings than changes to floor plans. A similar study [21] examined the effects of top and bottom plan geometries and diagrid angles, and optimal diagrid angles between 53° and 70° together with a larger number of sides showed the best results.
Even though ML was exploited in several areas of the scientific disciplines, in this multidisciplinary area where architecture and structural design co-exist, it does not appear to be fully investigated. To focus on the most striking examples in the literature, we mention that in [22], ML was applied to provide non-conventional structural shapes that were categorized according to the final design solution, getting insight into the relevant structural efficiency. Artificial intelligence led to more creative design processes in [23], by adopting a variational autoencoder to generate different architectural samples. In [24], generative adversarial networks were adopted to carry out a cost-benefit study and motivate retro-cladding in residential buildings: a large set of synthetic images was created by exploiting computer aided design renderings, to be later adopted by ML algorithms. In [25], ML was adopted in the early design phase to study the structural performance of a shell structure modelled parametrically: the dataset included nine structural parameters, combined with 42 material parameters, and a nonlinear regression and artificial neural networks were used within a supervised frame. In the context of non-structural applications of ML, in [26] information was extracted from 15 architectural building information models, and rated according to two subjective labels, livability, and sleep comfort.
In this work, by moving some steps in a largely unexplored research area, we exploit parametric design tools to feed a ML-based approach and investigate the response to conventional seismic actions of alternative structural and architectural solutions. By means of a parametric design approach [6], features like the architectural form can be in principle optimized to match site-specific requirements [27]. The entire design process can thus become extremely flexible, able to self-adapt under changing requirements, due to, e.g., client needs and other external effects [27]. Traditional approaches to link to architectural form and structural efficiency are based on the analysis of a large number of tall building models, resulting to be extremely time-consuming. An alternative approach based on genetic algorithms to optimize the structural efficiency of the said tall buildings would allow us to handle fewer geometrical models; conversely, it turns out to be longer to get some optimal configurations [21,28,29]. By means of a ML-based approach, a similarly limited dataset of building geometries can be instead adopted to learn the relationship between architectural parameters (such as the side count of the top and bottom floor plans) and the structural response to some specific actions, like those related to possible earthquakes. The structural response of new models can be predicted on the basis of the learned features or relationship. In other words, this approach is in principle capable of tackling all obstacles to classify the response of tall buildings, rapidly and accurately.
To describe the ML-based procedure in detail and validate it, the remainder of the paper is organized as follows. In Section 2, digital models of tall buildings with a specific geometry are described, as obtained via parametric design tools and characterized by outer diagrid structures; these models are supposed to be excited by lateral loads related to a conventional seismic action, fully described in the following. Various learning algorithms are described in Section 3; they are adopted in a supervised ML approach for feature classification, according to the structural response of the models. Results in Section 4 provide a rationale behind the optimal classification algorithms, showing how labels and selected structural performance indices have a role in the entire process. As a conclusion, in Section 5 a discussion is provided to understand how this work can help designers to automatically select the best possible options when dealing with architectural geometry and structural response simultaneously.
2. Workflow
The proposed procedure consists of three main steps:
- Form generation through a parametric design tool;
- Structural analysis allowing for building weight, dead load and seismic load;
- Classification learning, to allow discriminating the building factors having an impact on the structural response under the considered loading conditions.
The focus in this work is on a proposal regarding the last step, while the former two are briefly summarized in this Section; additional details can be found in [30,31]. A prerequisite behind the application of any ML approach is known to be represented by data availability: the ML algorithm then has to exploit (a subset of) the handled dataset to learn the link between the features of the structures on one side, and the response under pre-defined loadings (even in terms of environmental or operational variability) on the other side. The research goal of learning is to judge whether any geometry (typically, those unseen during learning) can be accurately classified. In Section 3, it will be shown that this classification can be extremely difficult to carry out, even with a kind of artificial intelligence to govern the procedure, due to the large number of features allowed for in the analysis and to the complexity in their interplay. We should emphasize that a classification approach is able to deal with existing data, and not to foresee new ones for other geometries: we will return to this issue, in particular regarding generative approaches, in the discussion related to future activities in Section 5. Under the aforementioned limitations, the main objective of the present work is to find a suitable algorithm to classify the response of tall buildings with an outer diagrid structure under the considered actions.
Architectural and Structural Modelling
By exploiting parametric design, the architectural form of a tall building is dealt with as a three-dimensional shape characterised by: the geometry of top and bottom plans; the vertical transformation between the aforementioned geometries, namely the morph or twist or curvilinear transformation, occurring along the building elevation, see [32]. At each story, the geometry is therefore a polygon; in our investigation the shapes at the top and at the bottom are chosen to be a 3, 4, 5, 6, 7, 8, 9, 10, 11, 12, 13 or 24 sided polygon. Hence, there are 12 alternative choices for the bottom plan and other 12 choices for the top plan, leading to a total of 144 building forms. The top and bottom plan areas are supposed to be 500 and 2025 square meters, respectively; the tall buildings are vertically tapered to guarantee better lateral stability with respect to constant-section buildings [33]. The total height is set in such a way that the total usable area of all buildings is maintained at 70,000 square meters ± 1%: therefore, the number of floors may change in order to comply with this constraint. These settings are extracted from another research [32] and modified by architectural consideration of actual tall buildings, including parameters like lease span (i.e., distance from the core to the exterior window) and the minimum core dimension. The total elevation of each model can be calculated by multiplying the distance from floor to floor (4 m) by the number of stories, resulting in a total height of 232 m (58 stories) or 236 m (59 stories). The aspect ratio, i.e., the ratio of height to the largest horizontal dimension of the bottom plan, ranges from 2.93 to 4.62. The maximum in-plane dimension of the bottom plan ranges between 45 and 59 m, while the average is about 51 m. In Figure 1, the entire set of architectural forms is depicted in perspective and in-plan views, to provide an idea regarding how the 144 models differ from each other. Rhinoceros™ and Grasshopper™ have been used for this architectural modelling stage; the computational environment of Grasshopper™ has allowed to speed-up form generation, with a group of forms that could be easily (re)generated thanks to its parametric modelling capability.
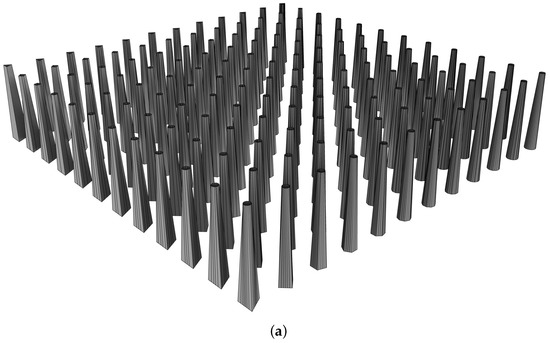
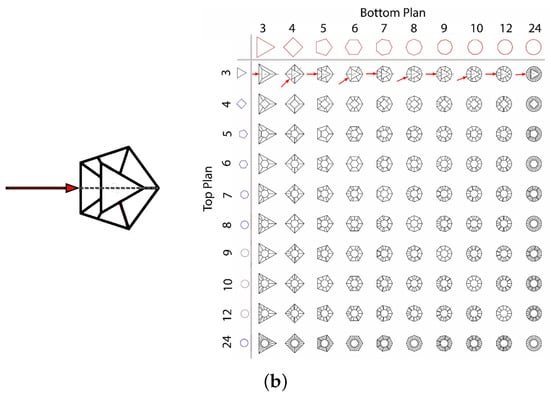
Figure 1.
Generation of the 144 architectural models for the tall buildings considered in this work. (a): perspective. (b): plan view to get details of top and bottom floor plans, and direction of the applied seismic load.
A diagrid pattern representing the outer structure of each building is then mapped on its skin. The diagrid is assumed to have a tubular cross section and pinned joints. The concrete slabs at each floor are assumed as a rigid diaphragm transferring the dead load to the core, while the diagrid structure has to sustain the lateral loads representing the seismic effects according to the statically equivalent method. The dead load is assumed to be constant and equal to 4.50 kN/m2, while a 2.50 kN/m2 live load is considered; all floors receive 100% of the dead load and 20% of the live load. Since our objective is to ascertain the feasibility of the ML approach to link architectural and structural choices, we make here the conventional assumption to allow for a weak seismic event, which implies that a linear elastic response of the structure is taken into account. The response is therefore purposely assumed to be not significantly affected by modes of vibrations higher than the fundamental one in each principal direction. The total amount of the equivalent lateral force is computed according to Eurocode 8 and then applied at the center of mass of each story proportionally to the floor height and mass [34]. Seismic and other loads are combined with their deterministic value, i.e., in the load combination a factor of 1 is simply assumed. More precisely, the seismic force is computed by following this procedure: (i) the input acceleration is determined according to the design spectrum; (ii) the base shear force is computed; (iii) the said shear force is distributed among all stories. The design spectrum is set by the standard and it can be computed on the basis of: the design ground acceleration ; the soil factor S; the behavior factor q; the fundamental vibration period along the direction of interest; the periods , and , related to the start of the acceleration-constant branch, the start of the velocity-constant branch and the start of the displacement-constant branch in the design spectrum, respectively. As indicated in [34], the expression to be used in case of a low seismic event characterized by , is:
with the values specified in Table 1 for the ground located in Tehran, Iran (ground type C).

Table 1.
Properties of the considered site in Tehran, Iran. Data adapted from the design spectrum in [34].
It is worth stressing that the linear static assumption is somehow enforced: in view of our objective (ML-based classification), the seismic load should be therefore considered as a conventional horizontal excitation to compare different design alternatives, more than an actual representation of the earthquake action. The encouraging results for the classification that are going to be shown in Section 4 will spur us to pursue improvements in the future as to the representation of the actual seismic load and response. The fundamental vibration period for all the models included in this research has been computed using Karamba™, a structural analysis plug-in for Grasshopper™ [35]. In addition, the adopted standard defines a lower bound for , represented by the product of the lower bound factor of the horizontal design spectrum and : it is worthwhile to mention that in most cases this second alternative, shown in Equation (1), is used. Next, the base shear is computed according to:
where m is the total mass of the building and a possible reduction factor, set to 1 in our analysis. Finally, the shear force is distributed to each i-th story, depending on the story height and weight , by using:
For the sake of simplicity, in this research the orientation of the equivalent seismic action is assumed along an axis of symmetry at the bottom plan, as indicated in Figure 1b. An example of the tall building structures is shown in Figure 2.
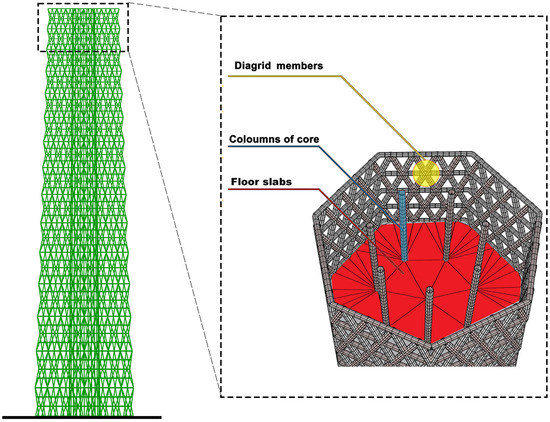
Figure 2.
Tall building geometry with floor slabs and diagrid structure. In the inset: detail of the inner columns and of the diagrid geometry on the outer surface.
A tubular steel section is assigned to the diagonal diagrid elements, with a diameter of 80 cm and a thickness of 2 cm. For the horizontal members of the diagrid, a 60 cm diameter and a 1.5 cm thickness are specified. The floor slabs are modelled as a shell mesh in C45/55 concrete and it acts as a rigid diaphragm, redistributing the seismic load from the centre of mass of each floor to the diagrid nodes on the same plane. Furthermore, diagrid nodes are connected by pinned joints. The boundary condition of the building is set at the ground level through pinned joints. Finally, the structural model of each building contains about 60 shell elements for each rigid floor slab and about 12,000 Euler-Bernoulli beam elements.
The structural analysis is then carried out with the mentioned software Karamba™. As anticipated, in the analysis each structure is assumed to behave linearly, avoiding to consider possible damage states, see [31]. The results of the analysis are processed in terms of: input parameters related to the architectural design, such as the number of polygon edges at the top and bottom floors, the total gross area, the diagrid degree (namely the angle between the horizontal plane and a diagonal truss element), and the façade area; output parameters related to the structural response, such as the total weight, and relevant drift (measured by the horizontal displacement at the top of the building), the maximum utilization of the structural components, the total length of diagrid members, the expected design weight (the sum of the products of each member utilization times its weight) and the maximum normal force. A naive but sometimes useful method adopted to comparatively assess the effects of the shape of the building on its structural performance is shown in Figure 3, where the 12 × 12 grid already depicted in Figure 1 is related to coded colours to report a feature of the structural response. For example, in Figure 3 the drift is considered as ranging between 41 cm and 177 cm; depending on the specific feature reported, the pattern in this and similar diagrams may change. This type of diagrams provides a first insight into the structural response: it can be seen that, by increasing the number of polygon edges, the response gets characterized by smaller drift values [30].
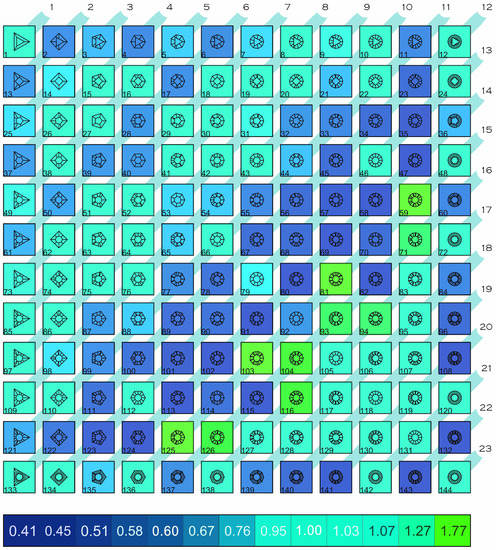
Figure 3.
Colour-coded diagram depicting the structural response, in terms of drift, for the considered 144 tall building models.
In Figure 4, the forms showing the best, the average, and the worst solutions are visible: model 132 (dark blue) turns out to be the best, with the minimum drift (41 cm) and the minimum expected design weight (about 800 tons), as linked to its 24-sided polygons at the top and bottom plans; model 51 (light blue), having a 5-sided polygon at top plan and a 7-sided polygon at the bottom plan, performs as a kind of average solution, with a drift equal to 125 cm and 1113 tons as expected design weight; model 103 (green), with 9-sided polygon at the top plan and a 11-sided polygon at the bottom plan, is instead the worst form with a maximum drift (177 cm) and the highest expected design weight (1250 tons).
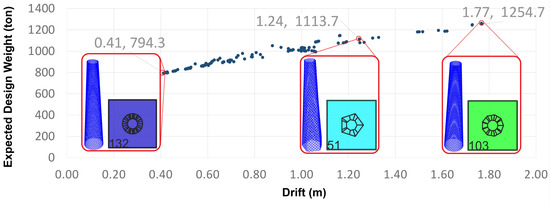
Figure 4.
Expected design weight vs drift plot, with insets reporting the geometries of the forms featuring the best, average and worst performance.
As the previous discussion evidences, this naive approach cannot easily provide a quantitative assessment of the structural response, as affected by the architectural design. Hence, we discuss next our proposed data-driven methodology able to dig into the available results and recognize hidden patterns in the data.
3. Machine Learning
To move from the qualitative approach described above to a physically sound, quantitative one, we allow for the capability and potentiality of ML. The entire dataset relevant to the considered 144 tall building shapes is subdivided into sub-sets, a 75% of the forms for training purposes and 25% for testing.
Even though the number of models in the dataset looks small, the quantity of data to feed the ML algorithm is by far larger, since the input and output parameters of each structural analysis, as described above, allow multiple patterns to be learned. The following eight quantities have been then adopted to play the role of features in the classification task: top/bottom geometry, diagrid degree, total mass, drift, expected design weight, maximum utilization, total length of the diagrid, maximum normal force.
To avoid biased classification outcomes, a randomization algorithm is adopted to set the training and the testing datasets: each time the ML algorithm is used, a different pair of training and testing datasets are generated, each one possibly leading to a different classification accuracy. A procedure is then exploited to effectively learn the sought patterns in the dataset features: pairs of training and the testing datasets are generated a number of times by sorting them out of the entire dataset, and the classification accuracy is finally computed by averaging the values relevant to each single pair. Independently of the training data, in this way the most efficient generalization of the results could be achieved. We will discuss again the randomization effect at the end of Section 4.1.
Since a supervised learning is adopted, a label must be defined for the structural response. As a reference case, we start by considering the label to be provided by the drift, i.e., by the lateral displacement at the top of the building as induced by the loading condition considered [36]; according to International standards [37], the drift has to be limited to a fraction (e.g., 1/300) of the total height of the building [36], in our case set around 300 m. Intuition suggests that drift provides a satisfying quantitative measure of the structural response. Accordingly, we classify all the forms in five classes, moving from worst solutions characterized by a drift close to 177 cm, up to the best ones characterized instead by a drift close to 40 cm. In this and all the other possible cases, the entire range of values in the dataset is subdivided uniformly into five classes, using labels A (best), B, C, D, E (worst) as marks.
Figure 5 exemplifies how labels are distributed when the drift is plotted against the diagrid degree. The present plot is reported to show how a number of characteristics can be understood from a representation of the results like this. It looks quite obvious that using different colours for the classes helps distinguish the effects of the reported features on the classification based on the proposed label. All the results look clustered around a clear trend: even though this post-processing of the results is not going to be exploited in the following, the dashed line represents the least-squares fit of the data. It will be shown that trends like this one cannot always be recognized in the dataset; that represents a clear hurdle, if ML algorithms are not adopted to dig into the data. Furthermore, the drift is shown to decrease if the diagrid degree increases, which is indeed an intuitive result, since in this way the structure becomes stiffer.
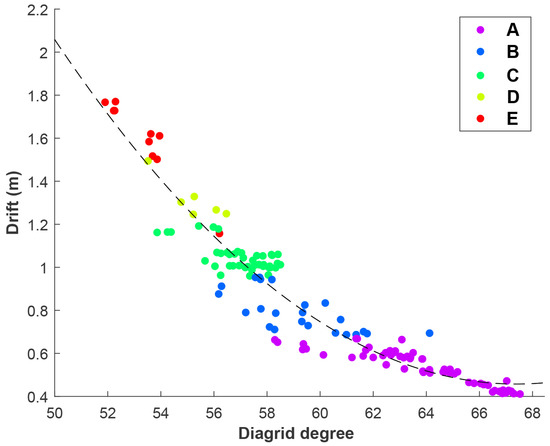
Figure 5.
5-class representation of the structural performance based on the drift and diagrid degree features.
It is also worth mentioning that the considered intervals defining the labels have been assumed to be constant in size, namely that the values to bound each of them have been assumed evenly spaced between the minimum and the maximum provided by the structural analysis. Hence, the distribution of the data among the five classes is not homogeneous. As can be seen even with the colour codes used in Figure 5 in this specific case, the classes corresponding to the best structural performances turn out to collect more observations; such outcome is clearly depicted in Figure 6.
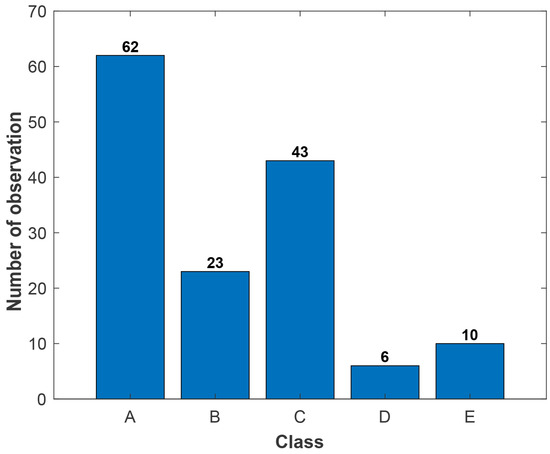
Figure 6.
Distribution of data among the defined drift-based classes.
This outcome is supposed to potentially represent an issue, since the ML algorithms may provide biased results if trained without a uniform distribution of the instances in all the different classes. An alternative way to tackle the classification task could be set as follows: the range of values of the considered performance index can be subdivided into finely tuned intervals, so that the amount of instances is the same for all of them. This approach could cause additional issues in the present case, characterized by a small dataset: the ranges of values for the various intervals can become largely different. Data would also need to be preprocessed in order to guarantee the aforementioned uniform distribution, with an additional burden for the classification task; classes and relevant ranges need to be adjusted on the basis of the adopted performance index as a label, making the problem to become index-dependent and not only performance-dependent. Further than that, the additional burden of data preprocessing could be only made partially automatic, with the need of expert intervention. Such an alternative approach to deal with the available data will be considered in future activities, and relevant results will be compared with the present ones in order to assess the strengths and the weaknesses of each methodology in handling small datasets.
In simple words, it is not easy to foresee whether a specific label can lead to a good classification: for example, if a geometry-related parameter is chosen, like the polygon side number, outcomes turn out to be poor. To provide an example, in Figure 7, the distributions of data for classification purposes are shown for other pairs of features. Even without a quantitative assessment, it is easy to foresee that the classification algorithms will work well in case of, e.g., the drift-vs-total mass case, and not in the case of the maximum utilization-vs-expected design weight case, since the data points corresponding to the label classes are quite spread in the latter case.
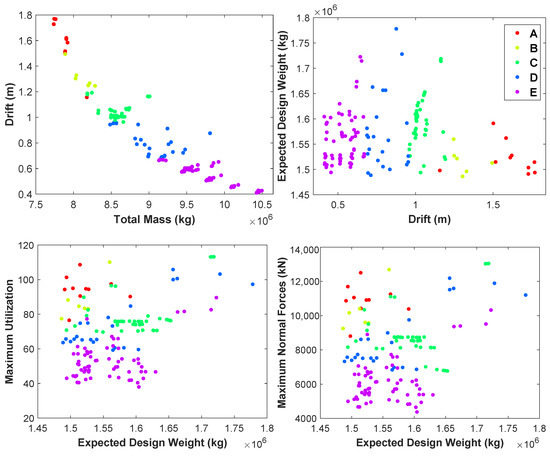
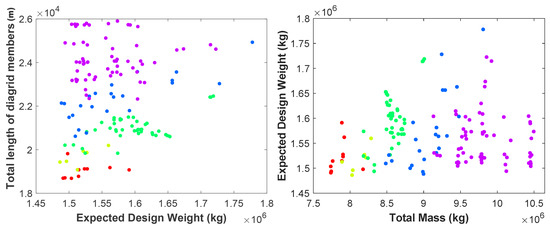
Figure 7.
Projections on different feature planes of the 5-class representation of the structural performance.
4. Results
In order to show the efficiency and capabilities of the different ML algorithms here considered, results are arranged in this Section as follows. First, in Section 4.1 the k-nearest neighbour (kNN) algorithm is adopted to start showing the potentiality of ML tools for classification purposes. Due to its intuitive working principle, this algorithm is expected to ascertain the feasibility of the adopted labeling strategy. Next, in Section 4.2 six different learning ML algorithms are adopted for the same classification purposes: k-nearest neighbours; ensemble method (EM); support vector machine (SVM); naive Bayes (NB); decision tree (DT); discriminant analysis (DA).
In the analysis, three optimizers are considered, namely the Bayesian, grid search, and random search ones, each with its own advantages and disadvantages, see [38]. These optimizers are used to set the hyperparameters of each ML algorithm. An example of the optimizer effect is shown in Figure 8, where the observed minimum classification error (MCE) is compared with the estimated MCE. In a specific iteration, the observed MCE is related to the error up to that iteration: at iteration 5 it would represent the minimum error between iterations 1–5. The estimated MCE refers instead to the prediction based on hyperparameters considered till that iteration (excluded), which can only be carried out with the Bayesian optimizer. At a given iteration, hyperparameters associated to the minimum error correspond to the ones leading to the minimum classification error. The best point hyperparameters do not necessarily coincide with the minimum error hyperparameters: in fact, in Bayesian optimization the hyperparameter that produces the smallest upper confidence interval for the classification error objective model is selected as the best point hyperparameter and not the one corresponding to the observed MCE. Results are specifically reported for the SVM classifier and it is shown that the best solution is attained at the 30-th iteration. At that iteration the classification error is 8.3%, and the accuracy reaches 91.7%.
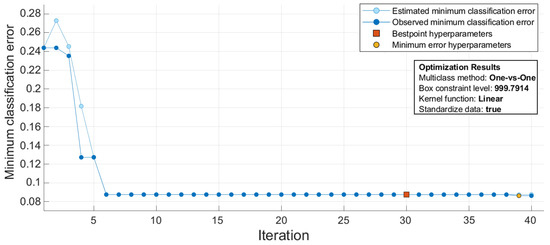
Figure 8.
Exemplary results of the Bayesian optimizer for the SVM classifier, reporting the error for each single iteration.
4.1. Feasibility of the ML Classification Approach
As mentioned, we start the investigation of the capability of the proposed ML-based approach by adopting the kNN algorithm. The primary goal is here to assess whether the foreseen classification and labelling strategy prove feasible. In a specific state space, the kNN algorithm looks for data nearest to a target observation, according to a specific metric. The parameter k actually represents the number of instances in the dataset nearest to the said observation. To avoid overfitting, a 5-fold cross validation is adopted: hence, the dataset is subdivided into 5 folds, and computations are repeated 5 times for each fold. The accuracy of training and testing reported in the following are thus the average values for the 5 folds. To check the effect of the aforementioned randomization, we compare the kNN with an alternative algorithm, the DT, which is going to be shown to be the best in the following comparisons; the algorithmic hyperparameters for the DT algorithm are automatically set by an optimizer.
As we deal with a rather small set of geometries, results may turn out to be biased in terms of accuracy depending on the subset of the entire data belonging to the different folds. We have therefore run the kNN algorithm 50 times, each time randomizing the data in each fold. Regarding the algorithmic hyperparameters of kNN, after an heuristic optimization strategy, they are eventually set as: k = 10; city lock metric with equal distance weight, see [39] and the discussion in Section 4.2.1.
The training and testing accuracies, defined as the ratio between the number of correctly classified instances in each dataset and the total number of instances, are shown in Figure 9; out of the 50 trials, three cases are highlighted in the graph, respectively representative of the maximum (run 16), average (run 47) and minimum (run 21) accuracies. The confusion matrices relevant to the training and testing of run 21 are shown in Figure 10 to get insights into the sources of the reduced accuracy reported.
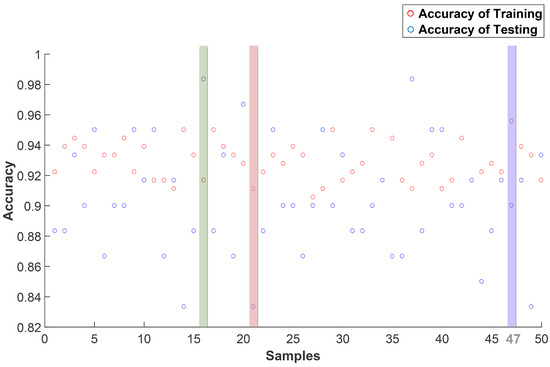
Figure 9.
kNN classifier: effect of randomization on the training and testing accuracies. The highlighted trials are respectively characterized by to the maximum (run 16), minimum (run 21), and average accuracy (run 47).
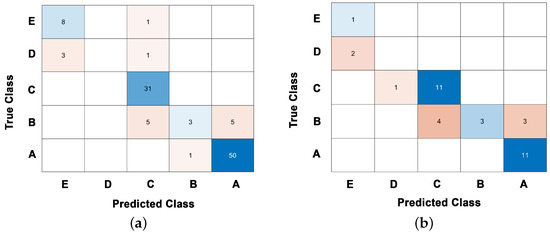
Figure 10.
kNN classifier (run 21): confusion matrices relevant to the (a) training and (b) testing datasets.
In this specific trial, the training and testing accuracies result to be 85.2% and 72.2%, respectively. Though it is a bit unusual to represent the results of training with a confusion matrix, we adopt this useful tool to easily compare the misclassification errors at the two stages of training and testing. To go more into the detail and figure out why the the classifier sometimes works improperly, Figure 10 shows that for class E there is only one datum or instance in the training set, but that is enough to predict correctly the class for 8 out of 9 data in the test set. For class D, all the few data in the training set are wrongly classified and, similarly, that happens for the testing ones, which are misplaced in class E. All the data in class C are classified correctly during training, and therefore it basically happens the same for the testing instances, with only one exception. For class B, data are evenly misclassified as C or A, both for the training and testing sets. Finally, data relevant to class A are (almost) perfectly classified. The confusion matrices clearly show that the instances are not uniformly distributed among the different classes and, as already stressed, the results get affected: for the classes featuring the highest numbers of instances (A and C), the algorithm is well trained with only marginal errors in the classification; for the classes featuring instead the lowest numbers of instances in the training set (B, D, and E), the ML algorithm is, in the end, not able to learn well the link between the structural performance and the relevant value of the performance index.
Furthermore, though impossible to understand on the basis of the results presented herein, there might be the case that the adopted performance index alone is not able to allow a proper classification; in such a situation, the label should then be based on a more complex evaluation of the input parameters affecting the behavior of the buildings. Better results could be achieved by increasing the number of instances in the dataset, e.g., through data augmentation. These aspects are beyond the scope of this work and will be investigated in future activities.
To further assess the randomization effects, the outcome of the kNN algorithm is compared with that of an optimized DT classifier. Figure 11 depicts, in terms of the cumulative distribution functions (CDFs) of the algorithm, accuracies obtained with the 50 runs in relation to the training (Figure 11a) and the testing (Figure 11b) stages. With kNN, the training and testing accuracies respectively range between 83.3% and 92.6%, and between 72.5% and 97.2%; these values have to be compared with those related to DT, with the accuracy to range respectively in the intervals 96–100% and 85–100%. The highest accuracy obtained with the DT classifier highlights the role of an adaptive hyperparameter optimization during the learning process, leading to DT plots far nearer to 100% and steeper, meaning that results are also less scattered than the kNN ones.
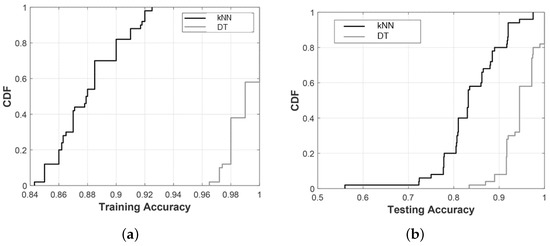
Figure 11.
Comparison between the performances of the kNN and DT algorithms, in terms of the CDFs of the accuracy during (a) training and (b) testing with the randomized datasets.
Finally, to investigate the effect of handling a small dataset on the accuracies of the results, the DT classifier is run 1000 times, adopting a Bayesian optimization for all hyperparameters. For each run, data in the training and testing sets are randomly extracted from the whole dataset. In Figure 12, the corresponding pairs of accuracy for the randomized training and testing sets are depicted. The red colour is used for the training data, and the blue colour for the testing ones; a horizontal line provides the average value of all the 1000 runs, while the dotted lines bound the confidential interval featuring plus/minus the standard deviation. Training and testing average accuracies are obtained as 0.98 and 0.95, respectively; their variances are small in both sets, as summarized in Table 2 together with other statistical properties. Therefore, the DT classifier is remarkable for its stability, as confirmed by its training median accuracy of 0.99, meaning that only one observation out of the 108 handled is misclassified, and by the corresponding testing median accuracy of 0.97, again meaning that only one sample out of 36 is misclassified. The small number of samples in the testing set leads to a step-wise reduction in the accuracy, so that several points are located on some horizontal lines in Figure 12. ML processes can be prone to overfitting in case of small datasets [40], but in those cases training accuracy should be far higher than testing accuracy, and the testing variance should be significant, which is instead not shown in the present case.
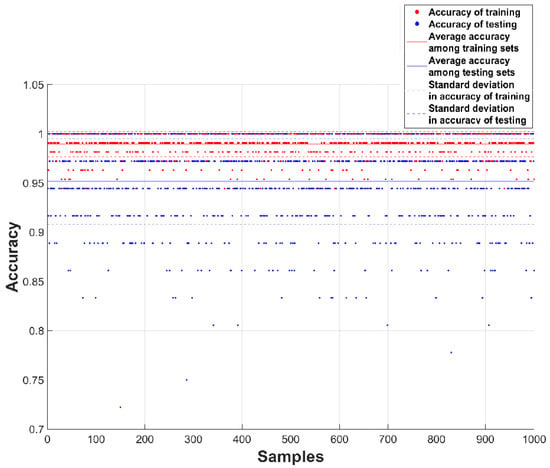
Figure 12.
Patterns in the accuracies for 1000 randomized training and testing datasets, as obtained via the DT algorithm backed by a Bayesian optimizer.

Table 2.
Statistical properties computed over the 1000 randomized runs via the optimized DT algorithm.
4.2. Comparison among Different Classifiers
In the following, some exemplary results obtained with the six considered classification algorithms are compared. For each algorithm, the hyperparameters governing the learning process are optimized online during training. For ease of reference, some known relationships, such as the key definition of distance in the feature space used in the kNN algorithm, are briefly recalled in the text.
4.2.1. K-Nearest Neighbours
Three hyperparameters are considered here to assess their effects on the accuracy of the results: number k of neighbours; metric to measure the distance between neighbours; weights for the computed distances [39]. In particular, we recall that, given a feature , () to classify and a dataset of training samples, , N being the dataset dimension, the distance can be defined as:
where represents the weight adopted for the f-th feature, and is the distance metric; relevant details are going to be provided in what follows.
To improve the performance of the algorithm, a Bayesian, grid search, or random search optimization is adopted. Principal component analysis (PCA) [41] is also exploited in order to reduce the problem dimensionality. Results are gathered in Table 3 for seven different models characterized by a varying k, which are representative of the entire set of analyses carried out, to get details about the effect of each hyperparameter varied in the investigation. The distance weights are selected to be either the inverse or the squared inverse of the distance between the data points, see [39]. The distance metric is assumed in most of the cases to be the city block one, given by , with representing the modulus of the quantity . For the highest values of k in the Table 3, results are also reported for the Euclidean distance metric and its generalization (Mahalanobis distance), see again [39] for details.

Table 3.
Features of the kNN models, and relevant accuracies achieved. Excl. feat. = excluded features (⋆ = top/bottom geometry, diagrid total length, maximum normal force).
The training accuracy varies between 80% and 91.7%, while the testing accuracy between 94.4% and 97.2%. It must be kept in mind that the training dataset is composed of 108 forms, so each one represents around the 0.9% of the solutions; the test dataset is instead composed of 36 forms, and each one indeed represents around the 2.8% of the corresponding solutions. Hence, for instance, showing that the accuracy is 97% during testing means that only one form is misclassified; the accuracies have accordingly to be judged on the basis of this kind of digital variation, with finite jumps in the classification outcome due to the limited number of available instances. In order to also assess the efficiency of the algorithm, results are reported in terms of the computing time required for the classification, which varies between 16.3 s to 64.6 s.
The comparison among the seven models shows that, by changing the optimization scheme from Bayesian (model K2) to random search (K3), the training and testing accuracies are the same, but the computing time decreases from 38.1 s to 15.9 s. This is caused by the fact that, if the number of iterations is a priori set, the Bayesian optimizer is always recomputed (this requires a bit of time) according to the continuous update granted by the Bayes rule, while in a random search the next iteration in the convergence towards the optimal solution is simply randomly extracted. By increasing the number of iterations from 30 to 50, see model K5, the testing accuracy shows a positive trend, increasing from 94.4% to 97.2%; the computing time also increases significantly, from 38.1 s to 64.5 s, as expected. The grid search algorithm with 10 divisions is adopted in model K1: the accuracy is similar to the K2 and K3 ones, but the computing time turns out to be far larger, testifying that this optimization algorithm is not effective and efficient for the present case study. By plugging in the PCA with 95% variance in model K7, the training accuracy reduces to 88%, while the testing accuracy increases to 97.2%; this is somehow in agreement with the fact that, as PCA is exploited to reduce the dimensionality of the dataset, some information can be lost and the accuracy is detrimentally affected during testing. In model K6 some features (top/bottom geometry, total diagrid length, maximum normal forces) are excluded in the training procedure and PCA is adopted, but the accuracy remains similar to model K7. In model K4 only feature exclusion is considered and the training accuracy increases to 96.3%. The overall conclusion is that, by excluding some features, results can be improved if the problem dimensionality is not reduced by PCA.
The discussed performances are going to be compared to those of other ML algorithms in the following Sections, to better infer the overall capabilities of ML in the current context.
4.2.2. Support Vector Machine
The SVM method [42] is used in this investigation as a term of comparison, though it is known to be more time consuming than kNN. In fact, it basically handles binary classes and, in case of multi-class problems, the method has to convert them to a combination of problems, each one characterized by binary classes [43].
With this algorithm, the hyperparameters are: the kernel function related to the type of support vector classifier, which may be linear, quadratic, Gaussian, or cubic; the multi-class method, which may be one-vs-all or one-vs-one, the latter one expected to be more accurate but also more time consuming [43]; the kernel scale, to affect the input data by means of the distance between the minimum and the maximum values of a given feature before the application of the kernel function, which has been always heuristically selected. The outcomes of the SVM classifier are shown in Table 4. Training and testing accuracies respectively result to be in the ranges 86.1–95.4%, and 91.7–94.4%, while the computing time ranges in the interval between 134 s and 2030 s.

Table 4.
Features of the SVM models, and relevant accuracies achieved. Excl. feat. = excluded features (⋆ = top/bottom geometry, diagrid total length, maximum normal force).
Overall, the accuracy does not improve in comparison to the kNN one, while the computing time results to be far larger, independently of the use of any optimizer to enhance the performance, see models S1, S2 and S3. In model S4 the same feature exclusion discussed for the kNN algorithm is adopted: in comparison to model S5 the training accuracy remains the same, while the testing one slightly decreases down to 91.7%. If PCA is plugged in with 95% variance, the accuracies decrease to 86.1% and 91.7%, see model S5. If some features are also excluded, see model S6, the training accuracy becomes slightly larger than the model S5 one. As already mentioned, PCA tends to reduce the dimensionality of the problem to increase the efficiency of the algorithm, and thus it decreases in principle the accuracy, while speeding up the training process.
4.2.3. Decision Tree
A DT classifier works by iteratively splitting the dataset into two subsets according to a specific rule, see also [44]. The algorithmic hyperparameters are now: the iteration (split) number; the criterion to split the data, to be in our analysis the Twoing rule, the Gini’s diversity index or the maximum variance reduction; the surrogate decision split option, to enforce a decision when even the variable dictating the rule is missing.
The results gathered in Table 5 show that the training accuracy varies between 86.1% and 93.5%, while the testing accuracy between 77.8% and 100%. The computing time instead varies between 17.4 s and 45 s. It is to note that the testing accuracy attains 100% for 4 out of 5 considered models; this result testifies that the DT classifier is one of the best algorithms in this context. With model T2, random search is used instead of the Bayesian optimization adopted for model T1; results remain the same, but the computing time decreases. Models T2 and T3 show similar results, as the only difference is represented by the surrogate decision split, which is activated with model T3, using a maximum of 10 surrogates: when the value to find the optimal split is missed, the algorithm looks for the mentioned surrogates. In general, this approach could be useful when there are missing observations in the dataset; however, in our case it does not affect much the results, since there are no missing points. In model T4, PCA is enabled again with 95% variance, and the training and testing accuracies decrease significantly. It is therefore shown that the algorithm performs well with most of the selected hyperparameters; it provides worse results only when PCA is applied.

Table 5.
Features of the DT models, and relevant accuracies achieved. Excl. feat. = excluded features.
4.2.4. Ensemble Method
EM stands out as a different approach, since it handles different algorithms to attain the optimal prediction [45]. It can be thus conceived as a family of algorithms, rather than a unique approach. The bootstrap aggregation (bagged tree) is the most famous ensemble classifier. In this work, RUSBoost, bagged tree (Bag), and AdaBoost algorithms are adopted, with: maximum number of split varied between 1 and 107; number of learners ranging from 10 to 500; learning rate varied between 0.001 and 1; predictor samples in the range from 1 to 8.
Results are characterized by a training accuracy of 85.2–98.1%, a testing accuracy of 94.4–100%, and a computing time ranging from 72 s to 129.4 s. The performances have a relevant scattering depending on the choice of the algorithm in the family, see Table 6. For models E1, E2, and E3, the Bayesian, grid search, and random search algorithms are adopted, and only with the grid search one the accuracy slightly decreases, even if the computing time is the largest. With model E5 some features are excluded during learning; in spite of this, the accuracy turns out to be better than the E4 one. In model E6, PCA is enabled, with also the already discussed features excluded; results are thus characterized by the minimum accuracy. To show the effects of this latter aspect, in model E7 only PCA is adopted, with a slightly better accuracy. EM thus turns out to be a noteworthy good classifier only when PCA is not exploited to speed up the process.

Table 6.
Features of the EM models, and relevant accuracies achieved. Excl. feat. = excluded features (⋆ = top/bottom geometry, diagrid total length, maximum normal force); NoL = number of learners; LR = learning rate.
4.2.5. Naive Bayes
The NB classifier works within a stochastic frame [46], exploiting the Bayes’ theory with the naive assumption that features in a class are uncorrelated. NB has two hyperparameters: the kernel smoother, to be the box, Gaussian, triangular, or Epanechnikov one; the distribution type.
Results gathered in Table 7 show that the training accuracy results in the range 82.4–92.6%, while the testing accuracy in the range 83.3–91.7%; the computing time instead varies from 13.7 s to 109.7 s. In model N2, as compared to model N1, the support type is changed from unbounded to positive, and the training accuracy increases from 90.7% to 92.6%, while the testing accuracy decreases from 91.7% to 88.9%. With model N3, the grid search is adopted in place of the Bayesian optimizer, without affecting the results. By enabling PCA, see model N4, accuracy gets lower as usual. In model N5, both PCA and feature exclusion are plugged in: this solution improves the accuracy with respect to the N4 case, since less predictors are included by the model to train it. Overall, it can be stated that the performance of NB results to be worse than that of the other classifiers.

Table 7.
Features of the NB models, and relevant accuracies achieved. Excl. feat. = excluded features (⋆ = top/bottom geometry, diagrid total length, maximum normal force).
4.2.6. Discriminant Analysis
With DA, it is supposed that data produced by different classes fit a Gaussian distribution [47]. The algorithmic hyperparameter in this analysis is only the discriminant type, assumed to be quadratic, linear, diagonal quadratic or diagonal linear.
According to the outcomes collected in Table 8, the training accuracy results to be 85.2–94.4%, while the testing accuracy 83.3–91.7%. The computing time turns out to be almost unaffected by the hyperparameter tuning, varying between 45.3 s and 48.7 s. If PCA is adopted, see model D2, training and testing accuracies decrease as compared with the previous classifiers. In model D4, some features are excluded, leading to only a 1% improvement of the training accuracy. Hence, there is no a clear indication as to whether the option of excluding some features, like e.g., top/bottom geometry, total diagrid length and maximum normal forces, has a positive effect on the accuracy of the ML model. That noted, it can be also remarked that, if both PCA and feature exclusion are plugged in, as for model D5, the accuracy has a general tendency to decrease.

Table 8.
Features of the DA models, and relevant accuracies achieved. Excl. feat. = excluded features (⋆ = top/bottom geometry, diagrid total length, maximum normal force).
5. Conclusions
In this work, we have assessed the possibly nested relationship between architectural form and structural response of tall buildings with a diagrid structure to external loading. To envisage an automatic strategy to get insights into which structural and geometrical parameters may improve the structural response, different ML algorithms have been exploited.
As a first step in our investigation, the performances of a set of well-known ML classifiers have been compared by referring to a label related to a conventional seismic load, namely the drift measured at the top of the building. The classification accuracy and the training time of the different algorithms have been compared. The decision tree and the ensemble method algorithms have shown the most promising results, especially in terms of a trade off between accuracy and computational burden. The role of algorithmic hyperparameters has been also discussed for each classifier; in all cases, the use of an optimizer has been reported to increase the model accuracy. Principal component analysis, adopted to reduce the complexity of the model, has resulted to be not useful: although rather good results have been almost always attained, the benefits offered by PCA in terms of speeding up the training have been compensated for by a decreased classification accuracy, which is here adopted to judge the performance of each single algorithm to work on a small set of building geometries.
The role of the selected features, like the top/bottom plan geometry, the diagrid degree, the total mass of the structure, the drift induced by the seismic load, the expected design weight, the maximum utilization, the total length of diagrid, and the maximum normal force, is not obviously neutral: in most of the cases, by excluding a few of the aforementioned features, the accuracy was affected.
In view of the present results, it can be claimed that machine learning tools can be efficiently adopted to the aim here envisaged, leading to noteworthy advantages and support during the early stage of the architectural design. At difference from the naive approach mentioned in Section 2, based on the observation by the naked eye of diagrams such as Figure 3, the ML-based classification permits to deal with a far larger number of architectural shapes (e.g., thousands of them) in a fast and clear way, restricting the results to a quantitative well-defined feature and finding the hidden patterns. Even if classification is not a predictive tool, still this approach allows to identify (with an error lower than 5%) the drift range for a given top-bottom geometry combination: an encouraging result for further applications in this field.
In future activities we are going to move towards the use of neural networks, like, e.g., (variational) autoencoders, to provide a generative approach that could suggest new groundbreaking architectural solutions, starting from the best ones identified as promising by the present classification approach. This methodology would provide the way, if properly linked to parametric design tools, to further enlarge the dataset of building geometries by including more complex solutions, not necessarily generated by a morph of the plan from top to bottom, as here considered. In order to also overcome the issues related to the small dimension of the dataset, other generative approaches, like, e.g., generative adversarial networks, could be adopted. Another research line to be addressed points to a regression analysis instead of a classification one, so that predictions linked to a continuous structural performance indicator will be provided instead of discrete classes. Overall, unsupervised learning methods will be looked for to categorize all the observations, and provide the best automation of the entire procedure.
Author Contributions
Conceptualization and methodology, P.K., A.G. and S.M.; software, P.K.; validation, P.K., A.G. and S.M.; data curation, P.K.; writing—original draft preparation, P.K. and A.G.; writing—review and editing, A.G. and S.M.; supervision, A.G. and S.M. All authors have read and agreed to the published version of the manuscript.
Funding
This research received no external funding.
Data Availability Statement
The data presented in this study are available on request from the corresponding author.
Conflicts of Interest
The authors declare no conflict of interest.
Abbreviations
The following abbreviations are used in this manuscript:
| CDF | Cumulative Distribution Function |
| DA | Discriminant Analysis |
| DT | Decision Tree |
| EM | Ensemble Method |
| kNN | k-Nearest Neighbor |
| MCE | Minimum Classification Error |
| ML | Machine Learning |
| NB | Naive Bayes |
| PCA | Principal Component Analysis |
| SVM | Support Vector Machine |
References
- Beghini, L.L.; Beghini, A.; Katz, N.; Baker, W.F.; Paulino, G.H. Connecting architecture and engineering through structural topology optimization. Eng. Struct. 2014, 59, 716–726. [Google Scholar] [CrossRef]
- Moynihan, M.C.; Allwood, J.M. Utilization of structural steel in buildings. Proc. R. Soc. Math. Phys. Eng. Sci. 2014, 470, 20140170. [Google Scholar] [CrossRef] [PubMed]
- Sun, H.; Burton, H.V.; Huang, H. Machine learning applications for building structural design and performance assessment: State-of-the-art review. J. Build. Eng. 2021, 33, 101816. [Google Scholar] [CrossRef]
- Farrar, C.R.; Worden, K. Structural Health Monitoring: A Machine Learning Perspective; John Wiley & Sons Inc.: Hoboken, NJ, USA, 2012. [Google Scholar] [CrossRef]
- Zheng, H.; Moosavi, V.; Akbarzadeh, M. Machine learning assisted evaluations in structural design and construction. Autom. Constr. 2020, 119, 103346. [Google Scholar] [CrossRef]
- Elnimeiri, M.; Nicknam, M.A. A Design Optimization Workflow for Tall Buildings Using Parametric Algorithm. In Proceedings of the Council on Tall Buildings and Urban Habitat 8th World Congress, Seoul, Korea, 10–12 October 2011. [Google Scholar]
- Hyde, R. Computer-aided architectural design and the design process. Archit. Sci. Rev. 2016, 59, 255–256. [Google Scholar] [CrossRef]
- Moon, K.S. Sustainable Structural Design of Contemporary Tall Buildings of Various Forms. In Proceedings of the Council on Tall Buildings and Urban Habitat 9th World Congress, Shanghai, China, 19–21 September 2012. [Google Scholar]
- Elnimeiri, M.; Almusharaf, A. Structure and Architectural Form of Tall Buildings. In Proceedings of the International Conference on Sustainable Bulding Asia, Seoul, Korea, 24–26 February 2010. [Google Scholar]
- Macdonald, A.J. Structure and Architecture; Routledge: London, UK, 2018. [Google Scholar] [CrossRef]
- Zhao, X.; Haojia, M.A. Structural System Embodied Carbon Analysis for Super Tall Buildings. Procedia Eng. 2015, 118, 215–222. [Google Scholar] [CrossRef]
- Elnimeiri, M.; Park, S.M.; Sharpe, D. Tall building form generation by parametric design process. In Proceedings of the Council on Tall Buildings and Urban Habitat World Conference, Seoul, Korea, 10–13 October 2004. [Google Scholar]
- Brown, N.; Mueller, C. Early-stage integration of architectural and structural performance in a parametric multi-objective design tool. In Proceedings of the 3rd Annual Conference on Structures and Architecture, Guimarães, Portugal, 27–29 July 2016. [Google Scholar]
- Park, S.M. Innovative Tall Building Form Development. In Proceedings of the Council on Tall Buildings and Urban Habitat 7th World Congress, New York, NY, USA, 16–19 October 2005. [Google Scholar]
- Osmond, L.J. John Hancock Center. Encyclopedia Britannica. Available online: https://www.britannica.com/topic/John-Hancock-Center (accessed on 20 July 2022).
- Afghani Khoraskani, R.; Kazemi, P.; Tahsildoost, M. Adaptation of hyperboloid structure for high-rise buildings with exoskeleton. In Proceedings of the 5th International Conference on Architecture and Building Environment, Venice, Italy, 22–24 May 2018. [Google Scholar]
- Khodadadi, A.; Von Buelow, P. Form Exploration and GA-Based Optimization of Lattice Towers Comparing with Shukhov Water Tower. In Proceedings of the IASS-SLTE 2014 Symposium, “Shells, Membranes and Spatial Structures: Footprints”, Brasilia, Brazil, 15–19 September 2014. [Google Scholar]
- Torghabehi, O.O.; von Buelow, P. Performance oriented generative design of structural double skin facades inspired by cell morphologies. In Proceedings of the IASS-SLTE 2014 Symposium, “Shells, Membranes and Spatial Structures: Footprints”, Brasilia, Brazil, 15–19 September 2014. [Google Scholar] [CrossRef]
- von Buelow, P.; Torghabehi, O.O.; Mankouche, S.; Vliet, K. Combining parametric form generation and design exploration to produce a wooden reticulated shell using natural tree crotches. In Proceedings of the IASS-SLTE 2018 Symposium, “Creativity in Structural Design”, Boston, MA, USA, 16–20 July 2018. [Google Scholar]
- Ardekani, A.; Dabbaghchian, I.; Alaghmandan, M.; Golabchi, M.; Hosseini, S.M.; Mirghaderi, S.R. Parametric design of diagrid tall buildings regarding structural efficiency. Archit. Sci. Rev. 2020, 63, 87–102. [Google Scholar] [CrossRef]
- Mirniazmandan, S.; Alaghmandan, M.; Barazande, F.; Rahimianzarif, E. Mutual effect of geometric modifications and diagrid structure on structural optimization of tall buildings. Archit. Sci. Rev. 2018, 61, 371–383. [Google Scholar] [CrossRef]
- Ochoa, K.S.; Ohlbrock, P.O.; D’Acunto, P.; Moosavi, V. Beyond typologies, beyond optimization: Exploring novel structural forms at the interface of human and machine intelligence. Int. J. Archit. Comput. 2021, 19, 466–490. [Google Scholar] [CrossRef]
- Danhaive, R.; Mueller, C.T. Design subspace learning: Structural design space exploration using performance-conditioned generative modeling. Autom. Constr. 2021, 127, 103664. [Google Scholar] [CrossRef]
- Nicholas, P.; Chen, Y.; Borpujari, N.; Bartov, N.; Refsgaard, A. A Chained Machine Learning Approach to Motivate Retro-Cladding of Residential Buildings. In Towards a New, Configurable Architecture, Proceedings of the 39th eCAADe Conference, Novi Sad, Serbia, 8–10 September 2021; University of Novi Sad: Novi Sad, Serbia, 2021. [Google Scholar]
- Yazici, S. A machine-learning model driven by geometry, material and structural performance data in architectural design process. In Proceedings of the 38th eCAADe Conference, Berlin, Germany, 16–18 September 2020; Volume 1. [Google Scholar]
- As, I.; Pal, S.; Basu, P. Artificial intelligence in architecture: Generating conceptual design via deep learning. Int. J. Archit. Comput. 2018, 16, 306–327. [Google Scholar] [CrossRef]
- Ho, G.; Liu, P.; Liu, M. Parametric Analysis and Design Engine for Tall Building Structures. Int. J. High-Rise Build. 2012, 1, 53–59. [Google Scholar] [CrossRef]
- Chang, S.W.; Dong, W.H.; Rhee, D.Y.; Jun, H.J. Deep learning-based natural language sentiment classification model for recognizing users’ sentiments toward residential space. Archit. Sci. Rev. 2021, 64, 410–421. [Google Scholar] [CrossRef]
- Fisher-Gewirtzman, D.; Polak, N. A learning automated 3D architecture synthesis model: Demonstrating a computer governed design of minimal apartment units based on human perceptual and physical needs. Archit. Sci. Rev. 2019, 62, 301–312. [Google Scholar] [CrossRef]
- Kazemi, P.; Khoraskani, A.; Tahcildoost, M. Achieving Structural Efficiency of Tall Buildings by means of Parametric Generative Design. In Proceedings of the Council on Tall Buildings and Urban Habitat 2018 International Conference, Dubai, United Arab Emirates, 20–25 October 2018. [Google Scholar]
- Kazemi, P.; Afghani, R.; Tahcildoost, M. Investigating the effect of architectural form on the structural response of lateral loads on diagrid structures in tall buildings. In Proceedings of the 5th International Conference on Architecture and Built Environment, Venice, Italy, 22–24 May 2018. [Google Scholar]
- Park, S.M. Tall Building Form Generation by Parametric Design Process. Ph.D. Thesis, Illinois Institute of Technology, Chicago, IL, USA, 2005. [Google Scholar]
- Moon, K.S. Comparative Evaluation of Structural Systems for Tapered Tall Buildings. Buildings 2018, 8, 108. [Google Scholar] [CrossRef]
- EN 1998-1; Eurocode 8, Design of Structures for Earthquake Resistance. Technical Report. British Standards Institution: London, UK, 2005.
- Preisinger, C. Linking Structure and Parametric Geometry. Archit. Des. 2013, 83, 110–113. [Google Scholar] [CrossRef]
- Bennett, D. Skyscraper: Form and Function; Simon & Schuster: New York, NY, USA, 1995. [Google Scholar]
- EN 1990; Eurocode 0: Basis of Structural Design. Technical Report. British Standards Institution: London, UK, 2002.
- Yang, L.; Shami, A. On hyperparameter optimization of machine learning algorithms: Theory and practice. Neurocomputing 2020, 415, 295–316. [Google Scholar] [CrossRef]
- Cunningham, P.; Delany, S.J. K-Nearest Neighbour Classifiers—A Tutorial. ACM Comput. Surv. 2021, 54, 3459665. [Google Scholar] [CrossRef]
- Althnian, A.; AlSaeed, D.; Al-Baity, H.; Samha, A.; Dris, A.B.; Alzakari, N.; Abou Elwafa, A.; Kurdi, H. Impact of Dataset Size on Classification Performance: An Empirical Evaluation in the Medical Domain. Appl. Sci. 2021, 11, 796. [Google Scholar] [CrossRef]
- Jolliffe, I. Principal Component Analysis. In International Encyclopedia of Statistical Science; Springer: Berlin/Heidelberg, Germany, 2011; pp. 1094–1096. [Google Scholar] [CrossRef]
- Meyer, D.; Leisch, F.; Hornik, K. The support vector machine under test. Neurocomputing 2003, 55, 169–186. [Google Scholar] [CrossRef]
- Brereton, R.G.; Lloyd, G.R. Support Vector Machines for classification and regression. Analyst 2010, 135, 230–267. [Google Scholar] [CrossRef] [PubMed]
- Song, Y.; Lu, Y. Decision tree methods: Applications for classification and prediction. Shanghai Arch. Psychiatry 2015, 27, 130–135. [Google Scholar] [PubMed]
- Ren, Y.; Zhang, L.; Suganthan, P. Ensemble Classification and Regression-Recent Developments, Applications and Future Directions. IEEE Comput. Intell. Mag. 2016, 11, 41–53. [Google Scholar] [CrossRef]
- Rish, I. An empirical study of the naive Bayes classifier. In IJCAI 2001 Workshop on Empirical Methods in Artificial Intelligence; Morgan Kaufmann Publishers Inc.: San Francisco, CA, USA, 2001. [Google Scholar]
- Tharwat, A.; Tarek, G.; Abdelhameed, I.; Ella, H.A. Linear discriminant analysis: A detailed tutorial. AI Commun. 2017, 30, 169–197. [Google Scholar] [CrossRef]
Publisher’s Note: MDPI stays neutral with regard to jurisdictional claims in published maps and institutional affiliations. |
© 2022 by the authors. Licensee MDPI, Basel, Switzerland. This article is an open access article distributed under the terms and conditions of the Creative Commons Attribution (CC BY) license (https://creativecommons.org/licenses/by/4.0/).