Article

A Heuristic Methods-Based Power Distribution System Optimization Toolbox

by
İsmail Alperen Özlü
1,
Olzhas Baimakhanov
2,
Almaz Saukhimov
3 and
Oğuzhan Ceylan
1,4,*
1
Management Information Systems Department, Kadir Has University, Istanbul 34083, Turkey
2
Electrical Power Systems Department, Almaty University of Power Engineering & Telecommunications Named after G. Daukeyev, Almaty 480013, Kazakhstan
3
Science & Innovations Department, Almaty University of Power Engineering & Telecommunications Named after G. Daukeyev, Almaty 480013, Kazakhstan
4
Electrical and Electronics Engineering Department, Marmara University, Istanbul 34854, Turkey
*
Author to whom correspondence should be addressed.
Algorithms 2022, 15(1), 14; https://doi.org/10.3390/a15010014
Submission received: 23 November 2021 / Revised: 14 December 2021 / Accepted: 19 December 2021 / Published: 28 December 2021
(This article belongs to the Special Issue Algorithms in Planning and Operation of Power Systems)

Abstract

:
This paper proposes a toolbox for simulating the effective integration of renewable energy sources into distribution systems. The toolbox uses four heuristic methods: the particle swarm optimization (PSO) method, and three recently developed methods, namely Gray Wolf Optimization (GWO), Ant Lion Optimization (ALO), and Whale Optimization Algorithm (WOA), for the efficient operation of power distribution systems. The toolbox consists of two main functionalities. The first one allows the user to select the test system to be solved (33-, 69-, or 141-bus test systems), the locations of the distributed generators (DGs), and the voltage regulators. In addition, the user selects the daily active power output profiles of the DGs, and the tool solves the voltage deviation problem for the specified time of day. The second functionality involves the simulation of energy storage systems and provides the optimal daily power output of the resources. With this program, a graphical user interface (GUI) allows users to select the test system, the optimization method to be used, the number of DGs and locations, the locations and number of battery energy storage systems (BESSs), and the tap changer locations. With the simple user interface, the user can manage the distribution system simulation and see the results by making appropriate changes to the test systems.

1. Introduction

With the urbanization of people, the demand for energy has increased worldwide. In addition, technological developments in our lives, industrialization, and increasing consumption of electrical appliances have also increased the demand for energy. These developments have also increased the amount of energy that consumers require at different times of the day. Due to this demand, the load fluctuation in the grid can be more than before, which can lead to violation of voltage limits. Recently, efforts to integrate DGs, including renewables such as photovoltaics and wind turbines, have increased. In addition, advanced electric vehicles (EVs) and battery energy storage systems (BESSs) can help maintain the voltage deviation of power distribution systems when coordinated with conventional devices such as voltage regulators.
In power system studies, power flow analysis is a vital tool for determining bus voltages and angles. Using Newton–Raphson or forward/backward power flow algorithms, snapshots of the distribution systems can be obtained for any load condition. Using legacy devices such as voltage regulators and the smart grid features with new components such as renewables (photovoltaics—PVs, wind turbines—WTs), BESS control operations can be performed. One can determine the optimal locations, sizes, power outputs, and the number of devices to be installed in the system by solving objectives such as cost minimization, profit maximization, load maximization, and efficiency maximization.
Optimization problems can be solved using either numerical or analytical methods. Numerical methods are classified into derivative-based and non-derivative methods. Of these, non-derivative methods have gained popularity due to their simplicity and ability to produce near-optimal results. Moreover, non-derivative heuristic algorithms are more successful than numerical algorithms in solving complex problems, especially when the derivative information is not easy to obtain due to the complexity of the functions encountered. We have used four heuristic methods to solve the operation problem in distribution networks. We chose the particle swarm optimization (PSO) method [1] because of its proven record in solving optimization problems since 1995. Three recently developed promising algorithms, Gray Wolf Optimization Algorithm (GWO) [2], Whale Optimization Algorithm (WOA) [3], and Ant Lion Optimization algorithm (ALO) [4], were also used. The main advantages of GWO are as follows. GWO does not require initialization of parameters [5], it is easy to implement due to its simple structure, it has lower memory and computational requirements with the ability to escape from local minima, and it has faster convergence capability, since it reduces the search space during the optimization process by using a smaller number of decision variables [6]. WOA proved to be competitive with several well-known heuristic algorithms using benchmark optimization problems thanks to the small number of parameters and escaping ability from local optimum points [3].
Some educational tools and software packages are used to perform power system analysis, management, and simulation in the literature. These are Power System Toolbox (PST) [7], Power Analysis Toolbox (PAT) [8], Educational Simulation Tool (EST) [9], Power System Analysis Toolbox (PSAT) [10], MatDyn [11], Power System GUI (PowSysGUI) [12], Torrit [13], Internet Technology-based Power System Simulator (InterPSS) [14], and Gym-ANM [15]. Of these, PST, PAT, EST, PSAT, MatDyn, and PowSysGUI run on MATLAB. However, Torrit and Gym-ANM, which are open source and easy to use GUIs, run on Python. The InterPSS project runs in a cloud-based environment, while other projects work offline.
There are many research papers that deal with solving optimization problems in smart power grids. Many of them use heuristic methods because they are simple and applicable to different problems. For example, in [16], the authors use the marine predators algorithm to solve the power source allocation problem in distribution networks. In a recent work, the Moth Flame Optimization algorithm (MFO) was modified to efficiently accommodate fuel cells consisting of wind turbines and photovoltaics [17]. PSO was used in [18] to solve the planning problem in distribution networks by considering economic constraints. Various studies have used an ALO [19,20], GWO [21,22,23], and WOA [24,25] for solving power systems-related problems. In 2016, Trivedi et al. applied the ALO [26], and in 2017, Bentouati et al. applied the WOA [24] for solving the optimal power flow problem. In 2019, an article was published on optimal renewable power placement and sizing using GWO [22]. A combination of GWO with Crow Search Optimization (CSO) was utilized for home appliance scheduling in [27]. In [28], the authors analyzed microgrids consisting of multiple renewable units and a diesel generator and battery considering the energy cost and the probability of insufficient power supply. They formed an optimization problem that was solved by hybridizing PSO and GWO.
Several studies have also been conducted to evaluate the effects of installing tap changers in the distribution system. In these studies, it was found that the use of tap changers to adjust the voltage profile can positively affect the voltage profile [23,29,30,31,32].
Recently, BESS systems have been used in power distribution systems due to several advantages such as the injection/absorption of power. Therefore, researchers focus on the optimal implementation of BESS systems, focusing on optimizing their locations in power systems [33,34] while others focus on optimizing the charging and discharging times of BESSs [35]. In addition, there are also studies that focus on BESS capacity optimization and operating costs [36].
The main contributions of this work can be described as follows.
-
We develop an open source toolbox for power distribution systems by using the classical PSO and several recently developed heuristic algorithms: GWO, WOA, and ALO optimization methods, combined with the free power systems software Matpower.
-
The optimization functions of the toolbox are designed to determine the near optimal set points of tap changer voltage regulators, the charge/discharge behavior of BESS and power output of inverters connected close to PVs on 33- [37], 69- [38], and 141-bus [39] systems.
The rest of the paper is organized as follows: The optimization models are described in Section 2. Section 3 describes the implementation of the optimization methods. Section 4 provides details about the toolbox graphical user interface (GUI). Finally, Section 5 shows the simulation and test results. Lastly, Section 6 concludes the paper.

2. Optimization Models

We use two different optimization models. The first model uses renewable based DGs and tap changers together. The second model uses BESSs and tap changers together.
The first model solves the voltage deviation problem at a given time. The objective function aims to minimize the differences of the sum of the voltage magnitudes of each node to the reference voltage magnitude: 1 p. u. The mathematical expression of this model is given in Equation (1):
m i n i m i z e s u b j e c t   t o i = 1 N | V i 1 | 2 0.95 V i 1.05 P D G i 2 + Q D G i 2 S D G i 2 T m i n T i T m a x
where Vi stands for the voltage magnitude at bus i. PDG and QDG refer to the active and reactive power output of DGs, respectively. SDG represents the apparent power of DG. Ti, Tmin, and Tmax stand for the regulator’s actual tap position, its allowed minimum tap position, and allowed maximum tap position, respectively. The voltage regulation can be done with the help of tap changers. The tap changers can take different values to bring the voltage value closer to 1 p.u. Each step-change changes the voltage value 0.00625 p.u. The maximum and minimum tap changer values are assumed to be ±16.
In the second model, the voltage deviation problem is solved daily by using BESSs and tap changers. A BESS behaves like a load when it draws power from the system and behaves like an energy source when it supplies power to the system. The state of charge (SOC) indicates the available capacity of the BESS. A SOC value of 0% indicates that the BESS is empty, and 100% means fully charged. The mathematical expression of this model is given in Equation (2):
m i n i m i z e s u b j e c t   t o t = 1 24 i = 1 N | V t i 1 | 2 0.95 V t i 1.05 T m i n T t i T m a x S O C m i n B t i S O C m a x .
Bti represents the position of the BESS at time t. SOCmin and SOCmax represent the BESS’s minimum and maximum state of charge limits.

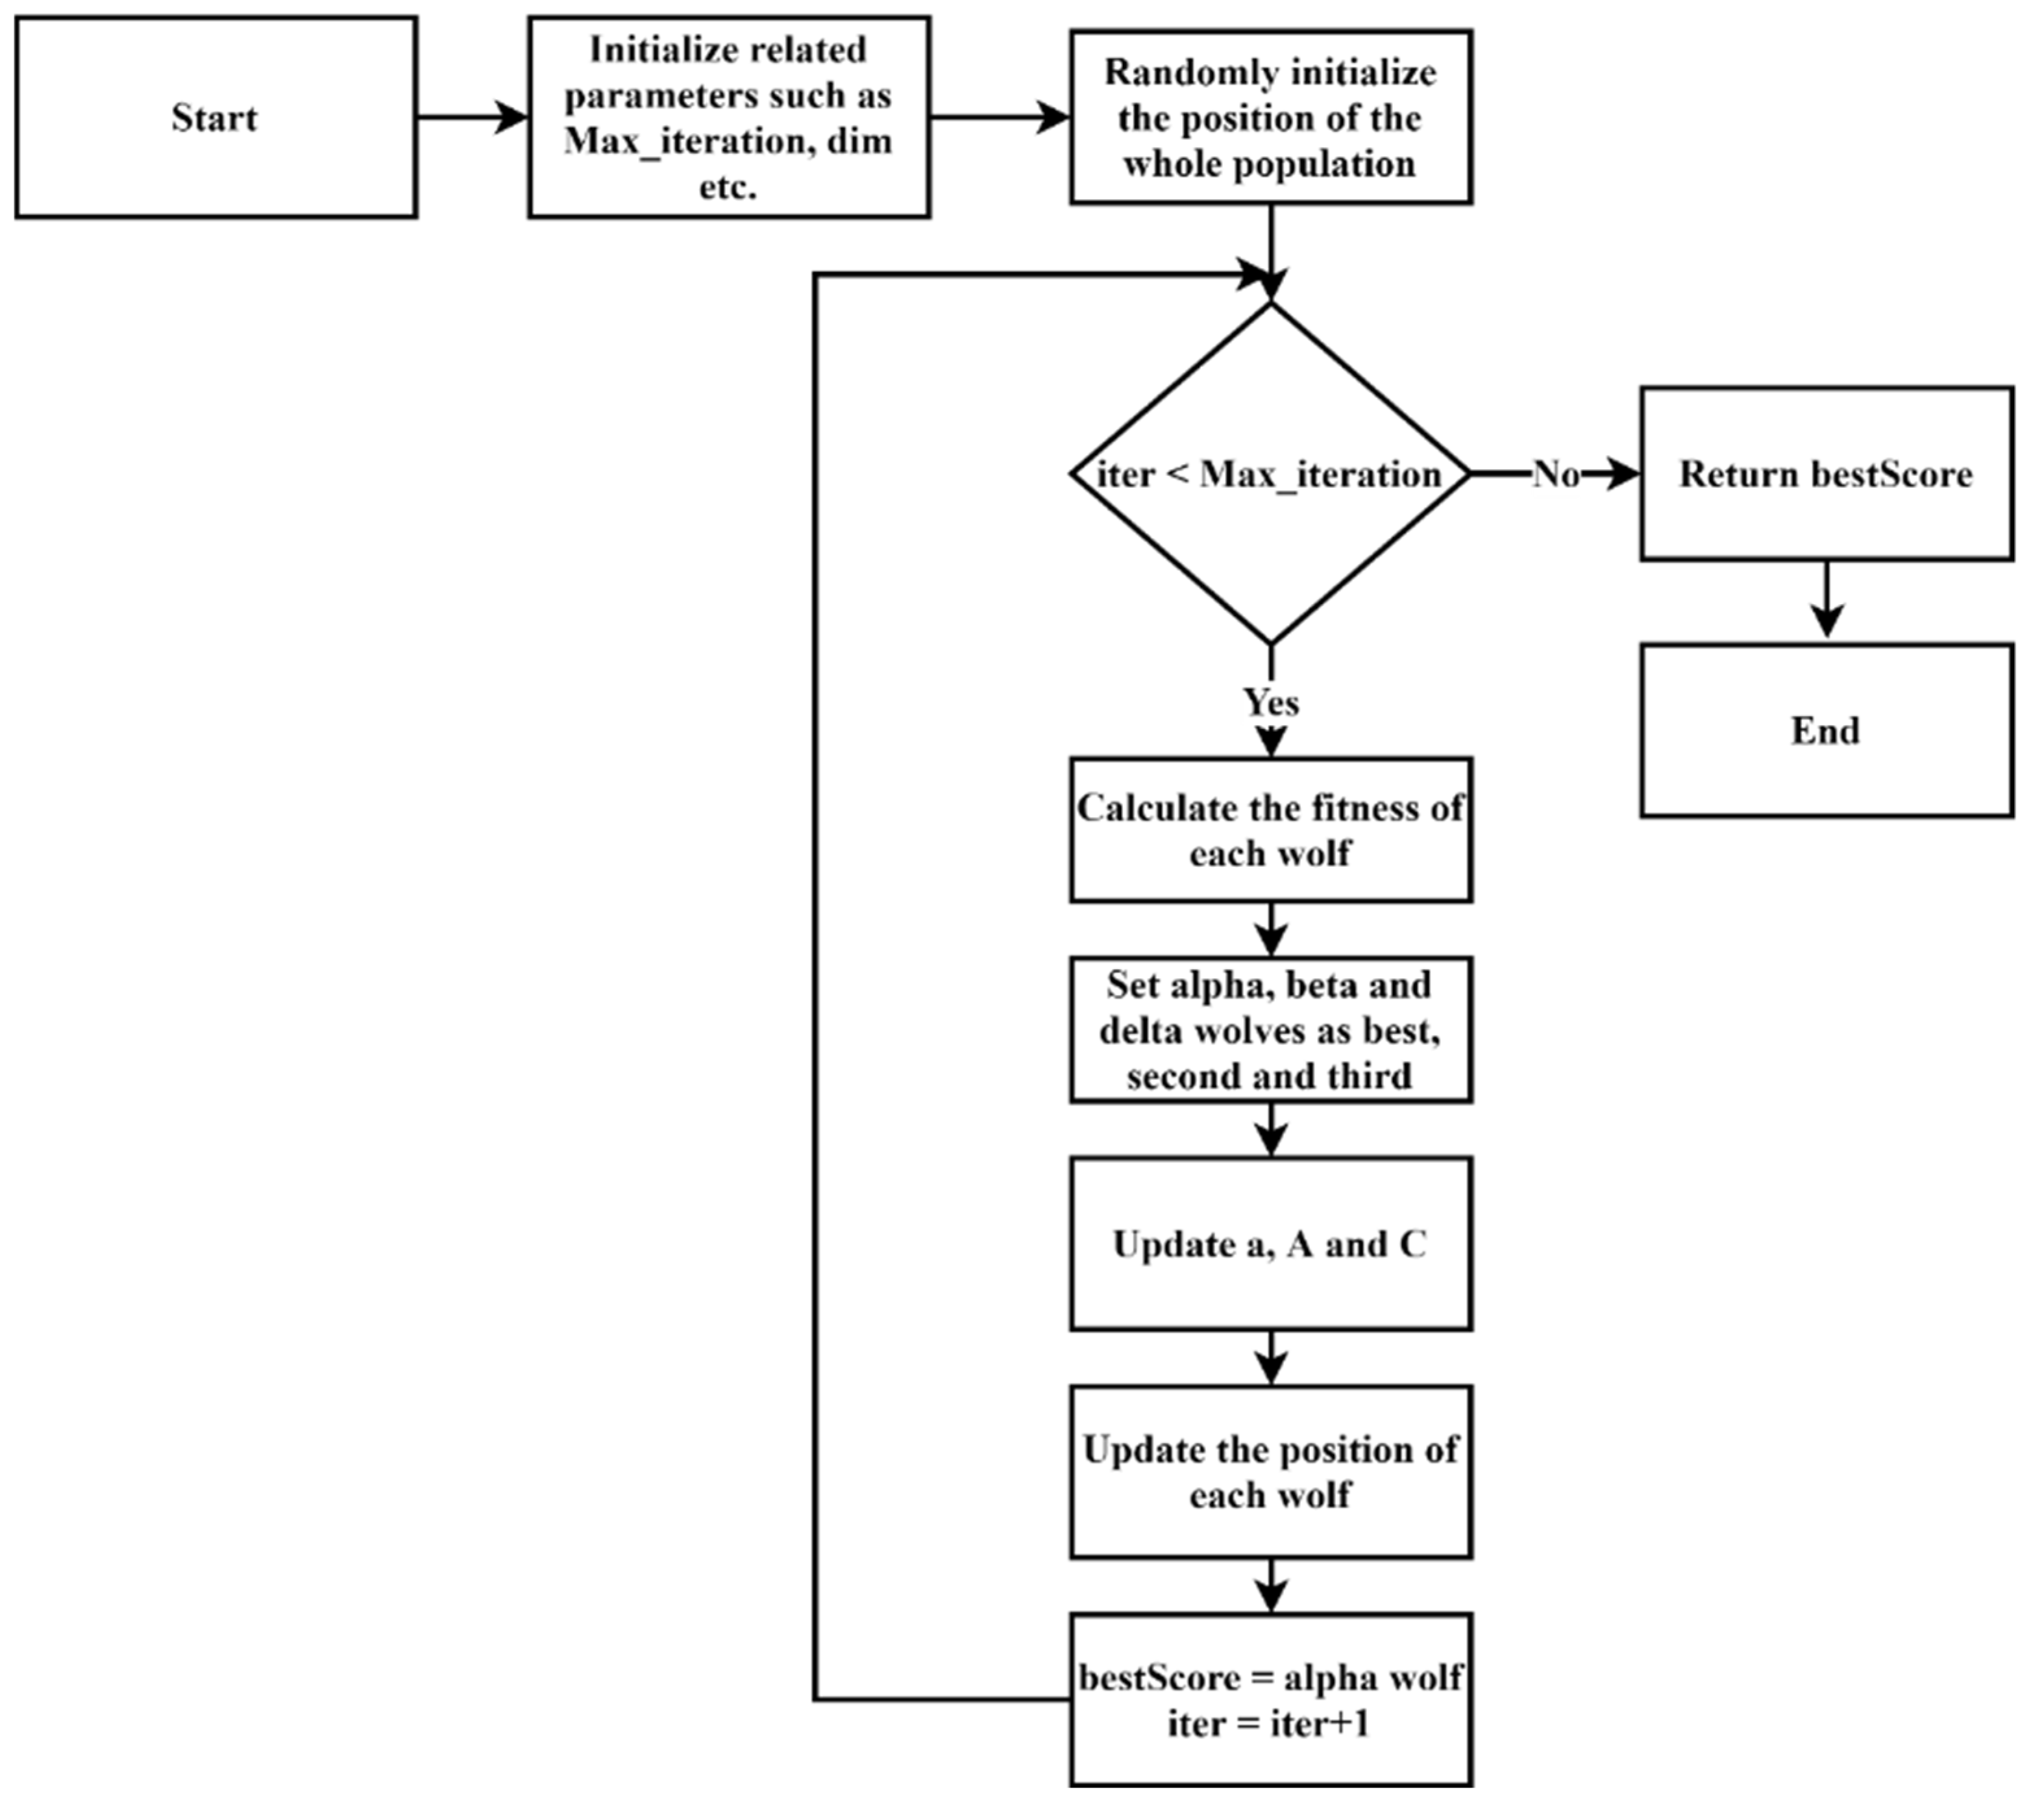
3. Implementation of the Optimization Methods

The toolbox uses four optimization methods based on the source codes we developed, namely PSO, GWO, WOA, and ALO. The source codes of optimization methods are publicly available on the indicated websites [40,41,42].
GWO is a nature-inspired optimization method that mimics the gray wolves’ strategy and leadership during hunting and was developed by Mirjalili in 2014. Gray wolves hierarchically consist of four groups as alpha (α), beta (β), delta (δ), and omega (ω) wolves. When hunting, they act as a group, and the alpha wolf leads the pack. The method aims to achieve the near-optimal solution of the optimization problem using alpha, beta, and delta wolves [2].
The optimization process consists of encircling, hunting, and attacking steps. During the optimization process, α represents the best solution. The second and third solutions are accepted as β and δ, respectively. Equations (3) and (4) are used to express the encircling of the prey [2].
D = | C X p ( t ) X ( t ) |
X ( t + 1 ) = X p ( t ) A D
where t is the current number of iterations, X p is the position of the prey, X is the position vector of a gray wolf. A and C express the vector coefficients. These vectors are calculated as shown in the following Equations (5) and (6) [2]:
A = a ( 2 r 1 1 )
C = 2 r 2
In Equations (5) and (6), r 1 and r 2 [0,1] refer to the random number and a refers to the coefficient, which decreases linearly from 2 to 0 as the iteration proceeds [2].
In the hunting step, at each iteration, the prey is estimated based on the distance of positions α, β, and δ from the prey. Then, the positions of the elements are updated. This situation is represented as follows [2]:
D α = | C 1 X α X ( t ) |
D β = | C 2 X β X ( t ) |
D δ = | C 3 X δ X ( t ) |
X 1 = | X α A 1 D α |
X 2 = | X β A 2 D β |    
X 3 = | X δ A 3 D δ |
X ( t + 1 ) = X 1 + X 2 + X 3 3
The attack step begins depending on the value of A . The values of A are between [−2, 2]. If the value of A is greater than 1, the wolves move away from the prey and search for more suitable prey. When the value of A is less than 1, the gray wolves start attacking the prey. The flowchart for the GWO algorithm is shown in Figure 1.
The WOA optimization method is based on a particular species of whale, the humpback whales. They have a unique feeding behavior called air bubble netting. The air bubbles they create as they breathe underwater collect the prey. Then, the whale moves toward the surface and creates a circle of bubbles containing the prey as it surfaces. Mirjalili and Lewis developed this optimization method in 2016 [2].
The ALO optimization method mimics the movements of hunting ant lions. In this method, the prey is the ant, and the hunter is the ant lion. Ant lions create a cone-shaped trap by drawing a circular path of their victims’ territory. Then, they then hide by burrowing into this trap. The ant lions start throwing sand at the victims to prevent them from escaping the trap. This optimization method was developed in 2015 [4].
The steps of optimization methods WOA and ALO are similar to GWO. Similar to the GWO method, the methods WOA and ALO first determine the size of the population and the position of each search agent. Then, the methods search for the near-optimal results in each iteration.
The PSO method was proposed in the 1990s by Kennedy and Eberhard [1] and mimics the foraging behavior of flocks of birds. It is one of the classical metaheuristic algorithms and uses both the local and global best values to update the positions reaching the optimal or near optimal points.
Our toolbox uses a MATLAB-based free power system simulation package MATPOWER [43,44] to calculate power flow for the first model. For the second model, we use a forward-backward sweep method-based power flow model.
All optimization methods in the toolbox are open source, so it is possible to make various improvements. Optimization methods require various parameters to work, such as the number of search agents, lower and upper search bounds, and objective functions. They compute continuous variables within the lower and upper search bounds. The values that DG and BESSs can take are continuous values, but tap changers are integer values. To obtain near-optimal tap changer settings, we use rounding operations when evaluating the objective function; for continuous variables, we do not perform any additional operations.
The optimization methods store the near-optimal results computed in each iteration and select the minimum of them. However, they do not store the SOC changes in the BESSs, and the tap setting changes when calculating the near-optimal result. The toolbox stores and displays the values of the changes in the SOC of the BESSs and the tap changer values obtained by the optimization methods.
The user of the toolbox can set the variables used by the optimization methods (size of the population, number of search agents, etc.). The toolbox defines the parameter values of the algorithm at startup. Then, the corresponding algorithm runs according to the values set by the user. The near-optimal values calculated by the algorithm are returned to the toolbox, and based on these values, the simulation is performed. The toolbox shows the changes between the base case and the near-optimal case. Figure 2 shows the flowchart of the developed toolbox.

4. Graphical User Interface

The toolbox runs on MATLAB and was developed using the MATLAB App Designer tool. There are two different modes of simulation in the application. In the first mode, the toolbox minimizes the voltage deviation using DG and the tap changer; in the second mode, the toolbox minimizes the voltage deviation using BESS and the tap changer. The user should specify different information such as the number of iterations, the number of search agents, DG, BESS, and tap changer positions depending on the mode selected. The program uses 33-, 69-, and 141-bus test systems during the analysis. As can be seen from Figure 3, the toolbox consists of three panels. The first of these panels is the settings panel to control program settings. The second is the preview window, which displays the drawing of the selected test system. The last one is the results window, which displays the optimization results.

4.1. Settings Panel

This panel allows you to adjust the settings. The user can change the optimization model, system load information, locations, and the numbers of DGs, tap changers, and BESSs here. Figure 4 shows a screenshot of the panel. We show different setting groups with numbers from 1 to 13.
The meanings and usage rules of use of these fields are as follows:
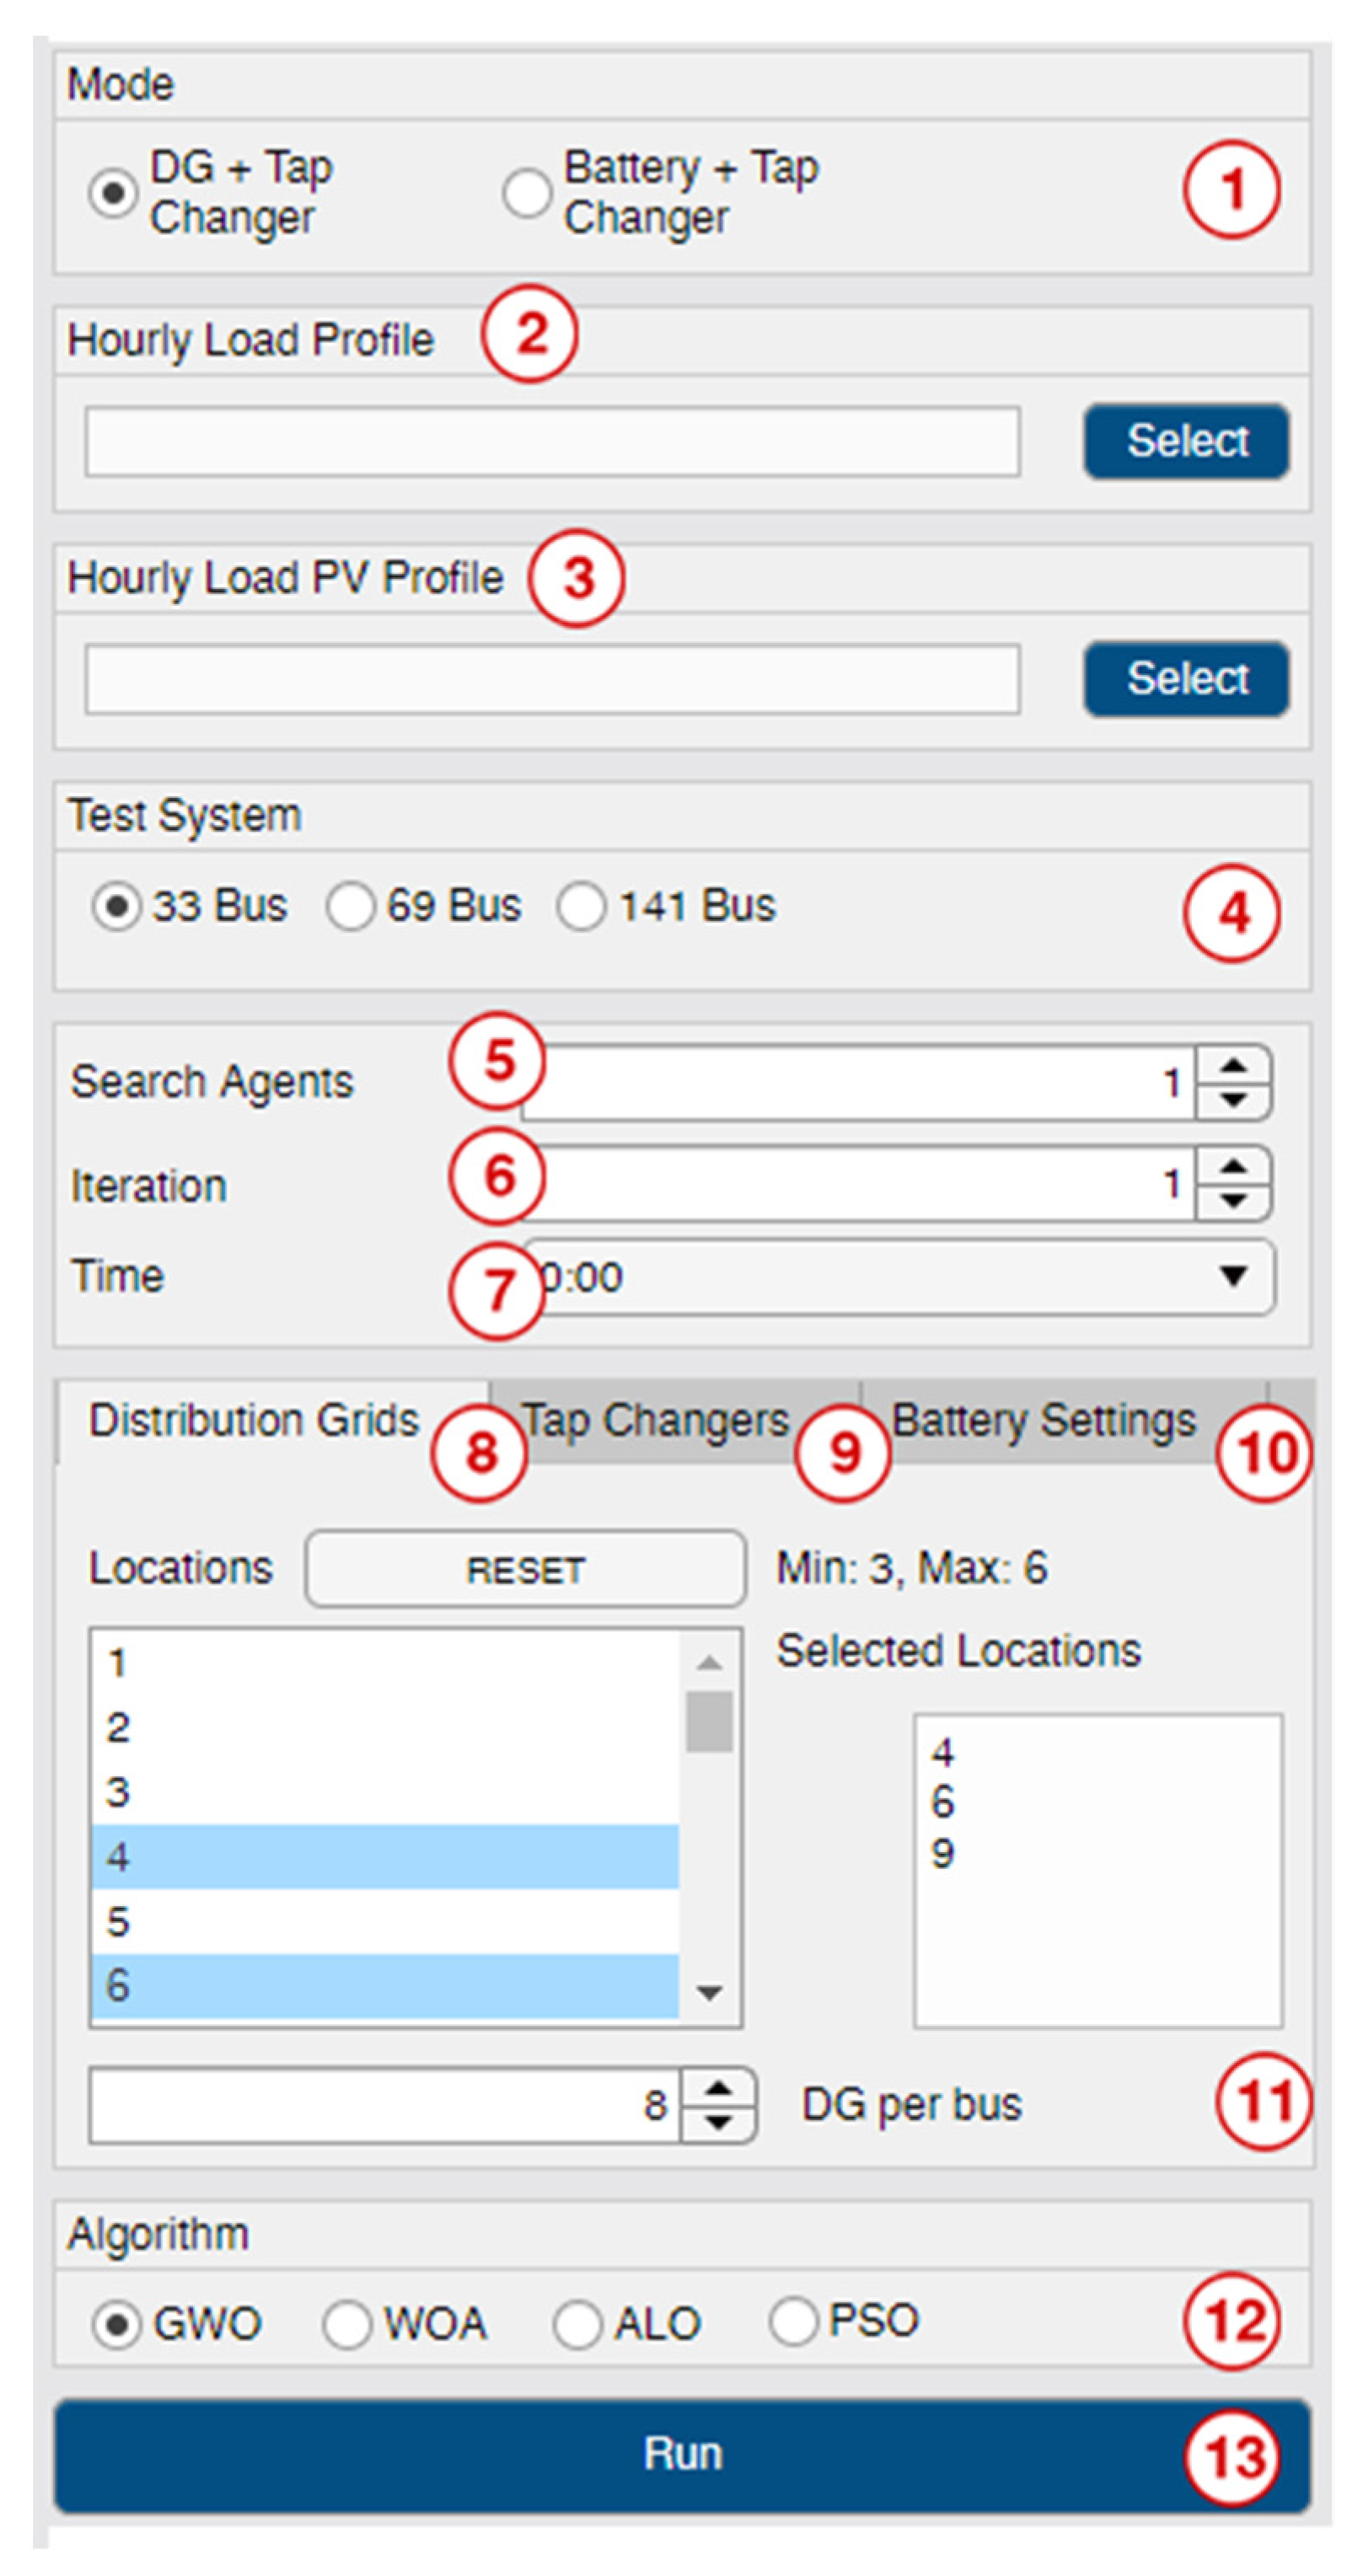
  • The first field specifies the mode in which the program runs. DG and the tap changer mode operates hourly. BESS and the tap changer mode operates daily. When the mode is changed, the settings menu also changes. Settings that cannot be used in the selected mode are hidden or disabled in the menu;
  • Daily power consumption data should be defined in the test system to perform optimization. Since the system uses a 1 h resolution, one has to upload 24 h load data to this field. The data for each hour should be separated by commas. This file can have an extension of TXT or CSV;
  • In DG and tap changer mode, the system requires daily power output data of the DG type used. All definitions and restrictions that apply to the previous field also apply to this field. Note that this field is not used if DG mode is not selected;
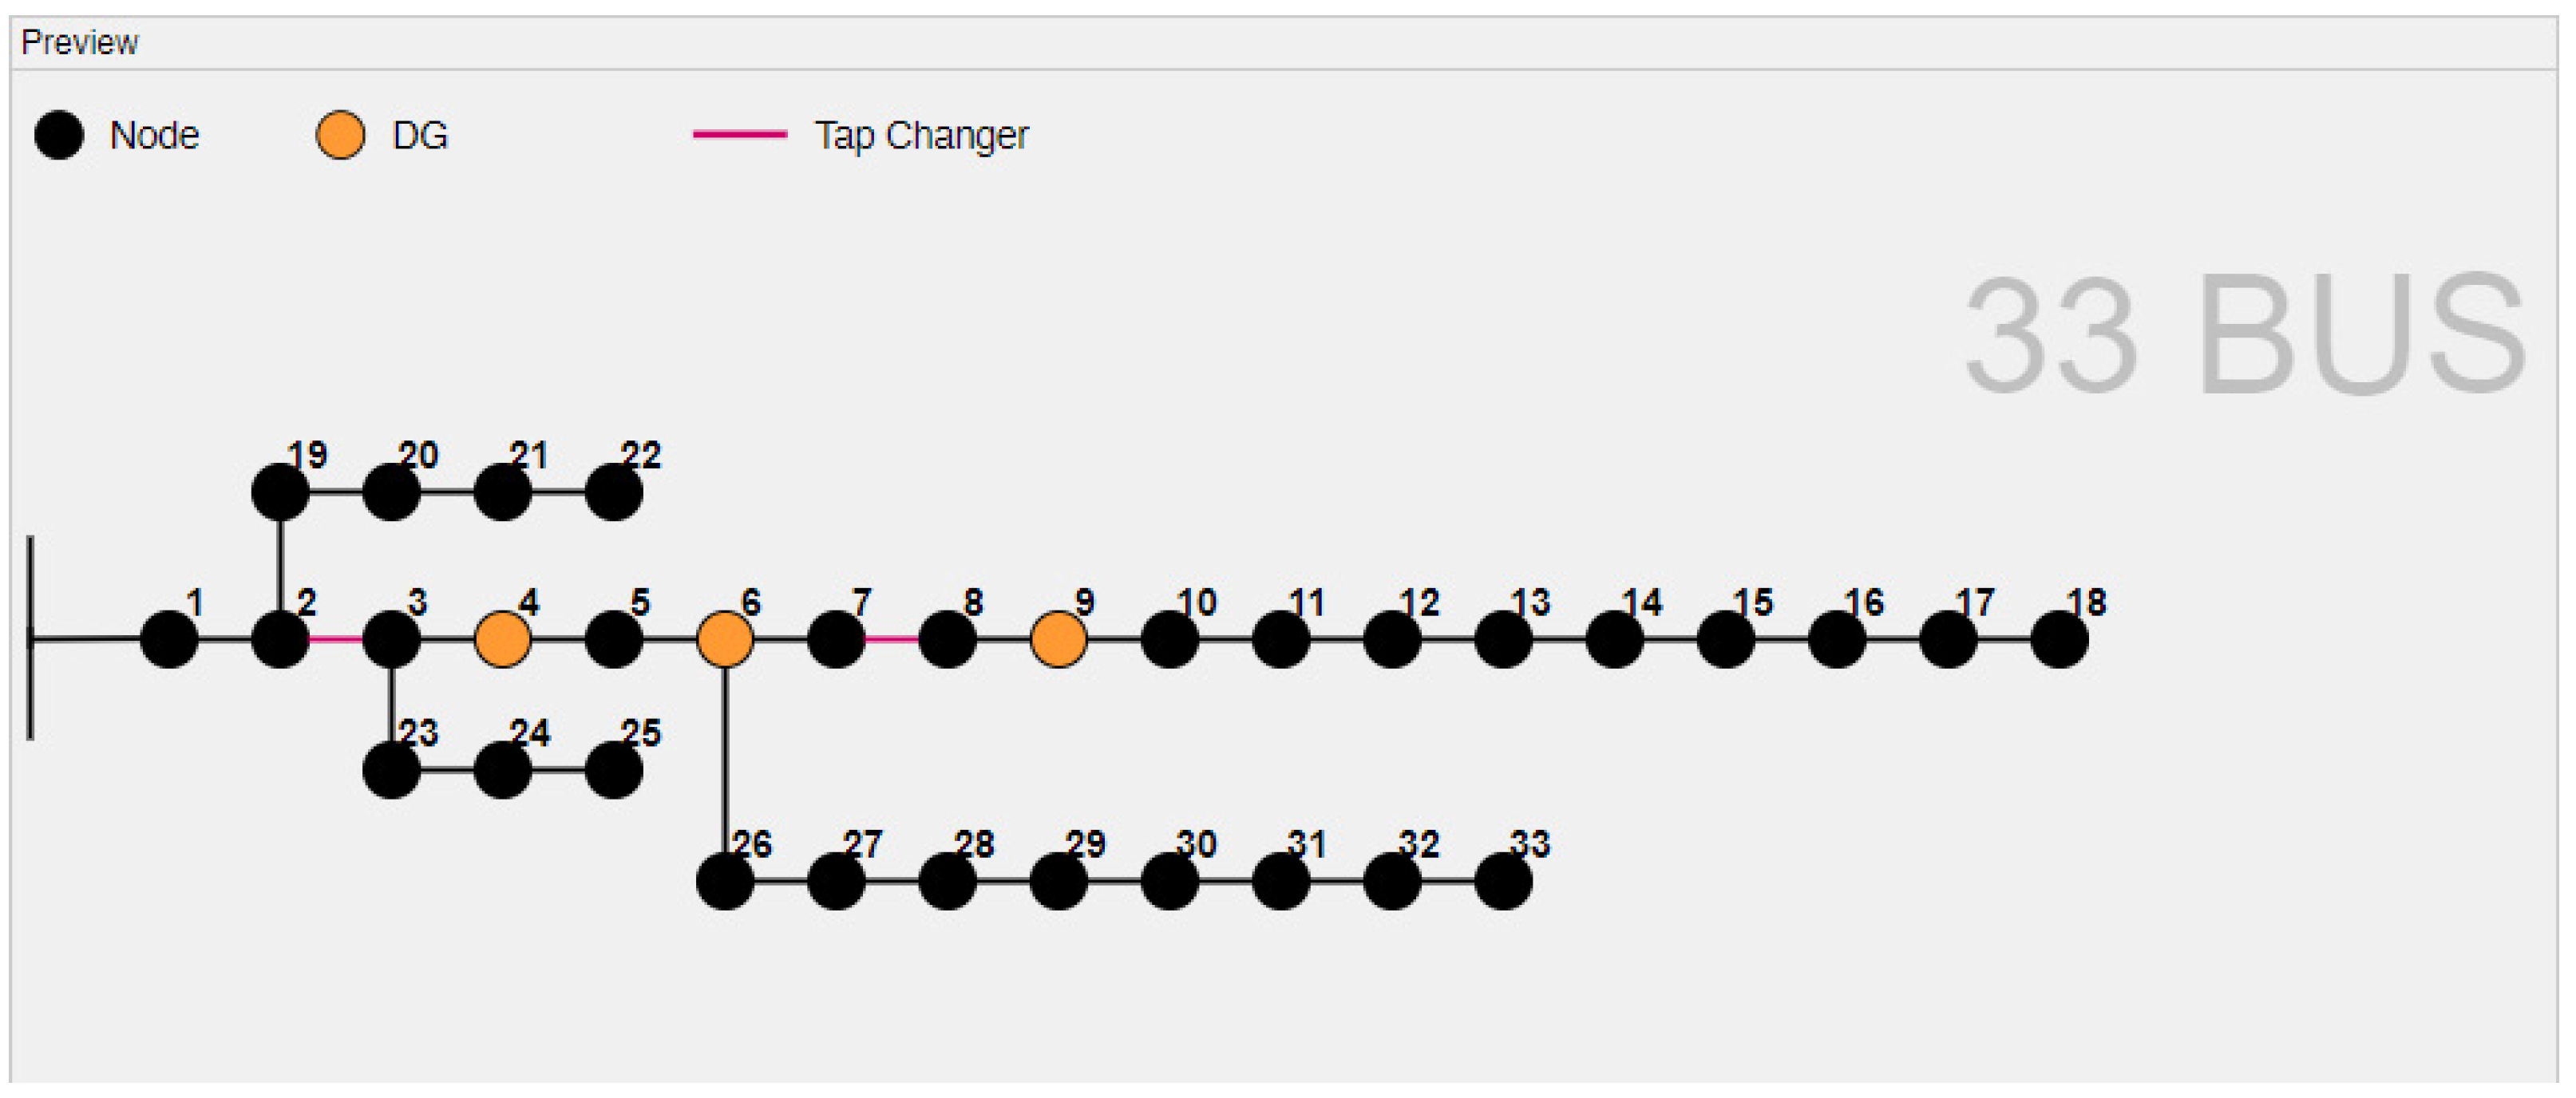
  • This section displays the available test systems, namely 33-bus, 69-bus, and 141-bus. The user selects the test system to be used;
  • This field determines the number of search agents to be used during the optimization process. If the user selects many search agents, the probability of obtaining a near-optimal result increases; however, the computation time also increases;
  • This field determines the number of iterations during the optimization;
  • If DG and the tap changer mode are selected, this field allows specifying at what time in the 24 h period the optimization should be performed;
  • This field determines the bus location of the DG added to the test system. Each selected bus appears in the next text box. Users can select multiple buses by holding down the CTRL key. They can clear all their selection by pressing the reset button. If BESS and the step mode are selected, BESS will be selected in this instead of DG;
  • The tap changers are not connected to the buses but to the lines between the buses. This field identifies the lines in the selected test system that are to be added to the tap changer. Each selected line appears in the next text box;
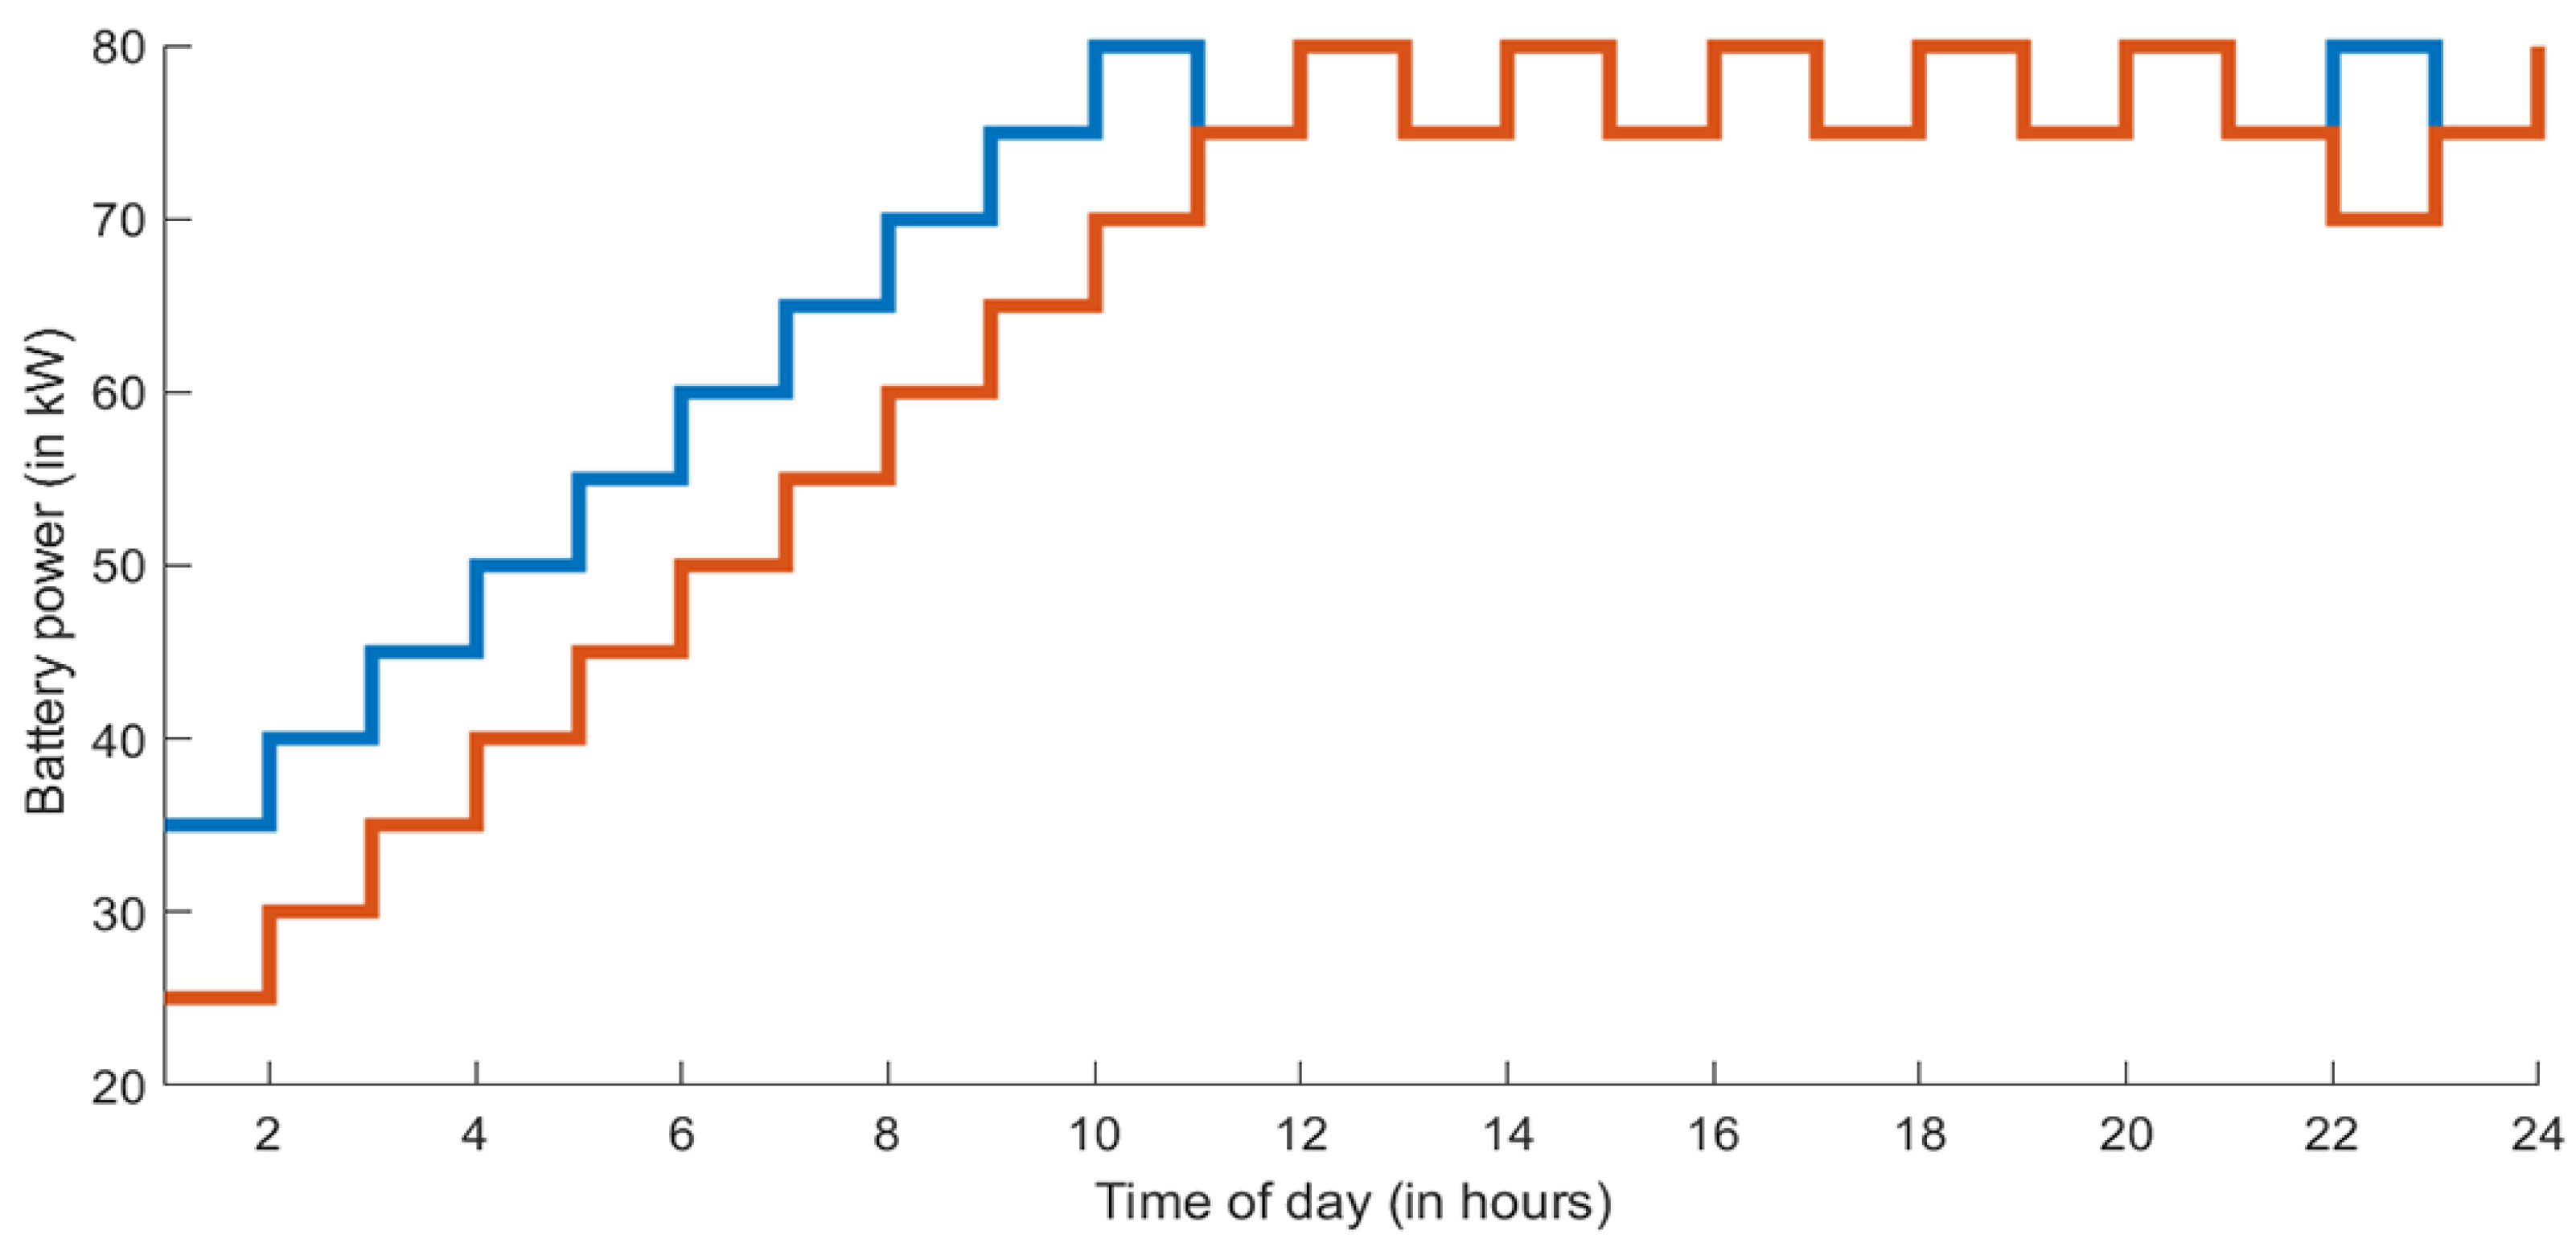
  • In the default settings, the output power of the BESSs is set to 30 kW and decreases or increases by 5 kW per hour depending on the demand of the system. The minimum charge level of the BESSs is 20 kW, and the maximum charge level of the BESSs is 80 kW. This section allows you to adjust the settings for the BESSs. This tab only works when the BESS and tap changer mode is active;
  • The user can add more than one DG or BESS with the same characteristics to the system. The number of DGs or BESSs can be set in this area;
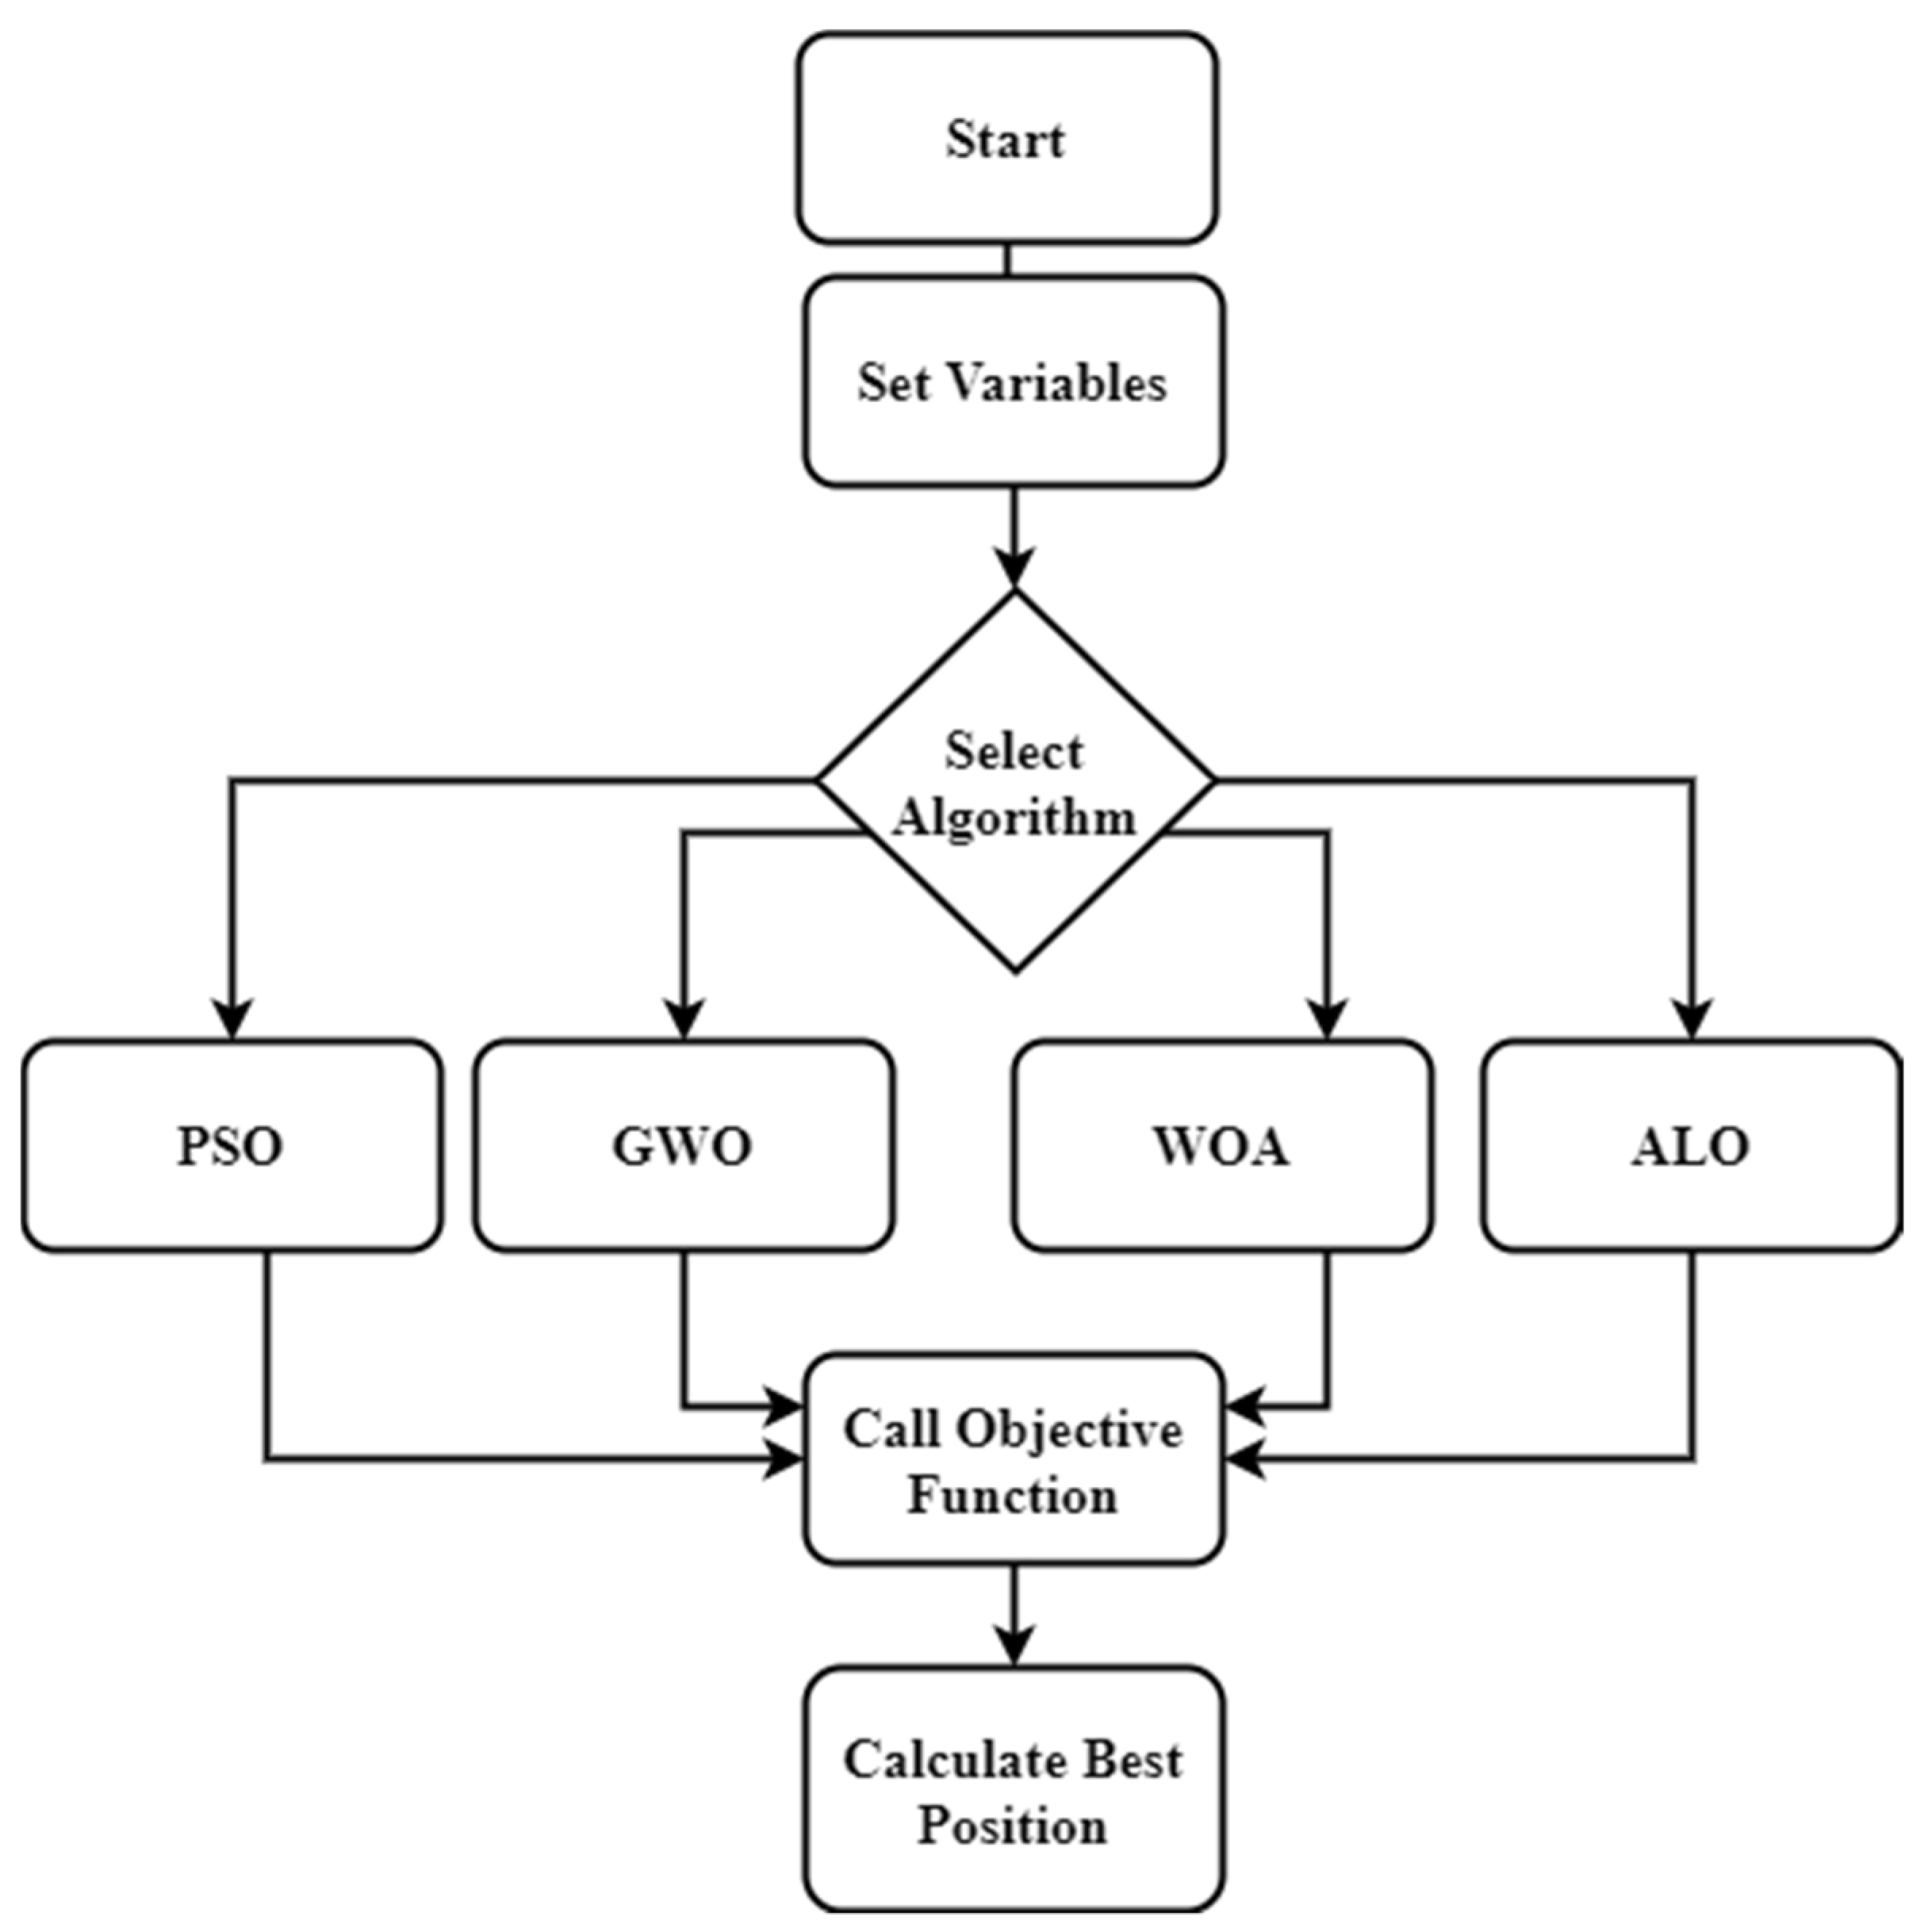
  • This field is used to select the optimization algorithm (GWO, ALO, WOA, PSO) to be used when running the program;
  • The optimization is performed by pressing the key. If there is an error in the selected values, an error message is displayed after pressing this button. If there is no error, the selected algorithm will be executed.
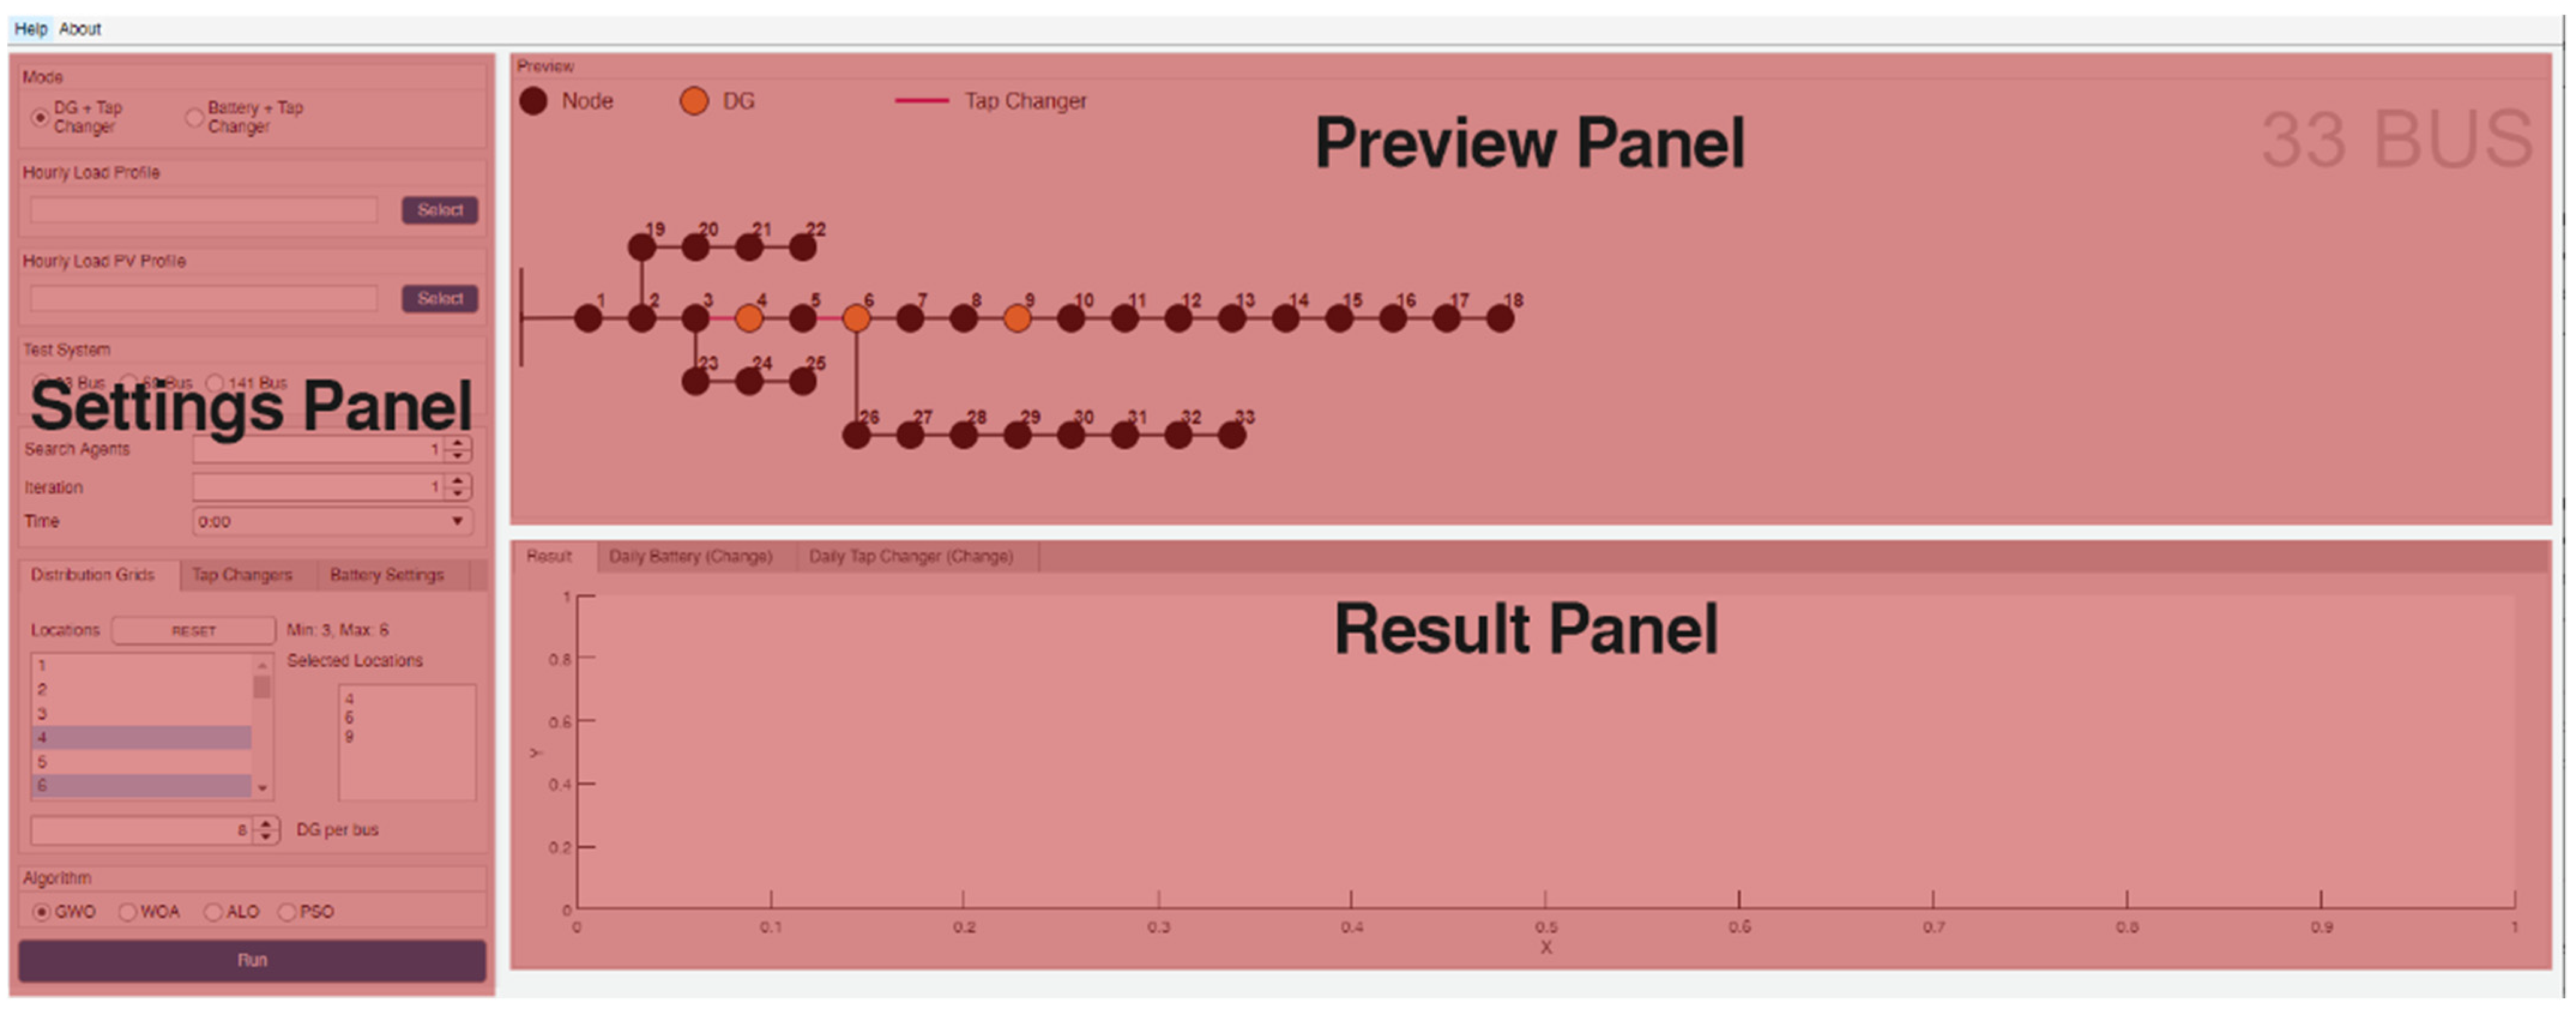
4.2. Preview Panel

A visual preview of the DGs, BESSs, and tap changers placed in the selected distribution system appears in the preview window. In the visual preview, the bus locations and lines are shown in black, while DGs and BESSs in the system are shown in orange, and the tap changers are shown in red. DG and BESSs are located at the bus positions and the tap changers are located at the lines. Figure 5 shows a screenshot of the preview panel.
We used draw.io [45] to create the single line diagram of the distribution test systems and saved the diagram in SVG format. One can use the following steps to insert a new single-line diagram of a distribution test system.
  • Draw the test system schematic on draw.io or a similar website;
  • Export the single line diagram using the SVG extension. When exporting, make sure that this file is transparent;
  • Copy an HTML file from the CasePreview folder and rename the file name to “preview-{CASE_NAME}.html”;
  • Add the source code of the SVG file into the HTML document.

4.3. Result Panel

The result of the simulations is displayed in the results panel. There are three tabs in this panel. The titles of these tabs are “Result”, “Daily BESS (Change)”, and “Daily Tap Changer (Change)”. The contents of the tabs change depending on the mode selected. The “Daily BESS (Change)” and “Daily Tap Changer (Change)” tabs only work when the “BESS and Tap Changer” mode is selected. Depending on the mode selected, the following graphics are displayed:
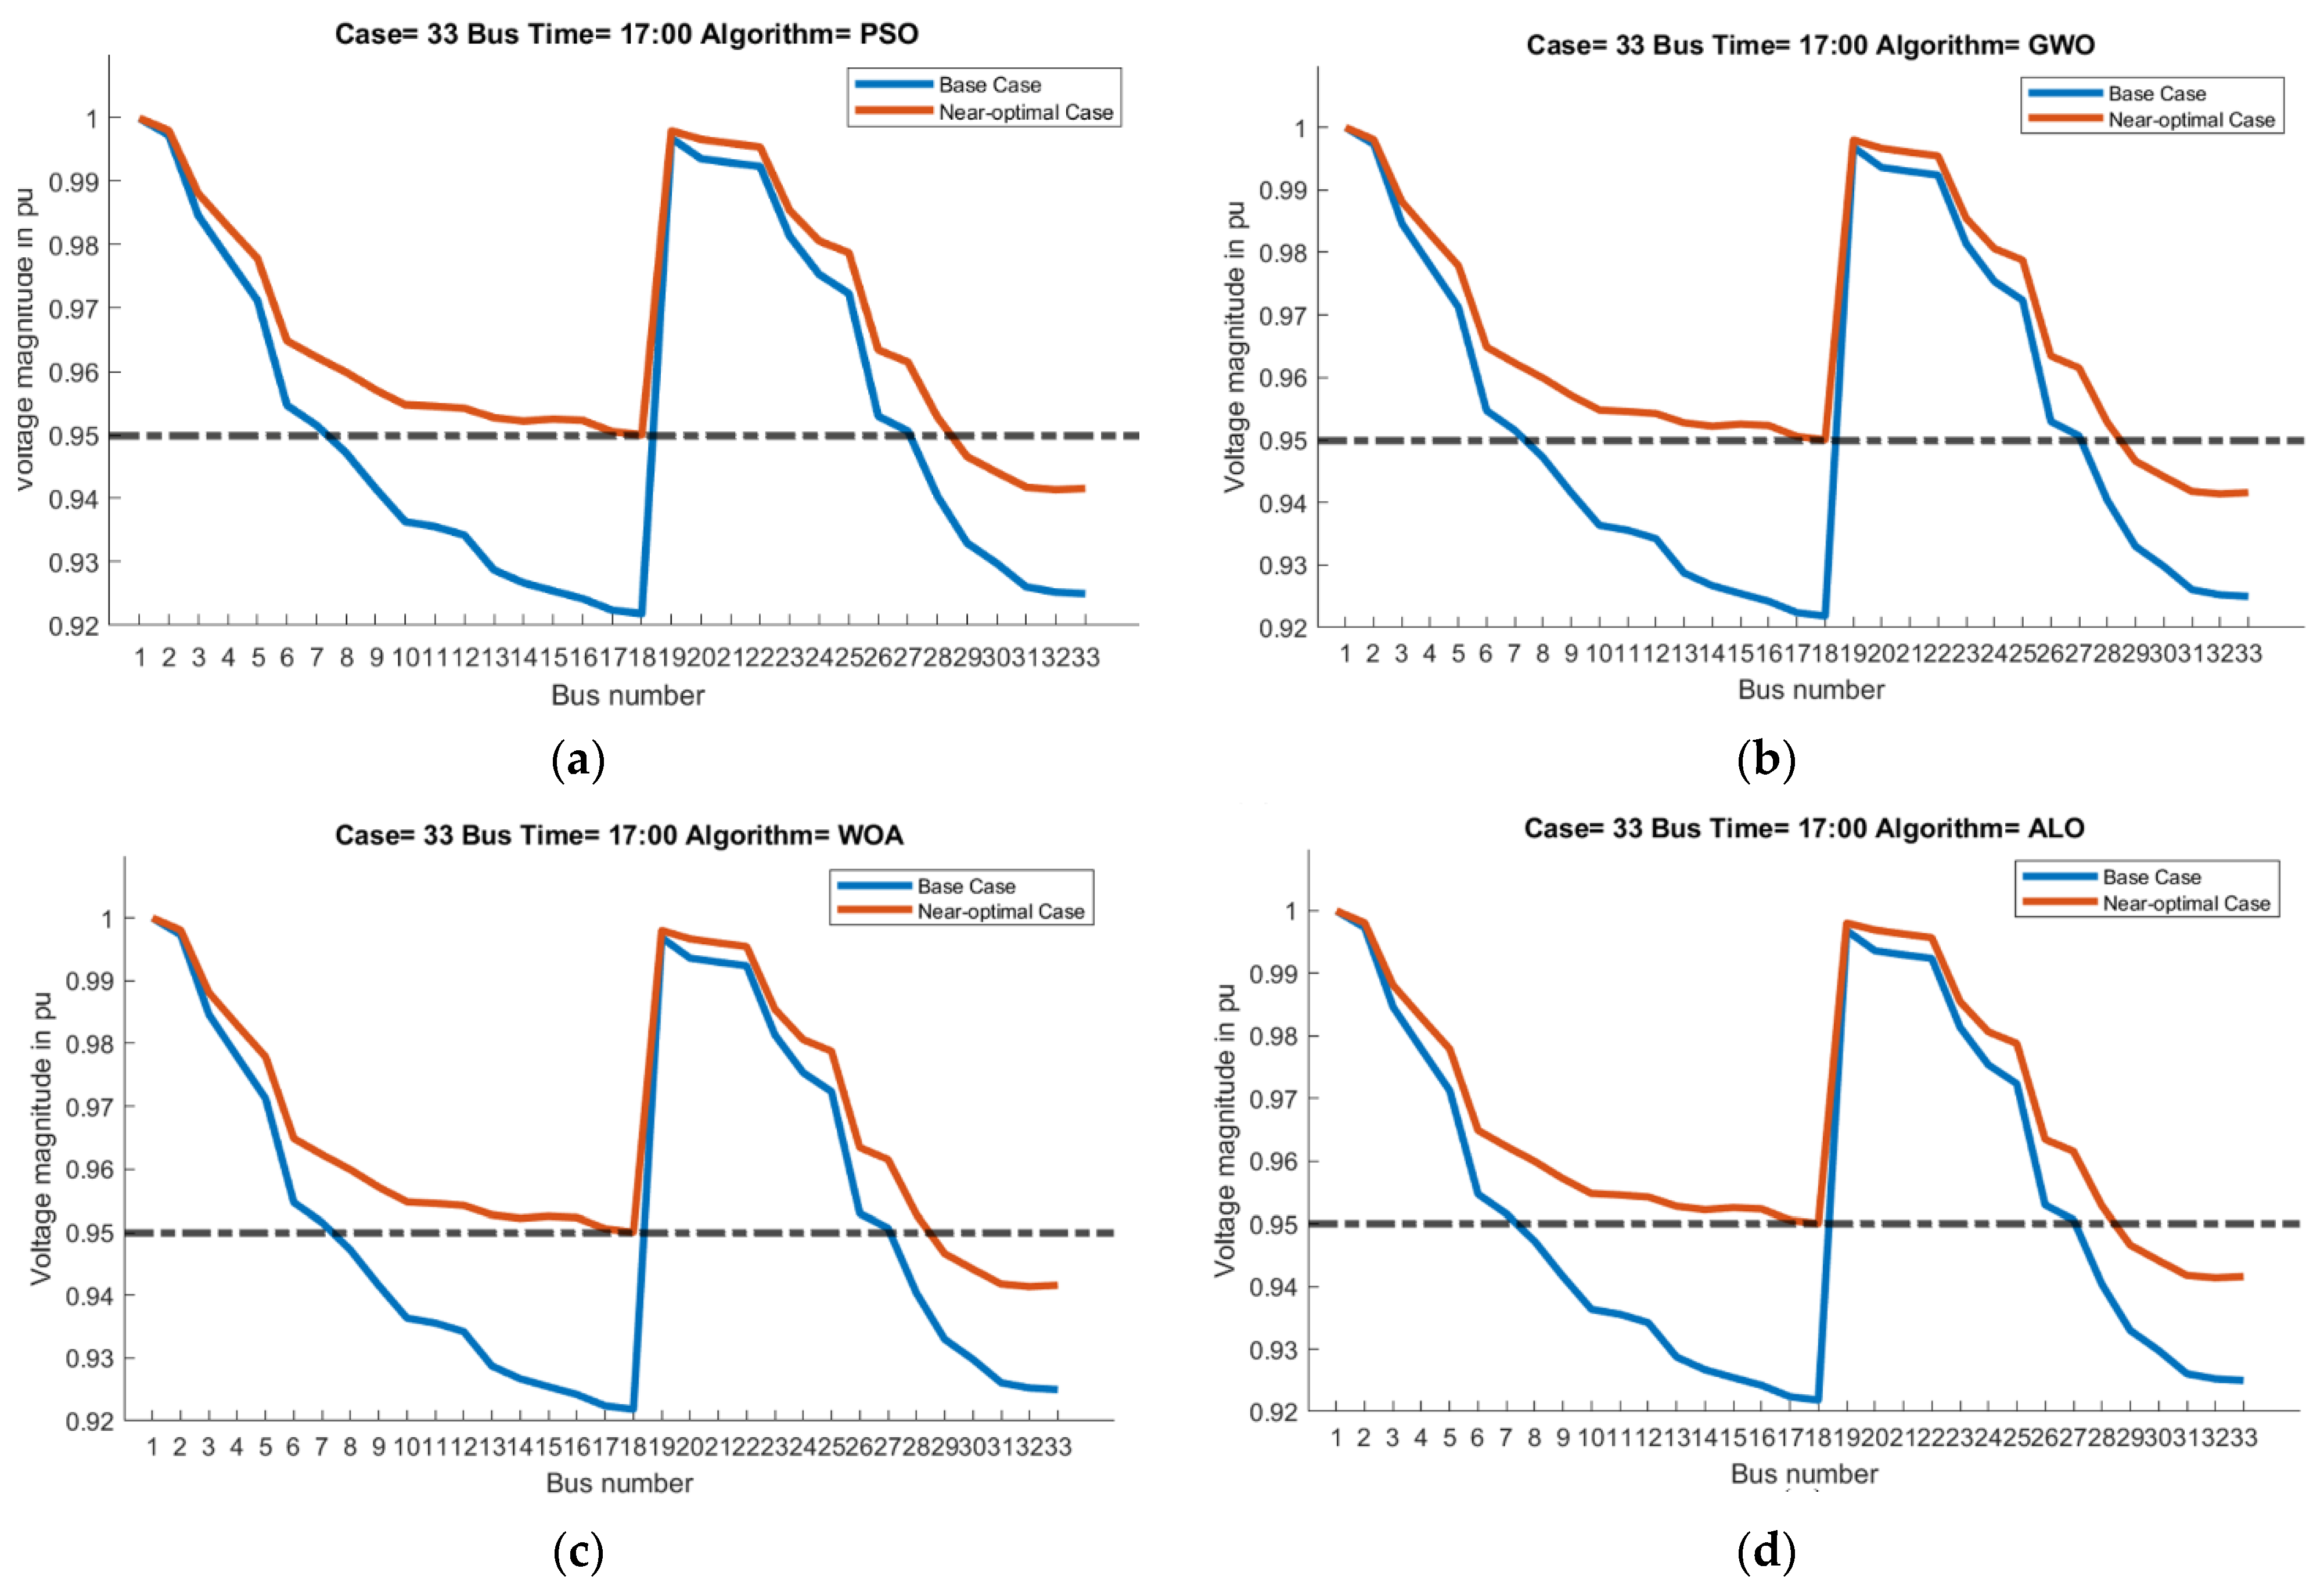
  • When DG and tap changer mode is selected:
    • A graph is displayed showing the voltage magnitude in pu for 24 h between the base case and the optimized case
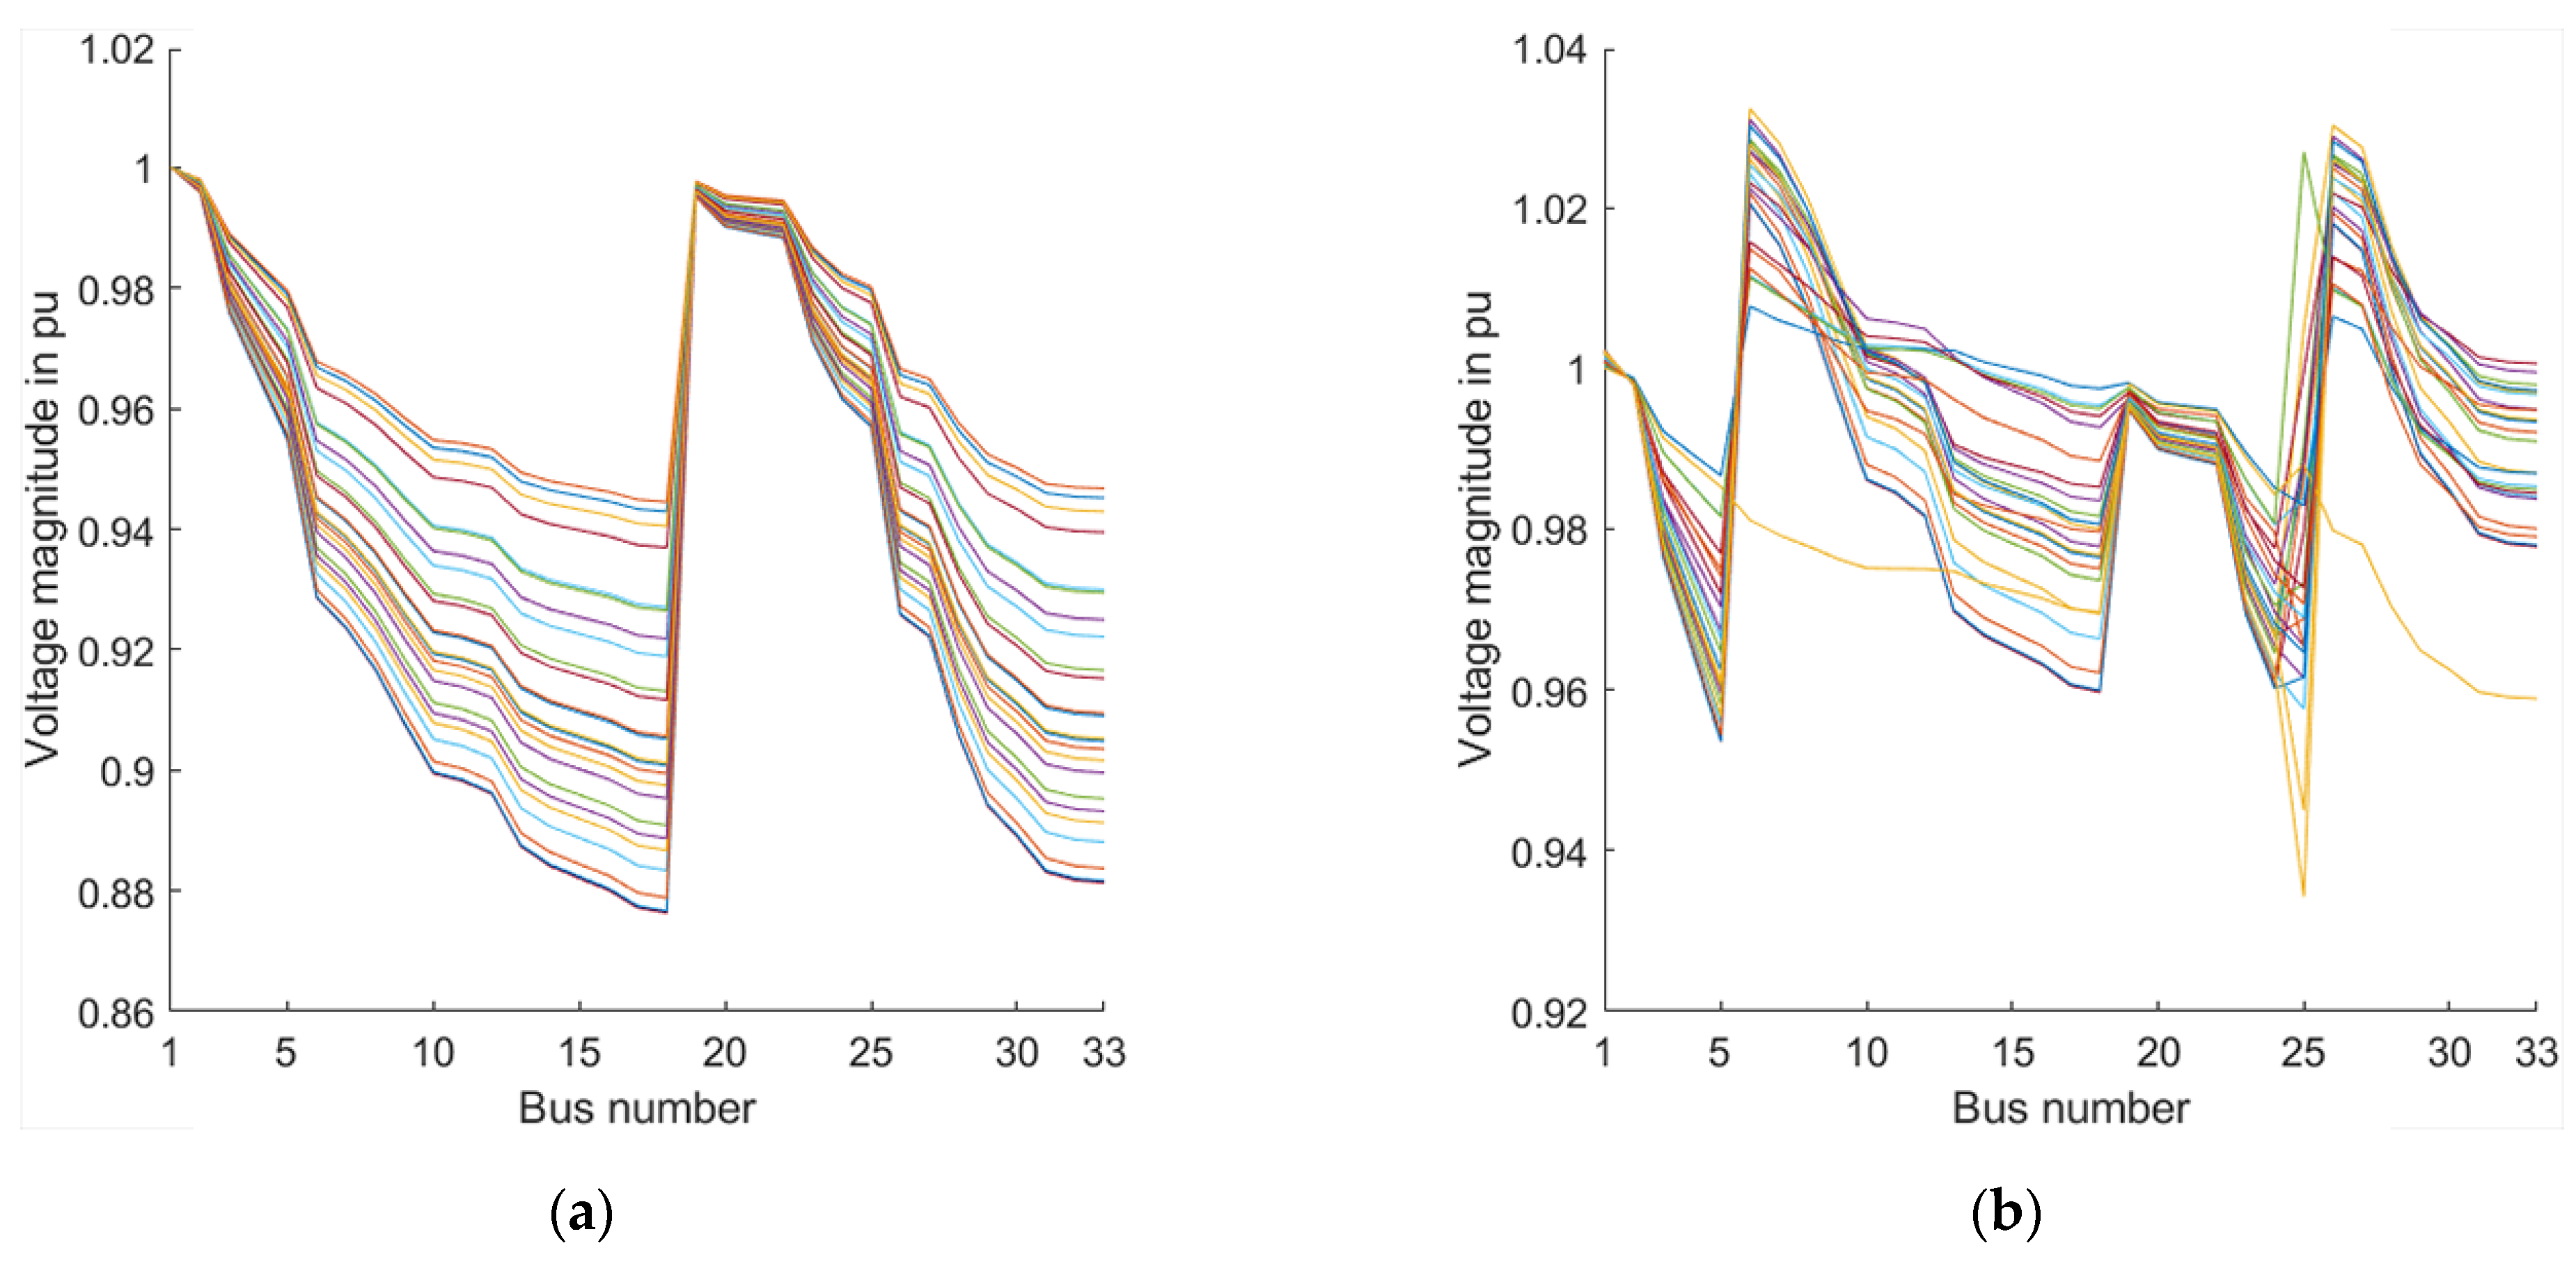
  • When BESS and tap changer mode is selected:
    • Two different graphs are drawn for of the base case and the optimized case showing the voltage magnitude in pu;
    • The graph of the power changes of the BESSs added to the system as a function of time of day is displayed;
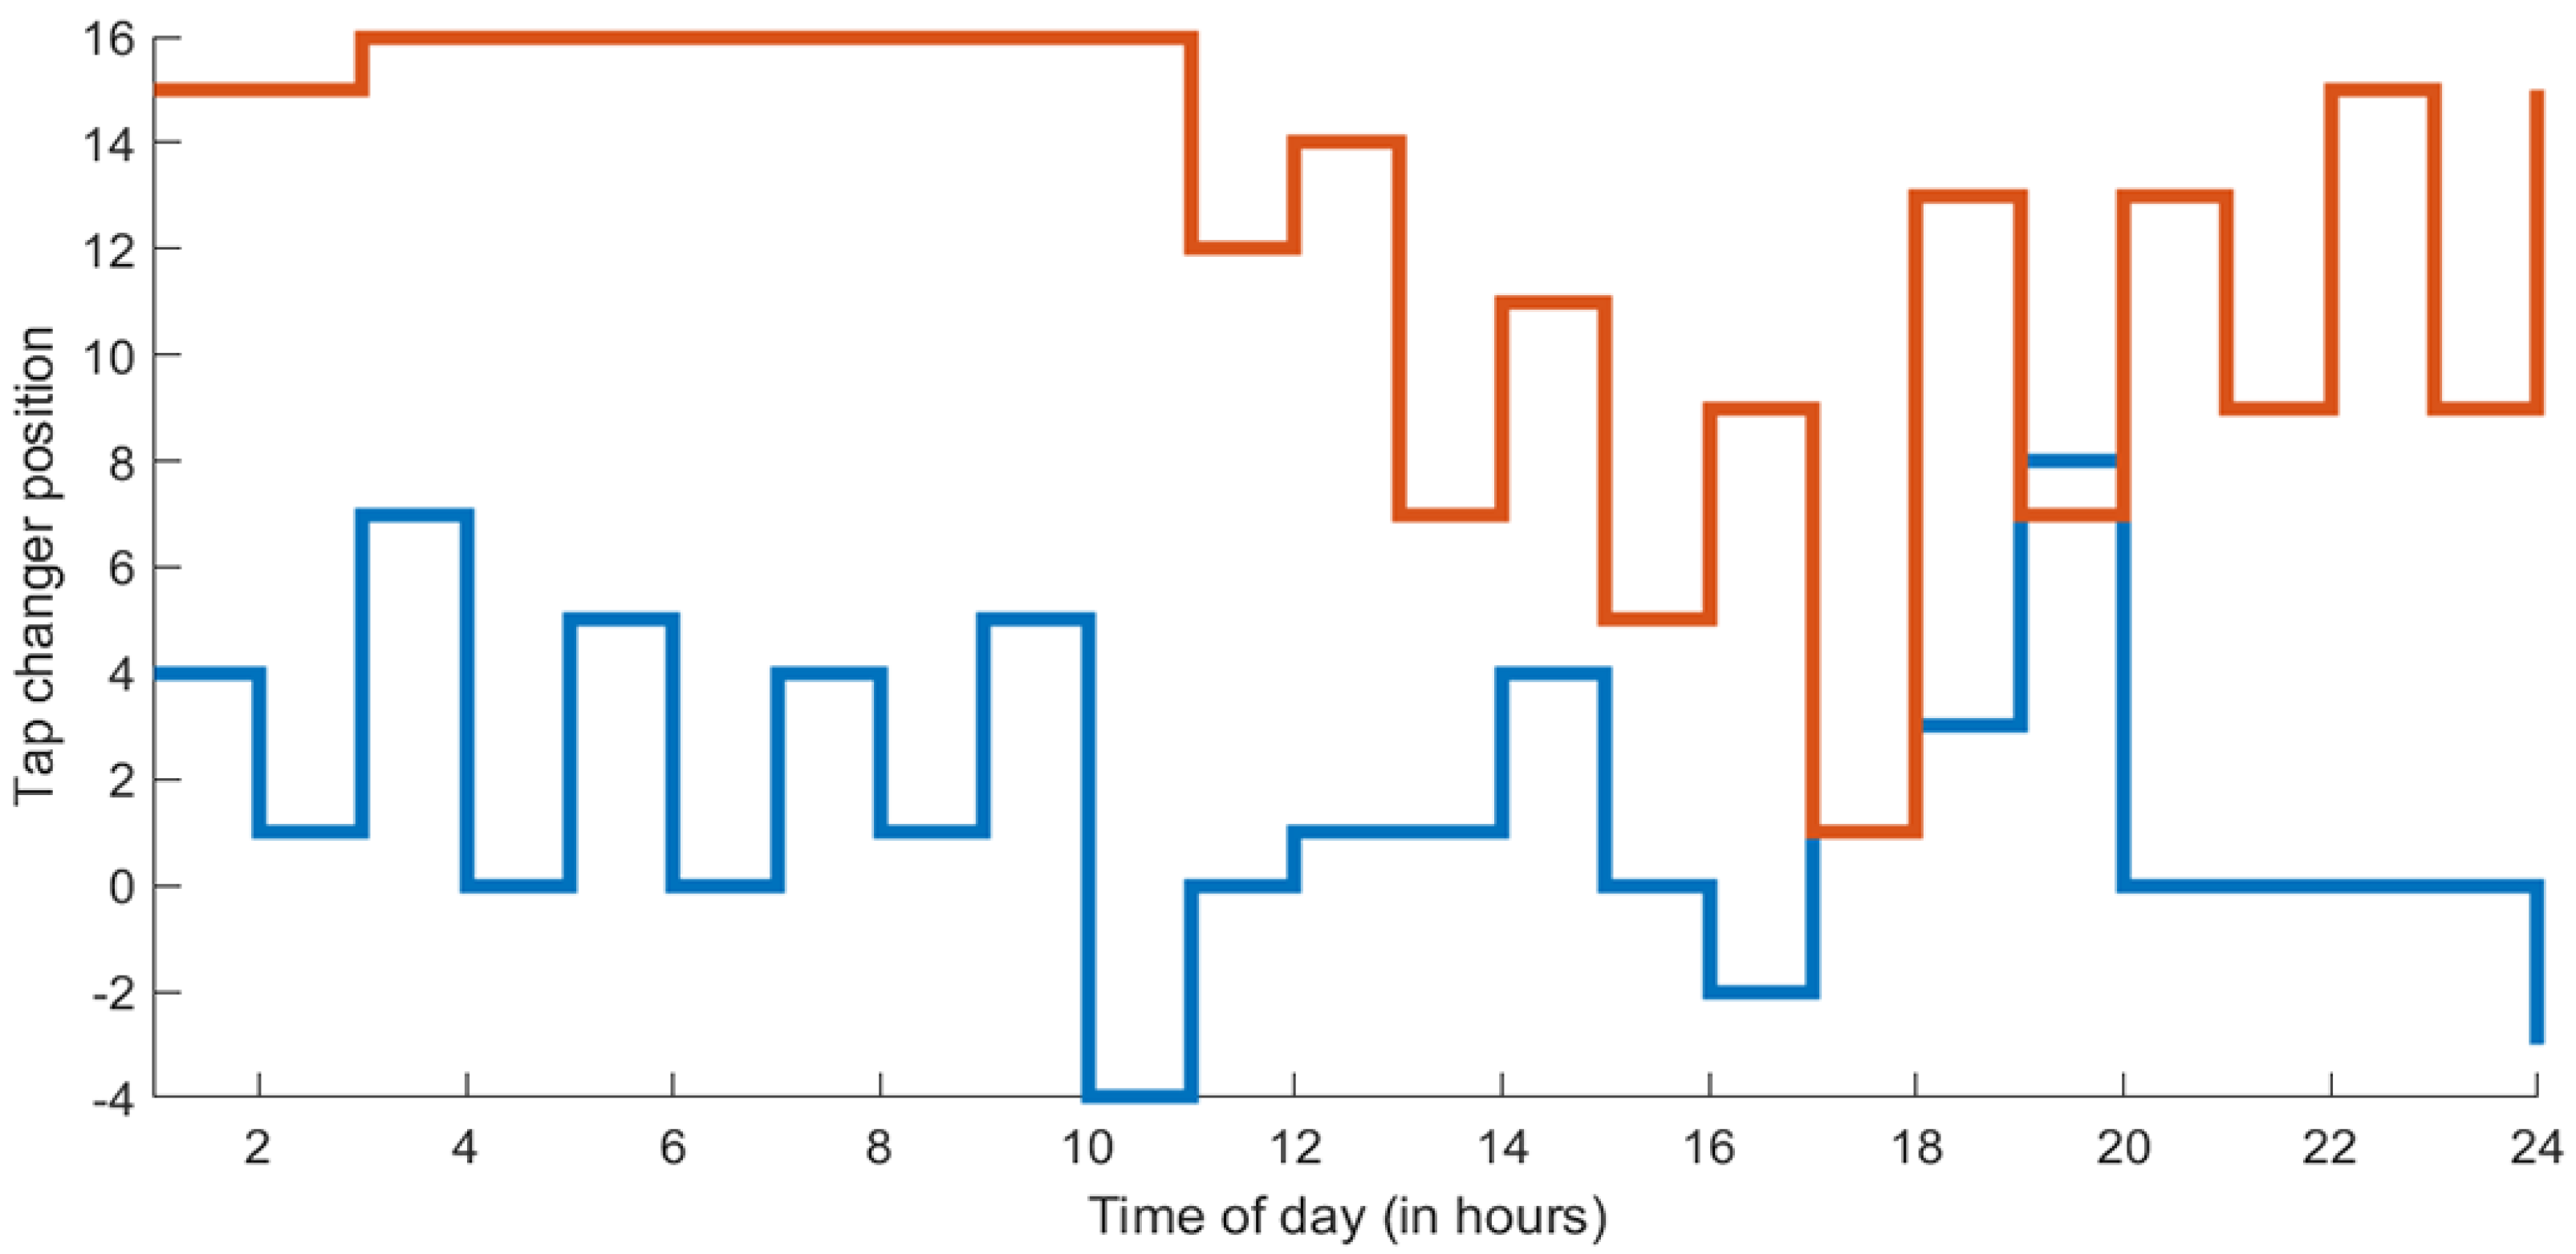
    • The graph of position changes of tap changers added to the system as a function of time of day is shown.

4.4. Installation of the Program

We develop the toolbox as a free MATLAB application. To install the application, MATLAB should be installed, and the steps given below should be followed:
  • The user should visit the GitHub version page of the project and download the “*.mlappinstall” for the latest version [46];
  • The user should double-click the downloaded file and install it;
  • The user should run MATLAB; then, the user can access the program from the APPS tab in the top menu. He/she can open the application by double-clicking it.

5. Simulation and Test Results

Several simulations were performed to test the correct functioning of the test systems, optimization methods, and settings used in the program.
We ran simulations for Model I and Model II using a 33-bus test system. We set the number of search agents to 50, the number of iterations to 1000, and placed 8 PVs at each bus 15, 16, 19, 20, 25, and 33. The results of PSO, GWO, WOA, and ALO-based optimization are shown in Figure 6. In all the results, it could be seen that the final voltage magnitudes values have improved.
For the simulations we run with Model II, we set the number of search agents to 50 and the number of iterations to 100. The initial power of the BESSs and their step values are set to 30 kW and 5 kWh, respectively. The lower and upper limits of SOC are 20 kW and 80 kW, respectively. There are tap changers on the line between the 5th and 6th buses and 24th and 25th buses. The two BESSs are installed on buses 5 and 13, and each BESS has the same characteristics, such as the initial value and SOC limits. We perform the tests using the GWO algorithm on a 33-bus test system. Figure 7 shows the improvement of the daily voltage profile when BESSs and tap changers are used. Figure 8 and Figure 9 illustrate the daily change in the power states of the BESSs and the daily change in the tap changer settings.
The convergence curves for the four methods using Model I with a maximum number of 100 runs using 33- and 69-bus test systems are shown in Figure 10. It is evident from the figure that all the methods arrive at a similar near optimal solution. From the figure, it can be seen that GWO converges faster compared to the other methods. The convergence speed of ALO was worst for the 33-bus test system, and the convergence speed of PSO was worst for the 69-bus test case.

6. Conclusions

In this paper, we explain a toolbox for optimizing smart grids for educational purposes. The toolbox can analyze the impact of renewable energy based DGs with coordinated use of tap changer voltage regulators and optimizes the daily operation of BESSs coordinated with tap changer voltage regulators. The user can select one of these two main operating modes and specify the details such as locations, profiles, etc. The toolbox can generate various diagrams including pre-and post-optimized voltage profiles. Based on the simulations shown, we find that the proposed toolbox is a useful tool for studying power distribution systems that can be used in power systems undergraduate/graduate courses. The developed toolbox is freely available to the public.

Author Contributions

Data curation, İ.A.Ö.; Formal analysis, O.B., A.S. and O.C.; Funding acquisition, A.S.; Investigation, İ.A.Ö., O.B. and O.C.; Methodology, İ.A.Ö., O.B. and O.C.; Project administration, A.S. and O.C.; Resources, O.B.; Software, İ.A.Ö.; Supervision, A.S. and O.C.; Validation, O.B.; Visualization, İ.A.Ö.; Writing—original draft, İ.A.Ö.; Writing—review & editing, O.B., A.S. and O.C. All authors have read and agreed to the published version of the manuscript.

Funding

This paper has been produced within the framework funded under the Grant #APP08052770 “Optimization of planning and control of Smart Grid systems” (Contract No 101 of 25.05.2020), supported by the Ministry of Education and Science of the Republic of Kazakhstan.

Institutional Review Board Statement

Not applicable.

Informed Consent Statement

Not applicable.

Data Availability Statement

Not applicable.

Conflicts of Interest

The authors declare no conflict of interest.

References

  1. Kennedy, J.; Eberhart, R. Particle Swarm Optimization. In Proceedings of the IEEE International Conference on Neural Networks—Conference Proceedings, Perth, Australia, 27 November–1 December 1995. [Google Scholar]
  2. Mirjalili, S. Grey Wolf Optimizer. Adv. Eng. Softw. 2014, 69, 46–61. [Google Scholar] [CrossRef] [Green Version]
  3. Mirjalili, S.; Lewis, A. The Whale Optimization Algorithm. Adv. Eng. Softw. 2016, 95, 51–67. [Google Scholar] [CrossRef]
  4. Mirjalili, S. The Ant Lion Optimizer. Adv. Eng. Softw. 2015, 83, 80–98. [Google Scholar] [CrossRef]
  5. Pradhan, M.; Roy, P.K.; Pal, T. Oppositional Based Grey Wolf Optimization Algorithm for Economic Dispatch Problem of Power System. Ain Shams Eng. J. 2018, 9, 2015–2025. [Google Scholar] [CrossRef]
  6. Hameed, I.A.; Bye, R.T.; Osen, O.L. Grey Wolf Optimizer (GWO) for Automated Offshore Crane Design. In Proceedings of the 2016 IEEE Symposium Series on Computational Intelligence, SSCI 2016, Athens, Greece, 6–9 December 2017. [Google Scholar]
  7. Chow, J.H.; Cheung, K.W. A Toolbox for Power System Dynamics and Control Engineering Education and Research. IEEE Trans. Power Syst. 1992, 7, 1559–1564. [Google Scholar] [CrossRef]
  8. Schoder, K.; Hasanović, A.; Feliachi, A.; Hasanović, A. PAT: A Power Analysis Toolbox MATLAB/Simulink. IEEE Trans. Power Syst. 2003, 18, 42–47. [Google Scholar] [CrossRef]
  9. Vournas, C.D.; Potamianakis, E.G.; Moors, C.; Van Cutsem, T. An Educational Simulation Tool for Power System Control and Stability. IEEE Trans. Power Syst. 2004, 19, 48–55. [Google Scholar] [CrossRef]
  10. Milano, F. An Open Source Power System Analysis Toolbox. IEEE Trans. Power Syst. 2005, 20, 1199–1206. [Google Scholar] [CrossRef]
  11. Cole, S.; Belmans, R. MatDyn, a New Matlab-Based Toolbox for Power System Dynamic Simulation. IEEE Trans. Power Syst. 2011, 26, 1129–1136. [Google Scholar] [CrossRef]
  12. Ekinci, S.; Demiroren, A.; Zeynelgil, H.L. PowSysGUI: A New Educational Software Package for Power System Stability Studies Using MATLAB/Simulink. Int. J. Electr. Eng. Educ. 2017, 54, 283–298. [Google Scholar] [CrossRef]
  13. Rahman, M.A. Torrit: A GUI-Based Power System Simulation Platform. arXiv 2020, arXiv:abs/2008.13509. Available online: https://arxiv.org/abs/2008.13509 (accessed on 20 December 2020).
  14. InterPSS Community. Available online: https://sites.google.com/a/interpss.org/interpss/Home?authuser=0 (accessed on 23 June 2021).
  15. Henry, R.; Ernst, D. Gym-ANM: Open-Source Software to Leverage Reinforcement Learning for Power System Management in Research and Education. Softw. Impacts 2021, 9, 100092. [Google Scholar] [CrossRef]
  16. Eid, A.; Kamel, S.; Abualigah, L. Marine Predators Algorithm for Optimal Allocation of Active and Reactive Power Resources in Distribution Networks. Neural Comput. Appl. 2021, 33, 14327–14355. [Google Scholar] [CrossRef]
  17. Singh, P.; Bishnoi, S.K. Modified Moth-Flame Optimization for Strategic Integration of Fuel Cell in Renewable Active Distribution Network. Electr. Power Syst. Res. 2021, 197, 107323. [Google Scholar] [CrossRef]
  18. Saboori, H.; Hemmati, R. Maximizing DISCO Profit in Active Distribution Networks by Optimal Planning of Energy Storage Systems and Distributed Generators. Renew. Sustain. Energy Rev. 2017, 71, 365–372. [Google Scholar] [CrossRef]
  19. Trivedi, I.N.; Parmar, S.A.; Bhesdadiya, R.H.; Jangir, P. Voltage Stability Enhancement and Voltage Deviation Minimization Using Ant-Lion Optimizer Algorithm. In Proceedings of the IEEE—2nd International Conference on Advances in Electrical, Electronics, Information, Communication and Bio-Informatics, IEEE—AEEICB 2016, Chennai, India, 27–28 February 2016. [Google Scholar]
  20. Mouassa, S.; Bouktir, T.; Salhi, A. Ant Lion Optimizer for Solving Optimal Reactive Power Dispatch Problem in Power Systems. Eng. Sci. Technol. Int. J. 2017, 20, 885–895. [Google Scholar] [CrossRef]
  21. Ladumor, D.P.; Trivedi, I.N.; Bhesdadiya, R.H.; Jangir, P. A Grey Wolf Optimizer Algorithm for Voltage Stability Enhancement. In Proceedings of the 3rd IEEE International Conference on Advances in Electrical and Electronics, Information, Communication and Bio-Informatics, AEEICB 2017, Chennai, India, 27–28 February 2017. [Google Scholar]
  22. Ahmadi, B.; Ceylan, O.; Ozdemir, A. Grey Wolf Optimizer for Allocation and Sizing of Distributed Renewable Generation. In Proceedings of the 2019 54th International Universities Power Engineering Conference, UPEC 2019, Bucharest, Romania, 3–6 September 2019. [Google Scholar]
  23. Ceylan, O.; Liu, G.; Tomsovic, K. Coordinated Distribution Network Control of Tap Changer Transformers, Capacitors and PV Inverters. Electr. Eng. 2018, 100, 1133–1146. [Google Scholar] [CrossRef]
  24. Bentouati, B.; Chaib, L.; Chettih, S. A Hybrid Whale Algorithm and Pattern Search Technique for Optimal Power Flow Problem. In Proceedings of the 2016 8th International Conference on Modelling, Identification and Control, ICMIC 2016, Algiers, Algeria, 15–17 November 2017. [Google Scholar]
  25. Qazi, S.H.; Mustafa, M.W.; Sultana, U.; Mirjat, N.H.; Soomro, S.A.; Rasheed, N. Regulation of Voltage and Frequency in Solid Oxide Fuel Cell-Based Autonomous Microgrids Using the Whales Optimisation Algorithm. Energies 2018, 11, 1318. [Google Scholar] [CrossRef] [Green Version]
  26. Trivedi, I.N.; Jangir, P.; Parmar, S.A. Optimal Power Flow with Enhancement of Voltage Stability and Reduction of Power Loss Using Ant-Lion Optimizer. Cogent Eng. 2016, 3, 1208942. [Google Scholar] [CrossRef]
  27. Waseem, M.; Lin, Z.; Liu, S.; Sajjad, I.A.; Aziz, T. Optimal GWCSO-Based Home Appliances Scheduling for Demand Response Considering End-Users Comfort. Electr. Power Syst. Res. 2020, 187, 106477. [Google Scholar] [CrossRef]
  28. Suman, G.K.; Guerrero, J.M.; Roy, O.P. Optimisation of Solar/Wind/Bio-Generator/Diesel/Battery Based Microgrids for Rural Areas: A PSO-GWO Approach. Sustain. Cities Soc. 2021, 67, 102723. [Google Scholar] [CrossRef]
  29. Liu, X.; Aichhorn, A.; Liu, L.; Li, H. Coordinated Control of Distributed Energy Storage System with Tap Changer Transformers for Voltage Rise Mitigation under High Photovoltaic Penetration. IEEE Trans. Smart Grid 2012, 3, 897–906. [Google Scholar] [CrossRef]
  30. Gao, C.; Redfern, M.A. A Review of Voltage Control Techniques of Networks with Distributed Generations Using On-Load Tap Changer Transformers. In Proceedings of the Universities Power Engineering Conference, Cardiff, UK, 31 August–3 September 2010. [Google Scholar]
  31. Sarimuthu, C.R.; Ramachandaramurthy, V.K.; Agileswari, K.R.; Mokhlis, H. A Review on Voltage Control Methods Using On-Load Tap Changer Transformers for Networks with Renewable Energy Sources. Renew. Sustain. Energy Rev. 2016, 62, 1154–1161. [Google Scholar] [CrossRef]
  32. Daylak, F. Elektrik Dağıtım Sistemlerinde Gerilim Profilinin, Güç Kayıpları ve Maliyet Minimizasyonunun Dağıtık Üretim Kaynakları ve Kademe Değiştiriciler Ile Iyileştirilmesi; Istanbul Technical University: İstanbul, Turkey, 2016. [Google Scholar]
  33. Zhang, Y.; Dong, Z.Y.; Luo, F.; Zheng, Y.; Meng, K.; Wong, K.P. Optimal Allocation of Battery Energy Storage Systems in Distribution Networks with High Wind Power Penetration. IET Renew. Power Gener. 2016, 10, 1105–1113. [Google Scholar] [CrossRef]
  34. Awad, A.S.A.; El-Fouly, T.H.M.; Salama, M.M.A. Optimal ESS Allocation for Load Management Application. IEEE Trans. Power Syst. 2015, 30, 327–336. [Google Scholar] [CrossRef]
  35. Ahmadi, B.; Ceylan, O.; Ozdemir, A. Voltage Profile Improving and Peak Shaving Using Multi-Type Distributed Generators and Battery Energy Storage Systems in Distribution Networks. In Proceedings of the UPEC 2020—2020 55th International Universities Power Engineering Conference, Turin, Italy, 1–4 September 2020. [Google Scholar]
  36. Bahramirad, S.; Reder, W.; Khodaei, A. Reliability-Constrained Optimal Sizing of Energy Storage System in a Microgrid. IEEE Trans. Smart Grid 2012, 3, 2056–2062. [Google Scholar] [CrossRef]
  37. Baran, M.E.; Wu, F.F. Network Reconfiguration in Distribution Systems for Loss Reduction and Load Balancing. IEEE Trans. Power Deliv. 1989, 4, 1401–1407. [Google Scholar] [CrossRef]
  38. Baran, M.E.; Wu, F.F. Optimal Capacitor Placement on Radial Distribution Systems. IEEE Trans. Power Deliv. 1989, 4, 725–734. [Google Scholar] [CrossRef]
  39. Khodr, H.M.; Olsina, F.G.; Jesus, P.M.D.O.-D.; Yusta, J.M. Maximum Savings Approach for Location and Sizing of Capacitors in Distribution Systems. Electr. Power Syst. Res. 2008, 78, 1192–1203. [Google Scholar] [CrossRef] [Green Version]
  40. Mirjalili, S. GWO. Available online: https://seyedalimirjalili.com/gwo (accessed on 5 February 2021).
  41. Mirjalili, S. WOA. Available online: https://seyedalimirjalili.com/woa (accessed on 7 February 2021).
  42. Mirjalili, S. ALO. Available online: https://seyedalimirjalili.com/alo (accessed on 10 February 2021).
  43. Zimmerman, R.D.; Murillo-Sánchez, C.E. MATPOWER. 2020. [Google Scholar] [CrossRef]
  44. Zimmerman, R.D.; Murillo-Sánchez, C.E.; Thomas, R.J. MATPOWER: Steady-State Operations, Planning, and Analysis Tools for Power Systems Research and Education. IEEE Trans. Power Syst. 2011, 26, 12–19. [Google Scholar] [CrossRef] [Green Version]
  45. Draw.Io. Available online: App.diagrams.net (accessed on 1 June 2021).
  46. Ozlu, I.A. Electrical Distribution Systems Optimization GUI. Available online: https://github.com/alperenozlu/electrical-distribution-systems-optimization-gui (accessed on 26 April 2021).
Figure 1. Flowchart of the GWO.
Algorithms 15 00014 g001
Figure 2. Flowchart of the toolbox.
Algorithms 15 00014 g002
Figure 3. Placement of three panels on the application.
Algorithms 15 00014 g003
Figure 4. Settings panel of the toolbox.
Algorithms 15 00014 g004
Figure 5. Preview panel of the toolbox.
Algorithms 15 00014 g005
Figure 6. Model I, voltage magnitudes for the base case and the near-optimal case for (a) PSO, (b) GWO, (c) WOA, and (d) ALO.
Algorithms 15 00014 g006
Figure 7. Daily, (a) base case, and (b) near-optimal voltage magnitudes when BESSs and tap changers are used.
Algorithms 15 00014 g007
Figure 8. Change of BESSs’ power state for 24 h.
Algorithms 15 00014 g008
Figure 9. Tap changer settings for 24 h.
Algorithms 15 00014 g009
Figure 10. Convergence curves for PSO, GWO, WOA, and ALO using Model I.
Algorithms 15 00014 g010
Publisher’s Note: MDPI stays neutral with regard to jurisdictional claims in published maps and institutional affiliations.

