1. Introduction
Clustering is widely used to find hidden structures in data. In clustering, a set of
C cluster centers
represents prototypes of clusters. Each cluster contain similar objects in a dataset
with
N objects and
D dimensions, where each object is a vector
. The goal of clustering is to learn the partition matrix
of a dataset. The partition matrix shows that an object
belongs to the cluster
and is represented by a
matrix as
where
and
such that
. In hard clustering, such as k-means,
= 1 if
and 0, otherwise. In fuzzy clustering, such as fuzzy C-means (FCM),
and
if
. These conventional techniques aims to minimize a single objective function as follows:
where
m, the fuzzy parameter, is 2. With a single objective function, different characteristics of hidden structures found in the dataset may not be well captured [
1]. Combining multiple objectives into one may not fully reflect conflicting characteristics, such as cluster compactness and separation [
2]. Thus, multiple objective functions that are optimized simultaneously in an evolving population of solutions were developed [
3]. In this way, cluster characteristics can be more accurately defined, evolving to better solutions. Applications of multiobjective evolutionary algorithms (MOEA) in clustering have shown to be effective in identifying meaningful clusters [
1,
3,
4].
In MOEA clustering or multiobjective clustering (MOC), many works focused on improving the algorithms through the treatment of chromosome encoding, use of objective functions [
5], choice of MOEA, incorporation of other techniques, such as swarm intelligence, choice of evolutionary operations and selection of the final solution [
6,
7]. While applications of MOEAs are covered in many works and surveys [
1,
6], there is a research gap where few studies have applied newer MOEA strategies in data clustering problems, tested on datasets with different characteristics [
8,
9,
10]. With this motivation, we previously investigated the application of a variety of MOEA algorithms to QPSO, BBPSO and fuzzy clustering algorithms tested on 10 UCI datasets [
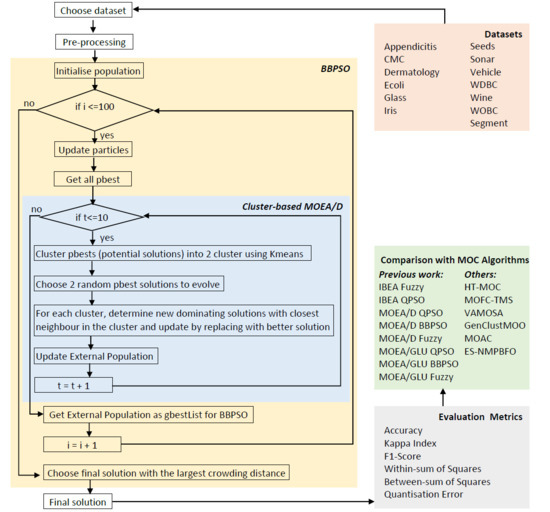
4]. Decomposition-based MOEA with bare bones particle swarm optimization (MOEA/D BBPSO) performed the best on most datasets. In this work, as continuation, we applied a cluster-based MOEA/D optimization technique to BBPSO clustering (CM-BBPSO) to introduce good Pareto solutions into the Pareto set to be considered for selection and investigated its performance for data clustering problems. To the best of our knowledge, there is very little work done in cluster-based MOEA for data clustering. Most cluster-based MOEA are for solving other engineering problems but not data clustering.
The cluster-based approach in solution selection have become increasingly popular in multiobjective optimization (MOO). The cluster-based selection approach applied to more than one objective function optimization was first proposed by [
11]. The approach generated a reduced Pareto set in many-objective optimization (MaOO) problems to solve its scaling problem. Furthermore, cluster-based approaches are also applied to improve good Pareto set in multi- and many-objective optimization problems, such as applying clustering with a flexible similarity metric [
12] and applying cluster-based solution selection [
13]. Chen et al. [
14] applied density-based fuzzy C-means clustering in a dynamic nondominated sorting multiobjective genetic algorithm to improve traffic congestion. While these cluster-based approaches improve the MOO algorithms, to the best of our knowledge, such approaches are not commonly applied to data clustering problems.
In this paper, we aim to incorporate the cluster-based MOEA selection strategy into a BBPSO clustering framework and investigate its clustering performance. By applying clustering on the Pareto set, we hope to benefit from the combined strength of solutions based on found cluster representatives to guide the solution selection. As part of our ongoing studies in PSO clustering, we also investigate and compare with the MOEA strategies in a PSO and fuzzy clustering framework. Our objectives are two-fold: first, to compare and study the clustering performance of CM-BBPSO and MOPSO clustering when compared to single objective BBPSO clustering algorithms to determine whether cluster-based MOEA/D strategy is effective for clustering; secondly, we would like to study the clustering behavior of these algorithms by applying them on datasets of different characteristics, such as size, cluster number, number of dimensions, density and overlap. We test on 13 UCI datasets [
15] and compare with BBPSO and MOEA clustering algorithms from our previous work.
The outline of the paper is as follows. We discuss a few latest works that applied cluster-based selection in MOEA. Next, we present the materials and methods we used in our proposed technique, starting with a brief introduction of MOEA/D, followed by an explanation of our methodology of cluster-based MOEA/D BBPSO (CM-BBPSO). Next, we present the details of our experiments and data used. The results and discussion are presented next, and the paper ends with conclusion.
2. Related Work
In this section, we discuss two aspects relating to this study. First, the development of cluster-based MOO, where clustering approaches are used to solve solution selection problems in MOO for engineering problems, not data clustering. Here, clustering is applied on the fitness values of MOO solutions, and not on the data samples. Such techniques have not been applied to data clustering problems such as in pattern recognition or knowledge discovery. Second, we review the latest development of multiobjective clustering techniques applied to the data clustering problem.
2.1. Cluster-Based Multiobjective Optimisation
An early work on cluster-based solution selection in the Pareto set was proposed by [
11], applied to generate a reduced Pareto set to solve the scaling and high-dimensional problems in many-objective optimization (MaOO). There is an increasing number of works that apply such an approach to improve the MOO solution selection. Here, the fitness values of solutions are clustered to find representatives (cluster centers). This means that solutions with similar fitness values are grouped together and a representative for each group is generated for guiding the solution selection or for the evolution of the solutions. Agrawal et al. [
16] applied fuzzy clustering in multiobjective particle swarm optimization to perform electrical power dispatching, particularly to minimize fuel cost and emission. Their technique outperformed traditional MOO techniques, including NSGA, NPGA and SPEA. In [
17], a density-based clustering approach DBSCAN was applied in MOO to find diverse optimal and near-optimal Pareto fronts to solve water resource problems. During dominance check, only local comparisons with solutions sharing the same clusters were checked.The authors stated that the introduction of a dissimilar index in the clustering for deciding whether to select or remove solutions for further evolution gave users more control as decision support. Hua et al. [
18] used an agglomerative hierarchical cluster-based approach with Ward’s linkage in MOEA to guide selection in a way that maintains diversity and reduces convergence time. Their technique was applied to solve the problem of poor solutions selection due to an irregular Pareto front. The authors shared that using K-means generated spherical clusters and required a prior number of clusters. Liu et al. [
12] proposed a flexible similarity metric for cluster-based MOEA to handle both convex- and concave-shaped Pareto fronts.
Chen et al. [
14] applied density-based Fuzzy C-means in clustering in a dynamic nondominated sorting multiobjective genetic algorithm to determine Pareto fronts distribution, applied to improve traffic congestion. In their previous work [
19], they applied a clustering method that was based on the VAR and PRE method. While these cluster-based approaches improve MOO algorithms, to the best of our knowledge, such approaches are not commonly applied to data clustering problems. So far, we found only [
20], who applied cluster-based MOO for data clustering, proposing the hierarchical topology-based cluster representation, which is based on a tree-based graph for multiobjective clustering (HT-MOC), scalable to large datasets. The approach involves the use of a seeding algorithm followed by the use of the formulation of minimum spanning trees before MOC clustering processes, which include an ensemble operator to produce consensus clusterings before the final selection operator is employed. As such cluster-based MOO techniques have shown to improve optimized solutions, we opted to apply K-means, as it is simple to implement and works fast, compared to density-based clustering. We understand that the shape of the Pareto front may not be convex, but we proceeded with k equaling two. As there is little work on cluster-based MOO for clustering, we chose simple techniques to evaluate the effective of the approach. Our approach is different from [
20], as we did not apply ensemble, nor is our cluster-representation tree-based. We used the generic centroid-based encoding.
2.2. Multiobjective Clustering
MOEA is popularly applied in data clustering. Mukhopadhyay et al. discussed extensively MOEA clustering as well as the application of metaheuristics, such as differential evolution, particle swarm optimization and genetic programming, for data clustering. In [
21], Armano and Farmani developed a multiobjective particle swarm optimization algorithm for automatic data clustering, using connectivity and cohesion objective functions and a locus-based adjacency genetic scheme. They reported their results using ARI, but ARI was not used in this study, making it not comparable. Wang et al. [
22] proposed two ensemble MOEA clustering algorithms, NSGA-II-ECFE and MOEA/D-ECFE, using four objective functions, DB, Dunn, cohesion, and stability, for patient stratification. Their ensemble construction involved using K-means to generate base clustering. They tested on 55 synthetic and 35 real patient stratification datasets. Unlike Wang et al. [
22] and Zhu et al. [
20], we did not use ensemble techniques but chose to use a simple swarm intelligence technique BBPSO to maintain our population of solutions. Instead of PSO, as in [
21], we used BBPSO, which is parameter-free. It is interesting to note that despite its simplicity, there are not as many works applying BBPSO or MOO BBPSO to data clustering. To name a few, Omran et al. applied BBPSO clustering for unsupervised image segmentation [
23], using a quantization-error-based objective function. Jiang and Wang [
24] proposed cooperative bare-bone particle swarm optimization (CBPSO) for data clustering, using a new centroid-based encoding scheme for each particle and the Chernoff bounds on a suitable population size.
Other MOC techniques apply other nature-inspired approaches. Peng et al. [
25] proposed a multiobjective fuzzy clustering framework, MOFC-TMS, with a tissue-like membrane system, which has a special cell structure for integrating a non-dominated sorting technique with a modified differential evolution mechanism. The proposed technique was developed to optimize three objective functions and was demonstrated to produce good results on many benchmark datasets. Kushwaha et al. [
26] proposed a magnetic optimization algorithm (MOA) inspired by the magnetic force for data clustering. The algorithm is not sensitive to initialization, and the particle update is based on the magnetic resultant force. Guo et al. [
27] proposed the evolutionary state-based novel multiobjective periodic bacterial foraging optimization algorithm (ES-NMPBFO). This is a novel multiobjective periodic bacterial foraging optimization (BFO) algorithm for data clustering, incorporating PSO mechanisms into the chemotaxis operation.
2.3. Motivation
The HT-MOC [
20] is a highly effective cluster-based MOO algorithm for solving challenging and large clustering problems, with overlapping and mixed-density clusters, applying many sophisticated techniques, such as tree-based graph cluster representation for a hierarchical topology for clustering and ensemble clustering. As there are few works in cluster-based MOO for data clustering, we hope to develop a simple cluster-based MOC technique, comprising familiar good-performing algorithms, with little to no parameter setting, to show its effectiveness to interested practitioners. For MOEA clustering, there is no local search in the evolutionary algorithm. The search for
in BBPSO is a local search within the sample search space. By applying cluster-based MOO selection, we introduced local search when selection solutions evolve in the next generation in the objective space. For the cluster-based part of the MOO, we applied K-means with two clusters. Like [
17], only local comparisons with solutions sharing the same clusters are checked for dominance. For the MOO, we used MOEA/D to find
using the
particles found by BBPSO. MOEA/D can simultaneously evolve subproblem multiobjectives and provide a scalar solution. They showed good performance in data clustering tasks. BBPSO does not require any parameter setting and showed good results for clustering. We hope that by testing on common datasets and using common evaluation metrics, the work can be a reference for the future direction of applying and developing cluster-based MOC to solve sophisticated clustering problems.
2.4. Contribution
We developed a novel framework that requires little to no parameter setting consisting of a simple swarm intelligence technique BBPSO and MOO technique MOEA/D with a solution update based on K-means for data clustering. To the best of our knowledge, this approach has not been explored.
We ran extensive investigations to evaluate its performance. We tested on 13 datasets with different characteristics and evaluated using 5 different popular metrics. We compared our results with other work to show how the proposed technique performs relatively. We conducted other analysis such as analysis of the convergence plot to assess the stability of the proposed technique and visual examination of biplots of the clustering found by the proposed technique.
3. Materials and Methods
In this section, we describe the techniques, experiments and data used to implement and evaluate the proposed technique, CM-BBPSO.
3.1. Bare Bones Particle Swarm Optimisation
The BBPSO was introduced to simplify PSO, removing the need for parameters or velocity [
28]. Each particle
in the swarm holds two properties: (a) its current position
and (b) its personal best position
. At each iteration
t, the position of the particle is updated based on
, a multivariate Gaussian distribution with mean
, and standard deviation
as follows:
In addition to parameter reduction, the multivariate Gaussian distribution operator helps maintain diverse candidates in the population for
particles to improve from. The BBPSO clustering algorithm to be used in this study is shown in Algorithm 1. The
particles are evolved from
pbest particles and refined using cluster-based MOEA/D.
| Algorithm 1 Pseudocode for BBPSO Clustering |
- 1:
Set max number of iterations I, max number of iterations T, Population size S, , , generate population P and initialize using MOEA/D and all pbest - 2:
while do - 3:
while do - 4:
Calculate any parameters - 5:
for Each particle do - 6:
Calculate new p using ( 2) - 7:
Check new p is within search range R - 8:
Calculate fitness of p and pBest using quantization error function from [ 23] - 9:
If new p dominates pBest, update p and pBest with new p - 10:
end for - 11:
gBestList = getGBestList(pbestList) using cluster-based MOEA/D (Algorithm 2) - 12:
end while - 13:
end while - 14:
Evaluate crowding distance of all solutions in gBestList - 15:
Choose gBest with largest crowding distance
|
3.2. Decomposition-Based Multiobjective Evolutionary Algorithm
The decomposition-based MOEA (MOEA/D) uses three approaches—the weighted sum, Tchebycheff and penalty-based boundary intersection (PBI)—to convert MOP into scalar optimization subproblems, simultaneously solved by evolving a population of solutions [
29]. Unlike previous MOO techniques, such as dominance-based MOEA, there is no clear ranking of Pareto solutions, while with MOEA/D, such a ranking is possible, as the
function is expressed as a scalar value as defined in the objective below. MOEA/D with the PBI approach for an
m-objective problem [
29] is defined as follows:
where
where
x is a candidate solution,
is a predefined penalty parameter,
is the reference point such that
,
is a weight vector such that
for
and
. In this study,
x is a candidate solution that undergoes the evaluation process of cluster-based MOEA/D to be selected for next generation, as detailed in Algorithm 2, line 15.
| Algorithm 2 Pseudocode for Cluster-based MOEA/D |
- 1:
Initialization phase: - 2:
Set external population EP = ∅ - 3:
Initialize N, number of subproblems - 4:
Generate a uniform spread of N weight vectors - 5:
For each , generate where are the T closest weight vectors to using Euclidean distance - 6:
Using solutions in pbestList to generate initial population where is current solution to ith subproblem and set fitness value of all individuals for - 7:
Initialize reference point where is the best value so far for objective - 8:
Set number of clusters k as 2 - 9:
Cluster individuals based on their similarity in the matrix and find which is most representative for each cluster c. - 10:
Update phase: - 11:
for do - 12:
Reproduction: Generate new solution y using genetic operators on two solutions and where indexes k and l are randomly chosen from - 13:
Improvement: Apply any improvement heuristic on y to produce - 14:
Update z: For each , if , set - 15:
Update neighbors: For each belonging to cluster c, if , values calculated using ( 3), set and - 16:
Update EP: Remove solutions in EP dominated by and add to EP if no vectors in EP dominate . - 17:
end for - 18:
Termination Condition: Stop and output EP if termination condition is met.
|
3.3. Cluster-Based MOEA/D BBPSO
Each solution in a multiobjective clustering (MOC) problem is regarded as a set of cluster centers
or
in (
1). Cluster connectedness (Conn) and within-sum-of-squares (WSS) [
3] are used as objective functions in this work to evaluate the best solution candidates. The final solution is then selected using crowding distance on the external population. In a MOC framework, the population
P contains
S solutions with
where the matrix of each solution
represents
C cluster centers of a dataset containing
N objects and
D dimensions as follows:
In the CM-BBPSO clustering framework, there are two parts. The BBPSO clustering algorithm is in charge of updating the particles in the swarm. The
from BBPSO are selected based on the quantization error-based fitness function from [
23]. BBPSO is used because it requires lesser parameters than PSO and performs well in clustering, based on previous work [
30]. Next, we subject the
solutions found by BBPSO to the cluster-based MOEA/D algorithm for solution evolving and selection to find the
for the BBPSO framework. The population size for the cluster-based MOEA/D is the same as the swarm size for the BBPSO. The objective functions Conn and WSS are used to update
matrix and then evaluate solutions in lines 6, 15, 16 in Algorithm 2. Newly evolved solutions are compared with existing ones and the better one is selected to be updated. The fitness matrix
containing WSS and Connectedness fitness values of the better solution are stored.
The cluster-based approach used in this study is adapted from [
13] and applied at line 9 in Algorithm 2 in the MOEA/D PBI framework from [
29] to find the
candidates, given all
. Here, we apply k-means clustering with
to guide the solution selection. Based on the fitness values in the
matrix of
N subproblems, we cluster them. The improved potential individual
is evaluated against neighbors belonging to the group and added to
if it has a more favorable evaluation value. In doing so, the application of the cluster-based approach is to improve the local search within the objective space for new candidates, while the genetic operators maintain a random global search. We will test on higher
k values to explore deeper in future work. In this work, we apply a small
k value and simple conventional algorithms and distance measures, such as k-means and Euclidean distance, to study the effects of clustering-based MOEA/D as a preliminary study. Indeed, more investigation is required to understand deeply the Pareto solutions found in the objective space and the more sophisticated methods to deal with challenging Pareto solutions as proposed in [
18].
To investigate its performance, we tested on 13 public datasets and compared cluster-based MOEA/D BBPSO (CM-BBPSO) with the following MOPSO clustering frameworks: IBEA QPSO (IB-QPSO), SPEA2 QPSO (SP-QPSO), MOEA/D QPSO (M-QPSO)and BBPSO (M-BBPSO), and MOEA/GLU QPSO (MG-QPSO) and BBPSO (MG-BBPSO), where the respective MOEAs are individually incorporated into a fuzzy, QPSO or BBPSO clustering framework as described in Algorithm 1 in [
4]. An abbreviation list is given before the References section.
3.4. Experiments
We employed similar experiment settings in [
4] with a swarm size of 20 and maximum iteration of 100, together with the following experiment settings. We previously obtained good results using similar datasets. Ten generations are run in the cluster-based MOEA/D framework, and each experiment is run thirty times. The data are scaled before applying clustering. To produce different solutions, we set the MOC algorithms to generate more than one solution. The final solution is selected by crowding distance. The number of clusters is set as the number of classes in the dataset.
The evaluation metrics used are accuracy, F1 and Kappa for external evaluation, and QE, WSS and BSS for internal evaluation. Different works in data clustering use different measures, which make comparison of other work difficult. There appears to be a mixed opinion to use external metrics to evaluate clustering, while another school of thought is that the point of clustering is to generate labels to perform classification and aims to generate such labels. This depends on the objective of the users and it is not within our scope to discuss this matter. We present both types of criteria for relevant researchers.
To evaluate the clustering performance and investigate in clustering behavior of CM-BBPSO, we conduct several analyses. We compare the CM-BBPSO with non-cluster based MOEA/D BPPSO and with BBPSO to study how the cluster-based MOEA/D approach has made a difference. Previously in [
4], we observed that the application of MOEA/D in BBPSO algorithm improves the performance. By comparing with BBPSO clustering techniques, we can determine if the cluster-based MOEA/D approach further improves BBPSO and M-BBPSO.
CM-BBPSO is then compared with other MOPSOs and MOO Fuzzy algorithms to evaluate its performance. In particular, M-Fuzzy is found to perform competitively to M-BBPSO in [
4]. Previously, we were not able to obtain results on CMC, segment and vehicle datasets. Through this analysis here, we are re-evaluating by comparison with the said algorithms and the additional datasets, which usually give poor results, as was reported in [
30]. We also compare CM-BBPSO results with the existing cluster-based MOO technique HT-MOC [
20], MOC techniques MOFC-TMS [
25], VAMOSA [
31], GenClustMOO [
32], MOAC [
26], ES-NMPBFO [
27] and BBPSO clustering technique CBPSO [
24] based on commonly reported datasets and evaluation metrics.
The following swarm sizes and maximum iterations (presented as ss-mi) are tested: 20–100, 30–100, 30–200 and 40–100. This is done to study whether am increase in the two parameters will improve clustering. The biplot visual examination allows us to evaluate CM-BBPSO performance in comparison with the ground truth, examining how well CM-BBPSO identifies overlapping clusters. With the analysis of the convergence plots of , we can evaluate the stability of CM-BBPSO.
3.5. Data
The algorithms are tested on 13 datasets obtained from the UCI Machine Learning Repository: Appendicitis, CMC, Dermatology, Ecoli, Glass, Iris, Seeds, Sonar, Vehicle, WDBC, Wine, WOBC and Segment [
15]. Full details and t-SNE biplots of the datasets are found in [
30]. These datasets have different types of characteristics, such as sizes N, dimensions n and cluster numbers c, as well as having different intensity of densities and overlapping. We are particularly interested to see the effects of CM-BBPSO on challenging datasets with highly overlapping clusters and a combination of the following characteristics: high number of classes, mixed densities, imbalanced class ratios. We choose a mixture of datasets for which most algorithms tend to produce good results as well as challenging datasets, such as Glass, Sonar, Ecoli, Segment, Vehicle and CMC. Many works tested algorithms with datasets with 2 or 3 classes, such as Iris, Wine, Appendicitis, WOBC and WDBC, which give good results.
4. Results
4.1. BBPSO Comparisons
In
Table 1, we compare the performance of CM-BBPSO with MOEA/D BBPSO and BBPSO evaluated on 13 UCI datasets and using 5 metrics: accuracy, F1-score (F1), Kappa (Cohen’s
index), between sum of squares (BSS), within sum of square (WSS) and quantization error (QE). The best result for each measure is highlighted in bold.
We observe that CB-MOEAD-BBPSO performed best in the CMC, Ecoli and Sonar datasets, three of which are challenging datasets containing either many imbalanced, highly overlapping and/or mixed density clusters. These datasets appear to be more challenging as shown in our previous work ([
4,
30]). This demonstrates that using the cluster-based selection of optimal solutions helps to choose good solutions for challenging datasets. We observed that M-BBPSO produced the best WSS values in 11 datasets, indicating that M-BBPSO tends to optimize cluster compactness. BBPSO produced the best BSS values in all the datasets, indicating that BBPSO optimizes cluster well-separatedness. CM-BBPSO had the worst (smallest) BSS values in four datasets and the worst (largest) WSS values in two datasets. M-BBPSO produced the worst BSS values in 9 datasets, while BBPSO produced the worst WSS values in 11 datasets. This shows that BBPSO is good for finding well-separated clusters, such as in Iris and Seeds, with a small number of clusters, while M-BBPSO is good for finding clusters that are compact, such as WDBC and WOBC. Based on the BSS and WSS measure, we observed that CM-BBPSO balances between these two properties of compactness (WSS) and well-separatedness (BSS), not doing better on one, such as M-BBPSO and BBPSO as discussed earlier. Such characteristics are useful when dealing with datasets with highly overlapping clusters and high dimensions. QE is another type of measure to indicate compactness and shares the same trend as WSS.
4.2. MOO Comparisons
We compare CM-BBPSO with other MOC algorithms from our previous work. We present the results on three datasets, CMC, Segment and Vehicle, in
Table 2,
Table 3 and
Table 4 which were not published in [
4] due to run issues for clustering algorithms using multiobjective evolutionary algorithms with the global loop update (MG) [
33], indicated as
. The results for the other 10 datasets were published. In these three challenging datasets, CM-BBPSO performed competitively, particularly for CMC where it had the second best accuracy, F1, Kappa and BSS. In this comparison, CM-BBPSO did not outperform any other MOC, nor BBPSO techniques. Instead, M-Fuzzy emerged as the superior algorithm in these datasets for most evaluation metrics.
Using the averages of the six evaluation metrics, we performed sum rank of each algorithm across the 13 datasets. For algorithms with no results for certain datasets, we gave a rank of 6 (middle rank). The sum rank table is presented in
Table 5. We placed MG algorithms at the end of the table, as they had issues in two or more datasets and the sum rank may not fully reflect their performance. In these three challenging datasets, CM-BBPSO was found to be very competitive. Overall, M-Fuzzy outperformed all other techniques, acquiring the smallest sum rank across most of the evaluation metrics, followed by M-BBPSO and M-QPSO. CM-BBPSO was ranked sixth.
In
Table 6, we calculate the sum rank for clustering performance on two datasets only, CMC and Sonar. Based on the external metrics of accuracy, F1 and Kappa, we can observe that CM-BBPSO performed best in CMC and Sonar. We placed MG-QPSO and MG-BBPSO, which had issues, at the end of the table as reference. The reason for isolating the two datasets is to identify the clustering techniques that performed well on the two datasets. Here, we observe that CM-BBPSO was the second best.
In
Table 7, we study which are the best two performing algorithms for the respective datasets based on the six evaluation metrics, highlighted in bold. M-Fuzzy was the top 2 best for 7 out of 13 datasets, while M-BBPSO was top 2 for 5 datasets. Previously, without the results from CMC, Segment and Vehicle, M-BBPSO was found to be best. CM-BBPSO was top 2 for one dataset only, CMC.
In
Table 8, we compare the performance of CM-BBPSO with other reported algorithms in terms of Accuracy and F1 score for five UCI datasets [
15]: CMC, WOBC (Cancer), Iris, Glass and Wine. Where results are not available, we left it blank. While CM-BBPSO was not found to be the best in any of the datasets, it was found to outperform certain algorithms in a few datasets. CM-BBPSO outperformed the following algorithms in the respective datasets: MOAC in CMC and Iris, VAMOSA in WOBC and Wine and CBPSO in CMC. This demonstrates that CM-BBPSO performs competitively, and this result is promising. However, HT-MOC, MOFC-TMS, GenClustMOO and ES-NMPBFO outperformed CM-BBPSO in the available common datasets.
4.3. Investigating Swarm Size and Maximum Number of Iterations
In
Table 9, the performance of CM-BBPSO, using the following swarm-size and maximum iteration pair settings ss-mi, 20–100, 30–100, 30–200 and 40–100, is presented. Experiments with ss-mi of 40–100 achieved the best results in 6 out of 13 datasets. Further experimentation using this setting will be considered. Overall, the results were considered competitive for the different settings.
4.4. Visual Examination of CM-BBPSO Clustering
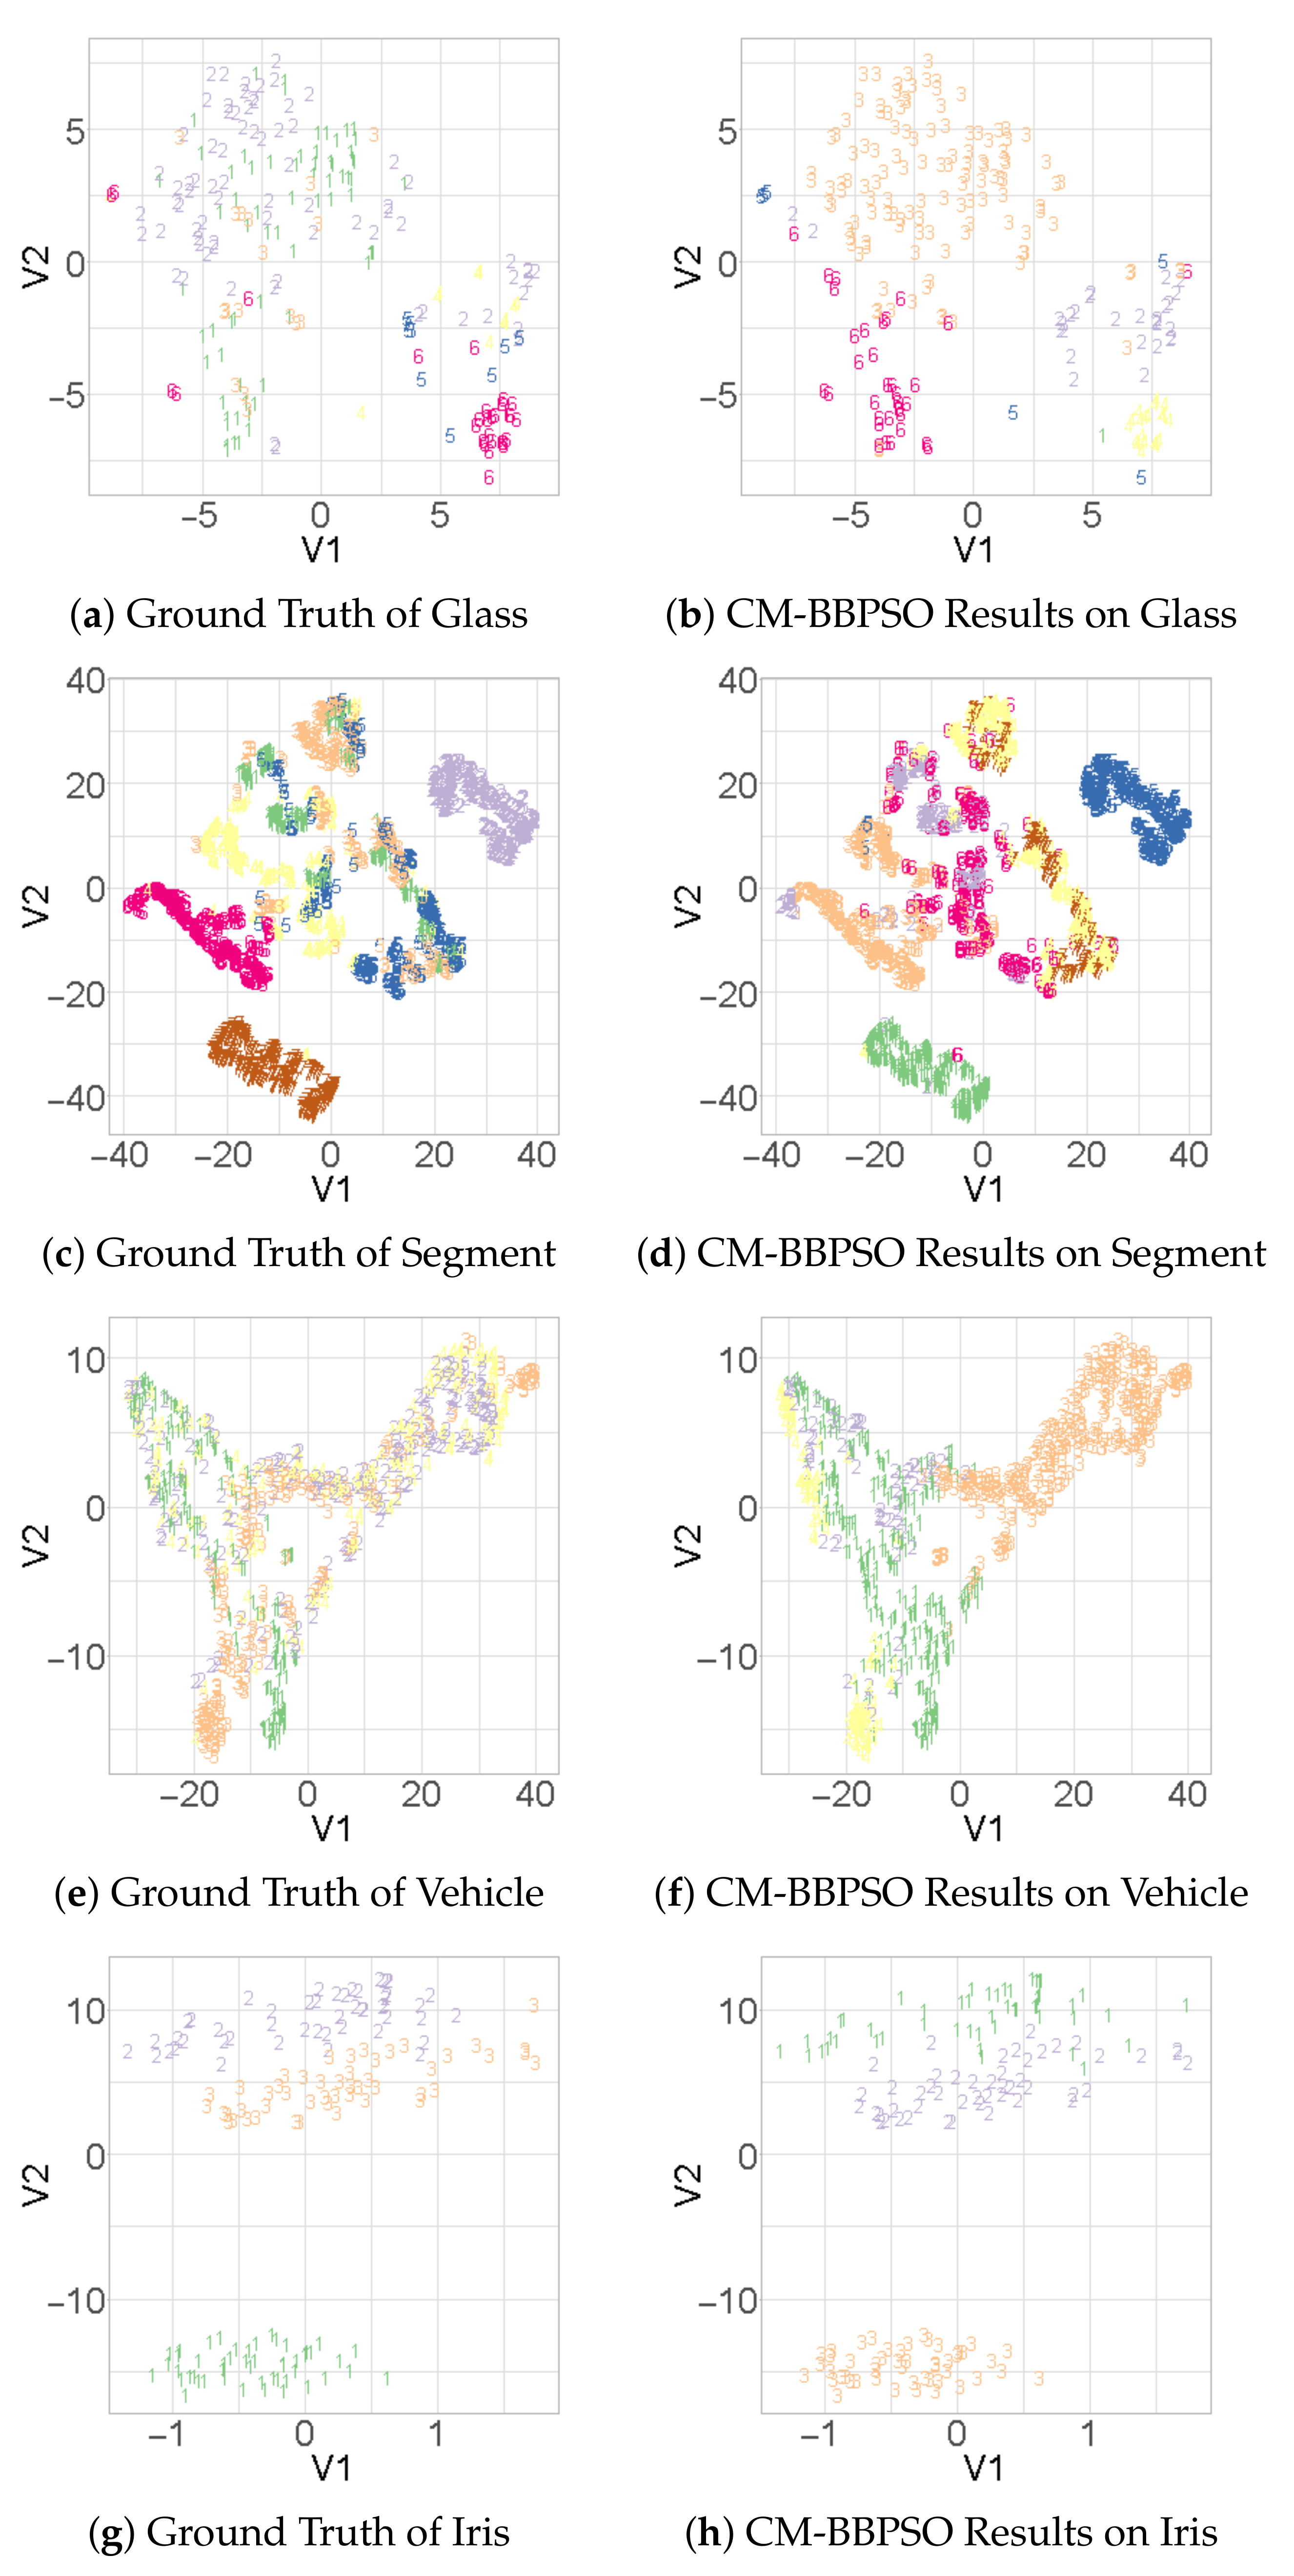
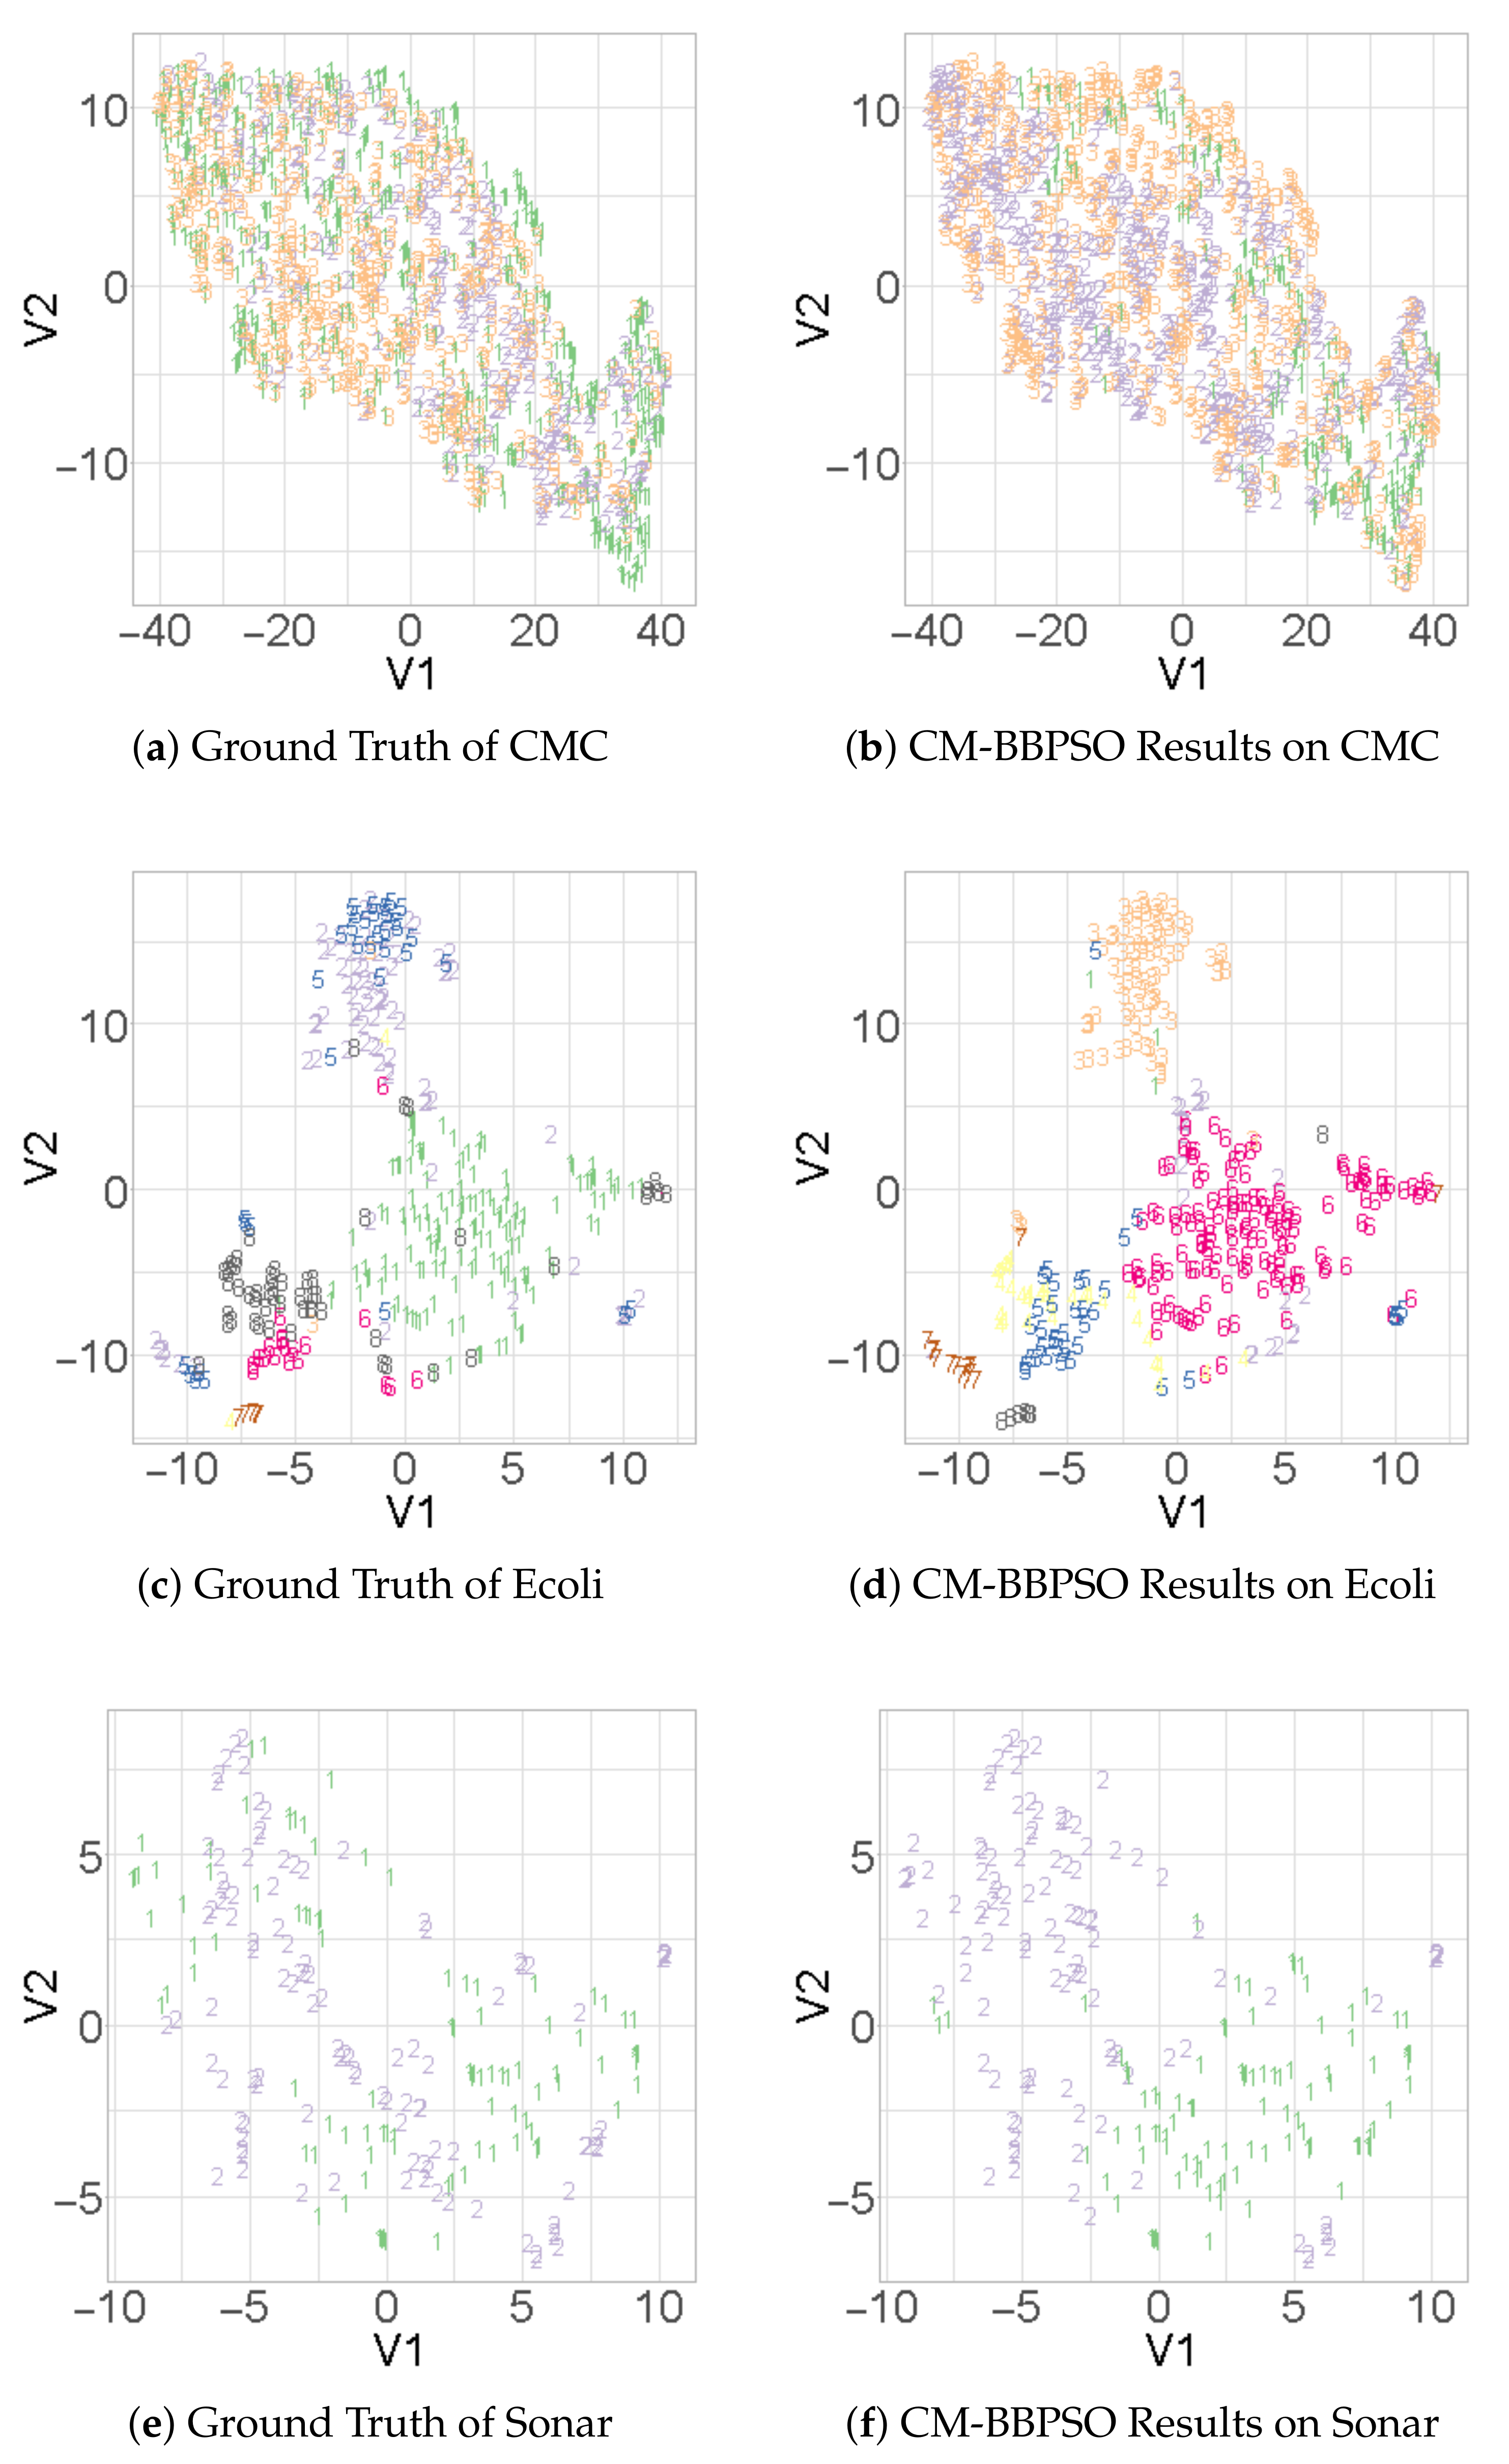
We visually inspect CM-BBPSO clustering by comparing T-SNE biplots with the ground truth. The biplots are generated using R package
, and a perplexity value of 40 is applied to all datasets presented. In
Figure 1a,e, we observe that clusters of CMC and Sonar highly overlap, but CM-BBPSO was able to cluster correctly some data points located between clusters. In
Figure 2a–f, the ground truth and CM-BBPSO clustering biplots of challenging datasets, Glass, Segment and Vehicle, are presented. For contrast, we present the biplot for Iris in
Figure 2h to show that CM-BBPSO can easily find the clusters. Where clusters do not overlap, CM-BBPSO performs with no issues, though its strength is in highly overlapping clusters.
In
Figure 3, convergence plots of connectedness values of particles and their
pbest against the number of iterations for particles using CM-BBPSO on the Appendicitis dataset are presented to show the convergence and, thus, the stability of CM-BBPSO. We observe that the connectedness values of particles and their
pbest converge on all four experiment settings. It is interesting to note that fewer particles dominate the
pbest value as the algorithm reaches near the maximum iteration.
5. Discussion
From the various comparative analysis, it is evident that CM-BBPSO does not perform better than the other algorithms on datasets with well-separated or a small number of clusters, such as Iris, Wine, WOBC and WDBC. Instead, it performs well on highly overlapping clusters, such as Sonar and CMC. Although other MOC results, both from our previous work and from other reported work, outperform CM-BBPSO on Sonar and CMC, we consider the CM-BBPSO to be promising. It used a simple clustering with two clusters for MOEA, and the results are not a lot worse. There was also no setting of parameters apart from the number of clusters, swarm size and maximum iteration. Excluding population size, maximum k and total generations, HT-MOC requires the parameters of neighborhood size, upper limit, branching factor and length of minimum spanning tree links. Excluding the number of objects, total generation and crossover, MOFC-TMS requires the degree of the membrane system.
With the 2-cluster K-means cluster-based approach in MOEA/D, the local search is introduced such that the evolved candidate is evaluated with the cluster closest to it during the dominance check. This brought on the effect of balancing the compactness and well-separatedness of the cluster as shown in
Table 1. Further experimentation is required to study the effects of clustering on solution selection and whether such effects are consistent across other MOC algorithms.
From
Table 2,
Table 3 and
Table 4, we observed that M-Fuzzy works well with the WSS as one of the objectives to achieve good accuracy. Examining all WSS and accuracy results of MOC algorithms from the previous and current work, those with best accuracy also produce the best WSS for 7 out of 13 datasets. Two thoughts came to mind: first, the objective functions in Fuzzy and BBPSO clustering. All BBPSO objective functions are based on [
23]. Using the same objective function as that of Fuzzy clustering on BBPSO clustering may improve it. Second is the objective functions in MOEA. The objective functions WSS and Connectivity in MOEA may not be the best combination for all datasets, and more objective functions can be considered. There is consideration to study the same framework, but with different objective functions [
34]. HT-MOC used variance and connectivity, while MOFC-TMS used
, XB-index and Sym-index. With three objective functions, MOFC-TMS produced good results for challenging datasets, such as CMC and Glass. To test on datasets with highly overlapping clusters, HT-MOC was tested on CoverType and Shuttle datasets. This will be considered in our further investigations.
So far, we applied the cluster-based approach only on MOEA/D BBPSO clustering. From
Table 5, despite having issues on the CMC dataset, M-Fuzzy was found to produce good results; further investigation of applications of the cluster-based technique on it can be considered. The latest cluster-based MOEA techniques were investigated in non-convex clusters in objective space, which is of interest to our future investigation in clustering problems. Furthermore, we would like to investigate adding the cluster representatives in our reproduction pool to guide the evolution of new candidates, which was conducted in [
13], but we did not apply it in this manner. By including cluster representatives, this can increase diversity while applying local search in the objective space during the dominance check. The results from the current work is promising, and this work has opened up potential research directions in applying cluster-based MOEA techniques for data clustering, using as few parameters as possible.
5.1. Implications
The application of clustering on fitness values in the objective space during the dominance check of solution evaluation in MOC added a layer of search control, which affected the properties of the clustering in the decision space as observed in the clusters’ compactness and well-separatedness characteristics of CM-BBPSO, M-BBPSO and BBPSO in their WSS and BSS values.
5.2. Insights
The local search introduced by cluster-based selection approach can be further manipulated through a more advanced design of clustering techniques in MOC to generate refined clusters that can influence the evolution and selection of new candidates.
5.3. Limitations
The following are limitations of this work. Where improvements were found when comparing with MOC from our previous work, CM-BBPSO did not demonstrate significantly large improvements. This could possibly be due to the conservative cluster number of two used in this study. So far, we applied the cluster-based approach only on MOEA/D BBPSO clustering. From
Table 5, despite having issues on the CMC dataset, M-Fuzzy was found to produce good results. Further investigation of applications of the cluster-based technique on it can be considered. Though the latest cluster-based MOEA techniques were investigated in non-convex clusters in the decision space, we did not cover in this work which is of interest to our future investigation. Furthermore, we would like to investigate adding cluster representatives in our reproduction pool to guide the evolution of new candidates, which was conducted in [
13], but we did not apply it in this manner. By including cluster representatives, this can increase diversity while applying local search in the decision space.
5.4. Future Work
Based on our discussion and limitations, we consider the following future work and direction. We will investigate the effect of more clusters and a larger swarm size, such as 40. The investigation of non-convex clusters in the decision space through cluster algorithm design and the addition of cluster representatives in our reproduction pool to guide the evolution of new candidates will be further studied, as the inclusion of cluster representatives in the population pool can increase diversity while applying local search in the decision space. As we used a different clustering objective for M-BBPSO as opposed to M-Fuzzy which performed very well, we will be investigating the objective functions in both the clustering of decision space and MOO parts as well as the effect of adding more objective functions to MOC. As differential evolution (DE) is gaining popularity as an effective swarm intelligence technique, we would like to apply DE in MOC and compare with BBPSO and Fuzzy techniques. To increase rigor in our testing, we will consider including two test datasets with highly overlapping clusters, CoverType and Shuttle datasets, used in testing HT-MOC.
6. Conclusions
The cluster-based multiobjective evolutionary algorithm based on decomposition to find gbest in a bare bones particle swarm optimization clustering framework was developed, tested extensively on 13 UCI datasets and compared with 10 MOC algorithms from a previous study. CM-BBPSO produced competitive results and better results in challenging datasets with highly overlapping clusters that are hard to distinguish, such as CMC, Sonar and Ecoli, when compared with other BBPSOs.
The comparison with MOC from our previous work showed that CM-BBPSO produces competitively good results and is ranked highly on datasets with difficult to distinguish clusters, such as CMC and Sonar.
Through the analysis of the WSS and BSS values, we observed that the effect of clustering in MOEA balances between compactness and well-separatedness characteristics, whereas M-BBPSO and BBPSO highly prioritize one over the other. This demonstrates that the clustering adds another layer of search control in the selection of candidates in MOEA, meaning that a local search is introduced during the dominance evaluation of new solutions against neighbors in the objective space. This opens up new research directions to explore novel local search, using clustering in the objective space of MOC.
Based on a comparative study of the results and methodologies in the reported literature, we found the results of our proposed technique, which uses almost no parameters, to be promising and have identified several areas for future investigation, such as in applying a cluster-based approach to M-Fuzzy, increasing k, and investigation of the choice of objective functions. The proposed technique, though it did not produce the best results, outperformed two of the reported MOC algorithms, VAMOSA and MOAC, on several datasets. We demonstrated that, using simple techniques, such as MOEA/D, BBPSO and K-means, the proposed technique is able to perform competitively.
The results from different experimental settings of swarm size and maximum iteration applied on CM-BBPSO showed that those with a smaller swarm size and maximum iteration of 20 and 100, respectively, can achieve good results, which can also be examined visually using the biplots. Furthermore, the convergence plots of CM-BBPSO showed that the algorithm stabilizes as it reaches maximum iterations.
With the application of advanced techniques or additional objective functions, such as those found in HT-MOC and MOFC-TMS, novel cluster-based MOEA can be developed to solve complex clustering problems. We hope that the discussion of this work, together with the extensive comparisons against existing MOCs across 13 datasets and 6 metrics, can provide a useful reference and demonstration of the feasibility and effectiveness of CM-BBPSO clustering to new or interested practitioners of BBPSO clustering, MOC and cluster-based MOC algorithms.
Author Contributions
Conceptualization, D.T.C.L. and Y.S.; methodology, D.T.C.L. and Y.S.; validation, D.T.C.L.; investigation, D.T.C.L.; resources, D.T.C.L.; data curation, D.T.C.L.; writing—original draft preparation, D.T.C.L.; writing—review and editing, D.T.C.L. and Y.S.; visualization, D.T.C.L.; supervision, D.T.C.L.; project administration, D.T.C.L.; funding acquisition, D.T.C.L. All authors have read and agreed to the published version of the manuscript.
Funding
This research was funded by Universiti Brunei Darussalam Grant UBD/RSCH/1.11/FICBF(b)/2019/001, Hosei University under Hosei International Fund Foreign Scholars Fellowship and JSPS KAKENHI Grant Number JP19K12162.
Institutional Review Board Statement
Not applicable.
Informed Consent Statement
Not applicable.
Data Availability Statement
Conflicts of Interest
The authors declare no conflict of interest. The funding bodies had no role in the design of the study; in the collection, analyses, or interpretation of data; in the writing of the manuscript, or in the decision to publish the results.
Abbreviations
The following abbreviations are used in this manuscript:
| PSO | Particle Swarm Optimization |
| BBPSO | Bare Bones PSO |
| QPSO | Quantum-behaved PSO |
| MOEA/D | Multi Objective Evolutionary Algorithm based on Decomposition |
| MOEA/GLU | Multi Objective Evolutionary Algorithm with Global Loop Update |
| CM-BBPSO | Cluster-based MOEA/D BBPSO |
| IB-Fuzzy | Indicator-based Evolutionary Algorithm Fuzzy |
| IB-QPSO | Indicator-based Evolutionary Algorithm QPSO |
| M-Fuzzy | MOEA/D Fuzzy |
| M-QPSO | MOEA/D QPSO |
| M-BBPSO | MOEA/D BBPSO |
| MG-Fuzzy | MOEA/GLU Fuzzy |
| MG-QPSO | MOEA/GLU QPSO |
| MG-BBPSO | MOEA/GLU BBPSO |
| SP-QPSO | Strength Pareto Evolutionary Algorithm 2 QPSO |
| WSS | Within-cluster Sum of Squares |
| BSS | Between-clusters Sum of Squares |
| QE | Quantization Error |
References
- Hruschka, E.R.; Campello, R.J.; Freitas, A.A.; de Carvalho, A.C.P.L.F. A survey of evolutionary algorithms for clustering. IEEE Trans. Syst. Man Cybern. Part (Appl. Rev.) 2009, 39, 133–155. [Google Scholar] [CrossRef] [Green Version]
- Law, M.H.; Topchy, A.P.; Jain, A.K. Multiobjective data clustering. In Proceedings of the 2004 IEEE Computer Society Conference on Computer Vision and Pattern Recognition, CVPR 2004, Washington, DC, USA, 27 June 2004–2 July 2014; IEEE: Piscataway, NJ, USA, 2004; Volume 2, p. II. [Google Scholar]
- Maulik, U.; Bandyopadhyay, S.; Mukhopadhyay, A. Multiobjective Genetic Algorithms for Clustering: Applications in Data Mining and Bioinformatics; Springer Science & Business Media: Berlin/Heidelberg, Germany, 2011. [Google Scholar]
- Lai, D.T.C.; Sato, Y. Hybrid Multiobjective Evolutionary Algorithms for Unsupervised QPSO, BBPSO and Fuzzy clustering. In Proceedings of the 2021 IEEE Congress on Evolutionary Computation (CEC), Krakow, Poland, 28 June–1 July 2021; IEEE: Piscataway, NJ, USA, 2021; pp. 696–703. [Google Scholar]
- Yang, D.; Yang, H.; Fei, R. An efficient SAR image segmentation framework using transformed nonlocal mean and multi-objective clustering in kernel space. Algorithms 2015, 8, 32–45. [Google Scholar] [CrossRef] [Green Version]
- Mukhopadhyay, A.; Maulik, U.; Bandyopadhyay, S. A survey of multiobjective evolutionary clustering. ACM Comput. Surv. (CSUR) 2015, 47, 61. [Google Scholar] [CrossRef]
- Mukhopadhyay, A.; Maulik, U.; Bandyopadhyay, S.; Coello, C.A.C. A survey of multiobjective evolutionary algorithms for data mining: Part I. IEEE Trans. Evol. Comput. 2013, 18, 4–19. [Google Scholar] [CrossRef]
- Garcia-Piquer, A.; Fornells, A.; Bacardit, J.; Orriols-Puig, A.; Golobardes, E. Large-scale experimental evaluation of cluster representations for multiobjective evolutionary clustering. IEEE Trans. Evol. Comput. 2014, 18, 36–53. [Google Scholar] [CrossRef]
- Que, X.; Jiang, S.; Yang, J.; An, N. A Similarity Measurement with Entropy-Based Weighting for Clustering Mixed Numerical and Categorical Datasets. Algorithms 2021, 14, 184. [Google Scholar] [CrossRef]
- Caruso, G.; Gattone, S.A.; Balzanella, A.; Di Battista, T. Cluster analysis: An application to a real mixed-type data set. In Models and Theories in Social Systems; Springer: Berlin/Heidelberg, Germany, 2019; pp. 525–533. [Google Scholar]
- Rosenman, M.; Gero, J. Reducing the Pareto optimal set in multicriteria optimization (with applications to Pareto optimal dynamic programming). Eng. Optim. 1985, 8, 189–206. [Google Scholar] [CrossRef]
- Liu, S.; Zheng, J.; Lin, Q.; Tan, K.C. Evolutionary multi and many-objective optimization via clustering for environmental selection. Inf. Sci. 2021, 578, 930–949. [Google Scholar] [CrossRef]
- Denysiuk, R.; Costa, L.; Santo, I.E. Clustering-based selection for evolutionary many-objective optimization. In Proceedings of the International Conference on Parallel Problem Solving from Nature, Ljubljana, Slovenia, 13–17 September 2014; Springer: Berlin/Heidelberg, Germany, 2014; pp. 538–547. [Google Scholar]
- Chen, J.; Feng, Q.; Guo, Q. Multi-Class Freeway Congestion and Emission Based on Robust Dynamic Multi-Objective Optimization. Algorithms 2021, 14, 266. [Google Scholar] [CrossRef]
- Dua, D.; Graff, C. UCI Machine Learning Repository; University of California Irvine: Irvine, CA, USA, 2017. [Google Scholar]
- Agrawal, S.; Panigrahi, B.K.; Tiwari, M.K. Multiobjective particle swarm algorithm with fuzzy clustering for electrical power dispatch. IEEE Trans. Evol. Comput. 2008, 12, 529–541. [Google Scholar] [CrossRef]
- Sahraei, S.; Asadzadeh, M. Cluster-based multi-objective optimization for identifying diverse design options: Application to water resources problems. Environ. Model. Softw. 2021, 135, 104902. [Google Scholar] [CrossRef]
- Hua, Y.; Jin, Y.; Hao, K. A clustering-based adaptive evolutionary algorithm for multiobjective optimization with irregular Pareto fronts. IEEE Trans. Cybern. 2018, 49, 2758–2770. [Google Scholar] [CrossRef]
- Chen, J.; Yu, Y.; Guo, Q. Freeway traffic congestion reduction and environment regulation via model predictive control. Algorithms 2019, 12, 220. [Google Scholar] [CrossRef] [Green Version]
- Zhu, S.; Xu, L.; Goodman, E.D. Hierarchical Topology-Based Cluster Representation for Scalable Evolutionary Multiobjective Clustering. IEEE Trans. Cybern. 2021, 1–15. [Google Scholar] [CrossRef]
- Armano, G.; Farmani, M.R. Multiobjective clustering analysis using particle swarm optimization. Expert Syst. Appl. 2016, 55, 184–193. [Google Scholar] [CrossRef]
- Wang, Y.; Li, X.; Wong, K.C.; Chang, Y.; Yang, S. Evolutionary Multiobjective Clustering Algorithms With Ensemble for Patient Stratification. IEEE Trans. Cybern. 2021, 1–14. [Google Scholar] [CrossRef] [PubMed]
- Omran, M.; Al-Sharhan, S. Barebones particle swarm methods for unsupervised image classification. In Proceedings of the 2007 IEEE Congress on Evolutionary Computation, CEC 2007, Singapore, 25–28 September 2007; IEEE: Piscataway, NJ, USA, 2007; pp. 3247–3252. [Google Scholar]
- Jiang, B.; Wang, N. Cooperative bare-bone particle swarm optimization for data clustering. Soft Comput. 2014, 18, 1079–1091. [Google Scholar] [CrossRef]
- Peng, H.; Shi, P.; Wang, J.; Riscos-Núñez, A.; Pérez-Jiménez, M.J. Multiobjective fuzzy clustering approach based on tissue-like membrane systems. Knowl. Based Syst. 2017, 125, 74–82. [Google Scholar] [CrossRef]
- Kushwaha, N.; Pant, M.; Kant, S.; Jain, V.K. Magnetic optimization algorithm for data clustering. Pattern Recognit. Lett. 2018, 115, 59–65. [Google Scholar] [CrossRef]
- Guo, C.; Tang, H.; Niu, B. Evolutionary state-based novel multi-objective periodic bacterial foraging optimization algorithm for data clustering. Expert Syst. 2021, e12812. [Google Scholar] [CrossRef]
- Kennedy, J. Bare bones particle swarms. In Proceedings of the IEEE Swarm Intelligence Symposium, 2003, SIS’03, Indianapolis, IN, USA, 24–26 April 2003; pp. 80–87. [Google Scholar]
- Zhang, Q.; Li, H. MOEA/D: A multiobjective evolutionary algorithm based on decomposition. IEEE Trans. Evol. Comput. 2007, 11, 712–731. [Google Scholar] [CrossRef]
- Lai, D.T.C.; Miyakawa, M.; Sato, Y. Semi-supervised data clustering using particle swarm optimisation. Soft Comput. 2020, 24, 3499–3510. [Google Scholar] [CrossRef]
- Saha, S.; Bandyopadhyay, S. A symmetry based multiobjective clustering technique for automatic evolution of clusters. Pattern Recognit. 2010, 43, 738–751. [Google Scholar] [CrossRef]
- Saha, S.; Bandyopadhyay, S. A generalized automatic clustering algorithm in a multiobjective framework. Appl. Soft Comput. 2013, 13, 89–108. [Google Scholar] [CrossRef]
- Zhang, Y.; Zeng, B.; Li, Y.; Li, J. A mullti-or many-objective evolutionary algorithm with global loop update. arXiv 2018, arXiv:1803.06282. [Google Scholar]
- Basheer, A.; Lai, D.T.C. A Comparative Study of Multi-Objective Functions in MOEA/D and Their Effects on Fuzzy Clustering. In Proceedings of the AIP Conference Proceedings, 8th Brunei International Conference on Engineering and Technology (BICET 2021), Bandar Seri Begawan, Brunei, 8–10 November 2021; AIP Publishing: Melville, NY, USA, 2021. [Google Scholar]
Figure 1.
T-SNE biplots of CM-BBPSO best performing datasets. (a,c,e) Ground Truth for CMC, Ecoli and Sonar, respectively, and their corresponding CM-BBPSO results in (b,d,f).
Figure 1.
T-SNE biplots of CM-BBPSO best performing datasets. (a,c,e) Ground Truth for CMC, Ecoli and Sonar, respectively, and their corresponding CM-BBPSO results in (b,d,f).
Figure 2.
T-SNE biplots of other datasets with overlapping clusters and of Iris. (a,c,e,g) Ground Truth for Glass, Segment, Vehicle and Iris respectively and their corresponding CM-BBPSO results in (b,d,f,h).
Figure 2.
T-SNE biplots of other datasets with overlapping clusters and of Iris. (a,c,e,g) Ground Truth for Glass, Segment, Vehicle and Iris respectively and their corresponding CM-BBPSO results in (b,d,f,h).
Figure 3.
Convergence plot of particles p and their where p dominates pbest in line 9 in Algorithm 1 on Appendicitis dataset using different swarm size (s) and maximum iterations (i), labeled as s-i in (a–d).
Figure 3.
Convergence plot of particles p and their where p dominates pbest in line 9 in Algorithm 1 on Appendicitis dataset using different swarm size (s) and maximum iterations (i), labeled as s-i in (a–d).
Table 1.
Performance of cluster-based MOEA/D (CM), MOEA/D (M) and ordinary BBPSOs with the best result produced by the algorithm for each dataset presented in bold.
Table 1.
Performance of cluster-based MOEA/D (CM), MOEA/D (M) and ordinary BBPSOs with the best result produced by the algorithm for each dataset presented in bold.
| Dataset | BBPSO | Accuracy | F1 | Kappa | BSS | WSS | QE |
|---|
| Appendicitis | CM-BBPSO | | | | | | |
| | M-BBPSO | | | | | | |
| | BBPSO | | | | | | |
| CMC | CM-BBPSO | | | | | | |
| | M-BBPSO | | | | | | |
| | BBPSO | | | | 16,600±3680 | | |
| Dermatology | CM-BBPSO | | | | | | |
| | M-BBPSO | | | | | | |
| | BBPSO | | | | 10,300 | | |
| Ecoli | CM-BBPSO | | | | | | |
| | M-BBPSO | | | | | | |
| | BBPSO | | | | | | |
| Glass | CM-BBPSO | | | | | | |
| | M-BBPSO | | | | | | |
| | BBPSO | | | | | | |
| Iris | CM-BBPSO | | | | | | |
| | M-BBPSO | | | | | | |
| | BBPSO | | | | | | |
| Seeds | CM-BBPSO | | | | | | |
| | M-BBPSO | | | | | | |
| | BBPSO | | | | | | |
| Segment | CM-BBPSO | | | | 23,700 ± 3610 | | |
| | M-BBPSO | | | | 23,500 ± 2980 | | |
| | BBPSO | | | | 33,700 | | |
| Sonar | CM-BBPSO | | | | | | |
| | M-BBPSO | | | | | | |
| | BBPSO | | | | 21,300±11,200 | | |
| Vehicle | CM-BBPSO | | | | 11,100 ± 2310 | | |
| | M-BBPSO | | | | 10,600 ± 2200 | | |
| | BBPSO | | | | 17,500±3130 | | |
| WDBC | CM-BBPSO | | | | | | |
| | M-BBPSO | | | | | | |
| | BBPSO | | | | 37,300±10,200 | | |
| Wine | CM-BBPSO | | | | | | |
| | M-BBPSO | | | | | | |
| | BBPSO | | | | | | |
| WOBC | CM-BBPSO | | | | | | |
| | M-BBPSO | | | | | | |
| | BBPSO | | | | | | |
Table 2.
Performance of CM-BBPSO and other clustering algorithms on CMC dataset with the best result produced by the algorithm presented in bold.
Table 2.
Performance of CM-BBPSO and other clustering algorithms on CMC dataset with the best result produced by the algorithm presented in bold.
| Clus Algo | Accuracy | F1 | Kappa | BSS | WSS | QE |
|---|
| CM-BBPSO | | | | | | |
| IB-Fuzzy | | | | | | |
| IB-QPSO | | | | | | |
| M-Fuzzy | | | | | | |
| M-QPSO | | | | | | |
| M-BBPSO | | | | | | |
| MG-Fuzzy | | | | | | |
| MG-QPSO | | | | | | |
| MG-BBPSO | | | | | | |
| SP-QPSO | | | | | | |
| BBPSO | | | | 16,600±3680 | | |
Table 3.
Performance of CM-BBPSO and other clustering algorithms on Segment dataset with the best result produced by the algorithm presented in bold.
Table 3.
Performance of CM-BBPSO and other clustering algorithms on Segment dataset with the best result produced by the algorithm presented in bold.
| Clus Algo | Accuracy | F1 | Kappa | BSS | WSS | QE |
|---|
| CM-BBPSO | | | | 23,700±3610 | | |
| IB-Fuzzy | | | | 18,900 ± 3580 | | |
| IB-QPSO | | | | 20,000 ±5920 | | |
| M-Fuzzy | | | | 22,600 ± 3780 | | |
| M-QPSO | | | | 24,800 ± 2610 | | |
| M-BBPSO | | | | 23,500 ± 2980 | | |
| MG-Fuzzy | | | | | | |
| MG-QPSO | | | | | | |
| MG-BBPSO | | | | | | |
| SP-QPSO | | | | 23,900 ± 3980 | | |
| BBPSO | | | | 33,700 ±4470 | | |
Table 4.
Performance of CM-BBPSO and other clustering algorithms on Vehicle dataset with the best result produced by the algorithm presented in bold.
Table 4.
Performance of CM-BBPSO and other clustering algorithms on Vehicle dataset with the best result produced by the algorithm presented in bold.
| Clus Algo | Accuracy | F1 | Kappa | BSS | WSS | QE |
|---|
| CM-BBPSO | | | | 11,100 ± 2310 | | |
| IB-Fuzzy | | | | | | |
| IB-QPSO | | | | | | |
| M-Fuzzy | | | | 10,200 ± 1360 | | |
| M-QPSO | | | | | | |
| M-BBPSO | | | | 10,600 ± 2200 | | |
| MG-Fuzzy | | | | | | |
| MG-QPSO | | | | | | |
| MG-BBPSO | | | | | | |
| SP-QPSO | | | | | | |
| BBPSO | | | | 17,500±3130 | | |
Table 5.
Sum rank of algorithms based on performances on 6 metrics on all datasets with best two sum rank values presented in bold.
Table 5.
Sum rank of algorithms based on performances on 6 metrics on all datasets with best two sum rank values presented in bold.
| Clus Algo | Accuracy | F1 | Kappa | QE | WSS | BSS | Total |
|---|
| M-Fuzzy | 51 | 45 | 47 | 29 | 34 | 70 | 276 |
| M-BBPSO | 54 | 54 | 54 | 61 | 57 | 66 | 346 |
| M-QPSO | 57 | 56 | 58 | 73 | 63 | 56 | 363 |
| SP-QPSO | 62 | 76 | 69 | 67 | 30 | 105 | 409 |
| BBPSO | 67 | 62 | 67 | 102 | 111 | 13 | 422 |
| CM-BBPSO | 83 | 77 | 82 | 95 | 102 | 52 | 491 |
| IB-Fuzzy | 99 | 88 | 96 | 52 | 101 | 86 | 522 |
| IB-QPSO | 96 | 100 | 101 | 104 | 101 | 104 | 606 |
| MG-BBPSO * | 76 | 84 | 80 | 57 | 49 | 85 | 431 |
| MG-QPSO * | 73 | 85 | 77 | 94 | 67 | 113 | 509 |
| MG-Fuzzy * | 99 | 88 | 91 | 69 | 105 | 73 | 525 |
Table 6.
Sum rank of algorithms based on performances on 6 metrics on CMC and Sonar datasets with best two sum rank values presented in bold.
Table 6.
Sum rank of algorithms based on performances on 6 metrics on CMC and Sonar datasets with best two sum rank values presented in bold.
| Clus Algo | Accuracy | F1 | Kappa | QE | WSS | BSS | Total |
|---|
| M-Fuzzy | 5 | 5 | 5 | 4 | 3 | 13 | 35 |
| CM-BBPSO | 6 | 5 | 5 | 11 | 15 | 4 | 46 |
| MG-Fuzzy | 10 | 5 | 4 | 9 | 13 | 9 | 50 |
| IB-Fuzzy | 9 | 5 | 6 | 7 | 11 | 13 | 51 |
| M-QPSO | 11 | 10 | 10 | 11 | 12 | 7 | 61 |
| M-BBPSO | 13 | 13 | 13 | 8 | 10 | 12 | 69 |
| IB-QPSO | 10 | 16 | 15 | 17 | 15 | 12 | 85 |
| SP-QPSO | 13 | 19 | 19 | 12 | 6 | 19 | 88 |
| BBPSO | 17 | 14 | 15 | 20 | 20 | 2 | 88 |
| MG-BBPSO * | 12 | 15 | 14 | 10 | 7 | 17 | 75 |
| MG-QPSO * | 16 | 16 | 16 | 14 | 10 | 15 | 87 |
Table 7.
Sum rank values of algorithms for all 6 metrics for each dataset with best two algorithms presented in bold.
Table 7.
Sum rank values of algorithms for all 6 metrics for each dataset with best two algorithms presented in bold.
| Dataset | CM-BBPSO | M-Fuzzy | M-BBPSO | SP-QPSO | BBPSO | IB-Fuzzy | IB-QPSO | M-QPSO | MG-BBPSO | MG-QPSO | MG-Fuzzy |
|---|
| Appendicitis | 54 | 12 | 46 | 30 | 35 | 29 | 61 | 32 | 37 | 47 | 12 |
| CMC | 20 | 11 | 33 | 31 | 39 | 33 | 44 | 25 | 36 * | 36 * | 33 |
| Dermatology | 36 | 34 | 23 | 15 | 25 | 51 | 56 | 27 | 42 | 29 | 57 |
| Ecoli | 36 | 34 | 32 | 24 | 50 | 52 | 37 | 23 | 26 | 27 | 52 |
| Glass | 48 | 27 | 22 | 20 | 46 | 52 | 43 | 28 | 28 | 27 | 50 |
| Iris | 44 | 37 | 33 | 40 | 10 | 51 | 33 | 38 | 19 | 22 | 57 |
| Seeds | 46 | 31 | 22 | 32 | 6 | 56 | 49 | 15 | 29 | 43 | 65 |
| Sonar | 26 | 24 | 36 | 57 | 49 | 18 | 41 | 36 | 39 | 51 | 17 |
| WDBC | 31 | 10 | 16 | 58 | 41 | 38 | 51 | 27 | 46 | 53 | 24 |
| Wine | 34 | 19 | 18 | 34 | 23 | 55 | 47 | 22 | 34 | 54 | 52 |
| WOBC | 53 | 16 | 25 | 15 | 51 | 25 | 63 | 33 | 31 | 48 | 34 |
| Segment | 35 | 11 | 18 | 24 | 28 | 33 | 46 | 21 | 36 * | 36 * | 36 * |
| Vehicle | 28 | 10 | 22 | 29 | 19 | 29 | 35 | 36 * | 28 | 36 * | 36 * |
| Total | 491 | 276 | 346 | 409 | 422 | 522 | 606 | 363 * | 431 * | 509 * | 525 * |
Table 8.
Comparison of CM-BBPSO with other reported cluster-based MOC, MOC and BBPSO clustering algorithms.
Table 8.
Comparison of CM-BBPSO with other reported cluster-based MOC, MOC and BBPSO clustering algorithms.
| | CMC | WOBC | Iris | Glass | Wine |
|---|
| | Acc | F1 | Acc | F1 | Acc | F1 | Acc | F1 | Acc | F1 |
|---|
| CM-BBPSO | 0.402 | 0.371 | 0.896 | 0.865 | 0.721 | 0.672 | 0.429 | 0.351 | 0.719 | 0.691 |
| HT-MOC (best) [20] | | | 0.961 | | | | | | 0.951 | |
| MOFC-TMS [25] | | 0.653 | | 0.97 | | 0.836 | | 0.501 | | 0.696 |
| GenClustMOO [32] | | 0.647 | | 0.969 | | 0.823 | | 0.503 | | 0.698 |
| VAMOSA [31] | | 0.593 | | 0.816 | | 0.682 | | 0.415 | | 0.516 |
| MOAC [26] | 0.401 | | | | 0.218 | | 0.893 | | | |
| ES-NMPBFO [27] | 0.448 | 0.478 | | | 0.886 | 0.834 | | | | |
| CBPSO [24] | 0.398 | | 0.961 | | 0.908 | | 0.509 | | 0.711 | |
Table 9.
Performances of CM-BBPSO using different swarm size (s) and maximum iteration (i), s-i with the best result produced by the s-i setting for each dataset presented in bold.
Table 9.
Performances of CM-BBPSO using different swarm size (s) and maximum iteration (i), s-i with the best result produced by the s-i setting for each dataset presented in bold.
| | Appendicitis | CMC | Dermatology | Ecoli |
|---|
| s-i | Accuracy | QE | Accuracy | QE | Accuracy | QE | Accuracy | QE |
| 20-100 | | | | | | | | |
| 30-100 | | | | | | | | |
| 30-200 | | | | | | | | |
| 40-100 | | | | | | | | |
| | Glass | Iris | Seeds | Segment |
| s-i | Accuracy | QE | Accuracy | QE | Accuracy | QE | Accuracy | QE |
| 20-100 | | | | | | | | |
| 30-100 | | | | | | | | |
| 30-200 | | | | | | | | |
| 40-100 | | | | | | | | |
| | Sonar | Vehicle | WDBC | Wine |
| s-i | Accuracy | QE | Accuracy | QE | Accuracy | QE | Accuracy | QE |
| 20-100 | | | | | | | | |
| 30-100 | | | | | | | | |
| 30-200 | | | | | | | | |
| 40-100 | | | | | | | | |
| | WOBC | | | |
| s-i | Accuracy | QE | | | | | | |
| 20-100 | | | | | | | | |
| 30-100 | | | | | | | | |
| 30-200 | | | | | | | | |
| 40-100 | | | | | | | | |
| Publisher’s Note: MDPI stays neutral with regard to jurisdictional claims in published maps and institutional affiliations. |
© 2021 by the authors. Licensee MDPI, Basel, Switzerland. This article is an open access article distributed under the terms and conditions of the Creative Commons Attribution (CC BY) license (https://creativecommons.org/licenses/by/4.0/).


