1. Introduction
Dimension reduction of high dimensional data is an important problem in a wide variety of domains. Whether it is the field of genomics, proteomics or medical informatics, dimension reduction always poses a challenge to extract meaningful information in low dimension for visualization, classification and other down-stream analysis. Traditionally, three different kinds of approaches are used for dimension reduction which try to preserve one of three factors: distances between data points, local topology, or the overall information in the data. While principal component analysis is an information preserving method, multidimensional scaling (MDS) and Sammon mapping preserve distance [
1], whereas methods such as t-SNE [
2] and Locally-Linear embedding (LLE) [
3] are nonlinear dimension-reduction techniques which aim to preserve local structure of data [
4]. These methods of dimension reduction have their own criteria and cost-function which they try to minimize. Sammon mapping tries to minimize the squared difference among scaled distances in high and low dimension normalised by the original distance in the high-dimensional space. One of the popular methods of dimension reduction, t-SNE aims to minimize cost function similar to SNE (stochastic neighbor embedding). SNE cost function [
5] is based on Kullback-Leibler divergences between the conditional probabilities of neighborhood based on Gaussian distribution. The SNE cost function does not allow the collapse of similar data-points and it emphasizes local distances which often leads to loss of information about the global topology. A class of non-linear dimension reduction methods such as Self organising map (SOM) focuses on assigning (or collapsing) data-points to predefined coordinates (lattice). SOM is often used to make an initial prediction of manifold [
6]. Even though SOM tends to provide visualization of local neighborhood among groups of data-points, it is not able to properly represent heterogeneity-based local topology or global distance information.
Methods which are mainly designed for local topology-based visualization [
2,
7,
8] often lose information needed for other downstream analysis. On the other hand, preserving global topology of distances has its own importance in dimension reduction, especially for downstream analysis steps such as clustering, phylogenetic analysis, or regression. However, while optimization of cost function of MDS, most often large distance dominate and cause a collapse of data-points [
9] which have some similarity among each-other but are distinct. Given recent trends in biological data-set, the collapse of data-points in lower dimensions could lead to loss of valuable and useful information. Single-cell transcriptome and proteome data-sets are meant to highlight differences among between cell-groups as well as heterogeneity among every cell so that the gradient of cell-states can be studied [
10,
11]. Similarly, while studying a cohort of individuals, we would like to visualise a large difference between diseased and normal cases as well as exploit heterogeneity among patients for stratification. Hence there is need for a method which can preserve distance information as well as local topology. Biomedical data analysts could benefit from such methods which could avoid artefact due to outlier effect of large distances as well as avoid collapse of data-points while preserving distances needed for downstream procedures such as clustering and machine learning. Hence we developed an approach to extend pre-existing distance preserving dimension reduction method, MDS, such that local topology can also be preserved to desirable extent to tackle its above mentioned weaknesses.
We call our method as Topology preserving distance scaling (TPDS). TPDS uses the approach of distance shrinkage before using the method of non-metric MDS. The objective of TPDS is not only to improve visualization such as t-SNE, but represent data in low dimension such that other procedures such as classification could be made more efficient. Here we first provide the description about TPDS then explain the cost function involved in learning its parameters. Then in result section, we describe results for four different kinds of data-sets. Later we discuss a few strengths and weaknesses of TPDS.
2. Methods
We follow the approach of distance scaling so that even if a distance preservation-based method is used, the local topology remains intact. In our approach, the MDS method tries to preserve the distances; however due to warping (shrinkage) of distances among data-points, the local topology could also be preserved. However, for this purpose, some prior guess of manifold and local topology is needed. Therefore, we first use self organising map (SOM) to get a rough estimate of groups and initial prediction of the manifold. The grouping of data-points by SOM need not to be necessarily correct, but it provides an estimate of neighborhood to be used by TPDS. Moreover, if the number of features is too large, one can first perform singular value decomposition (SVD) of data and use singular vectors with SOM. After a rough estimation of manifold and neighborhood, we scale the distance between the data-points using their belonging-ness to different groups and distance between group means. Notice that SOM has its own neighbourhood function which is shrunk during optimization. However, SOM is constrained by its geometry which often causes the collapse of data-points and loss of distances information. Therefore we do not need to be totally dependent on SOM but derive likelihood of proximity using output from SOM so that distance and local topology can be represented well. Therefore scaling function used by TPDS consists of an attractive and a repulsive component. For this purpose we define
as likelihood of proximity between two data-points
i and
j belonging to two different SOM clusters with centers
and
as
Here
is the normalised distance between cluster centers
and
to which data-points
i and
j belong. The spread factor
is just like the variance in Gaussian distribution. The centre of every SOM clusters is calculated by averaging its data-points. The
is normalised by division with mean of all distances between cluster centers. If data-points
i and
j belong to same SOM cluster the value of
is calculated using distance
between them
Notice that variable
is the same as in Equation (
1) and
is a multiplying factor less than 1. The purpose of
is to inflate local distances wherever the data-points lie in the same cluster so that we can avoid their collapse. Thus, using two different ways of calculating
depending on whether two data-points belong to same SOM cluster or not, helps in maintaining local topology for data-points belonging to same SOM cluster. We calculate the scaling factor for the distance between data-points
and
using the formula.
Here is a pseudo-count to stop the scaling factor to go to infinity.
After calculating the scaling factor, the distance between data-points are scaled using the formula
The matrix of scaled distances
is then used with the non-metric MDS method to reduce the dimension. Please note that the value of the denominator in scaling factor defined in Equation (
3) is controlled by the likelihood of proximity which itself becomes very small for large distances. The scaling factor is made such that it enhances the effect of the likelihood of proximity. When the likelihood of proximity
is low the scaling factor
increases and inflates the distance, hence it behaves like a repulsive force. However, when the likelihood
is high and reaches closer to 1, the value of
decrease to create an attractive force to shrink the distance
. Thus, we inflate and shrink distances according to the likelihood of proximity between data-points or their centres of clusters. Also notice that the likelihood is calculated in two different ways, depending on the condition whether two data-points belong to same SOM cluster or not. If data-points belong to same SOM cluster, the likelihood of their proximity is decreased so that the distances between them are inflated slightly. Such inflation of distances of data-points belonging to the same cluster, helps to avoid crowding and collapse while optimising for distance preservation-based dimension reduction.
2.1. Adjusting Spread Factor for Balance between Distance-Stress and Local Topology
The spread factor
in Equation (
1) indirectly controls the level of scaling of distances. If the value of
is low, the likelihood of proximity for larger distances become negligible and the local topology neighborhood is also small. Whereas if the value of
is high, larger distances are not ignored while scaling and lead to preservation of global structure of distances but may suppress local topology information. Hence optimization for
is an important step for TPDS. For optimization of
we use a combination of two well-known costs, namely distance-stress and a local-topology preserving strain. TPDS chooses the value of spread factor
which minimizes the cost function, which is defined as
where
is the Lagrange multiplier,
C is distance-based stress which measures the preservation of global distances pattern, and
E is a local-topology preserving constraint. TPDS uses a default value of
; however, a different value of
could also be used. Please note that we do not differentiate the cost function mentioned in Equation (
5) to learn
but perform a grid search with a fixed step size to find the value of
at which
is lowest. The grid search is done through use of a multiplying factor multiplied to standard deviation of distance matrix as explained in Algorithm-1. It is just meant to choose the correct scaled distance matrix to be provided to the non-metric MDS method for dimension reduction. Thus, TPDS also provides flexibility in choosing the level of preservation of local topology through
.
Distance-based stress is the cost function used by MDS, which can be defined as the sum of differences among distances in high dimension and reduced dimension
Here
is the distance between two data-points
and
in higher dimension space and
is distance in reduced dimension. The cost represented in Equation (
5) is often called at distance stress, which we term here as MDS-cost.
The strain of local topology preservation could be formulated using different approaches based on hard KNN or smooth neighborhood preservation [
12,
13]. To test our model, we have used the cost function associated with symmetric SNE. As proposed by Lauren et al. [
2] symmetric-SNE is a modification of SNE-based approach. The symmetric-SNE cost function consists of single Kullback–Leibler divergence between a joint probability distribution, P, in the high-dimensional space and a joint probability distribution, Q, in the low-dimensional space
where
and
is set to zero. Here it is called symmetric SNE because
and
as these pair wise similarities are defined as
and
in a higher dimension. Here
n is the number of data-points. We keep the value of
at perplexity = 15 [
2].
In the lower dimension, the likelihood of distances is determined as
Here and represent coordinates of data-points in lower dimension.
Overall the algorithm used by TPDS can be written as
| Algorithm 1: The algorithm of TPDS |
 |
2.2. Optimization of Parameters
Most of the internal parameters used by TPDS were tuned to provide satisfactory performance. Such parameters which do not need optimization include the number of iterations and step size to search the value of spread factor to minimize Equation (
5) (see Algorithm 1). The grid search method used for different data-set here was done using 5–10 values for spread factor
, however TPDS also allows more step size in case if it is needed. However, TPDS is dependent on two important external parameters which can influence the quality of results. The first external parameter is Lagrange multiplier
shown in Equation (
5). As explained above, the value of
helps in calculation of spread factor. The second external parameter is grid size of SOM. The grid size of SOM should be kept according to the expected number of classes for better visualization; however, it is not necessary for downstream analysis methods such as supervised classification or machine learning. if the value of grid-size is large (above 50), TPDS can still produce a satisfactory result. Here we have kept the value of grid-size between 20–60 for the data-sets used for evaluation.
2.3. Experimental Setup
We compared the performance of TPDS with two types of dimension reduction methods which were proven to be efficient on different kinds of data-sets. Moreover, target of TPDS is not exactly the same as t-SNE, i.e., to improve only visualization of data. Therefore for evaluation, we used four data-sets which could represent the application of dimension reduction in different branches of Biomedical data analysis. We used two data-sets with physiological features, one protein-expression profile and a large single-cell gene-expression matrix for evaluation. One of the physiological data-sets used here, consisted of features derived from the speech of normal individuals and Parkinson’s disease [
14]. Every replicate for an individual was considered as a data-point. The other physiological data-set called SCADI (Self-Care Activities Dataset based on ICF-CY) is based on ICF-CY ( International Classification of Functioning, Disability and Health for Children and Youth) [
15]. The SCADI data-set contains self-care attributes of 70 children with physical and motor disability based on ICF-CY. A protein expression data-set was also used to evaluate TPDS. This protein expression data-set consists of the expression levels of 77 proteins/protein modifications using samples from the nuclear fraction of cortex of mouse [
16]. We also used a data set of single-cell expression profile which contained RNA-seq read-counts from cells belonging to seven cell-lines [
17]. Single-cell expression data set had outliers which added a new dimension of evaluation of the robustness of different dimension reduction methods. Thus, all the data sets used here had class labels which helped in evaluating the performance of clustering after dimension-reduction. To evaluate the usability of dimension reduction methods we have used two different approaches of clustering namely k-means and DBSCAN (Density-Based Spatial Clustering of Applications with Noise) [
18].
3. Results
To evaluate TPDS we used have data sets where both classification and visualization are needed for making a useful inference. The first data set used here for evaluation was generated by Naranjo et al. [
14], and it consists of feature extracted from speech recording of normal individuals and Parkinon’s disease patients. For every patient or individual, there are 4 replicate of data points which have 44 features. In the original manuscript, authors have used supervised classification approach to classify the normal and Parkison’s cases. We applied our unsupervised method of reducing the dimension.
As shown in
Figure 1 for Naranjo et al.’s data set [
14] the data-points belonging to normal and Parkinson’s disease are shown with two colours. Sammon mapping, non-metric MDS and t-SNE are not able to show separability of data-points belonging to two classes. However, TPDS revealed clear separability between Parkinson’s and normal cases and had lower MDS-cost than t-SNE. Furthermore, we performed k-mean clustering (k = 2) on the output from TPDS and other tested methods. We calculated clustering purity using the adjusted Rand index (ARI) and normalized mutual information (NMI). K-mean clustering on output from TPDS had the highest purity as the ARI and NMI scores were almost 1.7–2 times greater than other method used (tSNE, non-metric MDS and Sammon mapping) (see
Figure 1). We also checked clustering purity after applying DBSCAN to cluster data-points in low-dimension. Even with DBSCAN-based classification, TPDS provided best clustering purity among tested methods (see
Table 1).
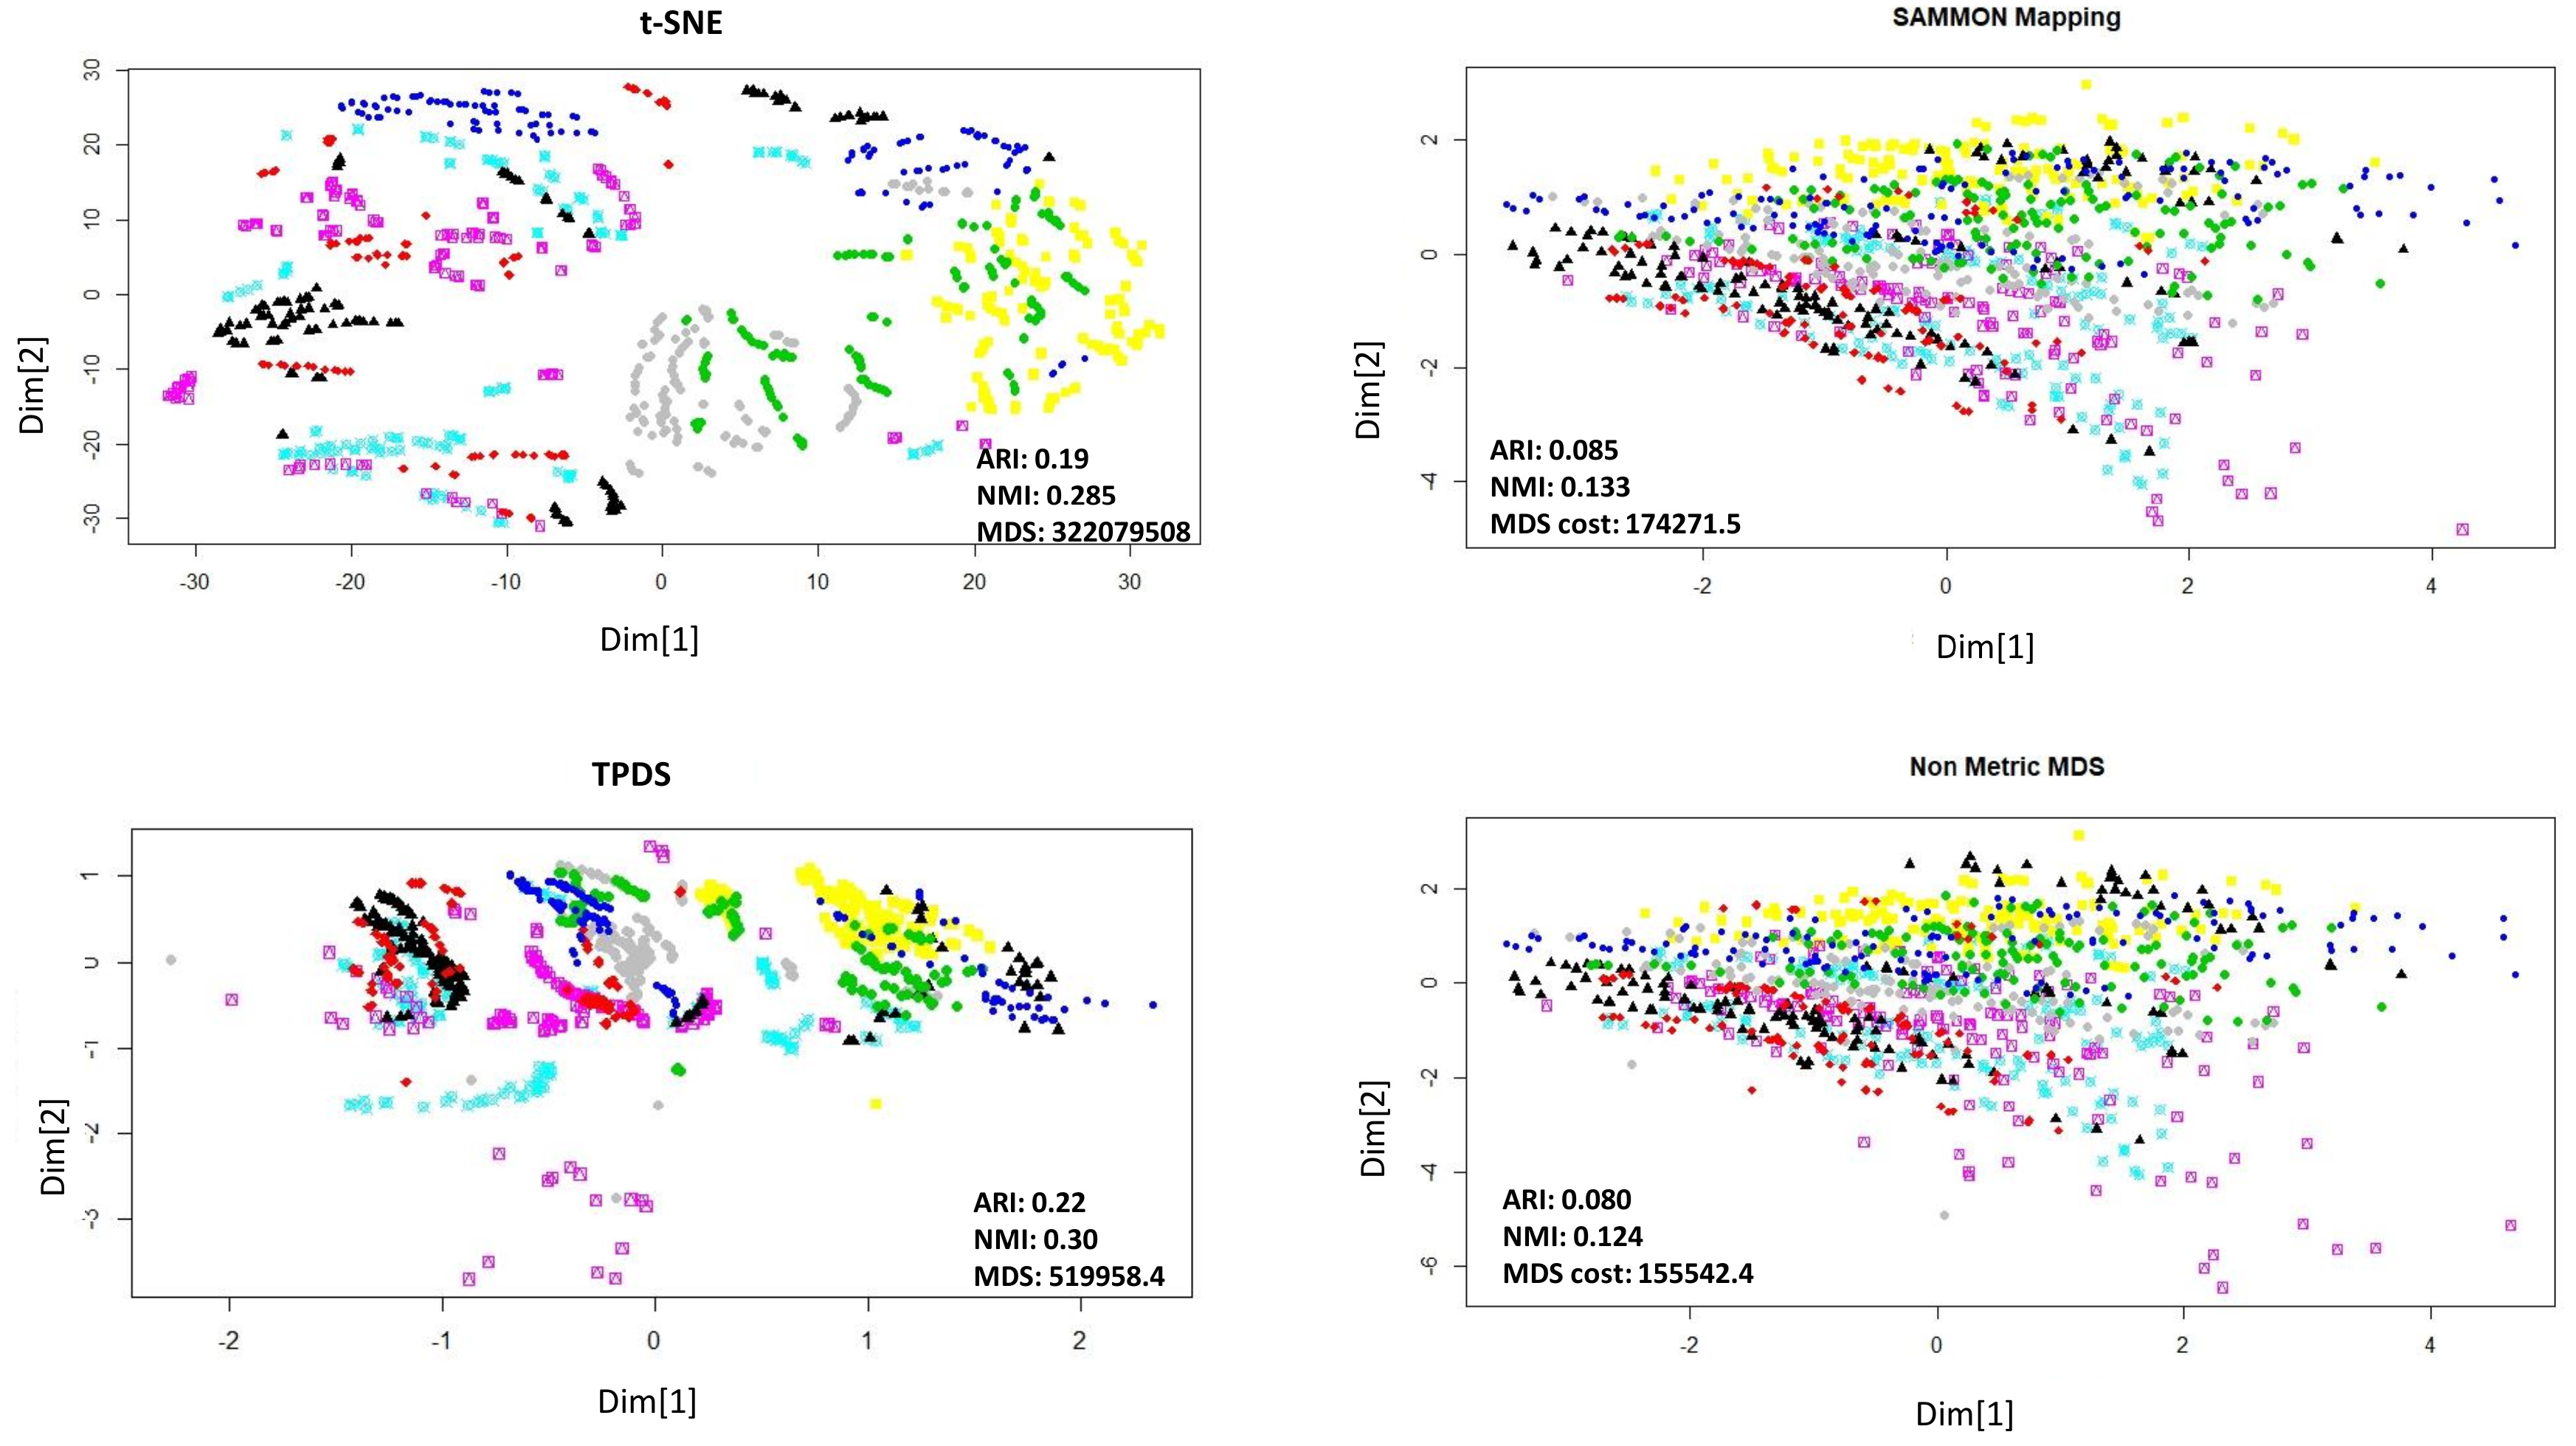
The second data sets we used for evaluation consist of the expression levels of 77 proteins/protein modifications from the nuclear fraction of cortex of mouse [
16]. This data set of protein expression was generated using 38 control mice and 34 trisomic mice with Down syndrome. There are 15 replicates per sample/mouse such that control mice, there are 38 × 15, or 570 measurements, and for trisomic mice, there are 34 × 15, or 510 measurements. In the original manuscript authors recommended to consider each replicate as a separate sample. The mice themselves belonged to eight different groups depending on genotype, behaviour and treatment. Using genotype mice could group separately as control or trisomic [
16].
According to behaviour, the mice could be grouped as stimulated or non-stimulated to learn the context-shock. Similarly, mice could be grouped as treated with drug or untreated. First, we visualised data points with reduced dimension, using different colours for eight different groups. Visually, it was non-trivial to judge about which method performed better. The t-SNE method avoided crowding but spread out samples too much to cause mixing between different groups. With TPDS there seem to be crowding among some samples but for the majority of samples, co-localization was according to group (
Figure 2). On the other hand, Sammon mapping and non-metric MDS caused data-points to be localised as highly overlapping strata according to eight groups. Using K-means clustering and calculating purity of classification provided higher NMI and ARI score for TPDS compared to other tested methods (
Figure 2). We confirmed the improvement provided by TPDS in clustering using DBSCAN (see
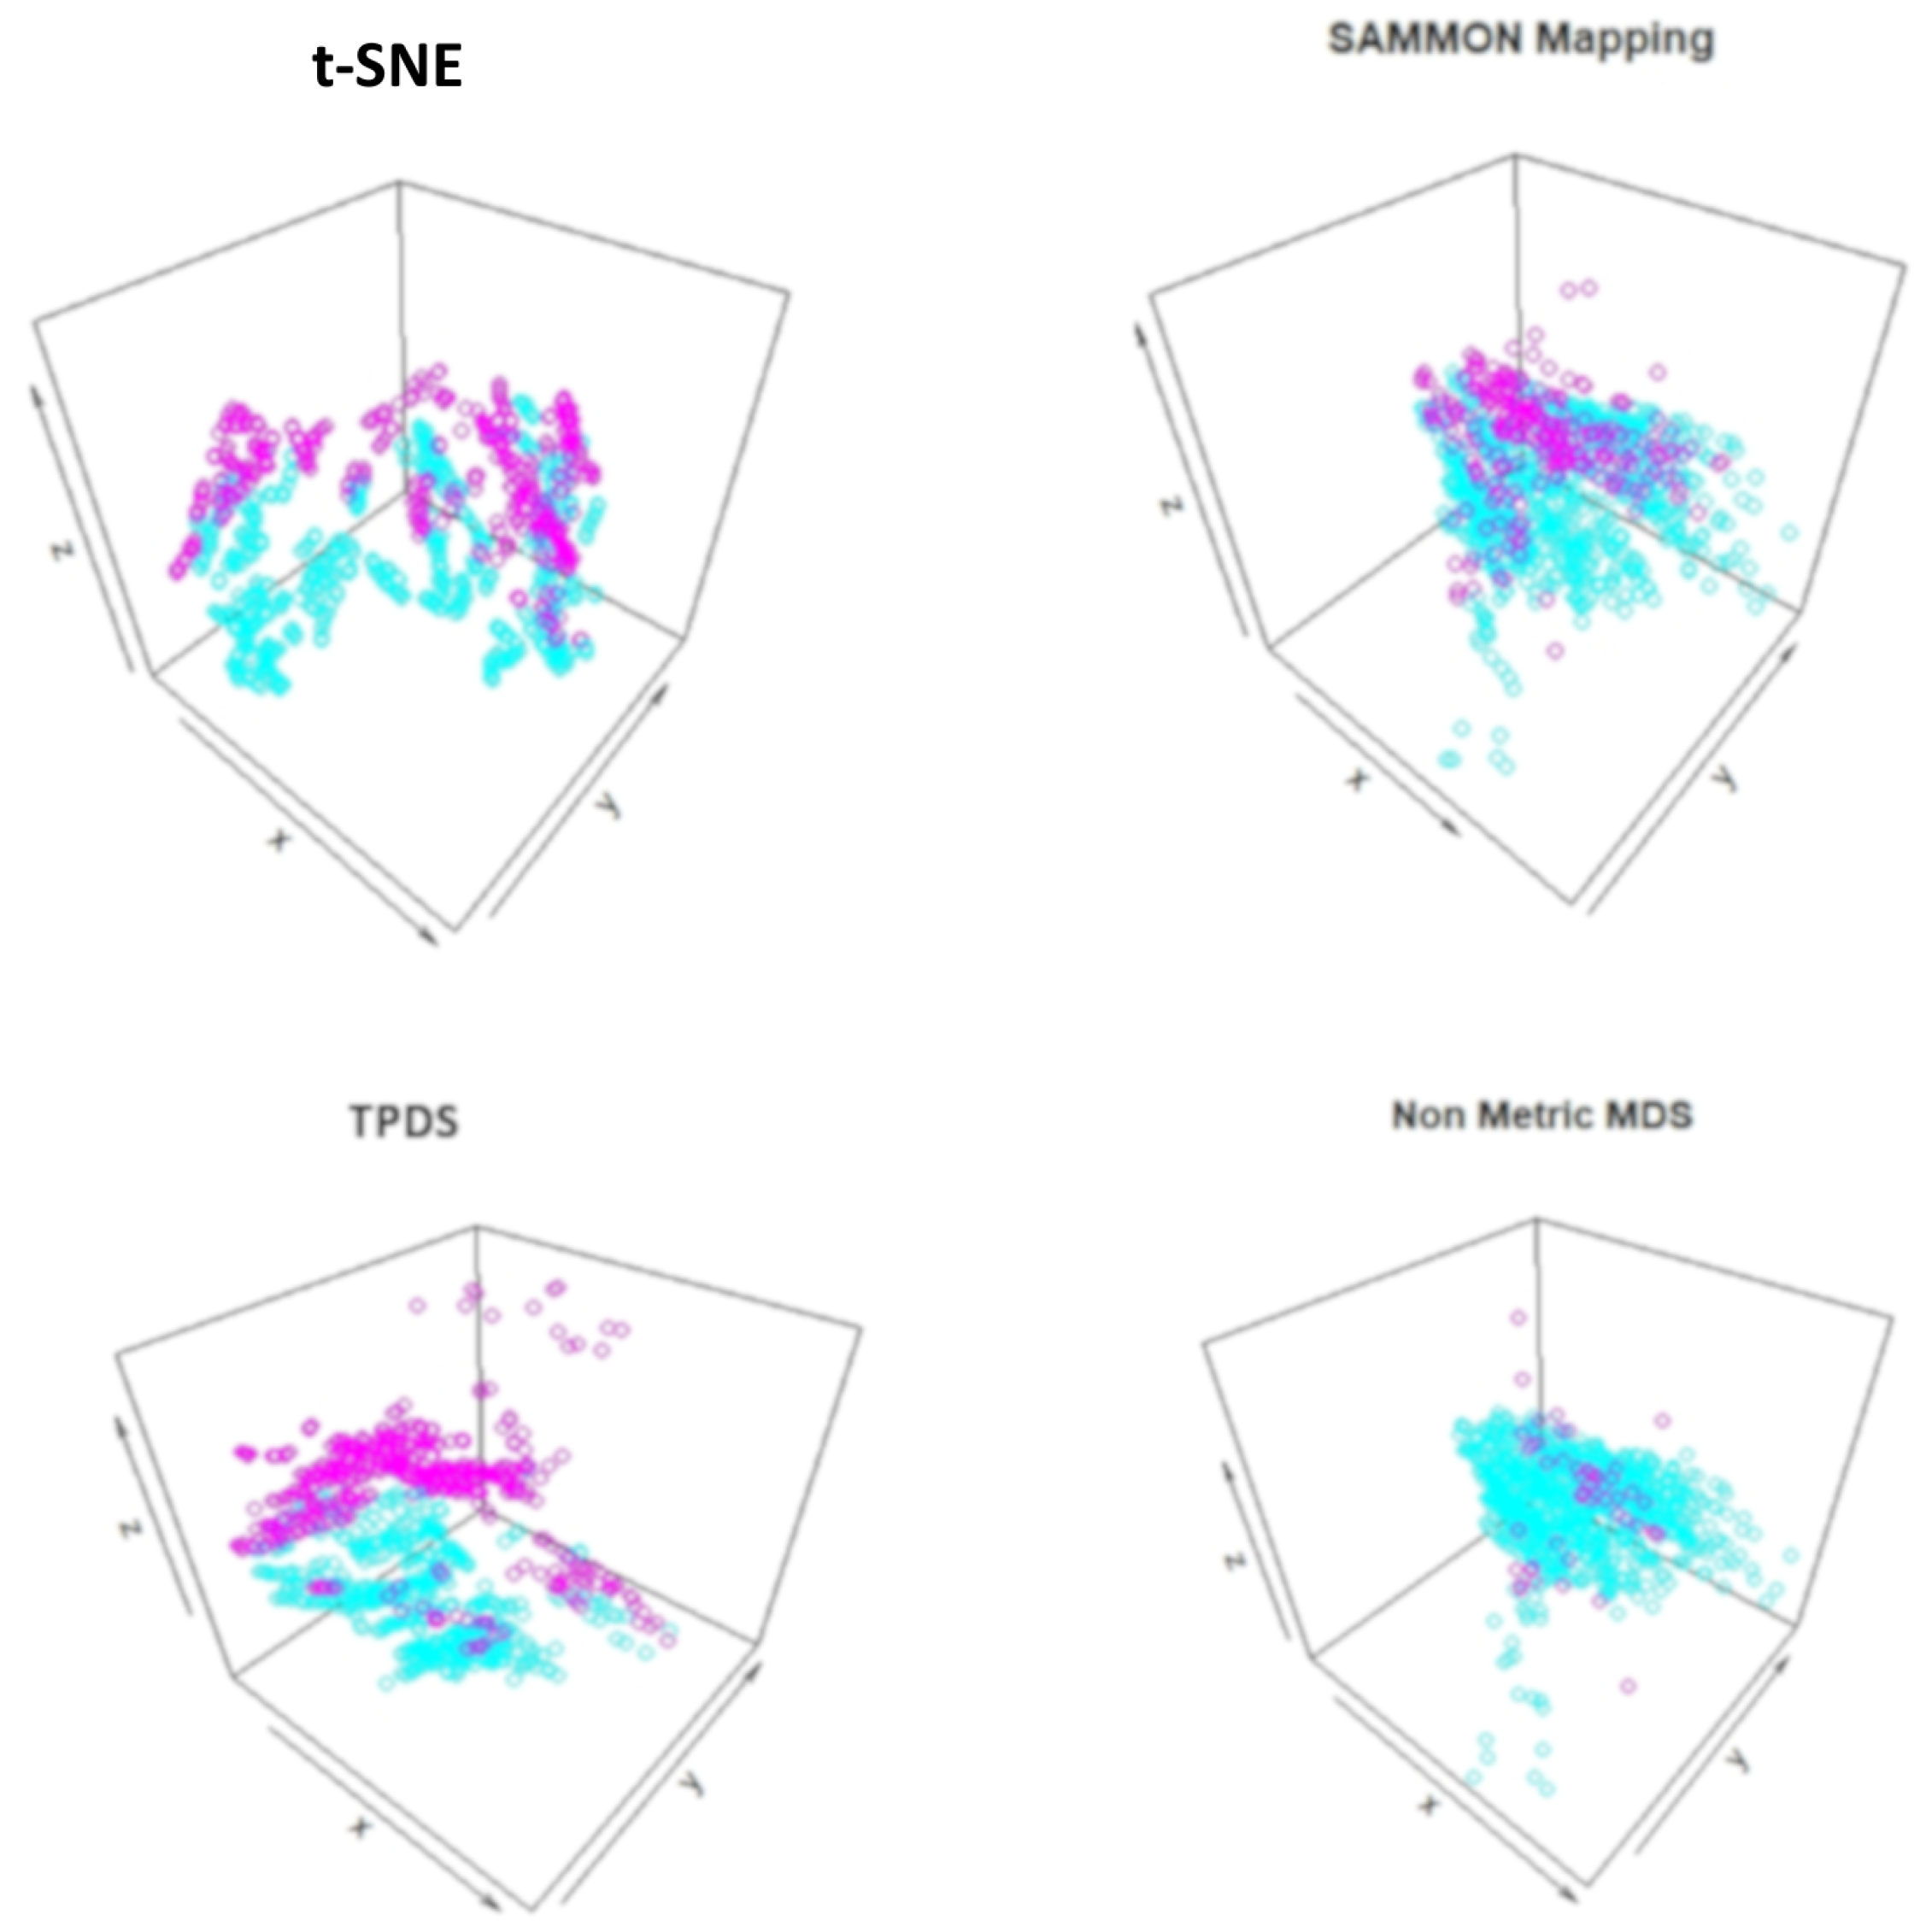
Table 1). However, the mixing of classes hinted towards unknown co-variates. Therefore we again used TPDS to represent the high dimensional protein expression data set using three dimensions. When data was reduced to three dimension, the 3D scatter plot of TPDS could show clear separability between trisomic and normal mice. Whereas other methods could not provide comparable separability, such as TPDS (
Figure 3). Overall, with mouse cortex protein expression data set, we realised that TPDS has better potential to reduce dimension to align similar class data-points together and provide separability between non-similar groups.
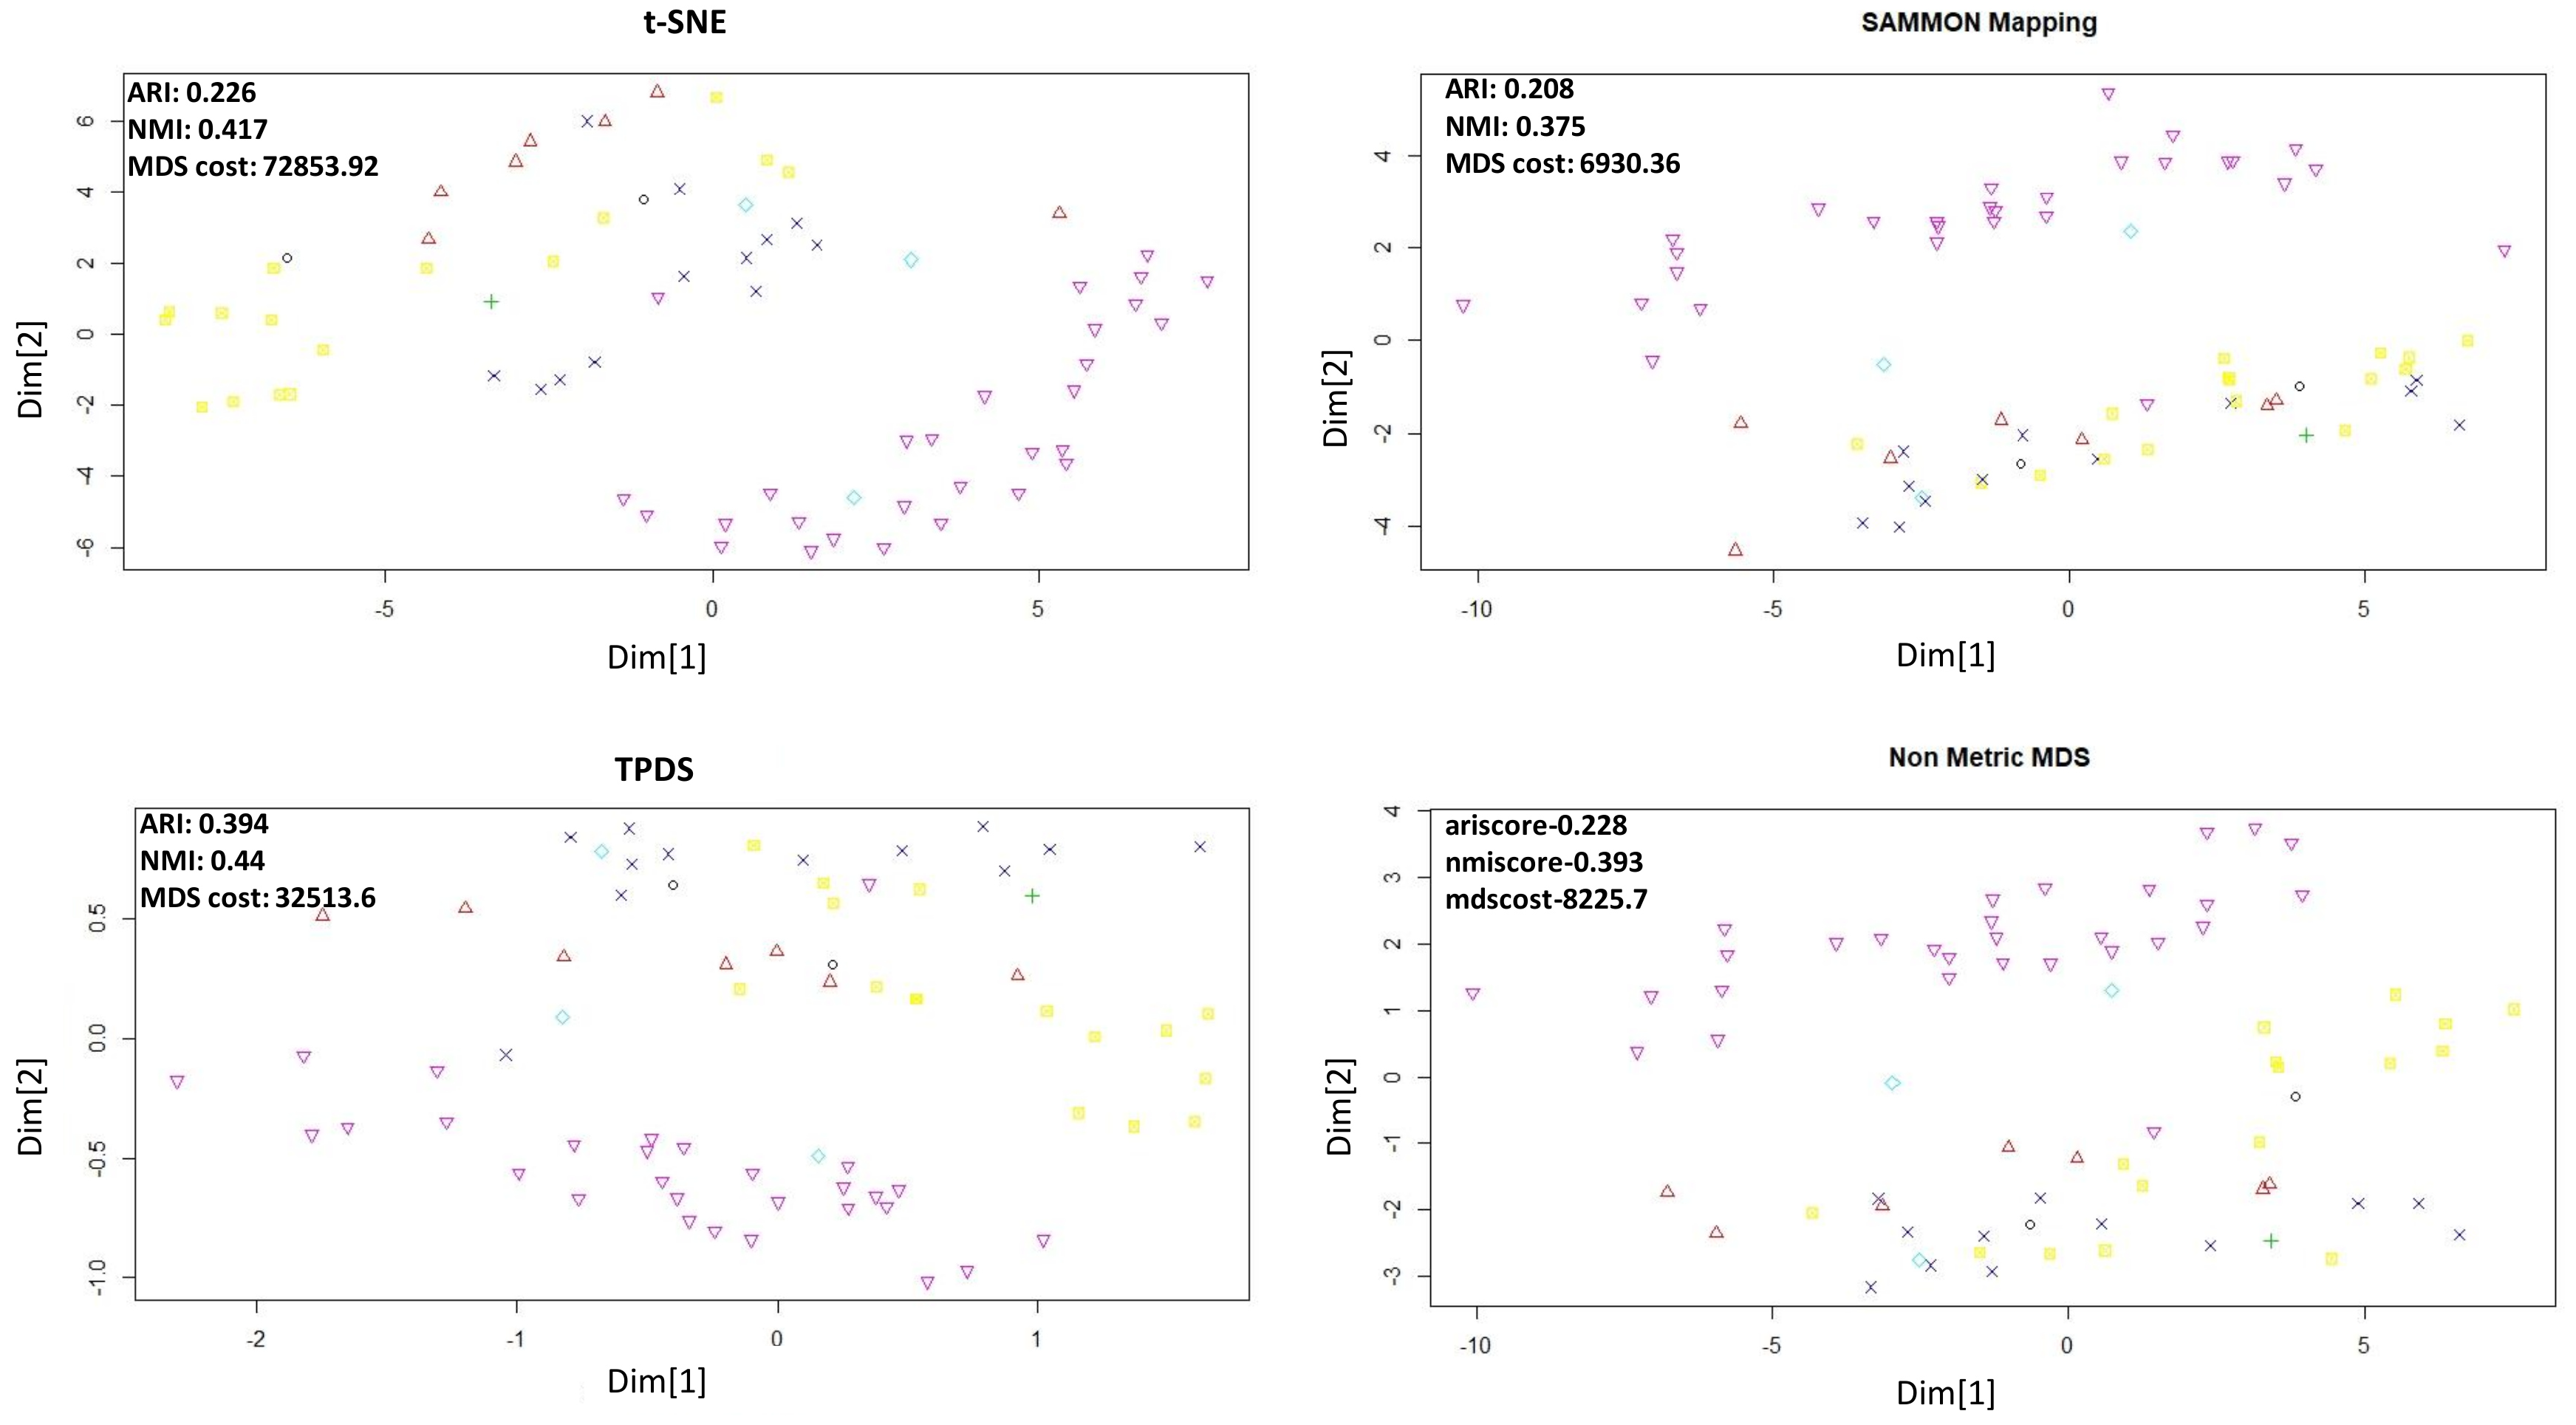
The third data set we used for evaluation is the SCADI data set [
15] which was also downloaded from UCI machine learning repository. The SCADI data set contains 206 attributes of 70 children with physical and motor disability. The data-points are divided into seven classes based on the behaviour of children [
15]. Applying our approach and other three methods revealed clear separability for a few classes in reduced dimension (
Figure 4). However, evaluating the separability after dimension reduction of SCADI data set, revealed that the classification of TPDS output resulted in substantially higher clustering purity than other tested methods (see
Figure 4 and
Table 1).
Finally, we used single-cell expression data to evaluate the potential of TPDS. The single-cell expression data set used here was published by Li et al. [
17]. This data set consists of read-count of more than 57,242 genes as features and 562 cells as data-points. For dimension reduction of such data-sets with such large features, principal component decomposition (or SVD) are often used, especially in case of t-SNE. Therefore we provided loading on top 30 principal components to all the methods. The single-cell data-sets used here had labels for each cell and they could be categorised to 7 cell-types which we took as classes. The visualization of t-SNE and TPDS outputs showed distinguishable loci for cells belonging to different types (classes). In terms of clustering purity using k-means and DBSCAN, TPDS had better performance than other distance preserving methods (Sammon mapping, non-metric MDS) (see
Figure 5). Notice that at different values of perplexity the performance of t-SNE changes. Nevertheless, TPDS, which uses MDS function, also has comparable performance to t-SNE for single-cell expression data-set. Surprisingly, for single-cell data-set, the distance stress cost (MDS-cost) for TPDS was lower than other tested methods despite decent visualization through the preservation of local topology among cells. It hints about possible convergence issue of Sammon mapping and non-metric MDS method due to outlier cells. In
Figure 5, it is clearly visible that a few cells (represented by red color) are outliers which caused the collapse of locations of other cell types with Sammon mapping and non-metric MDS. Notice that, even if TPDS uses non-metric MDS method as the last step, the collapse of data-points do not happen due to distance scaling to preserve local topology. Thus, TPDS seem to have avoided local minima by providing less weightage to large distances of outlier data-point.
4. Discussion
Various procedures of analysis of large data-sets such as classification, regression, and anomaly detection can be improved using dimension reduction techniques. Given the diversity of Biomedical data-set, there could be multiple factors which influence classification. Hence techniques meant only for visualization just as t-SNE may not be optimal for improving the performance of analysis and classification for most of the data-sets. Preserving distance during dimension reduction could have its own advantage in terms of providing clear separability among dissimilar data-points. The success of TPDS in achieving low MDS-cost (distance stress), decent visualization and better clustering purity for tested data-sets hint that having a balance between local-topology and distance preservation could be useful for other analysis procedures also.
The approach of TPDS to scale the distances to preserve some information about local topology can also help in better convergence of MDS-like methods. It could be explained as such: the larger distances among data-points could act as outliers and cause hurdle in convergence. The smaller distances among data-points with in the same group could be large in number, so giving them more weightage lead to a better reduction of overall MDS-cost. In this process, some information about local topology could also be preserved for better visualization. Influence of outliers on other distance-preserving methods is so strong that it causes a collapse of data-points and more computation time in convergence. Thus, TPDS shows a clear advantage over the typical distance-preserving method by giving less weightage to outliers. Another important feature in results of TPDS is that besides separability among data-points of different classes they have tighter co-localization among data-points of same classes, that too without the collapse of their location. Such result caused substantially higher classification purity for TPDS results by DBSCAN which exploit such tight co-localization for density-based clustering. Hence TPDS could be used as an alternative dimension reduction method to support such density-based clustering approach also. Besides being robust to outliers and having the potential to provide better classification results, TPDS is not so slow (see
supplementary Table S1). However, we are trying to optimise it further for better speed.
Here we used SOM to learn preliminary estimation of the manifold. Other methods generally use KNN or a modified version of it [
3,
19,
20] for the same purpose. We also evaluated the effect of the geometry of SOM on TPDS performance. By default, TPDS uses rectangular geometry, where every node has four neighbors. However, we also tested hexagonal geometry of SOM. The results with hexagonal geometry of SOM was almost similar to default mode (
supplementary Figure S1). SOM provides neighborhood information about the cluster of data-points, hence in comparison to KNN, SOM results could be less influenced by noise because of the averaging effect. Such as with protein expression data set it can be seen that data-points belonging to the same class were closer to each other in TPDS due to averaging effect while calculating proximity likelihood. On other other hand t-SNE was not efficient in estimating the likelihood of proximity for data-points in protein expression data, probably due to noise or sample-specific artefacts.
For visualization with TPDS, one needs to provide a guess about the number of SOM clusters (grid size), which could have the least effect on downstream analysis steps such as supervised classification and regression. Other methods, such as t-SNE and Sammon mapping, are also dependent on parameters. t-SNE is dependent on perplexity parameter, whereas Sammon mapping used lambda as the initial value of the step size during optimization. Hence TPDS is not an exception in terms of dependency on one or two parameters. Overall, we have presented an approach to improve the existing method for distance preservation-based dimension reduction by resolving multiple issues so that information of heterogeneity among data-points is not lost and overall classification can also be improved.


