A Geolocation Analytics-Driven Ontology for Short-Term Leases: Inferring Current Sharing Economy Trends


Abstract
1. Introduction
2. Related Work
Keyword Extraction
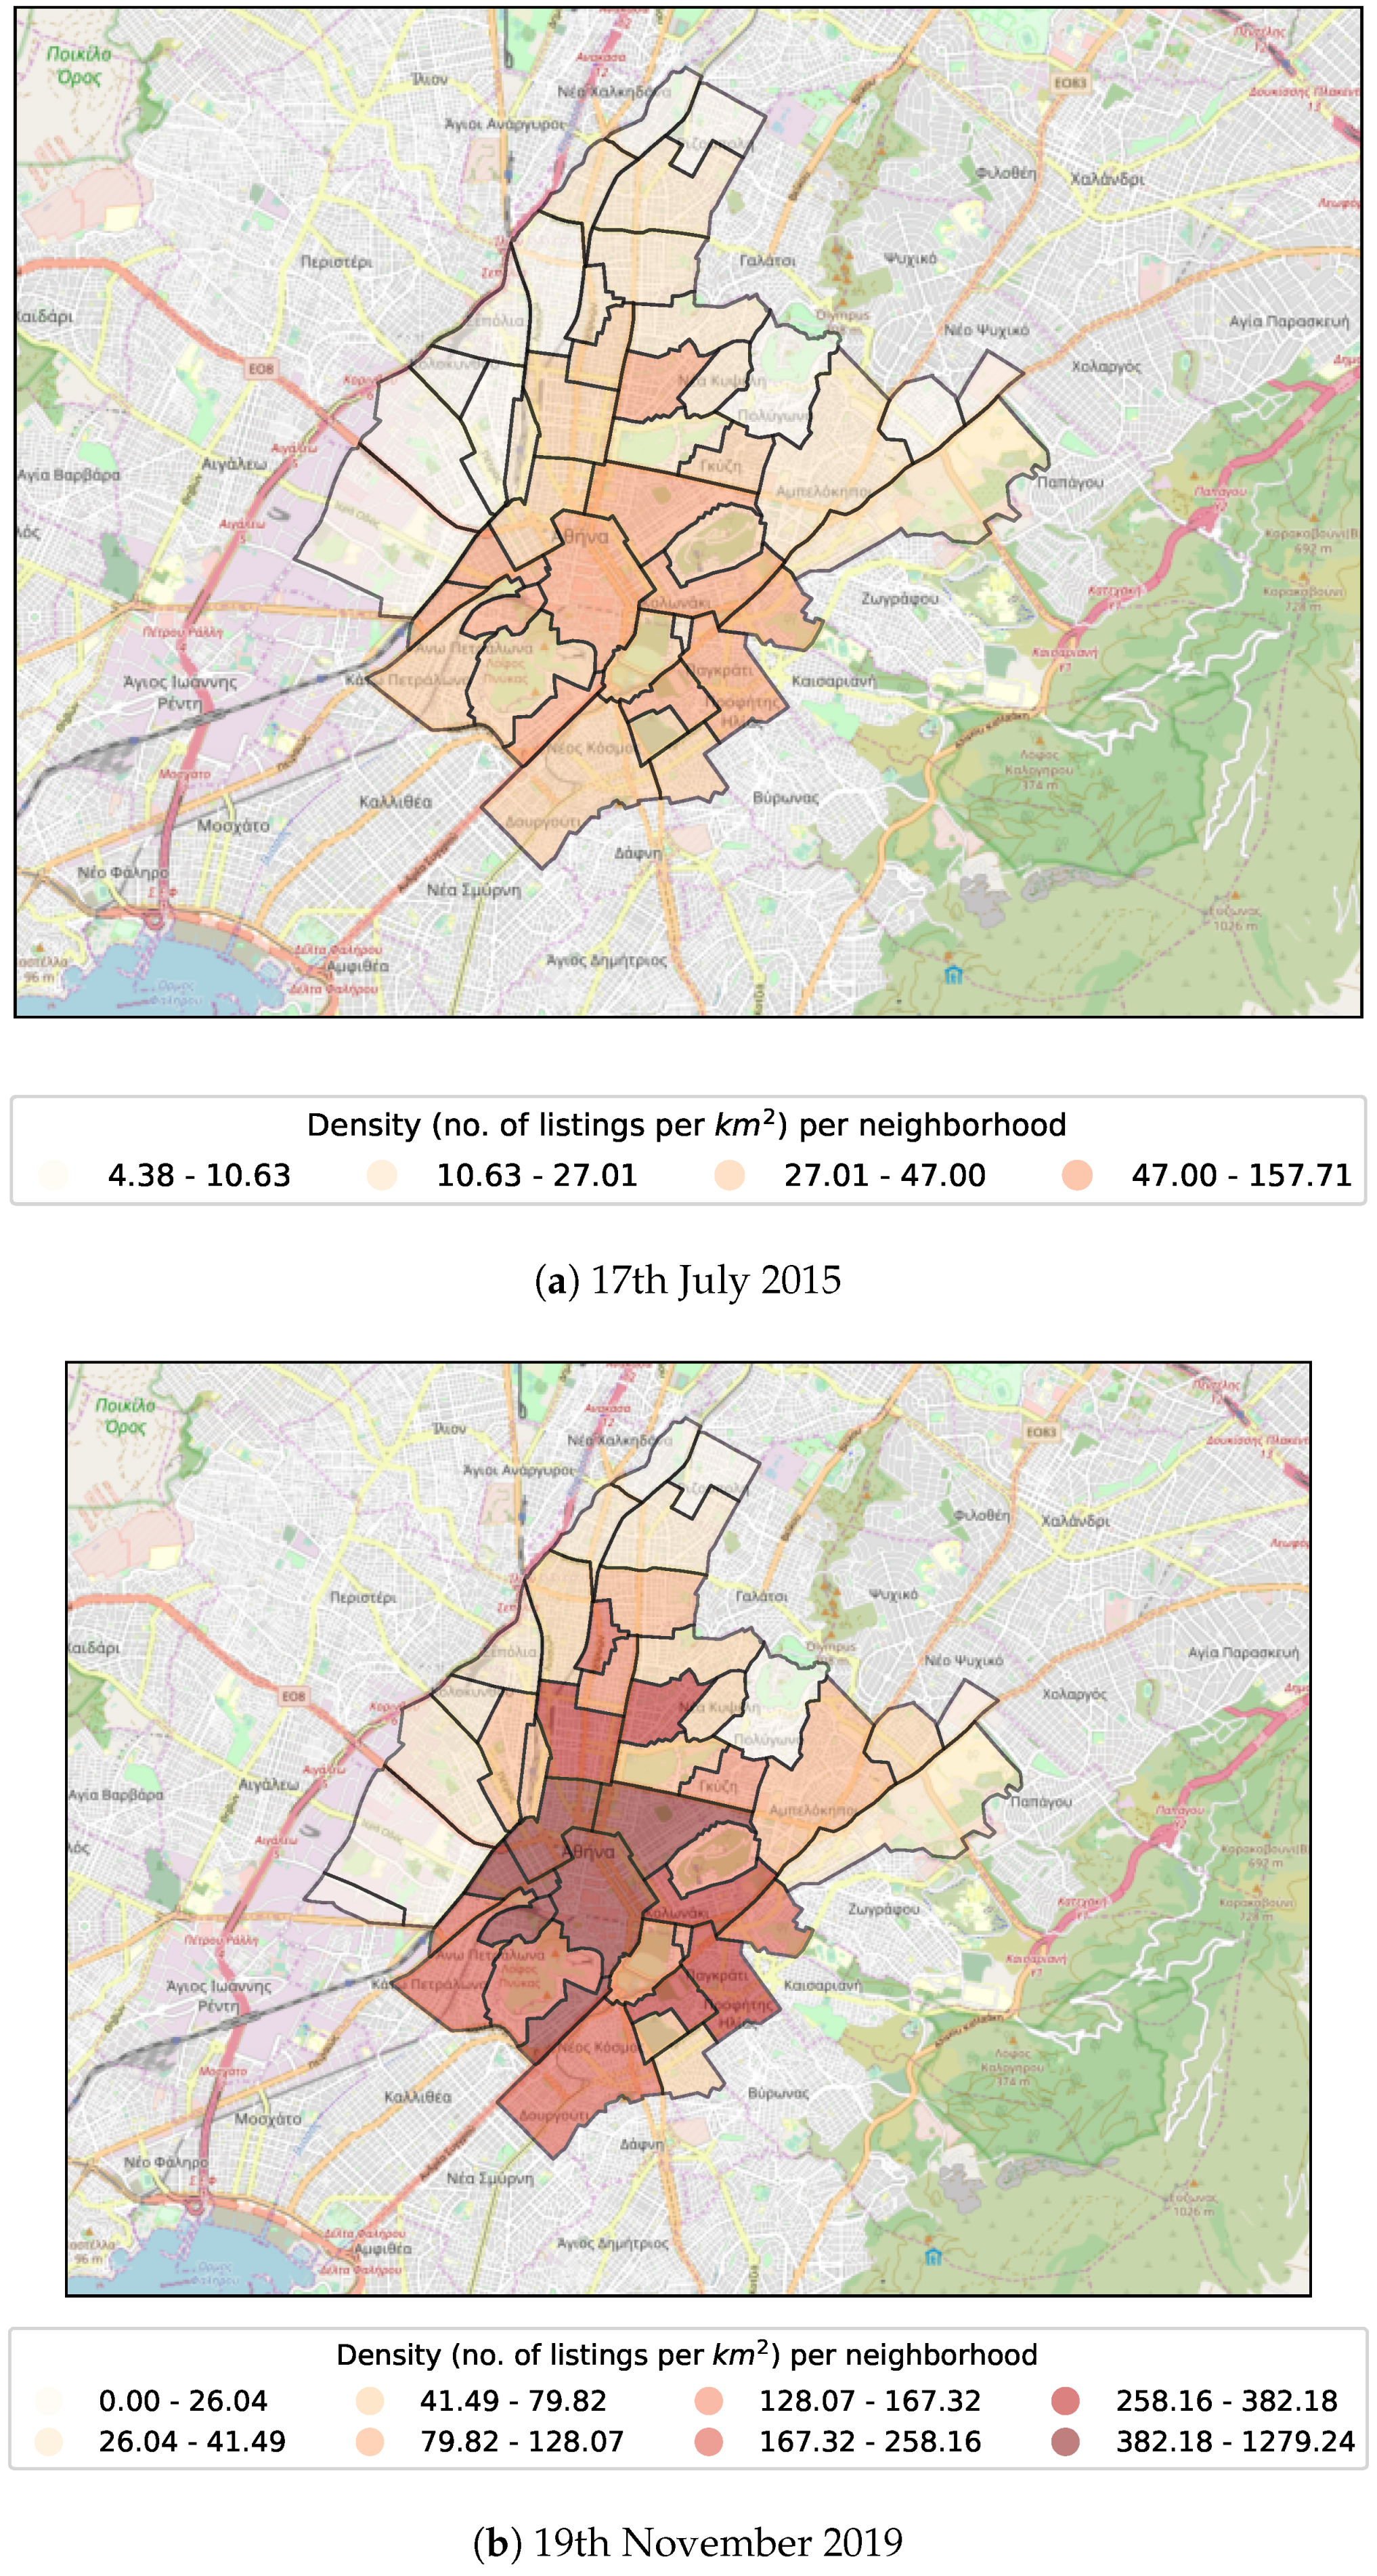
3. Case Study
4. Dataset
- its characteristics (e.g., description, location, etc)
- its availability for rent throughout the year
- the reviews it has received so far.
4.1. Characteristics
- Host details (name, id, number of properties managed)
- Listing details (listing id, description, exact location, neighborhood, property type)
- Basic availability details (availability throughout the year, minimum nights per stay)
- Price per night (in USD)
- Aggregated review details
4.2. Reviews
5. Methodology
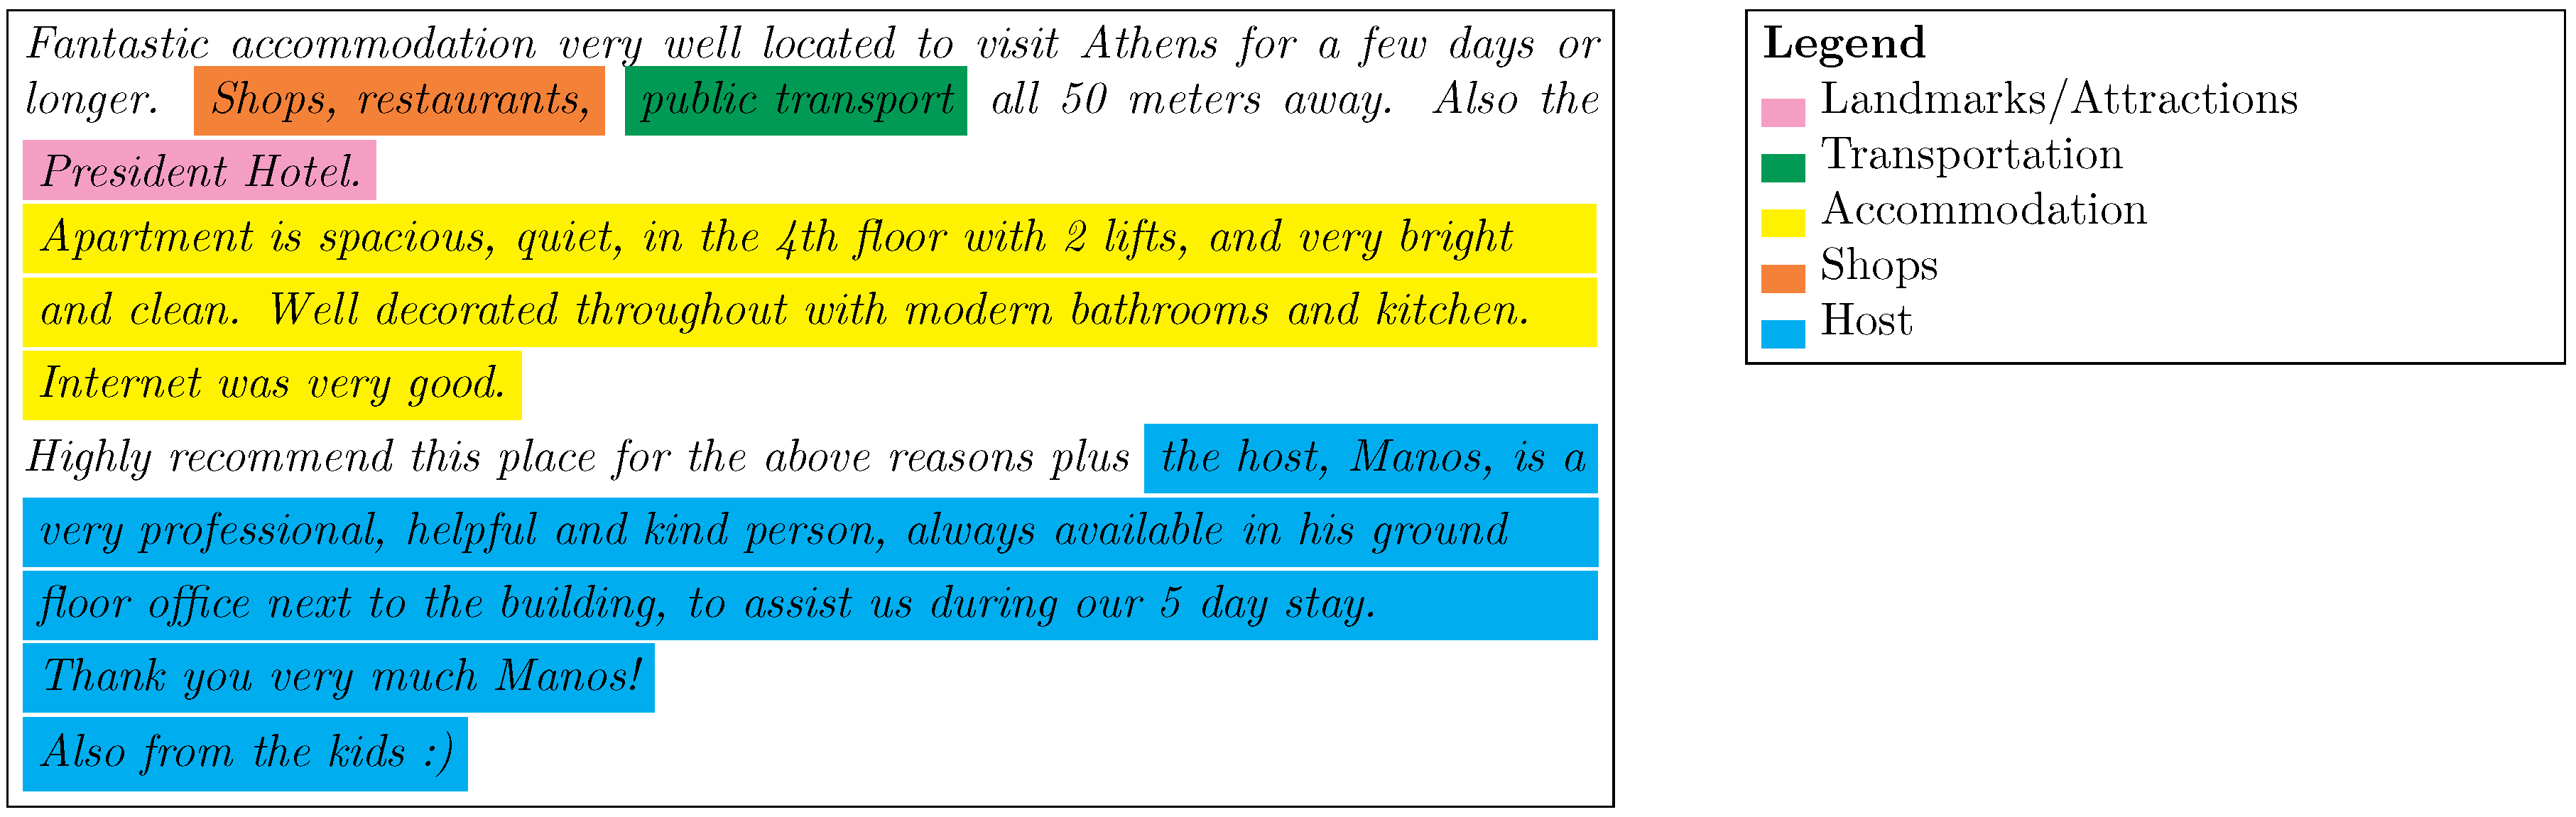
5.1. Keyword Extraction
- Landmarks or Attractions
- Transportation
- Shops
- Accommodation
- Host
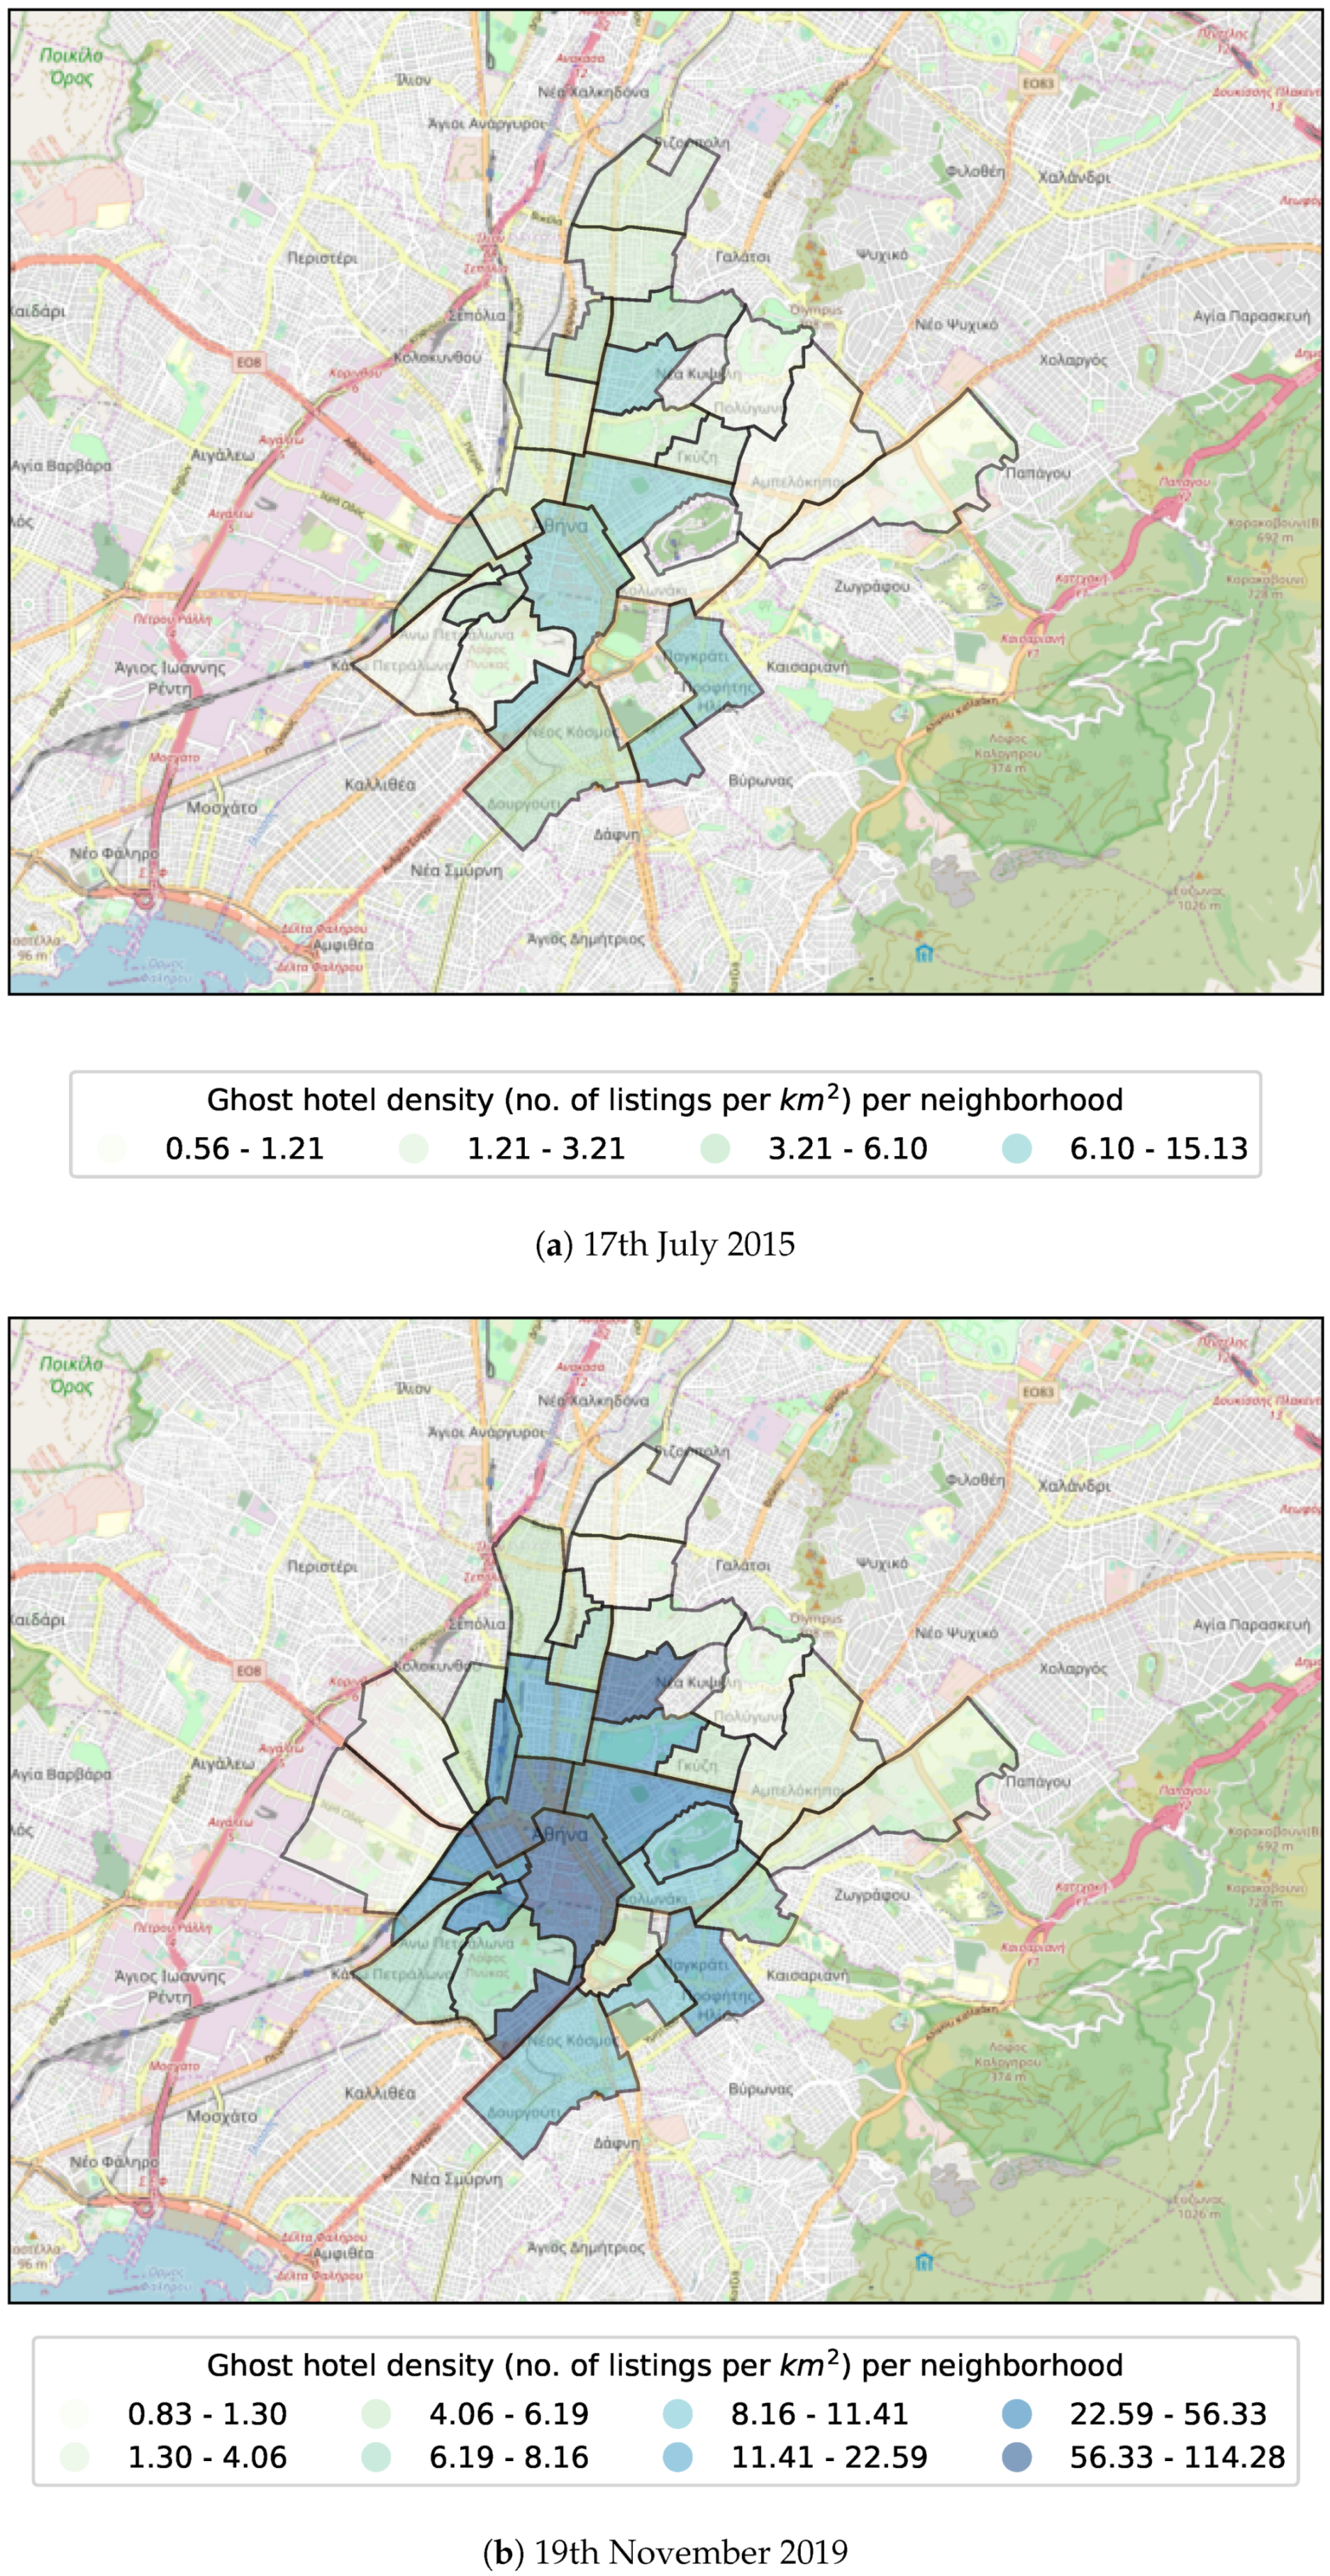
5.2. Ghost Hotels
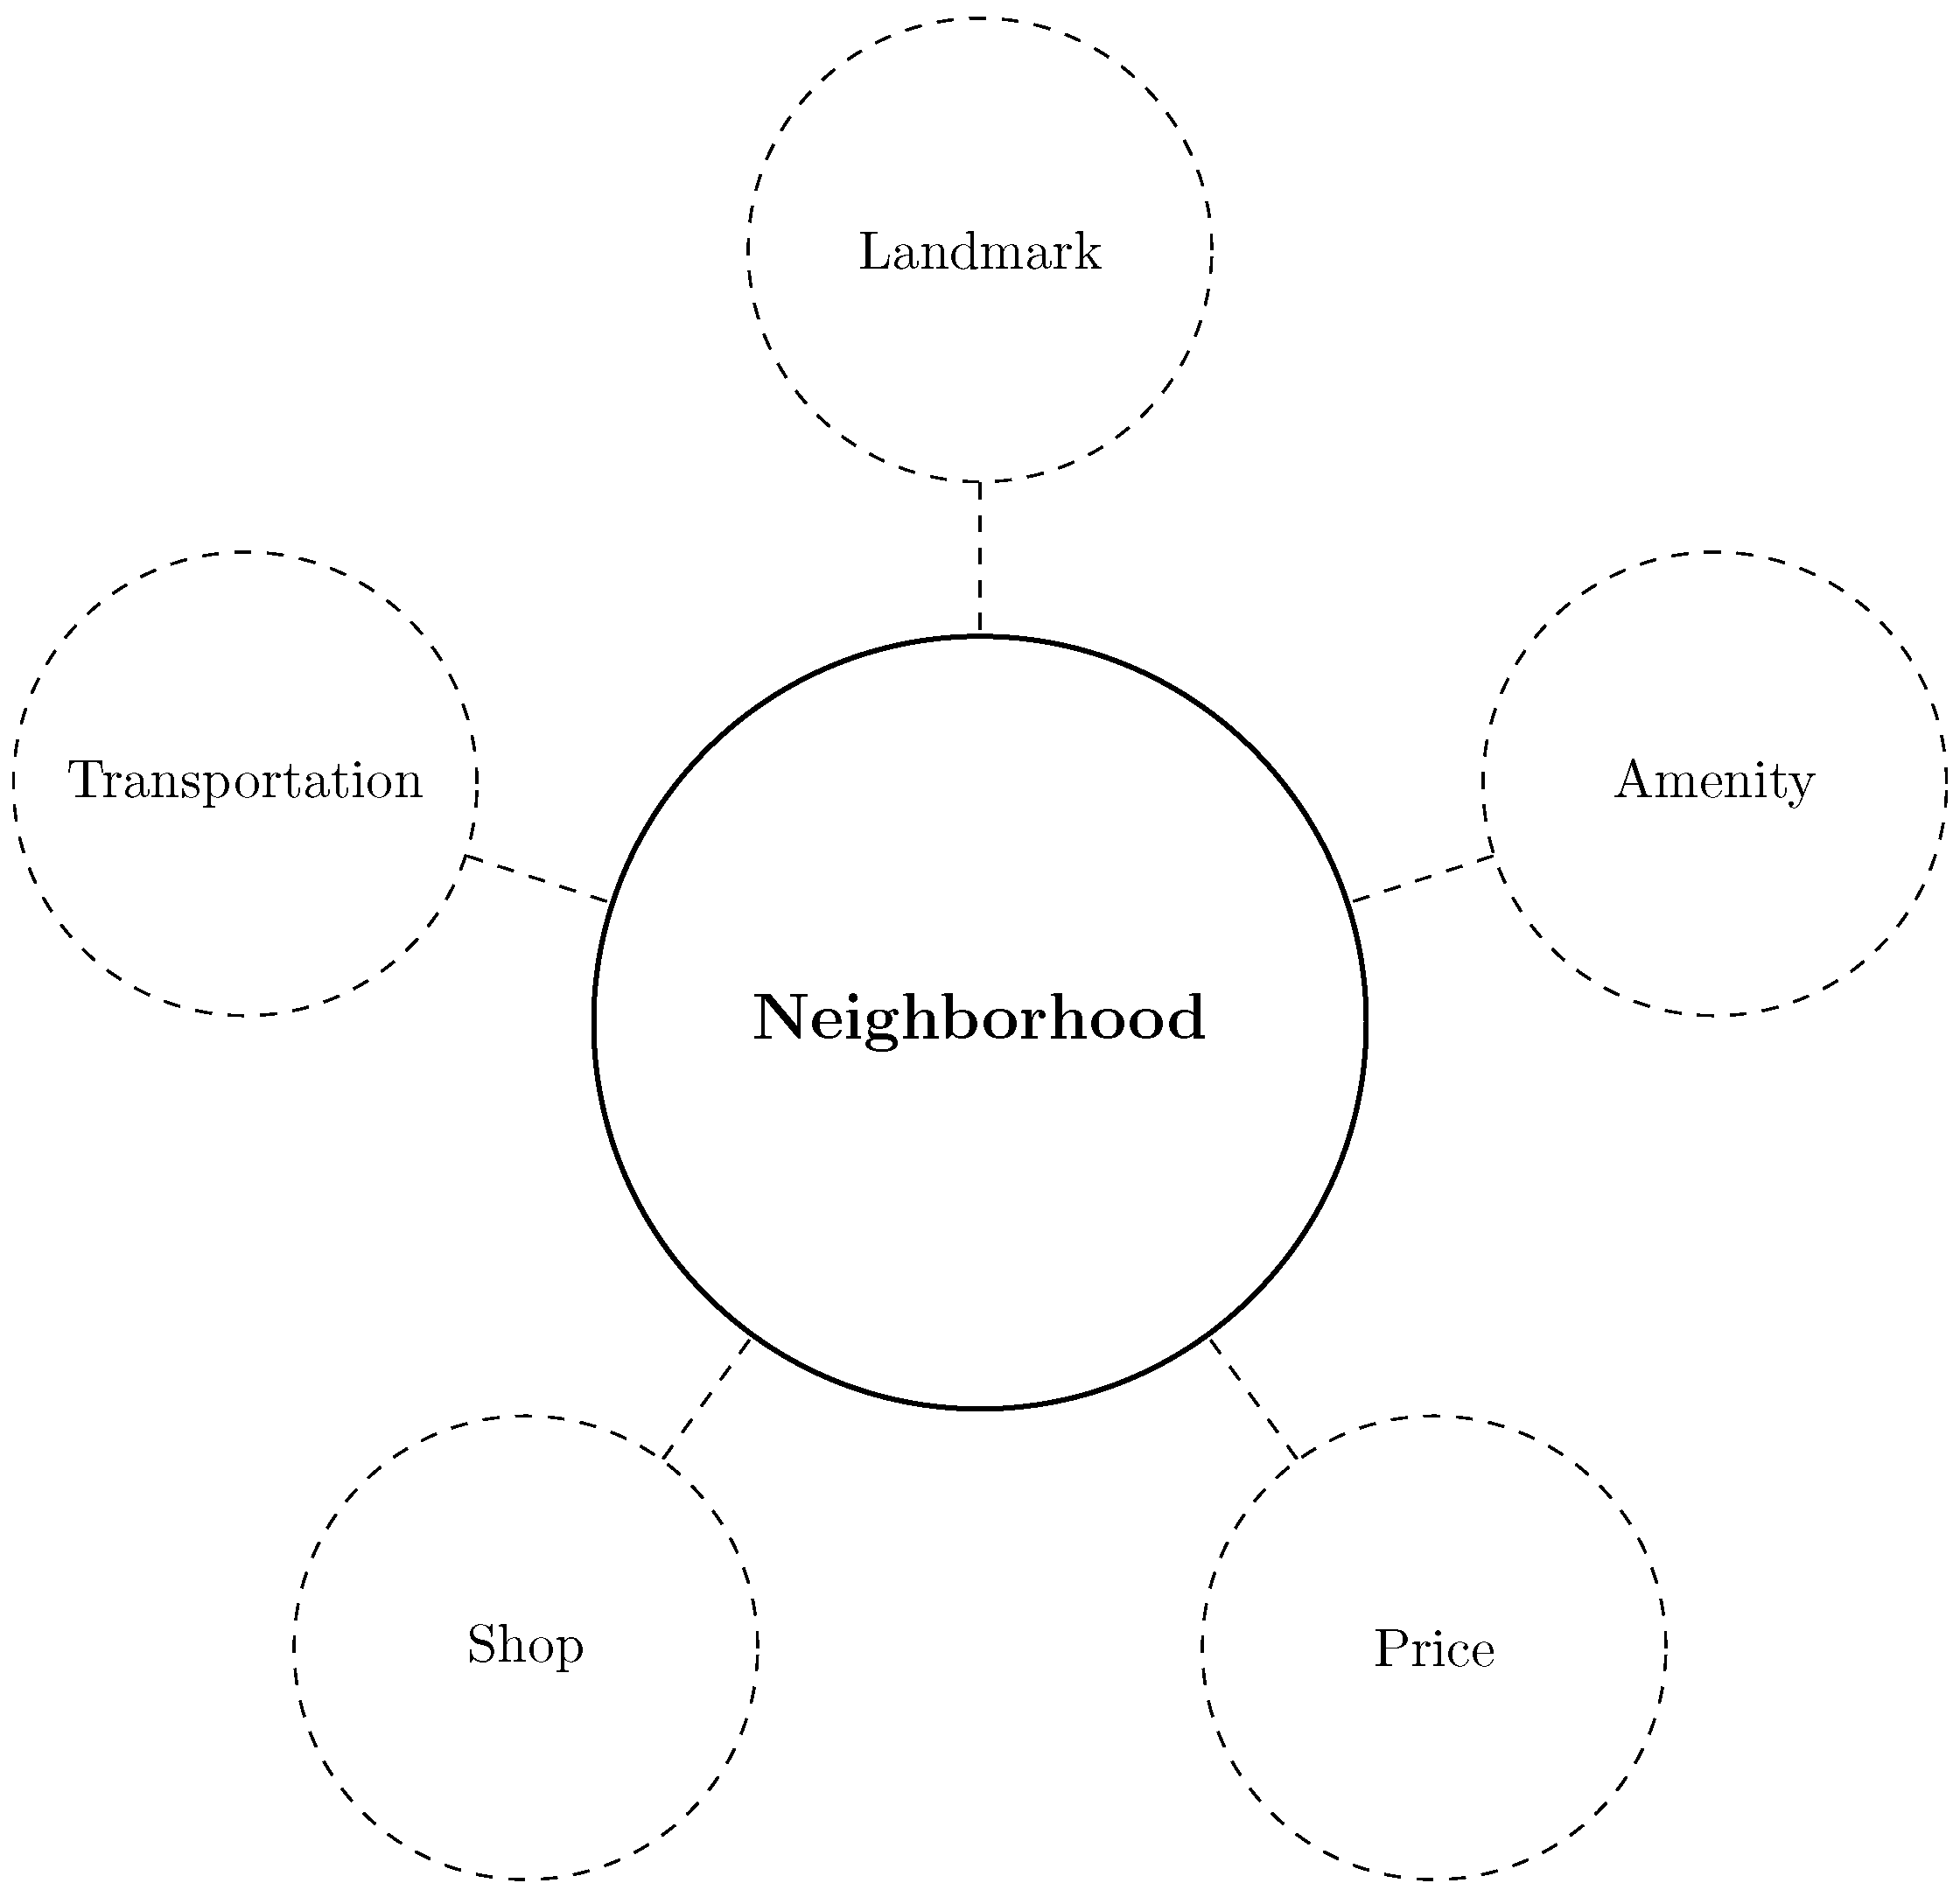
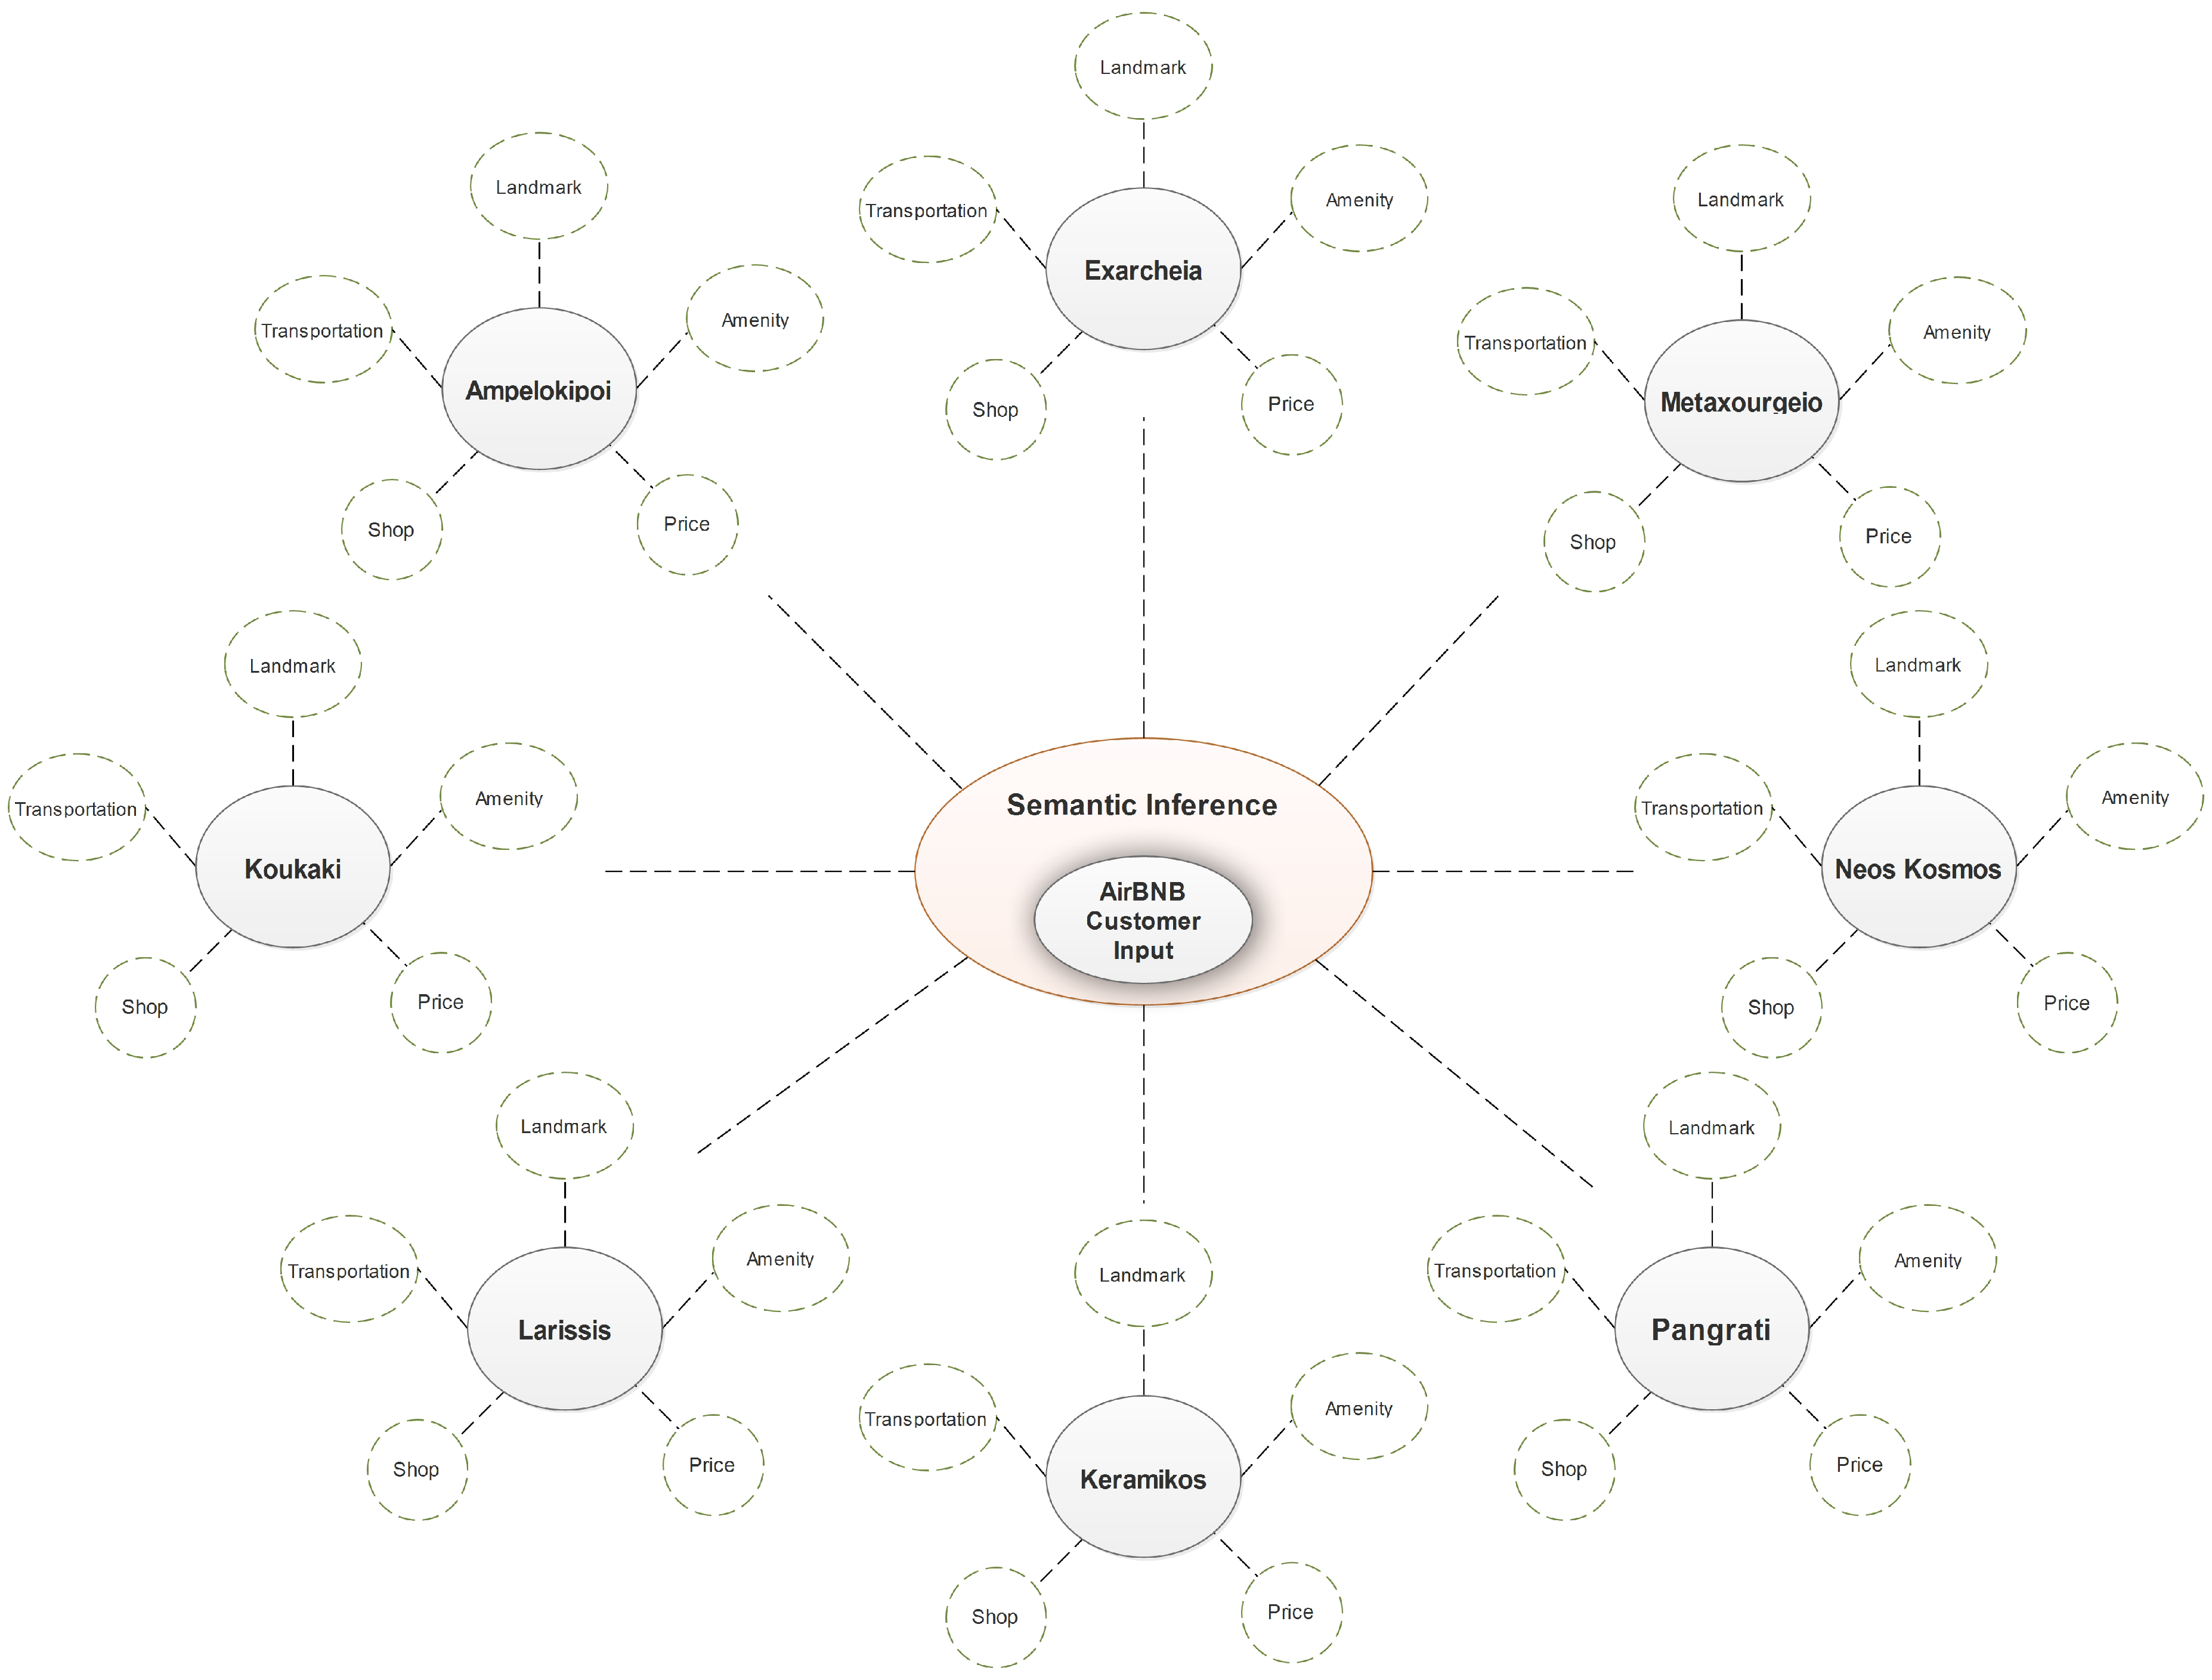
5.3. Ontology Creation
6. Discussion and Future Work
Author Contributions
Funding
Conflicts of Interest
Abbreviations
| LTR | Long-Term Rentals |
| POI | Point of Interest |
| P2P | Peer-to-Peer |
| RAKE | Rapid Automatic Keyword Extraction |
| RevPAR | Revenue Per Available Room |
| STR | Short-Term Rentals |
References
- Hellwig, K.; Morhart, F.; Girardin, F.; Hauser, M. Exploring different types of sharing: A proposed segmentation of the market for “sharing” businesses. Psychol. Market. 2015, 32, 891–906. [Google Scholar] [CrossRef]
- Stephany, A. The Business of Sharing: Making it in the New Sharing Economy; Springer: Berlin, Germany, 2015. [Google Scholar]
- Hamari, J.; Sjöklint, M.; Ukkonen, A. The sharing economy: Why people participate in collaborative consumption. J. Assoc. Inf. Sci. Tech. 2016, 67, 2047–2059. [Google Scholar] [CrossRef]
- Walsh, B. 10 Ideas That Will Change the World. 2011. Available online: http://content.time.com/time/specials/packages/article/0,28804,2059521_2059717,00.html (accessed on 14 January 2020).
- Airbnb—Holiday Lets, Homes, Experiences & Places. Available online: https://airbnb.com/ (accessed on 14 January 2020).
- Kavadias, S.; Ladas, K.; Loch, C. The transformative business model. Harv. Bus. Rev. 2016, 94, 91–98. [Google Scholar]
- Wachsmuth, D.; Weisler, A. Airbnb and the rent gap: Gentrification through the sharing economy. Environ. Plan. A Econ. Space 2018, 50, 1147–1170. [Google Scholar] [CrossRef]
- Ključnikov, A.; Krajčík, V.; Vincúrová, Z. International sharing economy: The Case of AiRBnB in the Czech Republic. Econ. Sociol. 2018, 11, 126–137. [Google Scholar] [CrossRef] [PubMed]
- Gourzis, K.; Alexandridis, G.; Gialis, S.; Caridakis, G. Studying the Spatialities of Short-Term Rentals’ Sprawl in the Urban Fabric: The Case of Airbnb in Athens, Greece. In Artificial Intelligence Applications and Innovations; MacIntyre, J., Maglogiannis, I., Iliadis, L., Pimenidis, E., Eds.; Springer: Cham, Switzerland, 2019; Volume 560, pp. 196–207. [Google Scholar]
- Luo, Y. What Airbnb Reviews Can Tell Us? an Advanced Latent Aspect Rating Analysis Approach. Ph.D. Thesis, Iowa State University, Ames, IA, USA, 14 June 2018. [Google Scholar]
- Matsaganis, M.; Leventi, C. Poverty and Inequality during the Great Recession in Greece. Polit. Stud. Rev. 2014, 12, 209–223. [Google Scholar] [CrossRef]
- Sheppard, S.; Udell, A. Do Airbnb Properties Affect House Prices? 2016. Available online: https://web.williams.edu/Economics/wp/SheppardUdellAirbnbAffectHousePrices.pdf (accessed on 14 January 2020).
- Einav, L.; Farronato, C.; Levin, J. Peer-to-Peer Markets. Annu. Rev. Econ. 2016, 8, 615–635. [Google Scholar] [CrossRef]
- Edelman, B.; Luca, M. Airbnb (A). 2011. Available online: https://store.hbr.org/product/airbnb-a/912019 (accessed on 14 January 2020).
- Yrigoy, I. The Impact of Airbnb in the Urban Arena: Towards a Tourism-Led Gentrification? the Case-Study of Palma Old Quarter (Mallorca, Spain). 2016. Available online: https://core.ac.uk/download/pdf/154376904.pdf (accessed on 14 January 2020).
- Horn, K.; Merante, M. Is home sharing driving up rents? Evidence from Airbnb in Boston. J. Hous. Econ. 2017, 38, 14–24. [Google Scholar] [CrossRef]
- Adamiak, C. Mapping Airbnb supply in European cities. Ann. Tour. Res. 2018, 71, 67–71. [Google Scholar] [CrossRef]
- Sparck Jones, K. A statistical interpretation of term specificity and its application in retrieval. J. Doc. 1972, 28, 11–21. [Google Scholar] [CrossRef]
- Salton, G.; Wong, A.; Yang, C.S. A vector space model for automatic indexing. Commun. ACM 1975, 18, 613–620. [Google Scholar] [CrossRef]
- Andrade, M.A.; Valencia, A. Automatic extraction of keywords from scientific text: Application to the knowledge domain of protein families. Bioinformatics (Oxford, England) 1998, 14, 600–607. [Google Scholar] [CrossRef] [PubMed]
- Engel, D.W.; Whitney, P.D.; Calapristi, A.J.; Brockman, F.J. Mining for Emerging Technologies within Text Streams and Documents; Technical Report; Pacific Northwest National Lab.(PNNL): Richland, WA, USA, 10 February 2009. [Google Scholar]
- Whitney, P.; Engel, D.; Cramer, N. Mining for surprise events within text streams. In Proceedings of the 2009 SIAM International Conference on Data Mining, Sparks, NV, USA, 30 April 2009; pp. 617–627. [Google Scholar]
- Matsuo, Y.; Ishizuka, M. Keyword extraction from a single document using word co-occurrence statistical information. Int. J. Artif. Intell. Tool. 2004, 13, 157–169. [Google Scholar] [CrossRef]
- Ercan, G.; Cicekli, I. Using lexical chains for keyword extraction. Inform. Process. Manag. 2007, 43, 1705–1714. [Google Scholar] [CrossRef]
- Abilhoa, W.D.; De Castro, L.N. A keyword extraction method from twitter messages represented as graphs. Appl. Math. Comput. 2014, 240, 308–325. [Google Scholar] [CrossRef]
- Yang, K.; Chen, Z.; Cai, Y.; Huang, D.; Leung, H.f. Improved automatic keyword extraction given more semantic knowledge. In Database Systems for Advanced Applications; Gao, H., Kim, J., Sakurai, Y., Eds.; Springer: Cham, Switzerland, 2016; Volume 9645, pp. 112–125. [Google Scholar]
- Ying, K.; Jingchang, P.; Minglei, W. Research on Sentiment Analysis of Micro-blog’s Topic Based on TextRank’s Abstract. In Proceedings of the 2017 International Conference on Information Technology, Jordan, Malaysia, 27 December 2017; pp. 86–90. [Google Scholar]
- Petasis, G.; Karkaletsis, V. Identifying argument components through textrank. In Proceedings of the Third Workshop on Argument Mining (ArgMining2016), Berlin, Germany, 7–12 August 2016; pp. 94–102. [Google Scholar]
- Mihalcea, R.; Tarau, P. Textrank: Bringing order into text. In Proceedings of the 2004 Conference on Empirical Methods in Natural Language Processing, Barcelona, Spain, 25–26 July 2004; pp. 404–411. [Google Scholar]
- Manna, S.; Phongpanangam, O. Exploring topic models on short texts: a case study with crisis data. In Proceedings of the 2018 Second IEEE International Conference on Robotic Computing (IRC), Laguna Hills, CA, USA, 31 January–2 February 2018; pp. 377–382. [Google Scholar]
- Situmorang, K.; Hidayanto, A.; Wicaksono, A.; Yuliawati, A. Analysis on Customer Satisfaction Dimensions in P2P Accommodation Using LDA: A Case Study of Airbnb. 2018. Available online: http://journal.portalgaruda.org/index.php/EECSI/article/view/1674/1141 (accessed on 14 January 2020).
- SÜZEK, T.Ö. Using latent semantic analysis for automated keyword extraction from large document corpora. Turk. J. Electr. Eng. Comput. Sci. 2017, 25, 1784–1794. [Google Scholar] [CrossRef]
- Kaur, B.; Jain, S. Keyword extraction using machine learning approaches. In Proceedings of the 2017 3rd International Conference on Advances in Computing, Communication & Automation (ICACCA)(Fall), Dehradun, India, 15–16 September 2017; pp. 1–6. [Google Scholar]
- Wang, Y.; Zhang, J. Keyword extraction from online product reviews based on bi-directional LSTM recurrent neural network. In Proceedings of the 2017 IEEE International Conference on Industrial Engineering and Engineering Management (IEEM), Singapore, 10–13 December 2017; pp. 2241–2245. [Google Scholar]
- Chen, Y.; Yang, G.; Jiang, Y.; Liu, X. Monocular Visual Odometry Based on Trifocal Tensor Constraint. In Journal of Physics: Conference Series; IOP Publishing: Boracay, Philippines, 19–21 January 2018; Volume 976, p. 012002. [Google Scholar]
- Rose, S.; Engel, D.; Cramer, N.; Cowley, W. Automatic keyword extraction from individual documents. In Text Mining: Applications and Theory; Berry, M.W., Kogan, J., Eds.; John Wiley & Sons: Hoboken, NJ, USA, 2010; pp. 1–20. [Google Scholar]
- Roussanoglou, N. Real Estate Investment Firms Get Into Office Building Development. 2019. Available online: http://www.ekathimerini.com/238554/article/ekathimerini/business/real-estate-investment-firms-get-into-office-building-development (accessed on 14 January 2020).
- Gourzis, K.; Gialis, S. Dismantled Spatial Fixes in the Aftermath of Recession: Capital Switching and Labour Underutilization in the Greek Capital Metropolitan Region. Int. J. Urban. Reg. Res. 2019, 43, 741–759. [Google Scholar] [CrossRef]
- Athens Short-Term Rental Property: Where to Get the Biggest Bang for Your Buck. 2018. Available online: https://tranio.com/articles/athens-short-term-rental-property-where-to-get-the-biggest-bang-for-your-buck/ (accessed on 14 January 2020).
- Short-Term Leasing Financials in Greece Through Airbnb and HomeAway Platforms—INSETE. 2020. Available online: http://www.insete.gr/Portals/0/meletes-INSETE/01/2019/2019_AirDNA_Short_Stay.pdf (accessed on 20 February 2020).
- HomeAway|Book Your Vacation Rentals: Beach Houses, Cabins, Condos & More. Available online: https://www.homeaway.com/ (accessed on 14 January 2020).
- Greek Property Sale and Rent Prices Per Area|Spitogatos. Available online: https://en.spitogatos.gr/property-index (accessed on 14 January 2020).
- AirDNA|Short-Term Rental Data & Analytics|Airbnb & Vrbo. Available online: https://www.airdna.co/ (accessed on 14 January 2020).
- Velesioti, A. Airbnb Rentals: The New Eldorados and the “ghosts”—What Did The Evidence for 2019 Show (In Greek). 2020. Available online: https://www.eleftherostypos.gr/oikonomia/525785-misthoseis-airbnb-ta-nea-elntoranto-kai-ta-fantasmata-ti-edeixan-ta-stoixeia-gia-to-2019/ (accessed on 14 January 2020).
- Mauri, A.G. Hotel Revenue Management: Principles and Practices; Pearson Italia Spa: Milano MI, Italy, 2013. [Google Scholar]
- Inside Airbnb. Adding Data to the Debate. Available online: http://insideairbnb.com/ (accessed on 14 January 2020).
- Wieditz, T. Could Airbnb Turn Toronto’s Most Affordable Rental Housing Stock Into Ghost Hotel Suites? FAIRBNB CA Coalition. 2017. Available online: https://fairbnb.ca/wp-content/uploads/2019/07/Fairbnb_Report-on-Secondary-Suites_final.pdf (accessed on 14 January 2020).
- Zadeh, L.A. Fuzzy sets. In Information and Control; Elsevier: Oxford, UK, 1965. [Google Scholar]


| No. | Date | Total Number of Listings | Mean Price per Night | Average Number of Available Days per Year |
|---|---|---|---|---|
| 1 | 17th July 2015 | 2116 | ||
| 2 | 9th May 2017 | 5127 | ||
| 3 | 14th April 2018 | 7962 | ||
| 4 | 16th May 2018 | 7828 | ||
| 5 | 16th July 2018 | 8968 | ||
| 6 | 15th August 2018 | 9360 | ||
| 7 | 13th September 2018 | 9294 | ||
| 8 | 11th October 2018 | 9163 | ||
| 9 | 15th November 2018 | 9122 | ||
| 10 | 12th December 2018 | 8647 | ||
| 11 | 16th January 2019 | 8891 | ||
| 12 | 8th February 2019 | 9100 | ||
| 13 | 11th March 2019 | 9361 | ||
| 14 | 13th April 2019 | 9661 | ||
| 15 | 15th May 2019 | 10,079 | ||
| 16 | 10th June 2019 | 10,414 | ||
| 17 | 13th July 2019 | 11,047 | ||
| 18 | 13th August 2019 | 11,340 | ||
| 19 | 20th September 2019 | 11,338 | ||
| 20 | 17th October 2019 | 11,213 | ||
| 21 | 19th November 2019 | 11,263 | ||
| Average Value | ||||
| Standard Deviation |
| Data Dump | 17th July 2015 | 19th November 2019 | ||
|---|---|---|---|---|
| Listings | Percentage | Listings | Percentage | |
| Entire home/apartment | 1729 | 9874 | ||
| Private room | 464 | 1040 | ||
| Hotel room | 0 | 291 | ||
| Shared room | 41 | 58 | ||
| Total | 2116 | 11,263 | ||
| Language | Number of Reviews | Percentage |
|---|---|---|
| English | 311,347 | |
| French | 26,847 | |
| Greek | 22,716 | |
| Spanish | 11,765 | |
| German | 7548 | |
| Italian | 4814 | |
| Russian | 2912 | |
| Other Languages | 14,361 | |
| Total | 402,310 |
| Keyword | Score | Keyword | Score |
|---|---|---|---|
| harry belafonte suite | 6.92 | major tourist attractions | 6.27 |
| million dollar view | 6.82 | main historical sites | 6.26 |
| pristine urban suites | 6.74 | major metro stations | 6.23 |
| solo female traveler | 6.69 | major historic sites | 6.23 |
| main tourist spots | 6.60 | air bnb experience | 6.22 |
| air conditioning works | 6.54 | major historical sites | 6.21 |
| nearest metro station | 6.52 | main metro station | 6.21 |
| air conditioning worked | 6.50 | short walking distance | 6.20 |
| main tourist areas | 6.48 | great water pressure | 6.19 |
| great air conditioning | 6.48 | good water pressure | 6.16 |
| good air conditioning | 6.45 | king size bed | 6.15 |
| bring ear plugs | 6.39 | x95 bus stop | 6.12 |
| national archaeological museum | 6.38 | main shopping district | 6.10 |
| main tourist sites | 6.35 | ac works great | 6.10 |
| main pedestrian street | 6.33 | ac worked great | 6.05 |
| main tourist attractions | 6.32 | busy pedestrian street | 6.03 |
| major tourist sites | 6.30 | akropoli metro station | 5.99 |
| main tourist area | 6.28 | hot water heater | 5.99 |
| main shopping strip | 6.27 | air conditioning unit | 5.98 |
| national archeological museum | 6.27 |
| Number of Listings per Host | 17th July 2015 | 19th November 2019 | ||
|---|---|---|---|---|
| Listings | Percentage | Listings | Percentage | |
| One listing | 228 | 430 | ||
| More listings | 159 | 959 | ||
| Total | 387 | 1389 | ||
© 2020 by the authors. Licensee MDPI, Basel, Switzerland. This article is an open access article distributed under the terms and conditions of the Creative Commons Attribution (CC BY) license (http://creativecommons.org/licenses/by/4.0/).
Share and Cite
Alexandridis, G.; Voutos, Y.; Mylonas, P.; Caridakis, G. A Geolocation Analytics-Driven Ontology for Short-Term Leases: Inferring Current Sharing Economy Trends. Algorithms 2020, 13, 59. https://doi.org/10.3390/a13030059
Alexandridis G, Voutos Y, Mylonas P, Caridakis G. A Geolocation Analytics-Driven Ontology for Short-Term Leases: Inferring Current Sharing Economy Trends. Algorithms. 2020; 13(3):59. https://doi.org/10.3390/a13030059
Chicago/Turabian StyleAlexandridis, Georgios, Yorghos Voutos, Phivos Mylonas, and George Caridakis. 2020. "A Geolocation Analytics-Driven Ontology for Short-Term Leases: Inferring Current Sharing Economy Trends" Algorithms 13, no. 3: 59. https://doi.org/10.3390/a13030059
APA StyleAlexandridis, G., Voutos, Y., Mylonas, P., & Caridakis, G. (2020). A Geolocation Analytics-Driven Ontology for Short-Term Leases: Inferring Current Sharing Economy Trends. Algorithms, 13(3), 59. https://doi.org/10.3390/a13030059