An IoT System for Social Distancing and Emergency Management in Smart Cities Using Multi-Sensor Data


Abstract
1. Introduction
1.1. Literature Review on Available Solutions
1.2. Objectives and Scopes
2. IoT System Description
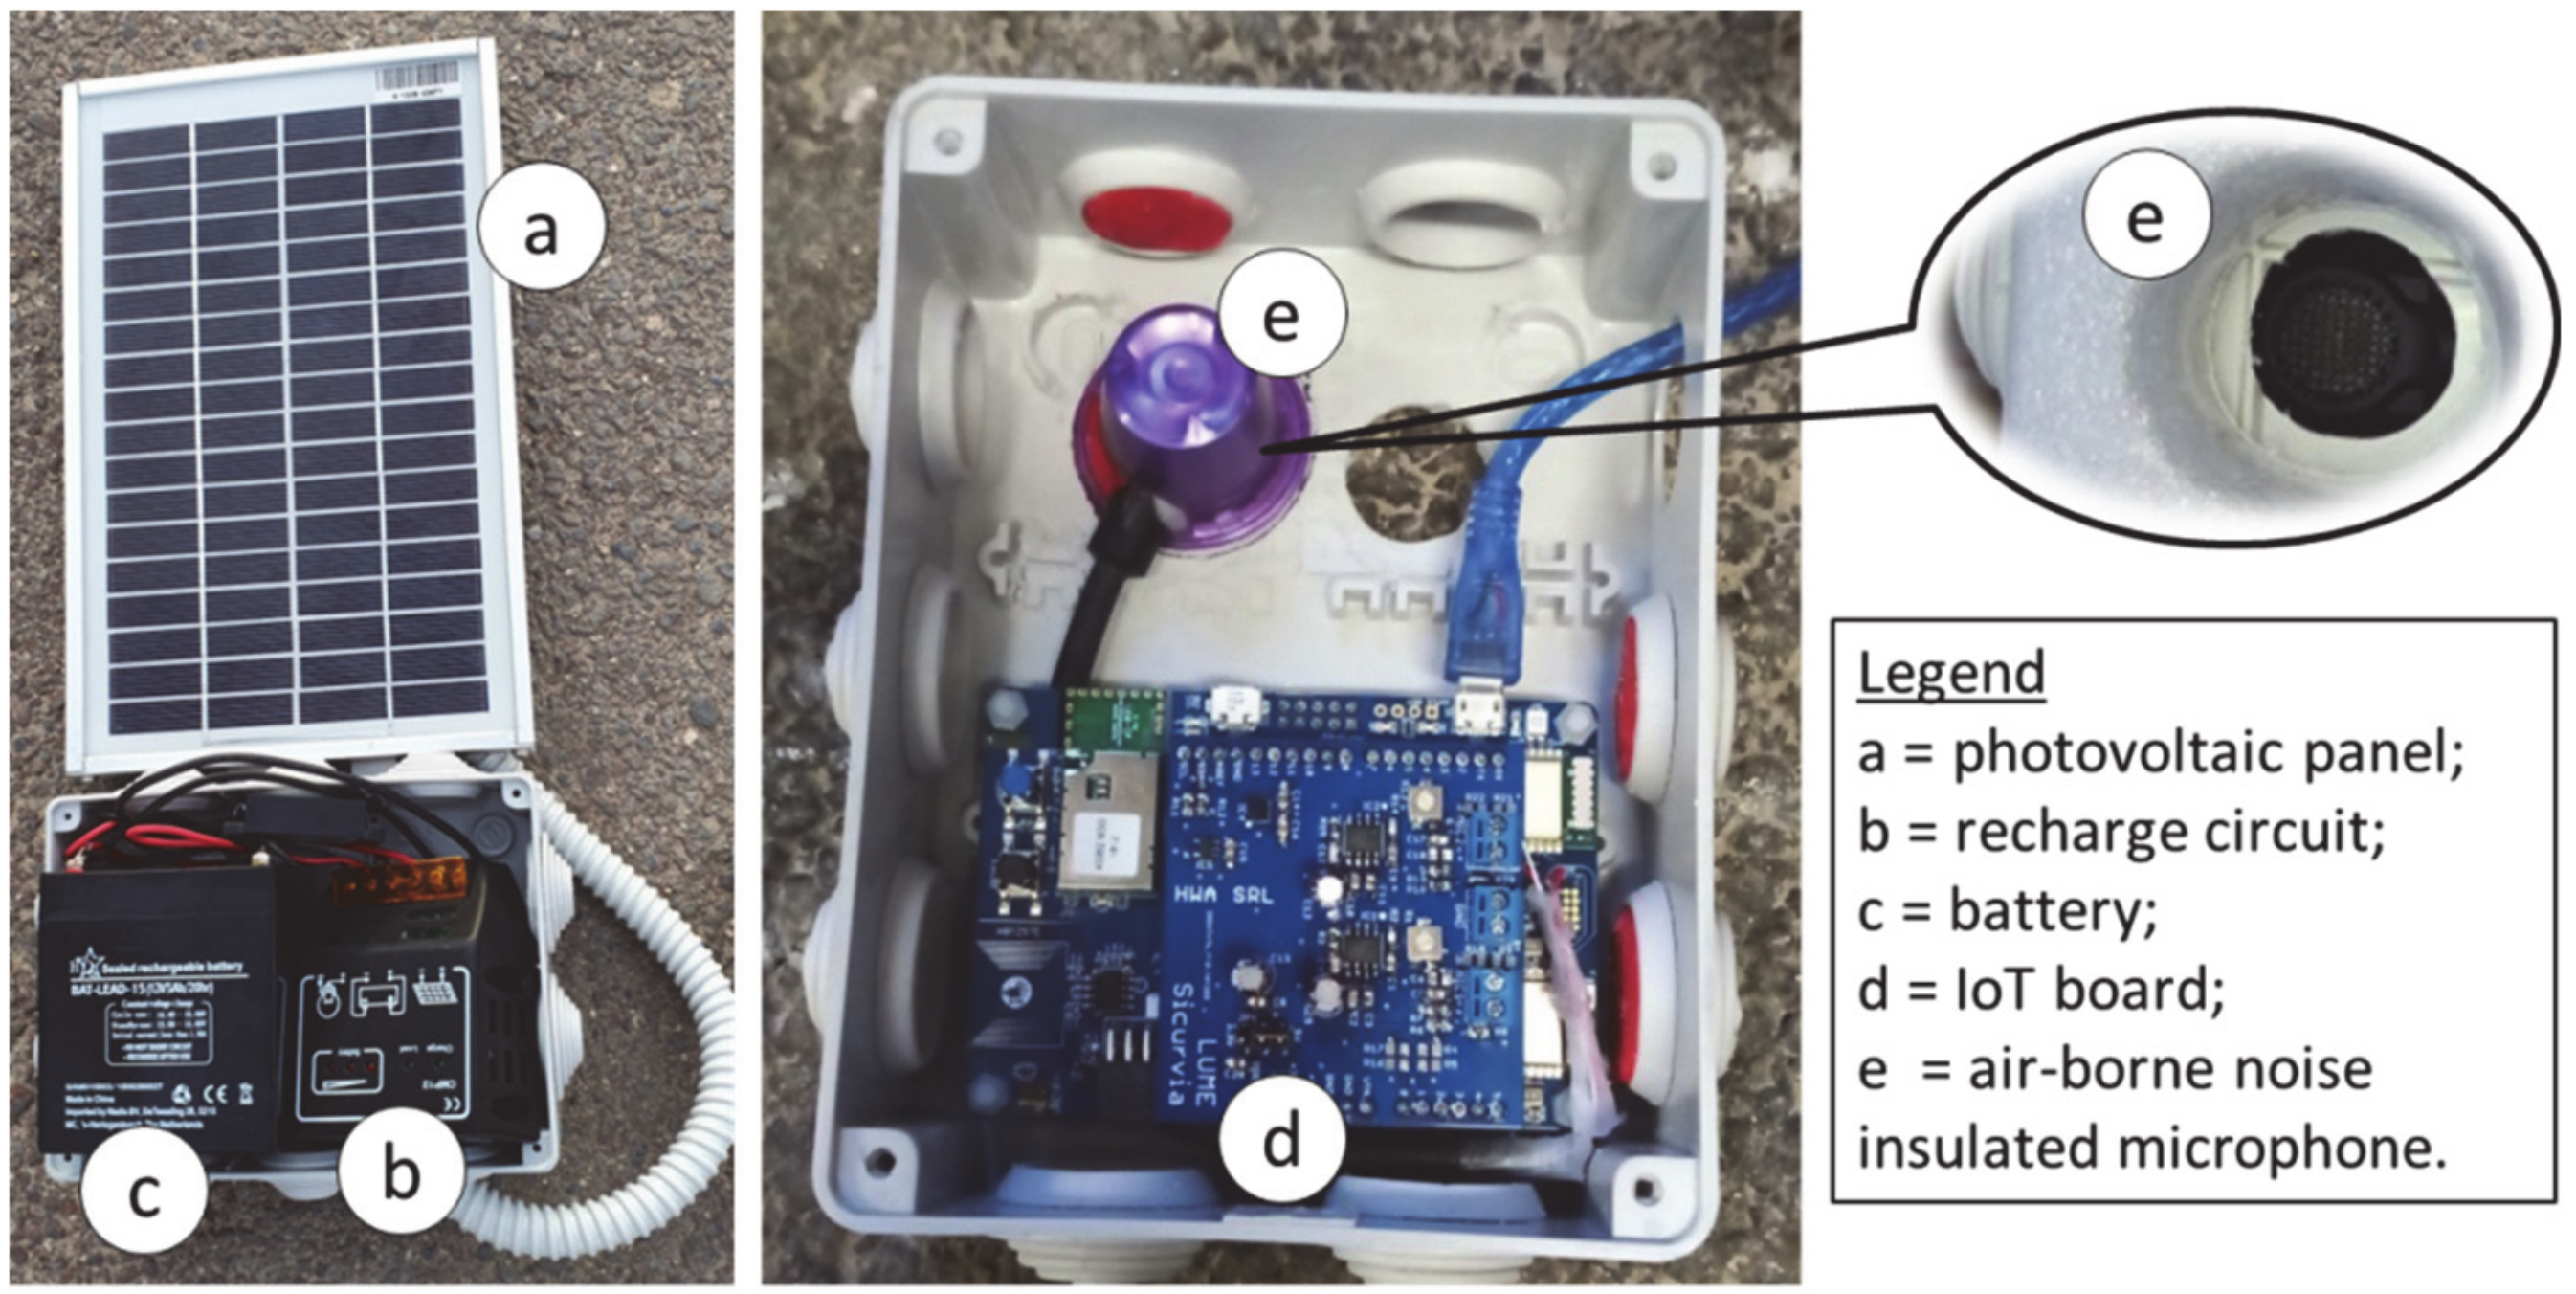
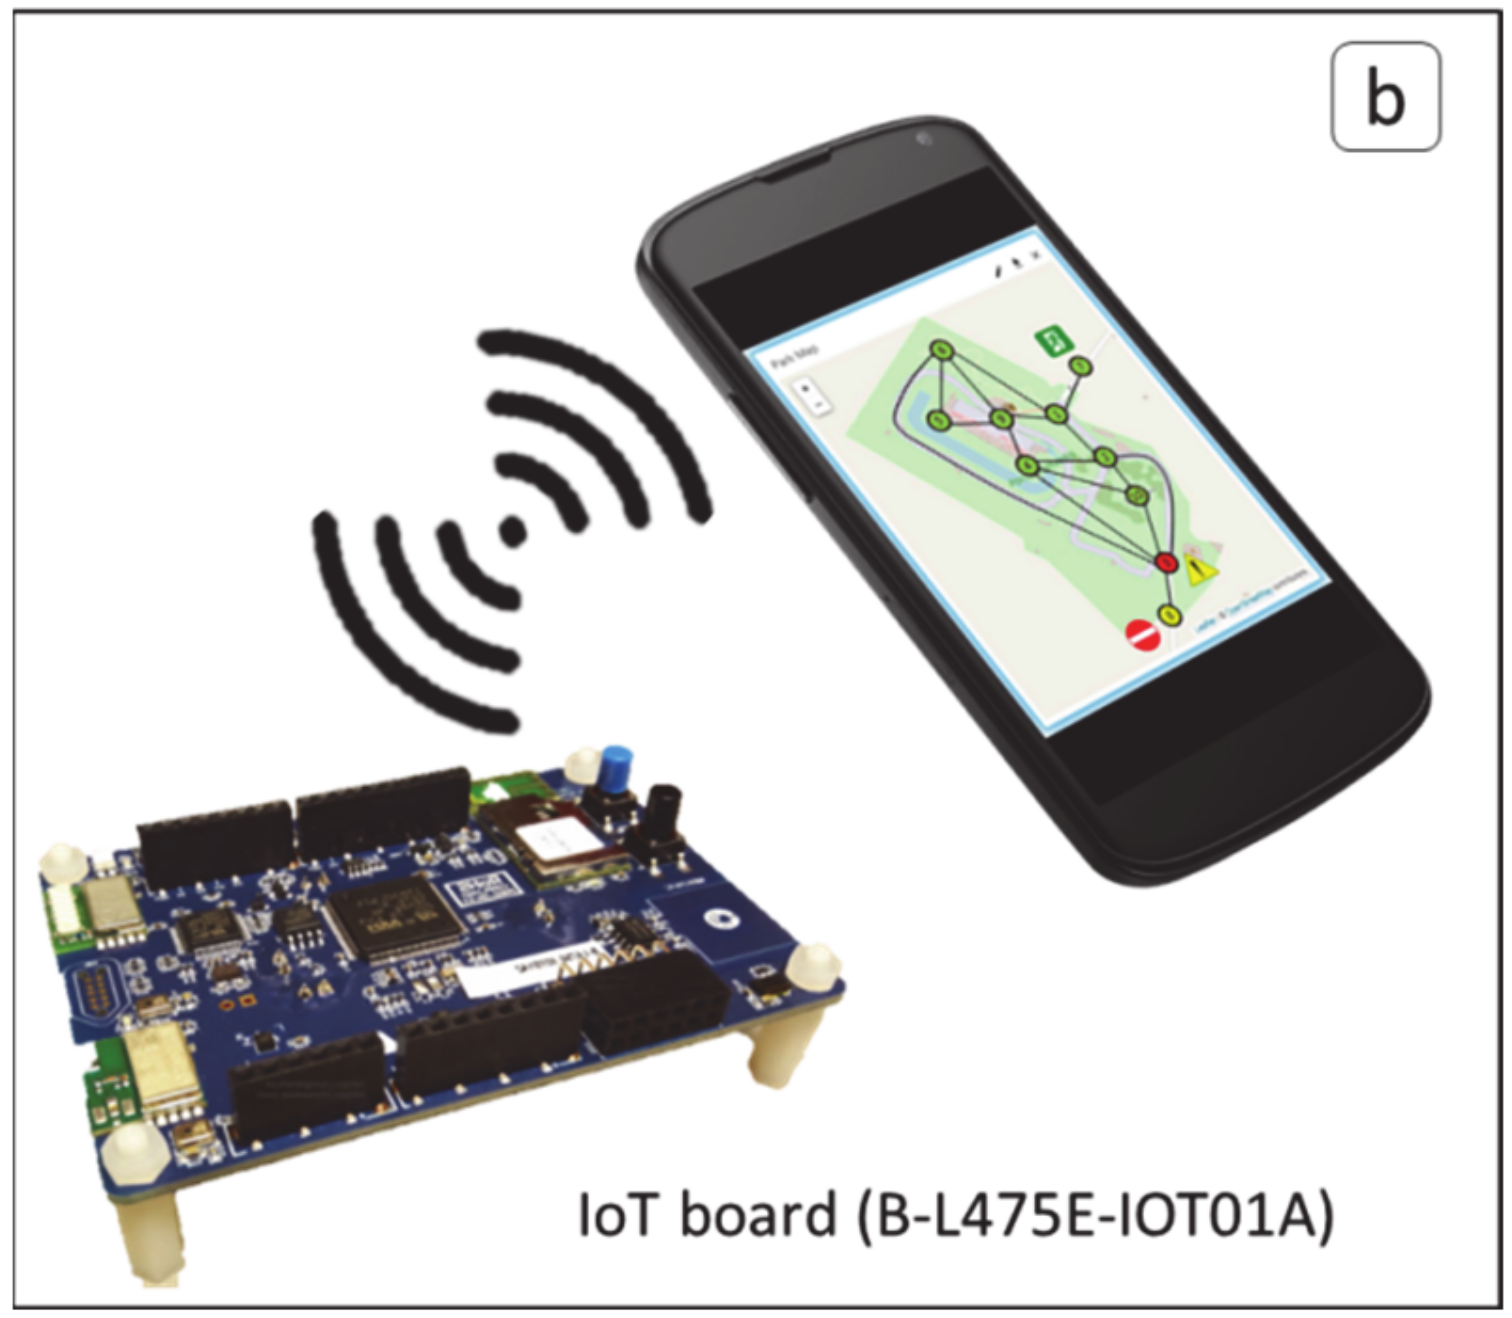
2.1. Hardware: A Multisensor IoT-WSN
2.2. Software: NN-Based and SPF Algorithms for Emergency Management and Social Distancing
3. Case Studies
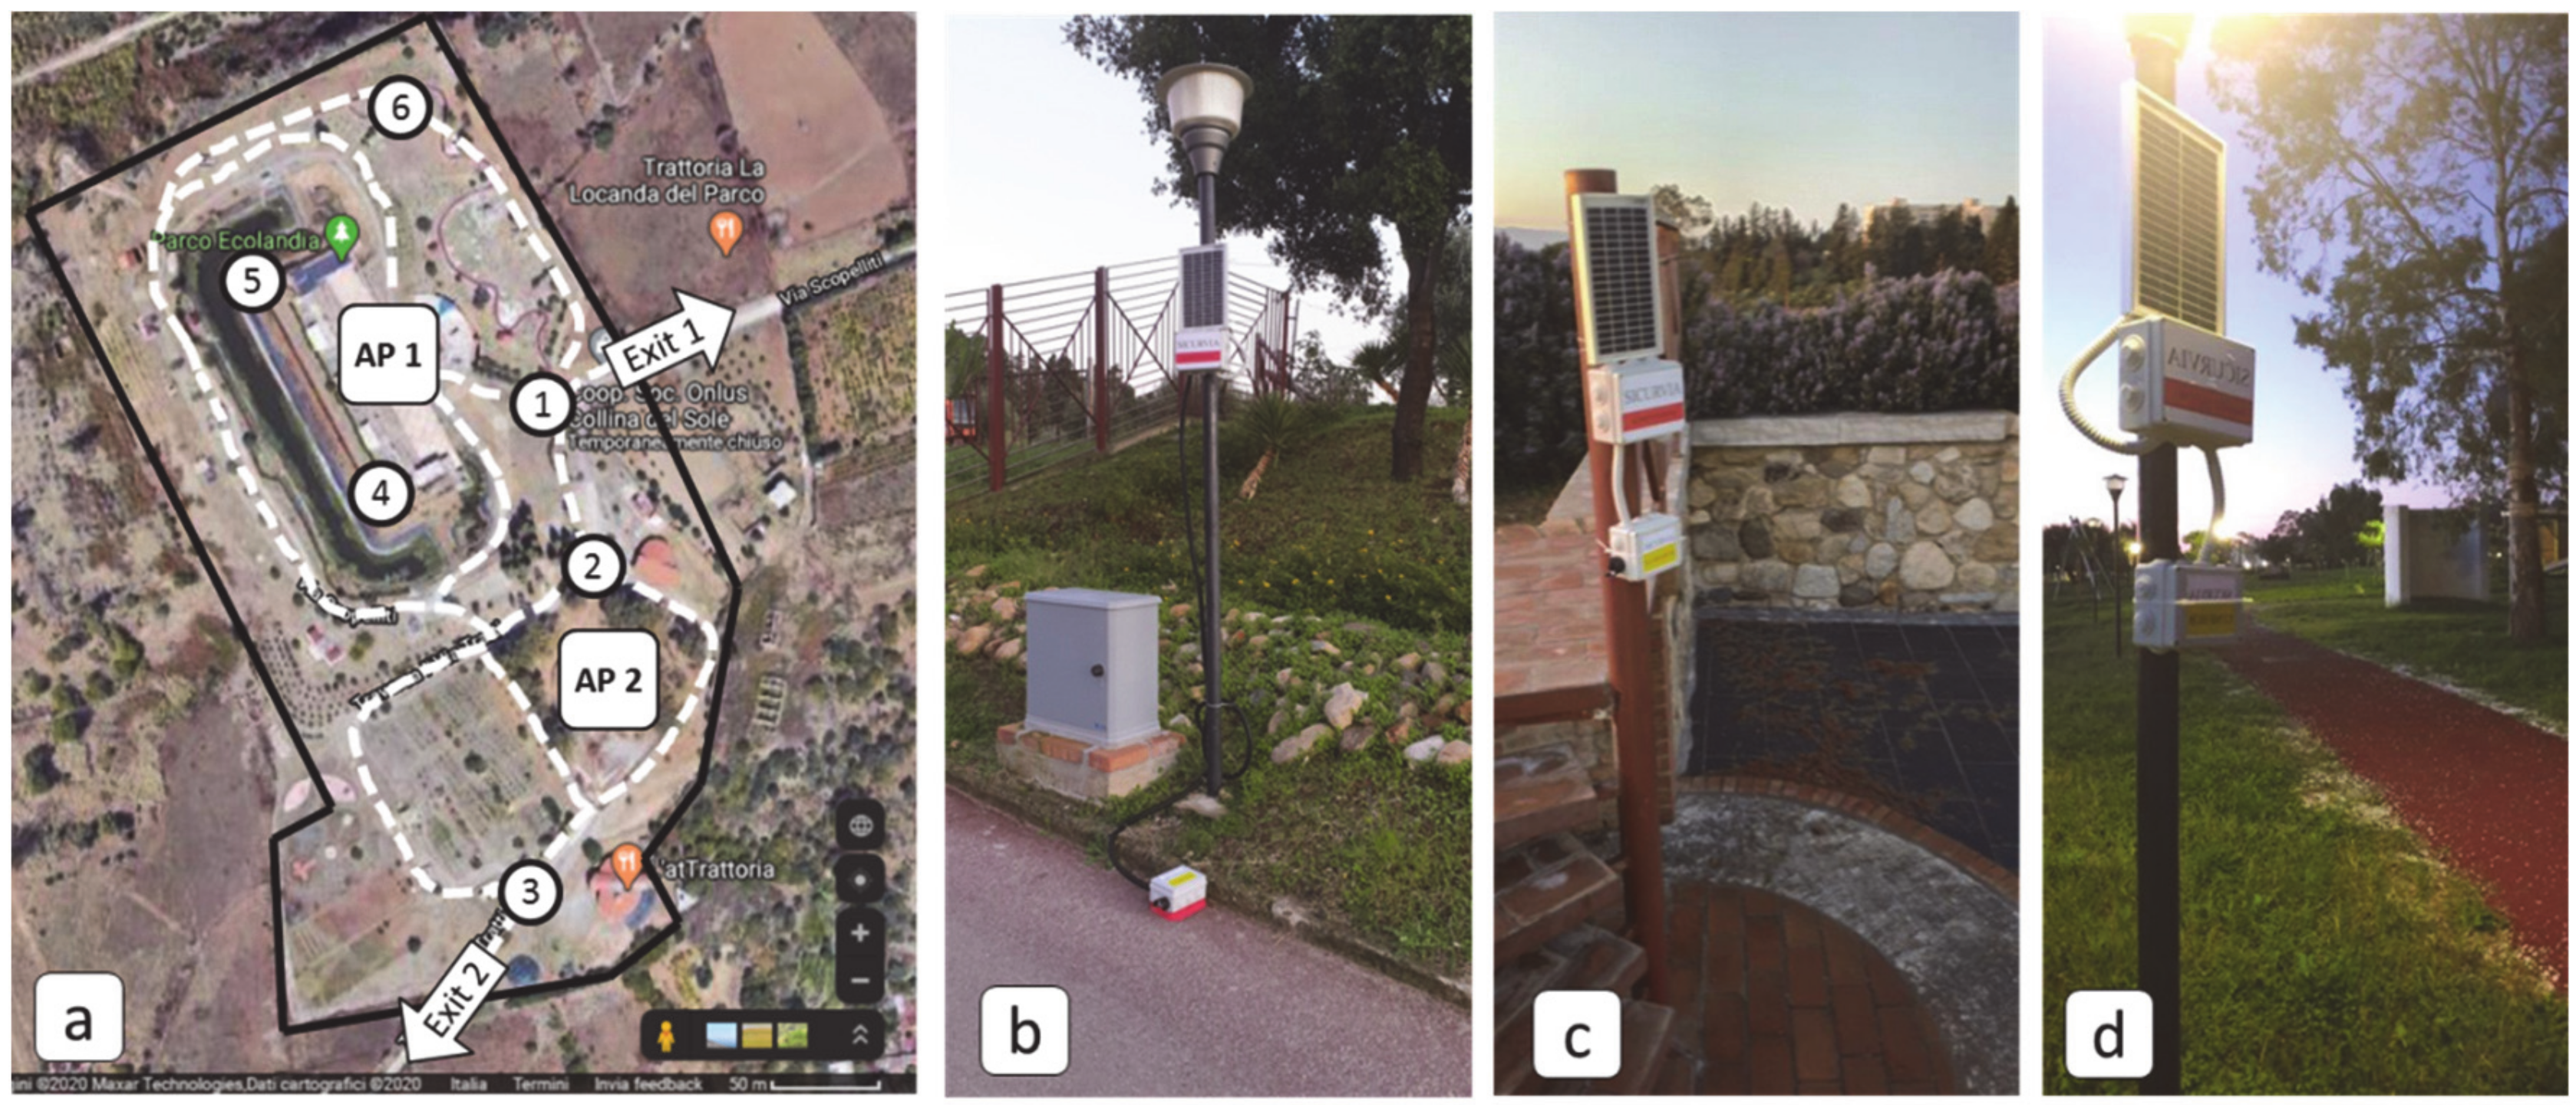
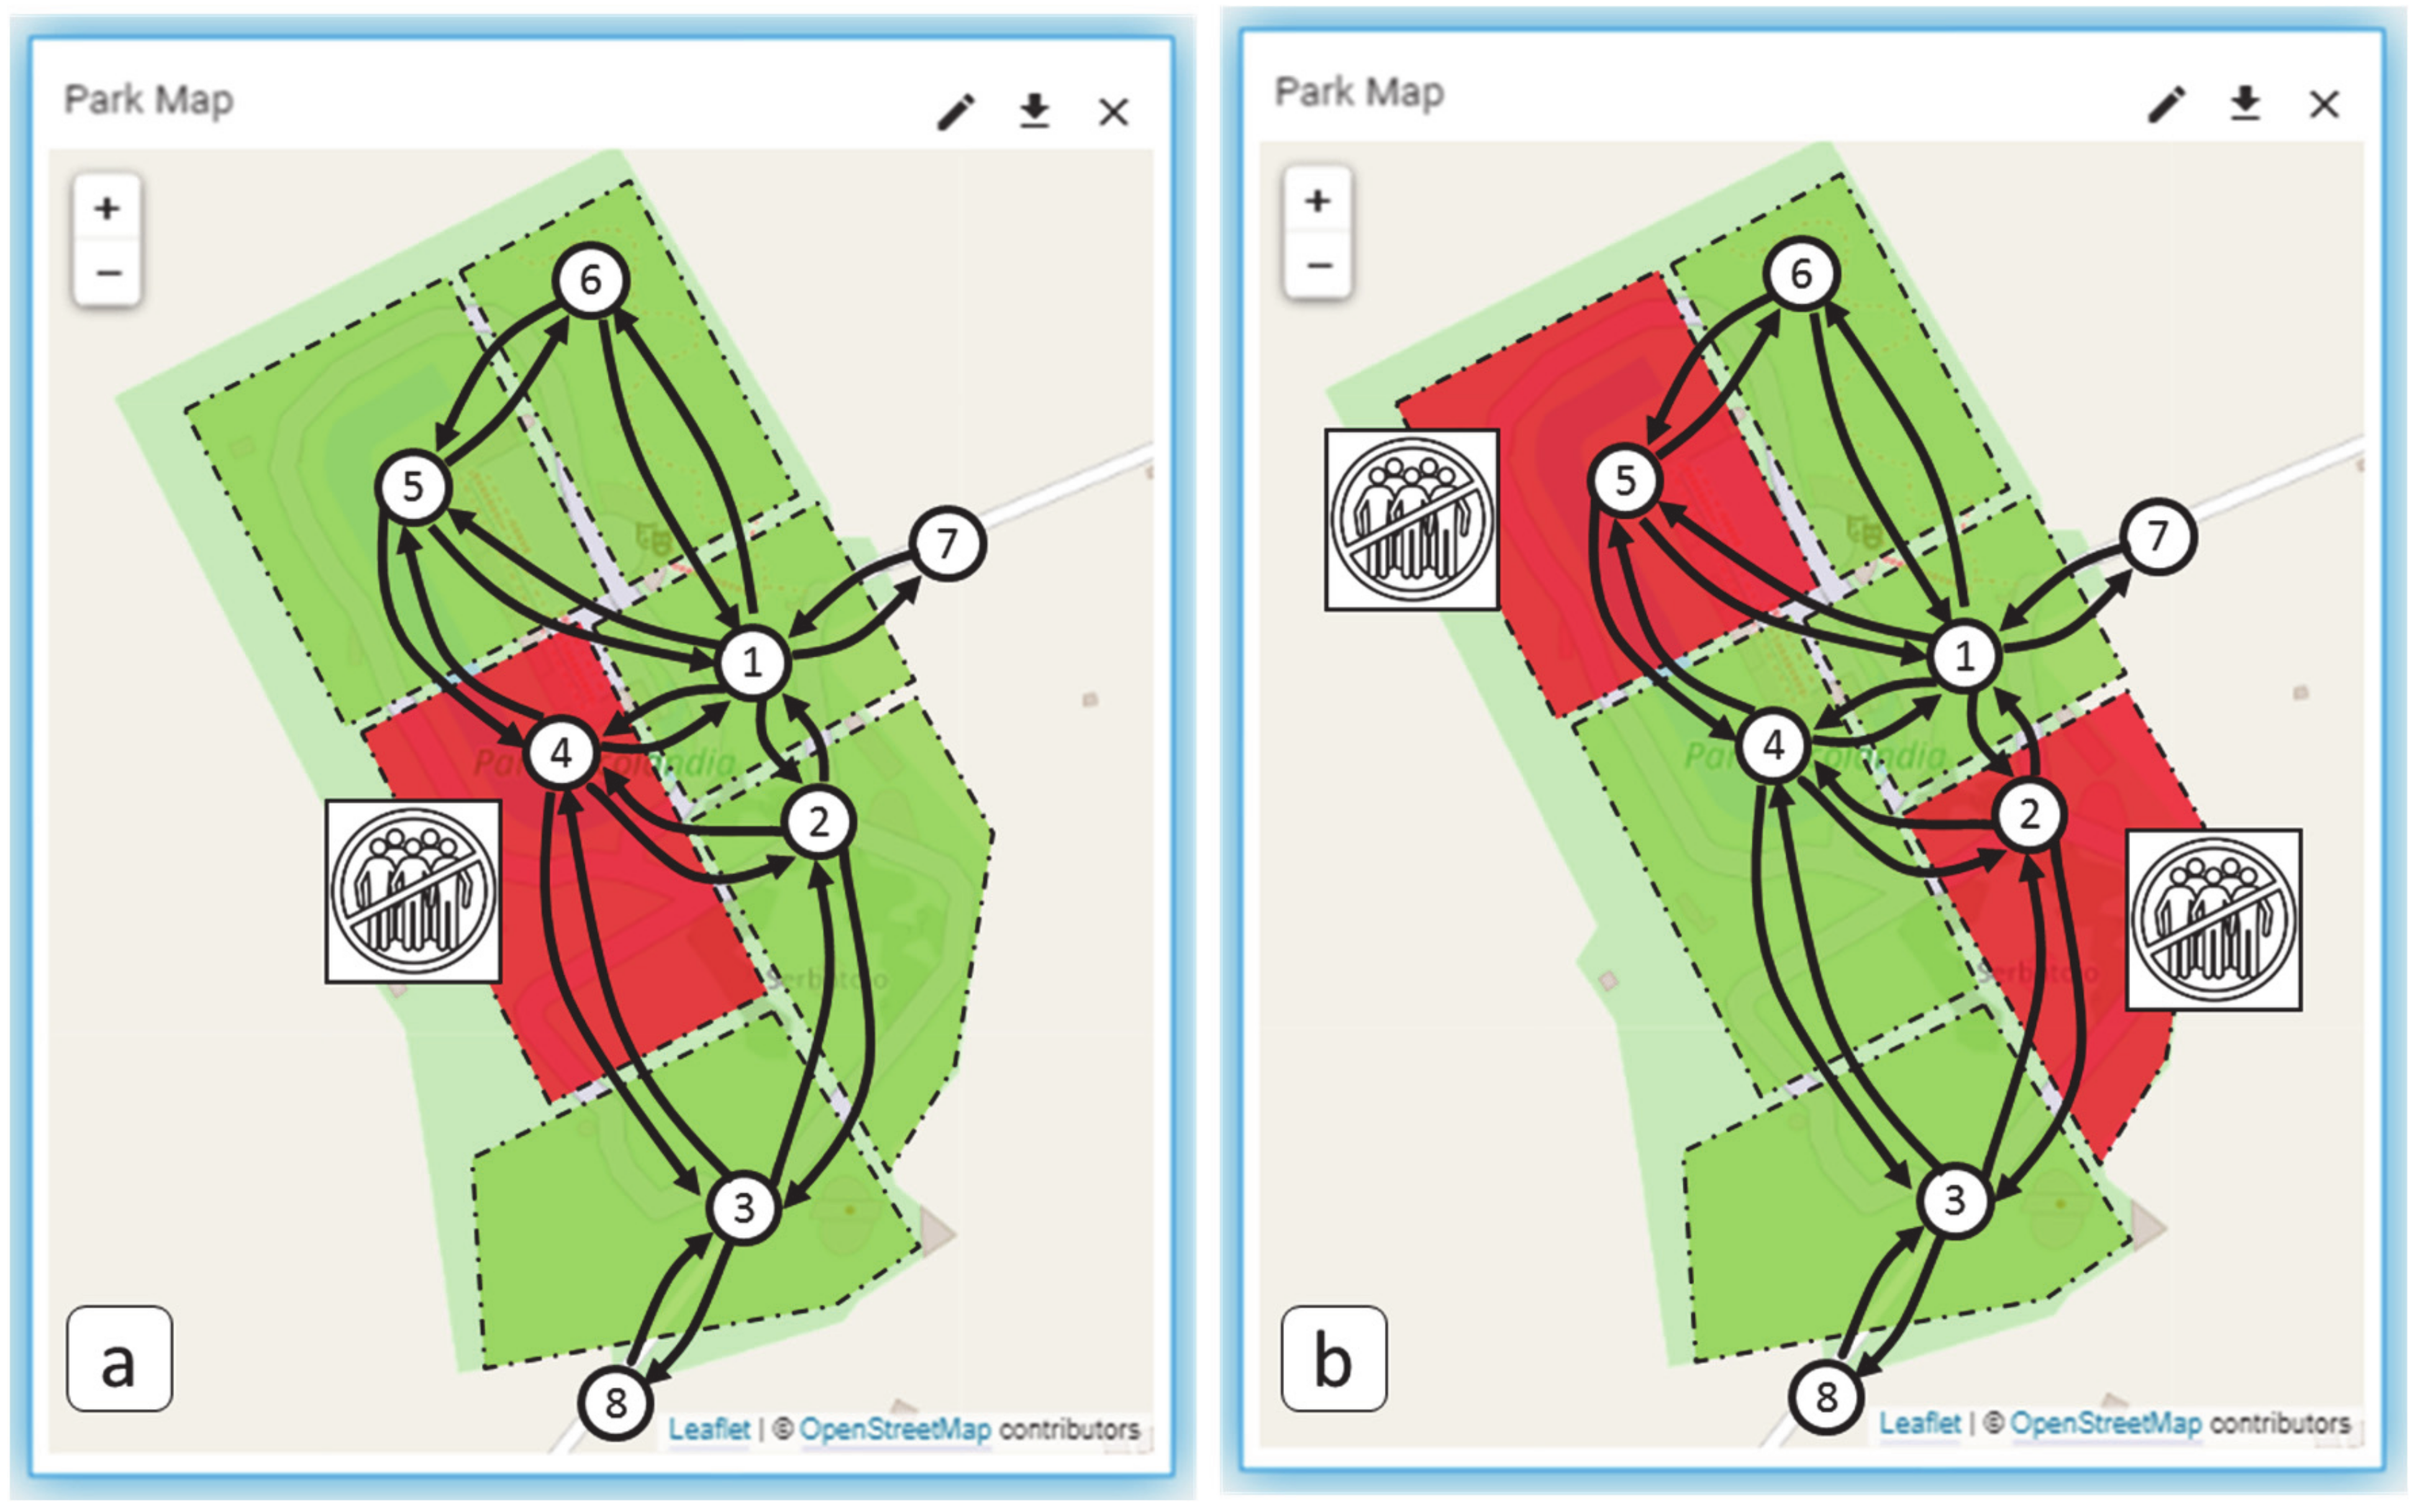
3.1. Case Study 1: Monitoring Scenario (Social Distancing)
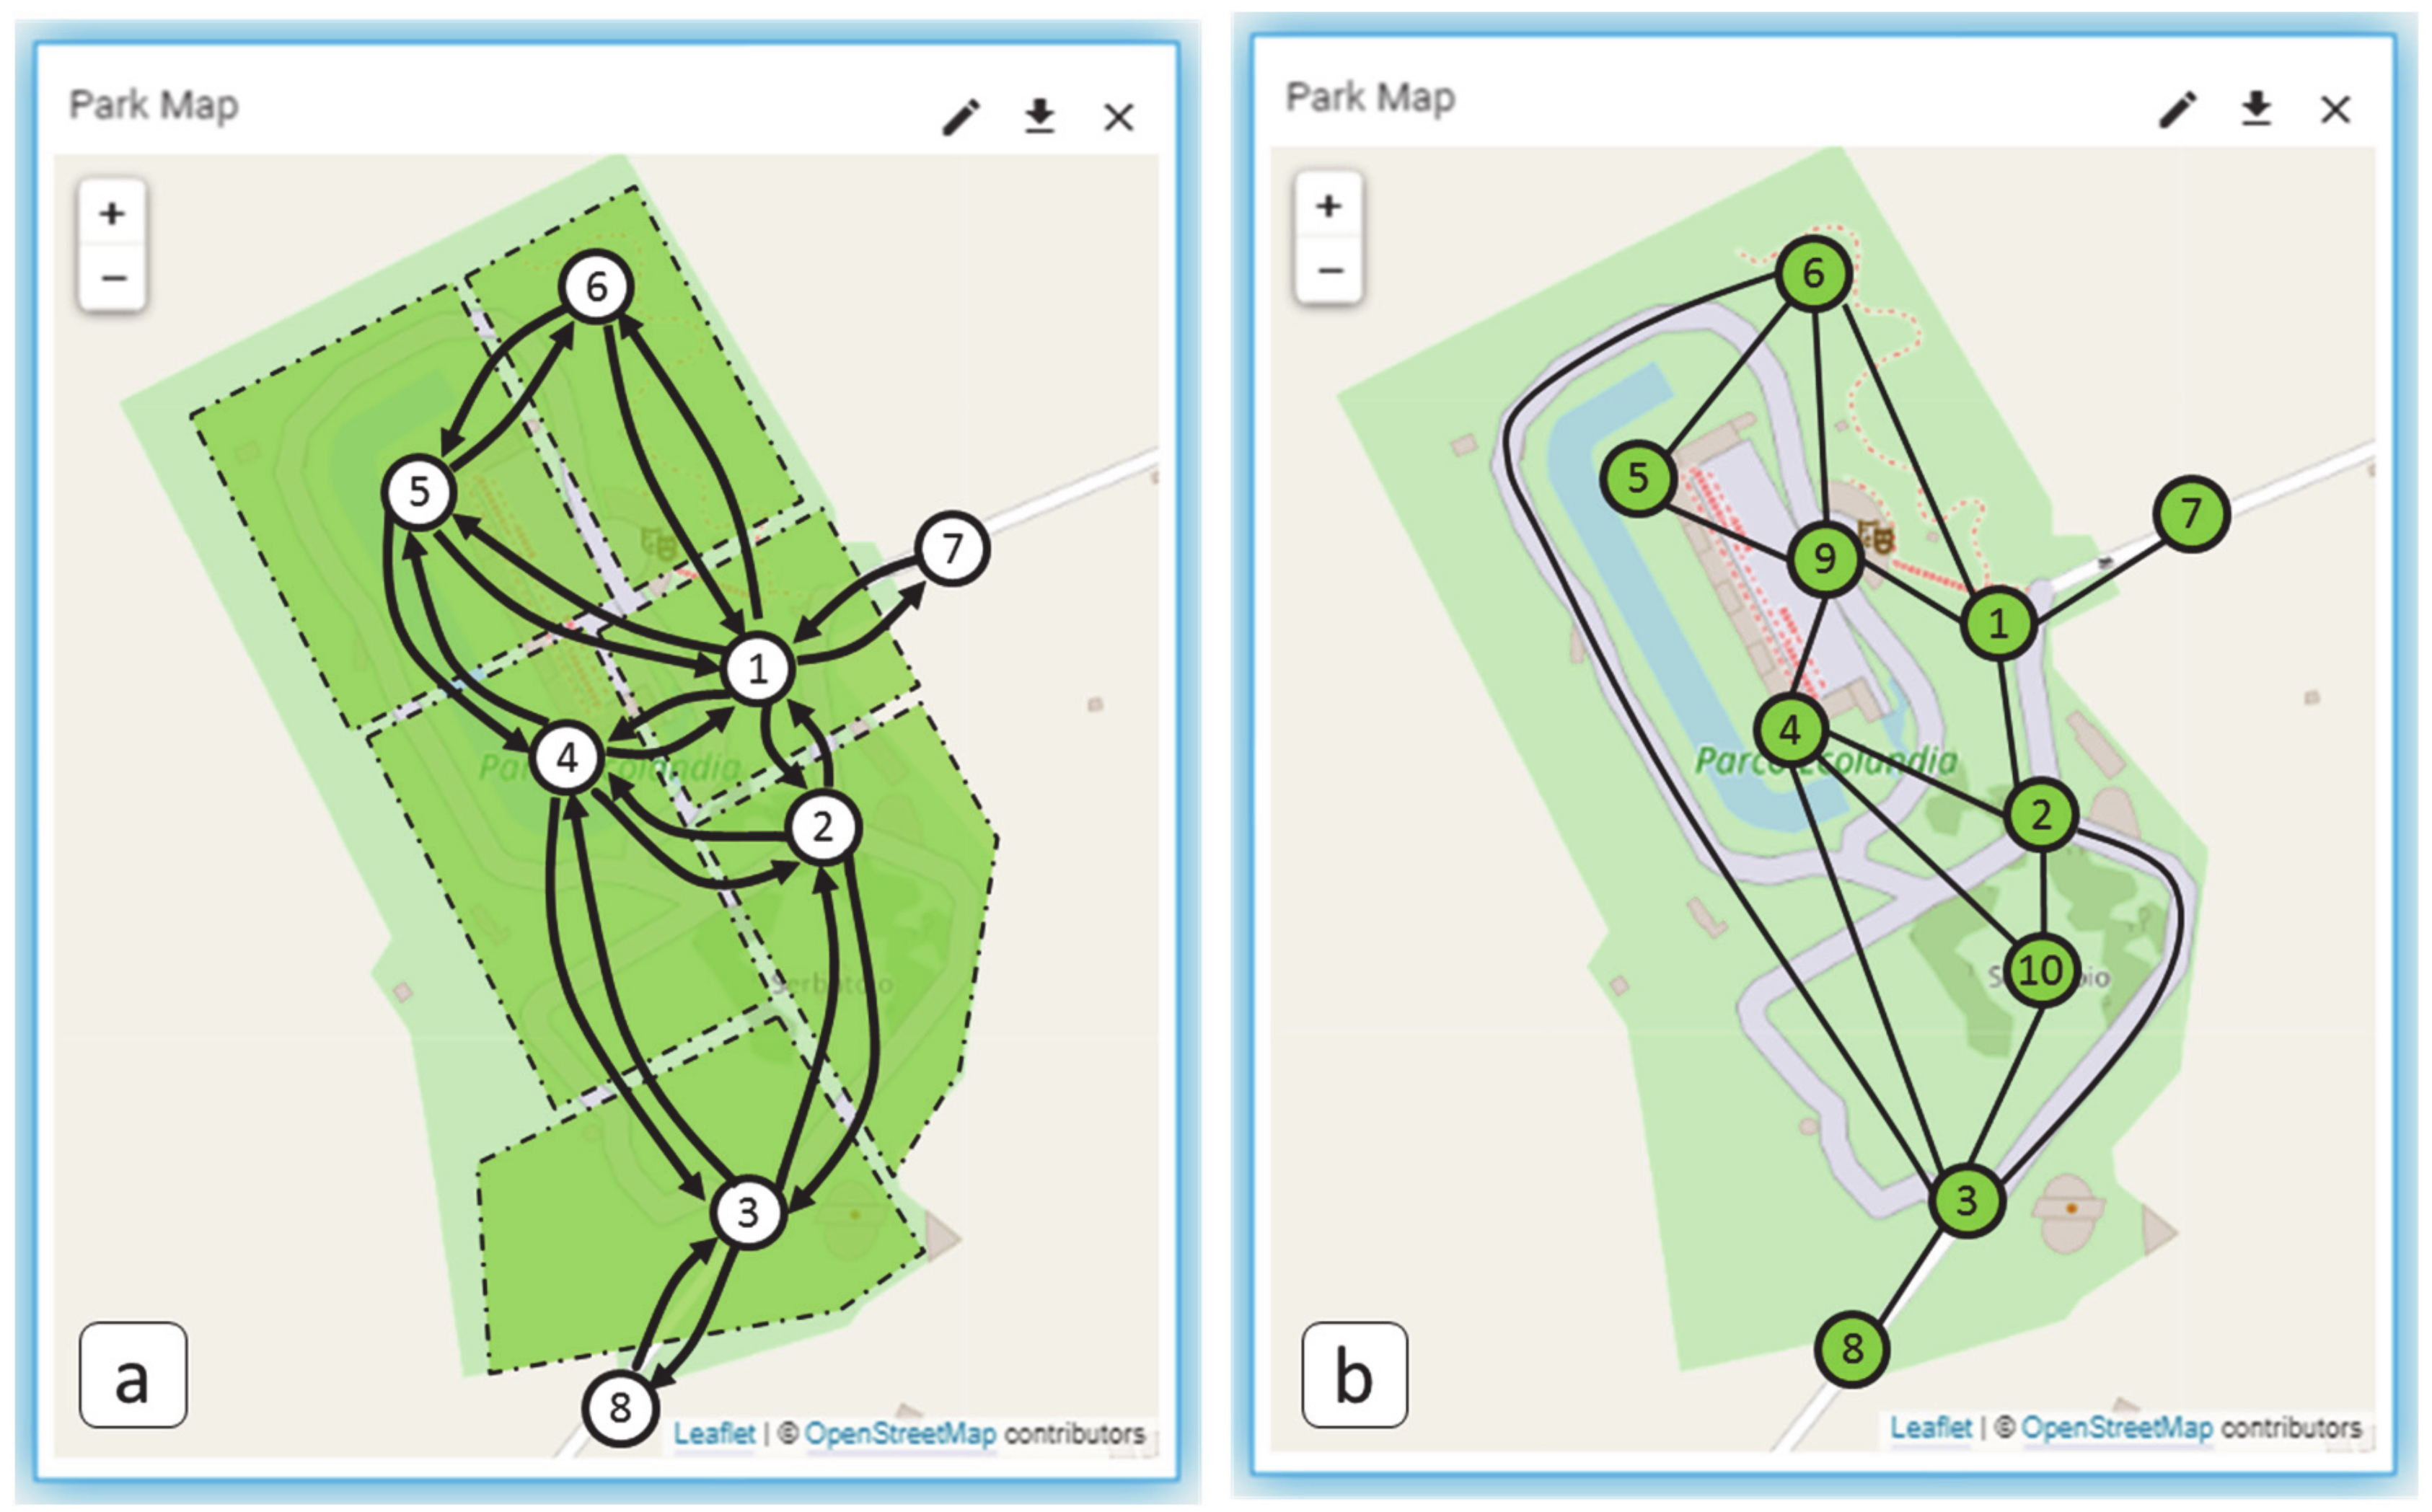
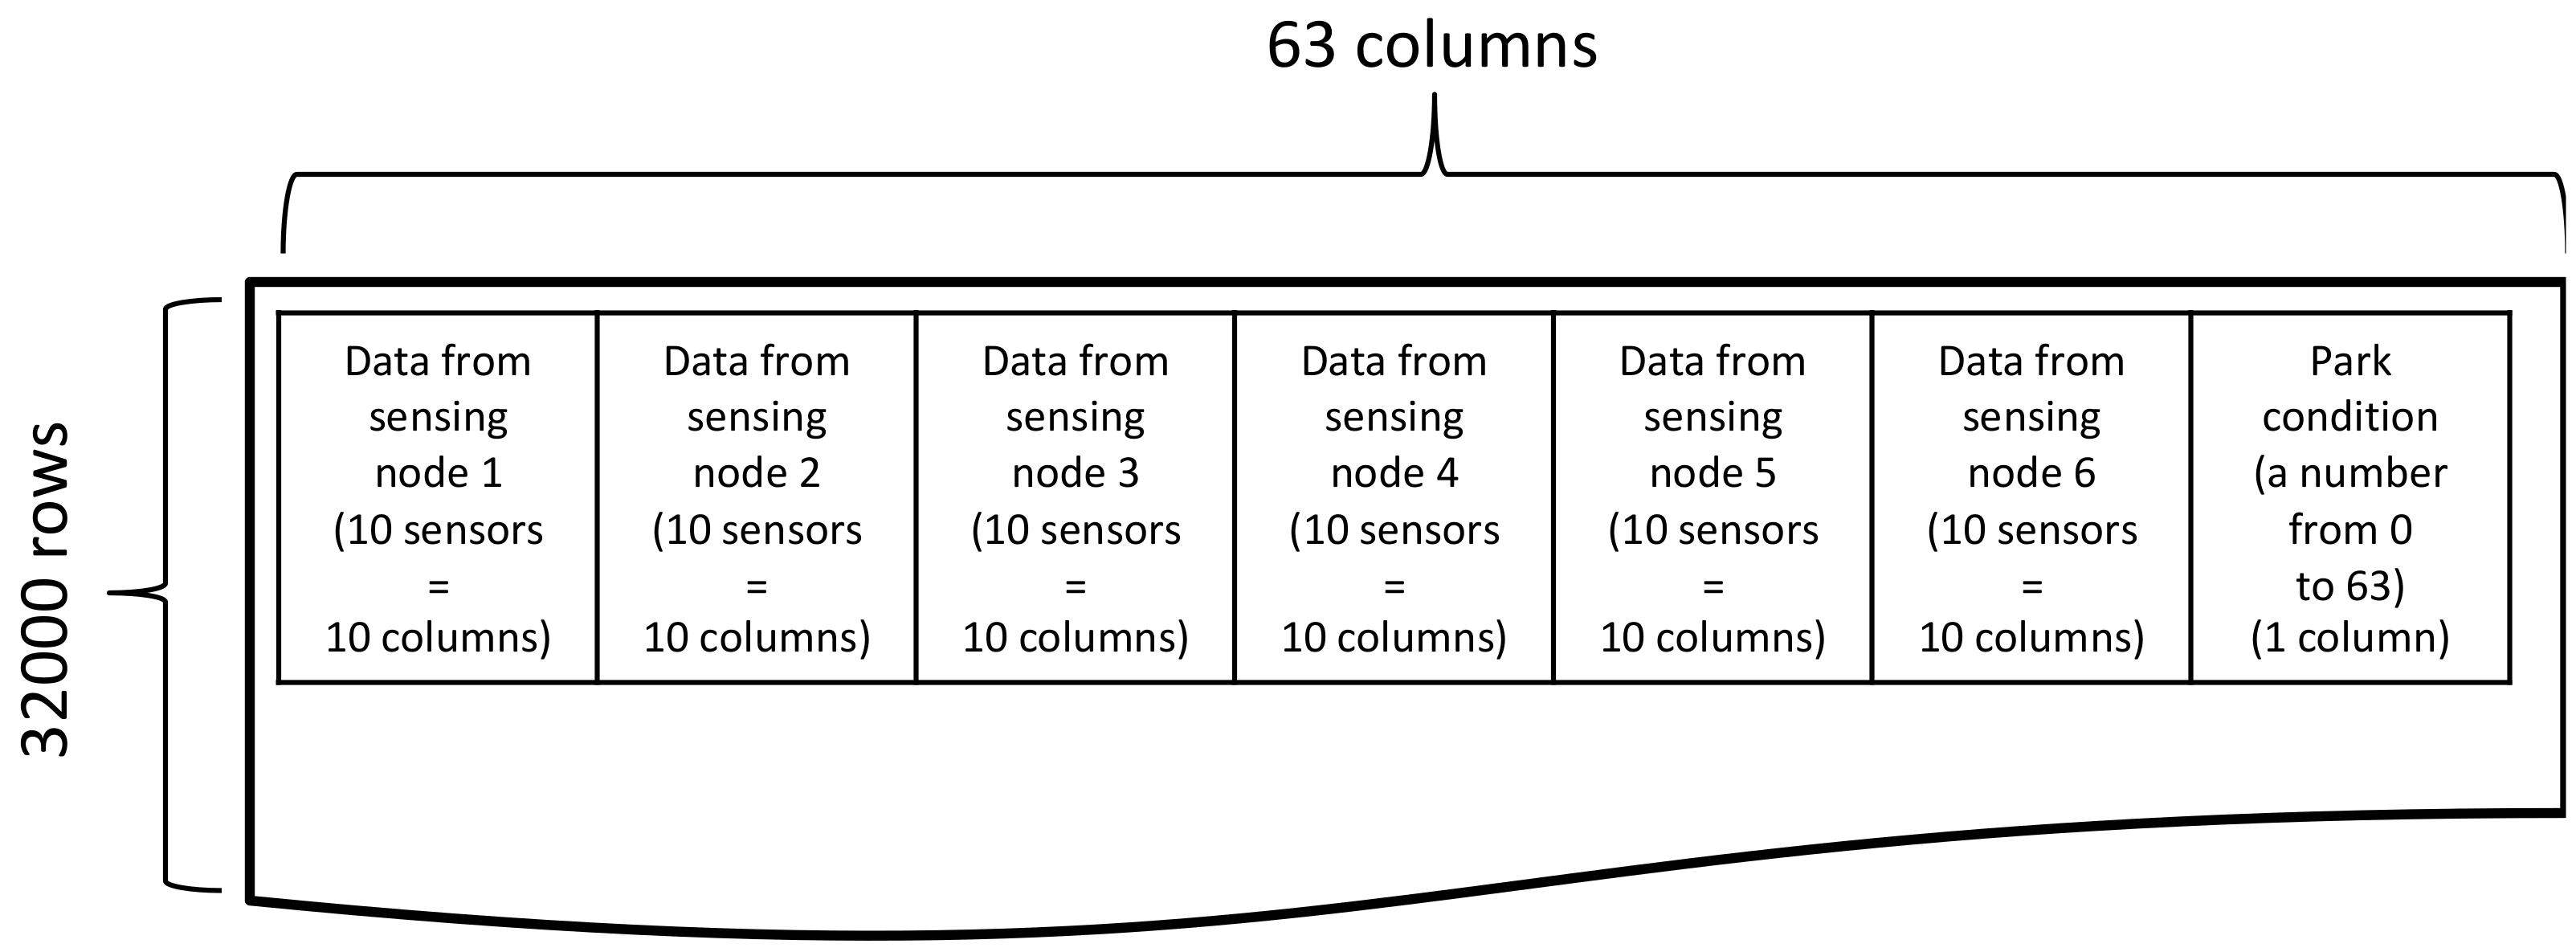
3.1.1. Case Study 1: Data Generation
3.1.2. Case Study 1: Algorithms
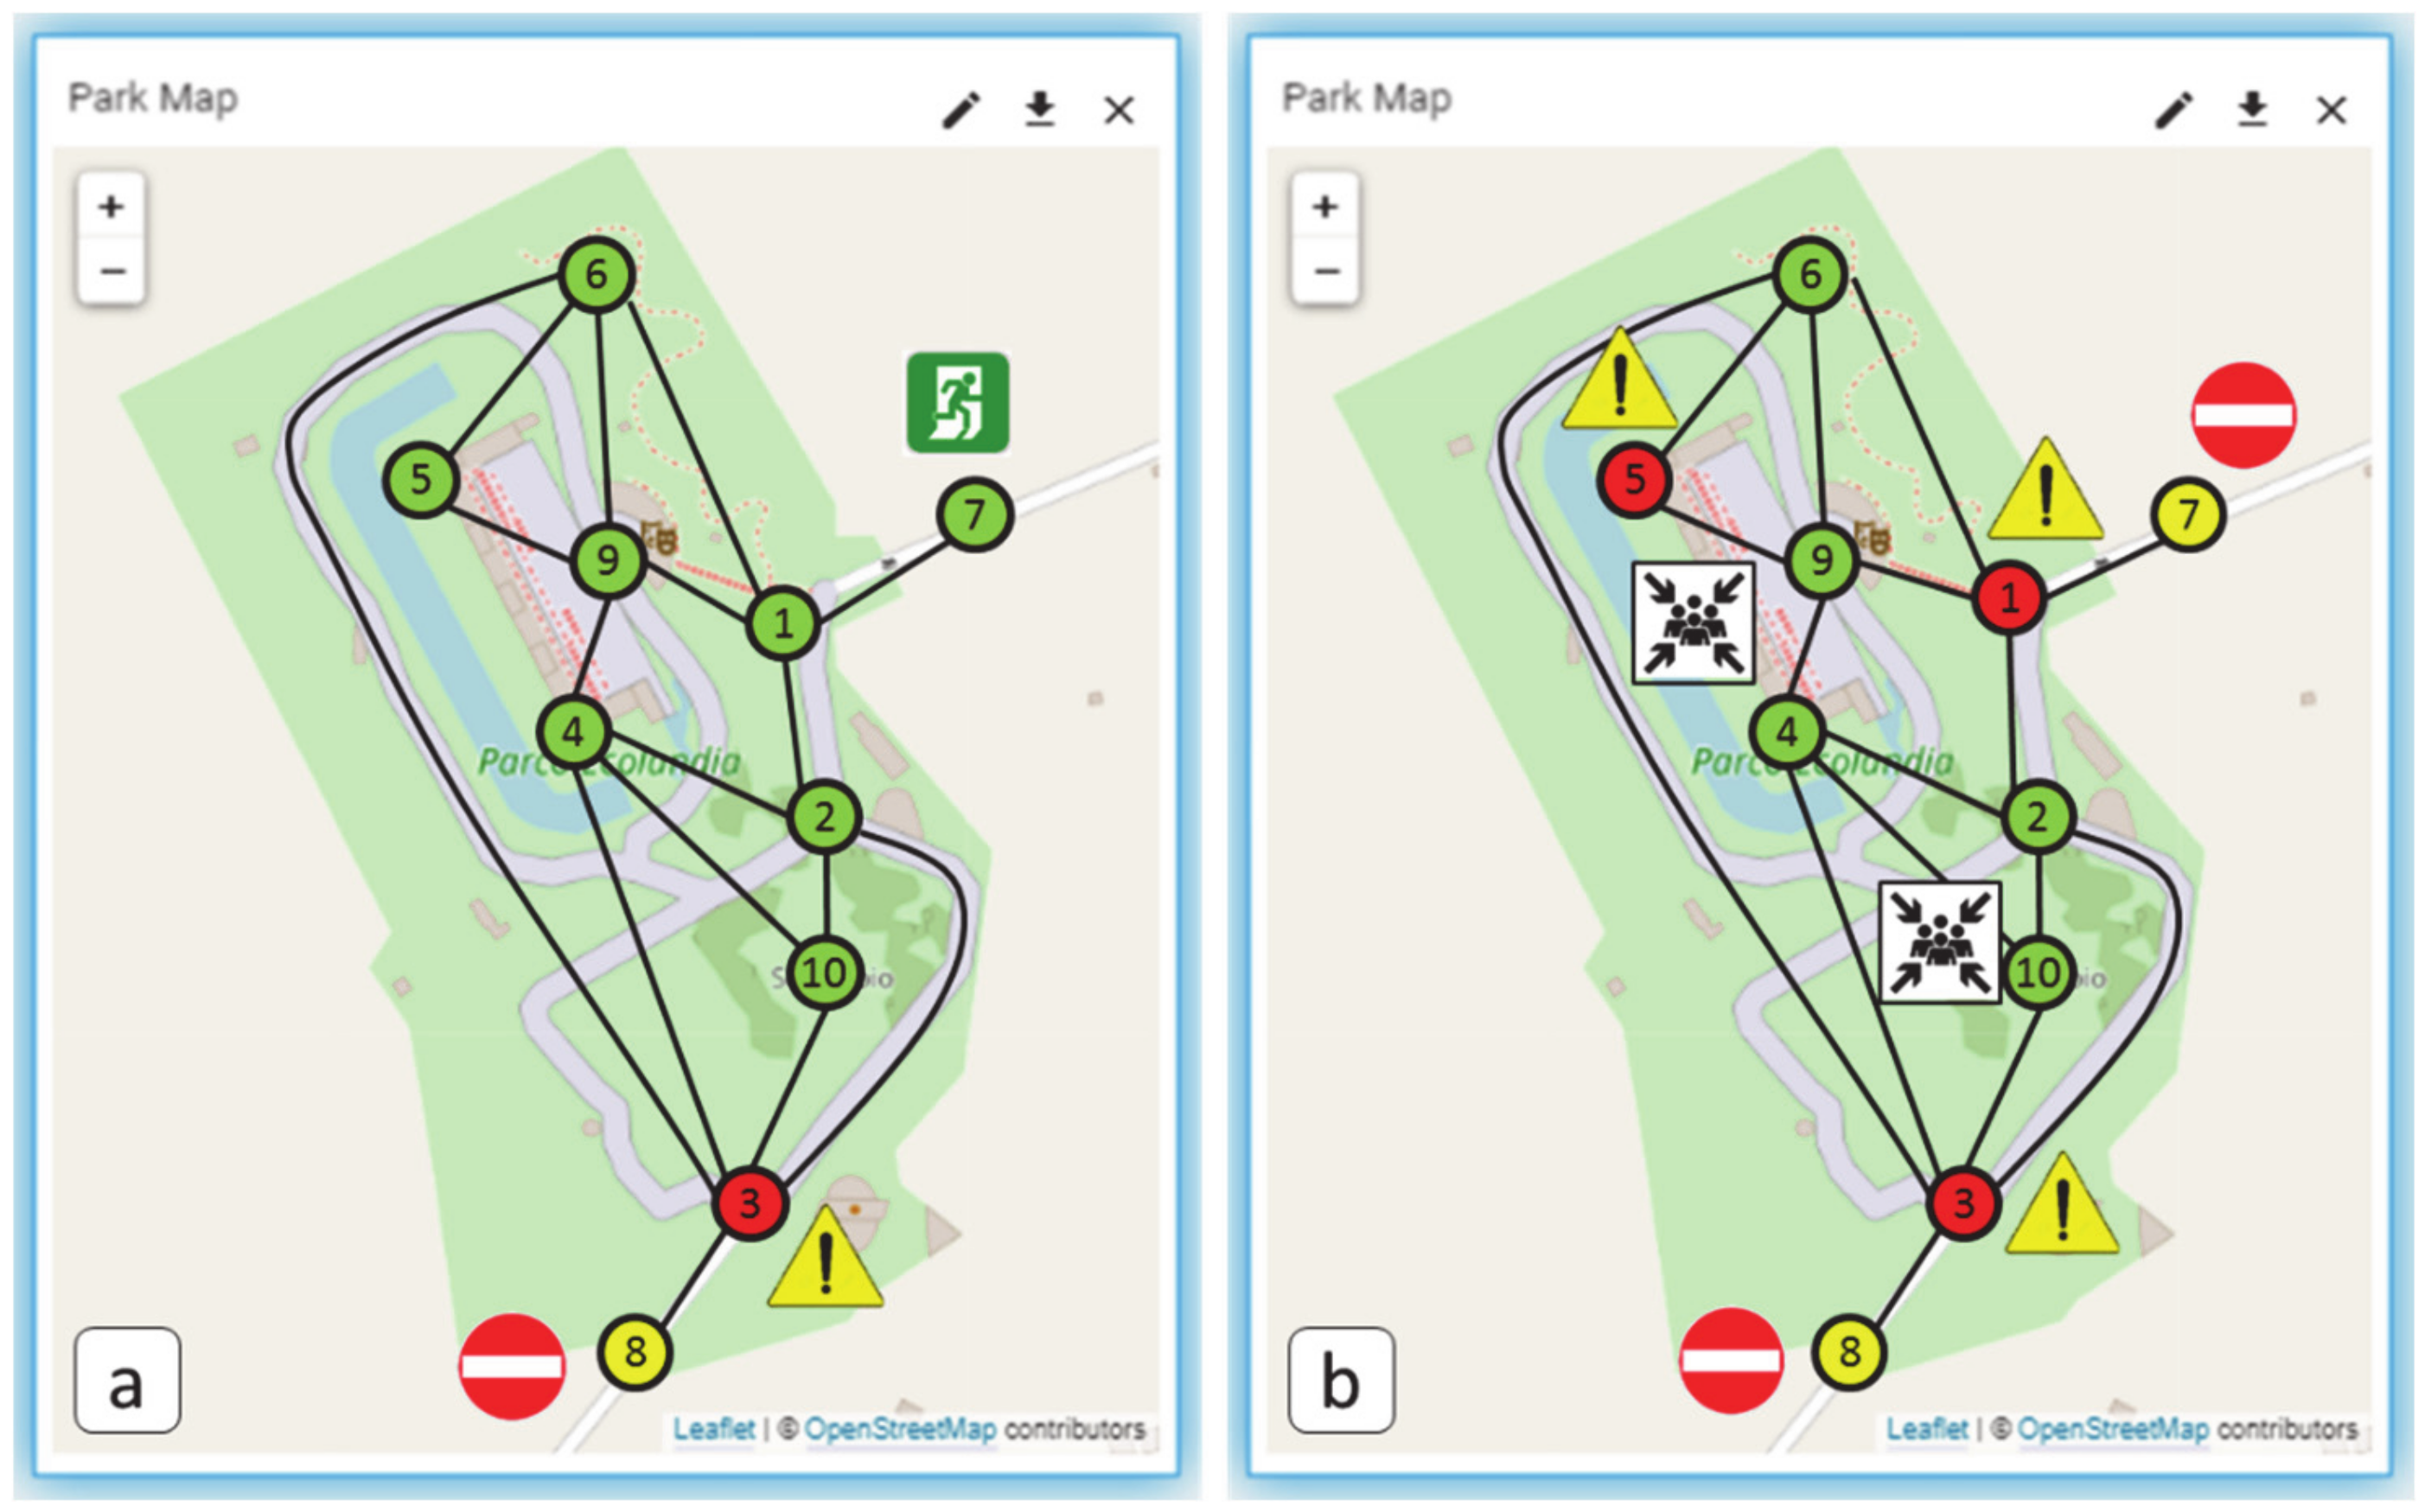
3.2. Case Study 2: Emergency Scenario (Emergency Management)
3.2.1. Case Study 2: Dataset Generation
3.2.2. Case Study 2: Algorithms
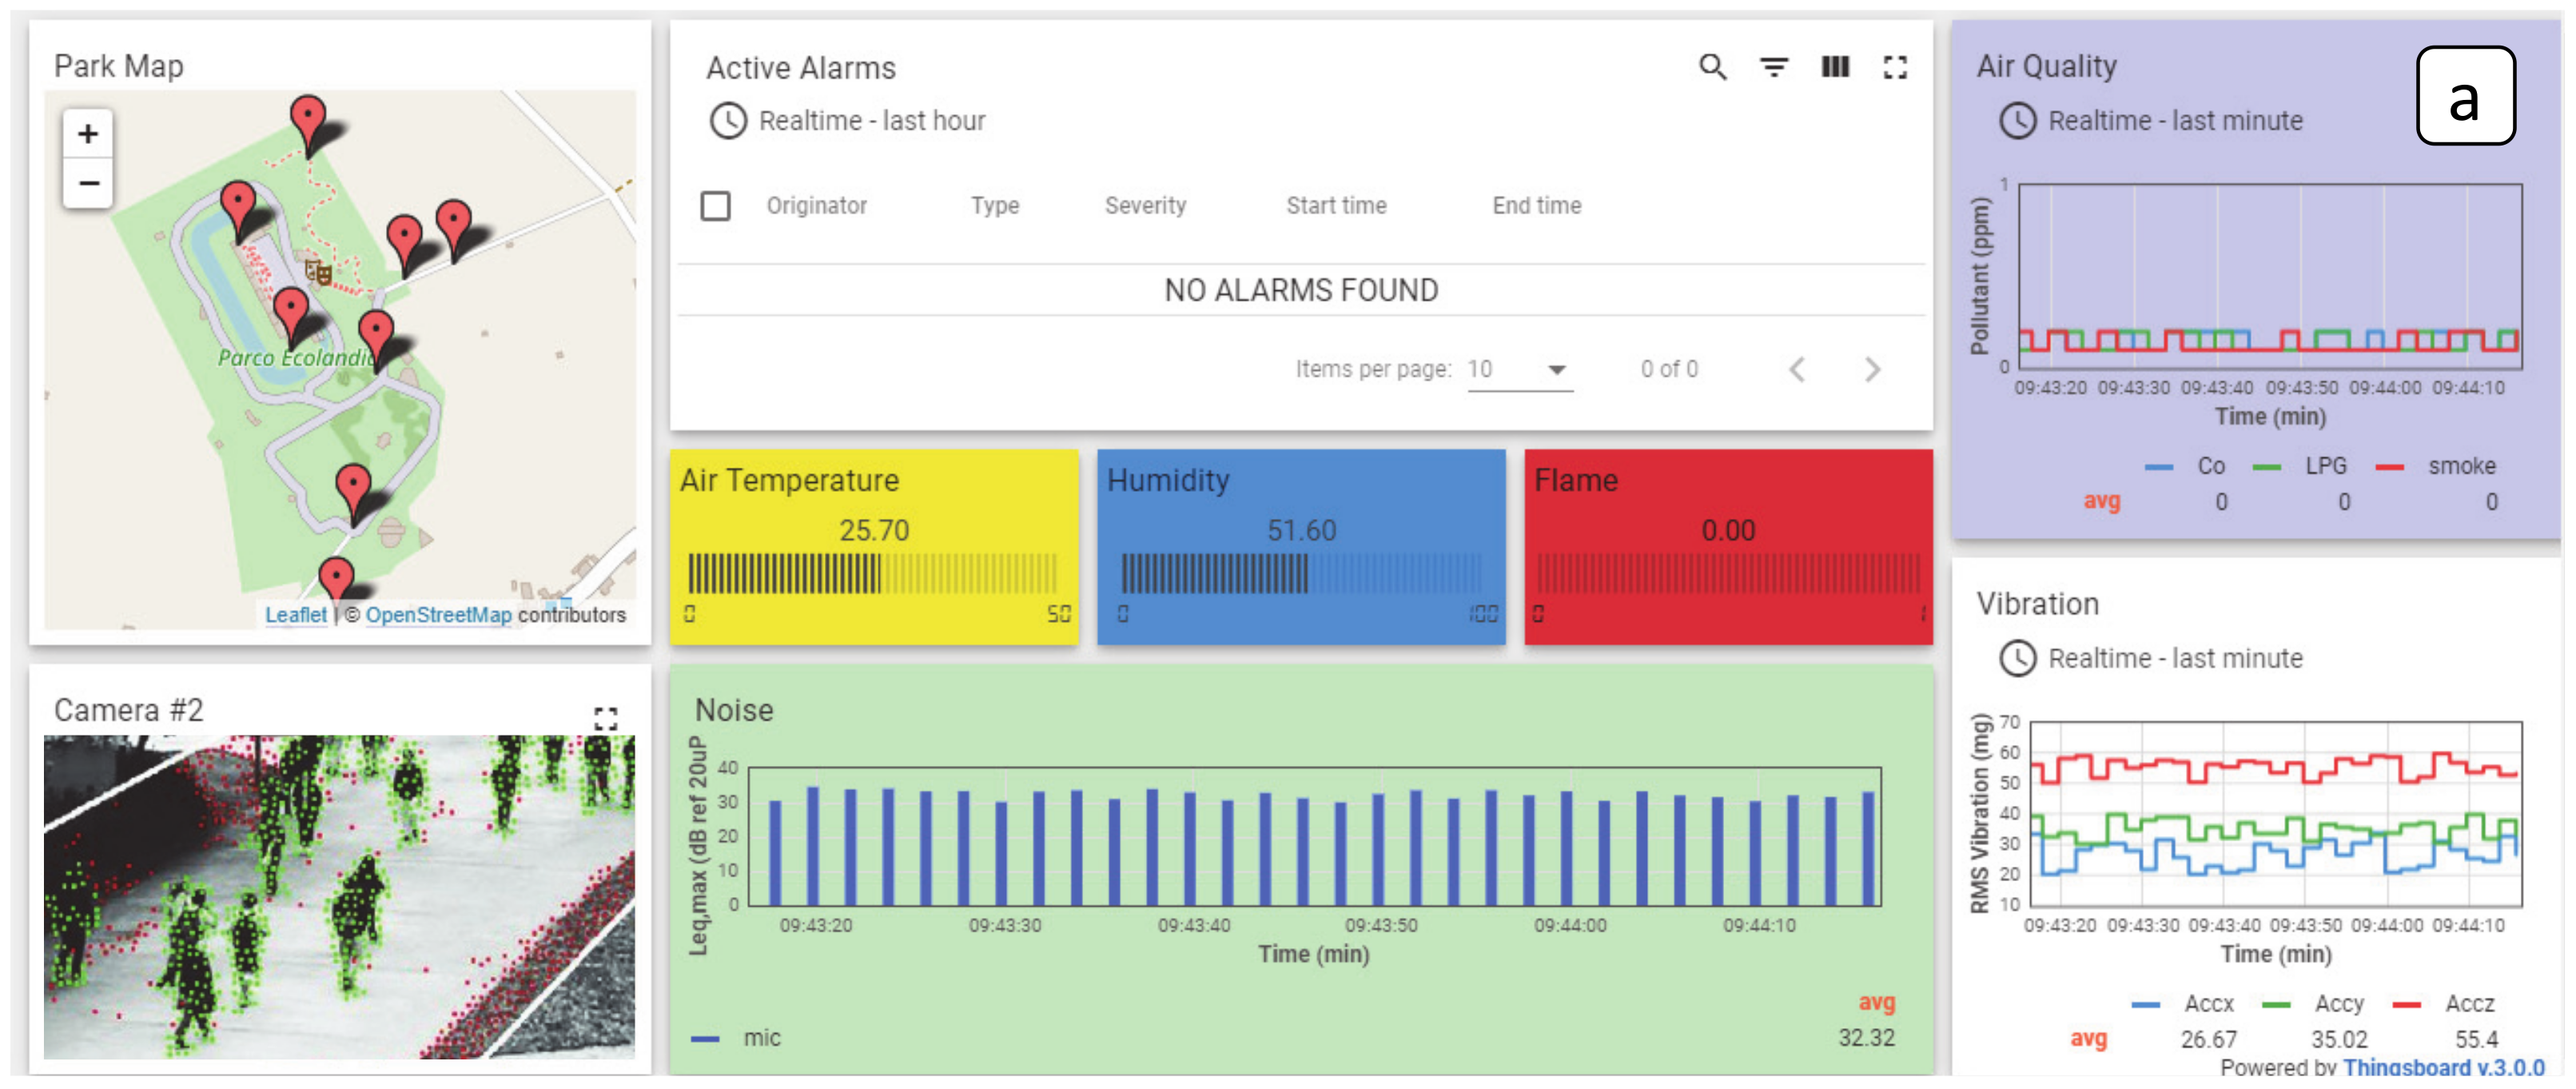
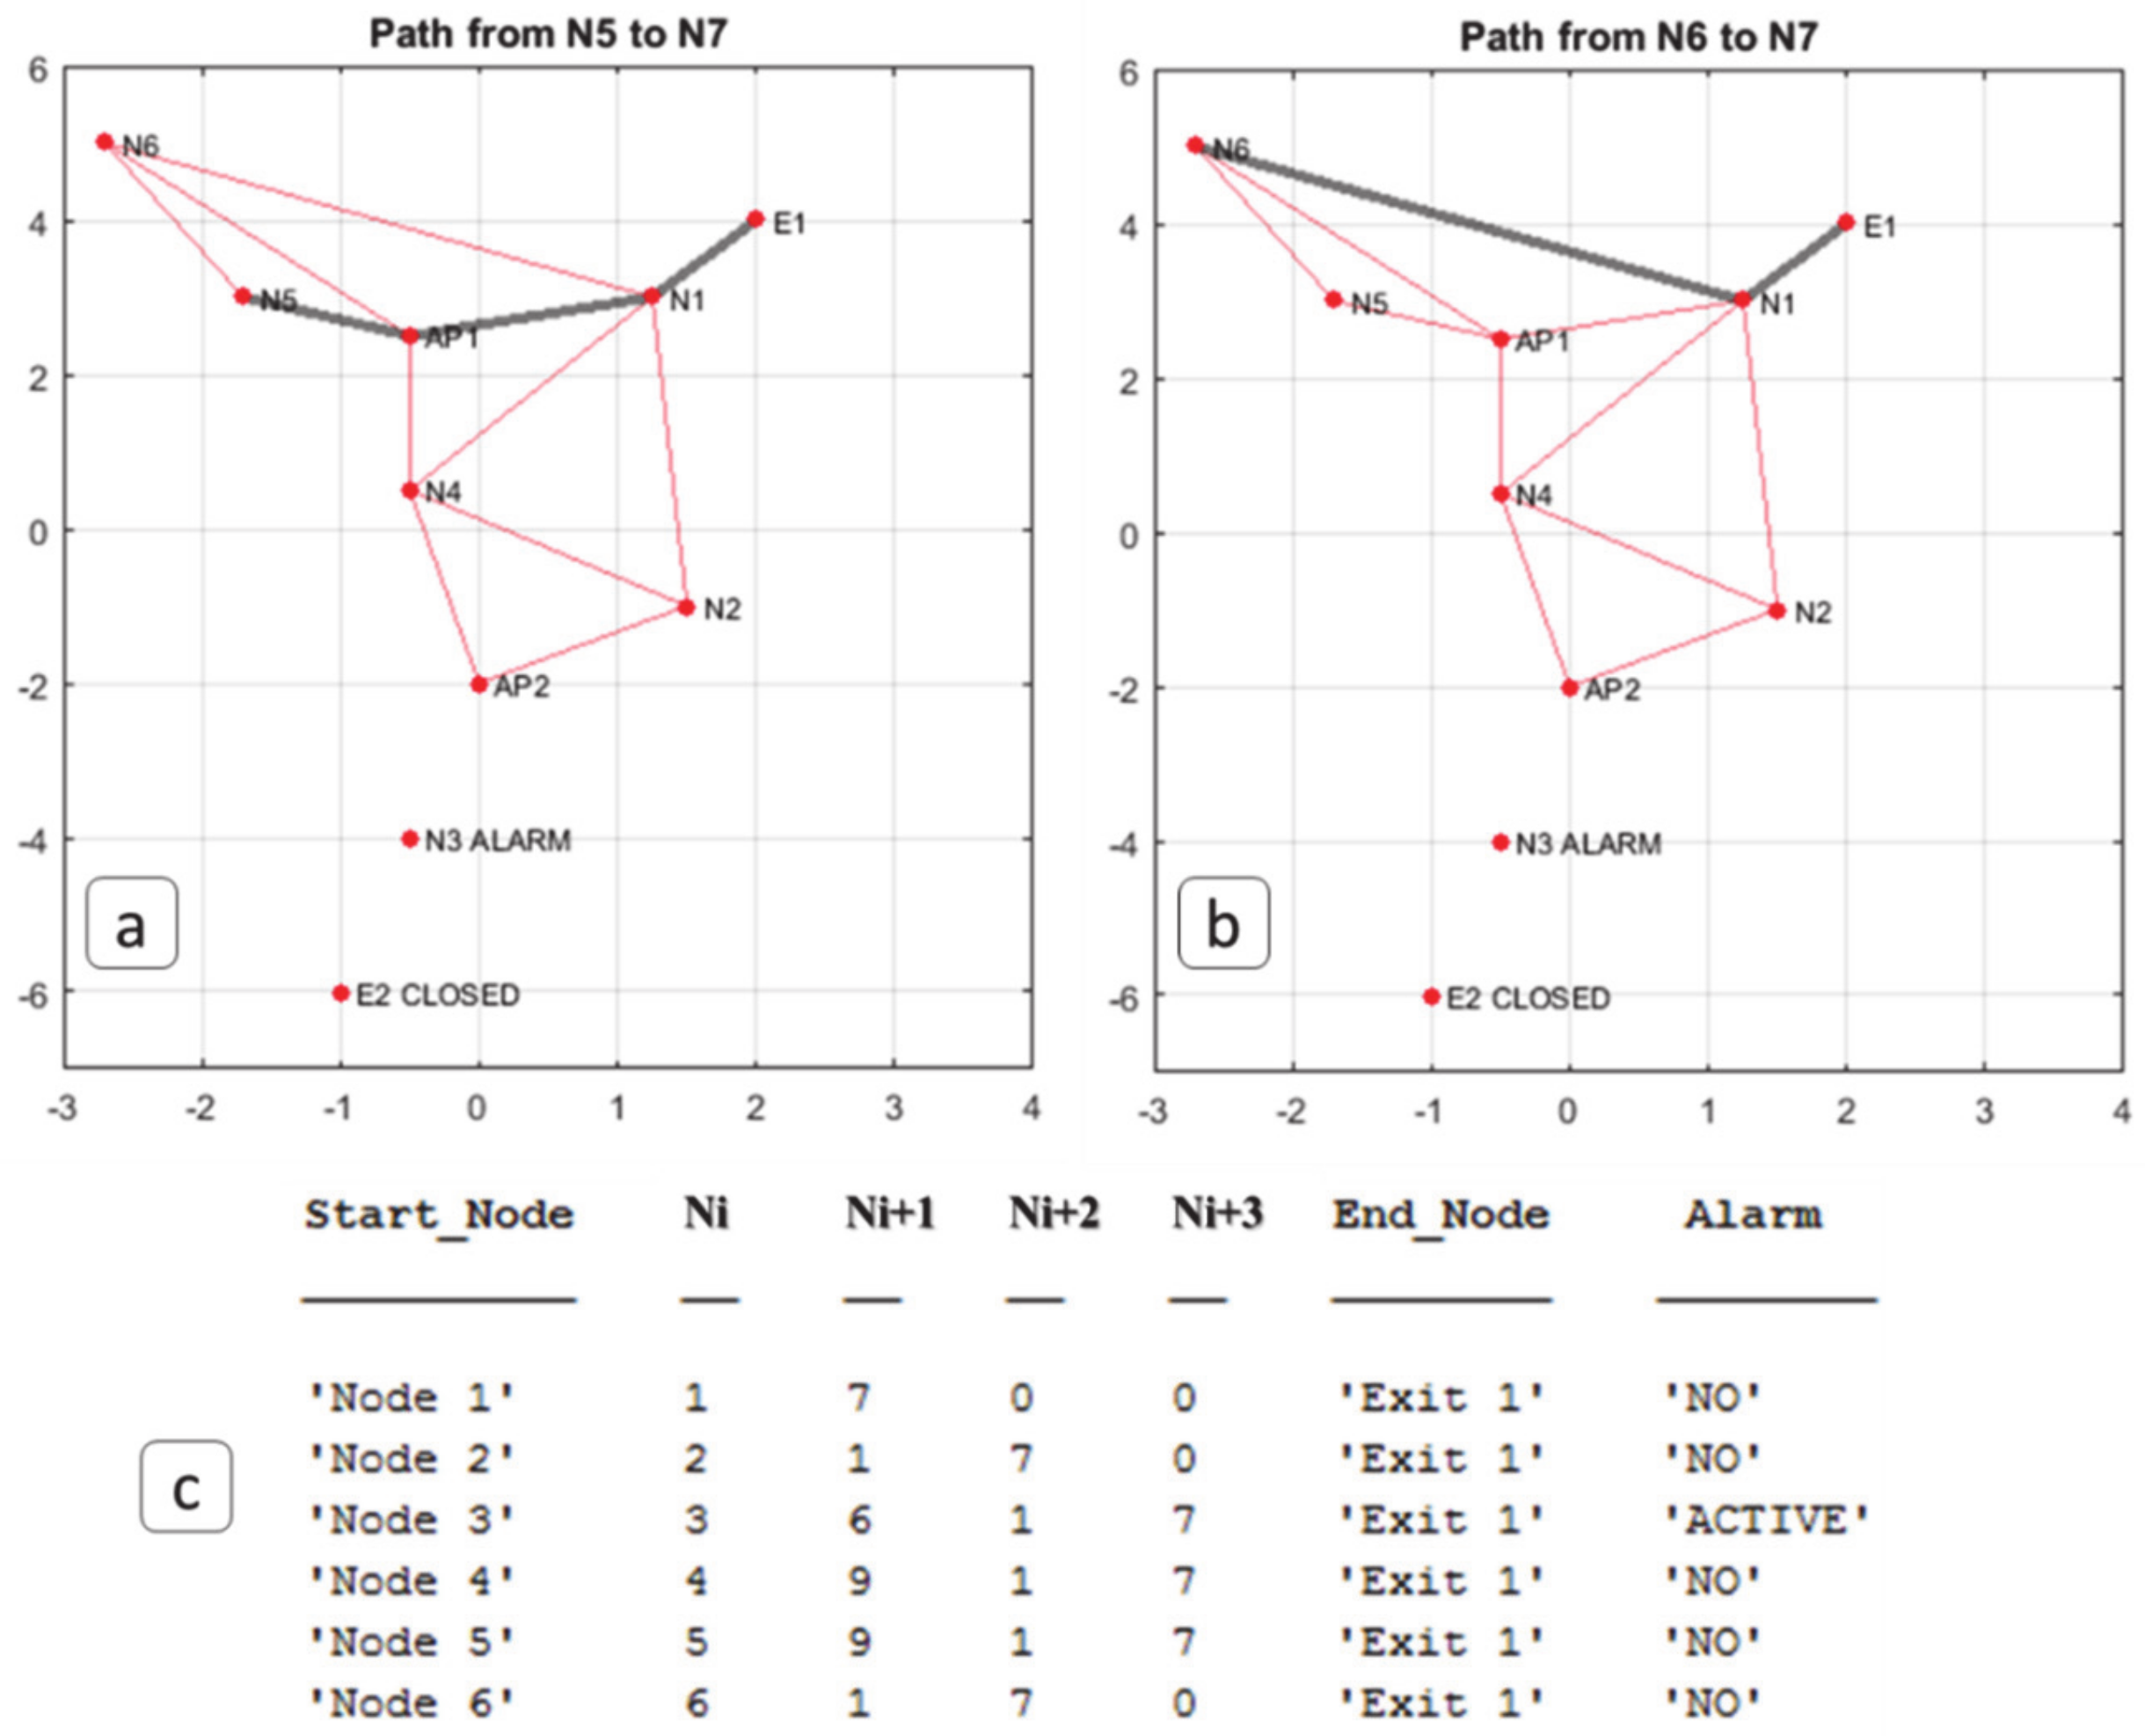
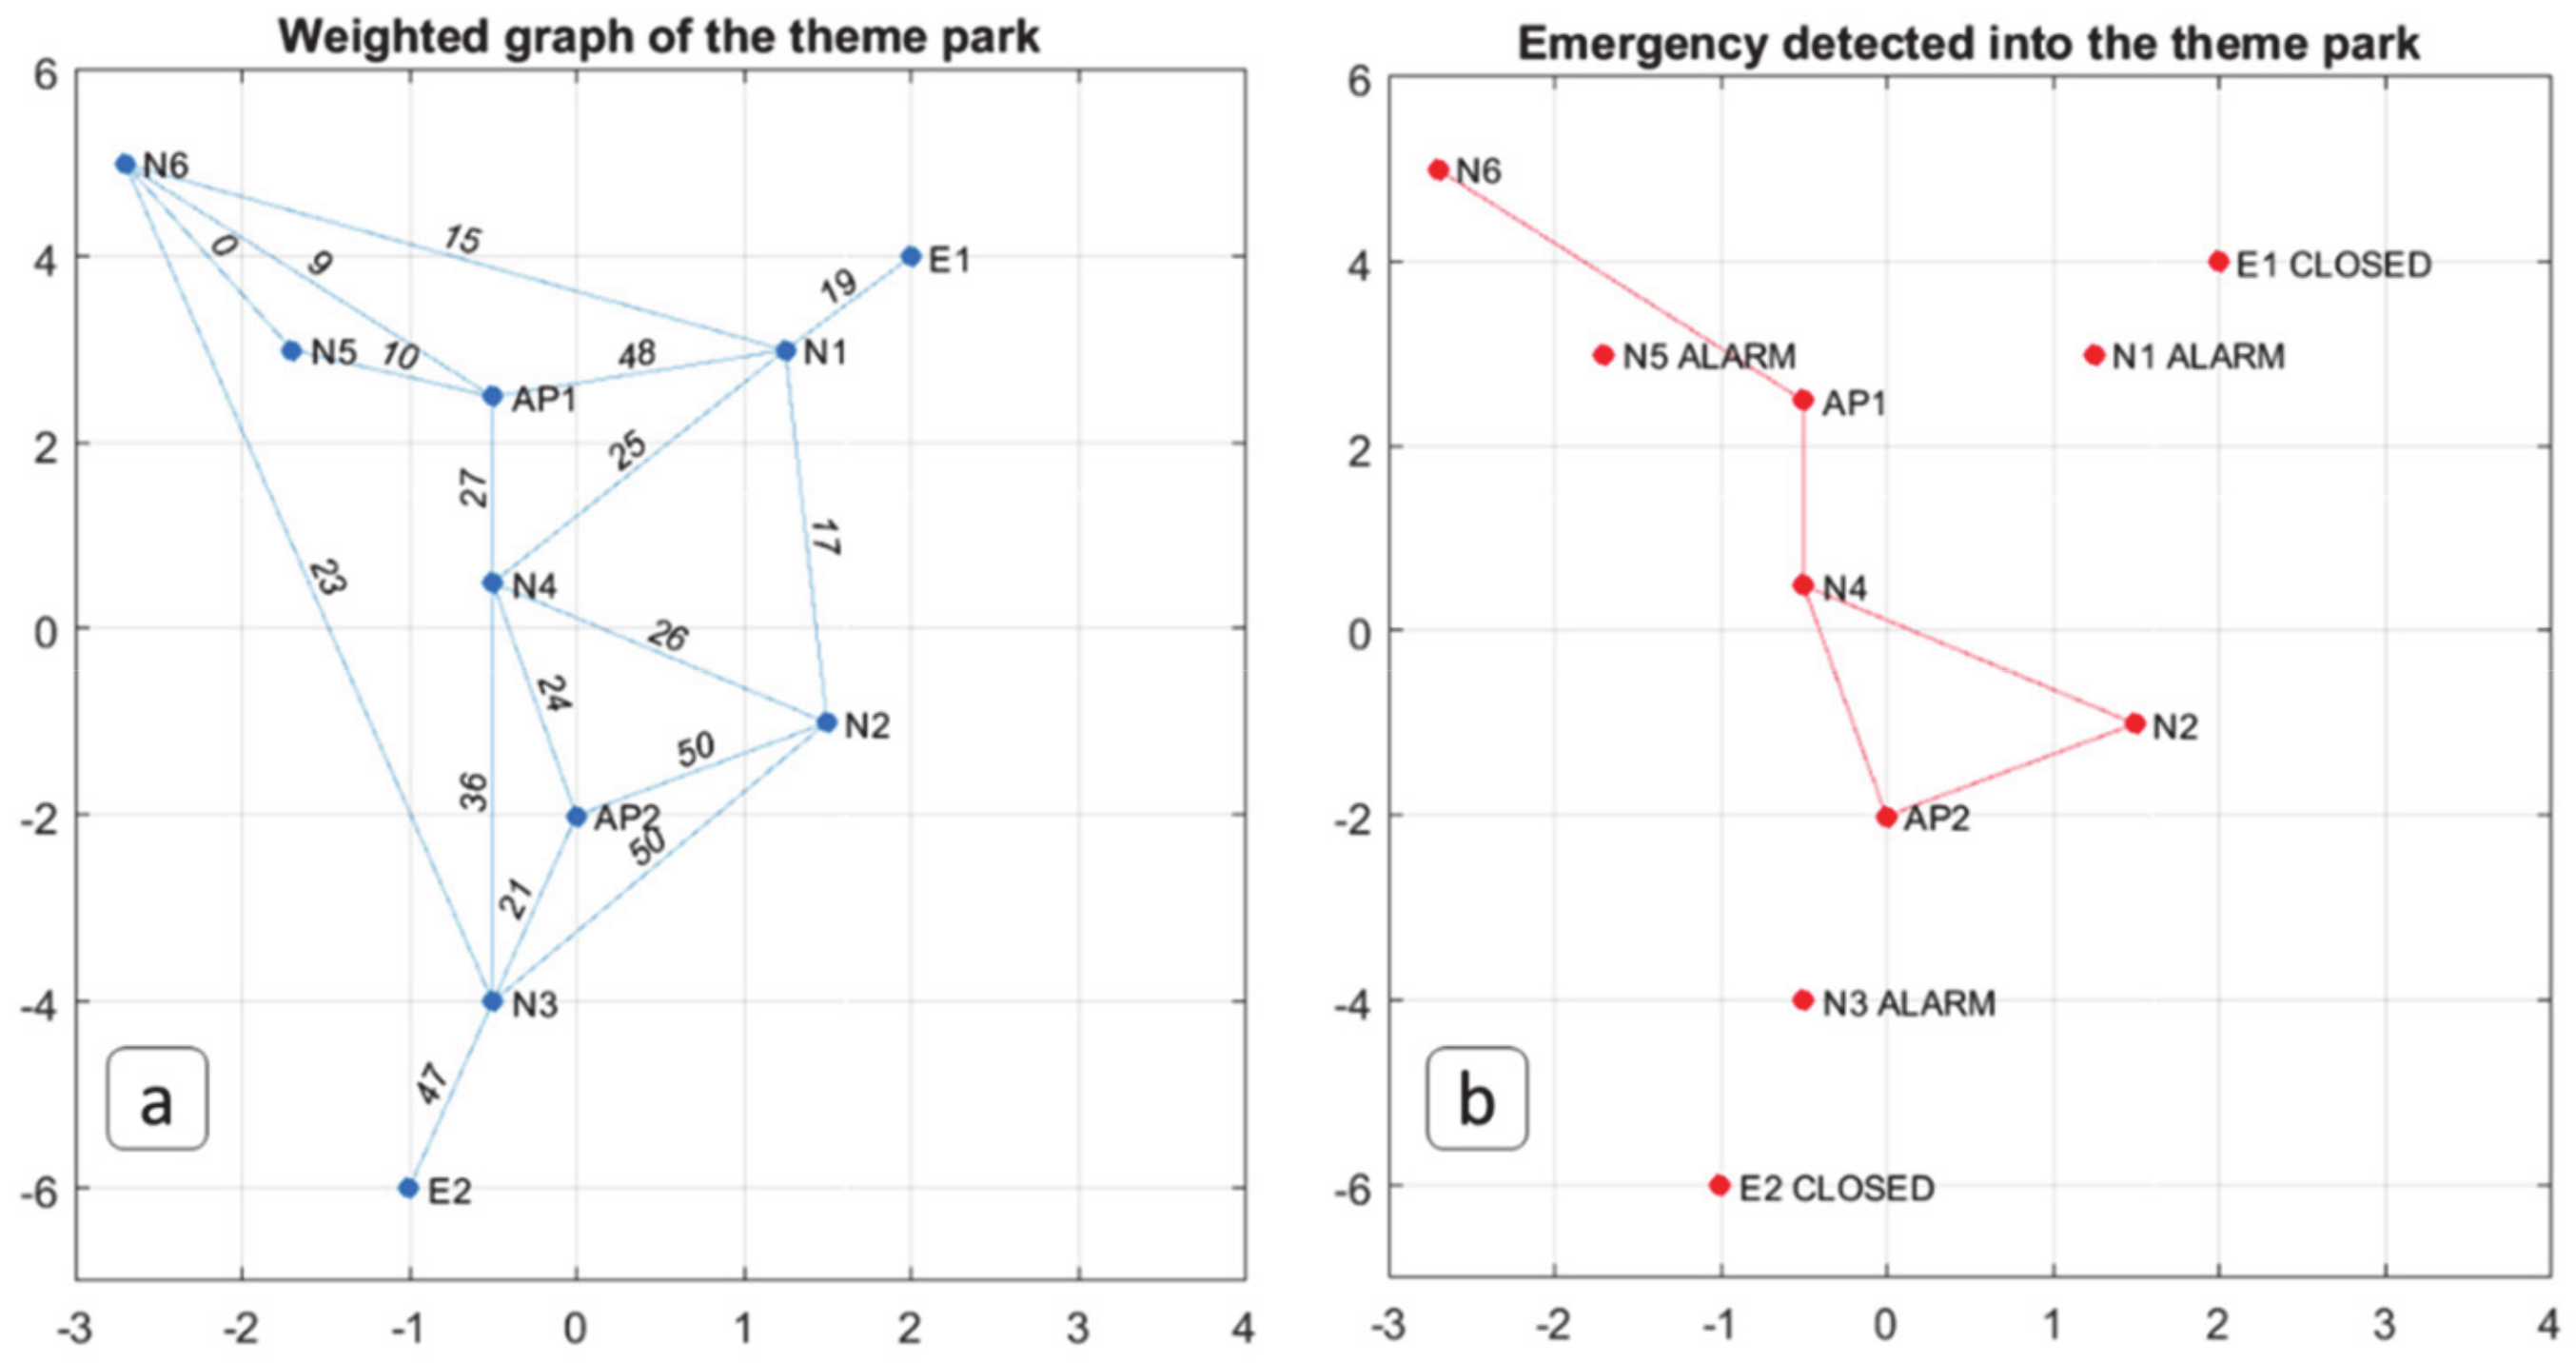
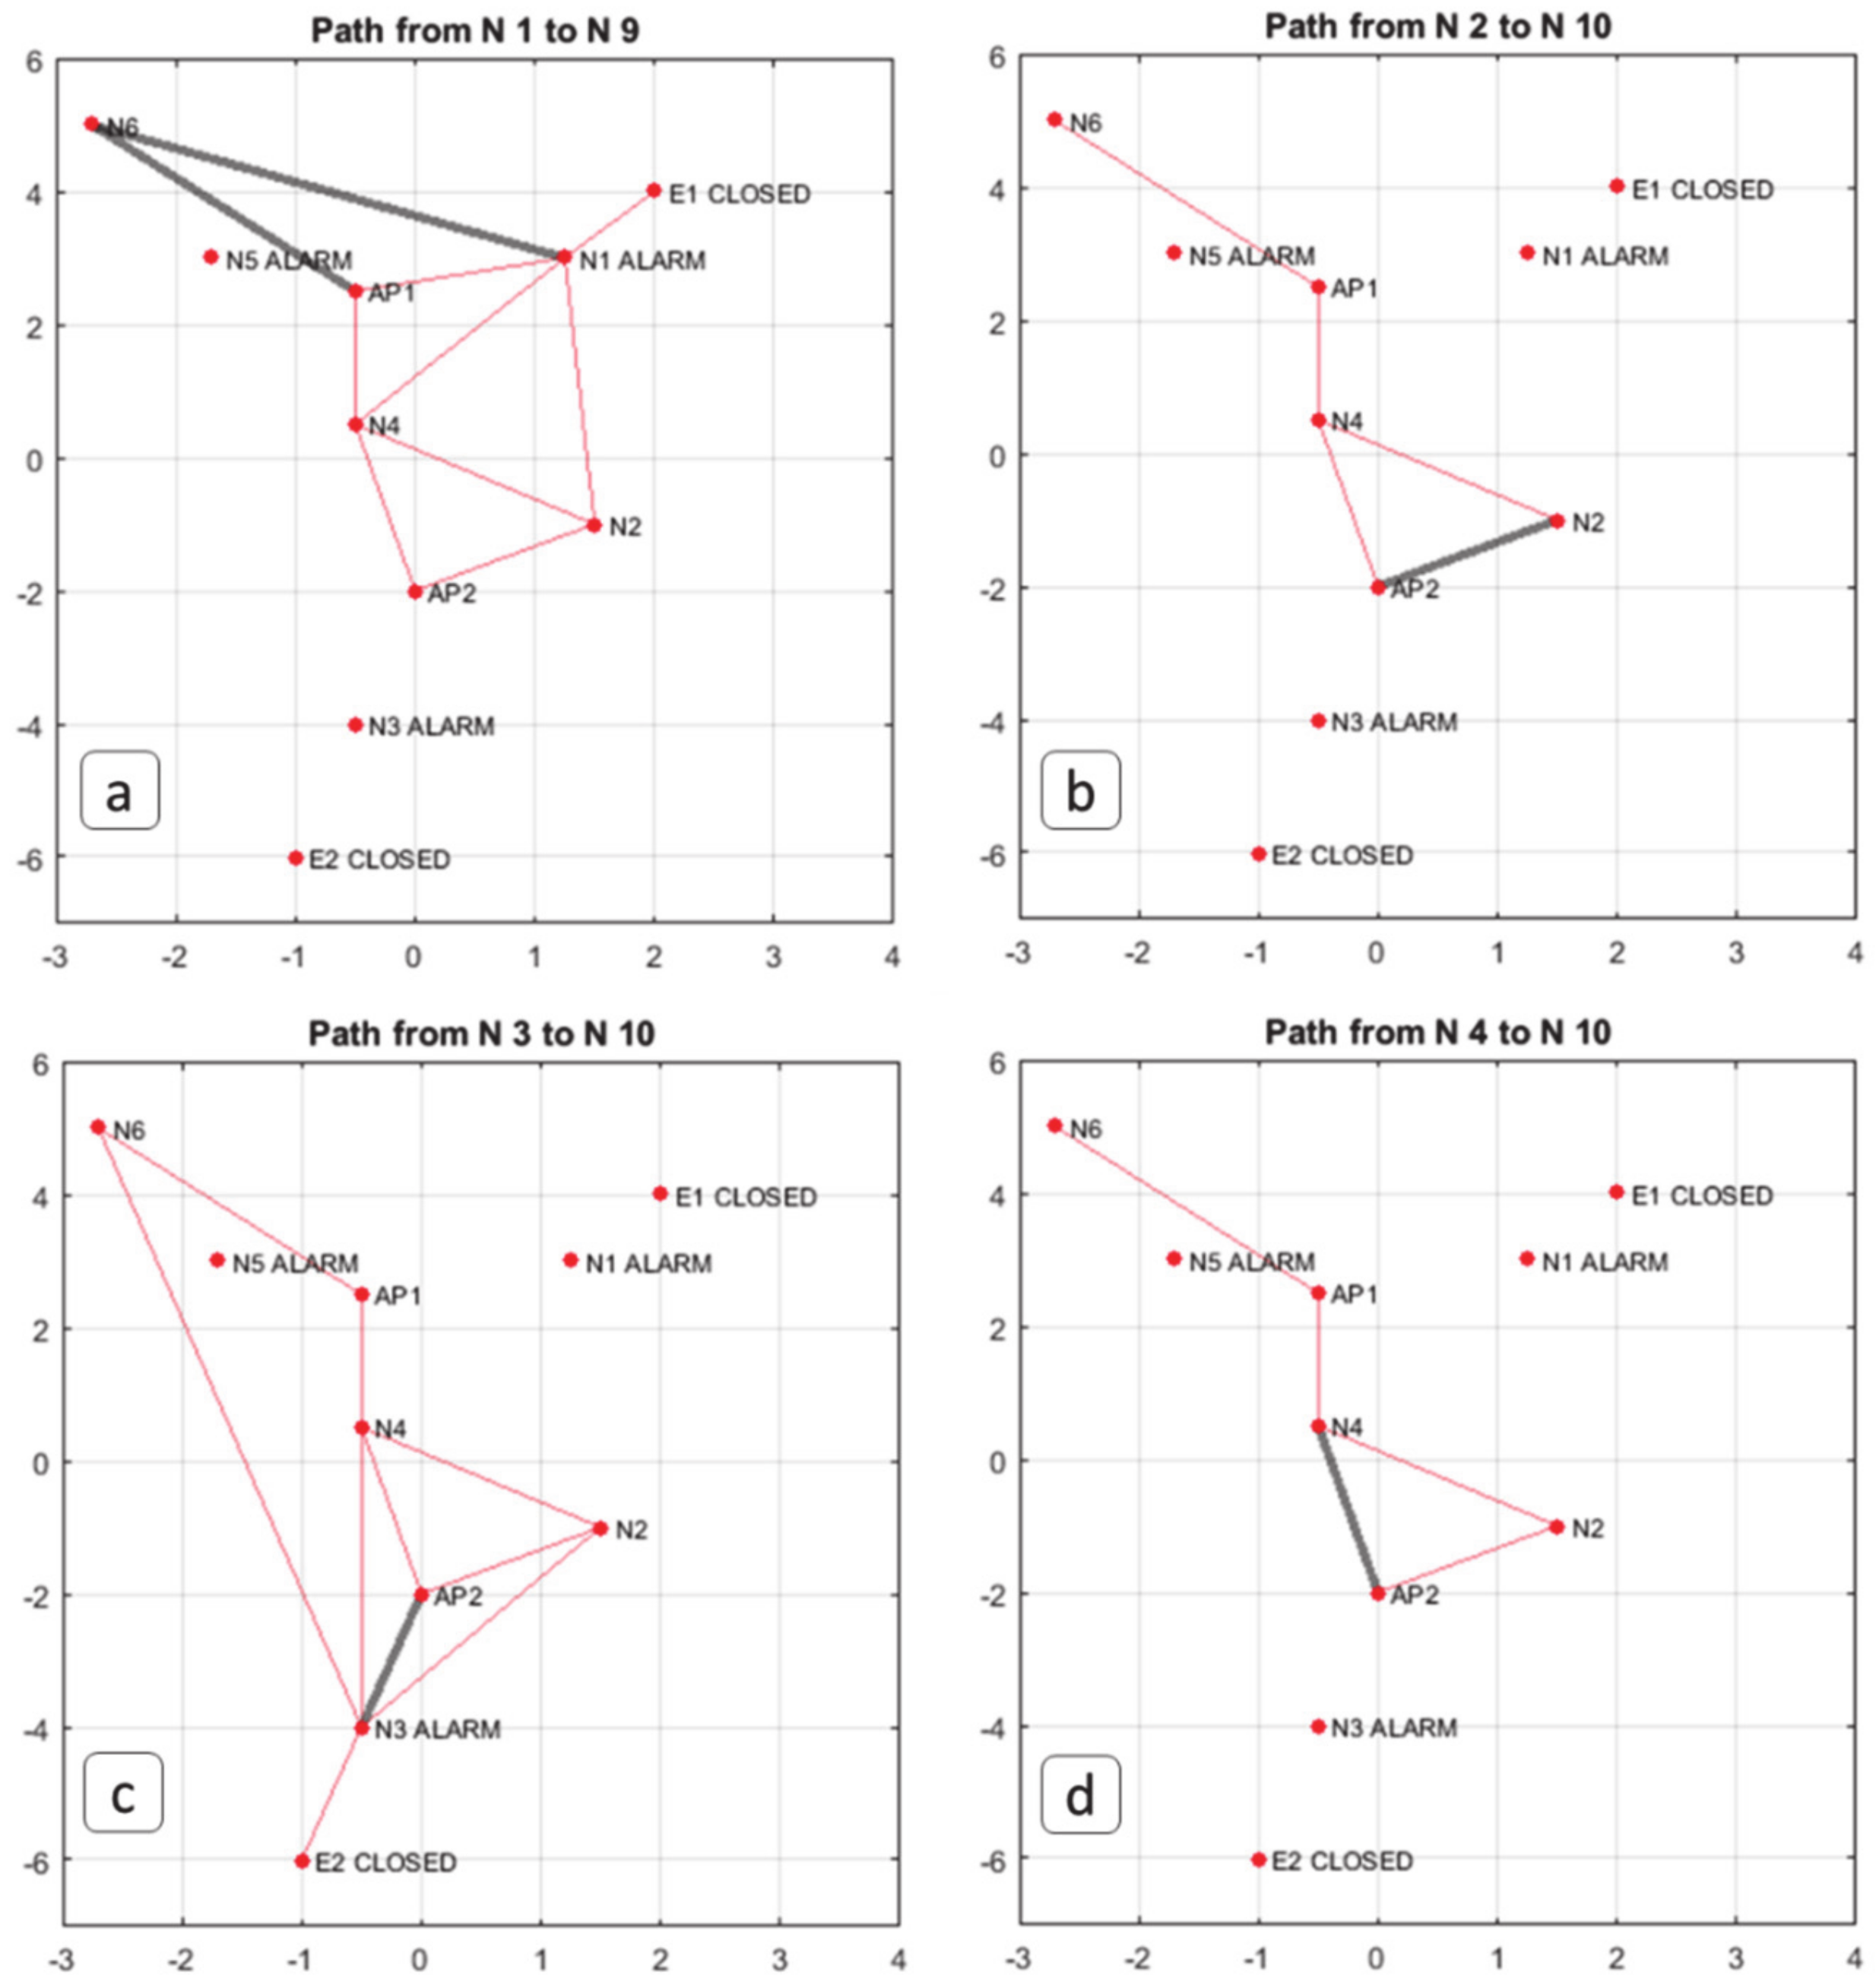
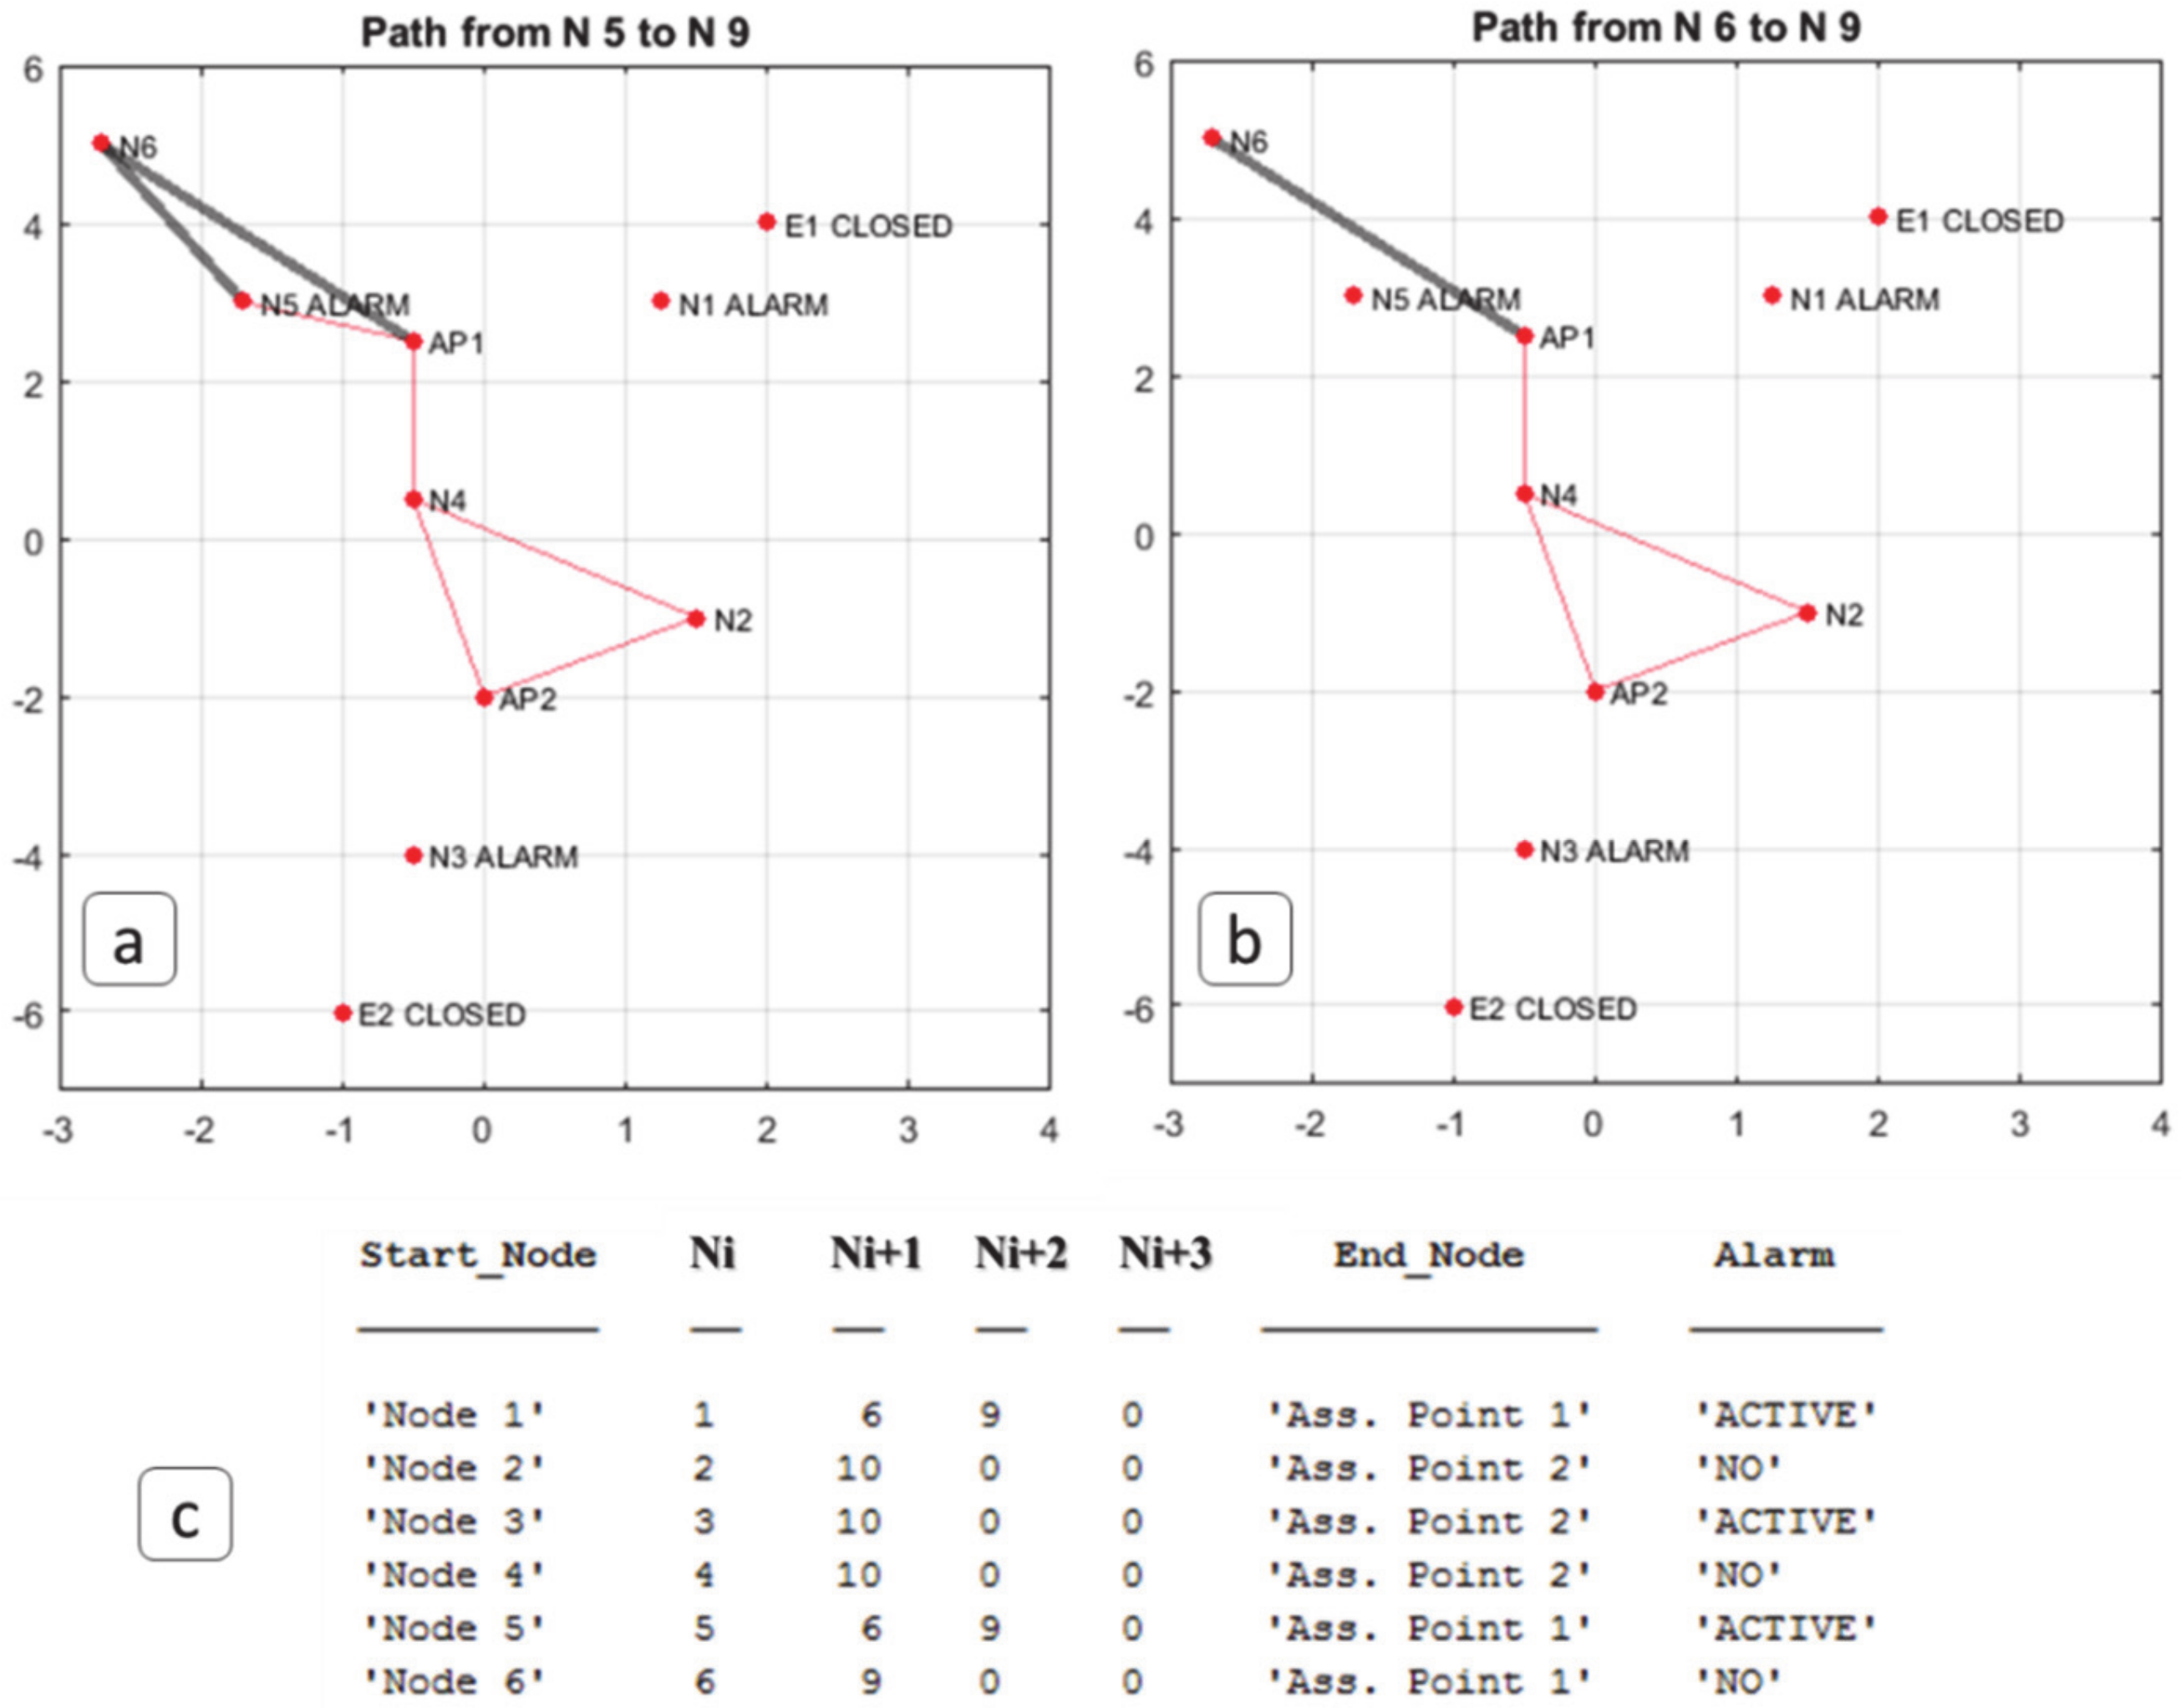
4. Results and Discussions
5. Conclusions
Author Contributions
Funding
Conflicts of Interest
References
- Bibri, S.E. The IoT for smart sustainable cities of the future: An analytical framework for sensor-based big data applications for environmental sustainability. Sustain. Cities Soc. 2018, 38, 230–253. [Google Scholar] [CrossRef]
- Fan, C.; Zhang, C.; Yahja, A.; Mostafavi, A. Disaster City Digital Twin: A vision for integrating artificial and human intelligence for disaster management. Int. J. Inf. Manag. 2019, (in press). [CrossRef]
- Sakurai, M.; Murayama, Y. Information technologies and disaster management – Benefits and issues. Prog. Disaster Sci. 2019, 2, 100012. [Google Scholar] [CrossRef]
- Bacco, M.; Delmastro, F.; Ferro, E.; Gotta, A. Environmental Monitoring for Smart Cities. IEEE Sens. J. 2017, 17, 7767–7774. [Google Scholar] [CrossRef]
- Government of South Australia COVID-19. Available online: https://www.health.gov.au/news/health-alerts/novel-coronavirus-2019-ncov-health-alert/how-to-protect-yourself-and-others-from-coronavirus-covid-19/limits-on-public-gatherings-for-coronavirus-covid-19 (accessed on 14 April 2020).
- Caley, P.; Philp, D.J.; McCracken, K. Quantifying social distancing arising from pandemic influenza. J. R. Soc. Interface 2008, 5, 631–639. [Google Scholar] [CrossRef][Green Version]
- Stein, R.A. COVID-19 and rationally layered social distancing. Int. J. Clin. Pract. 2020, 74, e13501. [Google Scholar] [CrossRef]
- Merenda, M.; Porcaro, C.; Iero, D. Edge machine learning for ai-enabled iot devices: A review. Sensors 2020, 20, 2533. [Google Scholar] [CrossRef]
- Nakas, C.; Kandris, D.; Visvardis, G. Energy efficient routing in wireless sensor networks: A comprehensive survey. Algorithms 2020, 13, 72. [Google Scholar] [CrossRef]
- Jin, Z.; Jian-Ping, Y.; Si-Wang, Z.; Ya-Ping, L.; Guang, L. A survey on position-based routing algorithms in wireless sensor networks. Algorithms 2009, 2, 158–182. [Google Scholar] [CrossRef]
- Hedar, A.R.; Abdulaziz, S.N.; Sewisy, A.A.; El-Sayed, G.A. Adaptive scatter search to solve the minimum connected dominating set problem for efficient management of wireless networks. Algorithms 2020, 13, 35. [Google Scholar] [CrossRef]
- Meghanathan, N. A, Benchmarking algorithm to determine minimum aggregation delay for data gathering trees and an analysis of the diameter-aggregation delay tradeoff. Algorithms 2015, 8, 435–458. [Google Scholar] [CrossRef]
- El Khamlichi, Y.; Tahiri, A.; Abtoy, A.; Medina-Bulo, I.; Palomo-Lozano, F.A. Hybrid algorithm for optimal wireless sensor network deployment with the minimum number of sensor nodes. Algorithms 2017, 10, 80. [Google Scholar] [CrossRef]
- Erd, M.; Schaeffer, F.; Kostic, M.; Reindl, L.M. Event monitoring in emergency scenarios using energy efficient wireless sensor nodes for the disaster information management. Int. J. Disaster Risk Reduct. 2016, 16, 33–42. [Google Scholar] [CrossRef]
- Rahman, M.U.; Rahman, S.; Mansoor, S.; Deep, V.; Aashkaar, M. Implementation of ICT and Wireless Sensor Networks for Earthquake Alert and Disaster Management in Earthquake Prone Areas. Proceedings of International Conference on Computational Modeling and Security, Bangalore, India, 11–13 February 2016; Volume 85, pp. 92–99. [Google Scholar]
- Erdelj, M.; Król, M.; Natalizio, E. Wireless Sensor Networks and Multi-UAV systems for natural disaster management. Comput. Netw. 2017, 124, 72–86. [Google Scholar] [CrossRef]
- Jain, B.; Brar, G.; Malhotra, J.; Rani, S. A novel approach for smart cities in convergence to wireless sensor networks. Sustain. Cities Soc. 2017, 35, 440–448. [Google Scholar] [CrossRef]
- Alam, S.; De, D. Bio-inspired smog sensing model for wireless sensor networks based on intracellular signalling. Inf. Fusion 2019, 49, 100–119. [Google Scholar] [CrossRef]
- Uma Priyadarsini, P.S.; Sriramya, P. Disaster management using evidence-based interactive trust management system for wireless sensor networks by Internet of Things. Comput. Electr. Eng. 2019, 75, 164–174. [Google Scholar] [CrossRef]
- Deak, G.; Curran, K.; Condell, J.; Asimakopoulou, E.; Bessis, N. IoTs (Internet of Things) and DfPL (Device-free Passive Localisation) in a disaster management scenario. Simul. Model. Pract. Theory 2013, 35, 86–96. [Google Scholar] [CrossRef]
- Cui, F. Deployment and integration of smart sensors with IoT devices detecting fire disasters in huge forest environment. Comput. Commun. 2020, 150, 818–827. [Google Scholar] [CrossRef]
- Pillai, A.S.; Chandraprasad, G.S.; Khwaja, A.S.; Anpalagan, A. A service oriented IoT architecture for disaster preparedness and forecasting system. IoT 2019, 100076. (in press). [CrossRef]
- Tao, Z. Advanced Wavelet Sampling Algorithm for IoT based environmental monitoring and management. Comput. Commun. 2020, 150, 547–555. [Google Scholar] [CrossRef]
- Rathore, M.M.; Paul, A.; Hong, W.H.; Seo, H.C.; Awan, I.; Saeed, S. Exploiting IoT and big data analytics: Defining Smart Digital City using real-time urban data. Sustain. Cities Soc. 2018, 40, 600–610. [Google Scholar] [CrossRef]
- Chen, W.; He, B.; Zhang, L.; Nover, D. Developing an integrated 2D and 3D WebGIS-based platform for effective landslide hazard management. Int. J. Disaster Risk Reduct. 2016, 20, 26–38. [Google Scholar] [CrossRef]
- Aloi, G.; Briante, O.; Di Felice, M.; Ruggeri, G.; Savazzi, S. The SENSE-ME platform: Infrastructure-less smartphone connectivity and decentralized sensing for emergency management. Pervasive Mob. Comput. 2017, 42, 187–208. [Google Scholar] [CrossRef]
- Qiu, L.; Du, Z.; Zhu, Q.; Fan, Y. An integrated flood management system based on linking environmental models and disaster-related data. Environ. Model. Softw. 2017, 91, 111–126. [Google Scholar] [CrossRef]
- Damalas, A.; Mettas, C.; Evagorou, E.; Giannecchini, S.; Iasio, C.; Papadopoulos, M.; Konstantinou, A.; Hadjimitsis, D. Development and Implementation of a DECATASTROPHIZE platform and tool for the management of disasters or multiple hazards. Int. J. Disaster Risk Reduct. 2018, 31, 589–601. [Google Scholar] [CrossRef]
- Pérez-González, C.J.; Colebrook, M.; Roda-García, J.L.; Rosa-Remedios, C.B. Developing a data analytics platform to support decision making in emergency and security management. Expert Syst. Appl. 2019, 120, 167–184. [Google Scholar] [CrossRef]
- Ma, G.; Wu, Z. BIM-based building fire emergency management: Combining building users’ behavior decisions. Autom. Constr. 2020, 109, 102975. [Google Scholar] [CrossRef]
- Franke, T.; Lukowicz, P.; Blanke, U. Smart crowds in smart cities: Real life, city scale deployments of a smartphone based participatory crowd management platform. J. Internet Serv. Appl. 2015, 6, 1–19. [Google Scholar] [CrossRef]
- Palmieri, F.; Ficco, M.; Pardi, S.; Castiglione, A. A cloud-based architecture for emergency management and first responders localization in smart city environments. Comput. Electr. Eng. 2016, 56, 810–830. [Google Scholar] [CrossRef]
- Alazawi, Z.; Alani, O.; Abdljabar, M.B.; Altowaijri, S.; Mehmood, R. A smart disaster management system for future cities. In Proceedings of the 2014 ACM International Workshop on Wireless and Mobile Technologies for Smart Cities, Co-Located with MobiHoc, Philadelphia, PA, USA, 11–14 August 2014; pp. 1–10. [Google Scholar]
- Astarita, V.; Festa, D.C.; Giofrè, V.P.; Guido, G.; Stefano, G. Mobile for emergencies M4EM: A cooperative software tool for emergency management operations. Procedia Comput. Sci. 2018, 134, 433–438. [Google Scholar] [CrossRef]
- He, Y.; Zhang, D.; Fang, Y. Development of a mobile post-disaster management system using free and open source technologies. Int. J. Disaster Risk Reduct. 2017, 25, 101–110. [Google Scholar] [CrossRef]
- Kaku, K. Satellite remote sensing for disaster management support: A holistic and staged approach based on case studies in Sentinel Asia. Int. J. Disaster Risk Reduct. 2019, 33, 417–432. [Google Scholar] [CrossRef]
- Hiltz, S.R.; Hughes, A.L.; Imran, M.; Plotnick, L.; Power, R.; Turoff, M. Exploring the usefulness and feasibility of software requirements for social media use in emergency management. Int. J. Disaster Risk Reduct. 2020, 42, 101367. [Google Scholar] [CrossRef]
- Loureiro, A.L.D.; Miguéis, V.L.; da Silva, L.F.M. Exploring the use of deep neural networks for sales forecasting in fashion retail. Decis. Support Syst. 2018, 114, 81–93. [Google Scholar] [CrossRef]
- Kor, A.L.; Yanovsky, M.; Pattinson, C.; Kharchenko, V. SMART-ITEM: IoT-enabled smart living. In Proceedings of the FTC 2016—Proceedings of Future Technologies Conference, San Francisco, CA, USA, 6–7 December 2016; pp. 739–749. [Google Scholar]
- Zhang, S.; Yao, L.; Sun, A.; Tay, Y. Deep learning based recommender system: A survey and new perspectives. ACM Comput. Surv. 2019, 52, 5. [Google Scholar] [CrossRef]
- Kunaver, M.; Požrl, T. Diversity in recommender systems—A survey. Knowl. Based. Syst. 2017, 123, 154–162. [Google Scholar] [CrossRef]
- Di Martino, S.; Rossi, S. An Architecture for a Mobility Recommender System in Smart Cities. Procedia Comput. Sci. 2016, 58, 425–430. [Google Scholar] [CrossRef]
- Lujak, M.; Billhardt, H.; Dunkel, J.; Fernández, A.; Hermoso, R.; Ossowski, S. A distributed architecture for real-time evacuation guidance in large smart buildings. Comput Sci. Inf. Syst. 2017, 14, 257–282. [Google Scholar] [CrossRef]
- Saleem, Y.; Crespi, N.; Rehmani, M.H.; Copeland, R.; Hussein, D.; Bertin, E. Exploitation of social IoT for recommendation services. In Proceedings of the 2016 IEEE 3rd World Forum on Internet of Things, WF-IoT, Reston, VA, USA, 12–14 December 2016; pp. 359–364. [Google Scholar]
- Vijayalakshmir, D.; Kalaivani, R. Minimum Cost Spanning Tree using Matrix Algorithm. Int. J. Sci. Res. Publ. 2014, 4, 1–5. [Google Scholar]
- Goyal, A.; Mogha, P.; Luthra, R.; Sangwan, N. Path finding: A* or Dijkstra’s? . Int. J. IT Eng. 2013, 2, 1–15. [Google Scholar]
- Khuller, S.; Raghavachari, B. Graph and Network Algorithms. Available online: https://it.mathworks.com/help/matlab/graph-and-network-algorithms.html?s_tid=CRUX_lftnav (accessed on 20 September 2020).
- NFC Forum NFC Technology. Available online: https://nfc-forum.org/what-is-nfc/ (accessed on 20 September 2020).
- Freire, S. Modeling of spatiotemporal distribution of urban population at high resolution—Value for risk assessment and emergency management. In Lecture Notes in Geoinformation and Cartography; Springer: Berlin, Germany, 2010; pp. 53–67. [Google Scholar]
- Chan, A.B.; Liang, Z.S.J.; Vasconcelos, N. Privacy preserving crowd monitoring: Counting people without people models or tracking. In Proceedings of the 26th IEEE Conference on Computer Vision and Pattern Recognition, CVPR, Anchorage, AK, USA, 23–28 June 2008. [Google Scholar]
- Bacanin, N.; Bezdan, T.; Tuba, E.; Strumberger, I.; Tuba, M. Optimizing convolutional neural network hyperparameters by enhanced swarm intelligence metaheuristics. Algorithms 2020, 13, 67. [Google Scholar] [CrossRef]
- Qu, H.; Wang, M.; Zhang, C.; Wei, Y. A study on faster R-CNN-based subway pedestrian detection with ACE enhancement. Algorithms 2018, 11, 192. [Google Scholar] [CrossRef]
- Solano, F.; Di Fazio, S.; Modica, G. A methodology based on GEOBIA and WorldView-3 imagery to derive vegetation indices at tree crown detail in olive orchards. Int. J. Appl. Earth Obs. Geoinf. 2019, 83, 101912. [Google Scholar] [CrossRef]
- Lanucara, S.; Praticò, S.; Modica, G. Harmonization and interoperable sharing of multi-temporal geospatial data of rural landscapes. Smart Innov. Syst. Technol. 2019, 100, 51–59. [Google Scholar]
- He, K.; Gkioxari, G.; Dollár, P.; Girshick, R. Mask R-CNN. IEEE Trans. Pattern Anal. Mach. Intell. 2020, 42, 386–397. [Google Scholar] [CrossRef]
- Zhang, S.H.; Li, R.; Dong, X.; Rosin, P.; Cai, Z.; Han, X.; Yang, D.; Huang, H.; Hu, S.M. Pose2Seg: Detection free human instance segmentation. In Proceedings of the IEEE Computer Society Conference on Computer Vision and Pattern Recognition, Long Beach, CA, USA, 16–20 June 2019; Volume 2019, pp. 889–898. [Google Scholar]
- Tan, M.; Pang, R.; Le, Q.V. EfficientDet: Scalable and Efficient Object Detection. In Proceedings of the IEEE Conference on Computer Vision and Pattern Recognition, Seattle, WA, USA, 16–18 June 2020; pp. 10778–10787. [Google Scholar]
- Bengio, Y.; Goodfellow, I.J.; Courville, A. Deep Learning: Chapter 9—Convolutional Networks; MIT Press: Cambridge, MA, USA, 2016. [Google Scholar]
- Lecun, Y.; Bengio, Y.; Hinton, G. Deep Learning. Nature 2015, 7553, 436–444. [Google Scholar] [CrossRef]
- Fedele, R.; Merenda, M.; Praticò, F.G.; Carotenuto, R.; Della Corte, F.G. Energy harvesting for IoT road monitoring systems. Instrum. Mes. Metrol. 2018, 17, 605–623. [Google Scholar] [CrossRef]
- Merenda, M.; Praticò, F.G.; Fedele, R.; Carotenuto, R.; Corte, F.G. Della A real-time decision platform for the management of structures and infrastructures. Electronics 2019, 8, 1180. [Google Scholar] [CrossRef]
- Merenda, M.; Iero, D.; Carotenuto, R.; Corte, F.G.D. Simple and low-cost photovoltaic module emulator. Electronics 2019, 8, 1445. [Google Scholar] [CrossRef]
- STMicroelectronics IoT board (Model: Kit Discovery B-L475E-IOT01A). Available online: https://www.mouser.it/Search/Refine?Ntk=P_MarCom&Ntt=160178092 (accessed on 20 September 2020).
- Fedele, R.; Praticò, F.G. Monitoring infrastructure asset through its acoustic signature. In Proceedings of the INTER-NOISE 2019 MADRID, Spain—48th International Congress and Exhibition on Noise Control Engineering, Madrid, Spain, 16–19 June 2019. [Google Scholar]
- Fedele, R.; Praticò, F.G.; Carotenuto, R.; Corte, F.G.D. Structural health monitoring of pavement assets through acoustic signature. In Proceedings of the 10th International Conference on the Bearing Capacity of Roads, Railways and Airfields, BCRRA, Athens, Greece, 28–30 June 2017; pp. 869–875. [Google Scholar]
- Praticò, F.G.; Fedele, R.; Naumov, V.; Sauer, T. Detection and monitoring of bottom-up cracks in road pavement using a machine-learning approach. Algorithms 2020, 13, 81. [Google Scholar] [CrossRef]
- Praticò, F.G.; Della Corte, F.G.; Merenda, M. Self-powered sensors for road pavements. In Proceedings of the 4th Chinese-European Workshop on Functional Pavement Design, CEW, Delft, The Netherlands, 29 June–1 July 2016; pp. 1365–1374. [Google Scholar]
- ThingsBoard. ThingsBoard IoT Open Source Plataform. Available online: https://thingsboard.io/ (accessed on 20 September 2020).
- Dalal, N.; Triggs, B. Histograms of oriented gradients for human detection. In Proceedings of the 2005 IEEE Computer Society Conference on Computer Vision and Pattern Recognition, CVPR, San Diego, CA, USA, 20–25 June 2005; pp. 886–893. [Google Scholar]
- Lukežič, A.; Vojíř, T.; Čehovin Zajc, L.; Matas, J.; Kristan, M. Discriminative Correlation Filter Tracker with Channel and Spatial Reliability. Int. J. Comput. Vis. 2018, 126, 671–688. [Google Scholar] [CrossRef]


| Reference | Main Characteristics | Limitations |
|---|---|---|
| [14] | WSN based on energy-efficient wireless sensor nodes equipped with an ultrasonic sensor, which were tested in a field experiment (explosion in a building) to confirm functionality and reliability in terms of collision-free data transmission during the emergency. | Buildings only; Ultrasonic sensor only; Explosion emergency only; Does not consider the overcrowding. |
| [15] | WSN based on the idea of monitoring the earthquake precursors (e.g., unusual movement of animals, ground water pressure, radon emission, etc.), which was designed for early earthquake warnings and disaster management. | Earthquake emergency only; Does not consider the overcrowding. |
| [16] | WSNs used together with Unmanned Aerial Vehicles (UAV) for monitoring, forecast, early warning, information fusion and sharing, logistics, evacuation, search and rescue mission, damage assessment. | Does not consider the overcrowding. |
| [17] | WSN paradigm for real-time applications in smart cities, which aims at balancing performance and energy consumption, and uses the Technique for Order of Preference by Similarity to Ideal Solution (TOPSIS) optimization technique to find the shortest data transmission path. | Paradigm; Does not consider the overcrowding. |
| [18] | WSN based on a method inspired by biological intracellular signaling, which was designed to perform smog pollution sensing, and taking into account the ad hoc demand routing protocol (AODV) and bellman-ford and interzone routing protocol (IERP) for data transmission. | Air pollution only; Does not consider the overcrowding. |
| [19] | IoT-WSN based on an evidence-based interactive trust management system for disaster management. | Medical emergency only; Communications between autonomous and adaptive nodes. |
| [20] | WSN that aims at detecting, in a disaster scenario, moving people without ‘tracking devices’ (i.e., carrying out the so-called Device free Passive Localization, DfPL). | Does not consider the emergency detection. |
| [21] | IoT-WSN based on smart fire sensors, cameras, and a Convolutional Neural Network (CNN), acting as a surveillance monitoring system for detecting disasters that occur in a remote area (e.g., a forest). | Remote area only; Does not use sensors for structural monitoring. |
| [22] | IoT-WSN based on machine learning algorithms that run in a cloud server and includes a modular redundancy fault tolerant scheme to obtain an accurate prediction from sensor data (gas and force sensors) managed by the ultra-low power MSP430 board and a Raspberry Pi, which was designed for early warning in an industry environment. | Gas and force sensors only; Industry environment only; Does not consider overcrowding. |
| [23] | IoT-WSN that uses the Advanced Adaptive Wavelet Sampling Algorithm (AAWSA) for prolonging the lifetime and power consumption of sensor nodes that include several sensors (i.e., moisture sensors, pressure sensor, rain gauge, tilt meters, and strain gauge), which was developed for disaster prediction in an urban region. | Does not consider overcrowding. |
| [24] | IoT-based architecture that collects real-time data from the city (from existing sensors at home, parking, vehicular networking, surveillance, weather and water monitoring system, etc.), implemented in the Hadoop ecosystem that allows the processing of Big Data, to obtain a “Smart Digital City”. | Architecture; Based on existing sensors. |
| Reference | Main Characteristics | Limitations |
|---|---|---|
| [25] | 2D and 3D WebGIS-based platform that has a scalable network architecture and uses a three-tier software architecture, which was designed for effective landslide multilevel management, and an emergency response. | Landslide emergency only; Does not consider overcrowding. |
| [26] | SENS-ME platform that aims at exploiting the functionalities of Commercial Off-The-Shelf (COTS) smartphones to carry out opportunistic networking, mobile sensing, and distributed information processing. | Does not consider emergency detection. Smartphones as sensors. |
| [27] | Flood disaster management system (FDMS) that carries out environmental model selection and disaster-related data binding. | Flood disaster only. |
| [28] | DECATASTROPHIZE (a.k.a., DECAT) platform that aims at managing disasters or multiple and/or simultaneous natural and man-made hazards by means of a Geospatial Early-warning Decision Support System (GE-DSS) that allows early warning, decision making, rapid mapping, impacts assessment and mitigation, and geospatial data/information dissemination. | Does not consider overcrowding. |
| [29] | A web platform developed by the Emergency and Security Coordinating Centre to improve the decision making process of the Canary Islands’ Authorities, which provides a geographical and temporal incident distribution and which is able to forecast and classify incidents. | Emergency and security incident distribution only. |
| [30] | A Building Information Modeling (BIM)-based platform that was designed for building fire emergency management in a dynamic way, i.e., using building users’ behavior decisions (e.g., escape, wait for rescue, and fire extinguishing) and both fire and users’ positions, which plans action routes and provides visual route guidance. | Buildings only; Fire emergency only; Does not consider overcrowding. |
| [31] | A smartphone-based platform for city-wide crowd management (through a “heat map-like” system for a real-time overview of the spatiotemporal distribution of crowds in given areas and through specific messaging for real-time, smart, adaptive emergency response and evacuation strategies), which aims at having smart crowds in smart cities and which was used in at least three European countries (UK, Netherlands, Switzerland). | Smartphones as sensors; Does not consider emergency detection. |
| [32] | A cloud-based architecture for emergency management and first-responders localization (landmark-based and landmark-free), which aims at supporting coordinated emergency management in smart cities based on the localization of first responders during crisis events. | Localization of first responders only. |
| [33] | Smart disaster management system for transportation applications in smart cities, which gathers information from multiple sources and locations (using VAENTS, i.e., Vehicular Ad hoc Networks, such as Vehicle-to-Vehicle, V2V, Vehicle-to-Infrastructure, V2I, or smartphones or other technologies), detects the point of incidence, makes strategies and decisions (using, e.g., high-performance computing, HPC), and propagates the information to vehicles and other nodes in real time. | Traffic incident only. |
| Scopes | Input | Output | Steps |
|---|---|---|---|
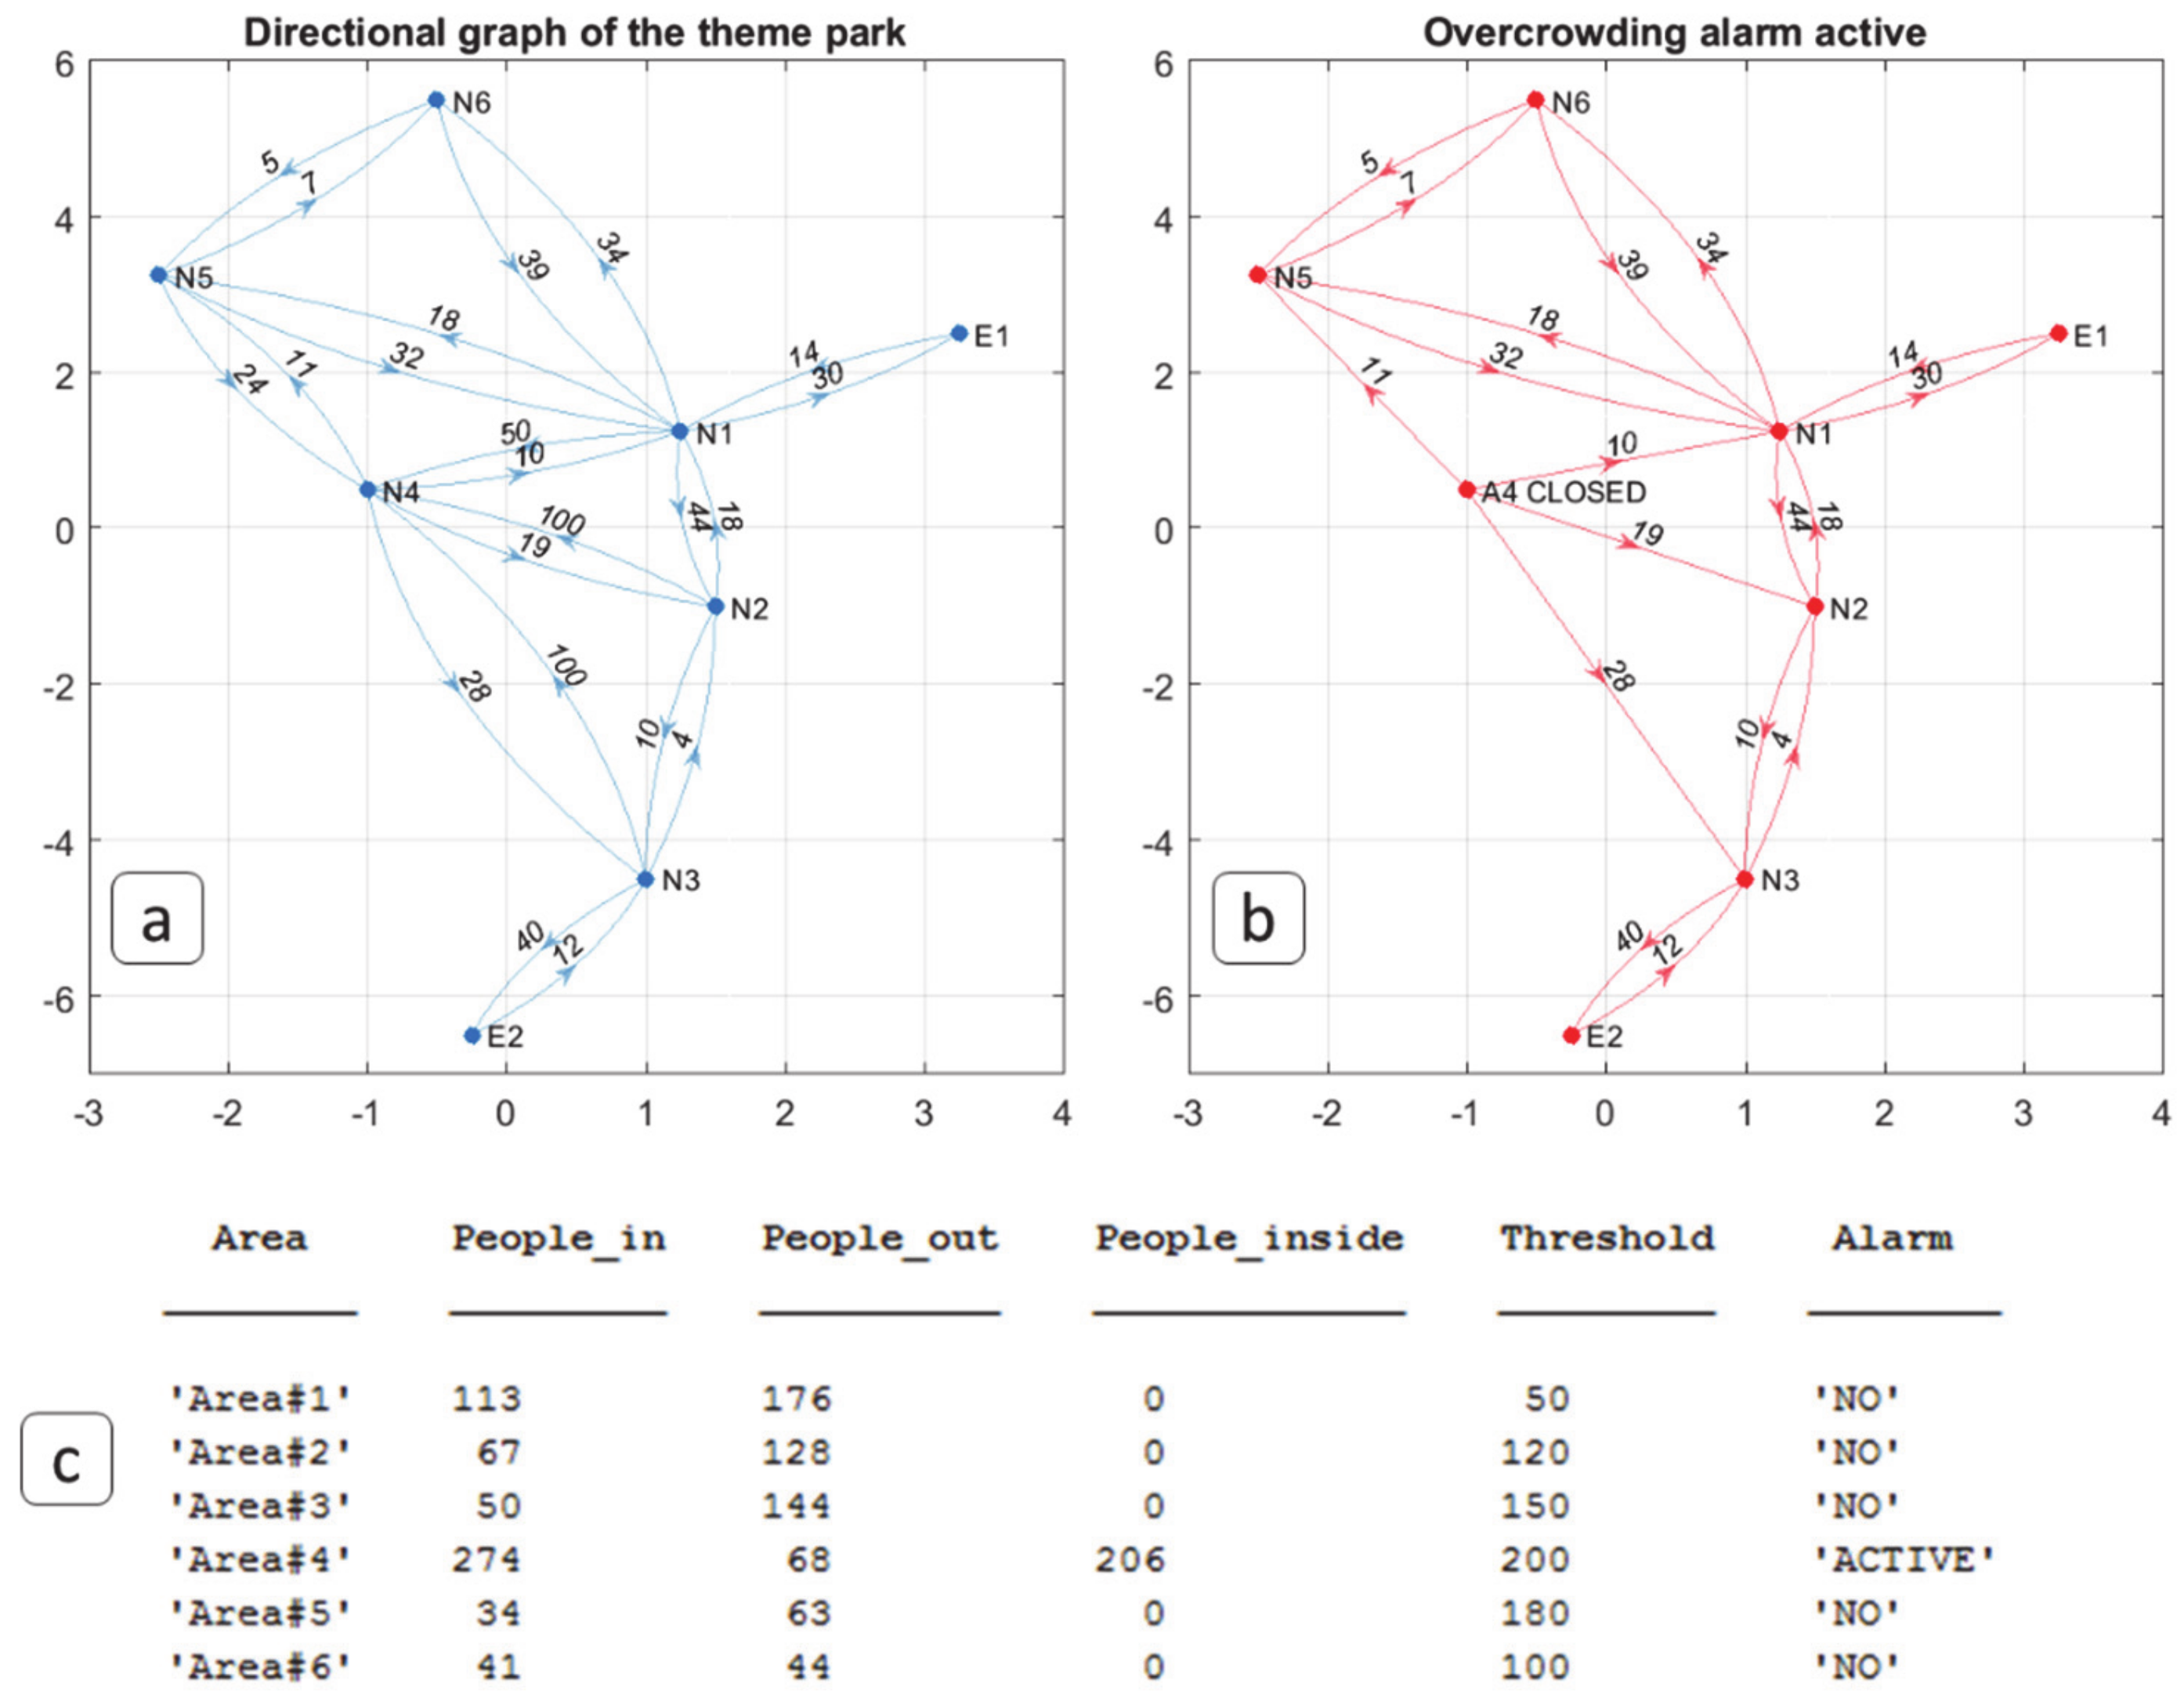
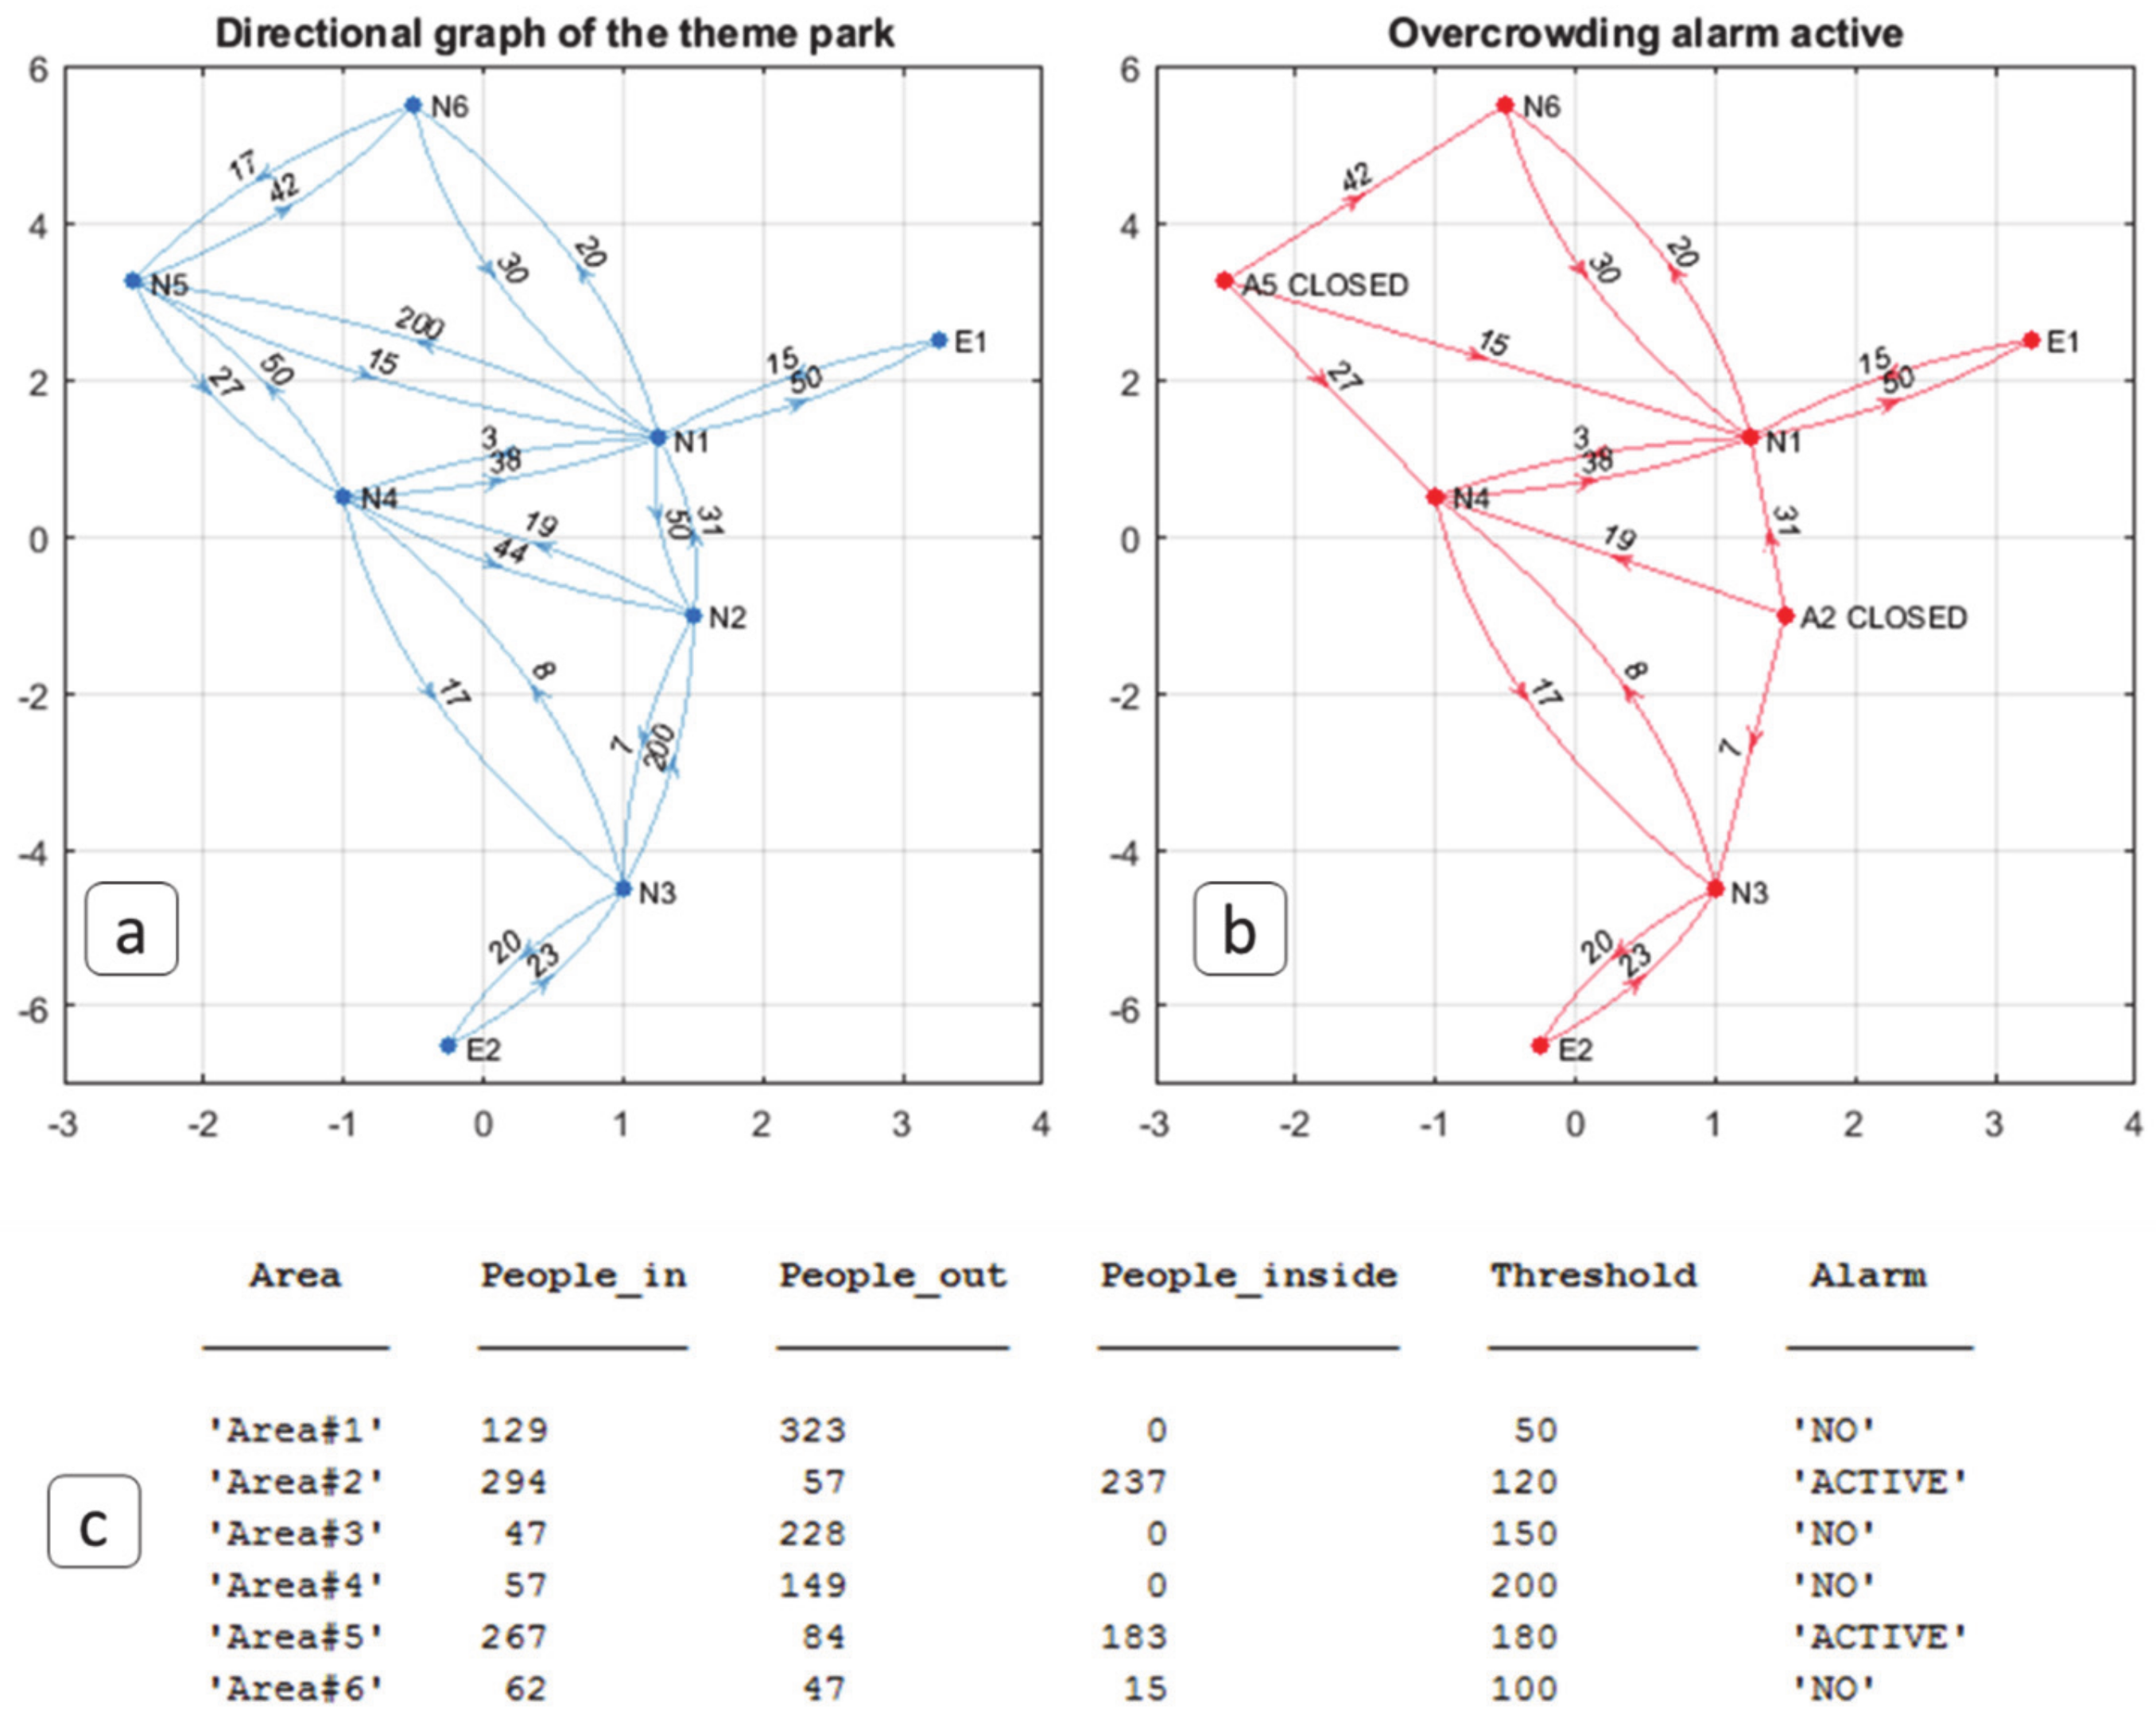
| Count the number of people entering and leaving a given area using data from cameras. |
|
|
|
| Scopes | Input | Output | Steps |
|---|---|---|---|
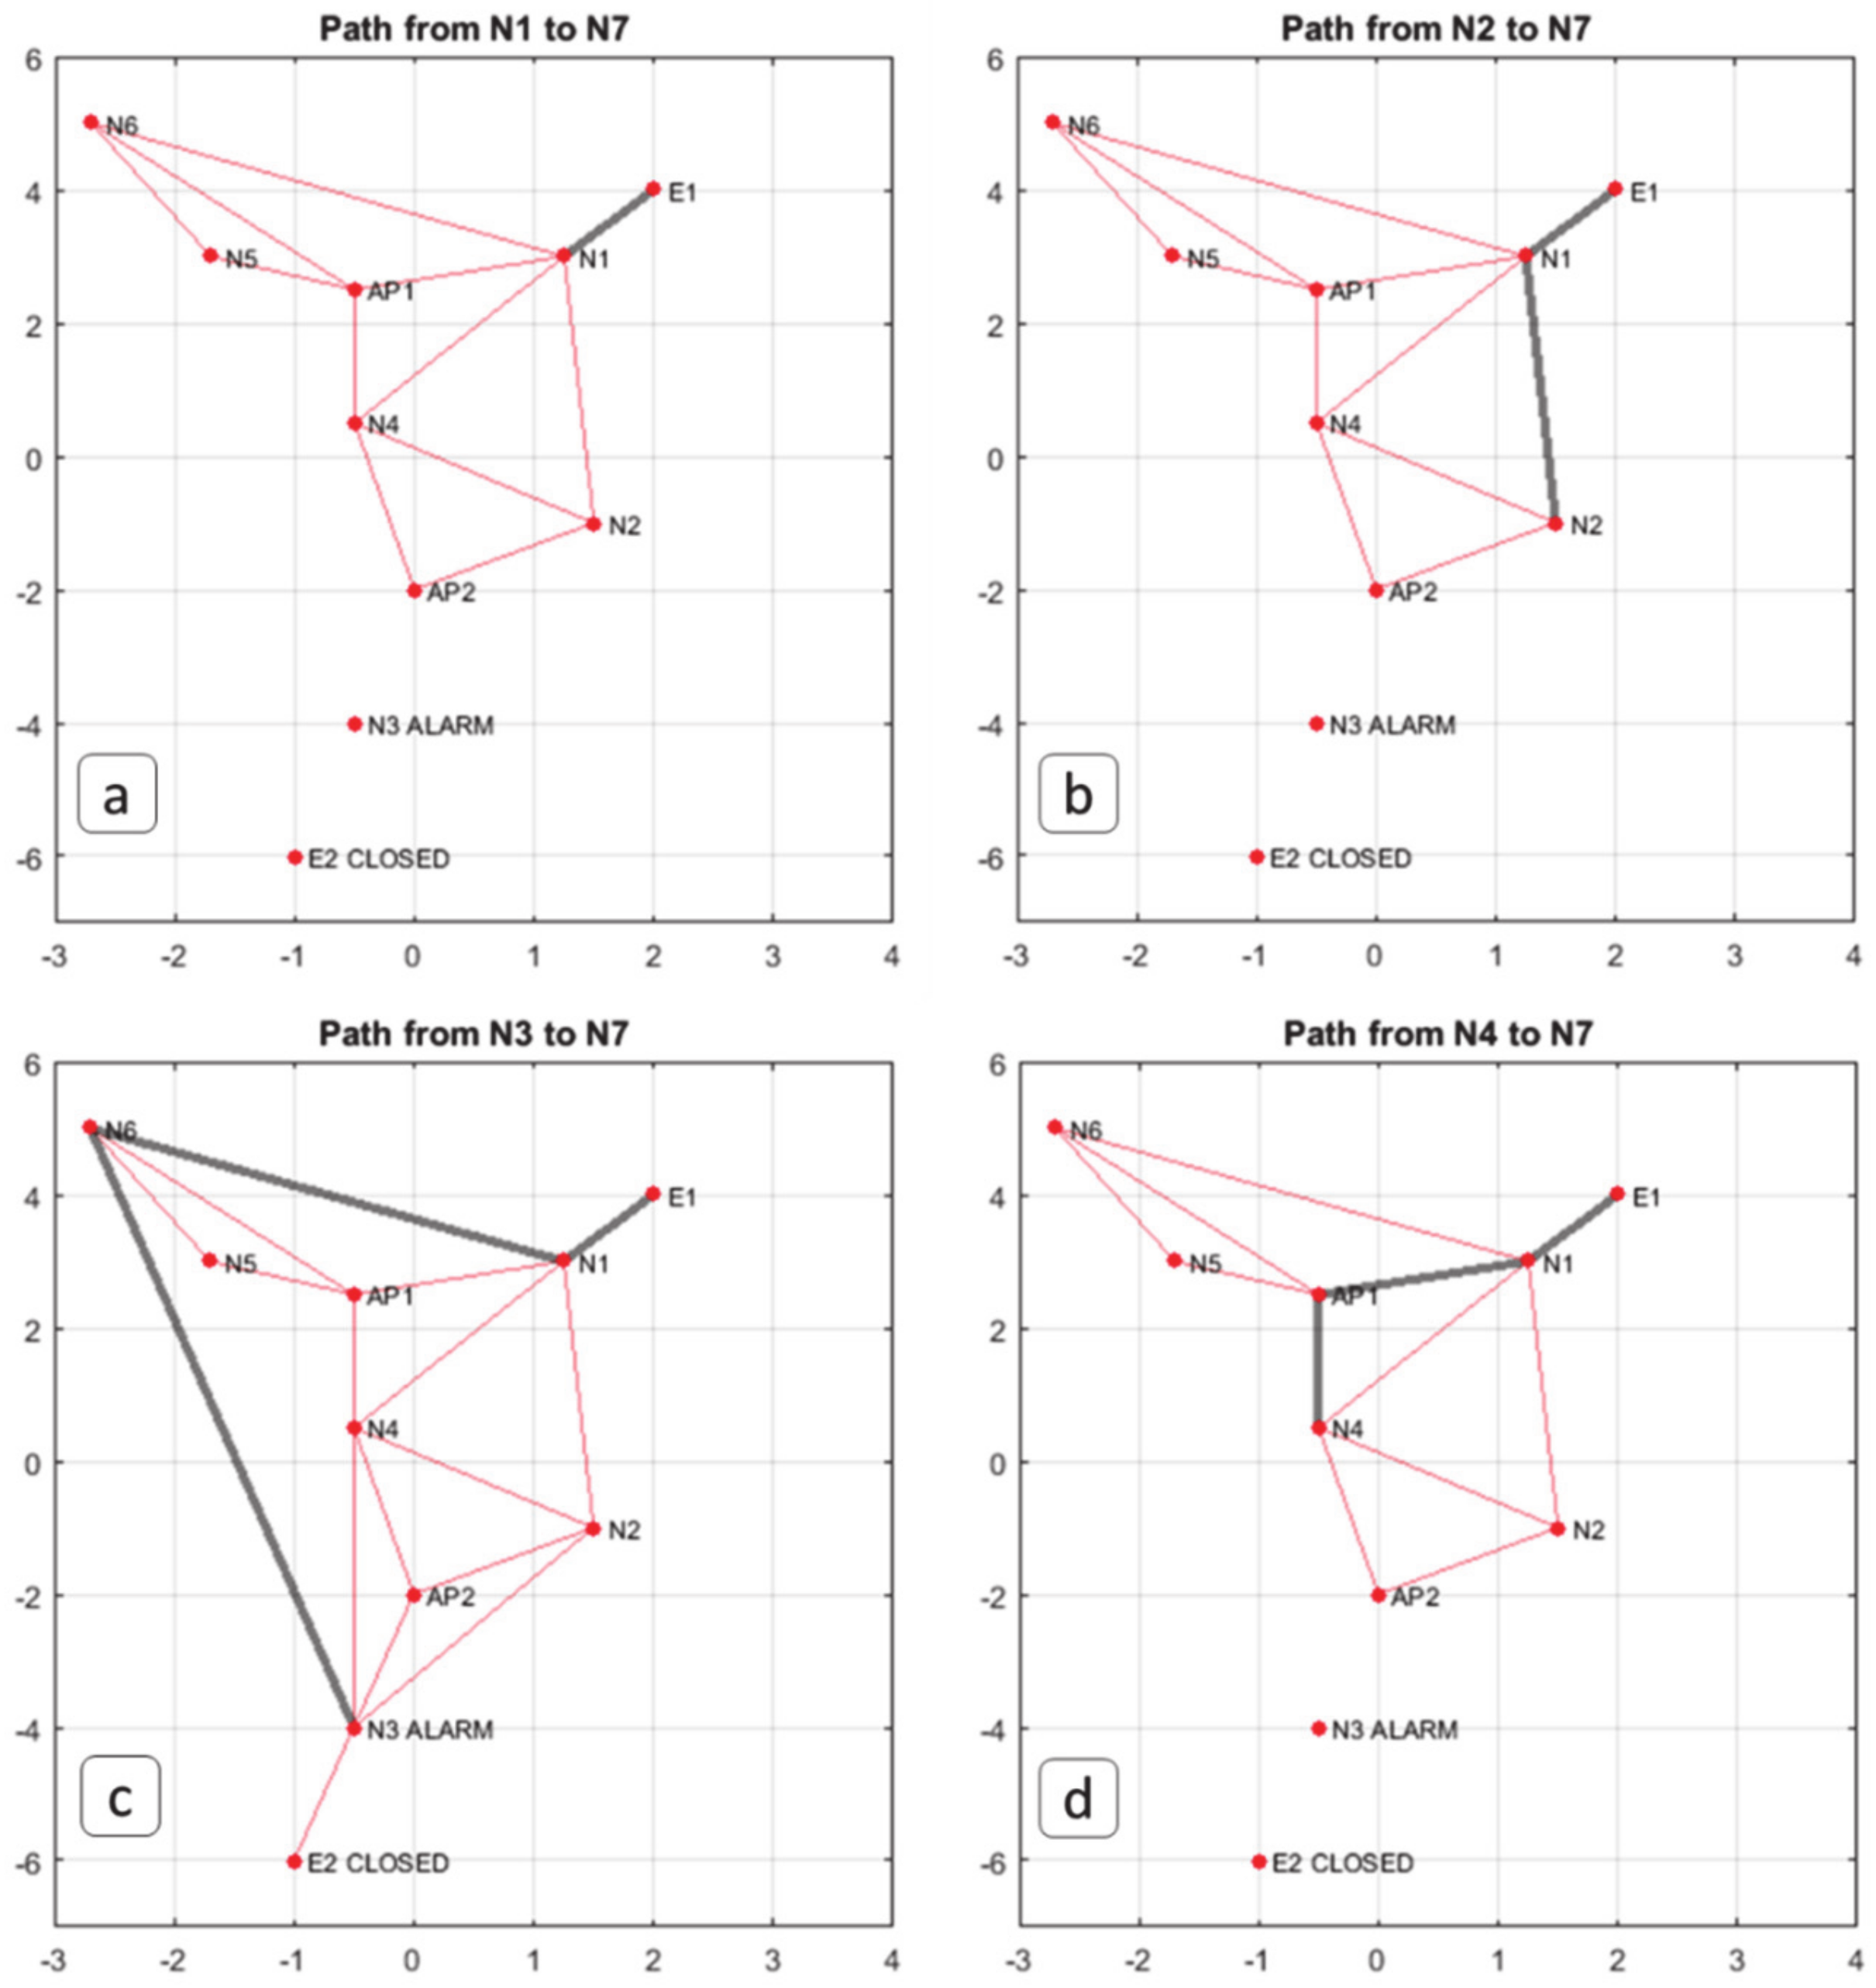
| Classify environmental and structural conditions and trigger related alarms when predefined thresholds are exceeded. |
|
|
|
| Scopes | Input | Output | Steps |
|---|---|---|---|
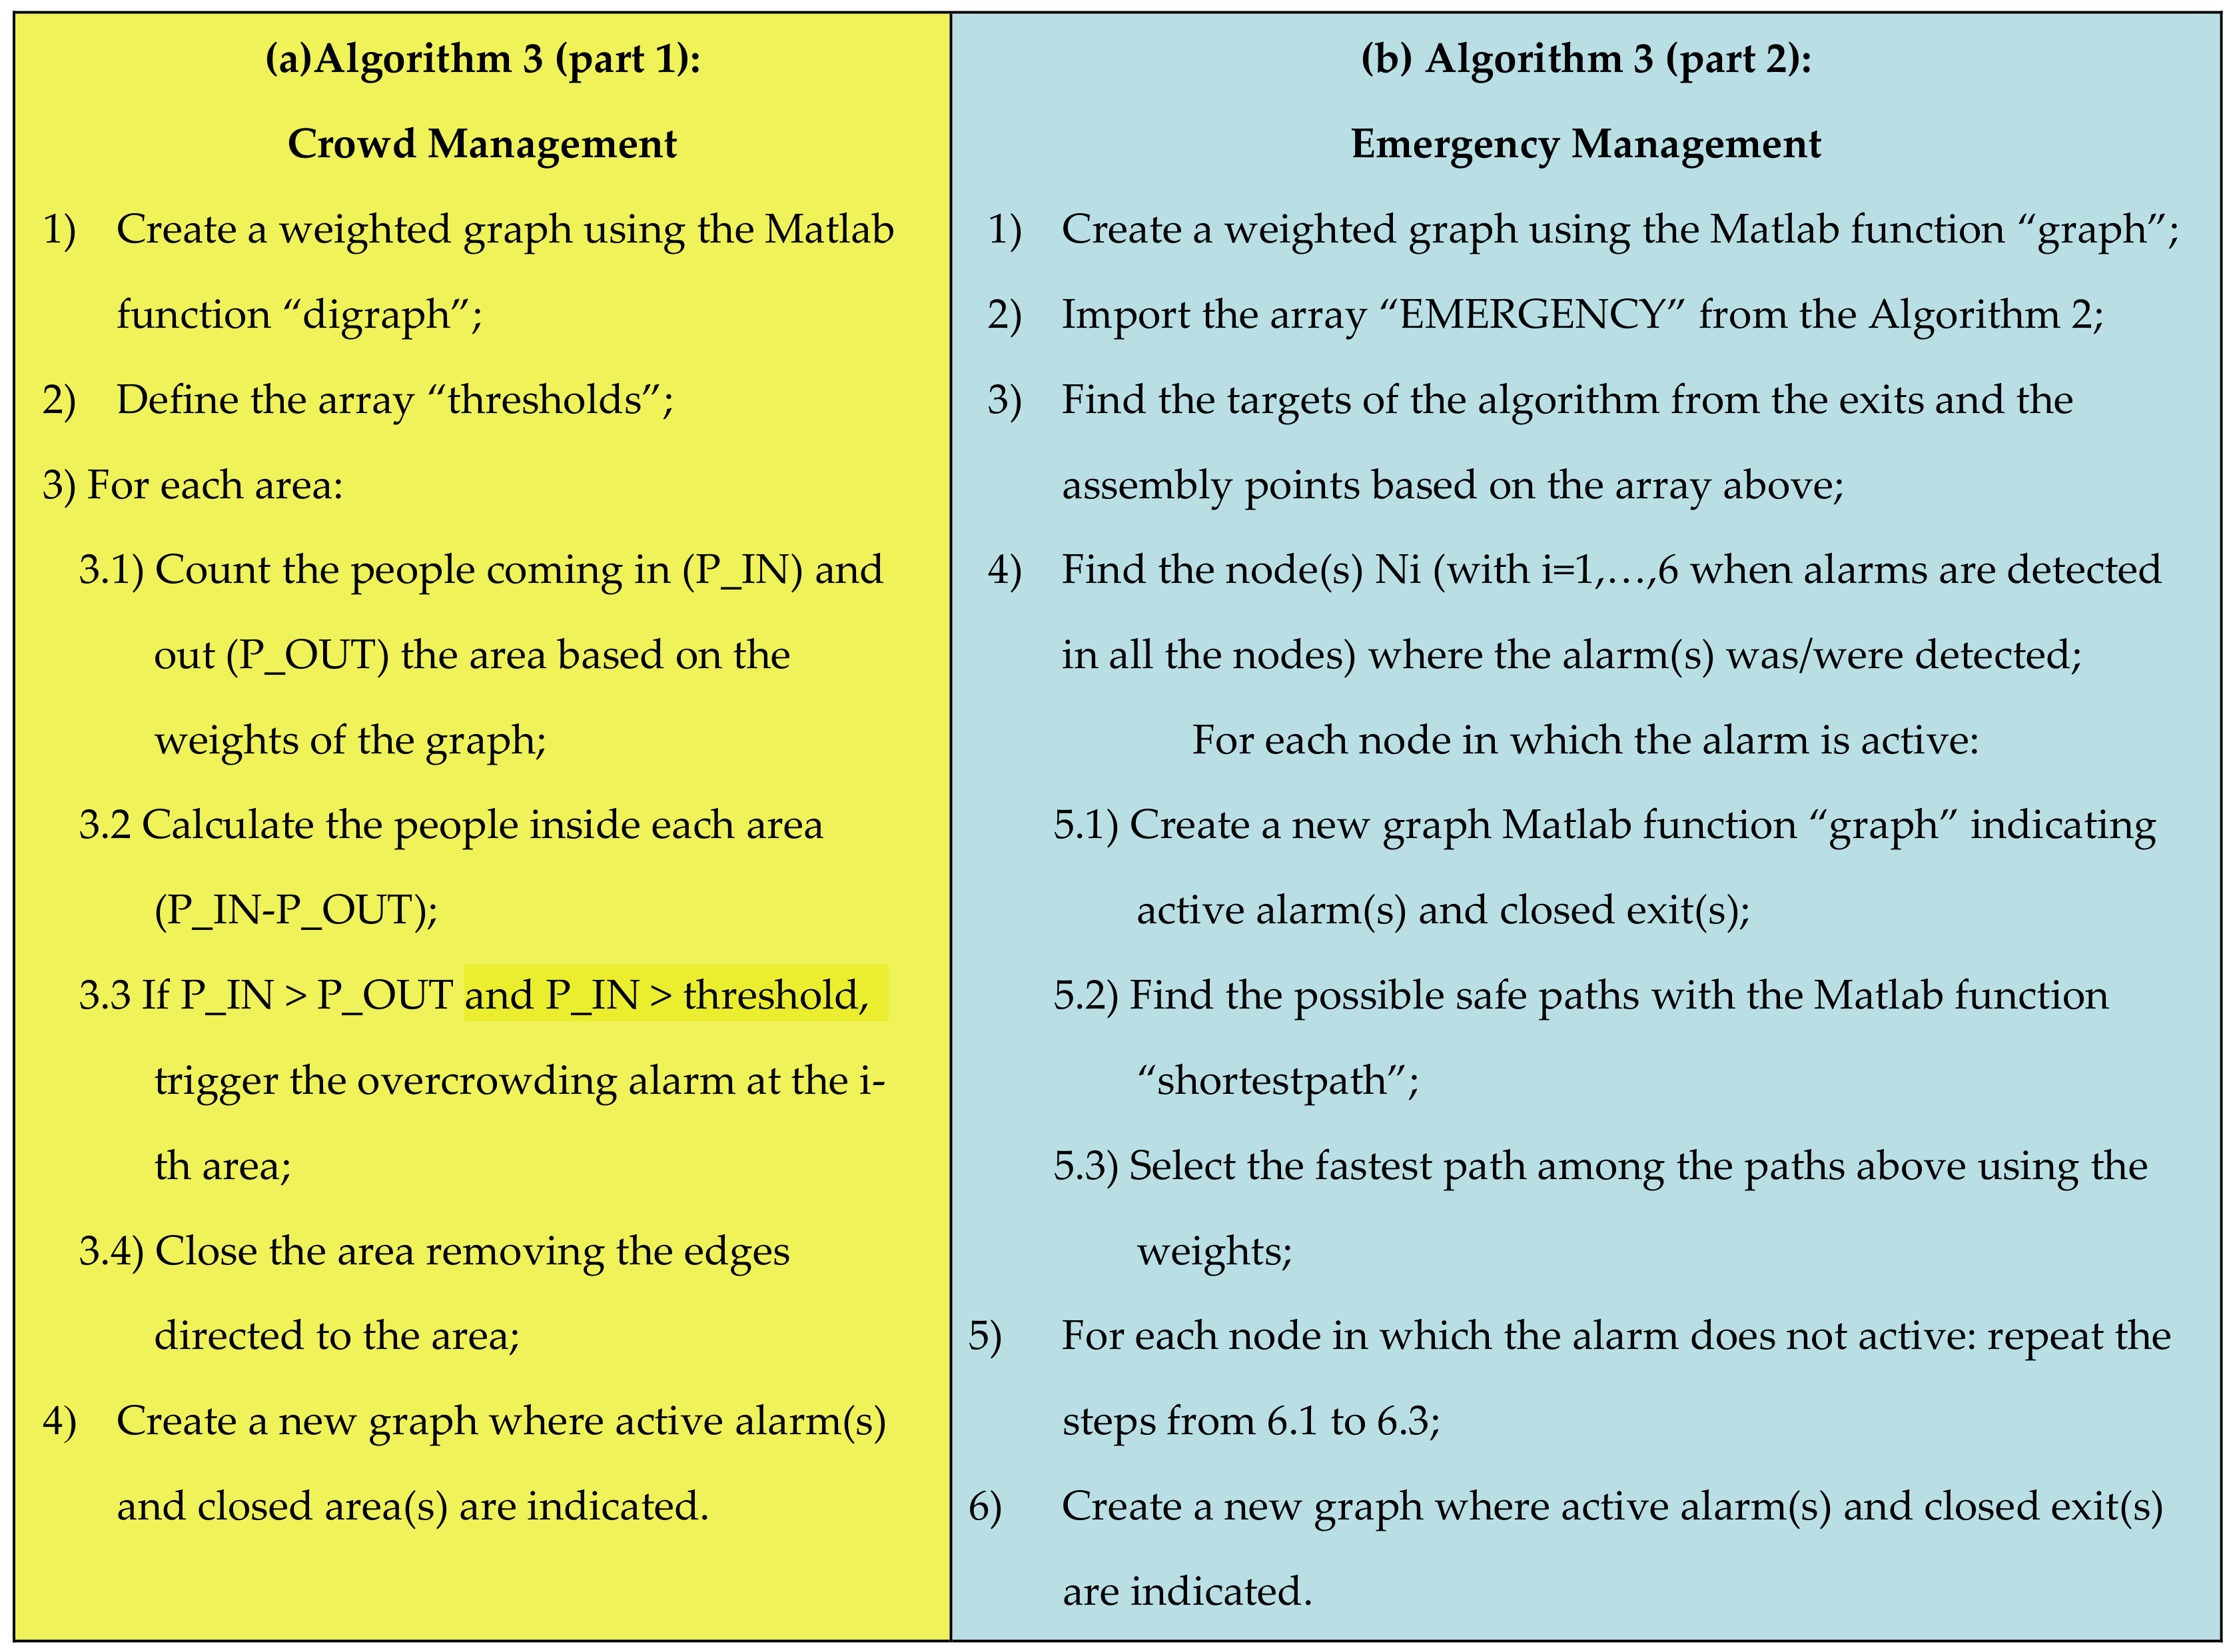
| For part 1:
| For part 1:
| For part 1:
|
For part 2:
| For part 2:
| For part 2:
|
| Condition | # of Node That Make Up the System | # Nodes in Alarm (i.e., 20% of All the Nodes) | Average Time of Response of the Algorithm 3 (s) |
|---|---|---|---|
| 1 | 6 | 1 | 0.5513 |
| 2 | 60 | 12 | 0.9253 |
| 3 | 240 | 48 | 1.7147 |
| 4 | 480 | 96 | 2.9778 |
| 5 | 960 | 192 | 5.9606 |
| 6 | 1200 | 240 | 7.3738 |
© 2020 by the authors. Licensee MDPI, Basel, Switzerland. This article is an open access article distributed under the terms and conditions of the Creative Commons Attribution (CC BY) license (http://creativecommons.org/licenses/by/4.0/).
Share and Cite
Fedele, R.; Merenda, M. An IoT System for Social Distancing and Emergency Management in Smart Cities Using Multi-Sensor Data. Algorithms 2020, 13, 254. https://doi.org/10.3390/a13100254
Fedele R, Merenda M. An IoT System for Social Distancing and Emergency Management in Smart Cities Using Multi-Sensor Data. Algorithms. 2020; 13(10):254. https://doi.org/10.3390/a13100254
Chicago/Turabian StyleFedele, Rosario, and Massimo Merenda. 2020. "An IoT System for Social Distancing and Emergency Management in Smart Cities Using Multi-Sensor Data" Algorithms 13, no. 10: 254. https://doi.org/10.3390/a13100254
APA StyleFedele, R., & Merenda, M. (2020). An IoT System for Social Distancing and Emergency Management in Smart Cities Using Multi-Sensor Data. Algorithms, 13(10), 254. https://doi.org/10.3390/a13100254