Study of Direct-Contact HfO2/Si Interfaces
Abstract
:1. Introduction
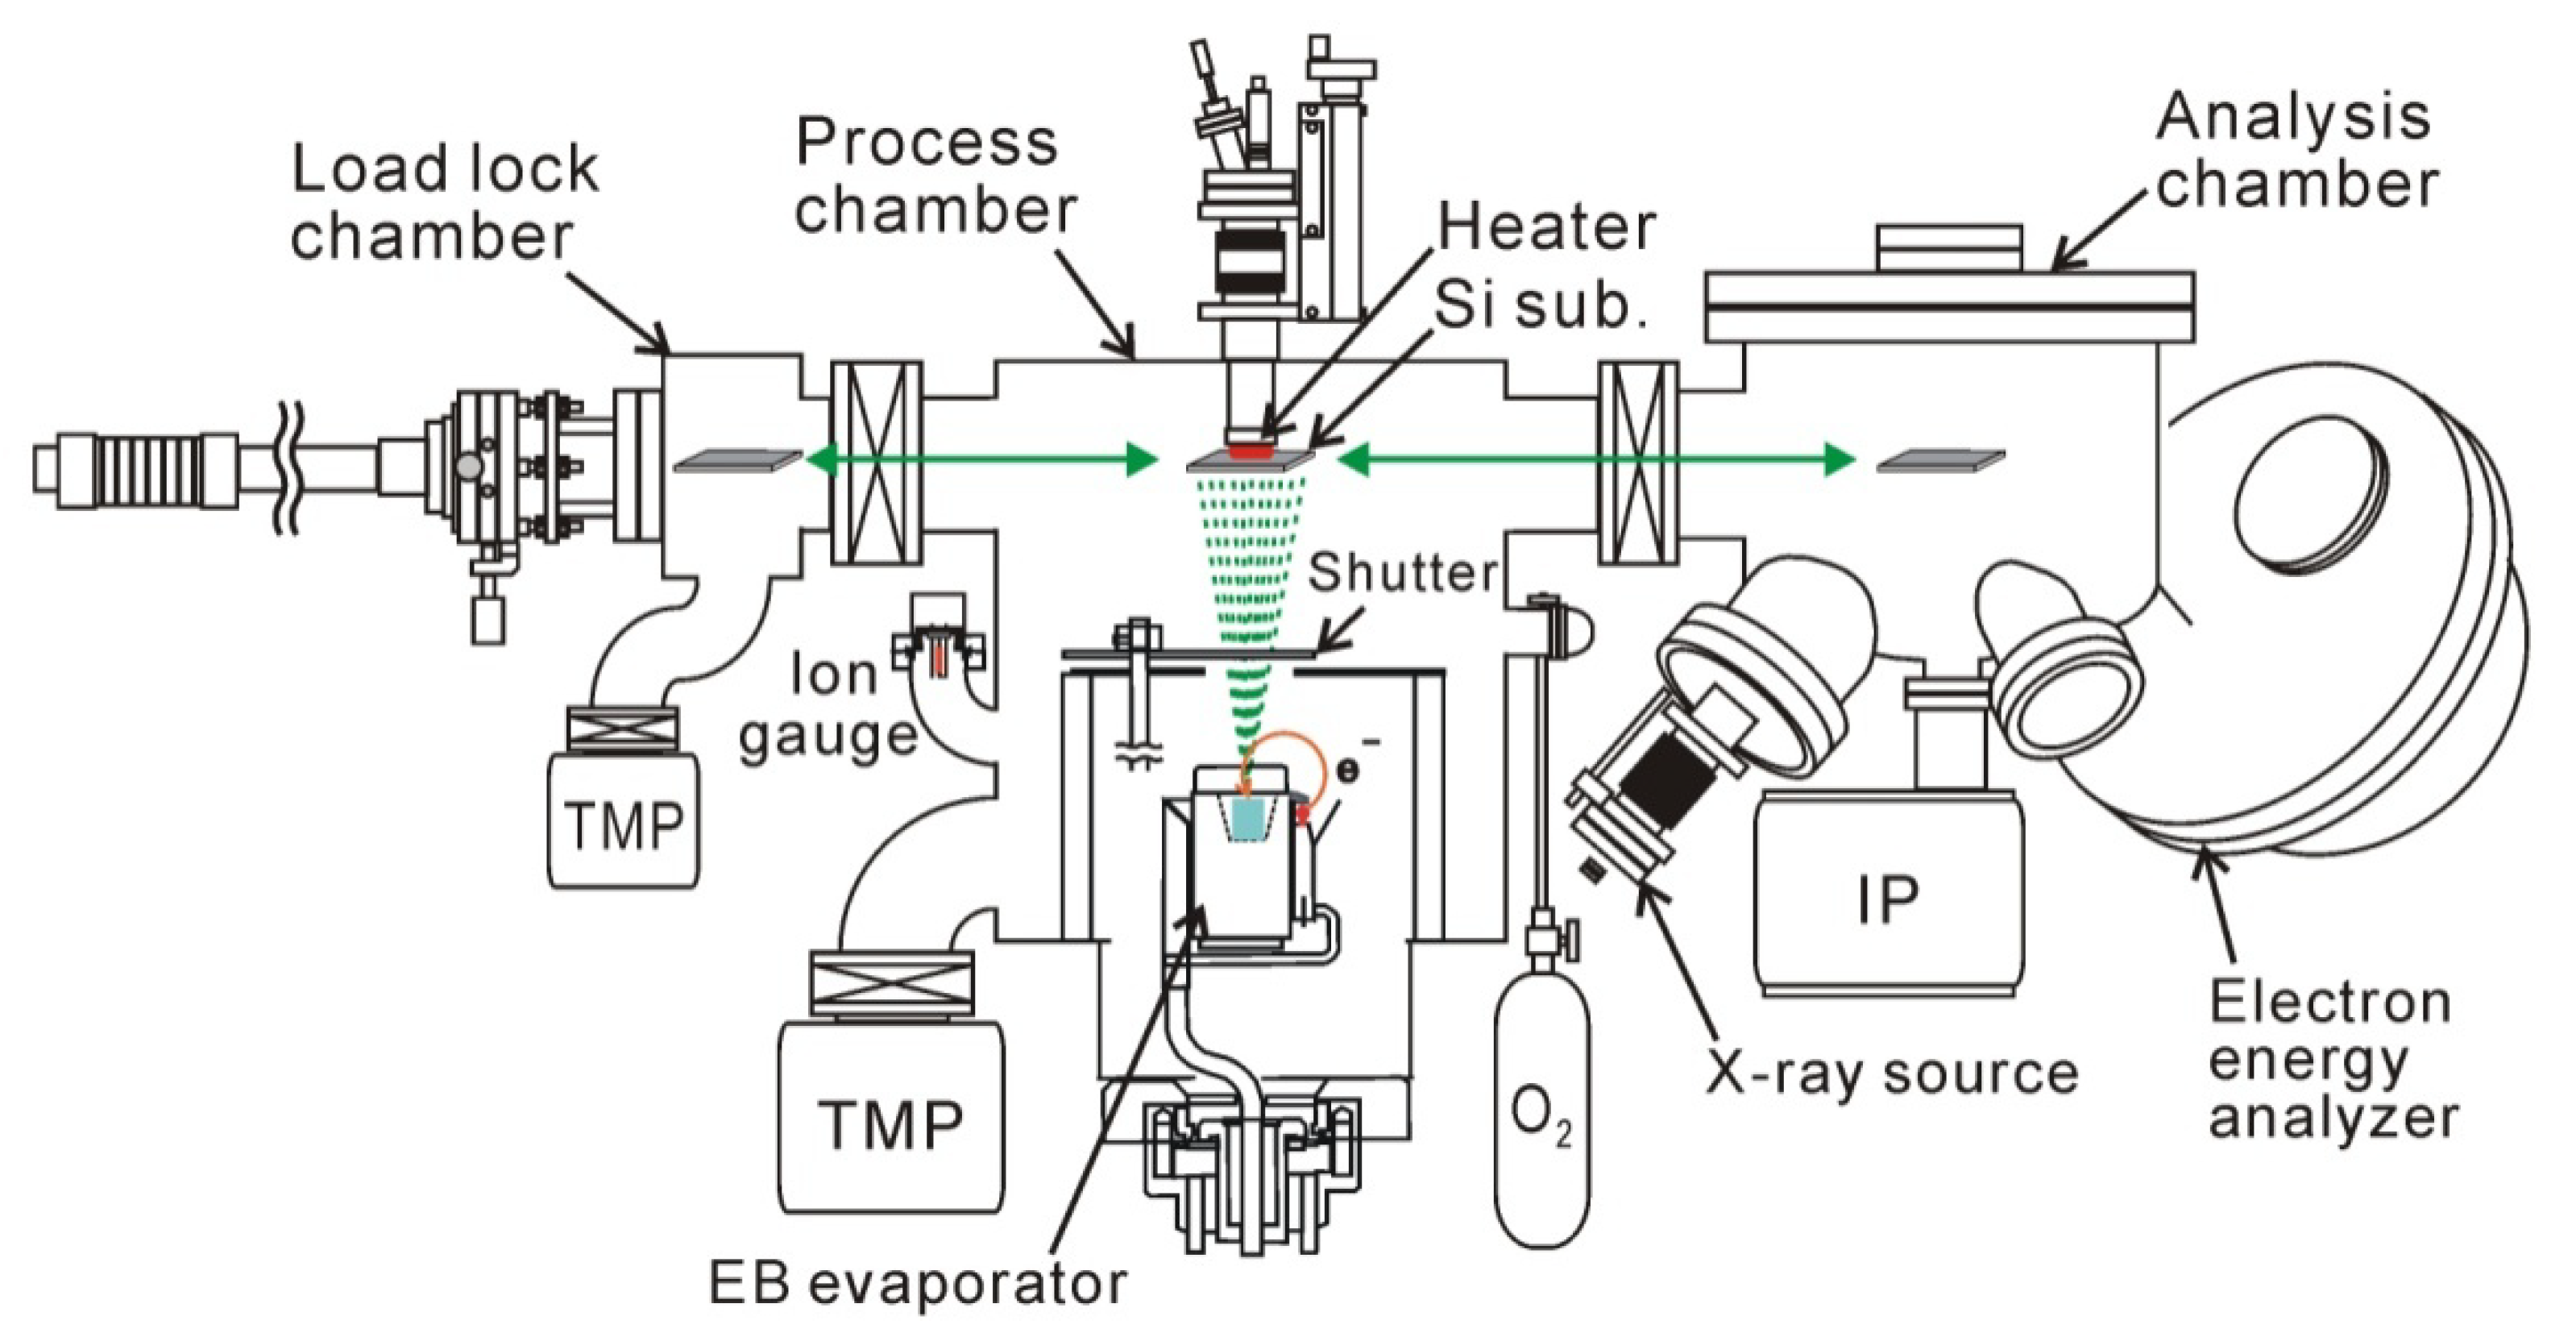
2. Electron-Beam HfO2 Deposition
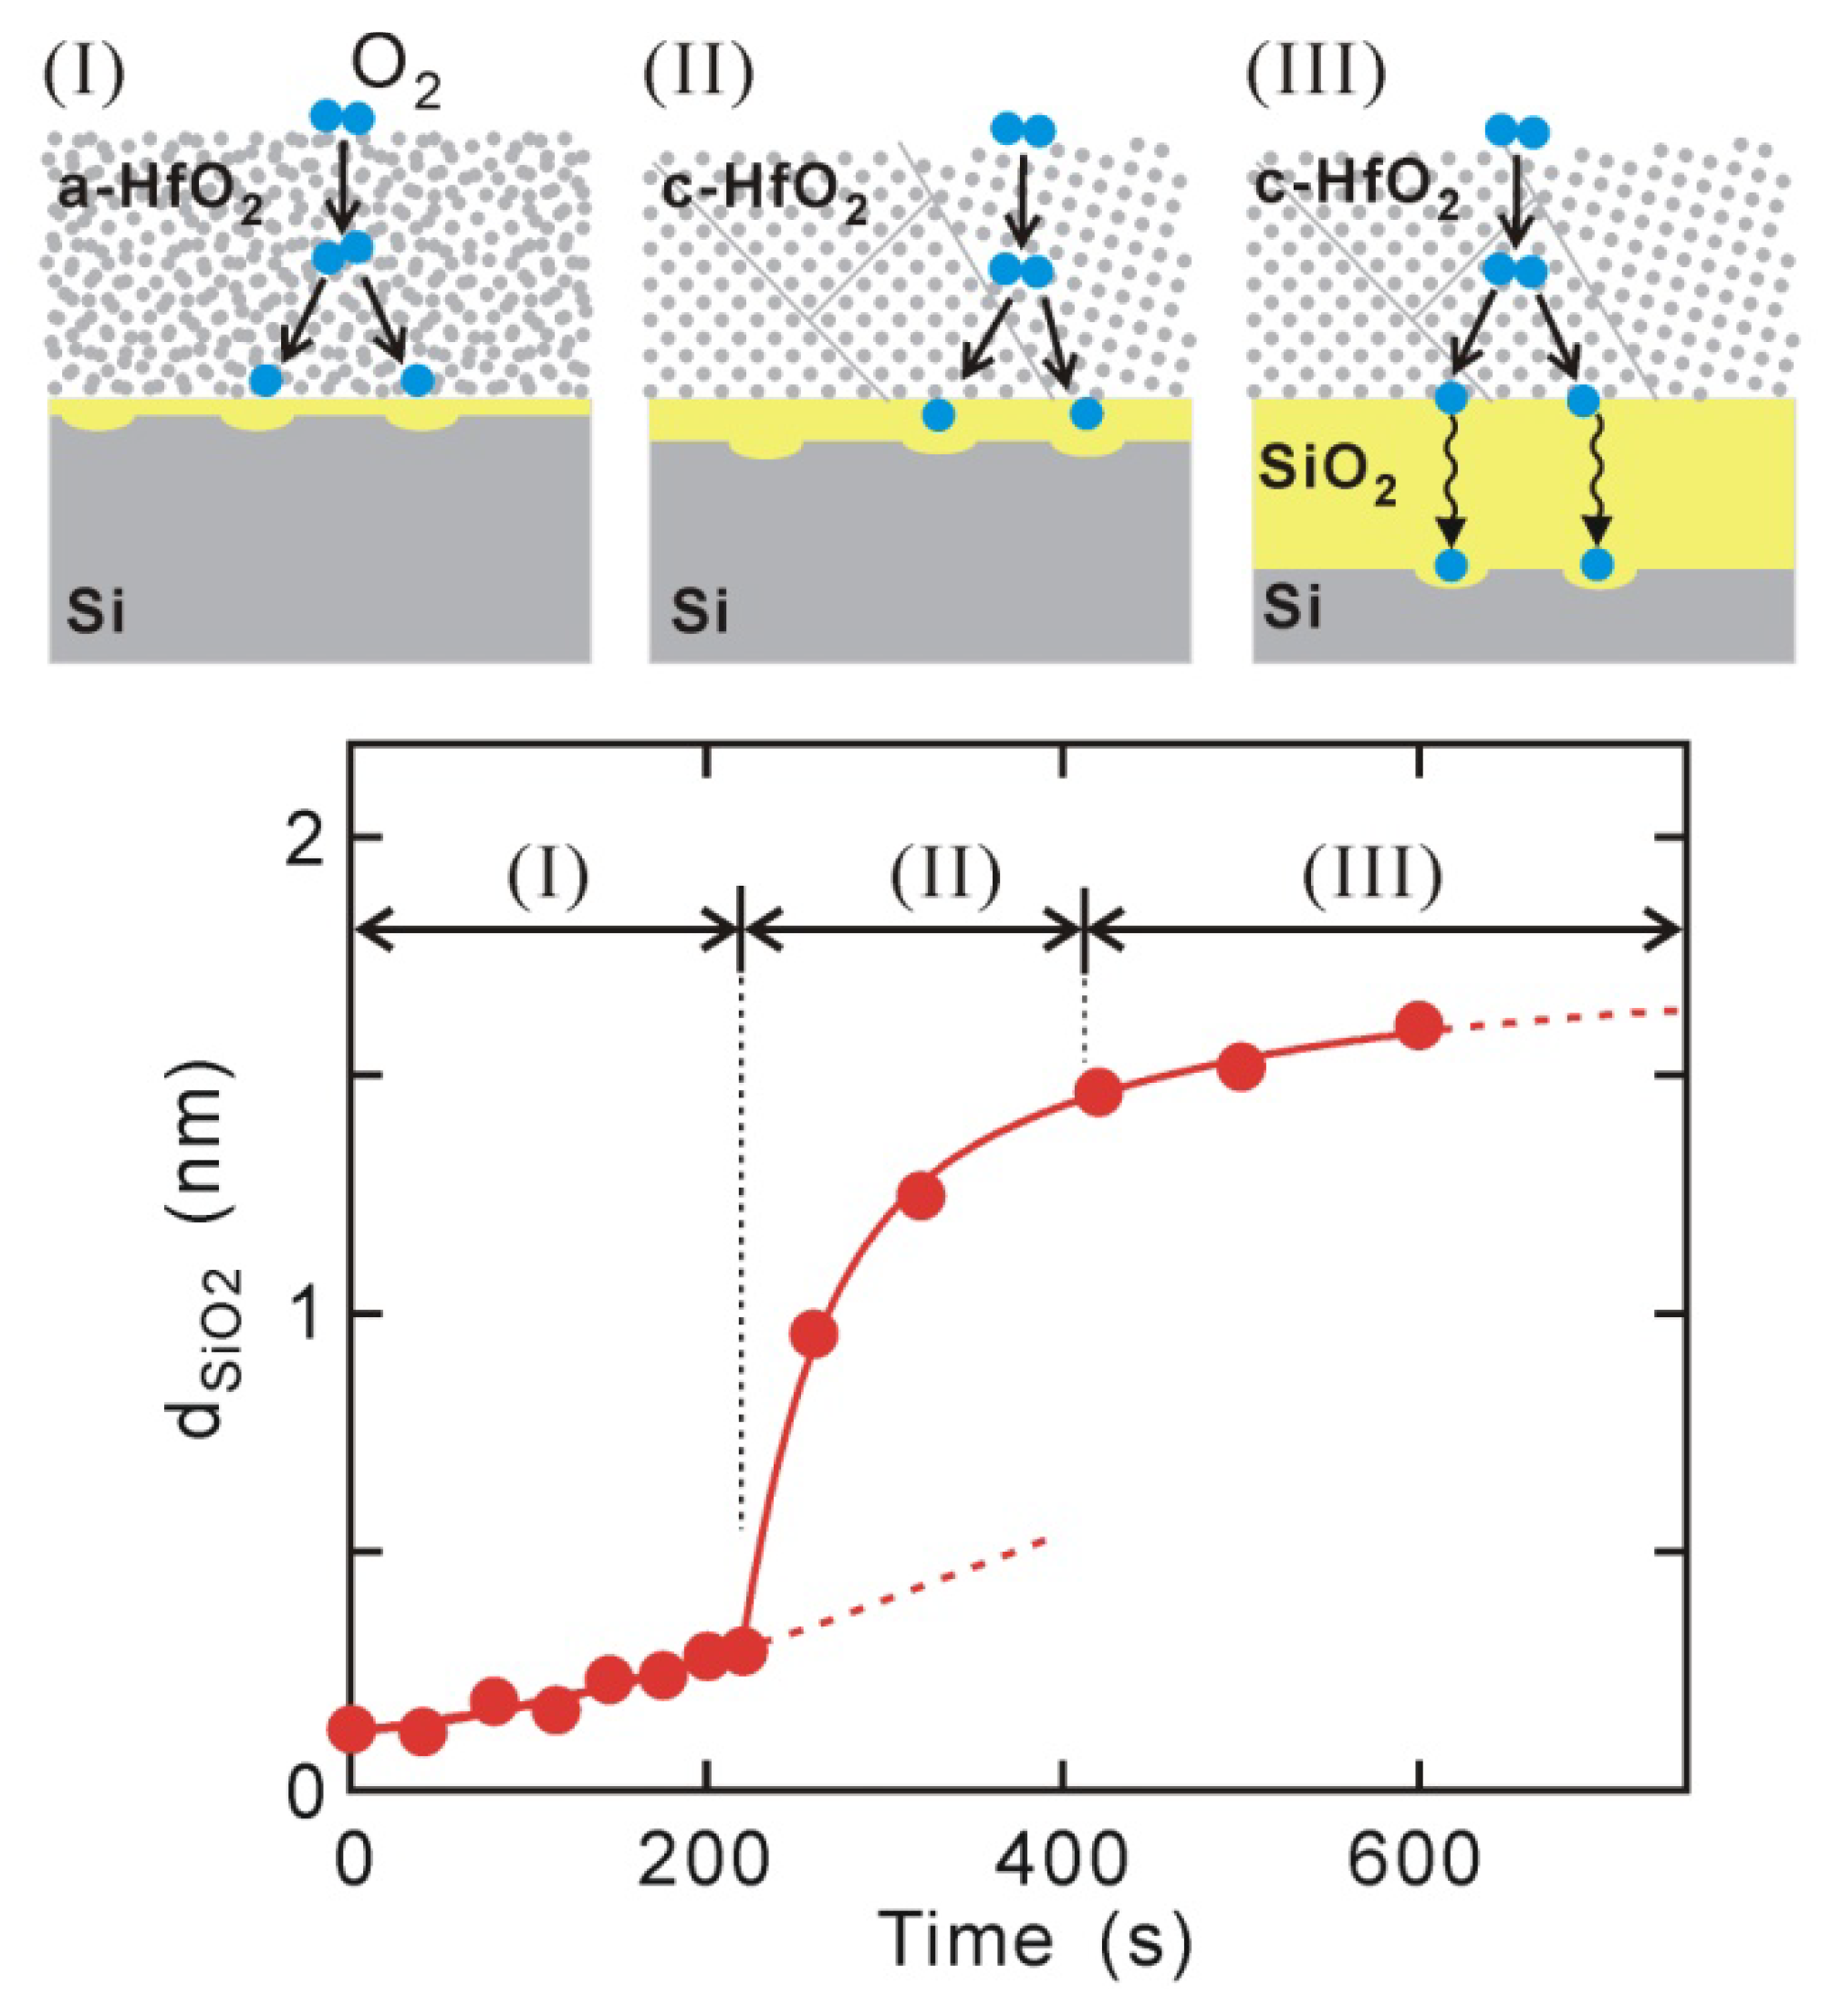
3. Kinetics of Interface Si Oxidation in PDA
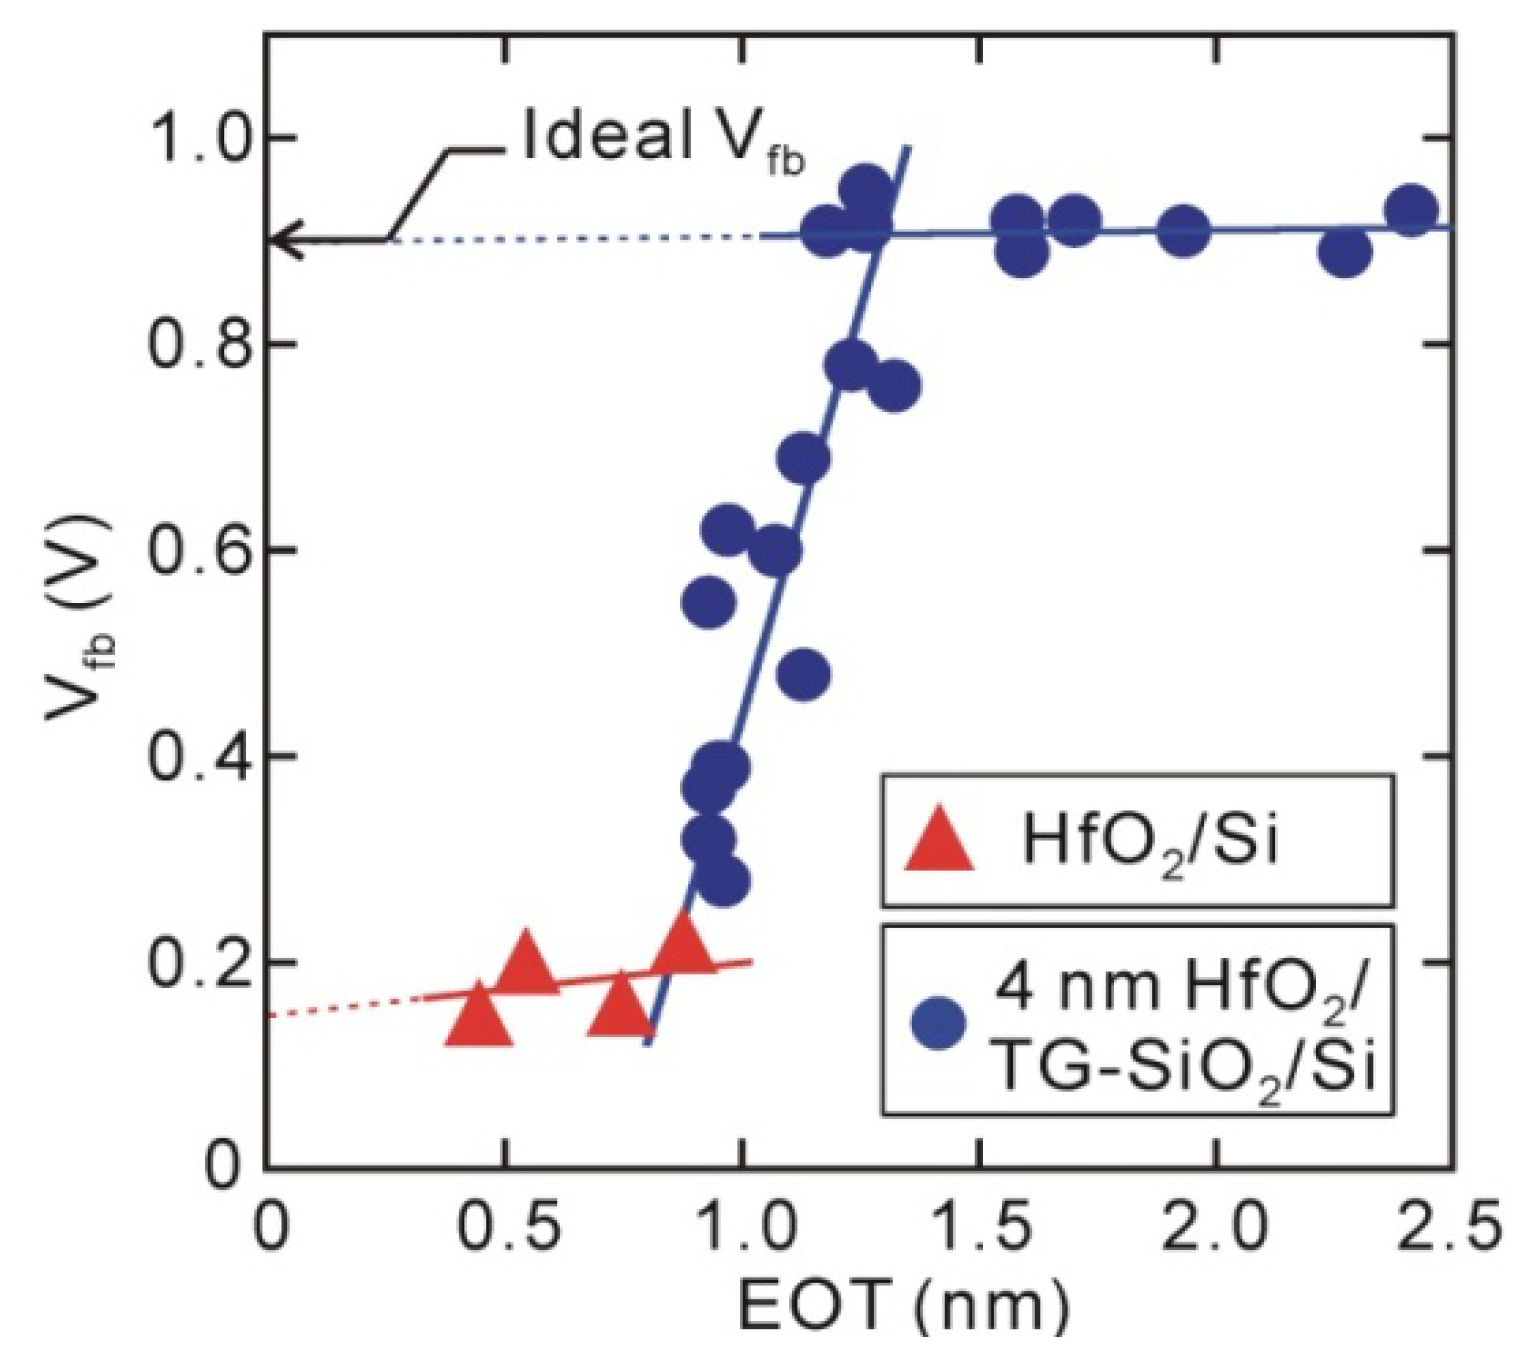
4. MOS Electrical Characteristics

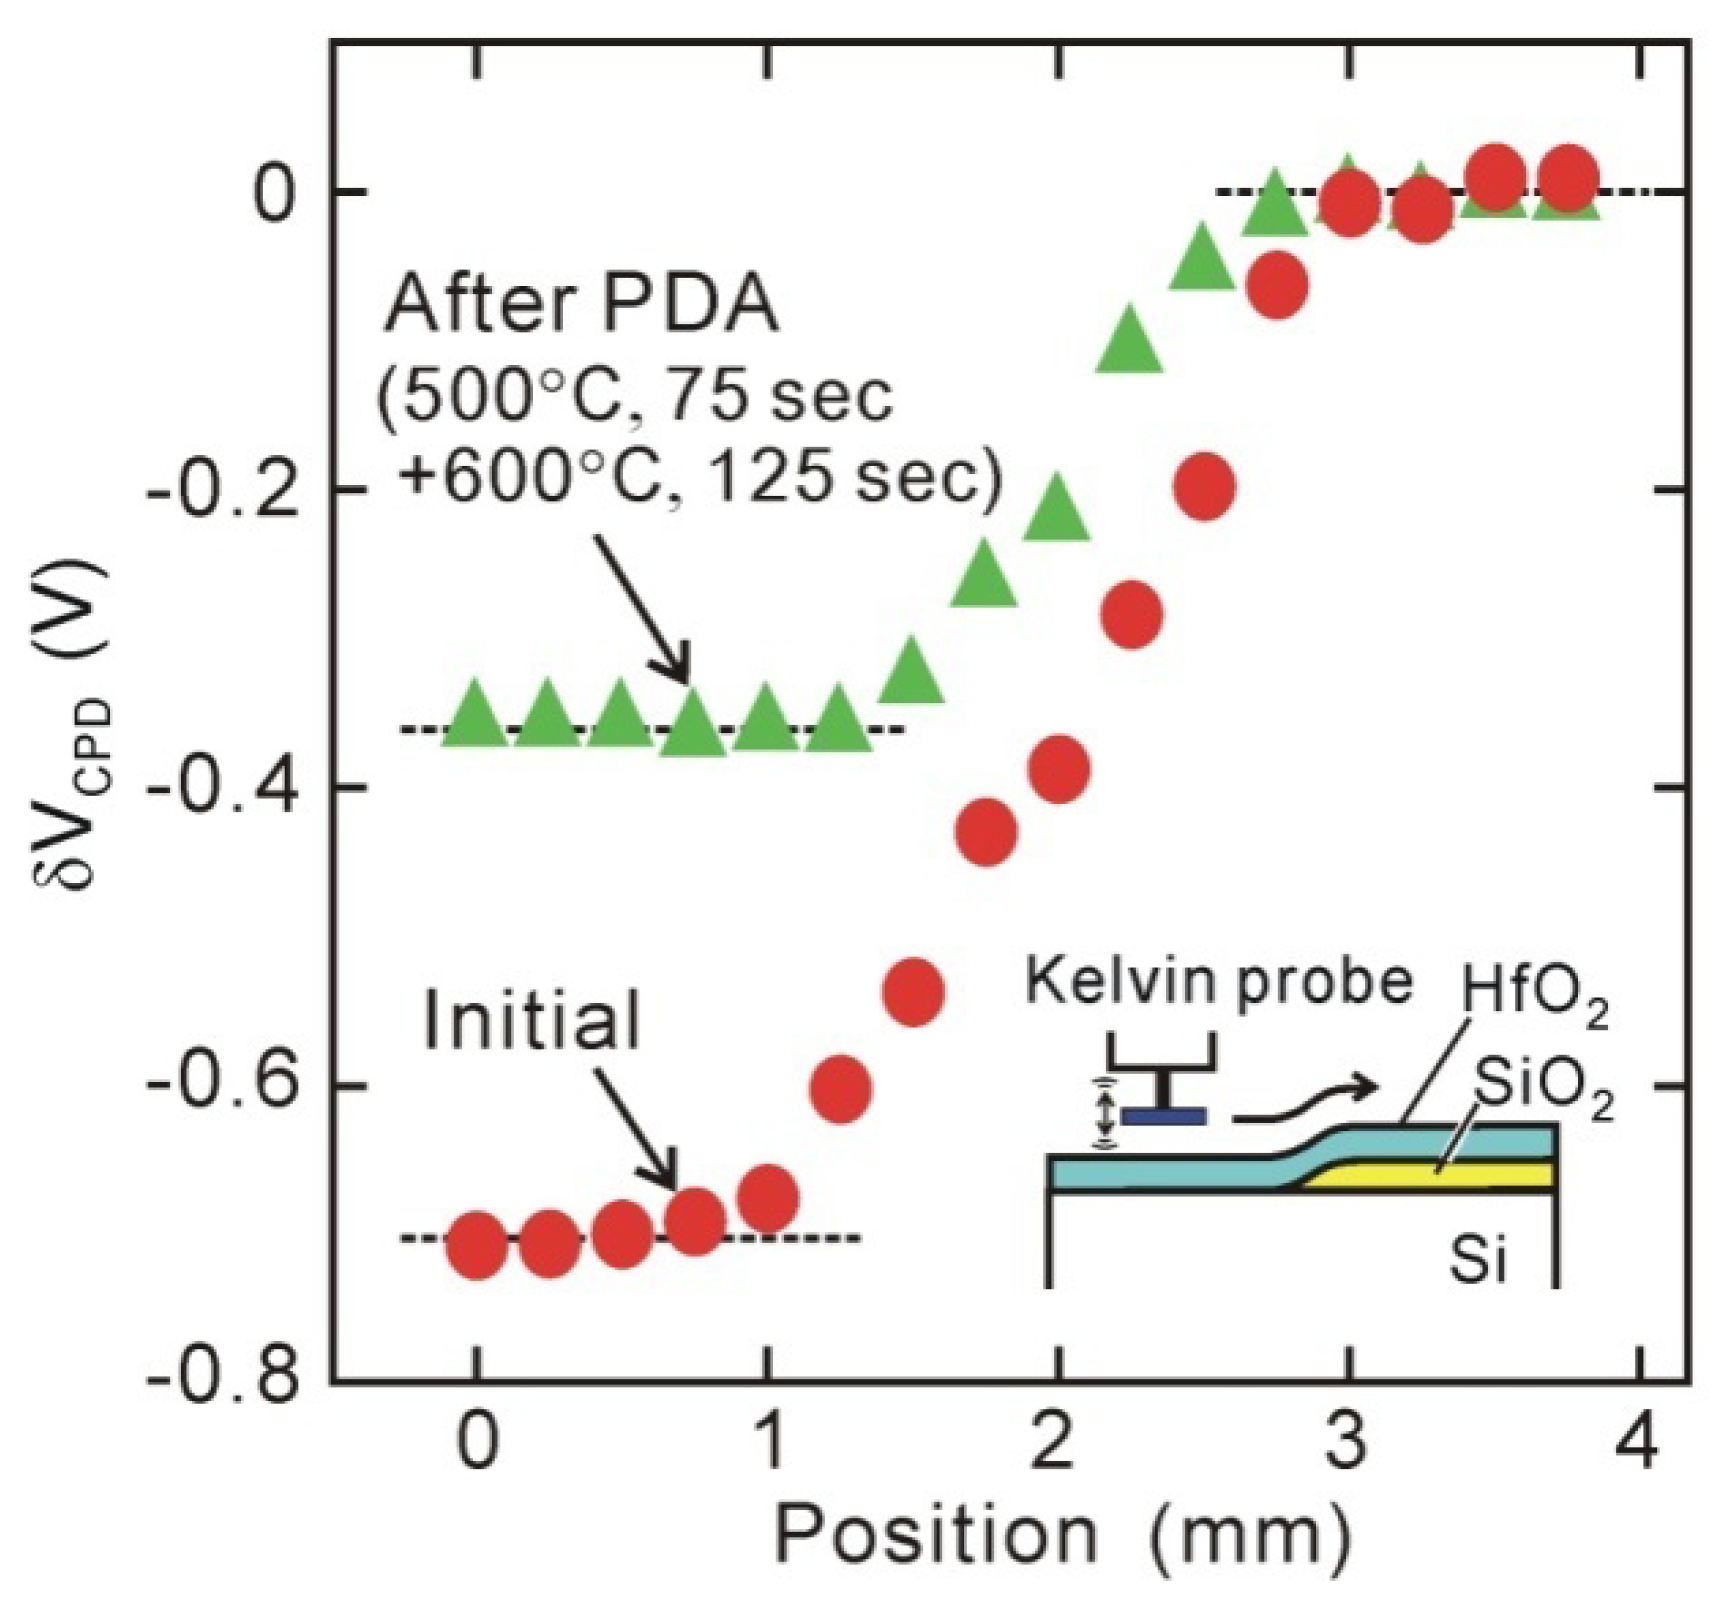
5. Origin of Interface Dipole

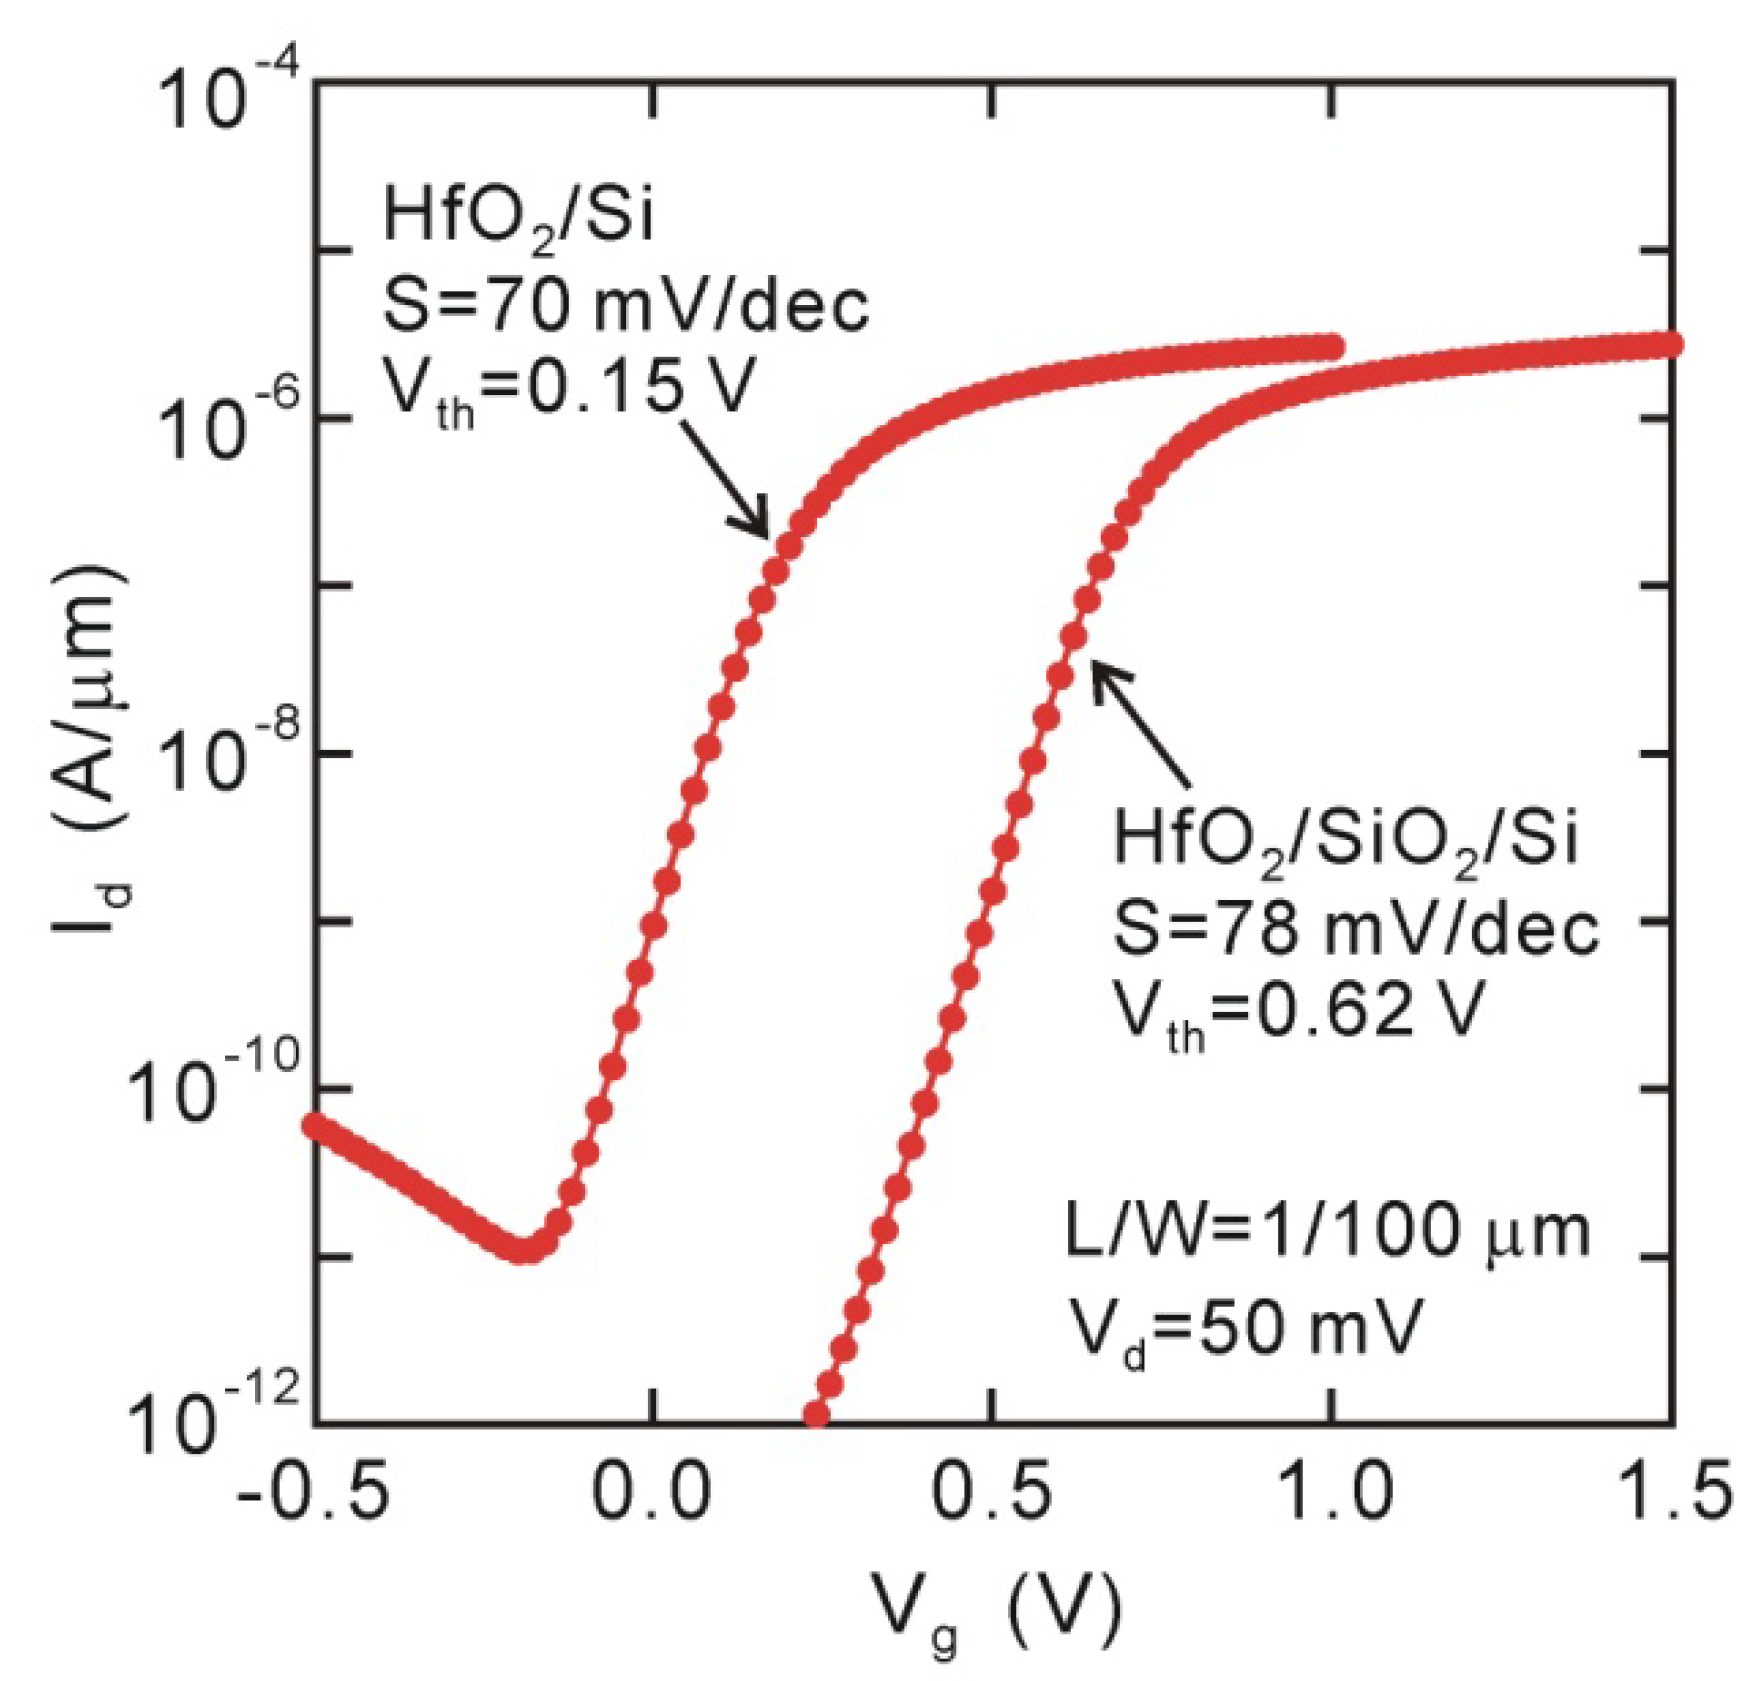
6. MOSFET Characteristics and Channel Mobility

7. Conclusions
Acknowledgments
References
- Mistry, K.; Allen, C.; Auth, C.; Beattie, B.; Bergstrom, D.; Bost, M.; Brazier, M.; Buehler, M.; Cappellani, A.; Chau, R.; et al. A 45 nm logic technology with high-k + Metal gate transistors, strained silicon, 9 Cu interconnect layers, 193nm dry patterning, and 100% Pb-free packaging. In Proceeding of the IEEE International Electron Devices Meeting, Washington, DC, USA, 10–12 December 2007; pp. 247–245.
- Jan, C.-H.; Agostinelli, M.; Buehler, M.; Chen, Z.-P.; Choi, S.-J.; Curello, G.; Deshpande, H.; Gannavaram, S.; Hafez, W.; Jalan, U.; et al. A 32 nm SoC platform technology with 2nd generation high-k/metal gate transistors optimized for ultra low power, high performance, and high density product applications. In Proceeding of the IEEE International Electron Devices Meeting, Baltimore, MD, USA; 2009; pp. 1–4. [Google Scholar]
- Green, M.L.; Gusev, E.P.; Degraeve, R.; Garfunkel, E.L. Ultrathin (<4 nm) SiO2 and Si-O-N gate dielectric layers for silicon microelectronics: Understanding the processing, structure, and physical and electrical limits. J. Appl. Phys. 2001, 90, 2057–2122. [Google Scholar]
- Wilk, G.D.; Wallace, R.M.; Anthony, J.M. High-k gate dielectrics: Current status and materials properties considerations. J. Appl. Phys. 2001, 89, 5243–5276. [Google Scholar] [CrossRef]
- Qi, W.J.; Nieh, R; Lee, B.H.; Kang, L.; Jeon, Y; Onishi, K.; Ngai, T.; Banerjee, S.; Lee, J.C. MOSCAP and MOSFET characteristics using ZrO2 gate dielectric deposited directly on Si. In Proceeding of the IEEE International Electron Devices Meeting, Washington, DC, USA; 1999; pp. 145–148. [Google Scholar]
- Chin, A.; Wu, Y.H.; Chen, S.B.; Liao, C.C.; Chen, W.J. High quality La2O3 and Al2O3 gate dielectrics with equivalent oxide thickness 5–10 Å. In Proceeding of the VLSI Technology, Digest of Technical Papers, Honolulu, HI, USA; 2000; pp. 16–17. [Google Scholar]
- Ragnarsson, L.-A.; Guha, S.; Copel, M.; Cartier, E.; Bojarczuk, N. A.; Karasinski, J. Molecular-beam-deposited yttrium-oxide dielectrics in aluminum-gated metal-oxide-semiconductor field-effect transistors: Effective electron mobility. Appl. Phys. Lett. 2001, 78, 4169–4171. [Google Scholar] [CrossRef]
- Wu, Y.H.; Yang, M.Y.; Chin, A.; Chen, W.J.; Kwei, C.M. Electrical characteristics of high quality La2O3 gate dielectric with equivalent oxide thickness of 5 Å. Electron. Device Lett. 2000, 21, 341–343. [Google Scholar] [CrossRef]
- Peacock, P.W.; Xiong, K.; Tse, K.; Robertson, J. Bonding and interface states of Si: HfO2 and Si:ZrO2 interfaces. Phys. Rev. B 2006, 73, 075328. [Google Scholar] [CrossRef]
- Hobbs, C.; Fonseca, L.; Dhandapani, V.; Samavedam, S.; Taylor, B.; Grant, J.; Dip, L.; Triyoso, D.; Hegde, R.; Gilmer, D.; et al. Fermi level pinning at the poly Si/metal oxide interface. VLSI Tech. Dig. 2004, 51, 9–10. [Google Scholar]
- Akiyama, K.; Wang, W.; Mizubayashi, W.; Ikeda, M.; Ota, H.; Nabatame, T.; Toriumi, A. VFB roll-off in HfO2 gate stack after high temperature annealing process—A crucial role of out-diffused oxygen from HfO2 to Si. In Proceeding of the VLSI Technology, Tokyo, Japan; 2007; pp. 72–73. [Google Scholar]
- Ohmori, K.; Ahmet, P.; Shiraishi, K.; Yamabe, K.; Watanabe, H.; Akasaka, Y.; Umezawa, N.; Nakajima, K.; Yoshitake, M.; Nakayama, T.; et al. Controllability of flatband voltage in high-k gate stack structures—Remarkable advantages of La2O3/HfO2. In Proceeding of the Solid-State and Integrated Circuit Technology, 8th International Conference, Shanghai, China; 2006; pp. 376–379. [Google Scholar]
- The International Technology Roadmap for Semiconductor; Semiconductor Industry Association: San Jose, CA, USA, 2003. Available online: http://www.itrs.net (accessed on 6 March 2012).
- He, G.; Fang, Q.; Liu, M.; Zhu, L.Q.; Zhang, L.D. The structural and interfacial properties of HfO2/Si by the plasma oxidation of sputtered metallic Hf thin films. J. Cryst. Growth 2004, 268, 155–162. [Google Scholar] [CrossRef]
- Lee, M.; Lu, Z.-H.; Ng, W.-T.; Landheer, D.; Wu, X.; Moisa, S. Interfacial growth in HfOxNy gate dielectrics deposited using [(C2H5)2N]4Hf with O2 and NO. Appl. Phys. Lett. 2003, 83, 2638–2640. [Google Scholar] [CrossRef]
- Miyata, N.; Ichikawa, M.; Nabatame, T.; Horikawa, T.; Toriumi, A. Thermal stability of a thin HfO2/ultrathin SiO2/Si structure: Interfacial Si oxidation and silicidation. Jpn. J. Appl. Phys. 2003, 42, 138–140. [Google Scholar] [CrossRef]
- Kirsch, P.D.; Kang, C.S.; Lozano, J.; Lee, J.C.; Ekerdt, J.G. Electrical and spectroscopic comparison of HfO2/Si interfaces on nitrided and un-nitrided Si(100). J. Appl. Phys. 2002, 91, 4353–4364. [Google Scholar] [CrossRef]
- Cho, M.-H.; Roh, Y.S.; Whang, C.N.; Jeong, K.; Nahm, S.W.; Ko, D.-H.; Lee, J.H.; Lee, N.I.; Fujihara, K. Thermal stability and structural characteristics of HfO2 films on Si (100) grown by atomic-layer deposition. Appl. Phys. Lett. 2002, 81, 472–475. [Google Scholar] [CrossRef]
- Chabal, Y.J. Infrared spectroscopy of hydrogen on silicon surfaces. Physica. B Condens. Matter 1991, 170, 447–456. [Google Scholar] [CrossRef]
- Miyata, N. Two-step behavior of initial oxidation at HfO2/Si interface. Appl. Phys. Lett. 2006, 89, 102903:1–102903:3. [Google Scholar] [CrossRef]
- Miyata, N.; Ota, H.; Ichikawa, M. Correlation between scanning-tunneling-probe-induced spots and fixed positive charges in thin HfO2 films. Appl. Phys. Lett. 2005, 86, 112906:1–112906:3. [Google Scholar] [CrossRef]
- Miyata, N. Photoassisted scanning tunneling spectroscopy study on the local spot strucutres in thin HfO2 film on Si. Appl. Phys. Express 2008, 1, 051602:1–051602:3. [Google Scholar]
- Miyata, N.; Nabatame, T.; Horikawa, T.; Ichikawa, M.; Toriumi, A. Void nucleation in thin HfO2 layer on Si. Appl. Phys. Lett. 2003, 82, 3880–3883. [Google Scholar] [CrossRef]
- Miyata, N.; Yasuda, T.; Abe, Y. Structural degradation of thin HfO2 film on Ge during the post deposition annealing. J. Appl. Phys. 2010, 107, 103536–103541. [Google Scholar] [CrossRef]
- Miyata, N.; Morita, Y.; Horikawa, T.; Nabatame, T.; Ichikawa, M.; Toriumi, A. Two-dimensional void growth during thermal annealing of thin HfO2 film on Si. Phys. Rev. 2005, B71, 233302:1–233302:4. [Google Scholar]
- Kundu, M.; Miyata, N.; Nabatame, T.; Horikawa, T.; Ichikawa, M.; Toriumi, A. Effect of Al2O3 capping layer on suppression of interfacial SiO2 growth in HfO2/ultrathin SiO2/Si(001) structure. Appl. Phys. Lett. 2003, 82, 3442–3445. [Google Scholar] [CrossRef]
- Massoud, H.Z.; Plummer, J.D.; Irene, E.A. Thermal Oxidation of silicon in dry oxygen growth-rate enhancement in the thin regime. J. Electrochem. Soc. 1985, 132, 2685–2693. [Google Scholar] [CrossRef]
- Kundu, M.; Miyata, N.; Morita, Y.; Horikawa, T.; Nabatame, T.; Ichikawa, M.; Toriumi, A. Decomposition of SiN interlayer during thermal annealing of HfAlOx/SiN/Si(001) structure. Appl. Phys. Lett. 2004, 84, 5326–5328. [Google Scholar] [CrossRef]
- Abe, Y.; Miyata, N.; Nohira, H.; Yasuda, T. Reduction of accumulation capacitance in direct-contact HfO2/p-Type Si metal-oxide-semiconductor capacitors. Jpn. J. Appl. Phys. 2010, 49, 060202:1–060202:3. [Google Scholar]
- Miyata, N.; Abe, Y.; Yasuda, T. Conductance spectroscopy study on interface electronic states of HfO2/Si structures: Comparison with interface dipole. Appl. Phys. Express 2009, 2, 035502. [Google Scholar] [CrossRef]
- Hickmott, T.W. Dipole layers at the metal—SiO2 interface. J. Appl. Phys. 1980, 51, 4269–4281. [Google Scholar] [CrossRef]
- Abe, Y.; Miyata, N.; Shiraki, Y.; Yasuda, T. Dipole formation at direct-contact HfO2/Si interface. Appl. Phys. Lett. 2007, 90, 172906:1–172906:3. [Google Scholar]
- Abe, Y.; Miyata, N.; Yasuda, T. Comparison between the direct-contact HfO2/Ge and HfO2/SiO2/Ge structure: Physical and electrical properties. ECS Trans. 2008, 375, 375–385. [Google Scholar]
- Sze, M. Physics of Semiconductor Devices, 2nd Ed. ed; Wiley: New York, NY, USA, 1981. [Google Scholar]
- Robertson, J. Band offsets of wide-band-gap oxides and implications for future electronic devices. J. Vac. Sci. Technol. 2000, B18, 1785–1791. [Google Scholar] [CrossRef]
- Zhu, W.J.; Tso-Ping Ma; Tamagawa, T.; Kim, J.; Di, Y. Current transport in metal/hafnium oxide/silicon structure. IEEE Electron. Device Lett. 2002, 23, 97–99. [Google Scholar] [CrossRef]
- Tanimura, T.; Toyoda, S.; Kumigashira, H.; Oshima, M.; Ikeda, K.; Liu, G.L.; Liu, Z.; Usuda, K. Analysis of x-ray irradiation effect in high-k gate dielectrics by time-dependent photoemission spectroscopy using synchrotron radiation. Surf. Interface Anal. 2008, 40, 1606–1609. [Google Scholar] [CrossRef]
- Kadoshima, M.; Ogawa, A.; Ota, H.; Iwamoto, K.; Takahashi, M.; Mise, N.; Migita, S.; Ikeda, M.; Satake, H.; Nabatame, T.; Toriumi, A. Symmetrical threshold voltage in complementary metal-oxide-semiconductor field-effect transistors with HfAlOx(N) achieved by adjusting Hf/Al compositional ratio. J. Appl. Phys. 2006, 99, 054506:1–054506:6. [Google Scholar] [CrossRef]
- Akasaka, Y.; Nakamura, G.; Shiraishi, K.; Umezawa, N.; Yamabe, K.; Ogawa, O.; Lee, M.; Amiaka, T.; Kasuya, T.; Watanabe, H.; et al. Modified oxygen vacancy induced fermi level pinning model extendable to P-metal pinning. Jpn. J. Appl. Phys. 2006, 45, L1289–L1291. [Google Scholar] [CrossRef]
- Miyazaki, S. Photoemission study of energy-band alignments and gap-state density distributions for high-k gate dielectrics. J. Vac. Sci. Technol. 2001, B19, 2212–2216. [Google Scholar] [CrossRef]
- Oshima, M.; Toyoda, S.; Okumura, T.; Okabayashi, J.; Kumigashira, H.; Ono, K.; Niwa, M.; Usuda, K.; Hirashita, N. Chemistry and band offsets of HfO2 thin films for gate insulators. Appl. Phys. Lett. 2003, 83, 2172–2175. [Google Scholar] [CrossRef]
- Abe, Y.; Miyata, N.; Ikenaga, E.; Suzuki, H.; Kitamura, K.; Igarashi, S.; Nohira, H. Effect of oxide charge trapping on x-ray photoelectron spectroscopy of HfO2/SiO2/Si structures. Jpn. J. Appl. Phys. 2009, 48, 7999–8004. [Google Scholar]
- Schroder, D.K. Surface voltage and surface photovoltage: History, theory and applications. Meas. Sci. Technol. 2001, 12, R16–R31. [Google Scholar] [CrossRef]
- Miyata, N.; Yasuda, T.; Abe, Y. Kelvin probe study on formation of electric dipole at direct-contact HfO2/Si interfaces. J. Appl. Phys. 2011, 110, 074115:1–074115:8. [Google Scholar] [CrossRef]
- Miyata, N.; Yasuda, T.; Abe, Y. Kelvin probe study of dipole formation and annihilation at the HfO2/Si interface. Appl. Phys. Express 2010, 3, 054101:1–054101:3. [Google Scholar]
- Bardeen, J. Surface states and rectification at a metal semi-conductor contact. Phys. Rev. 1947, 71, 717–727. [Google Scholar] [CrossRef]
- Tersoff, J. Theory of semiconductor heterojunctions: The role of quantum dipoles. Phys. Rev. 1984, B 30, 4874–4877. [Google Scholar] [CrossRef]
- Robertson, J. Band structures and band offsets of high K dielectrics on Si. Appl. Surf. Sci. 2002, 170, 2–7. [Google Scholar] [CrossRef]
- Mönch, W. On the electric-dipole contribution to the valence-band offsets in semiconductor-oxide heterostructures. Appl. Phys. Lett. 2007, 91, 042117:1–042117:3. [Google Scholar] [CrossRef]
- Lambrecht, W.R.L; Segall, B. Self-consistent dipole theory of heterojunction band offsets. Phys. Rev. 1990, B41, 2831–2813. [Google Scholar]
- Tung, R.T. Formation of an electric dipole at metal-semiconductor interfaces. Phys. Rev. 2001, B64, 205310:1–205310:15. [Google Scholar]
- McKee, R.A.; Walker, F.J.; Nardelli, M.B.; Shelton, W.A.; Stocks, G.M. The interface phase and the schottky barrier for a crystalline dielectric on silicon. Science 2003, 300, 1726–1730. [Google Scholar] [CrossRef] [PubMed]
- Nara, Y. Dielectric Films for Advanced Microelectronics; Baklanov, M., Green, M., Maex, K., Eds.; Wiley: New York, NY, USA, 2007; p. 437. [Google Scholar]
- Ota, H.; Hirano, A.; Watanabe, Y.; Yasuda, N.; Iwamoto, K.; Akiyama, K.; Okada, K.; Migita, S.; Nabatame, T.; Toriumi, A. Intrinsic origin of electron mobility reduction in high-k mosfets—From remote phonon to bottom interface dipole scattering. In Proceeding of the IEEE International Electron Devices Meeting, Washington, DC, USA, 10–12 December 2007; pp. 65–68.
- Urabe, Y.; Miyata, N.; Ishii, H.; Itatani, T.; Maeda, T.; Yasuda, T.; Yamada, H.; Fukuhara, N.; Hata, M.; Yokoyama, M.; et al. Correlation between channel mobility improvements and negative Vth shifts in III–V MISFETs: Dipole fluctuation as new scattering mechanism. In Proceeding of the IEEE International Electron Devices Meeting, San Francisco, CA, USA, 6–8 December 2010; pp. 142–145.
- Fischetti, M.V.; Neumayer, D.A; Carter, E.A. Effective electron mobility in Si inversion layers in metal-oxide-semiconductor systems with a high-k insulator: The role of remote phonon scattering. J. Appl. Phys. 2001, 90, 4587–4609. [Google Scholar] [CrossRef]
- Yasuda, N.; Hisamatsu, H.; Ota, H.; Mizubayashi, W.; Toriumi, A. Weak temperature dependence of non-coulomb scattering component of HfAlOx-limited inversion layer mobility in n+-polysilicon/HfAlOx/SiO2 N-channel metal-oxide-semiconductor field-effect transistors. Jpn. J. Appl. Phys. 2005, 44, 7750–7755. [Google Scholar] [CrossRef]
- Weber, O.; Cassé, M.; Thevenod, L.; Ducroquet, F.; Ernst, T.; Deleonibus, S. On the mobility in high-k/metal gate MOSFETs: Evaluation of the high-k phonon scattering impact. Solid-State Electron. 2006, 50, 626–631. [Google Scholar] [CrossRef]
- Ando, T.; Copel, M.; Bruley, J.; Frank, M.; Martin, M.; Watanabe, H.; Narayanan, V. Physical Origins of mobility degradation in extremely scaled SiO2/HfO2 gate stacks with La and Al induced dipoles. Appl. Phys. Lett. 2010, 96, 132904:1–132904:3. [Google Scholar]
- Miyata, N.; Ishii, H.; Itatani, T.; Yasuda, T. Electron mobility degradation and interface dipole formation in direct-contact HfO2/Si metal-oxide-semiconductor field-effect transistors. Appl. Phys. Express 2011, 4, 101101:1–101101:3. [Google Scholar] [CrossRef]
- Zhao, W.; Jena, D. Dipole scattering in highly polar semiconductor alloys. J. Appl. Phys. 2004, 96, 2095–2101. [Google Scholar] [CrossRef]
© 2012 by the authors; licensee MDPI, Basel, Switzerland. This article is an open access article distributed under the terms and conditions of the Creative Commons Attribution license (http://creativecommons.org/licenses/by/3.0/).
Share and Cite
Miyata, N. Study of Direct-Contact HfO2/Si Interfaces. Materials 2012, 5, 512-527. https://doi.org/10.3390/ma5030512
Miyata N. Study of Direct-Contact HfO2/Si Interfaces. Materials. 2012; 5(3):512-527. https://doi.org/10.3390/ma5030512
Chicago/Turabian StyleMiyata, Noriyuki. 2012. "Study of Direct-Contact HfO2/Si Interfaces" Materials 5, no. 3: 512-527. https://doi.org/10.3390/ma5030512
APA StyleMiyata, N. (2012). Study of Direct-Contact HfO2/Si Interfaces. Materials, 5(3), 512-527. https://doi.org/10.3390/ma5030512


