3.1. DSC Analysis
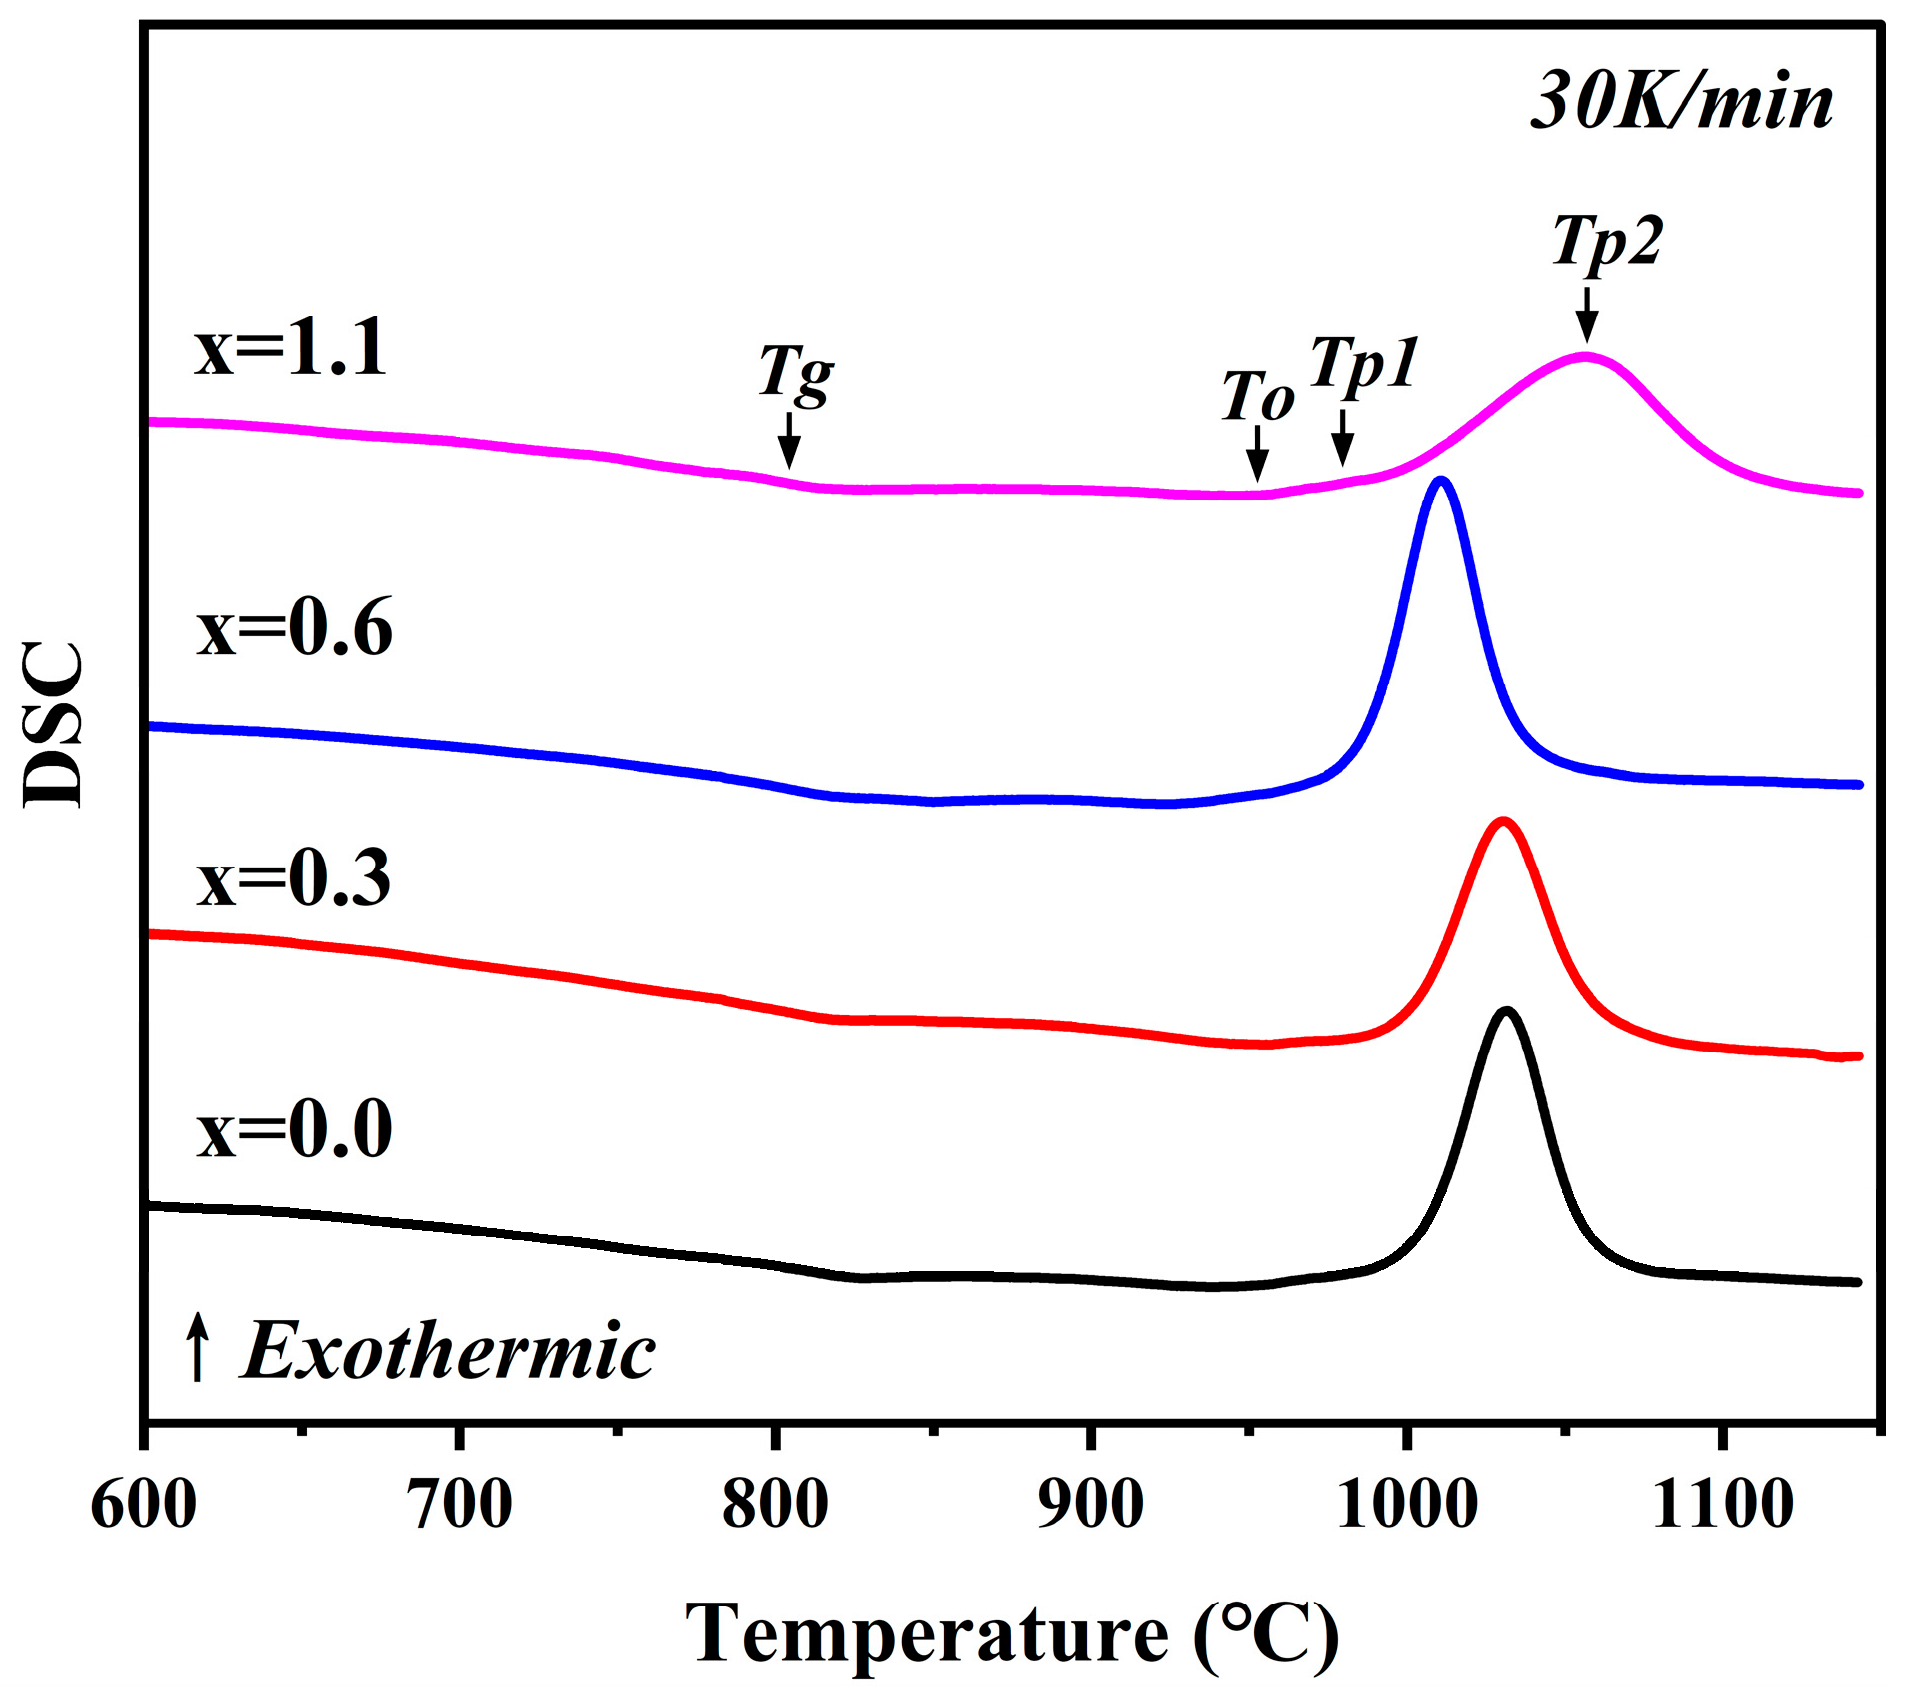
Figure 1 illustrates the DSC curves of the MAS parent glasses with varying Na
2O additions, measured at a heating rate of 30 °C/min. It can be observed that, within the temperature range of 750 °C to 1100 °C, all glass samples exhibit similar thermal response behaviors, characterized by an endothermic glass transition region followed by two exothermic crystallization peaks. Based on the subsequent XRD analysis of the glass-ceramic samples, the first exothermic peak corresponds to the crystallization of the metastable μ-cordierite phase, while the second exothermic peak corresponds to the crystallization of α-cordierite.
Table 3 systematically summarizes the key thermodynamic parameters of the parent glasses, which are determined by their chemical compositions and structural characteristics.
As indicated in
Figure 1 and
Table 3, with the Na
2O addition gradually increasing from 0 wt.% to 0.6 wt.%, the glass transition temperature (
Tg), the onset crystallization temperature (
To), the crystallization peak temperature of μ-cordierite (
Tp1), and the crystallization peak temperature of α-cordierite (
Tp2) all shift toward lower temperatures. However, when the Na
2O addition is further increased to 1.1 wt.%, while
Tg continues to shift toward lower temperatures, both
To,
Tp1 and
Tp2 shift toward higher temperatures. This indicates that the addition of Na
2O can promote the precipitation of cordierite crystals at lower temperatures; however, this promotional effect does not follow a monotonic relationship. Excessive Na
2O, conversely, inhibits the formation of cordierite crystals, even though the glass transition process of the parent glass is completed at a lower temperature.
Na
2O is a typical network modifier in aluminosilicate glass systems. Upon incorporation into the glass structure, it disrupts part of the bridging oxygen bonds (BO), such as Si-O-Si and Al-O-Si linkages, and promotes the formation of additional non-bridging oxygens, thereby reducing the degree of polymerization and connectivity of the glass network [
19,
20]. As network depolymerization intensifies, the rigidity of the structural framework weakens and the average bond strength decreases, which lowers the kinetic barrier that must be overcome for cooperative structural relaxation during the glass transition [
21]. Consequently, the base glass can complete the glass transition at a lower temperature, macroscopically manifested as a shift of
Tg toward lower temperatures.
The crystallization behavior of the parent glass is co-regulated by multiple factors, including glass composition, network structure, and ion diffusion kinetics [
19,
20]. As a typical glass network modifier, the introduction of Na
2O weakens and partially depolymerizes the original three-dimensional network structure of the parent glass. This leads to a decrease in the content of BO and an increase in the content of non-bridging oxygens (NBO), thereby reducing the overall degree of polymerization of the glass network [
21]. These variations in glass structure are verified by the subsequent semi-quantitative analysis of the relative contents of BO and NBO via FTIR and XPS. Furthermore, due to the low cationic field strength of Na
+, its ability to polarize oxygen ions is limited; the resulting weak ionic bonds cannot maintain high skeletal rigidity, leading to a decline in structural stability. This structural weakening is inferred to reduce the melt viscosity and the kinetic barrier for particle migration [
22,
23,
24]. Consequently, the diffusion and rearrangement of nucleating components such as Mg
2+ and Al
3+ are accelerated, facilitating nucleation and crystal growth, which is macroscopically manifested as a decrease in crystallization temperature. However, for the sample with x = 1.1, the rebound in crystallization temperature may be attributed to the thermodynamic inhibition effect overriding the kinetic promotion effect. According to classical nucleation theory, the introduction of excessive Na
+ lowers the free energy of the melt, thereby reducing the free energy difference relative to the cordierite crystal phase [
25,
26,
27]. This, in turn, diminishes the thermodynamic driving force for the transformation from the liquid phase to the crystalline phase. In addition, the presence of a large amount of Na
+ may also reduce the compatibility between the local structure of the glass melt and the cordierite crystal structure, as well as create diffusion hindrance to crystal growth [
25,
26,
27]. This increases the crystal-liquid interfacial energy and the nucleation barrier. Simultaneously, excessive Na
+ promotes the formation of Na-containing impurity phases. The competitive relationship between these crystal phases also inhibits the formation of cordierite crystals. This hypothesis is supported by the subsequent detection of the nepheline phase in the XRD analysis of the glass-ceramic samples. Consequently, this is macroscopically manifested as an increase in the crystallization temperature of the glass.
3.2. Non-Isothermal Crystallization Kinetics
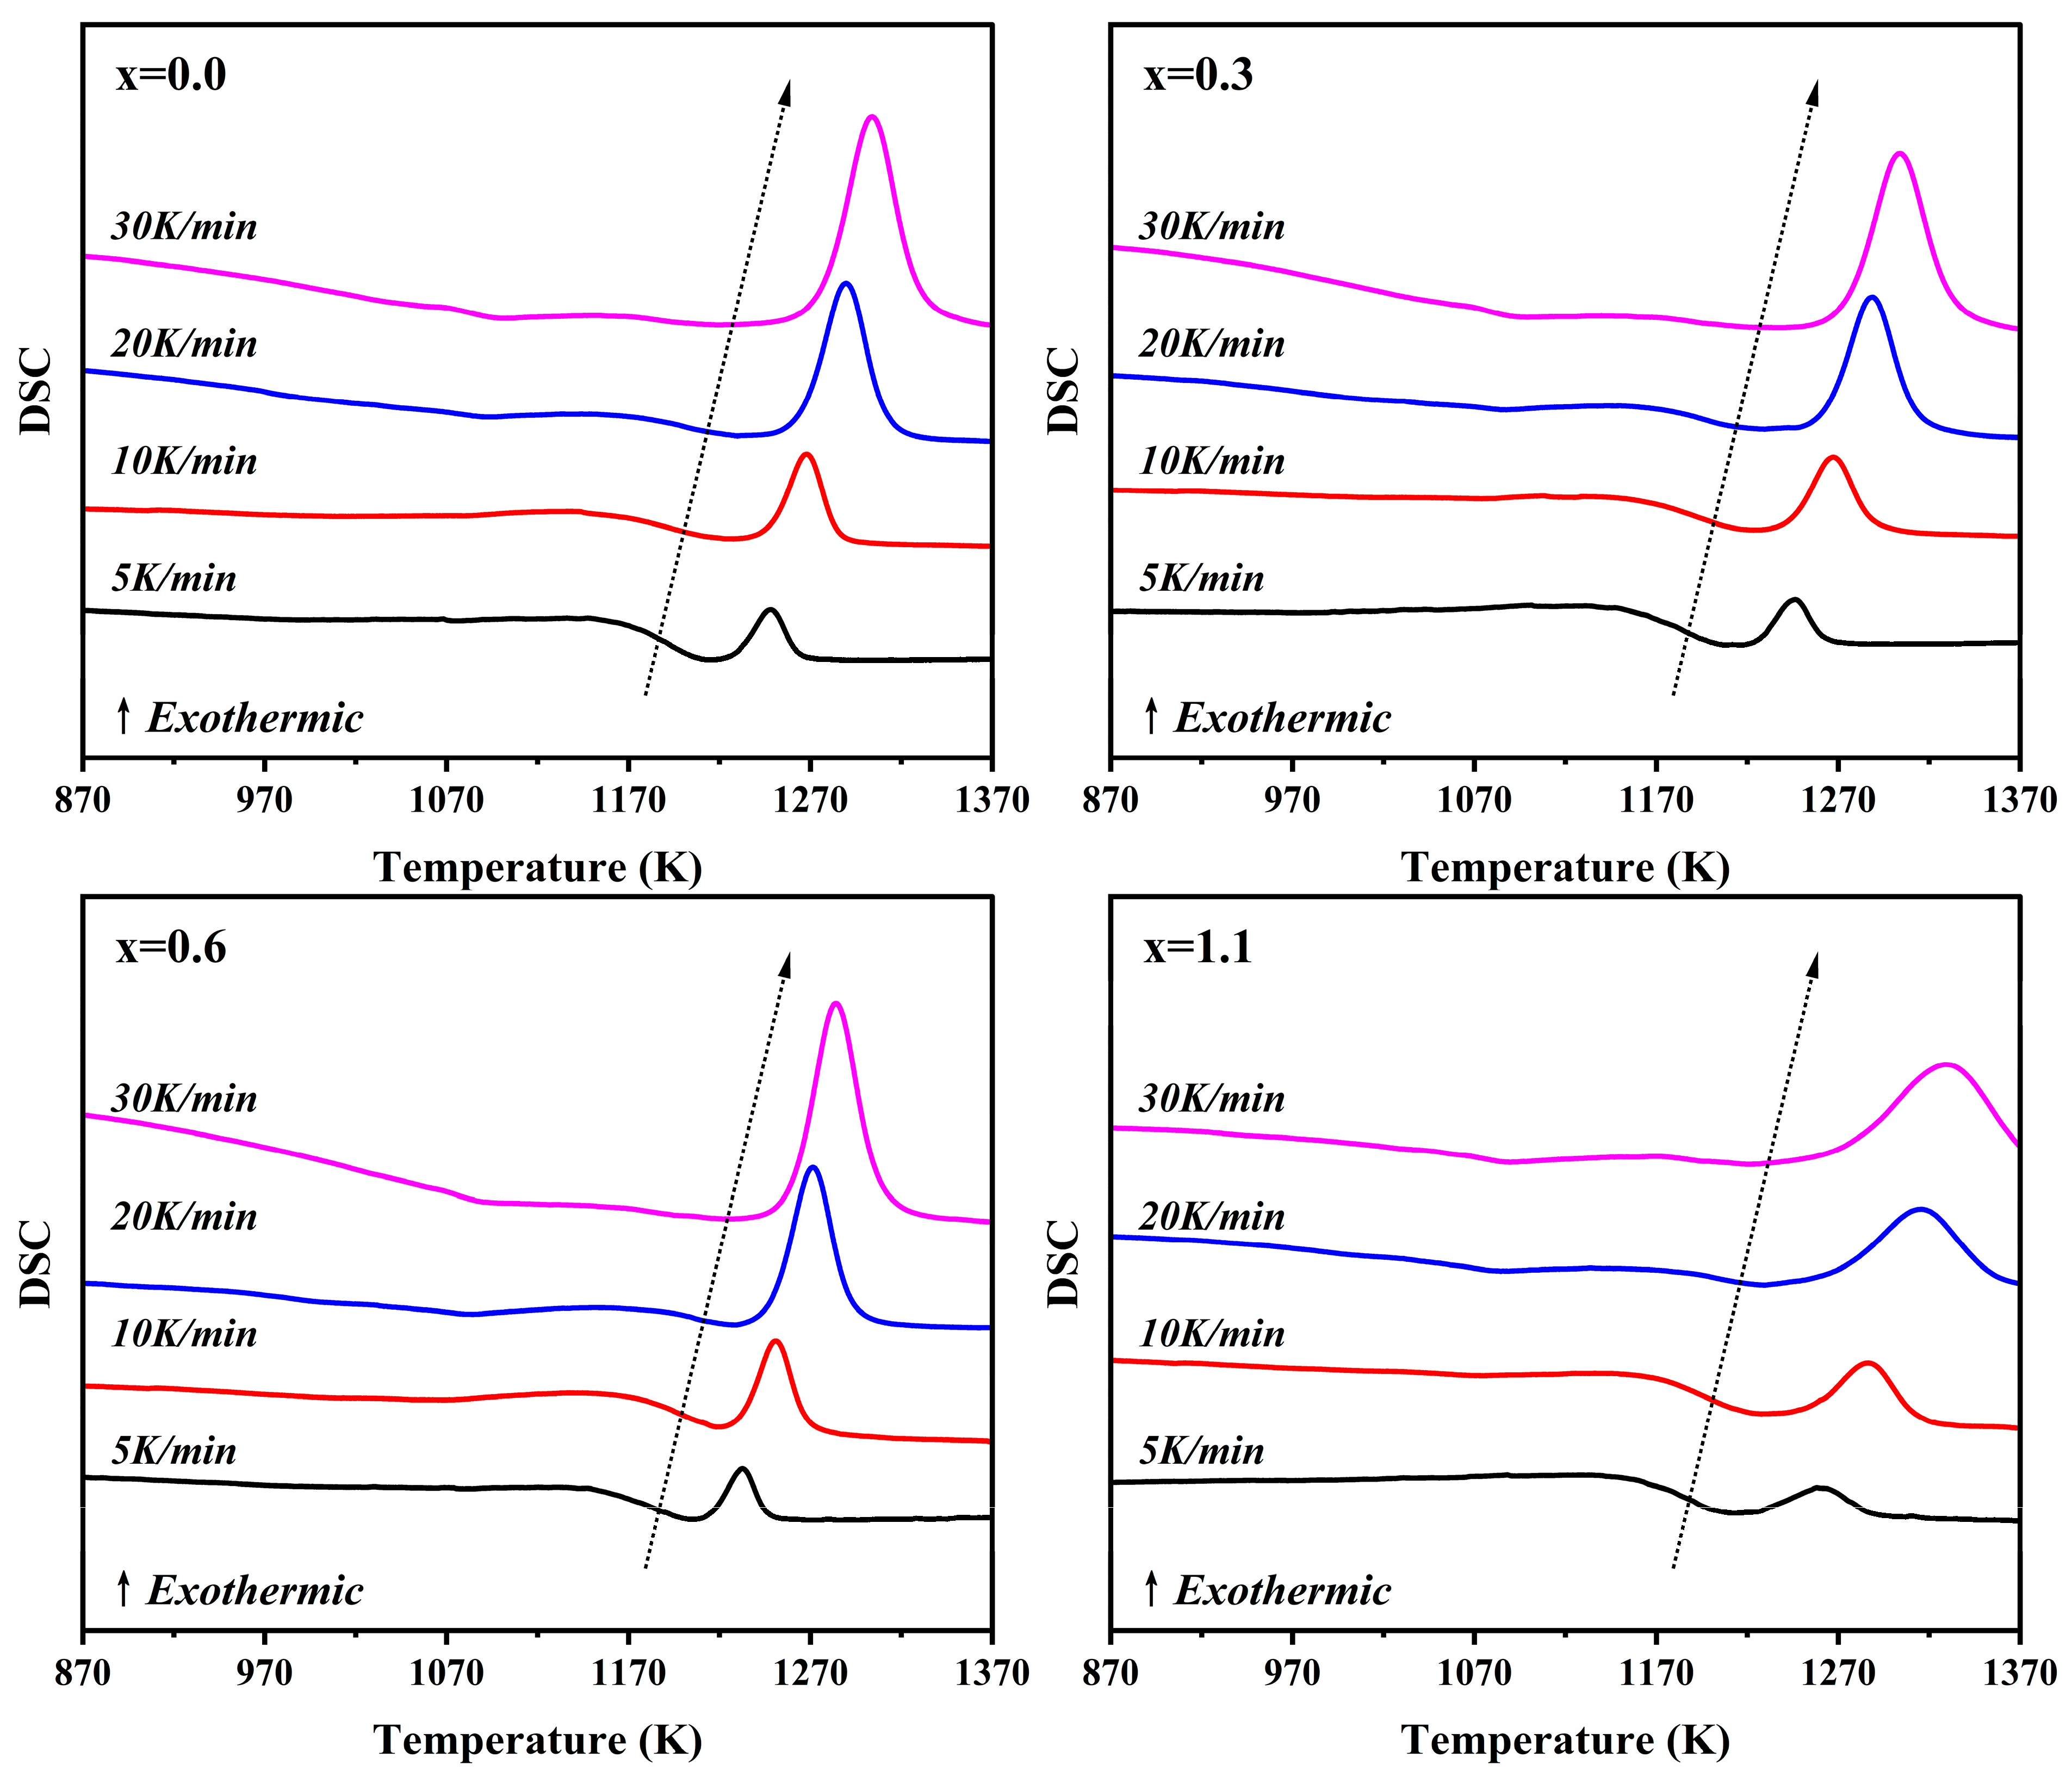
Figure 2 presents the DSC curves of parent glasses with varying Na
2O additions, measured at different heating rates (
β = 5, 10, 20 and 30 °C/min). From
Figure 2, it can be observed that for a given sample,
Tp shifts toward higher temperatures as
β increases. This is a typical phenomenon in non-isothermal crystallization kinetics. Under linear heating conditions, the variation of the crystallization conversion fraction, α, can be expressed by Equation (1) [
28,
29]. At the same temperature
T, a larger
β results in a smaller d
α/d
T. During the heating process, the system is unable to complete sufficient nucleation and early-stage growth within the lower temperature range in time, leading to a reduction in the actual conversion fraction at any given temperature.
where
α is the fraction of crystallization (conversion percentage),
β is the heating rate, and k(
T) is the reaction rate constant.
The crystallization activation energy (
E) refers to the energy barrier that structural units must overcome to rearrange during the transition from the glassy state to the crystalline state. It serves as a critical indicator for evaluating the crystallization capability of the parent glass. To deeply investigate the dynamic modulation effect of Na
2O on the crystallization behavior of cordierite glass-ceramics, this study calculated
E using the Kissinger [
30] and Ozawa [
31] methods based on multi-heating-rate DSC data (
β = 5, 10, 20 and 30 °C/min). Furthermore, the Avrami exponent (
n) was calculated by combining these results with the Matusita–Sakka model [
32] to characterize the non-isothermal nucleation and crystallization mechanisms. The Kissinger and Ozawa equations are given as follows:
where
Tp is the peak crystallization temperature,
β is the heating rate, and
R is the ideal gas constant.
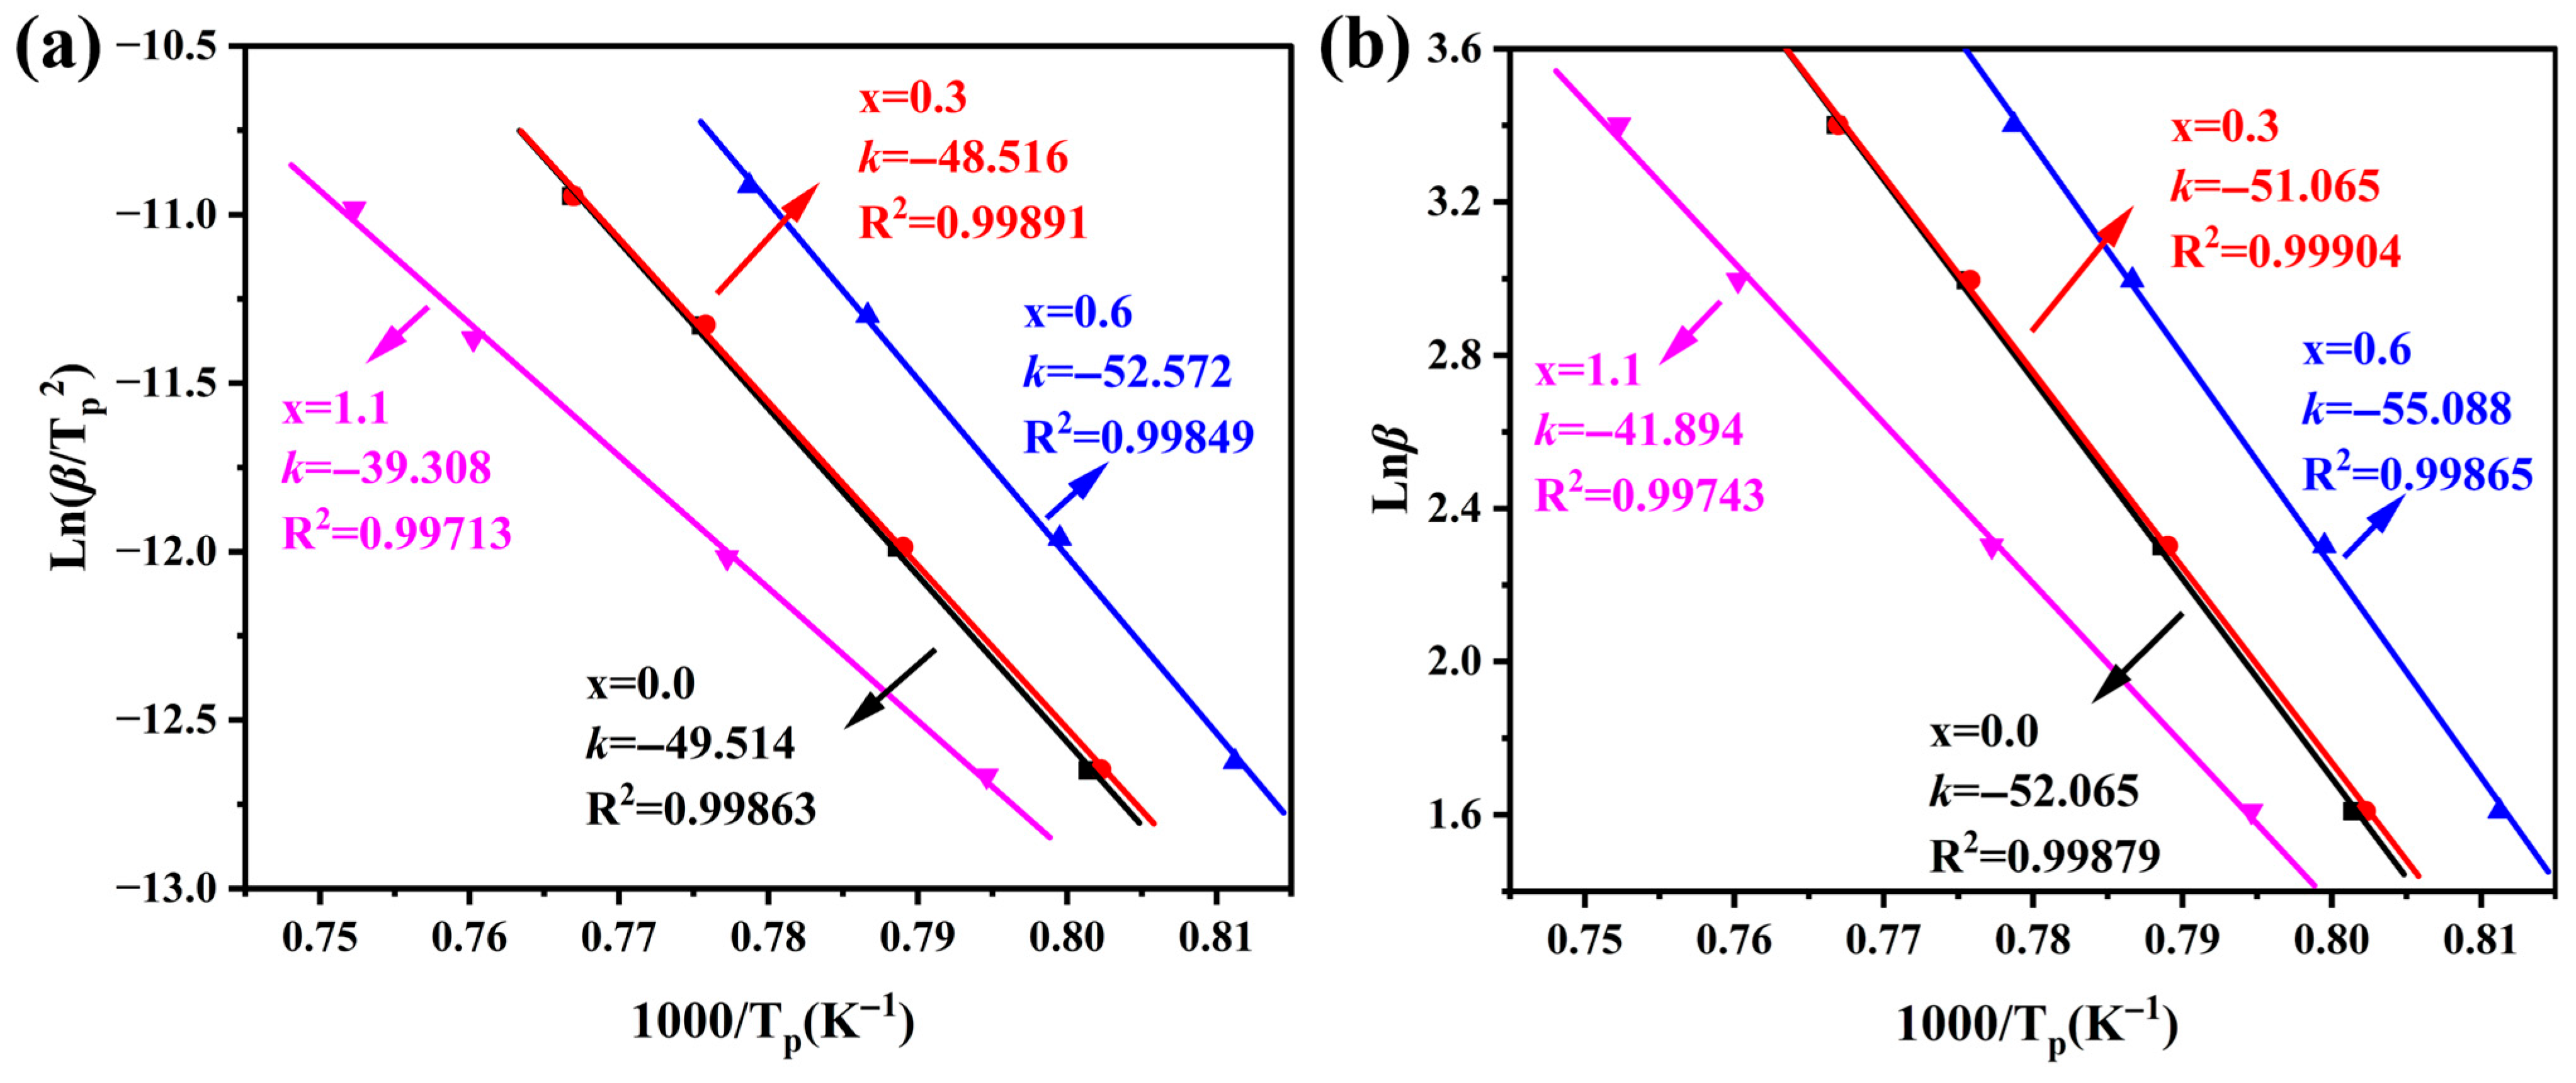
The Kissinger and Ozawa methods derive
E through the linear fitting of ln(
β/
Tp2) versus 1000/
Tp and ln
β versus 1000/
Tp, respectively. The corresponding linear fitting results are illustrated in
Figure 3, and the specific calculated
E values for α-cordierite are listed in
Table 4. As the Na
2O addition increases,
E of α-cordierite generally exhibits a downward trend. This indicates that the addition of Na
2O lowers the crystallization energy barrier for α-cordierite, facilitating its precipitation at lower temperatures. It is worth noting that the sample with x = 0.6 exhibits a relatively larger
E, which may be related to changes in the crystallization behavior of the metastable intermediate phase, μ-cordierite, at this composition. If the formation of the intermediate μ-cordierite phase is inhibited, the number of heterogeneous nucleation sites it can provide decreases, thereby resulting in a higher observed crystallization energy barrier for α-cordierite. It is noteworthy that the activation energy values obtained by the Kissinger and Ozawa methods are relatively close, and both exhibit a consistent variation trend with increasing Na
2O addition, indicating that the non-isothermal crystallization kinetics analysis in this study possesses good internal consistency and reliability.
The crystal volume fraction
x can be expressed as [
33,
34]:
where
To and
Te are the onset and end temperatures of crystallization, respectively, ∆
HT is the crystallization enthalpy in the temperature range from
To to
T, and ∆
H is the total enthalpy of crystallization.
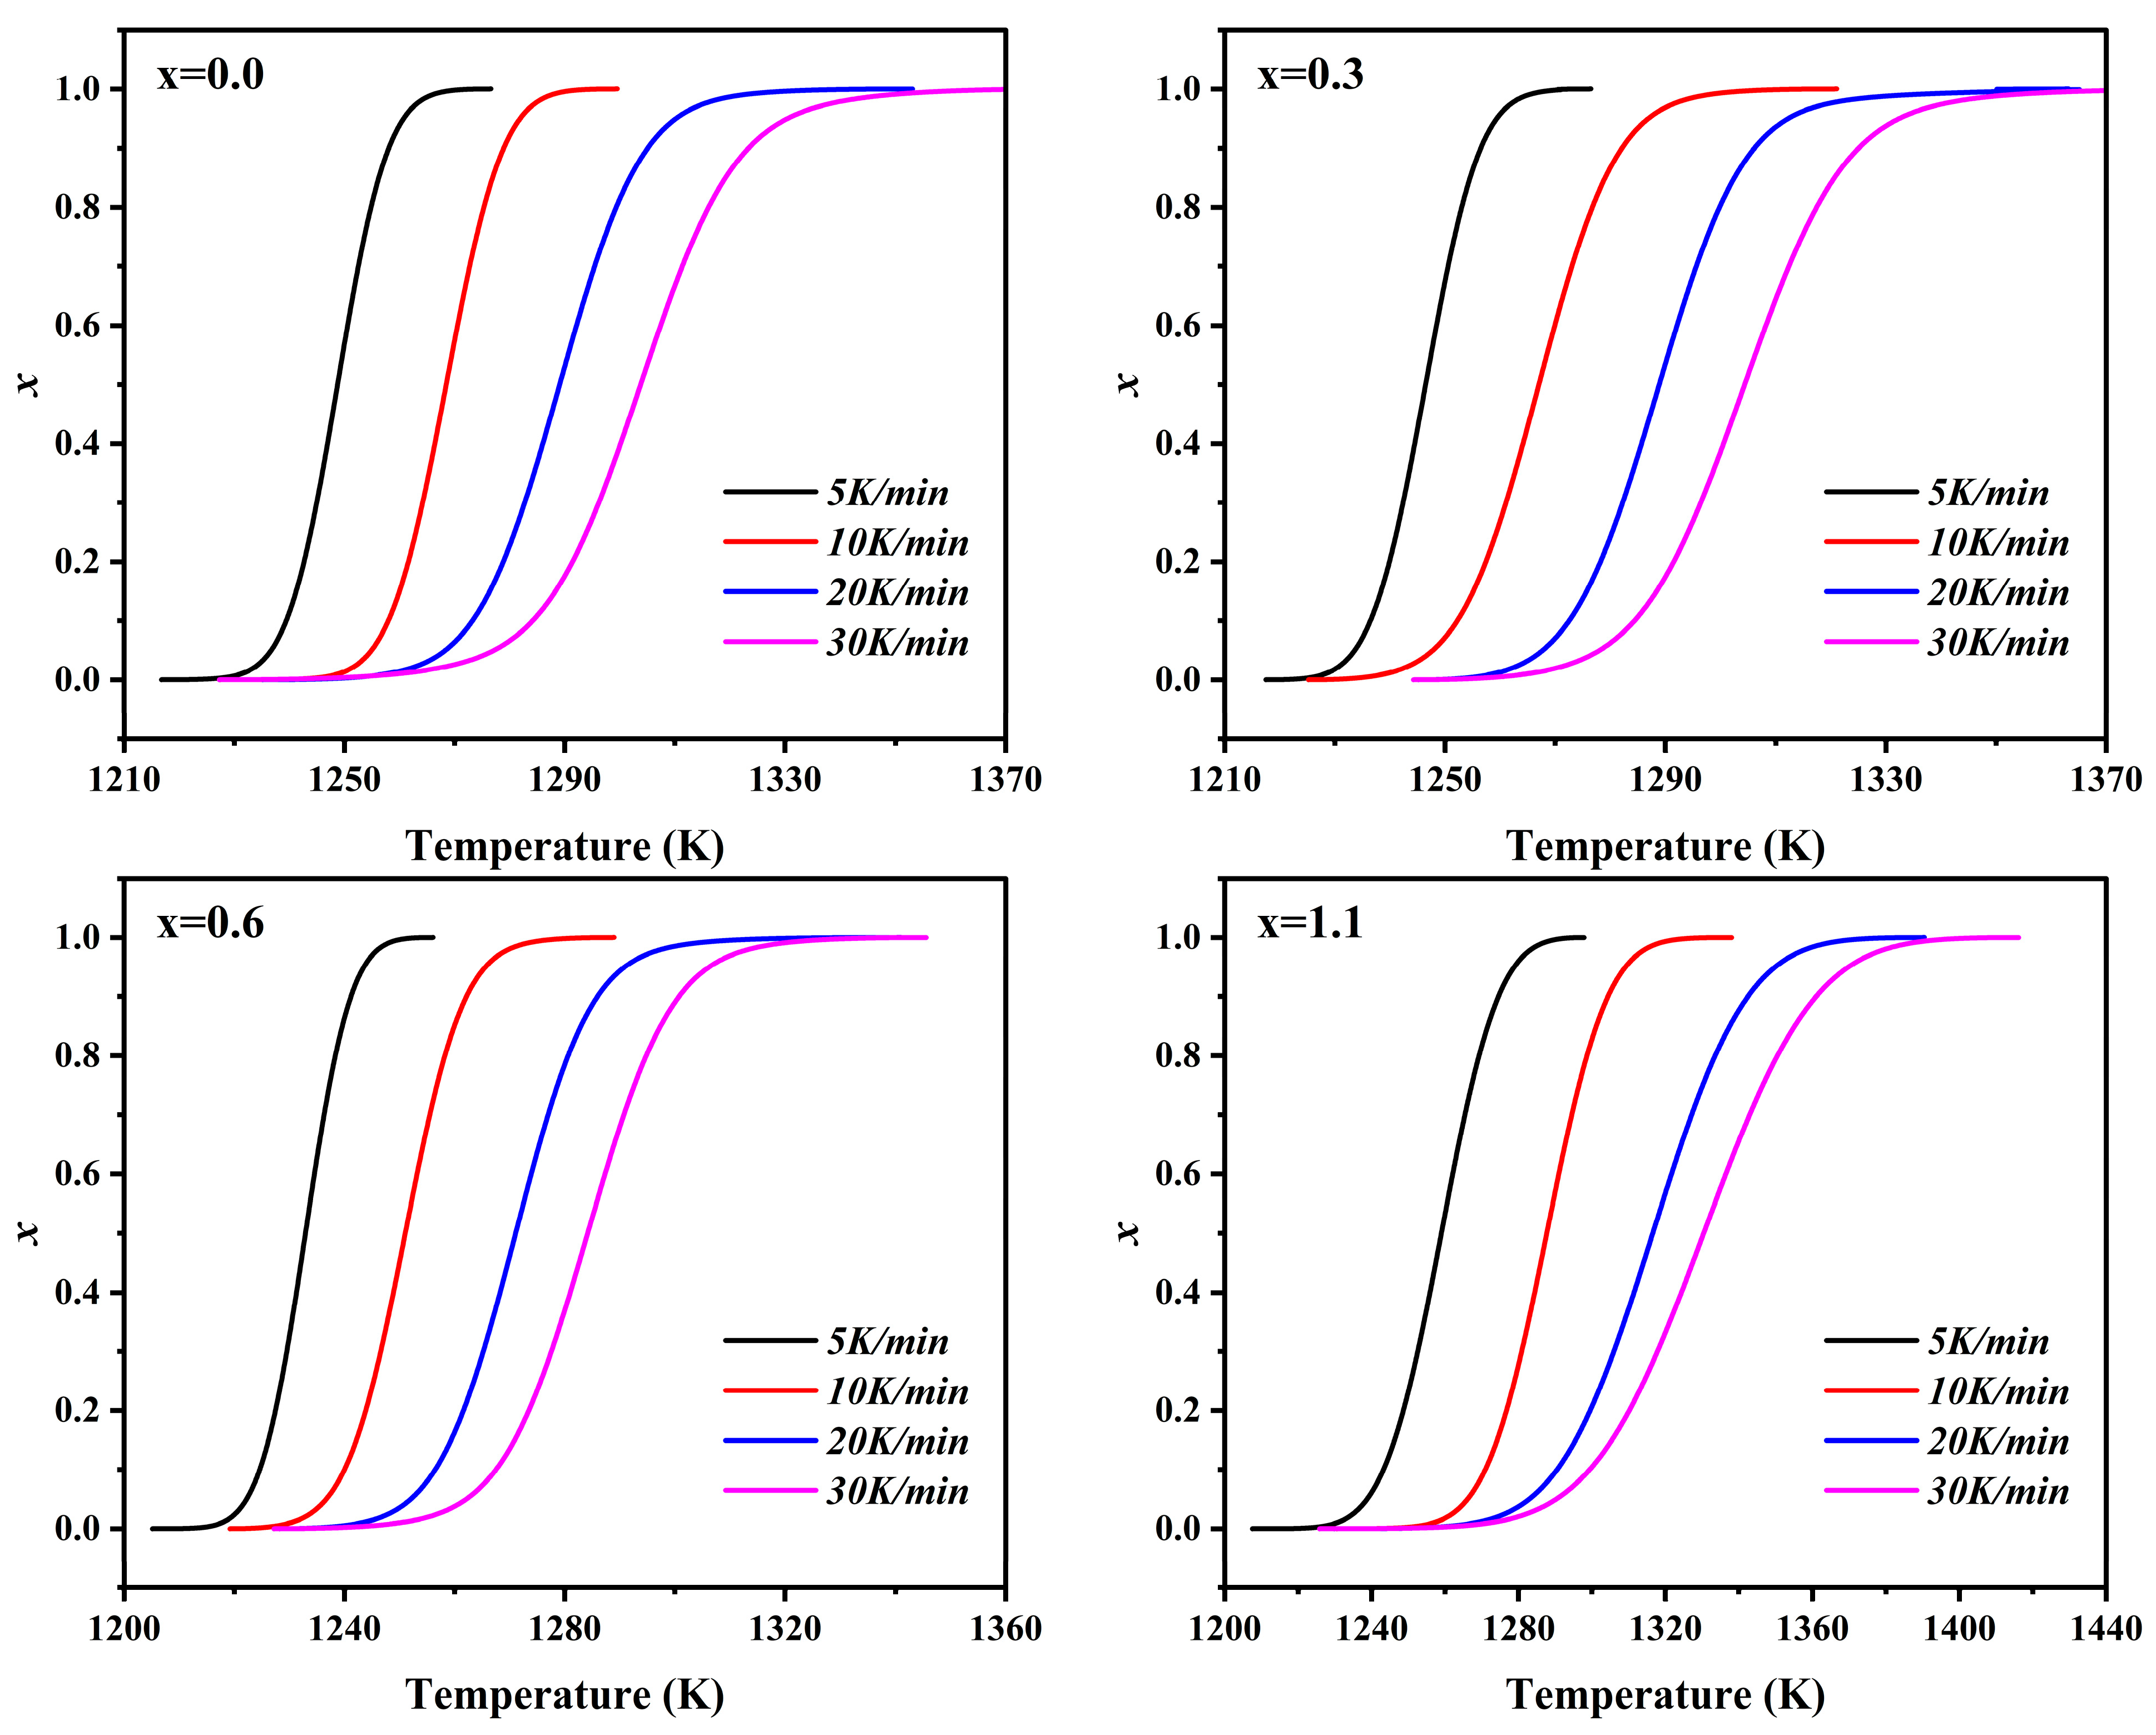
Figure 4 shows the crystallized volume fraction (
x) versus temperature (
T) curves for parent glasses with varying Na
2O additions at different heating rates. The slope of the
x–
T curves in the figure reflects the crystallization rate of the parent glass. The
x–
T curves for all samples exhibit a typical sigmoidal shape, and the crystallization process can generally be summarized into three stages. In the initial stage of crystallization (
x < 0.2), the high viscosity of the glass melt restricts atomic diffusion and rearrangement, resulting in a low crystallization rate. As the temperature rises, both the atomic diffusion rate and nucleation efficiency increase rapidly, leading to a sharp increase in the crystallization rate; this marks the entry into the rapid crystallization stage (
x = 0.2–0.8). In the final stage of crystallization (
x = 0.8–1.0), the impingement effect of adjacent crystal grains and the substantial consumption of crystallizable components extend the diffusion path, causing the crystallization rate to gradually decay and approach zero [
35].
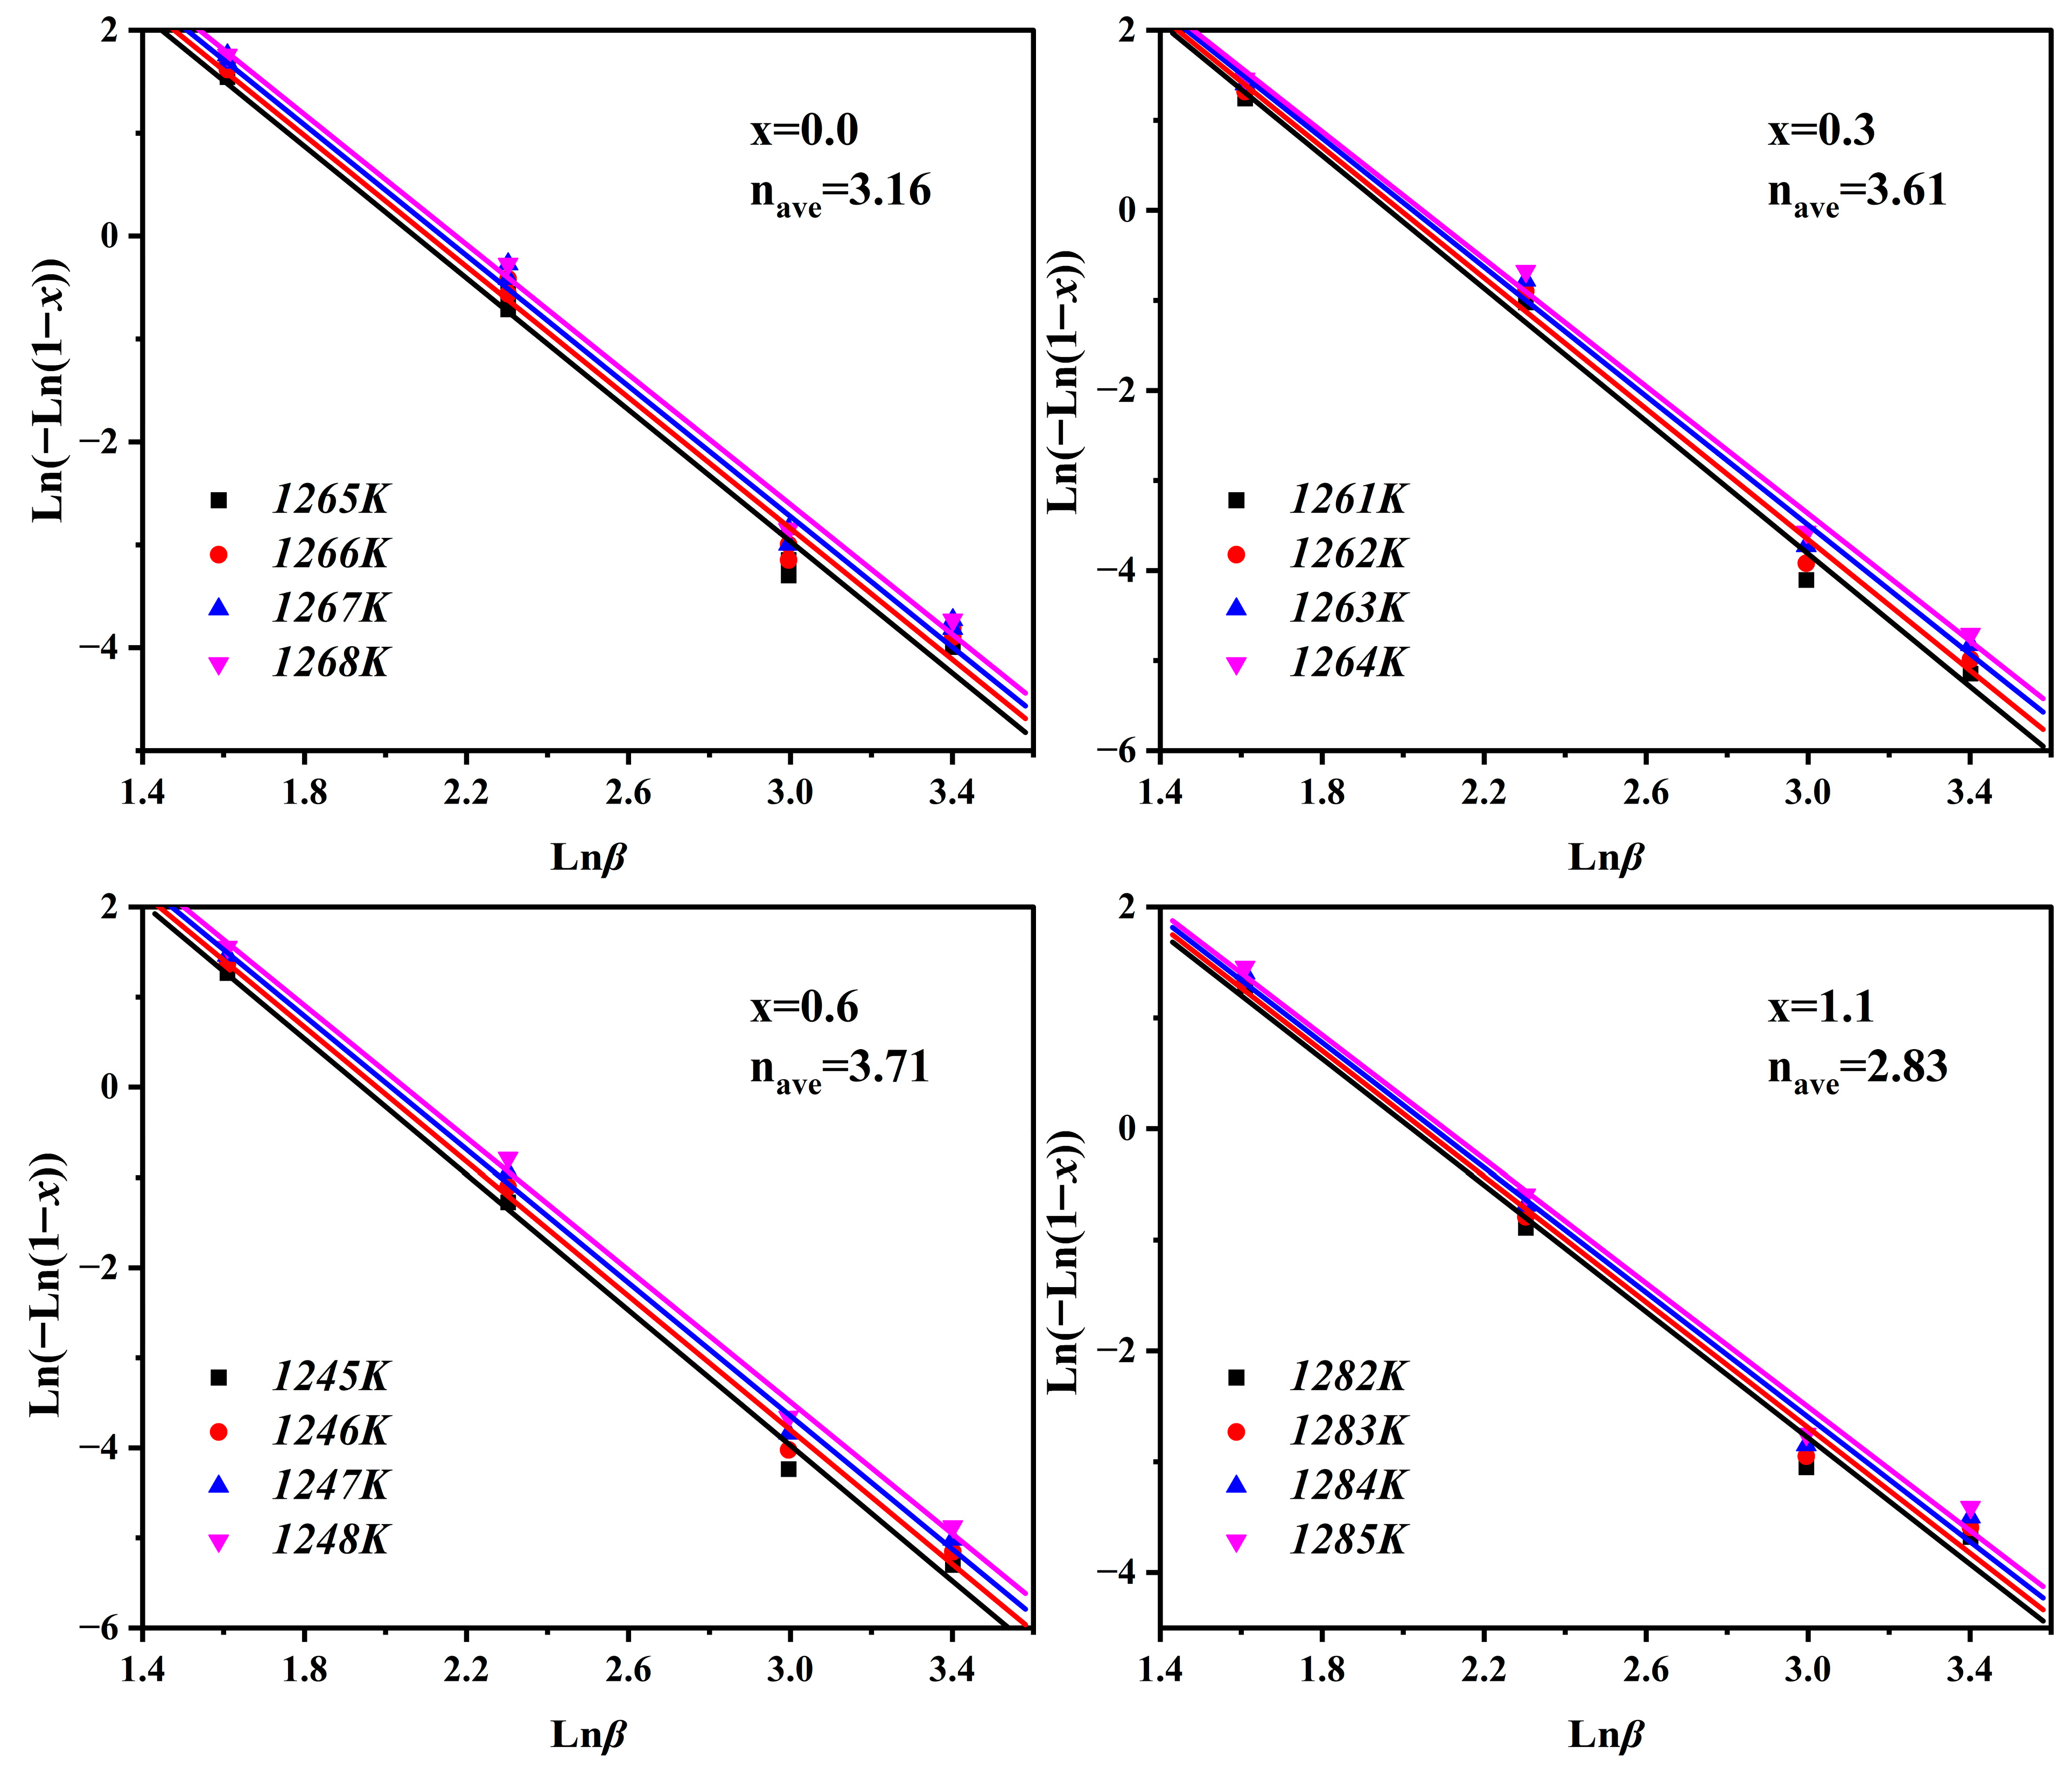
N serves as a pivotal parameter in elucidating crystallization mechanisms, as its numerical value quantitatively characterizes both the dimensionality of crystal growth and the temporal dependence of the nucleation rate. The classical Matusita–Sakka equation is used to calculate the n of the samples [
32]:
where
x is the crystallization volume fraction,
n is the Avrami index,
β is the heating rate,
E is the crystallization activation energy, and
R is the ideal gas constant. Then, ln[−ln(1 −
x)] is plotted against in
β, and the derived data points are linearly fitted through the least squares method, leading to the slope of the line, i.e., the −
n value.
As derived from
Figure 5, the average Avrami exponent values (
nave) for samples with varying Na
2O additions are 3.16, 3.61, 3.71, and 2.83, respectively. This indicates that the crystallization process of the parent glass is dominated by three-dimensional bulk crystal growth. Furthermore, the samples with x = 0.0, 0.3, and 0.6 exhibit
nave > 3, suggesting that nucleation in these samples is interface-controlled. In contrast, the sample with x = 1.1 has
nave < 3, indicating that its nucleation is diffusion-controlled [
30,
31,
32]. As x increases from 0.0 to 0.6, nave increases from 3.16 to 3.71, implying that with the addition of Na
2O, the nucleation behavior of the parent glass may gradually transition from a mechanism closer to site saturation toward continuous nucleation [
36].
To verify the validity of the non-isothermal crystallization kinetics calculations,
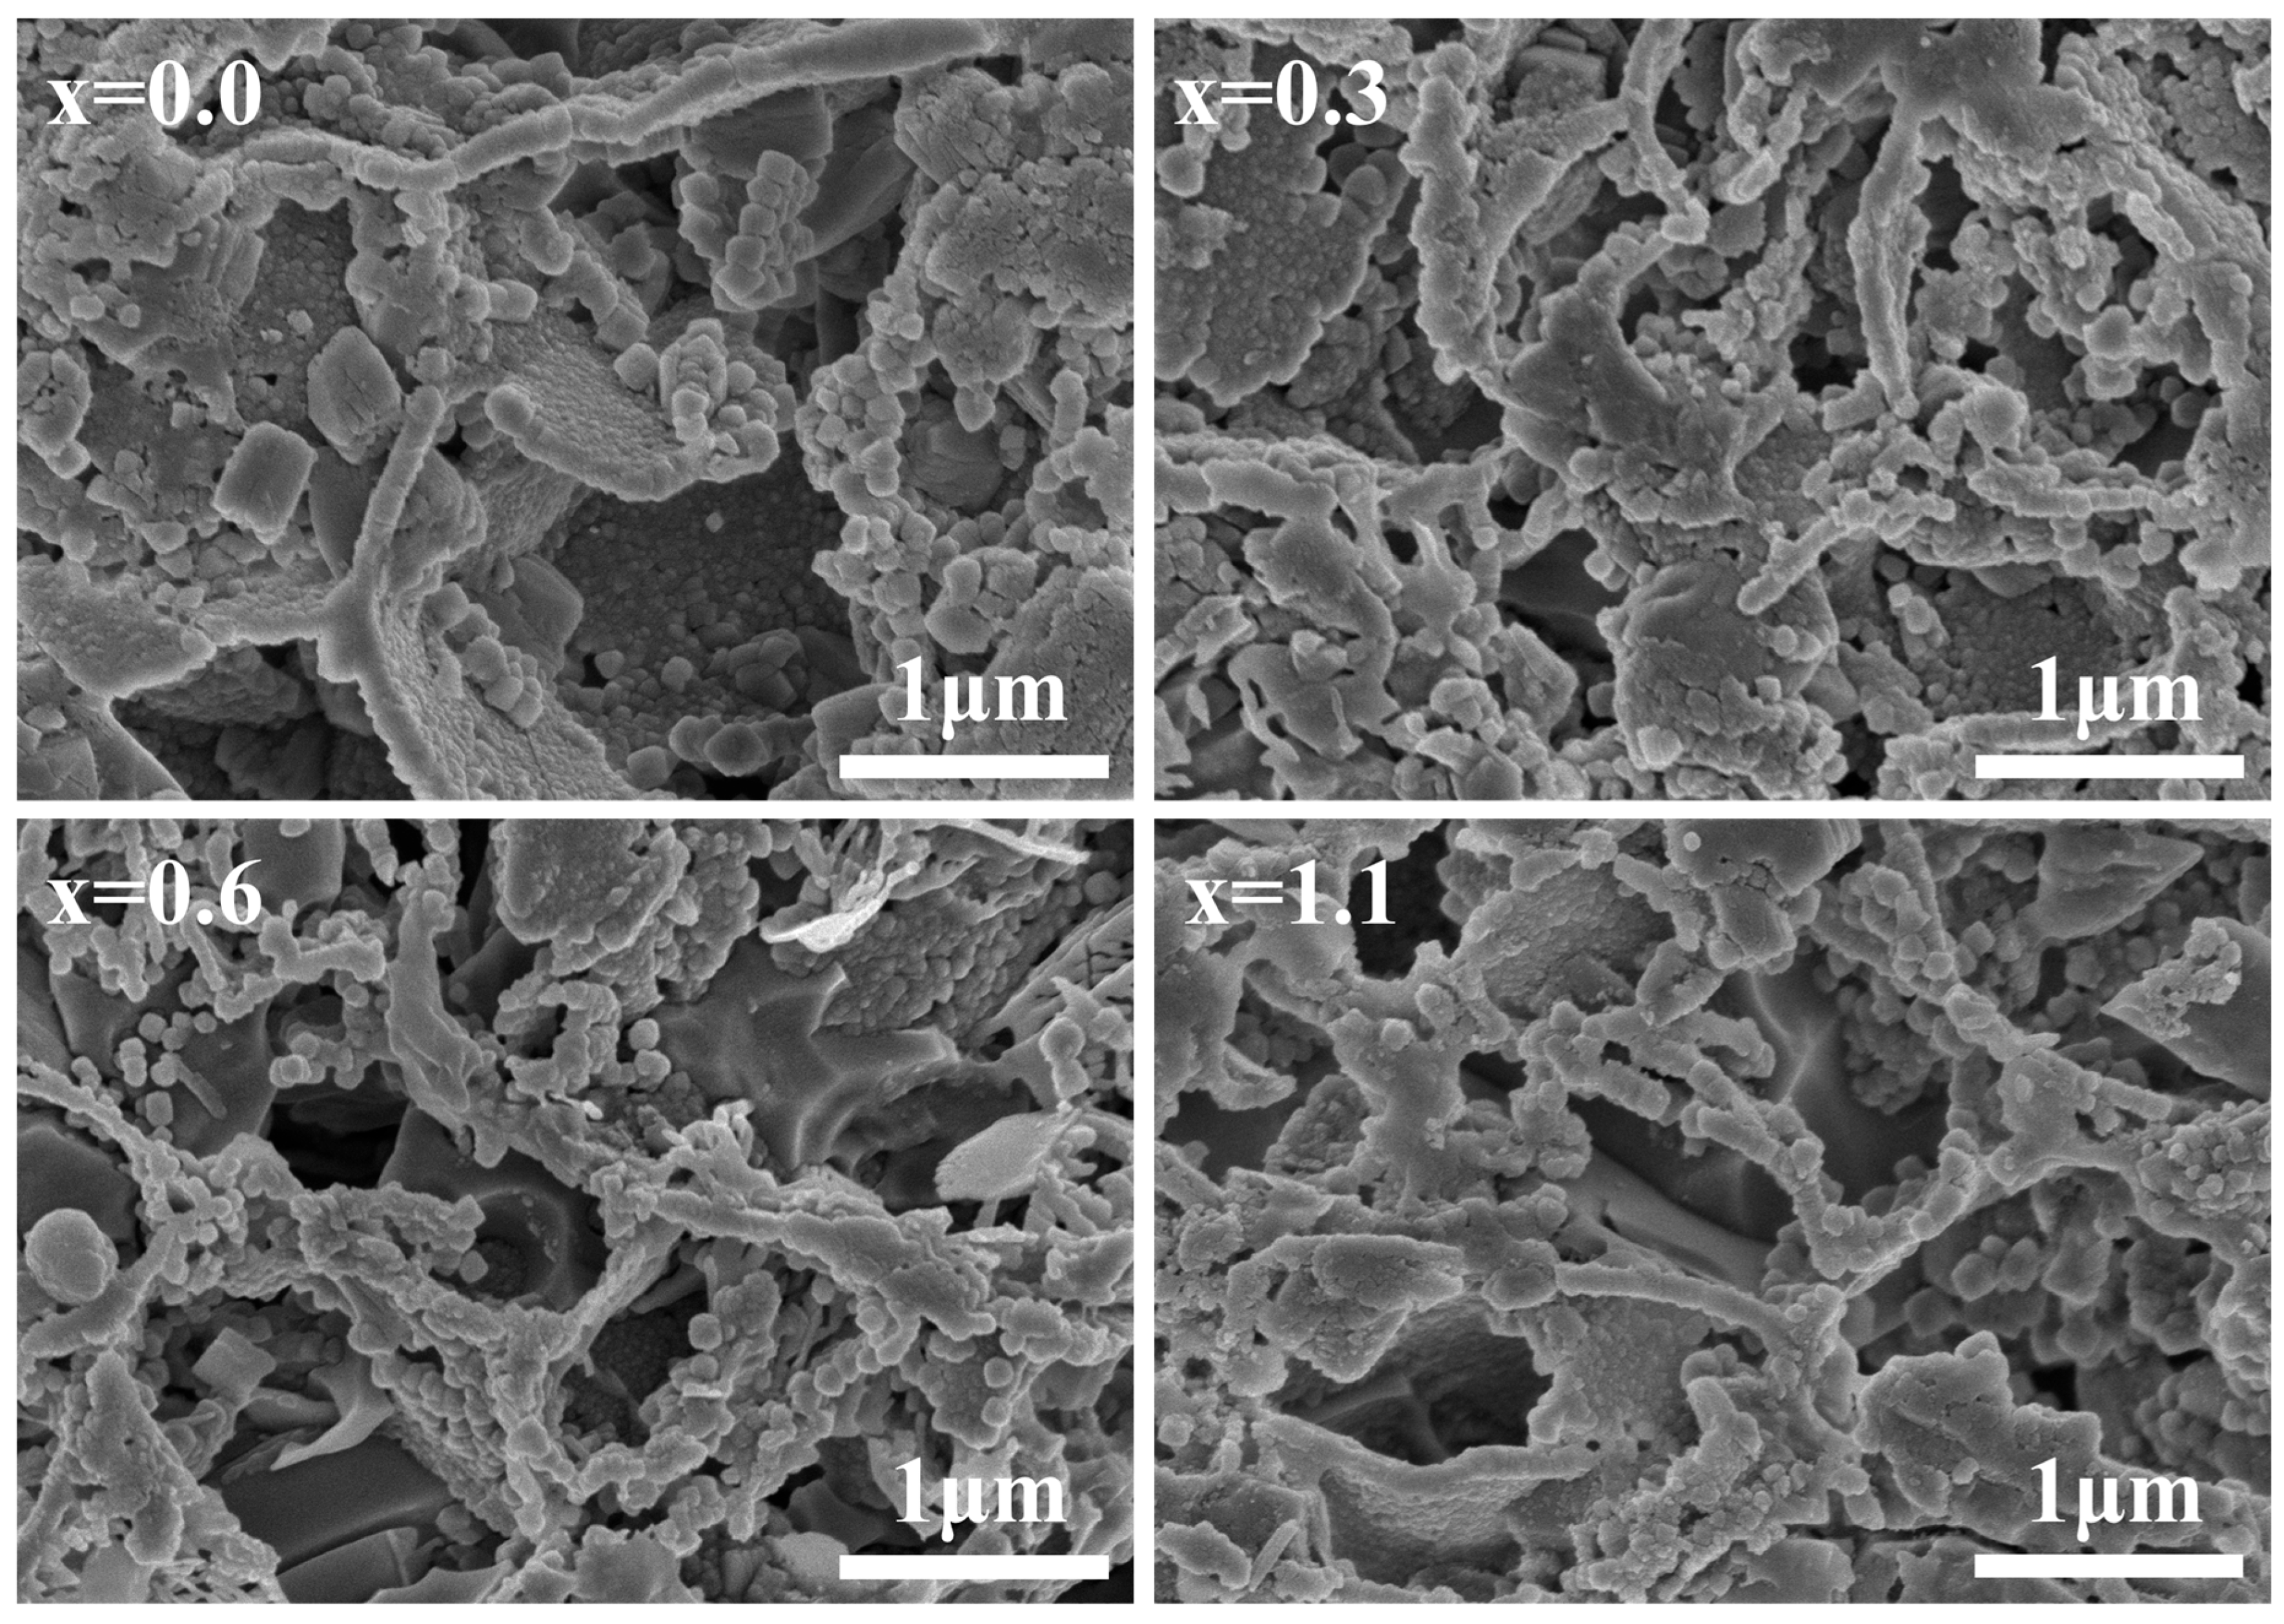
Figure 6 presents the SEM morphologies of acid-etched cordierite glass-ceramics prepared from parent glasses with varying Na
2O additions at their respective optimal sintering temperatures. It can be observed that the crystal grains in all glass-ceramics are interconnected in space and exhibit a dense three-dimensional packing structure within the glass matrix. This is consistent with the three-dimensional crystal growth mechanism inferred from
n.
3.3. Phase Evolution and Crystallization Behavior
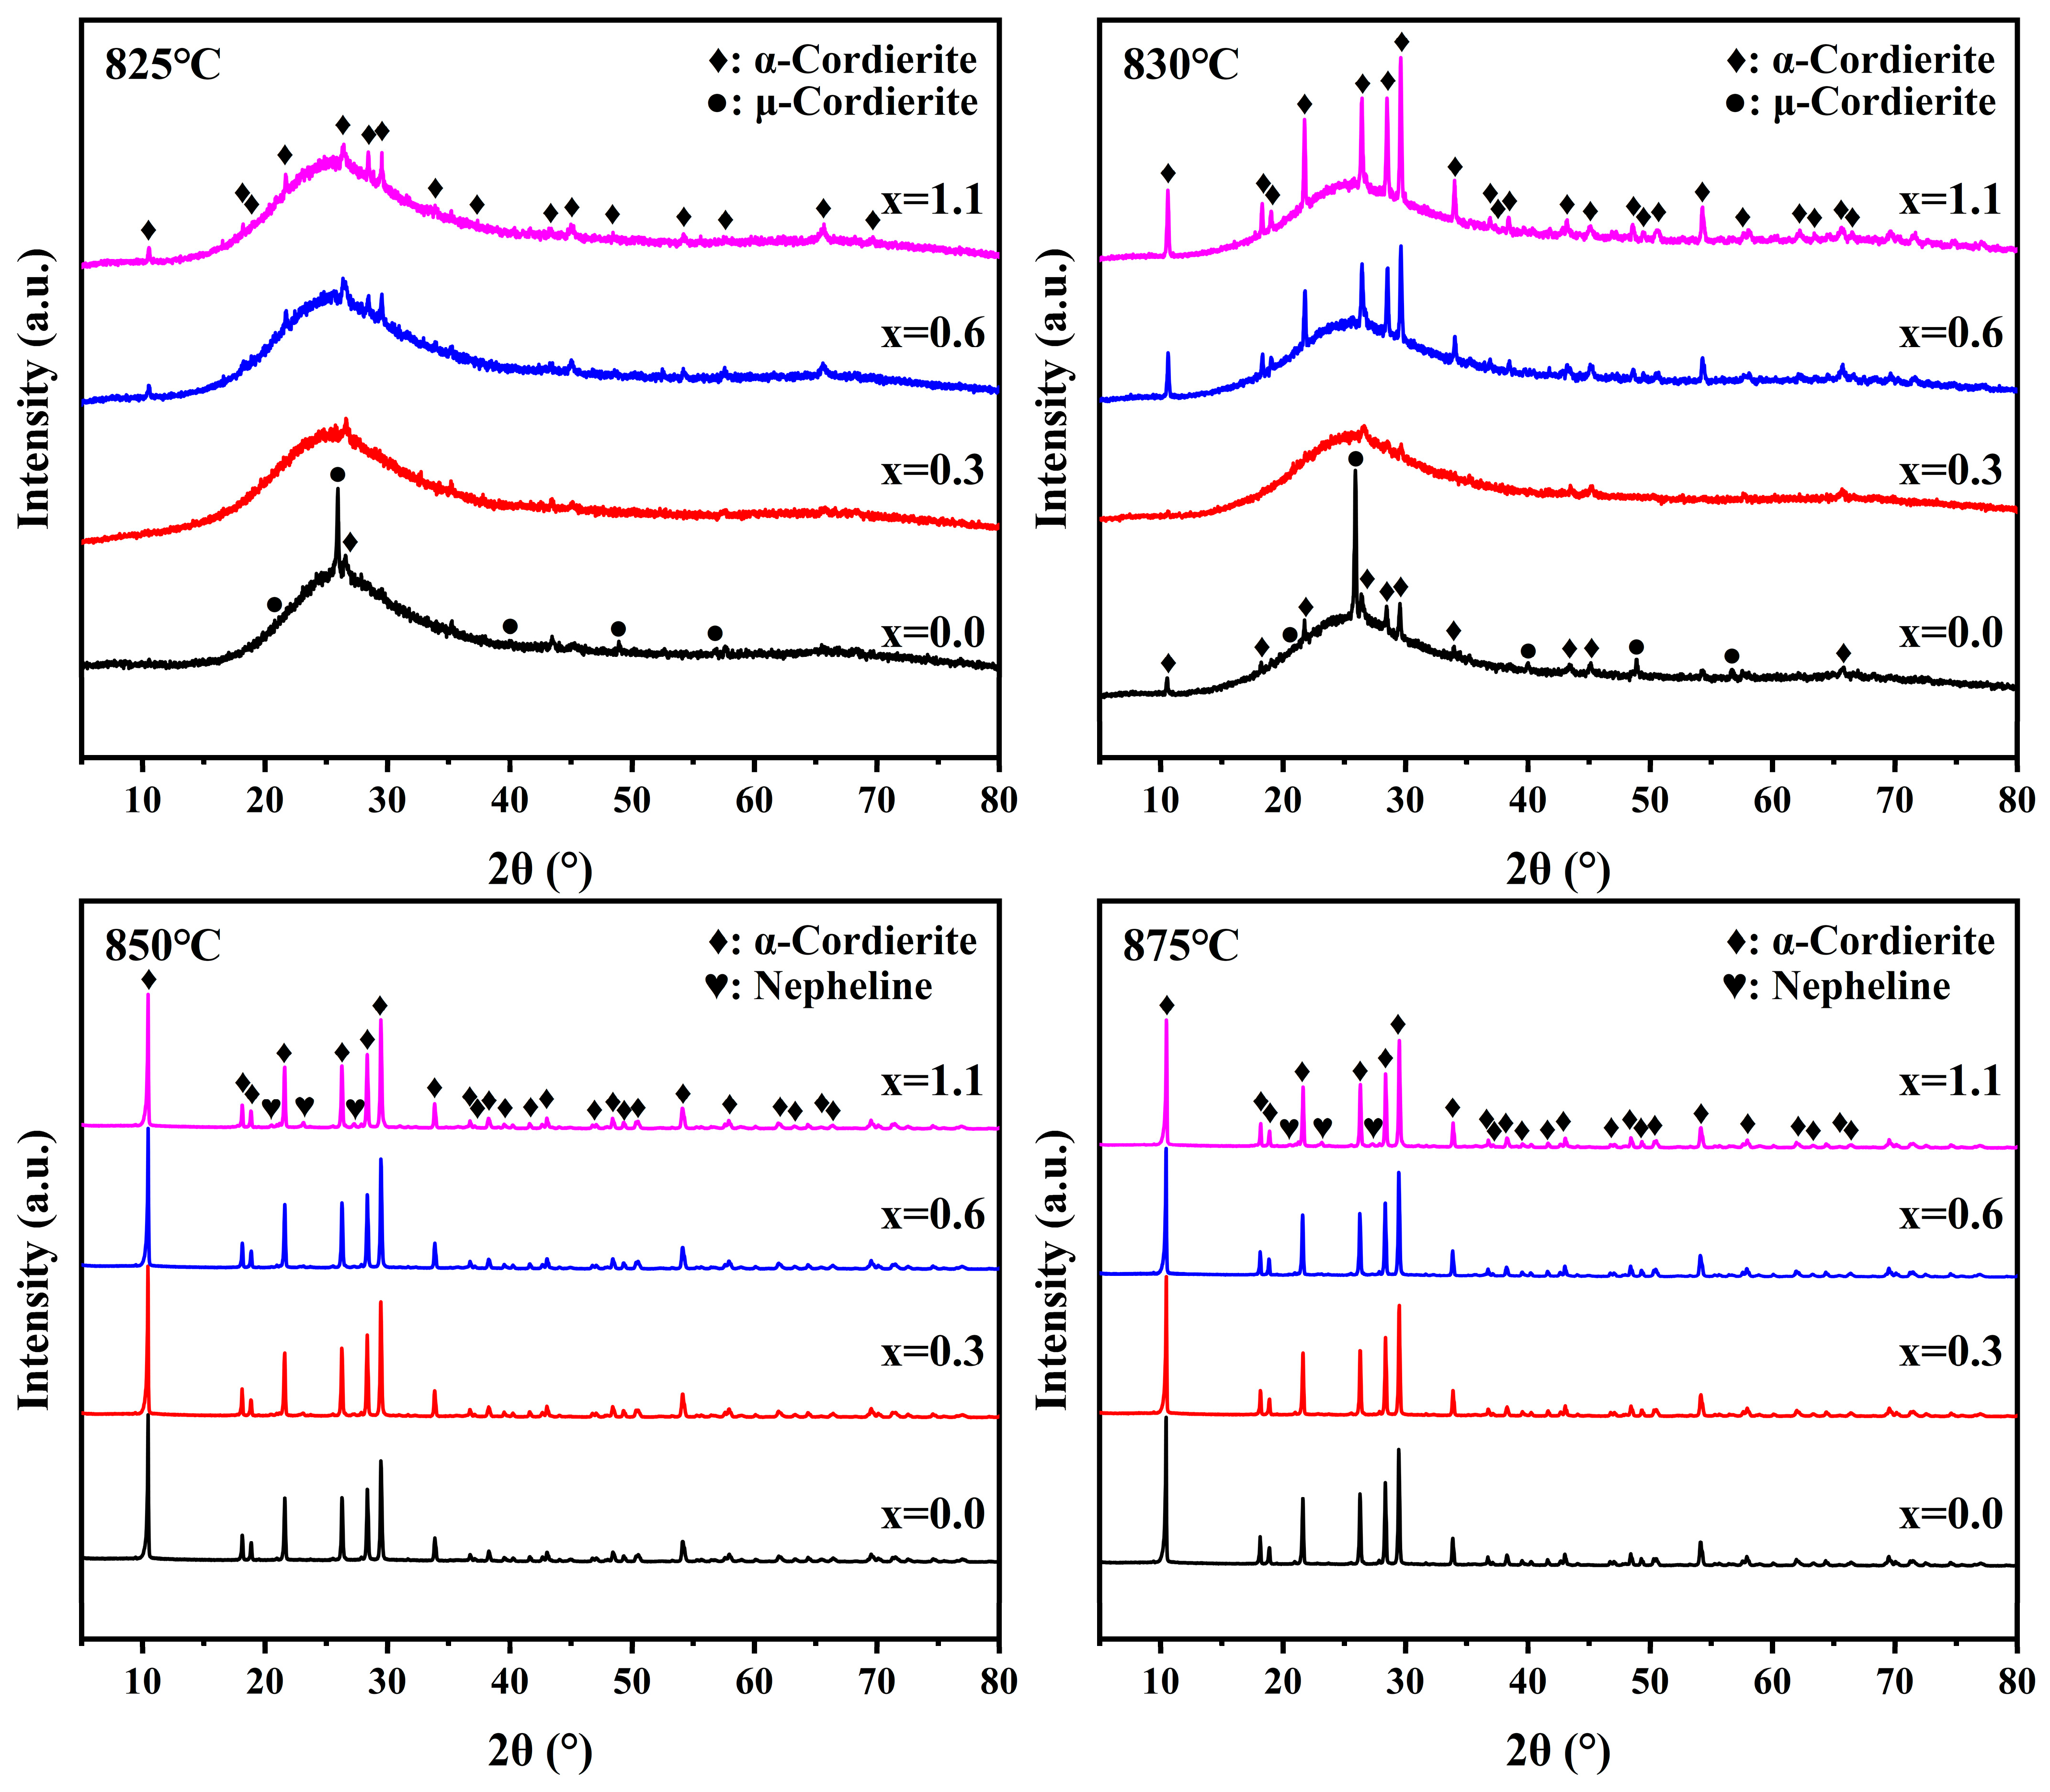
Figure 7 presents the XRD patterns of parent glasses with varying Na
2O additions crystallized for 6 h at different heat treatment temperatures (825, 830, 850 and 875 °C). The glass-ceramic samples with x = 0 and x = 0.3 contain only two crystalline phases: μ-cordierite (PDF#97-002-4899) and α-cordierite (PDF#97-007-5634). However, for the samples with x = 0.6 and x = 1.1, a new crystalline phase, nepheline (NaAlSiO
4: PDF#98-000-0327), appears. This indicates that the introduction of high concentrations of Na
2O induces the formation of sodium-containing impurity phases. The crystallinity of glass-ceramic samples with varying Na
2O additions, calculated via the peak-fitting method, is presented in
Table 5.
At a sintering temperature of 825 °C, the blank sample exhibited a distinct amorphous hump, accompanied by weak diffraction peaks of μ-cordierite and trace peaks of α-cordierite, corresponding to a crystallinity of 4.92%. In contrast, the samples containing Na
2O displayed a prominent amorphous hump along with weak α-cordierite diffraction peaks; notably, with increasing Na
2O addition, the crystallinity of these samples rose from 1.80% to 3.18%. Upon elevating the sintering temperature to 830 °C, the diffraction intensities of both μ-cordierite and α-cordierite in the blank sample further intensified, with the crystallinity increasing to 8.88%. In contrast, the Na
2O-modified samples exhibited enhanced α-cordierite diffraction intensity; notably, as the Na
2O addition increased, the crystallinity of the samples rose from 2.40% to 16.69%. Combined with the results in
Table 3, which indicate that the addition of Na
2O facilitates early crystal precipitation, it is evident that the samples maintain a high α-cordierite content even in the absence of a substantial transformation from μ-cordierite to α-cordierite. The formation of α-cordierite is attributed to two distinct pathways: the phase transformation from μ-cordierite and the direct nucleation and growth of the α-phase [
37]. Consequently, it can be inferred that Na
2O suppresses the formation of the μ-cordierite phase and facilitates the direct crystallization of α-cordierite, thereby effectively shortening the overall crystallization sequence of the samples. This behavior may be attributed to the role of Na
2O as a network modifier in the parent glass structure. The incorporation of Na
2O is considered to depolymerize the glass network and increase the amount of non-bridging oxygen. According to the previous literature [
22,
23,
24] and the structural evidence obtained in this work, such changes may be associated with reduced high-temperature viscosity and enhanced cation diffusion and local structural rearrangement during heat treatment. As a result, the direct reconstruction of structural units related to α-cordierite formation may be facilitated, making this crystallization pathway more favorable than the route involving transformation through the μ-cordierite intermediate phase. As evidenced by
Table 5, the x = 0.3 and x = 0.6 samples attained their peak crystallinity values of 83.87% and 84.57% at 850 °C, respectively. In contrast, the x = 0.0 and x = 1.1 samples reached their maximum crystallinity (81.56% and 82.95%) at a higher temperature of 875 °C. This suggests that incorporating an appropriate amount of Na
2O not only enhances the overall crystallinity but also shifts the crystallization process toward lower temperatures, effectively promoting premature crystal precipitation.
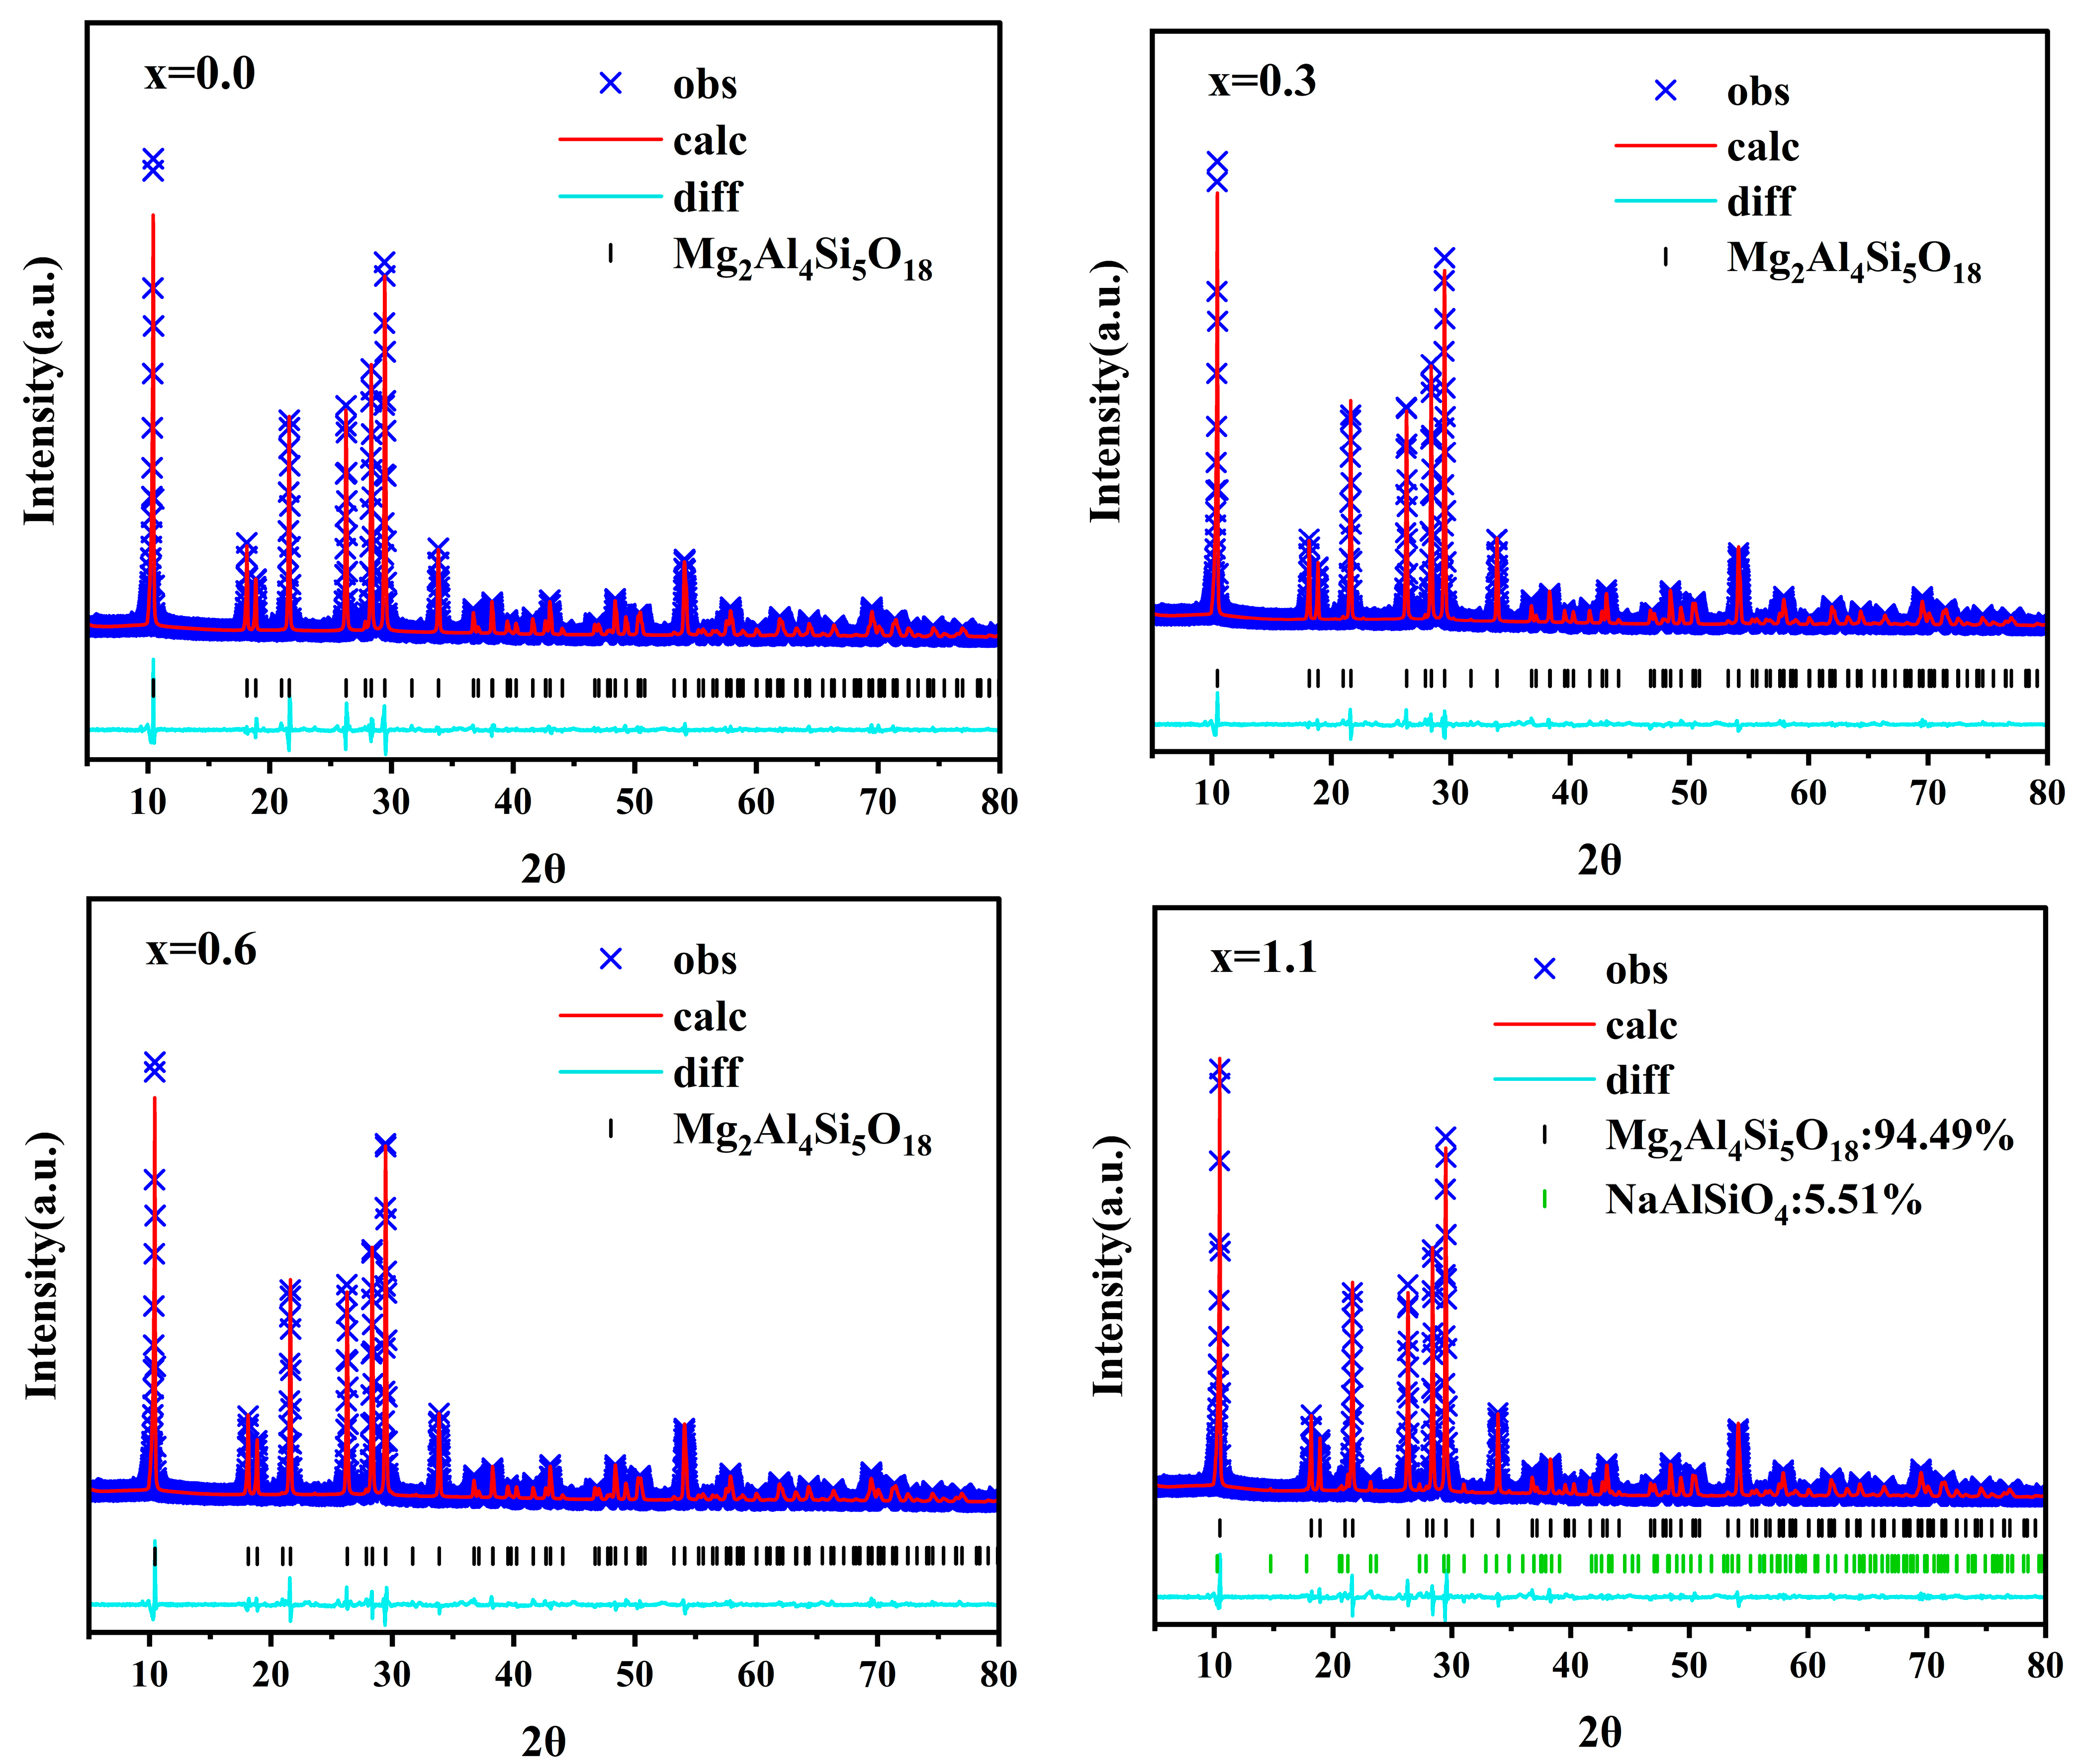
Figure 8 displays the Rietveld refinement results for glasses with varying Na
2O additions at their respective optimal sintering temperatures.
Table 6 summarizes the lattice parameters obtained from the Rietveld refinement. The post-refinement reliability factors,
Rp and
Rwp, are both less than 10%, indicating the reliability of the refinement results. When x increases from 0.6 to 1.1, the proportion of the nepheline phase NaAlSiO
4 rises from 0.99% to 5.51%. The presence of the nepheline phase hinders the grain boundary migration and grain growth of α-cordierite. This explains why the sample with x = 1.1 exhibits lower crystallinity at its optimal sintering temperature. Simultaneously, it can be observed that with the increase in Na
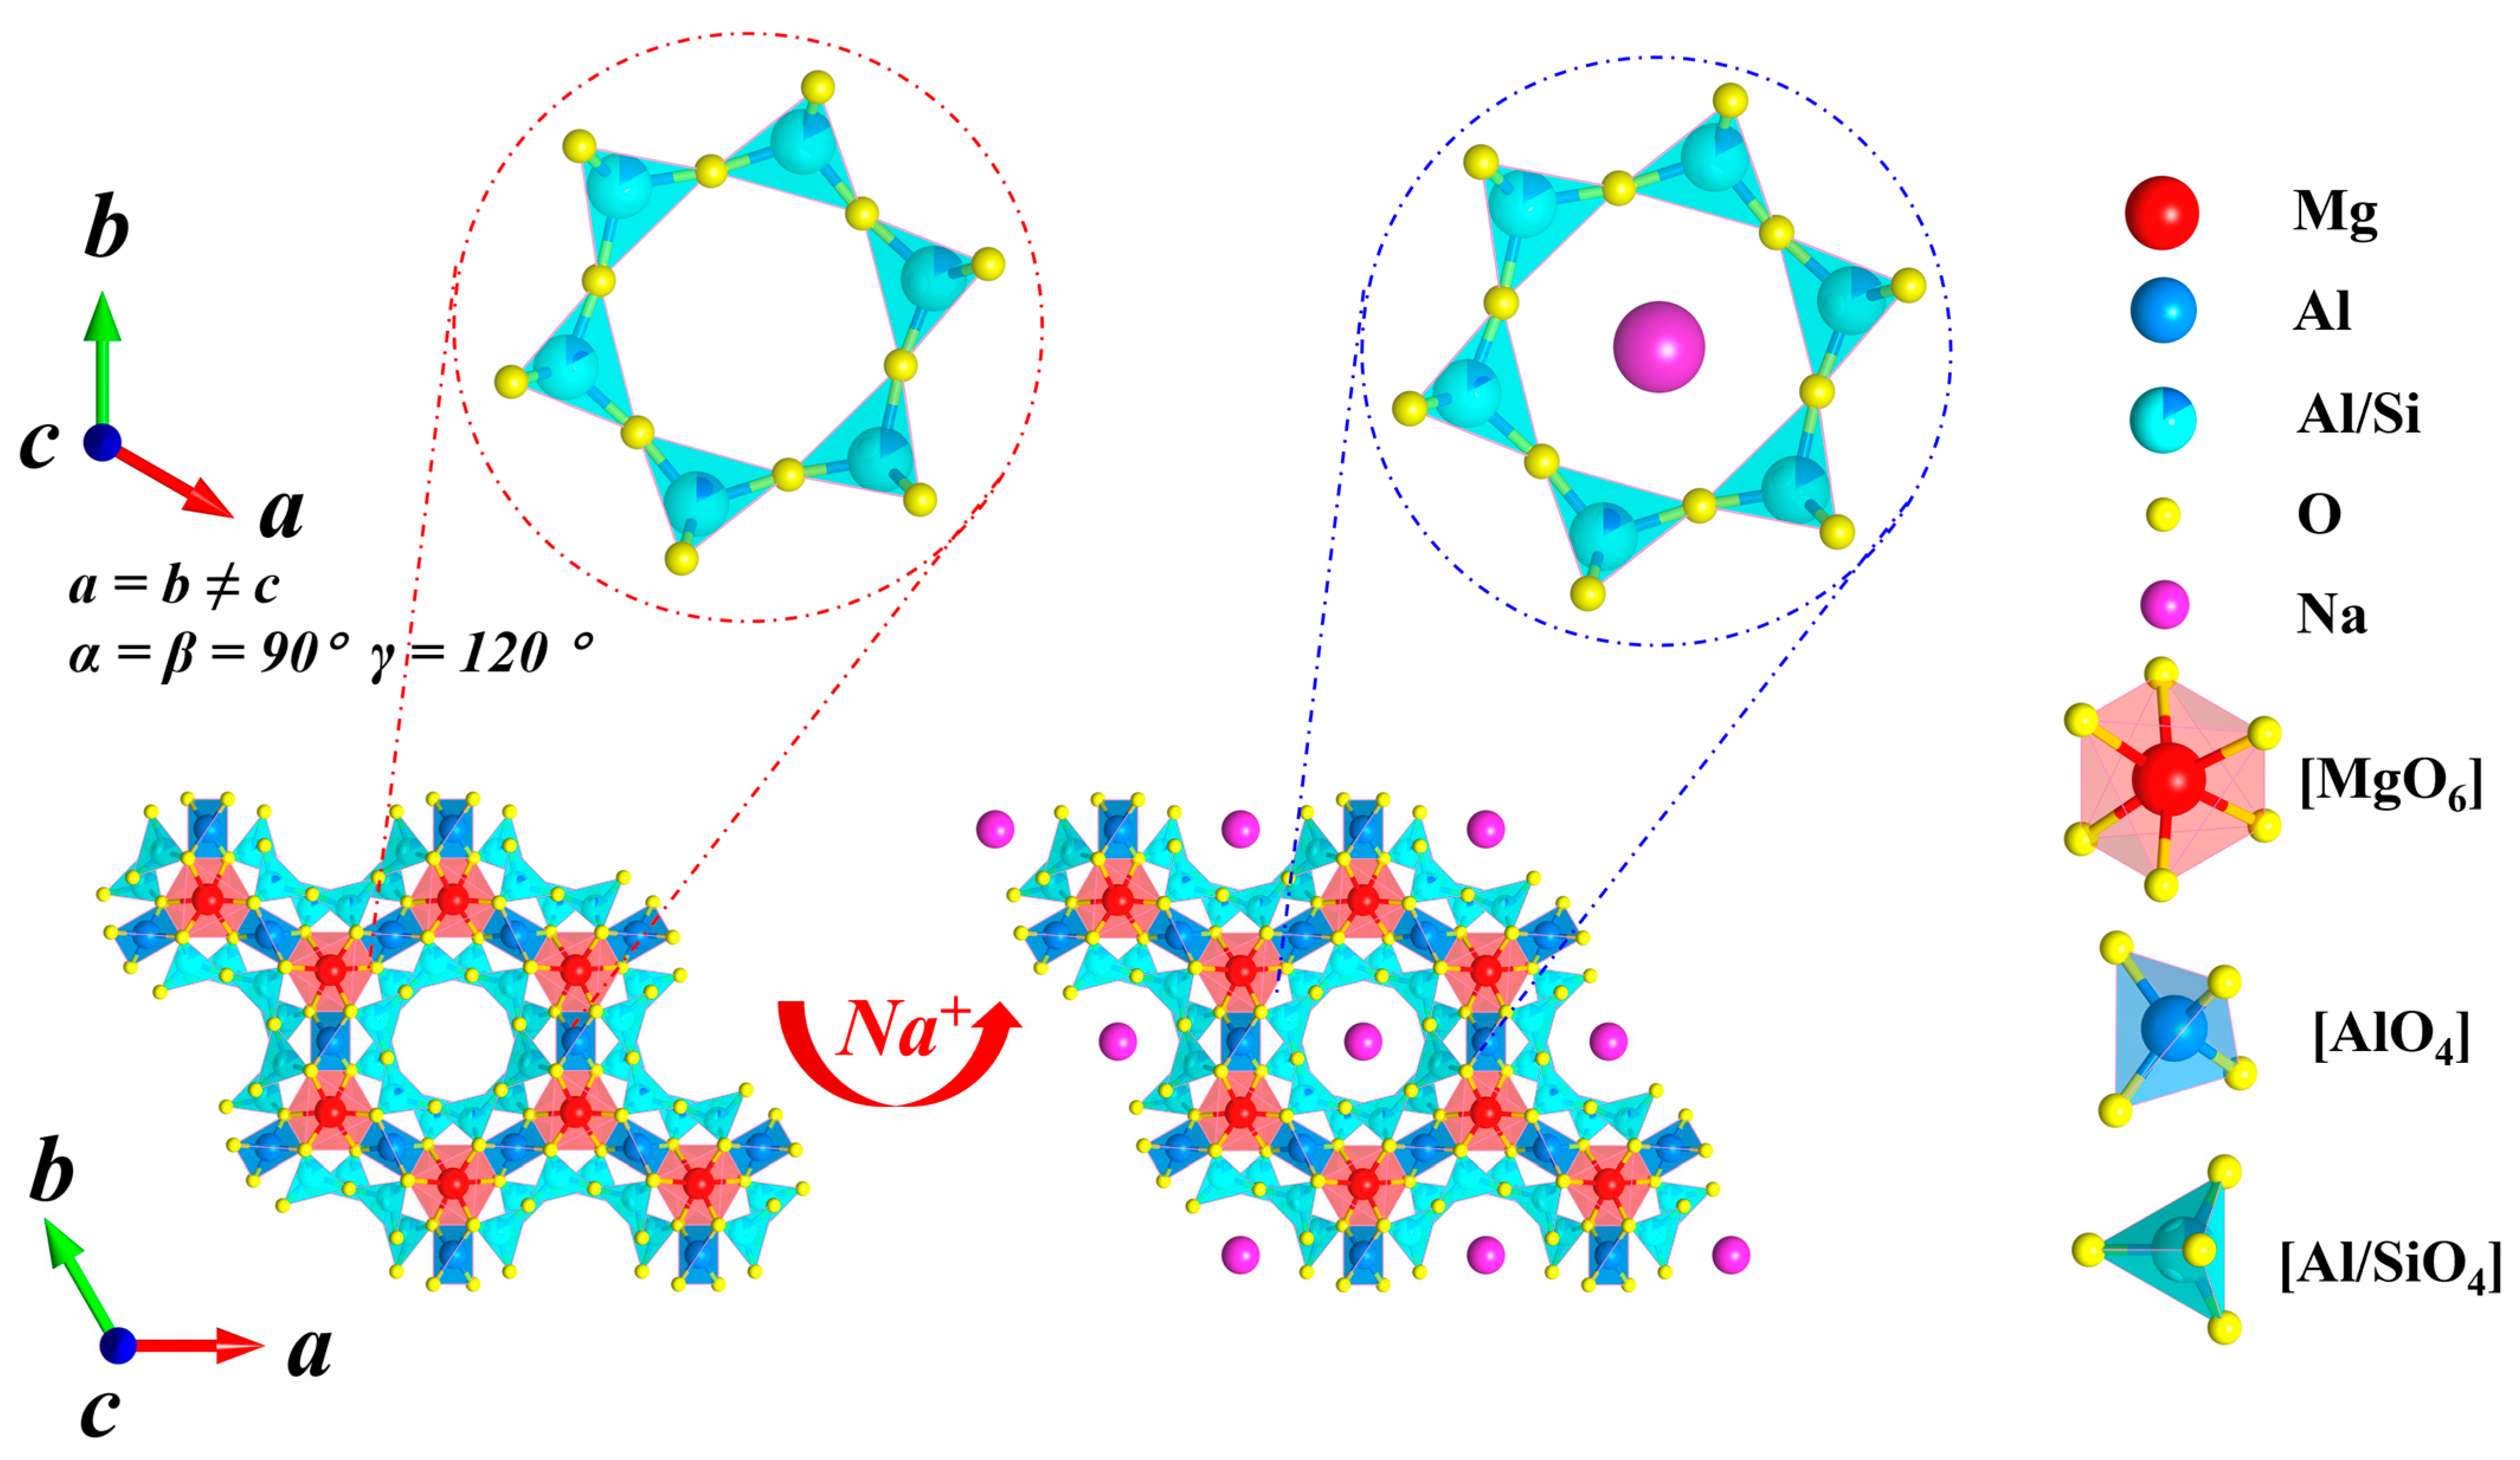
2O addition, the unit cell volume of α-cordierite gradually expands. Overall, this trend manifests as an increase in the lattice parameters a and b, while c remains essentially unchanged. This result suggests a high probability that Na
+ ions occupy the six-membered ring channels of α-cordierite. A schematic diagram illustrating this structural distortion is shown in
Figure 9.
3.4. Structure of the Parent Glass
However, it should be emphasized that, due to the strong overlap among the fitted components, the Gaussian deconvolution inevitably involves a certain degree of uncertainty. Therefore, the FTIR peak-fitting results should be regarded as semi-quantitative evidence for structural evolution. To further verify the reliability of the analysis, XPS O 1s measurements were additionally performed on the parent glasses as an independent and complementary means of cross-validation.
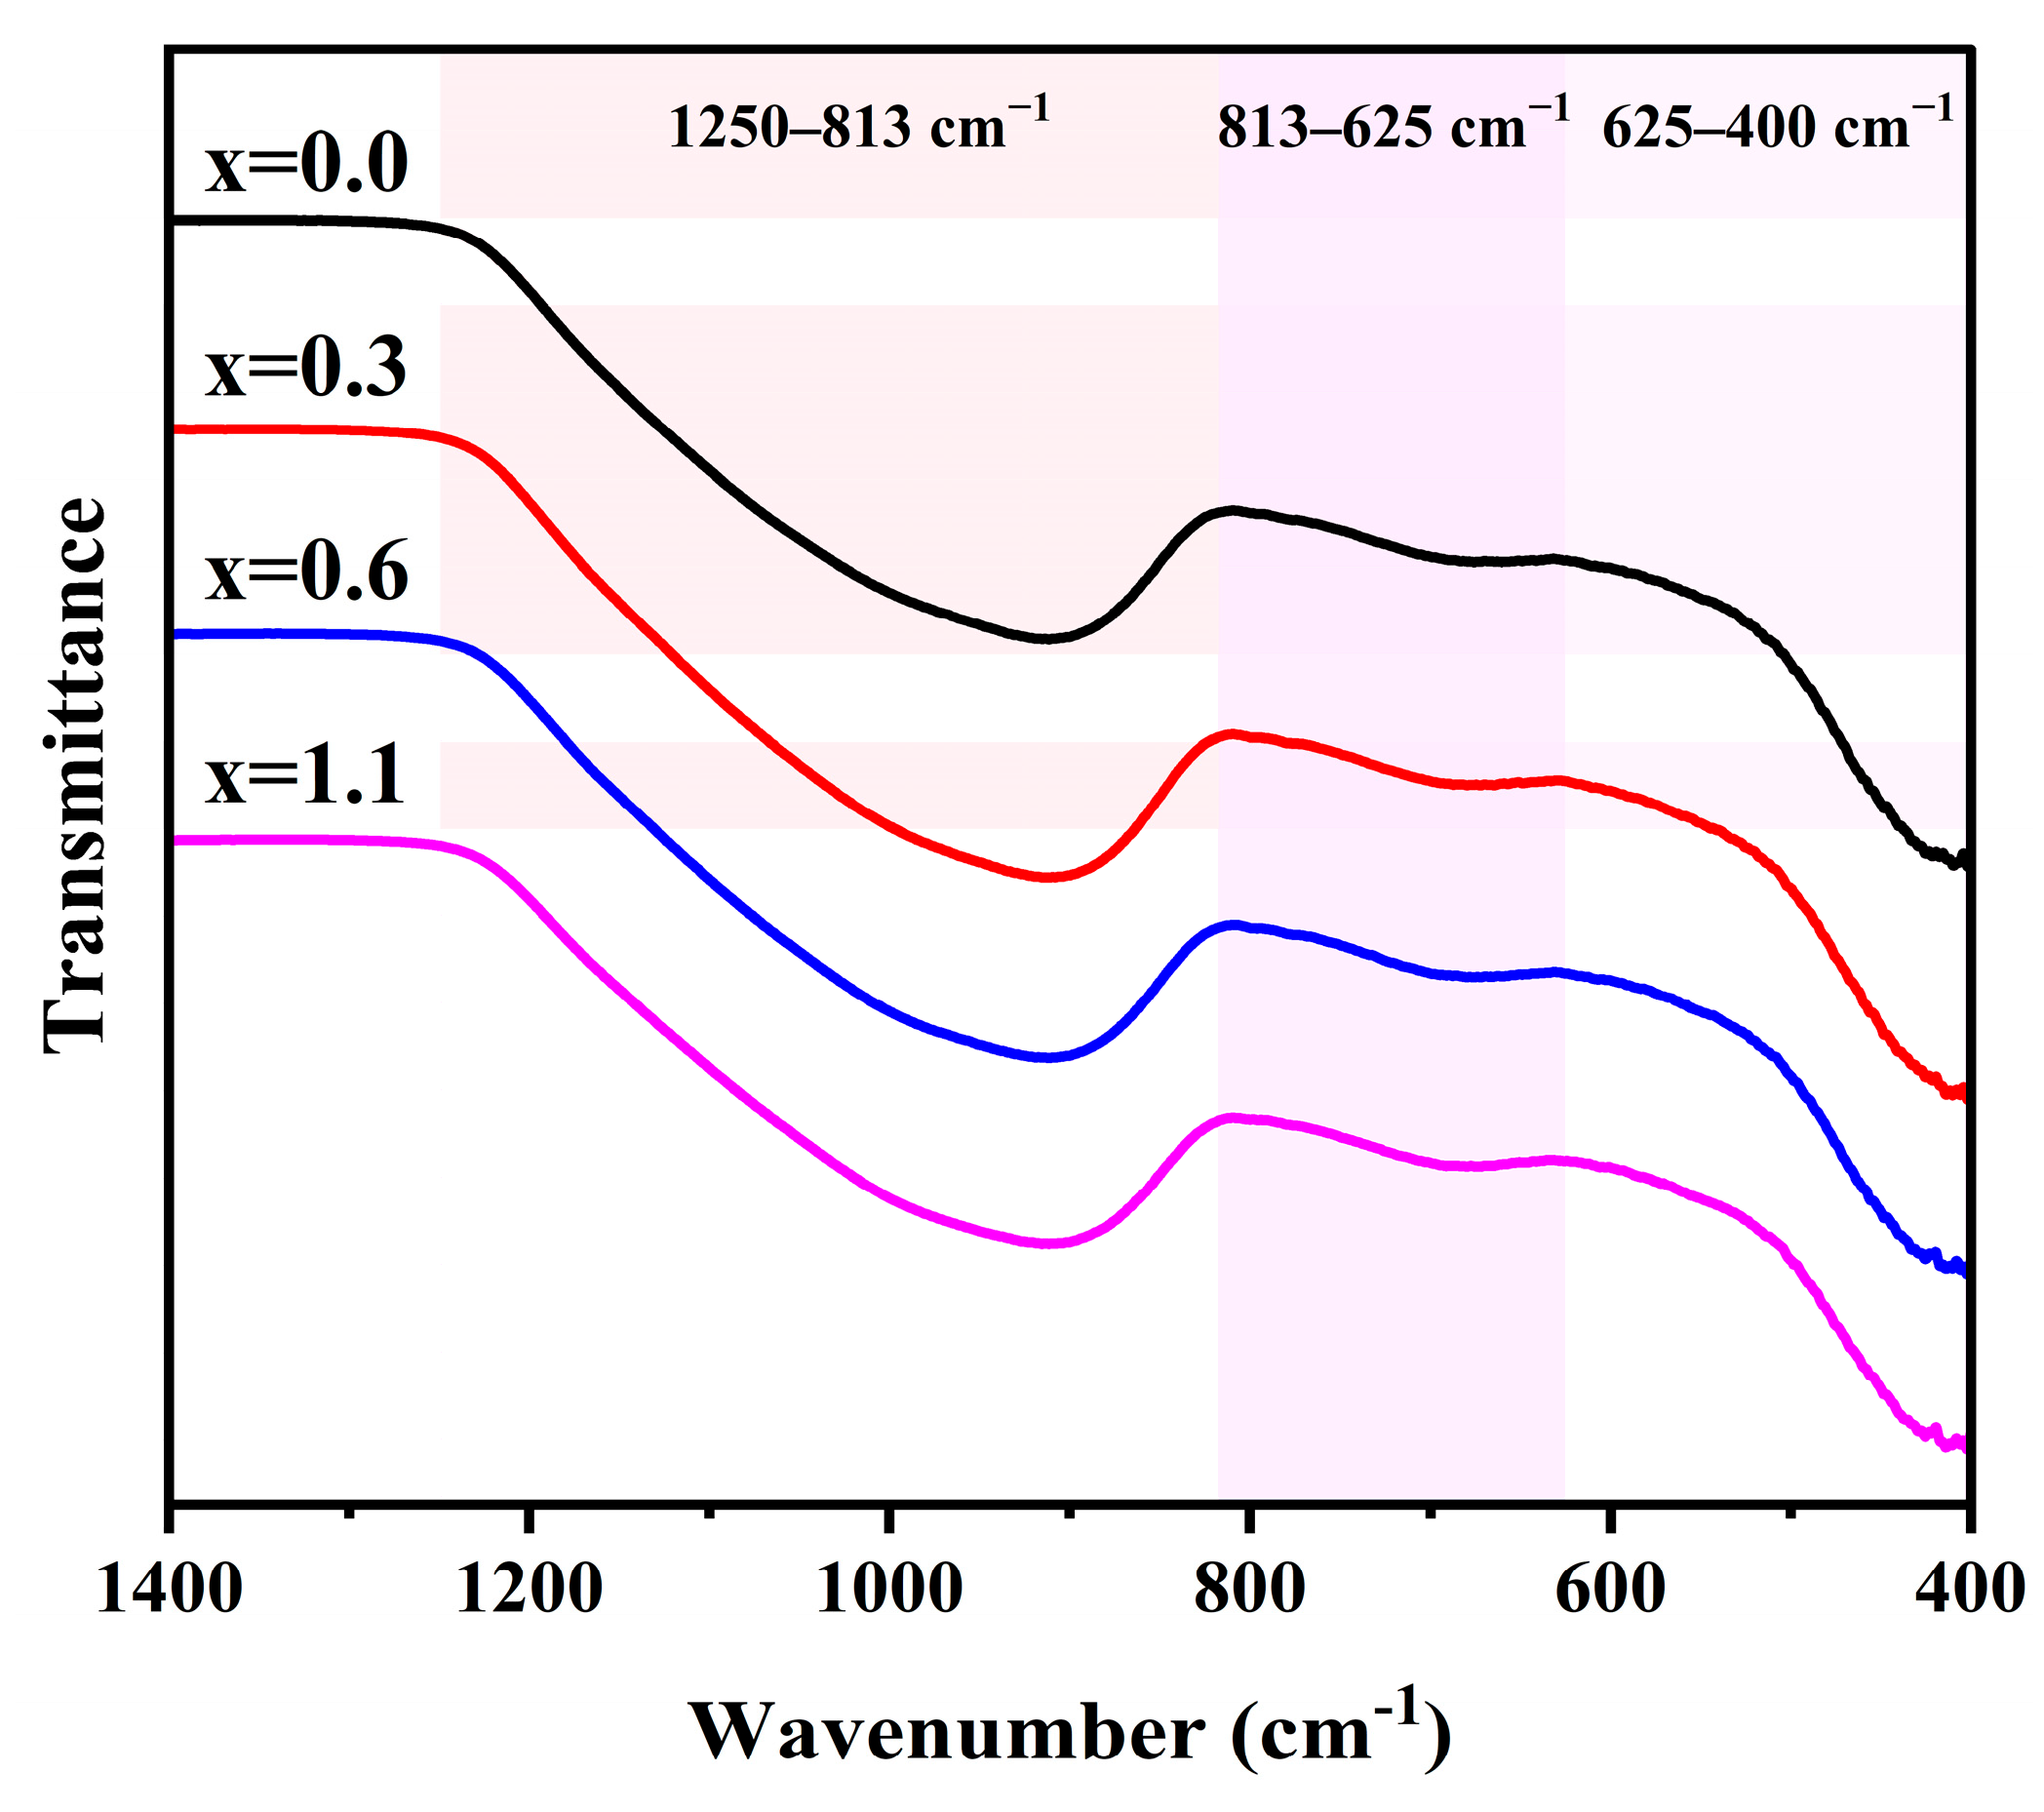
Figure 10 shows the FTIR spectra of parent glasses with varying Na
2O additions. The FTIR spectra of all glass samples mainly consist of three regions: 1250–813 cm
−1, 813–625 cm
−1, and 625–400 cm
−1. These bands can be attributed to the asymmetric stretching vibrations, symmetric stretching vibrations, and bending vibrations of the R-O-R bonds in [RO
4] (R = Si or Al) tetrahedra, respectively [
38].
As the Na
2O addition increases from 0 to 1.1 wt.%, the absorption band in the 1250–813 cm
−1 range undergoes a systematic shift toward lower wavenumbers. This phenomenon is primarily attributed to the depolymerization of the three-dimensional network structure of the parent glass induced by Na
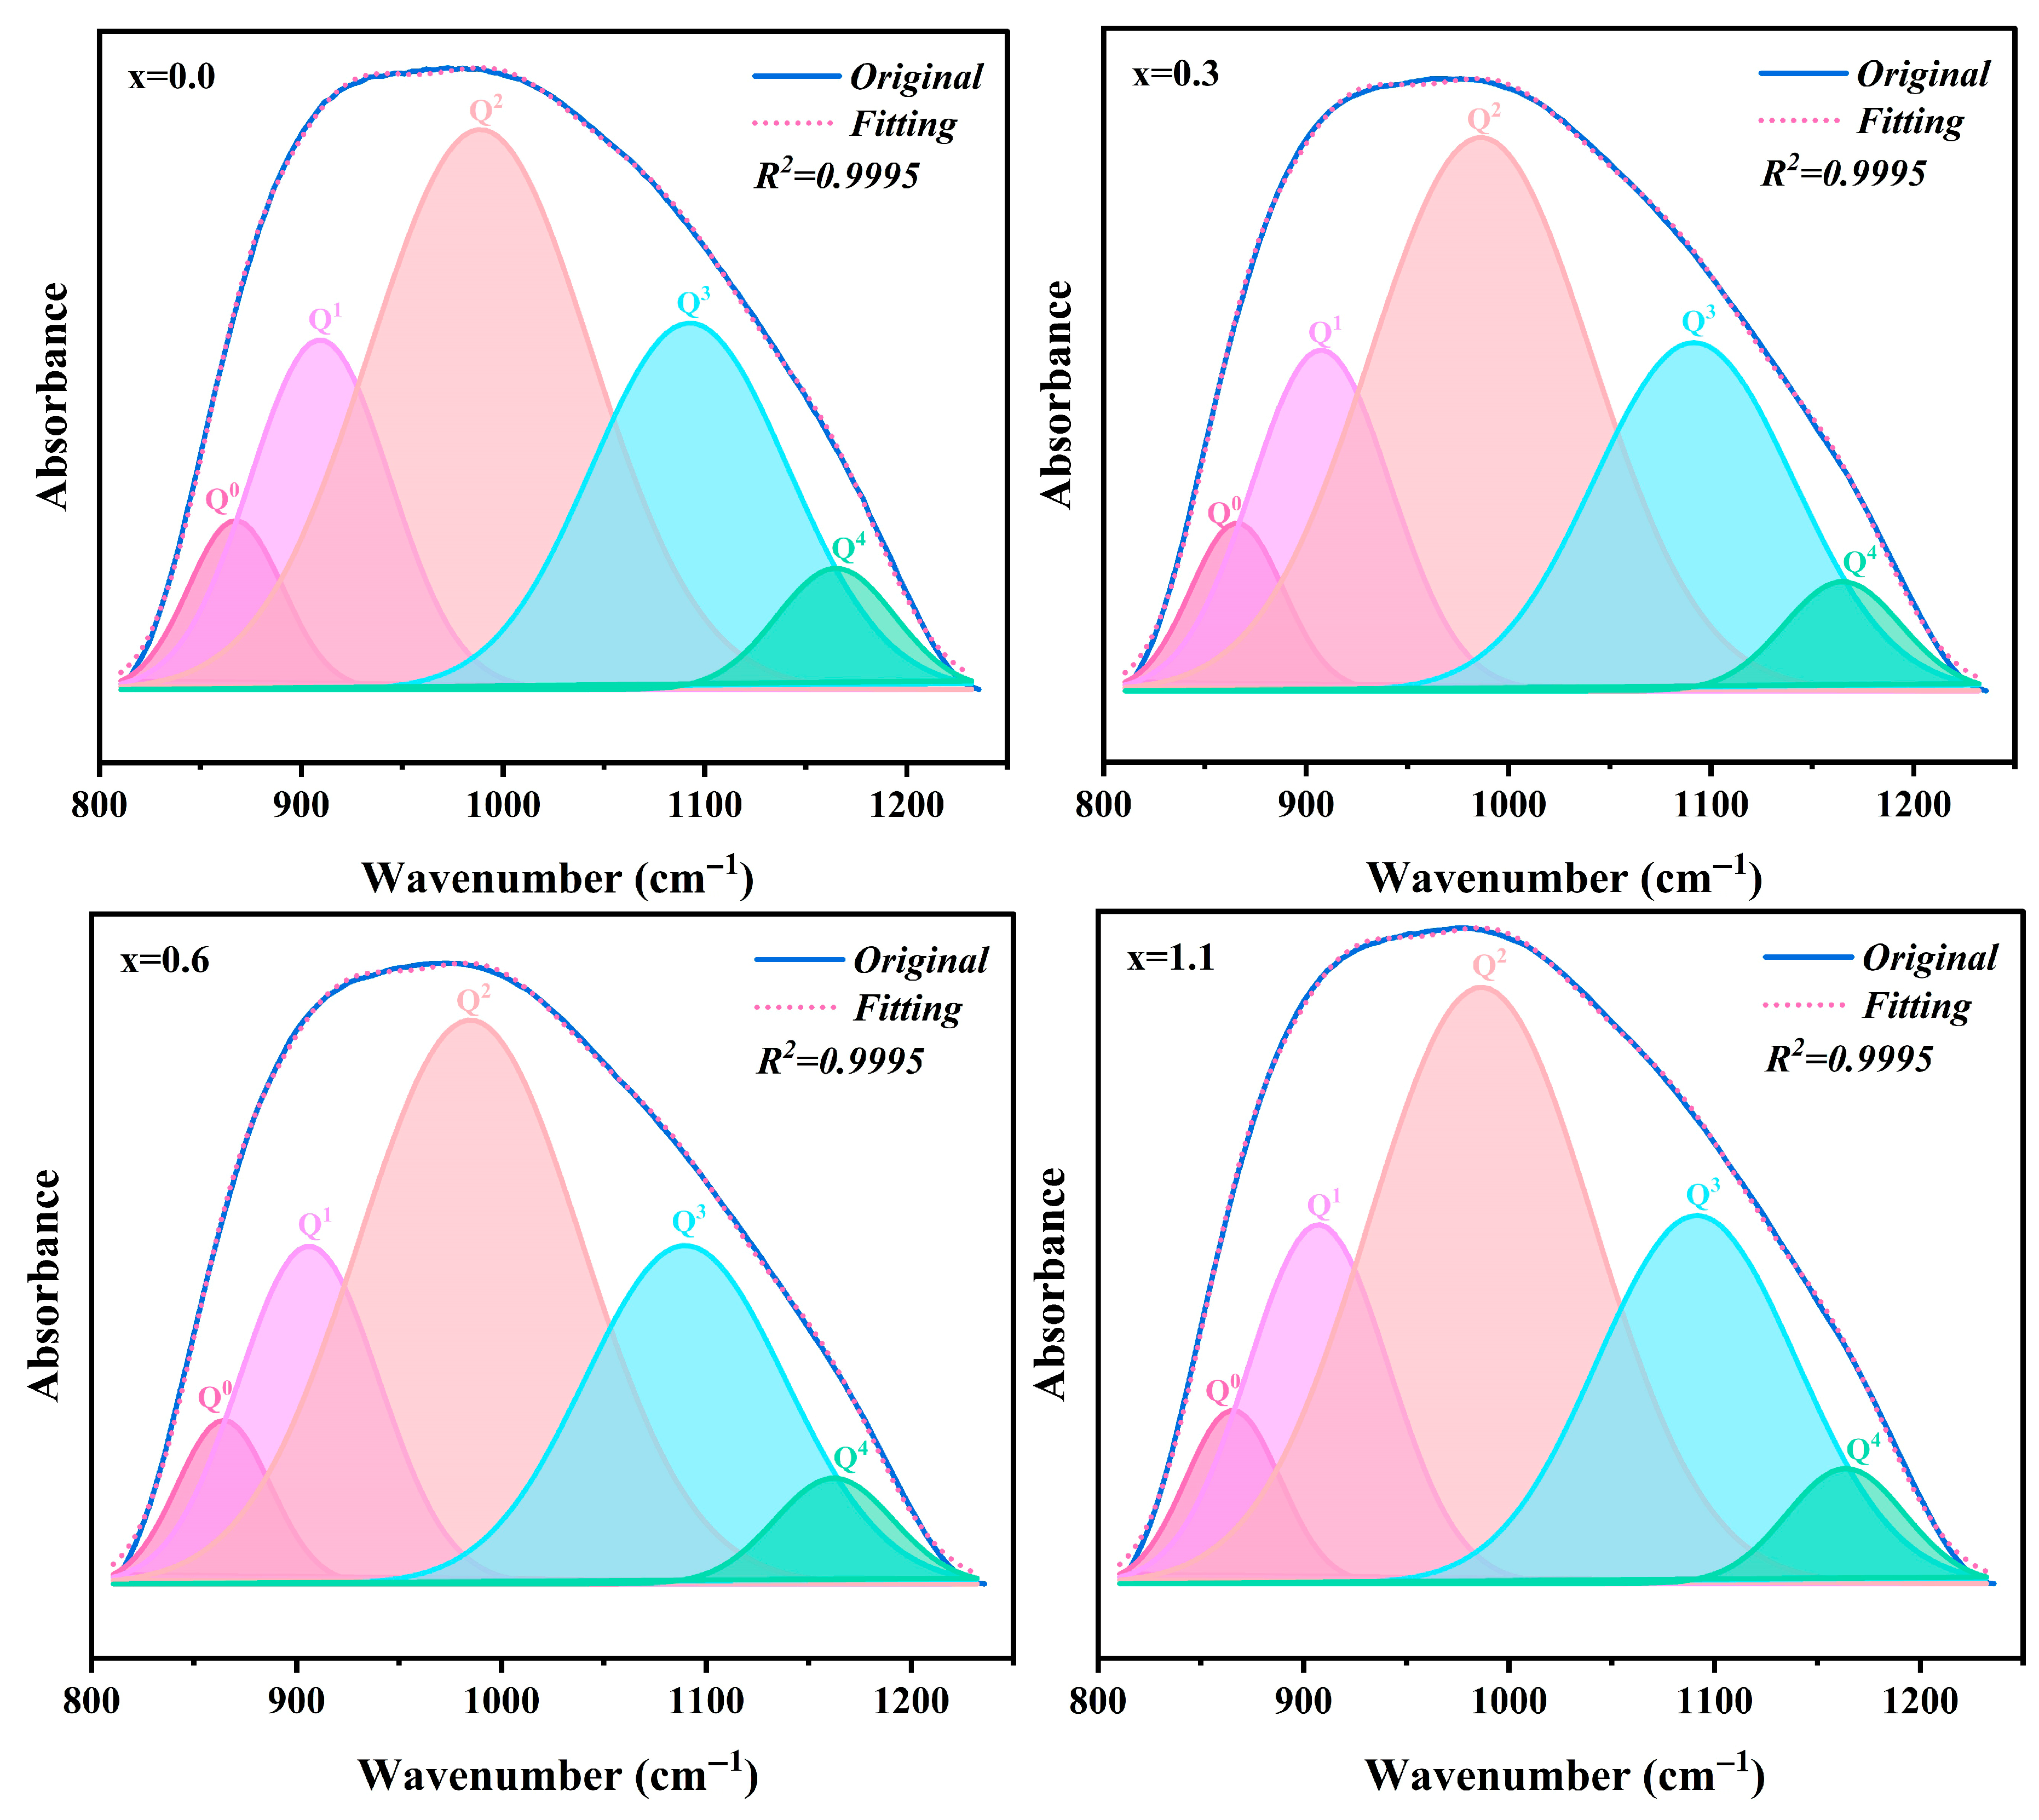
2O, which results in an increased concentration of NBOs. This specific absorption band originates from the superposition of vibrations from [SiO
4] structural units with varying degrees of polymerization, denoted as Q
n species (n = 0–4) [
39,
40,
41,
42]. To semi-quantitatively evaluate the variations in the connectivity of the glass network, Gaussian deconvolution was employed to fit the spectral envelopes in this region, as illustrated in
Figure 11.
Table 7 summarizes the relative peak area percentages of the different Q
n species. With the increasing addition of Na
2O, the relative contents of Q
3 and Q
4 decrease, whereas those of Q
0, Q
1 and Q
2 exhibit an upward trend. This observation indicates that the incorporation of Na
2O facilitates the transformation of highly polymerized structural units into less-connected ones, thereby depolymerizing the glass network. To quantify this trend, the ratio of NBO/BO, defined as (Q
0 + Q
1 + Q
2)/(Q
3 + Q
4), was employed to characterize the relative evolution of the glass network connectivity. It can be observed that the NBO/BO ratio increases monotonically with higher Na
2O concentrations.
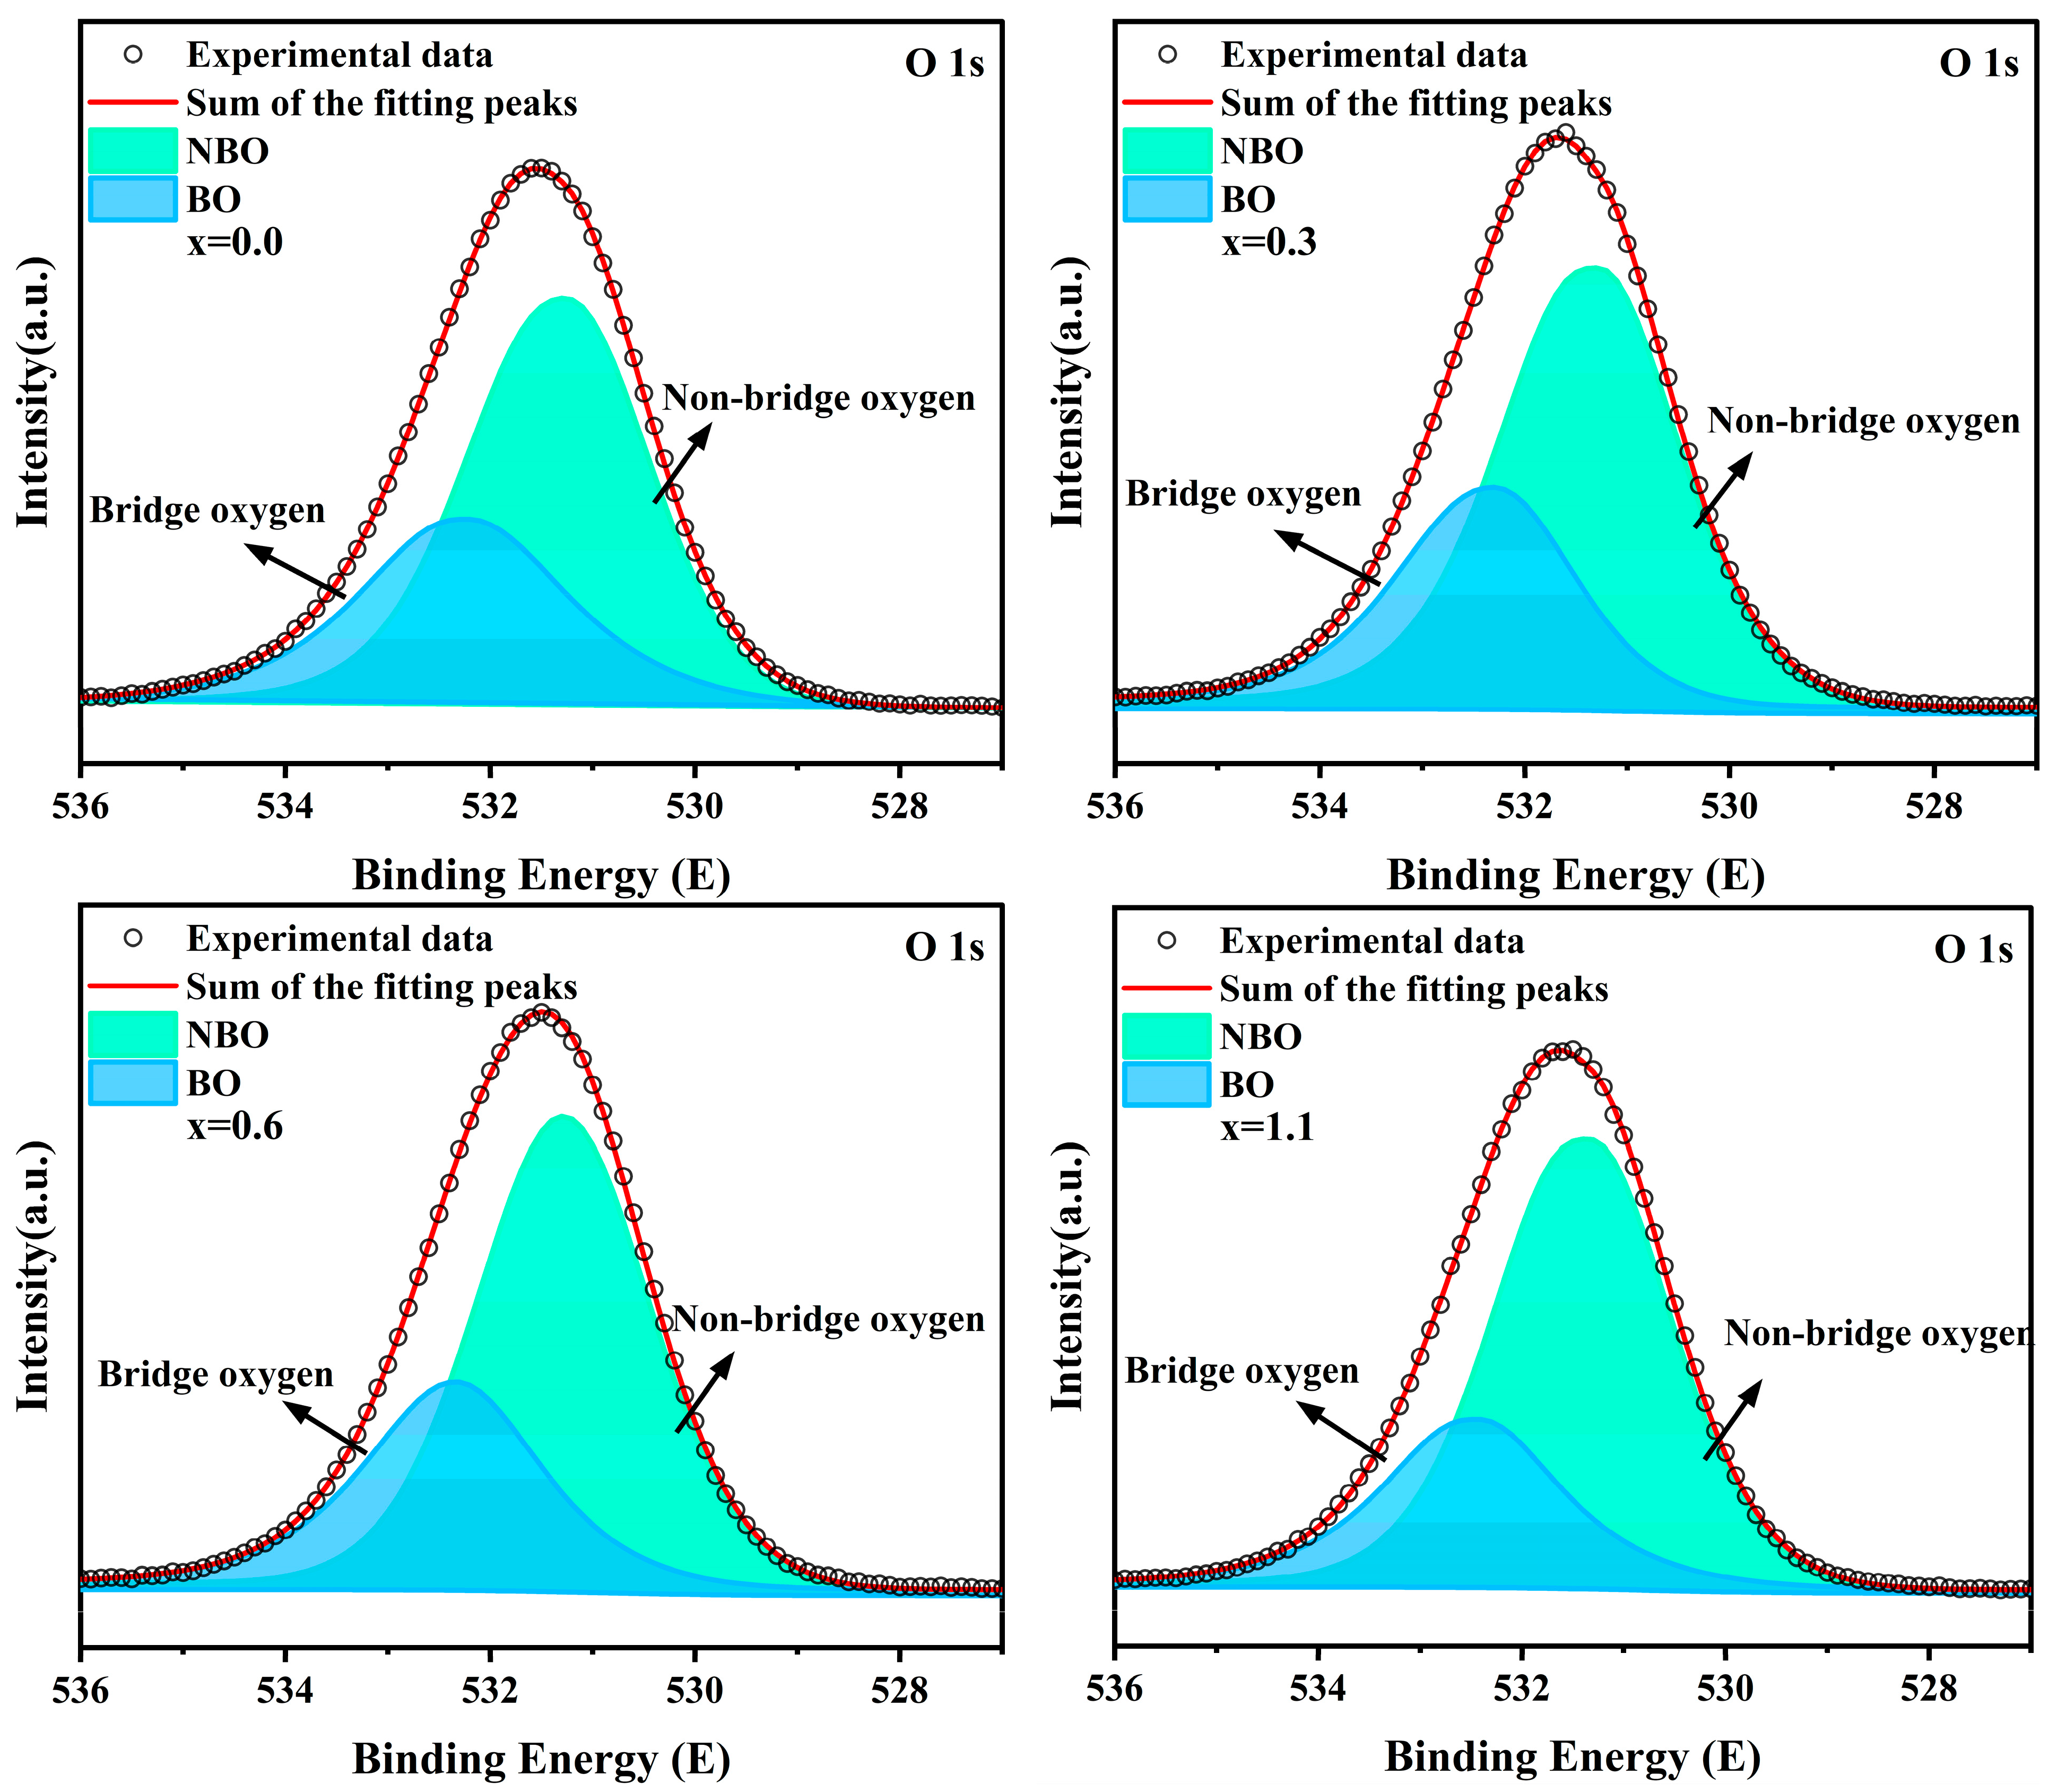
Figure 12 displays the XPS O 1s spectra of parent glasses with varying Na
2O additions, along with their corresponding peak fitting curves. The peak near 531.7 eV can be deconvoluted into two O 1s components: BO with a binding energy at approximately 532.2 eV and NBO with a binding energy at approximately 531.3 eV [
43,
44]. The detailed fitting results are presented in
Table 8. As the Na
2O addition increases, the NBO percentage in the parent glass rises from 64.74% to 71.46%, while the BO percentage decreases from 35.26% to 28.54%; correspondingly, the NBO/BO ratio increases from 1.84 to 2.50. Since FTIR primarily reflects bulk information while XPS focuses on surface information, there is a certain discrepancy in the NBO/BO values calculated by the two methods. However, the overall trends are consistent, which also aligns well with the variations in crystallization behavior exhibited in the DSC results.
3.5. Microstructure of Cordierite Glass-Ceramics
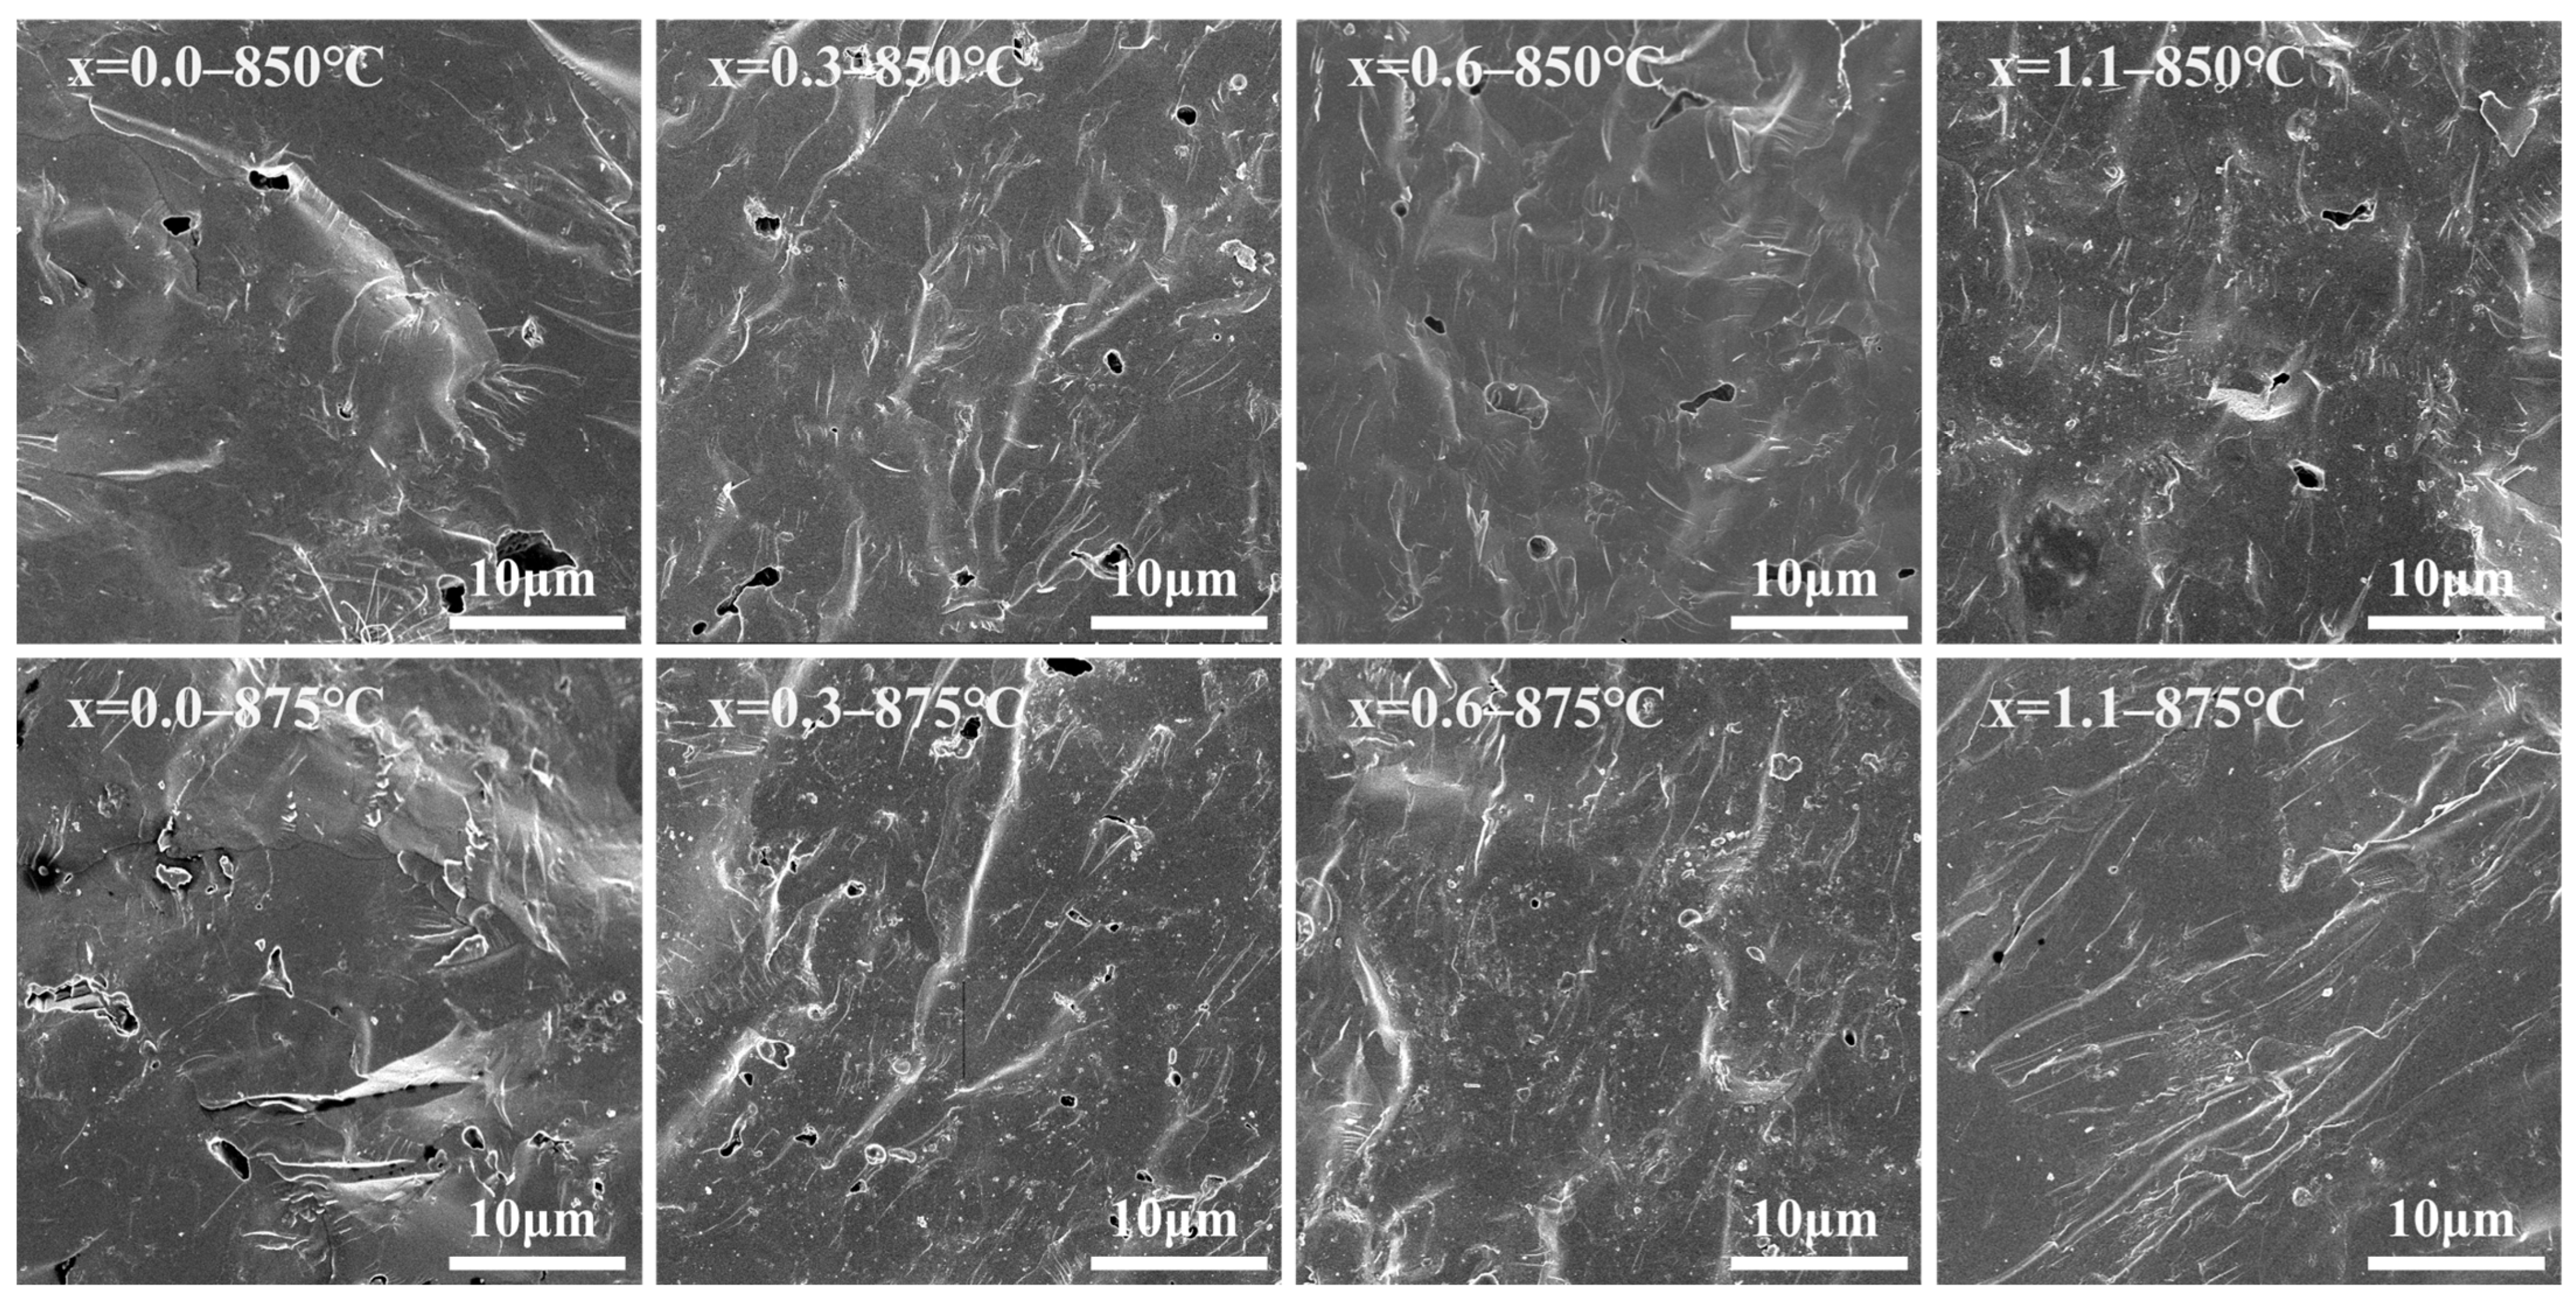
Figure 13 presents the fracture surface morphologies of the glass-ceramic samples with varying Na
2O additions sintered at 850 °C and 875 °C. For glass-ceramics fabricated through the sintering route, the densification process is primarily governed by the viscous flow mass transport mechanism, which involves distinct stages including particle rearrangement, neck growth, and the subsequent shrinkage and closure of pores [
45,
46,
47]. At a sintering temperature of 850 °C, the blank sample exhibited numerous irregular pores, with some localized pores being relatively large. As the Na
2O addition increased to 0.6 wt.%, both the quantity and size of the pores progressively decreased. This trend is attributed to the fact that an optimal addition of Na
2O can effectively reduce glass viscosity by decreasing the degree of network polymerization and broadening the densification sintering window. Consequently, particle rearrangement and pore closure driven by viscous flow are significantly enhanced, facilitating densification at lower temperatures. However, as the Na
2O addition increased to 1.1 wt.%, an anomalous resurgence in the number of pores was observed. However, when the Na
2O addition was increased to 1.1 wt.%, the number of pores in the samples anomalously increased. This was primarily attributed to the premature precipitation of crystals induced by excessive Na
2O, which hindered the sintering densification of the glass-ceramics (as evidenced by the XRD patterns, the sample with x = 1.1 exhibited the highest crystallinity at the initial stage of sintering). During the sintering of glass-ceramics, the continuous precipitation of crystals and the subsequent grain growth restrict the flow paths of the residual glass phase, thereby increasing the effective viscosity of the system. This phenomenon inherently narrows the densification sintering window, rendering the closure of residual pores increasingly difficult or even triggering pore coarsening [
48]. As the sintering temperature was increased to 875 °C, the porosity of the samples increased to a certain extent. In addition to the inhibitory effects of continuous crystallization and grain growth on densification, this phenomenon may also be attributed to the excessively high sintering temperature, which causes the base glass to soften too rapidly, leading to the premature closure of gas escape channels and the entrapment of part of the gas within the glass-ceramic, where it forms closed pores [
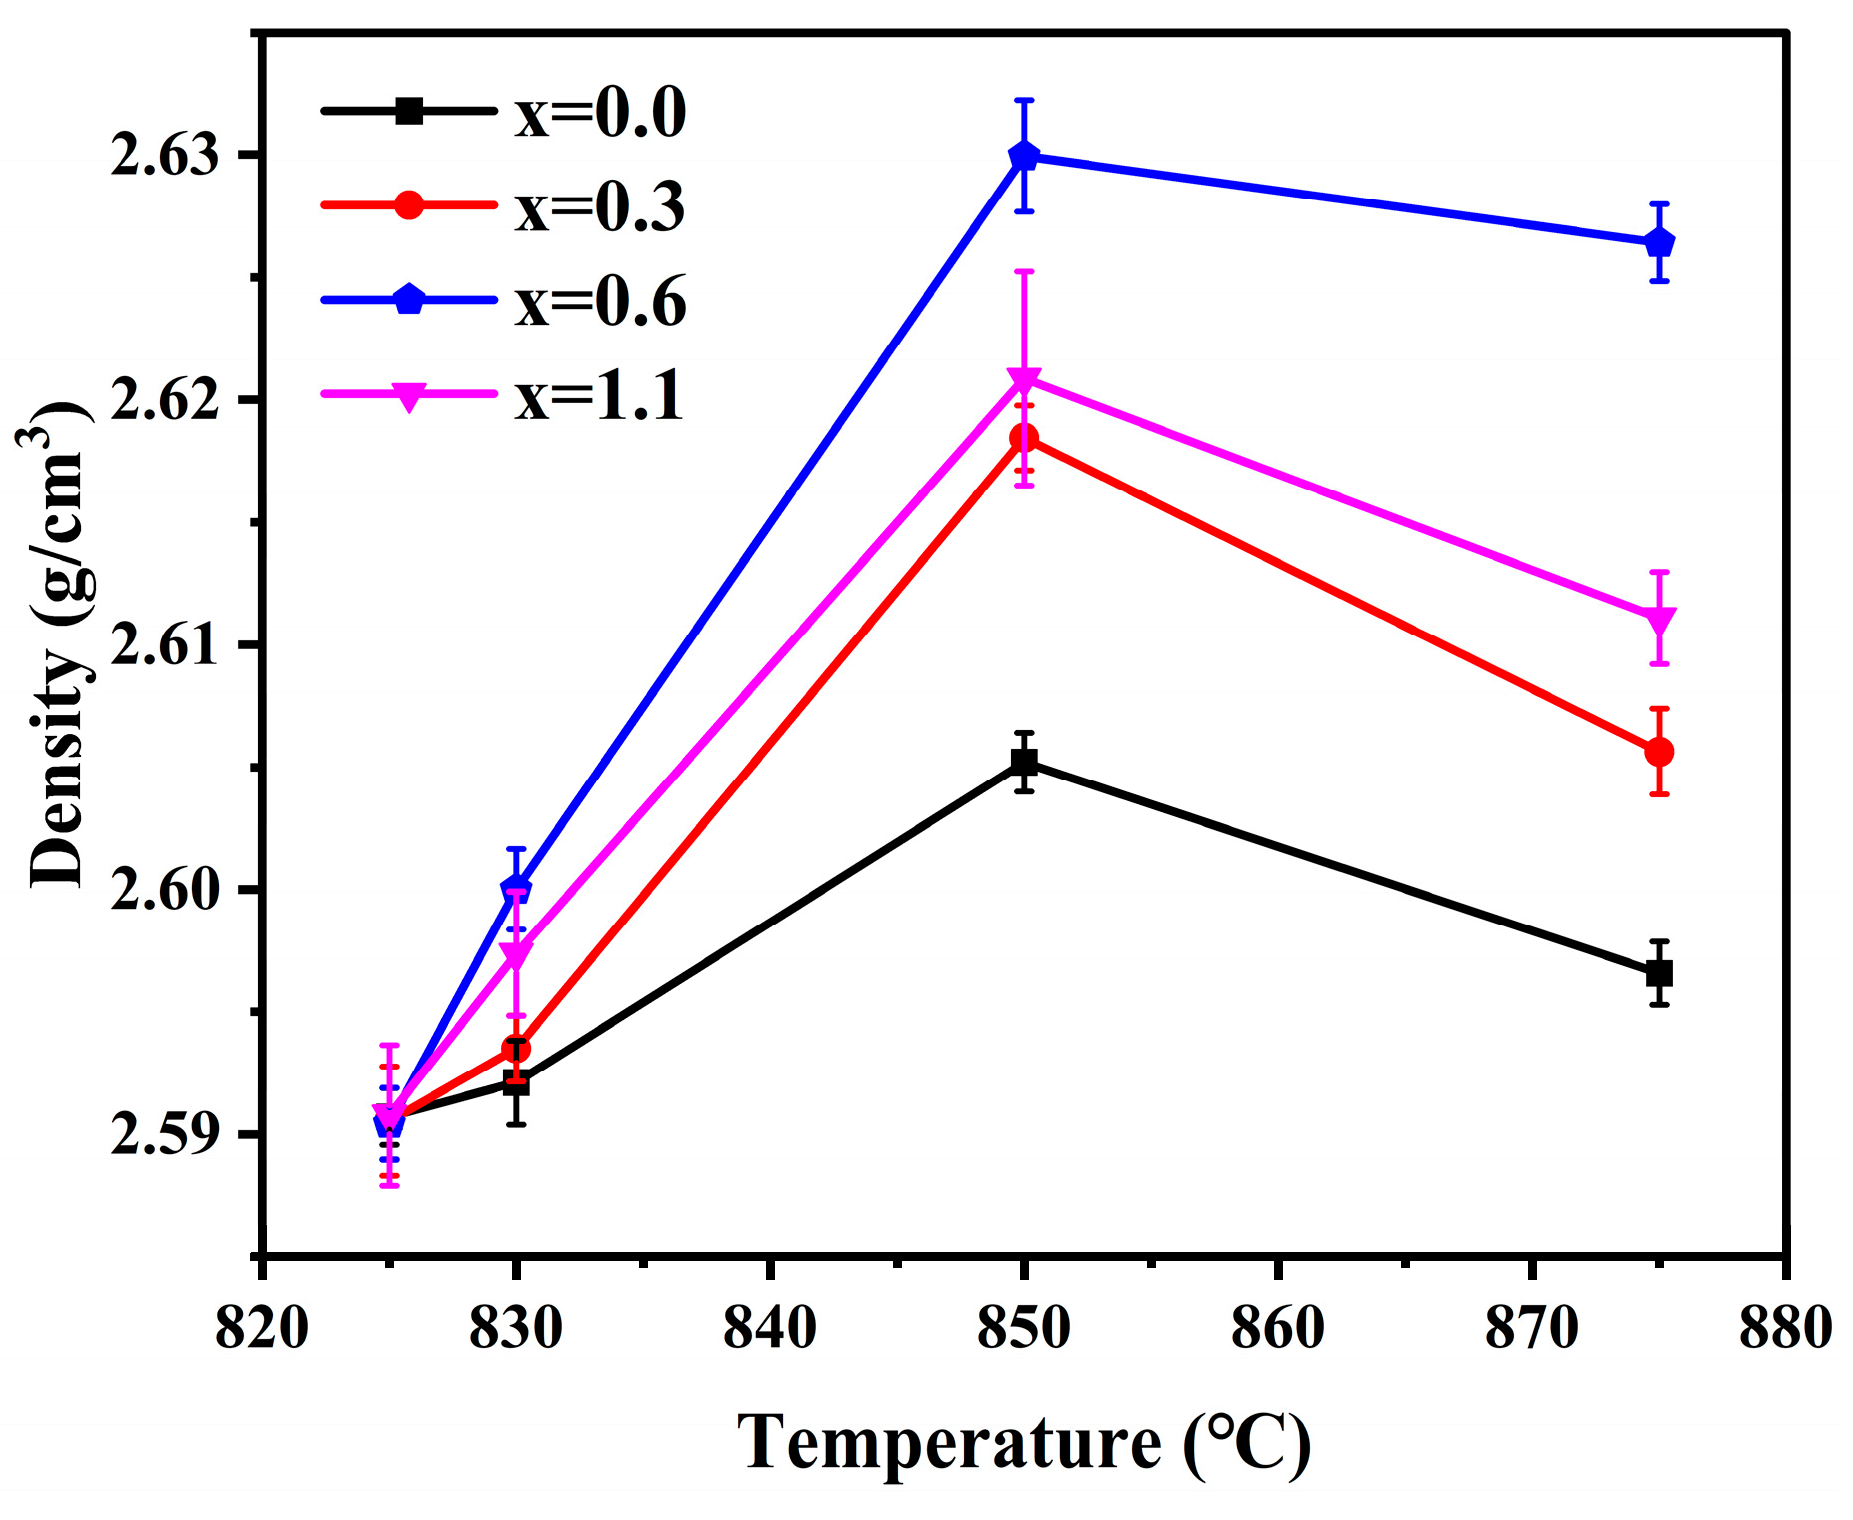
49]. At a sintering temperature of 850 °C and a Na
2O addition of 0.6 wt.%, the samples exhibit the optimal degree of densification, characterized by minimal porosity and a highly uniform pore size distribution.
3.7. Flexural Strength
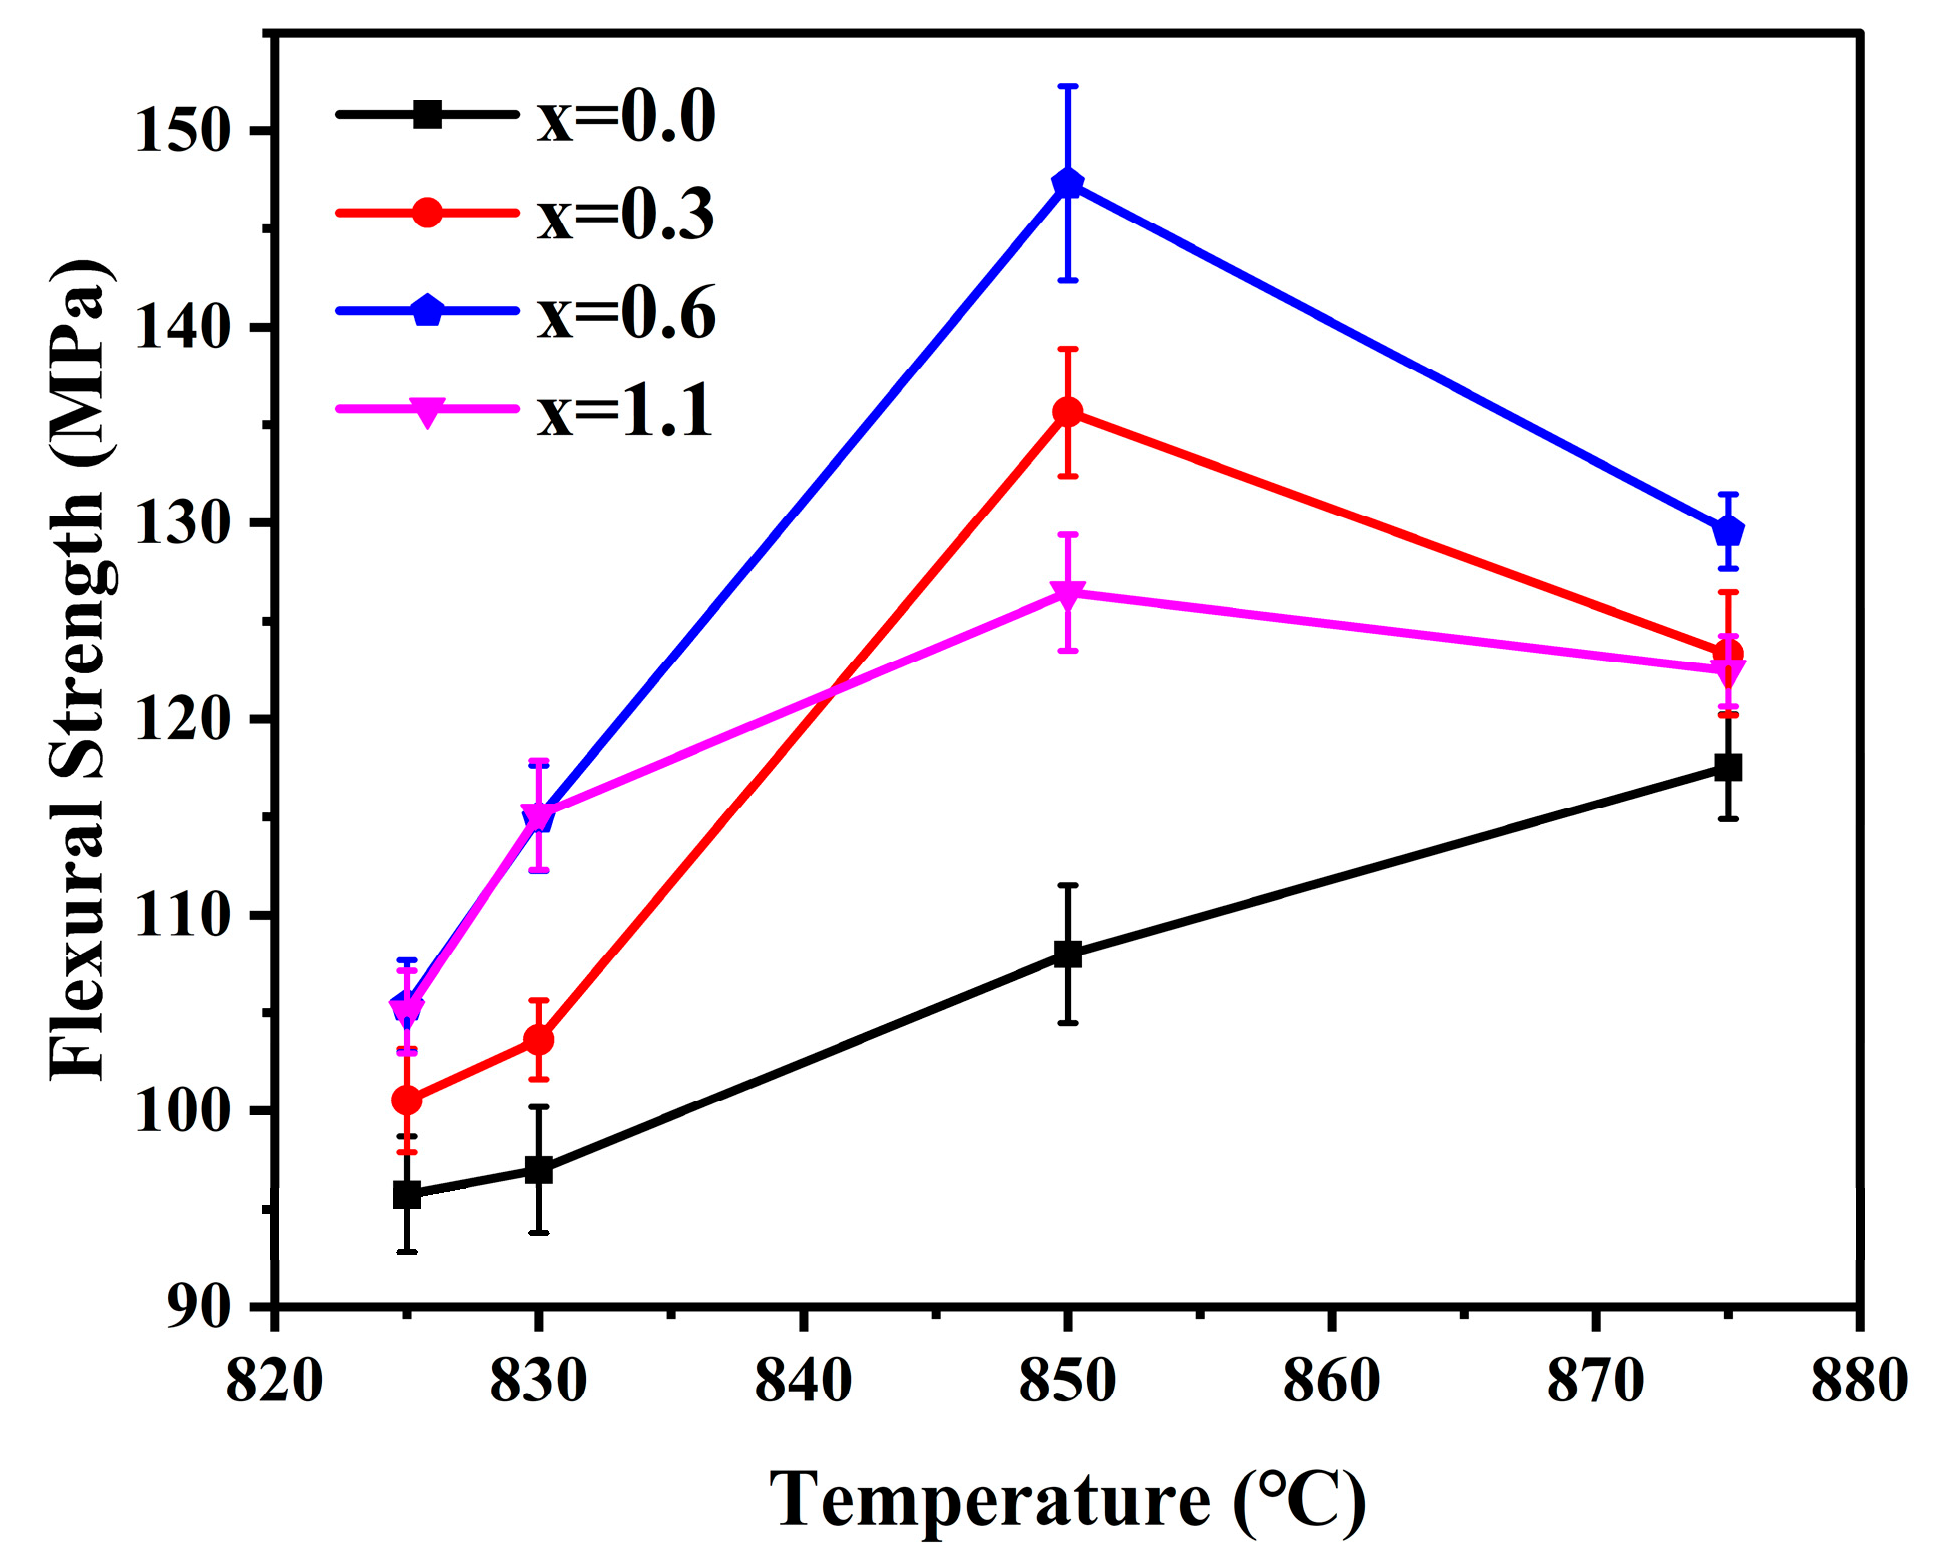
Figure 15 illustrates the flexural strength of the glass-ceramics prepared with varying Na
2O additions at different sintering temperatures. Overall, the variation trend of the flexural strength is highly consistent with that of the density, both being governed by the synergistic effect of the crystalline phase content and the degree of densification. The flexural strength of the samples exhibited a monotonic increase as the sintering temperature was raised from 825 °C to 850 °C. This phenomenon can be ascribed to two primary factors. First, the elevated sintering temperature promoted the precipitation and growth of cordierite crystals. Since cordierite crystals possess a higher elastic modulus and fracture surface energy than the amorphous glass phase, the increased crystallinity effectively enhanced the crack propagation resistance of the glass-ceramics [
50,
51]. Second, the higher sintering temperature facilitated the elimination of pores, significantly reducing the quantity and size of stress concentration sites, thereby improving the flexural strength of the samples [
52]. As the sintering temperature was further increased to 875 °C, the flexural strength of the glass-ceramics exhibited a certain degree of decline. In conjunction with the density analysis, this can be attributed to the excessively low viscosity of the parent glass at higher sintering temperatures, which led to premature surface sealing. This process prevented the escape of internal gases and resulted in the formation of closed pores, thereby increasing the quantity and size of stress concentration sites and ultimately reducing the flexural strength of the samples. Notably, despite the presence of a greater number of internal pores, the crystallinity of the blank sample increased from 77.76% to 83.56%. The sustained enhancement in flexural strength may be attributed to the fact that the positive contribution from the increased crystalline phase content outweighed the detrimental impact of the increased porosity.
In addition to the synergistic influence of the crystalline phase content and the degree of densification, the evolution of the samples’ flexural strength with varying Na
2O addition was also governed by factors such as lattice distortion, microcracks, and regions of phase boundary mismatch. The structural distortion of the six-membered rings, induced by the incorporation of Na
+ ions into the α-cordierite channels, may also alleviate the internal stress of the glass-ceramics by hindering the rotation of the rings, thereby enhancing the overall flexural strength of the samples [
53]. Concurrently, the addition of Na
2O suppressed the transformation from metastable μ-cordierite to α-cordierite, effectively mitigating the risk of microcracking associated with the volume changes during phase transition [
51]. Notably, as evidenced by
Table 5, the sample with x = 1.1 contains a certain amount of the NaAlSiO
4 phase. The lattice and thermal expansion mismatch between the NaAlSiO
4 secondary phase and the primary α-cordierite phase tends to introduce residual stresses at the phase boundary regions. These regions preferentially act as crack initiation sites under external loading, thereby leading to a reduction in the flexural strength of the samples [
54]. Ultimately, a maximum flexural strength of 147.3 Mpa was achieved at a sintering temperature of 850 °C with a Na
2O addition of 0.6 wt.%.
3.8. Vickers Hardness
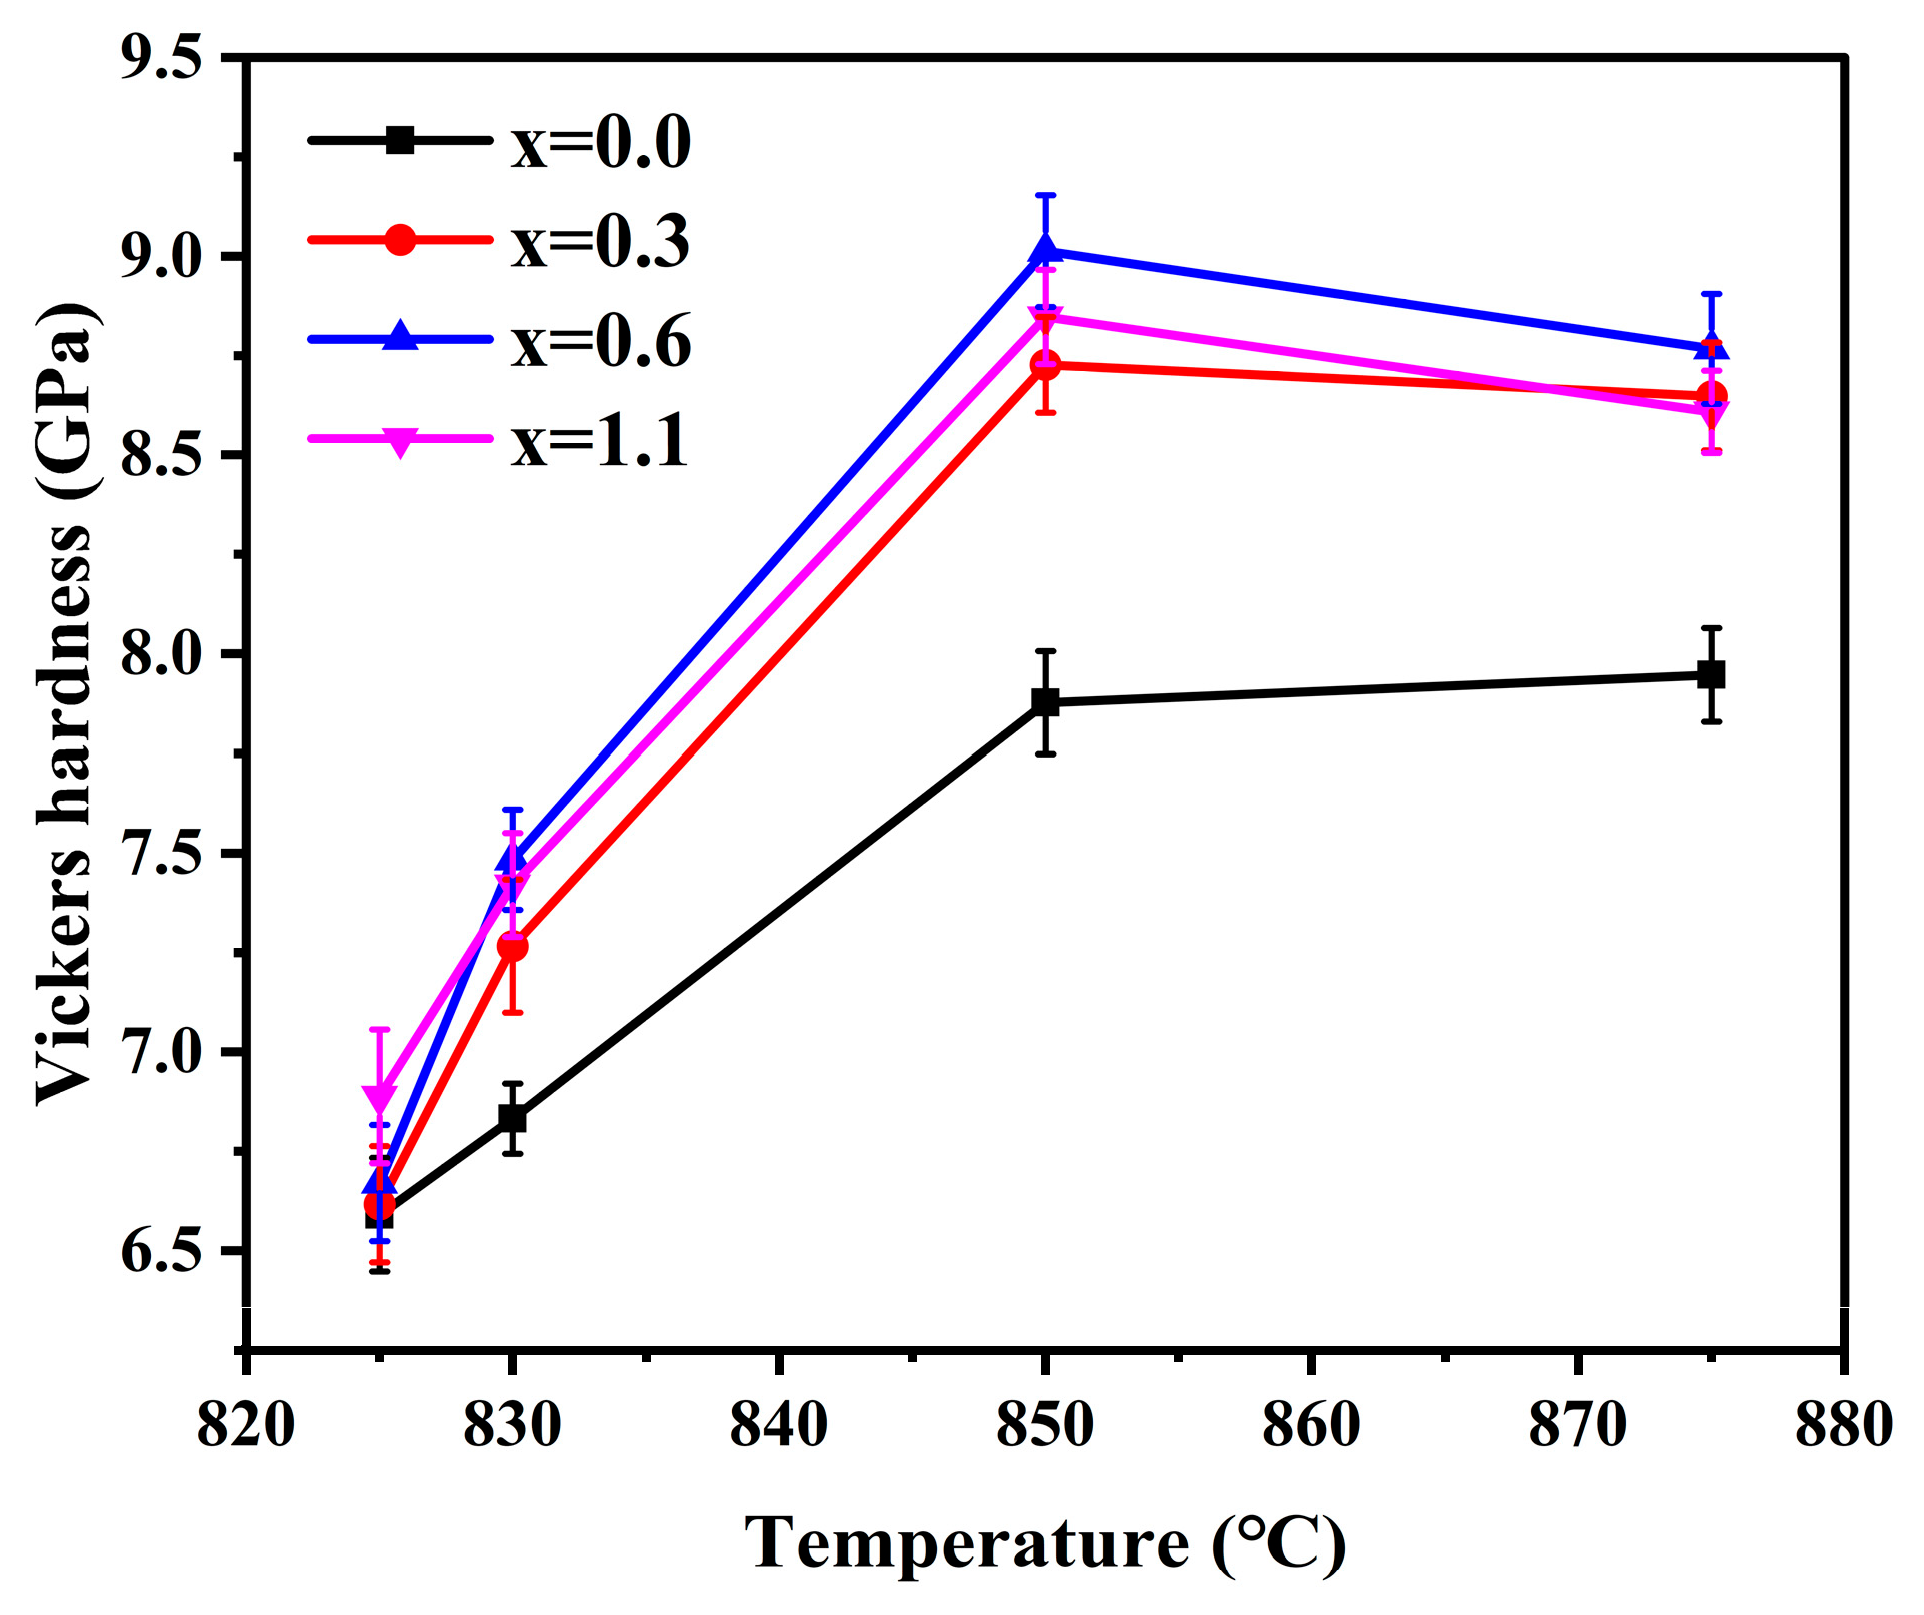
Figure 16 presents the Vickers hardness of glass-ceramics with different Na
2O addition amounts prepared at different sintering temperatures. Overall, the Vickers hardness of the samples first increased and then decreased with increasing sintering temperature, and after the addition of Na
2O, the overall hardness of the samples was higher than that of the sample without Na
2O addition.
The Vickers hardness of glass-ceramics is mainly governed by the combined effects of microstructure, degree of densification, residual glassy phase, and the type and amounts of crystalline phases. As the sintering temperature increased from 825 °C to 850 °C, the Vickers hardness of all samples gradually increased. This indicates that, within this temperature range, the increase in sintering temperature is beneficial to improving the densification of the samples, reducing pore defects, and promoting the crystallization of α-cordierite, thereby jointly enhancing the hardness. Compared with the residual glassy phase, the α-cordierite crystalline phase generally possesses higher local rigidity [
50,
51], whereas internal defects such as pores reduce the effective load-bearing area of the material and induce stress concentration under the indentation stress field, thereby weakening the resistance of the material to indentation-induced deformation [
52]. When the sintering temperature was further increased to 875 °C, the Vickers hardness of the samples decreased to some extent, which may be associated with factors such as the excessively rapid viscous flow of the glass melt at higher sintering temperatures, leading to the formation of local closed pores and grain coarsening.
The introduction of an appropriate Na
2O addition amount is beneficial for improving the Vickers hardness of the samples. This is mainly associated with the role of Na
2O in promoting low-temperature densification, enhancing the crystallization of α-cordierite, and reducing pore defects. It is worth noting that, as shown in
Table 5, when the sintering temperature reached 875 °C, the Vickers hardness of the x = 1.1 sample decreased to a certain extent. In addition to the reasons discussed above, this may also be related to the presence of a certain amount of the secondary NaAlSiO
4 crystalline phase in the sample. A certain degree of lattice and thermal expansion mismatch may exist between the NaAlSiO
4 phase and the primary α-cordierite crystalline phase, thereby introducing residual stress in the interfacial regions and consequently reducing the Vickers hardness [
54]. When the sintering temperature was 850 °C and the Na
2O addition amount was 0.6 wt.%, the sample exhibited the highest crystallinity, the smallest number and size of pores, and the greatest degree of densification, with the Vickers hardness reaching a maximum value of 9.01 Gpa.
3.9. Dielectric Properties
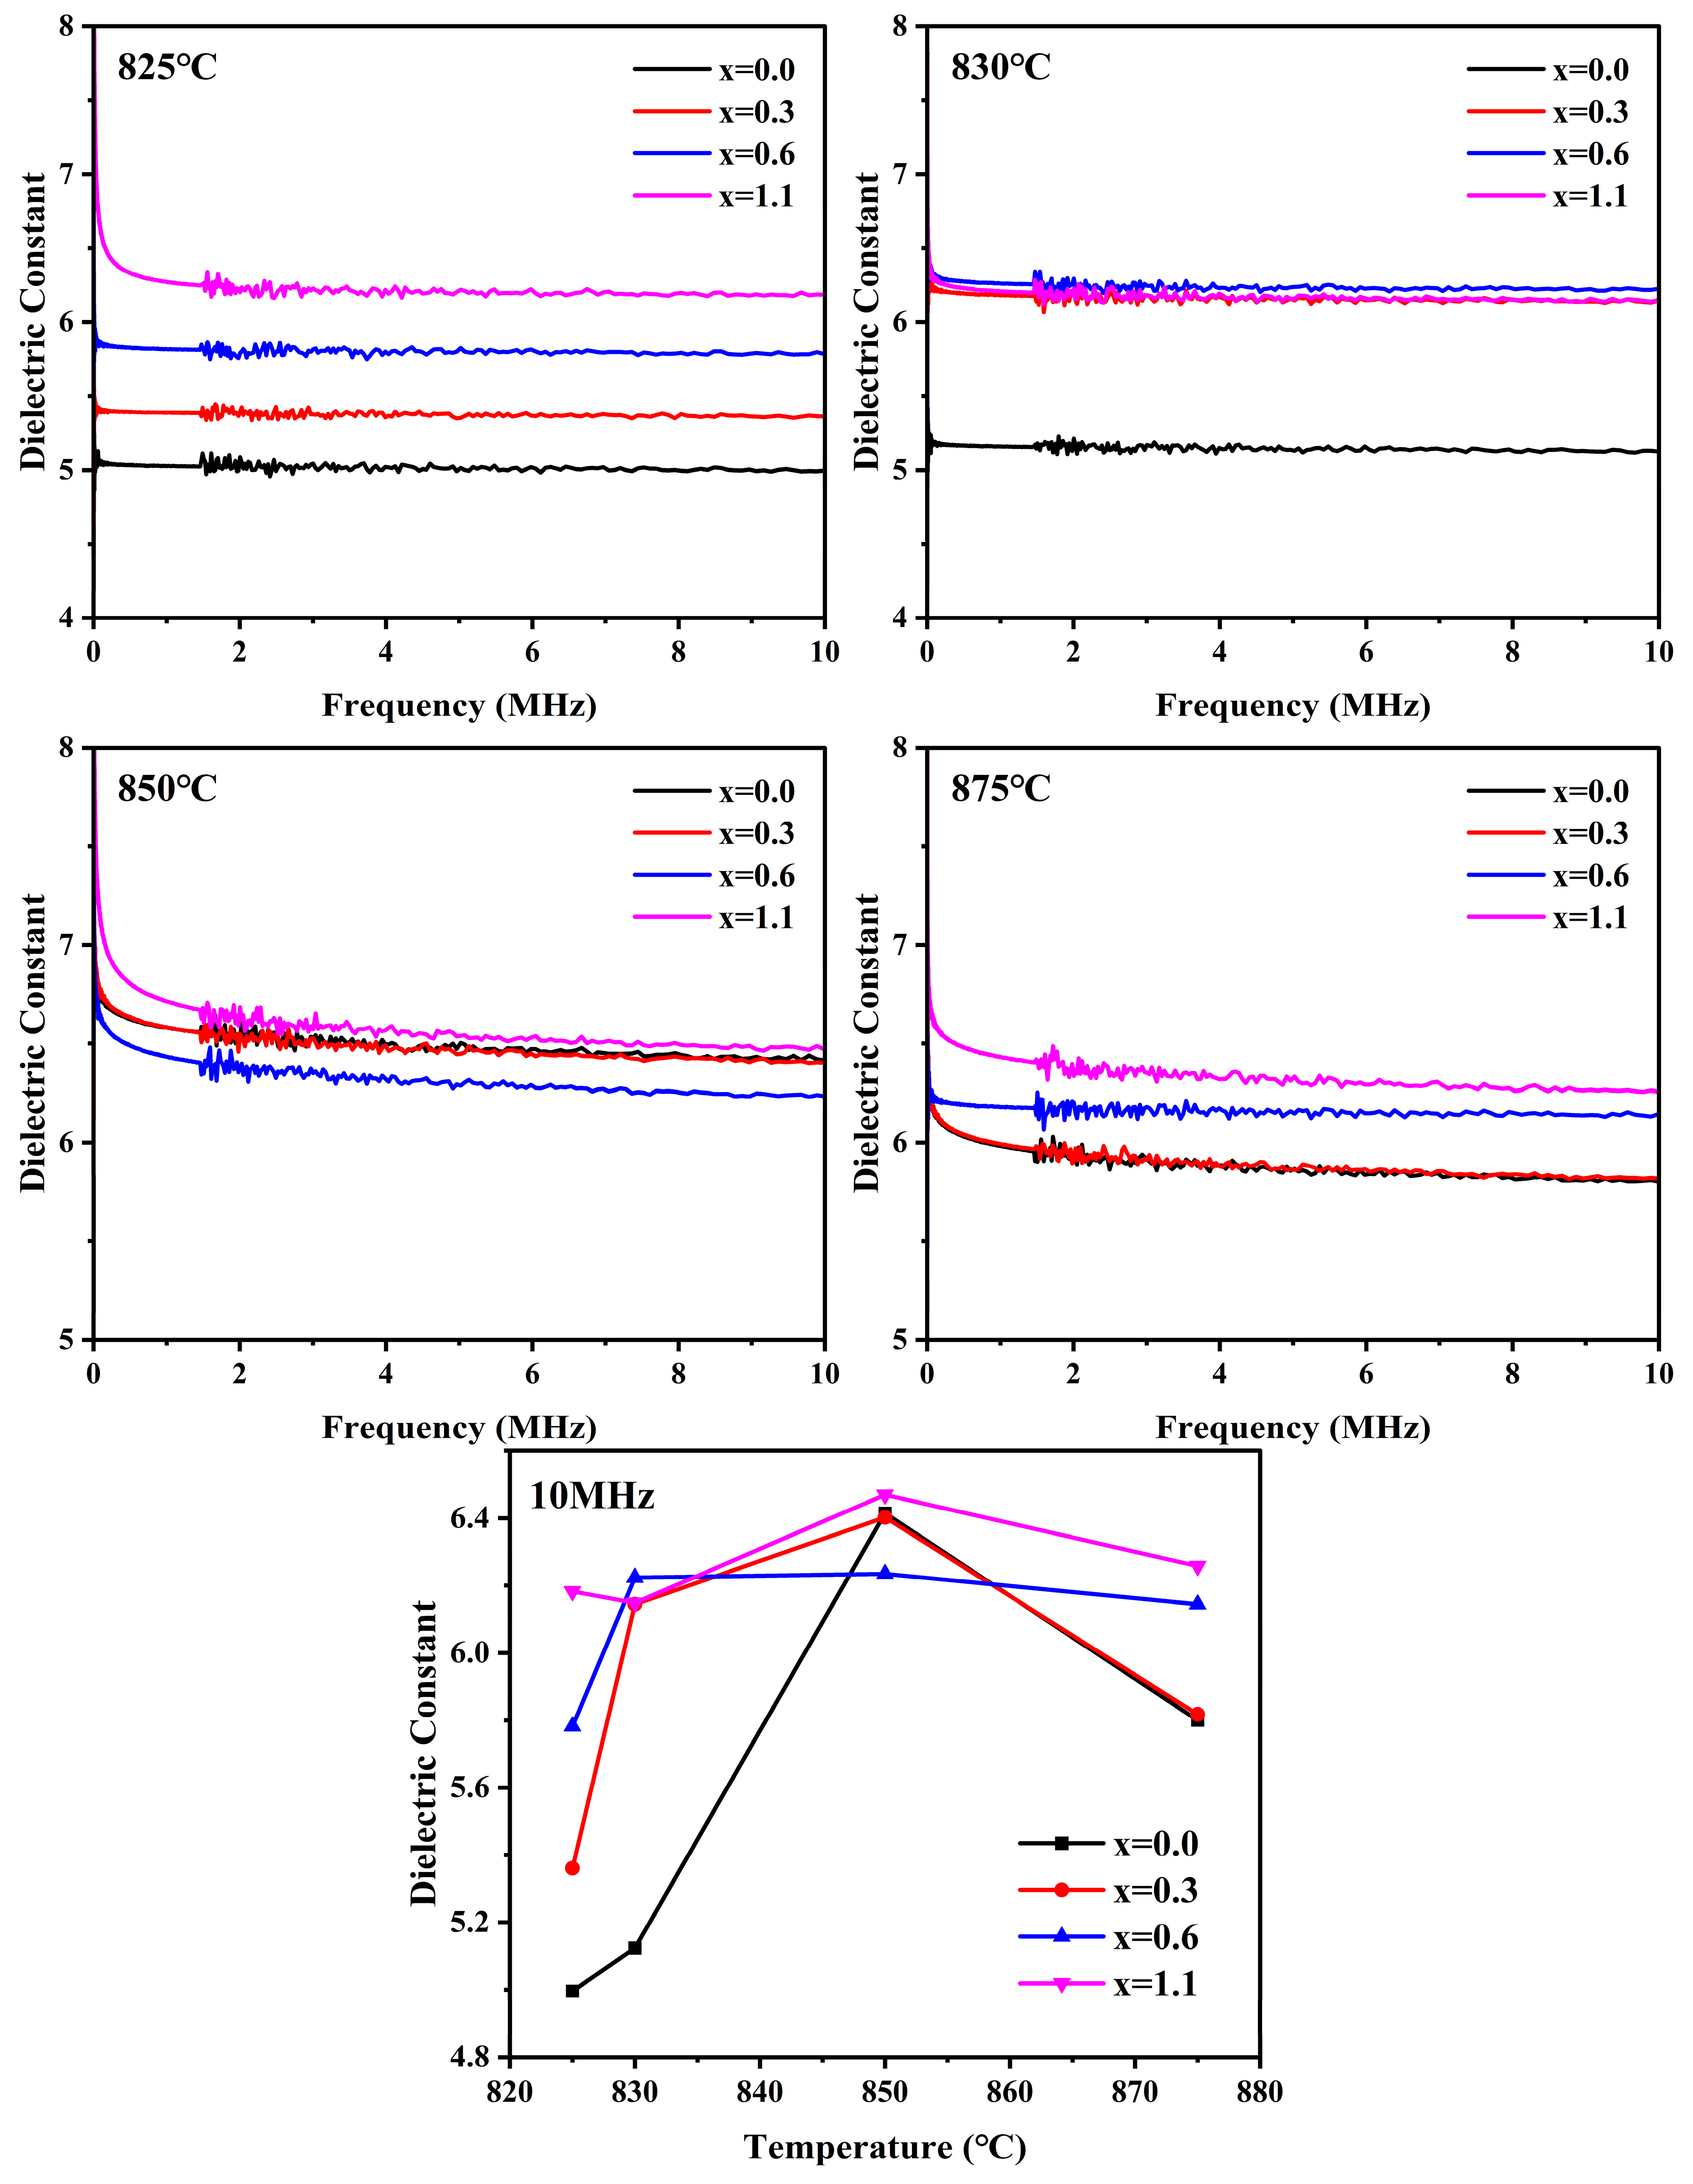
Figure 17 illustrates the frequency dependence (20 Hz–10 MHz) of the dielectric constant for cordierite glass-ceramics with varying Na
2O additions prepared at different sintering temperatures, as well as the dielectric constant values at 10 MHz. As shown in
Figure 16 the dielectric constant of the samples decreases gradually with increasing frequency. This phenomenon is attributed to the fact that at low frequencies, various internal polarization mechanisms can sufficiently respond to the alternating electric field. However, as the frequency increases, the oscillation period of the electric field progressively shortens until it is less than the relaxation time required for the internal polarization response. Consequently, certain polarization mechanisms, such as interfacial and dipolar polarization, fail to keep pace with the rapid oscillations of the electric field, leading to the phenomenon of polarization lag [
55,
56].
The dielectric constant of glass-ceramics is governed by a combination of factors, including the type and content of crystalline phases, the composition of the residual glassy matrix, the microstructure, and interface effects. Given that the dielectric constant of α-cordierite (~5) is lower than that of the residual glass phase, an increase in its volume fraction will, to a certain extent, lower the effective dielectric constant of the samples [
5]. Furthermore, the presence of pores is analogous to the introduction of a low-permittivity air phase (~1), which significantly reduces the overall dielectric constant of the glass-ceramics [
57]. In this study, the crystalline phase and its content, the glass phase composition, and the degree of densification are identified as the primary determinants of the dielectric constant.
At sintering temperatures of 825 °C and 830 °C, the glass-ceramic samples were in the initial sintering stage, consisting of a predominant glassy matrix and a minor crystalline fraction. The low degree of densification and high porosity at this stage resulted in a relatively low overall dielectric constant. At this stage, the dielectric constant of the glass-ceramics is predominantly governed by the composition of the glassy matrix and the presence of porosity. With increasing Na
2O addition, the dielectric constant of the samples exhibits a gradual upward trend. This is primarily attributed to the role of Na
2O as a network modifier; its incorporation disrupts the three-dimensional glass network, generating a higher concentration of NBOs. The resulting decrease in the degree of network polymerization enhances the contribution of ionic polarization [
58]. Concurrently, the addition of Na
2O promotes sintering densification, thereby mitigating the ‘dilution effect’ that pores exert on the overall permittivity of the glass-ceramics. As the sintering temperature was increased to 850 °C, both the crystallinity and densification of the samples exhibited a significant increase, as evidenced by
Table 5 and
Figure 16. At this stage, the evolution of the overall dielectric constant was primarily governed by a competitive mechanism between the degree of densification (positive contribution) and crystallization (negative contribution). Although the precipitation of the primary α-cordierite phase tends to decrease the overall dielectric constant, the enhancement in densification triggered by the elevated sintering temperature remains the predominant factor, ultimately resulting in a net increase in the dielectric constant of the samples. Notably, as the Na
2O addition increased, the dielectric constant of the samples exhibited an initial decrease followed by a subsequent increase, which is consistent with the variation trend of crystallinity. This phenomenon can be attributed to the high degree of densification achieved at 850 °C; under these conditions, the volume fraction of the crystalline phase becomes the dominant factor governing the dielectric properties. Regarding the x = 1.1 sample, although its crystallinity is higher than that of the blank sample, the presence of 4.26% of the high-permittivity NaAlSiO
4 phase results in a dielectric constant that exceeds that of the blank sample. As the sintering temperature was further raised to 875 °C, the crystallinity of the samples showed no significant variation; however, the degree of densification declined to some extent, accompanied by an increase in porosity, which ultimately led to a reduction in the dielectric constant.
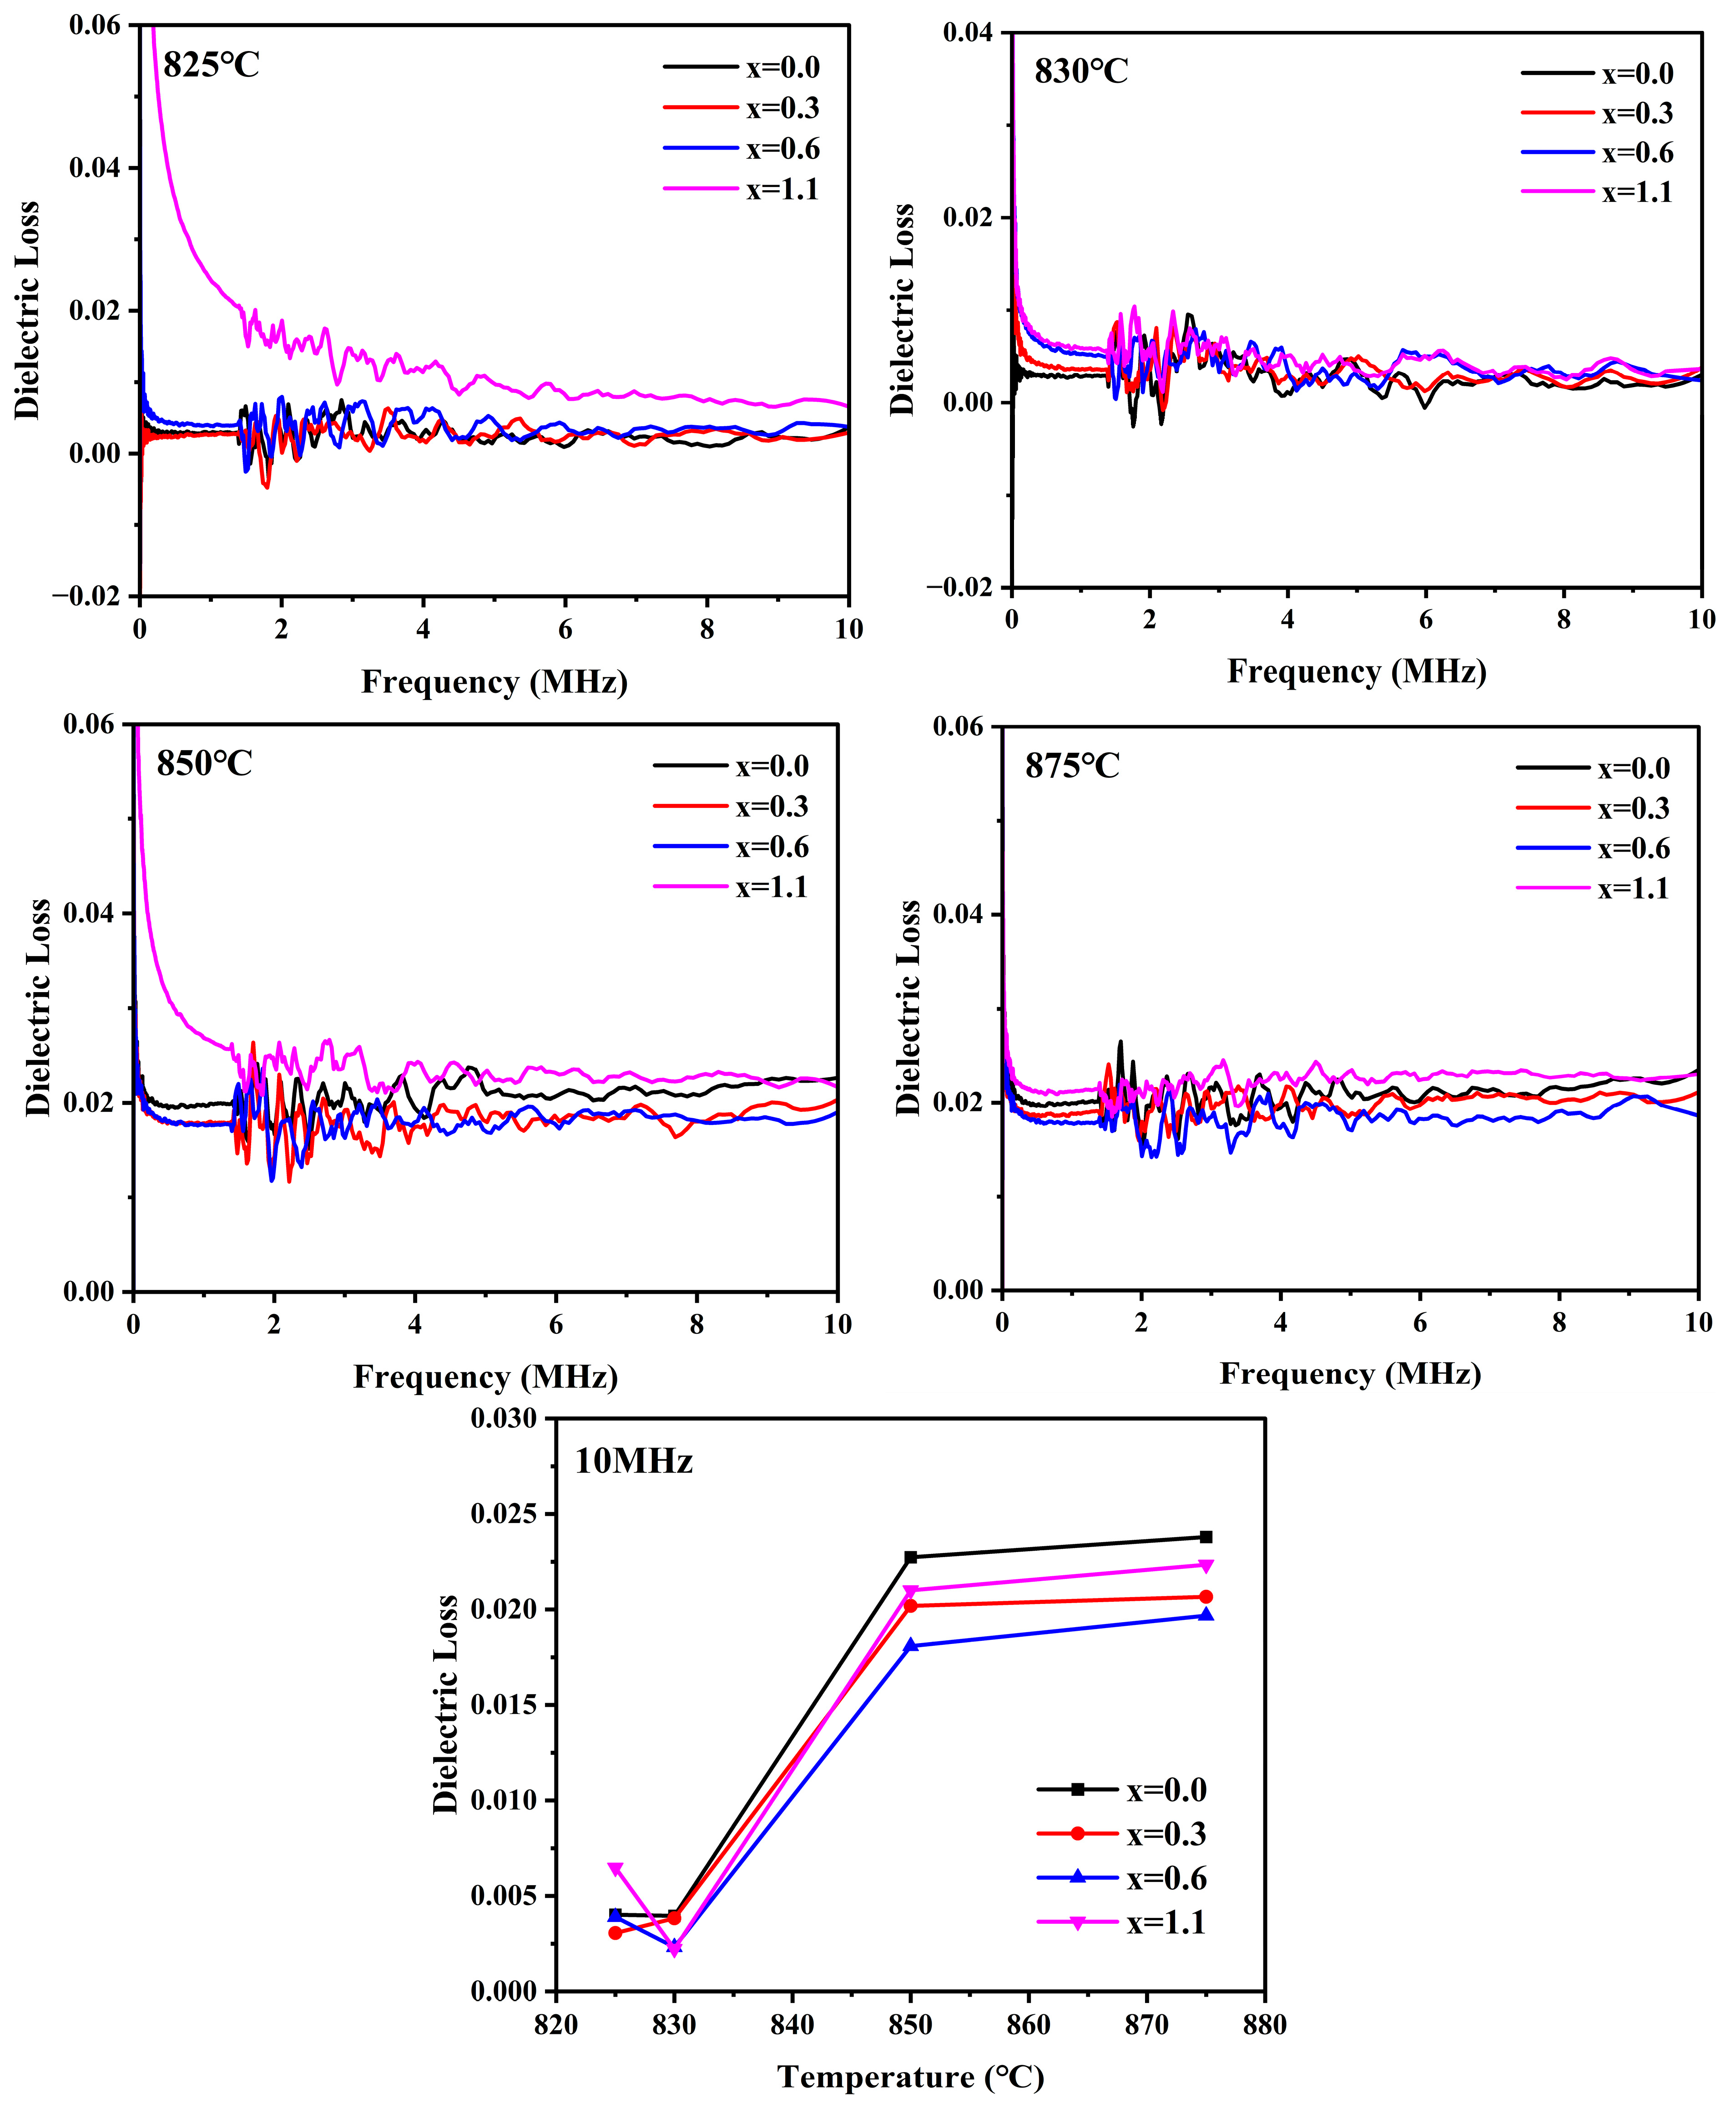
Figure 18 illustrates the frequency dependence (20 Hz–10 MHz) of the dielectric loss for cordierite glass-ceramics prepared from parent glasses with varying Na
2O additions at different sintering temperatures, as well as the dielectric loss values at 10 MHz. It can be observed that the variation trend of the dielectric loss exhibits distinct staged characteristics, which are closely associated with the phase transition kinetics and microstructural evolution of the samples. At sintering temperatures of 825 °C and 830 °C, the samples were in the initial sintering stage. During this phase, the dielectric loss was predominantly governed by the conduction loss of the residual glassy matrix and the Maxwell–Wagner interfacial polarization loss at the gas–solid interfaces [
59]. The addition of Na
2O acts to disrupt the glass network structure, leading to an increase in NBO content and a corresponding decrease in BO content. This reduction in the degree of network polymerization facilitates the migration of charge carriers, thereby intensifying the conduction loss and ultimately elevating the overall dielectric loss of the samples [
60]. Simultaneously, Na
2O lowers the viscosity of the glass melt and promotes sintering densification, which effectively inhibits pore-induced interfacial polarization effects, thus contributing to a reduction in the overall dielectric loss. At 825 °C, the dielectric loss of the sample with x = 1.1 was significantly higher than that of the other compositions, as the conduction loss induced by the high Na
+ concentration became the dominant factor. Conversely, at 830 °C, the sample with x = 0.6 exhibited the lowest dielectric loss, attributed to its optimal densification and minimal pore defects, which effectively suppressed interfacial polarization. The evolution of the dielectric loss with varying Na
2O addition is fundamentally the result of a competitive interplay between the suppression of interfacial polarization through densification and the enhancement of conduction loss induced by Na
+ ions. As the sintering temperature was further increased to 850 °C and 875 °C, the dielectric loss of all samples exhibited a pronounced, step-like increase, which was accompanied by the extensive precipitation of the primary α-cordierite phase. This phenomenon is the result of the coupling of multiple effects. Both elevated sintering temperatures and appropriate additions of Na
2O effectively enhance the crystallinity of the samples. Given the low intrinsic dielectric loss of α-cordierite crystals, an increase in crystallinity should theoretically reduce the overall dielectric loss. However, this increase in crystallinity concurrently leads to a deterioration in dielectric properties. Firstly, as continuous crystallization proceeds, the added Na
+ ions and impurity ions (such as Na
+, K
+ and Ca
2+) originating from the perlite tailings are excluded from the cordierite crystal lattice and consequently become highly concentrated within the diminishing residual glass phase. This enrichment significantly elevates the concentration of polarizing ions in the residual glass, thereby inducing intense dipolar relaxation loss [
61]. Secondly, the rapid increase in crystallinity generates a vast number of crystal-glass interfaces. Charges tend to accumulate at these interfaces, significantly potentiating the interfacial polarization effect [
62,
63]. Notably, as illustrated in
Figure 5, excessive Na
2O addition induces the formation of the NaAlSiO
4 phase. This secondary phase possesses a high intrinsic dielectric loss, which further aggravates the overall loss of the system. At 850 °C, the dielectric loss was predominantly governed by the enrichment of the residual phase and interfacial polarization effects. Specifically, the x = 0.6 sample exhibited the minimum dielectric loss, owing to its highest bulk density and the fewest structural defects. Conversely, the x = 0.0 sample showed the highest loss due to its poor degree of densification and the significant presence of pore defects. As the sintering temperature was further elevated to 875 °C, the degree of densification of the samples declined; however, the dielectric loss remained at a sustained high level. In summary, the dielectric loss of the samples at this stage is predominantly governed by a competitive interplay between the reduction in intrinsic loss driven by the enhancement of crystallinity and the elevation in loss resulting from residual phase enrichment and intensified interfacial polarization. Na
2O regulates this competitive relationship and the final dielectric loss through the modulation of the glass network structure, densification kinetics, crystallization behavior, and the formation of secondary phases.
3.10. Thermal Expansion Properties
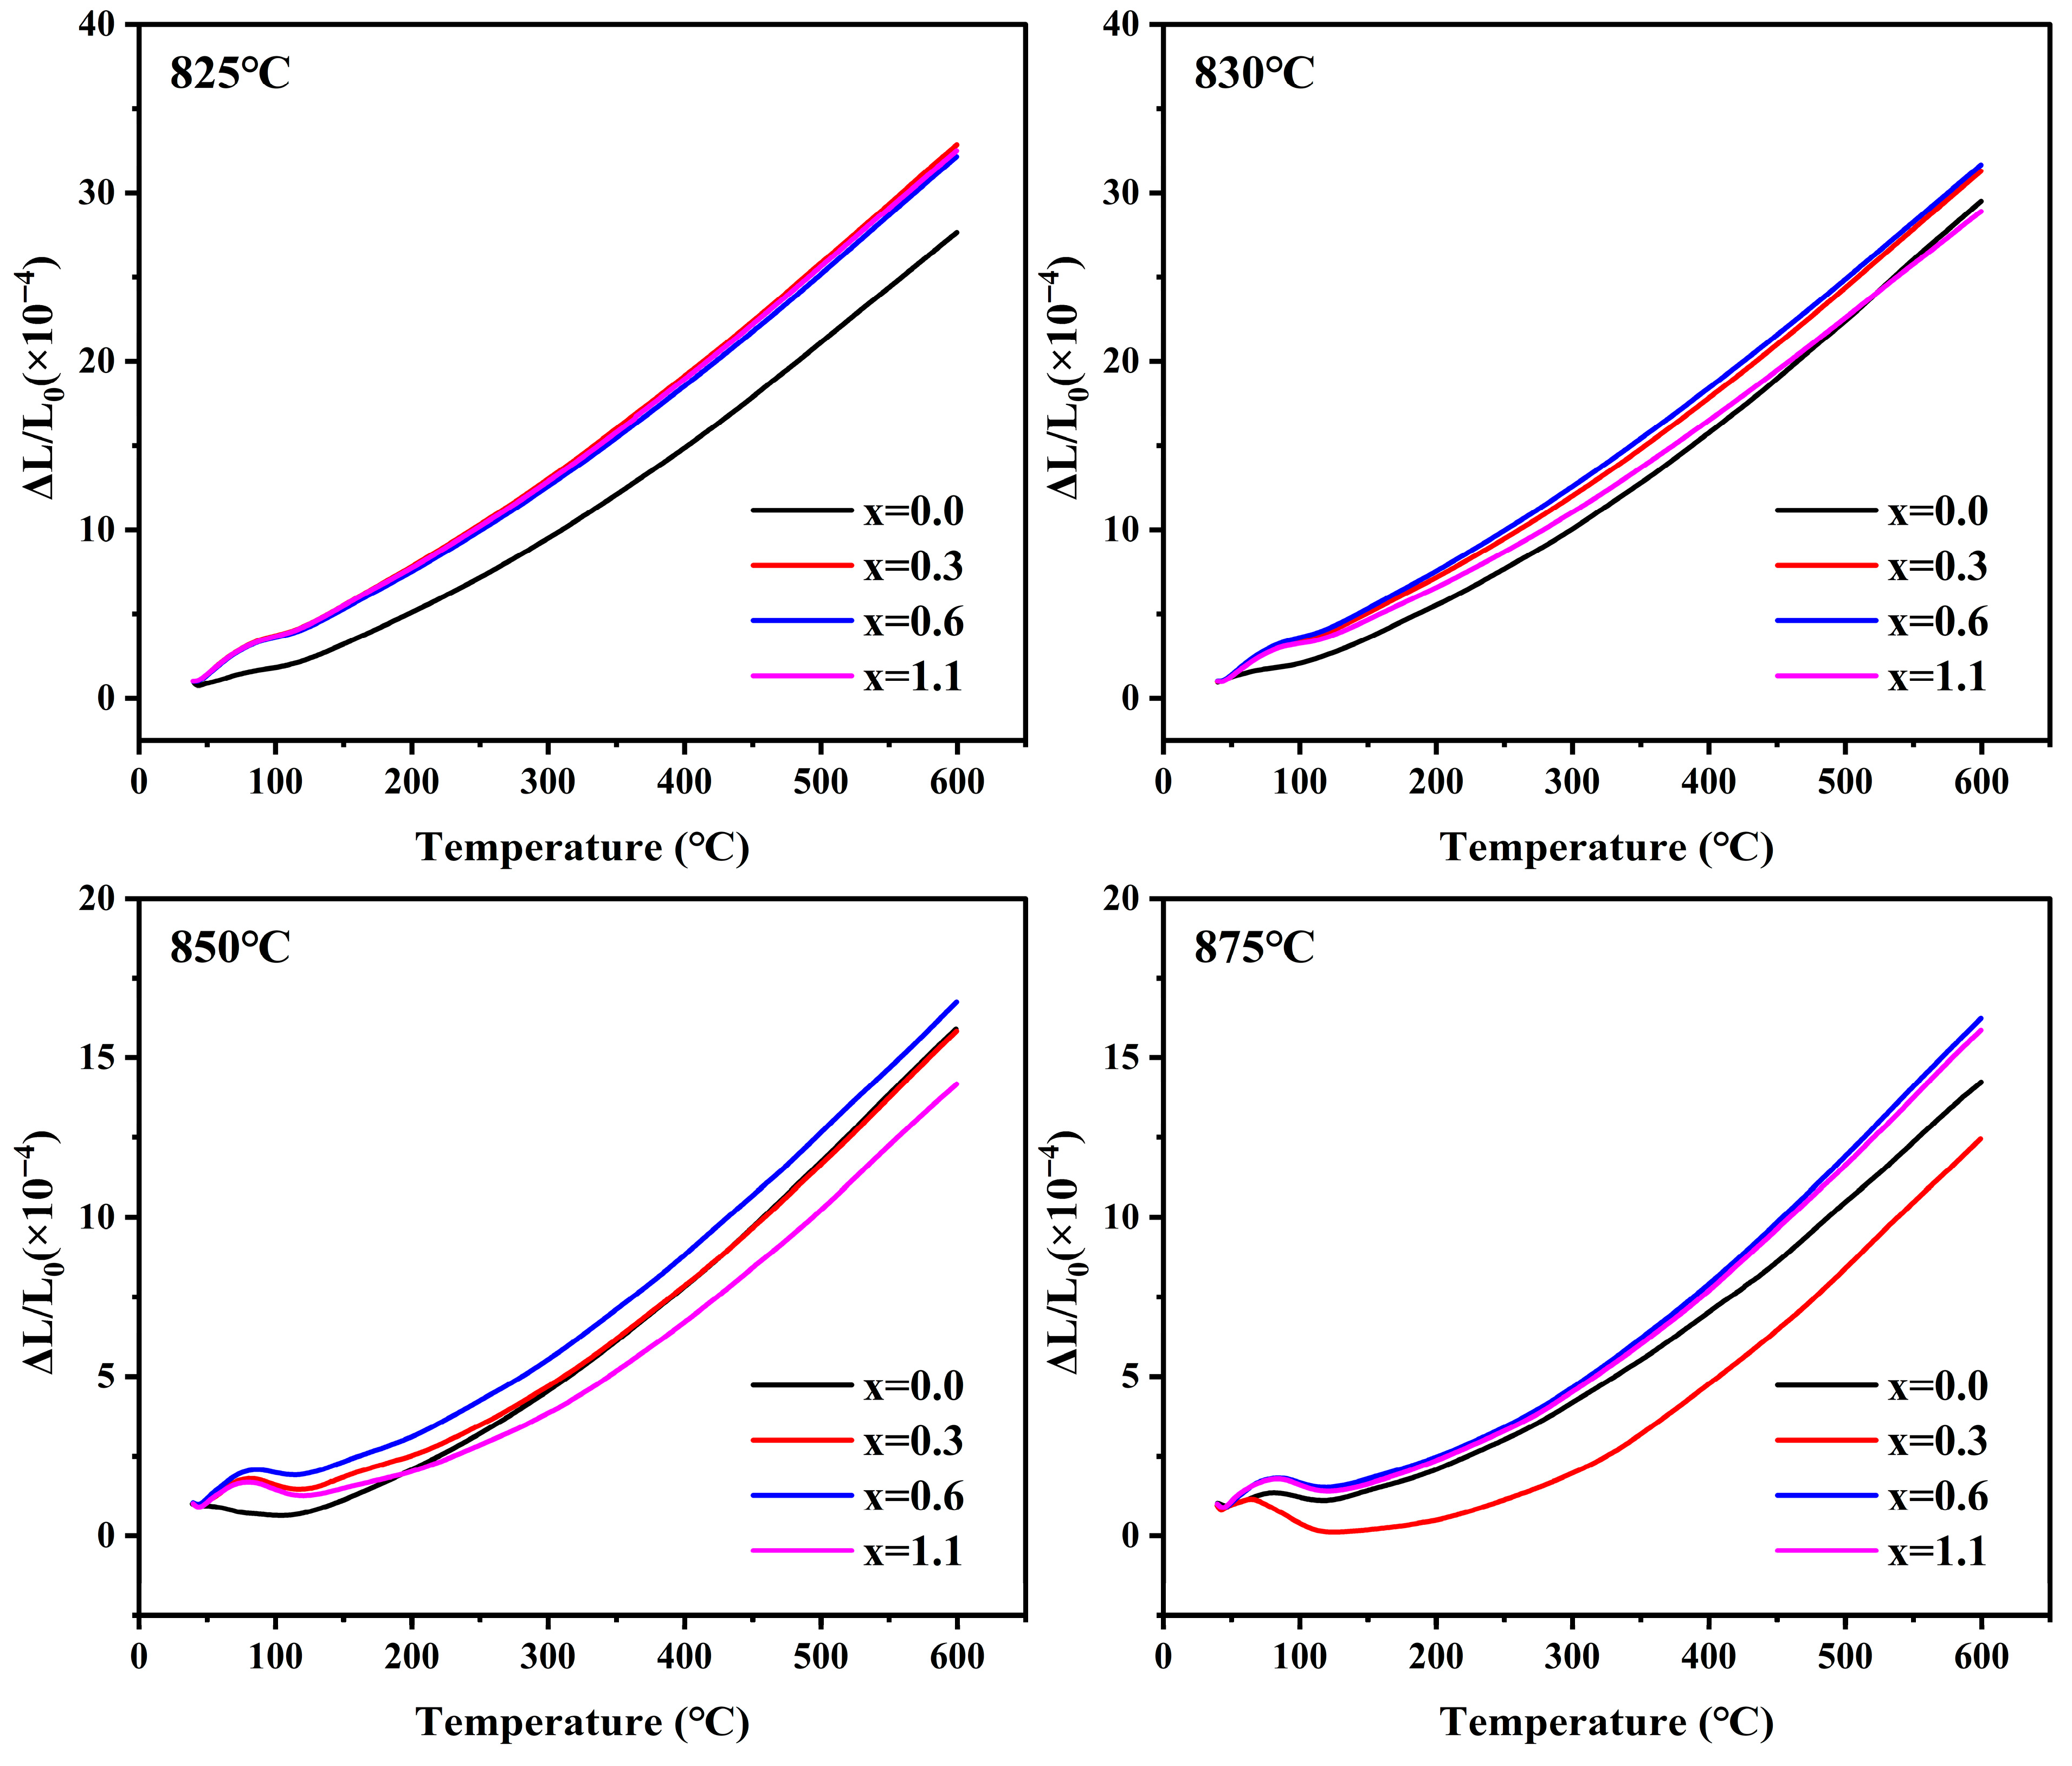
Figure 19 illustrates the thermal expansion behavior in the range of 40 °C to 600 °C for cordierite glass-ceramics prepared at different sintering temperatures. The specific values of the average CTE calculated in the 100–600 °C interval are listed in
Table 9. When the sintering temperature increases from 825 °C to 850 °C, the average CTE of the samples decreased significantly. This change is primarily related to the evolution of the crystalline phases. As the sintering temperature rose, the low-thermal-expansion α-cordierite phase gradually formed, and its content increased, while the relative content of the high-thermal-expansion residual glass phase decreased. As a result, the system transitioned from being glass-phase-dominated to crystal-phase-dominated, leading to a significant reduction in the overall average CTE of the samples. When the sintering temperature was further raised to 875 °C, the average CTE of the x = 0.0–0.6 samples continued to decrease, indicating that, in addition to changes in crystalline phase composition, alterations in the microstructure of the samples might also influence their thermal expansion response. As shown in
Figure 14, the density of the samples decreased to some extent, suggesting that the densification of the samples was reduced, and the internal porosity might have increased. Such microstructural changes could weaken the apparent thermal strain response of the glass-ceramics, resulting in a lower measured average CTE [
64,
65]. Furthermore, the thermal expansion anisotropy of the cordierite crystal axes may induce microcracks at the domain boundaries, which could also contribute to the reduction in the overall CTE of the samples [
66]. For the x = 1.1 sample, its average CTE increased anomalously. This is likely related to the increased relative proportion of NaAlSiO
4 phase in the sample. Since the CTE of NaAlSiO
4 is higher than that of α-cordierite, the increase in its proportion would raise the overall average CTE of the sample [
67]. Furthermore, by comparing the average CTEs of glass-ceramic samples with varying Na
2O additions prepared at their respective optimal sintering temperatures, with increasing Na
2O additions, the crystallinity of the samples first increased and then decreased, whereas the average CTE exhibited an increasing trend. Predecki et al. [
68] proposed that the thermal expansion driving force of cordierite crystals is the thermal deformation of [MgO
6] octahedra. Due to the weak bond strength between Mg and O, this results in expansion along the a-axis and contraction along the c-axis, manifesting as anisotropic thermal effects that cause the flattening of the [MgO
6] octahedra. Therefore, when Na
+ enter the six-membered ring channels of α-cordierite, they may hinder the thermal contraction along the c-axis of α-cordierite. This reduces the contribution of anisotropic contraction, thereby increasing the average CTE of the sample.




 ,
,