3.1. Microstructure and Phase Characterization
The elemental chemical composition of the synthesized (TiAlTaZrNb)Cx coatings, as determined by EDS/FESEM, is listed in
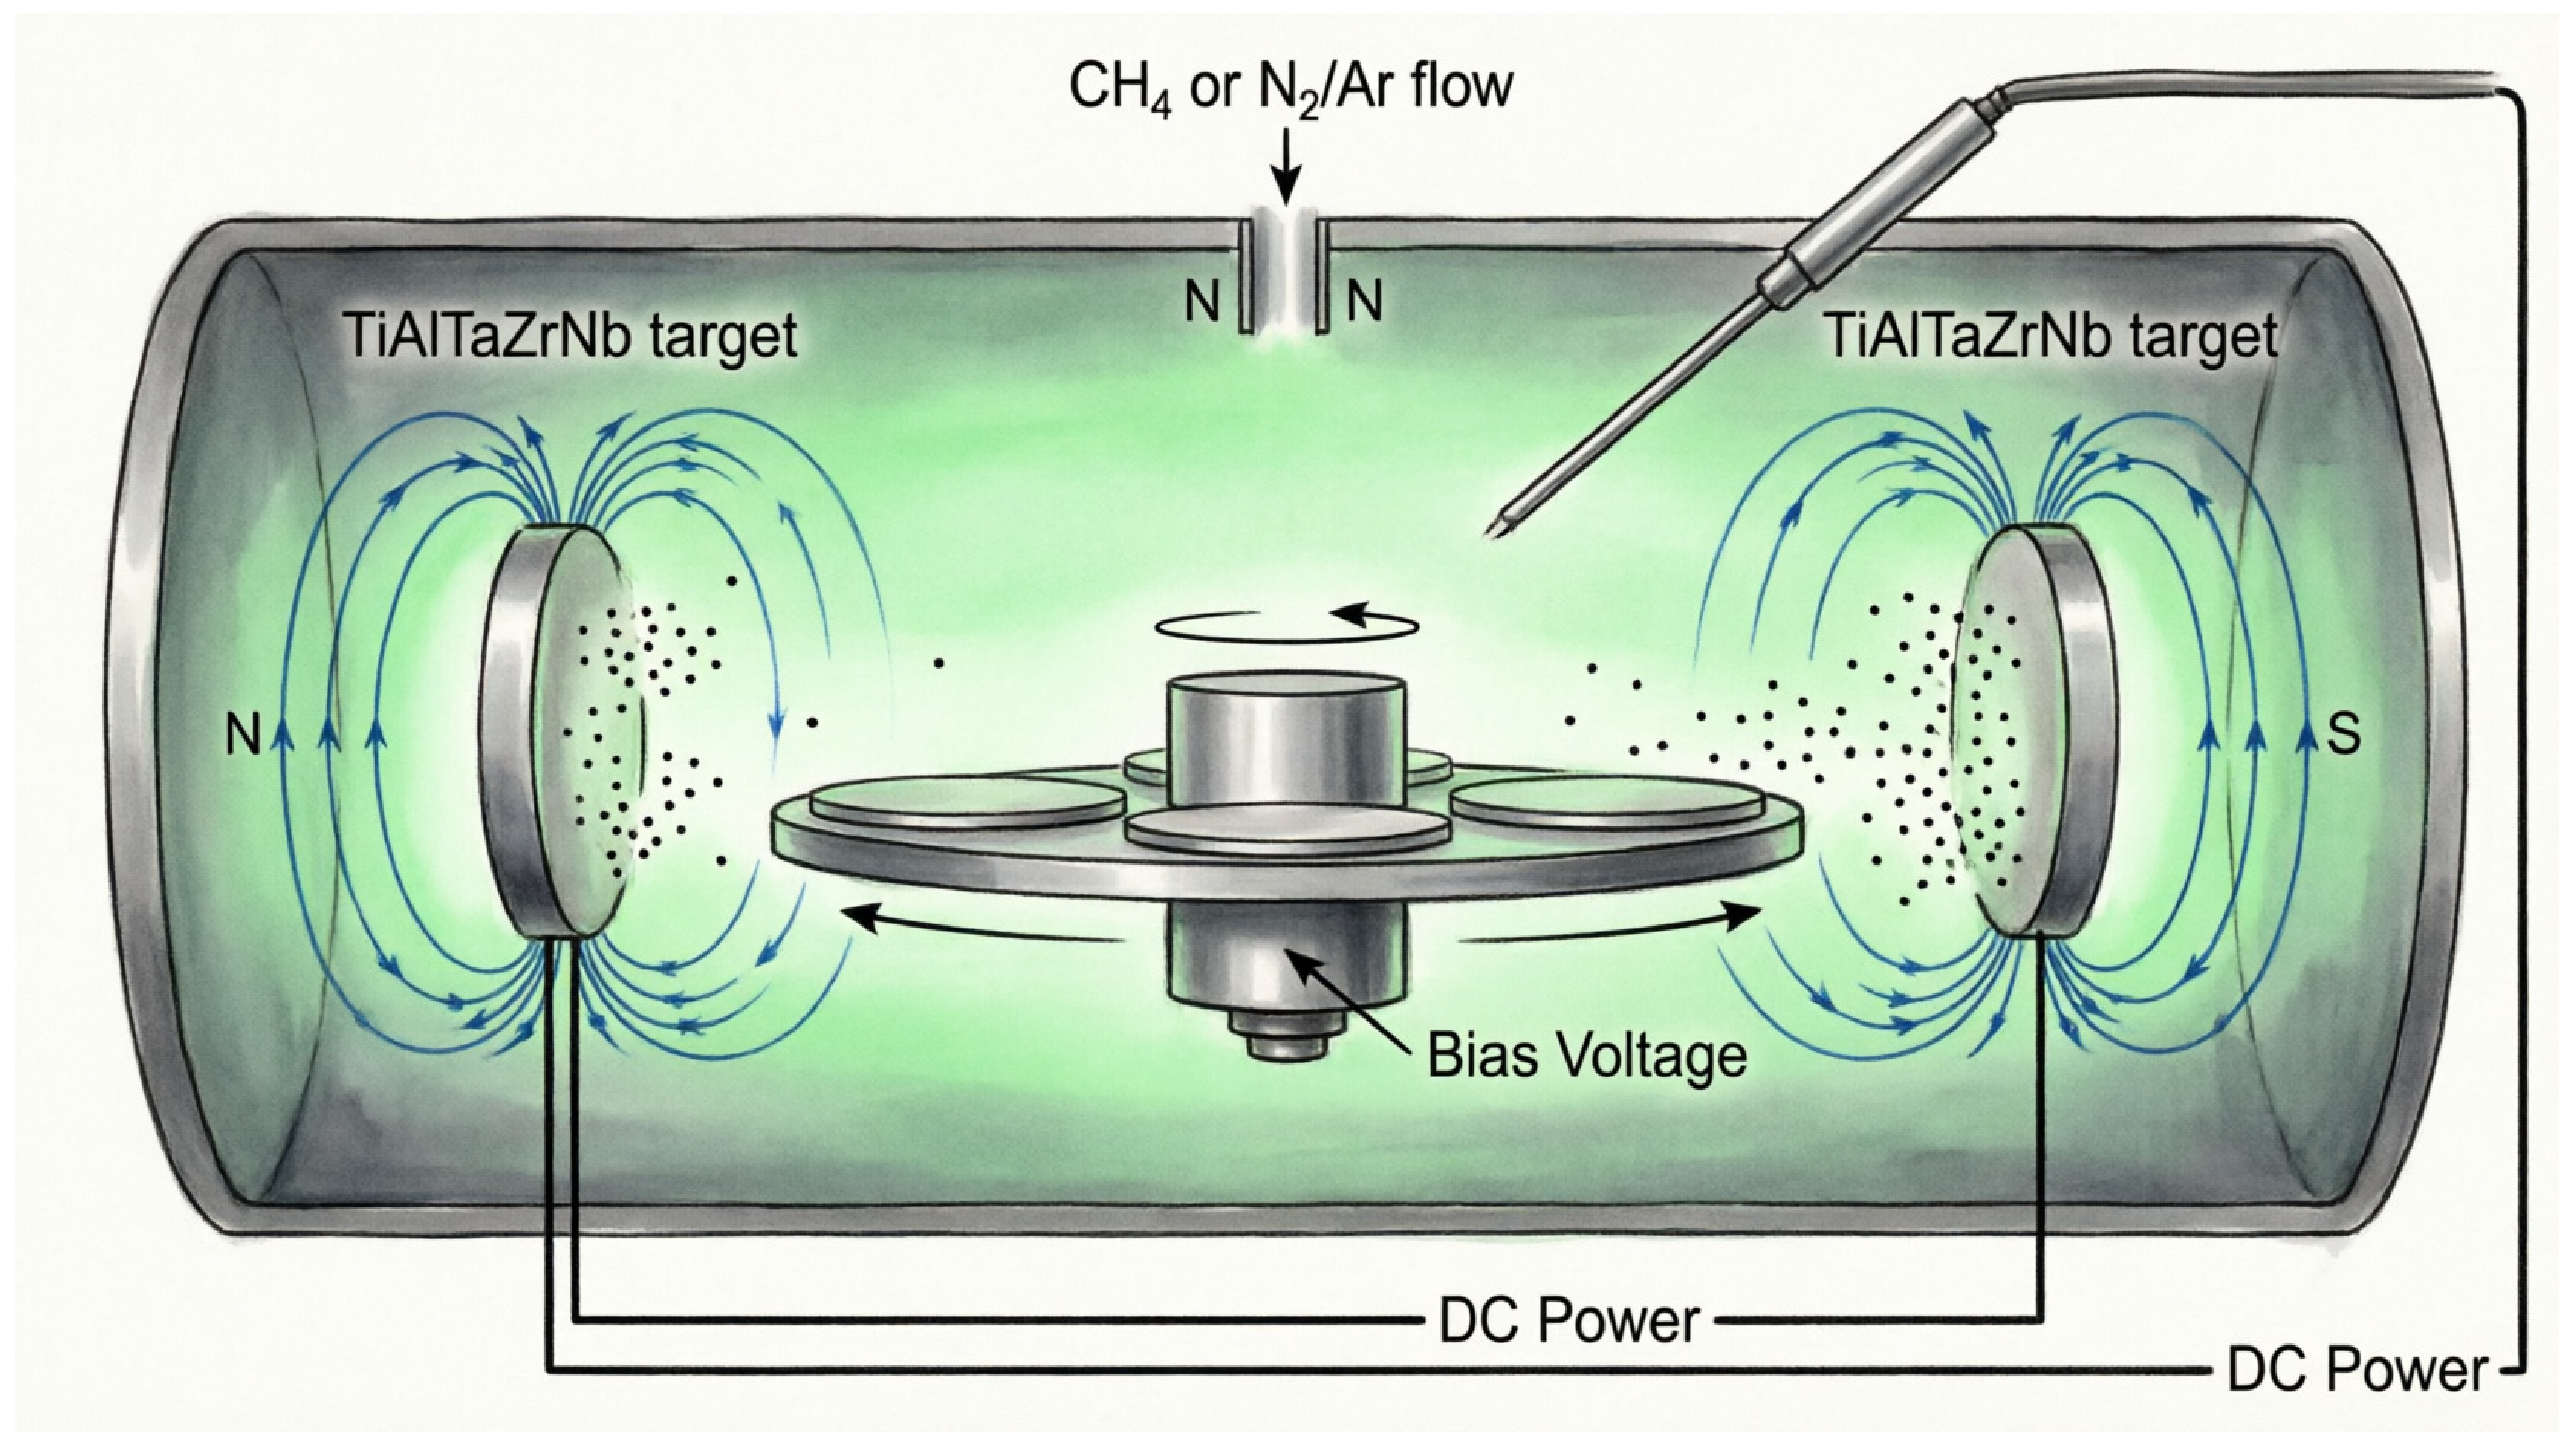
Table 2. The carbon content increased from 23.7 at.% to 55.3 at.% with increasing methane flow rate from 6 sccm to 12 sccm. Oxygen levels below 3.3 at.% were detected, which are attributed to residual oxygen in the vacuum chamber and possible surface contamination during handling. Notably, the aluminum content increases with methane flow, while the concentration of refractory metals (Ti, Ta, Zr, Nb) decreases slightly. This behavior may be related to preferential target poisoning during reactive sputtering. Ti, Ta, Nb and Zr form stable carbide phases with lower sputtering yields than their metallic counterparts, whereas Al-containing surface compounds are generally less stable. Consequently, increasing methane flow may promote relative Al enrichment in the deposited coatings. Additionally, differences in sputtering yields, angular distribution of sputtered species, and scattering in the gas phase contribute to compositional differences between the target and the film. The variation in the relative concentrations of individual refractory metals (e.g., the decrease in Nb from 20.8 at.% in C6 to 9.6 at.% in C12) can be attributed to differences in carbide formation thermodynamics and sputtering rates of the metallic elements in the presence of increasing reactive gas. In summary, it should be clarified that the difference in the atomic content of the deposited coatings arises from target poisoning and the varying sputtering rates of the constituent metallic elements. The gradual target poisoning, particularly at high CH
4 flow rates, reduces the deposition rate (
Table 3) and modifies the film composition, favoring carbon incorporation and the formation of carbon-rich secondary phases (TiC, TaC, and graphite), as observed in the XRD and Raman patterns shown below.
It should be noted that carbon quantification by EDS in carbide coatings is subject to well-known uncertainties. The carbon contents reported in
Table 2 should therefore be considered semi-quantitative, although the trend with increasing methane flow is reliable.
Table 3 shows the thickness and deposition rate of the deposited (TiAlTaZrNb)Cx coatings. Both parameters decrease with increasing methane flow for the same deposition time. This behavior is attributed to the reduction in the relative argon concentration in the gas mixture and probably to target poisoning by carbon, which decreases the sputtering rate and consequently the coating deposition rate [
15].
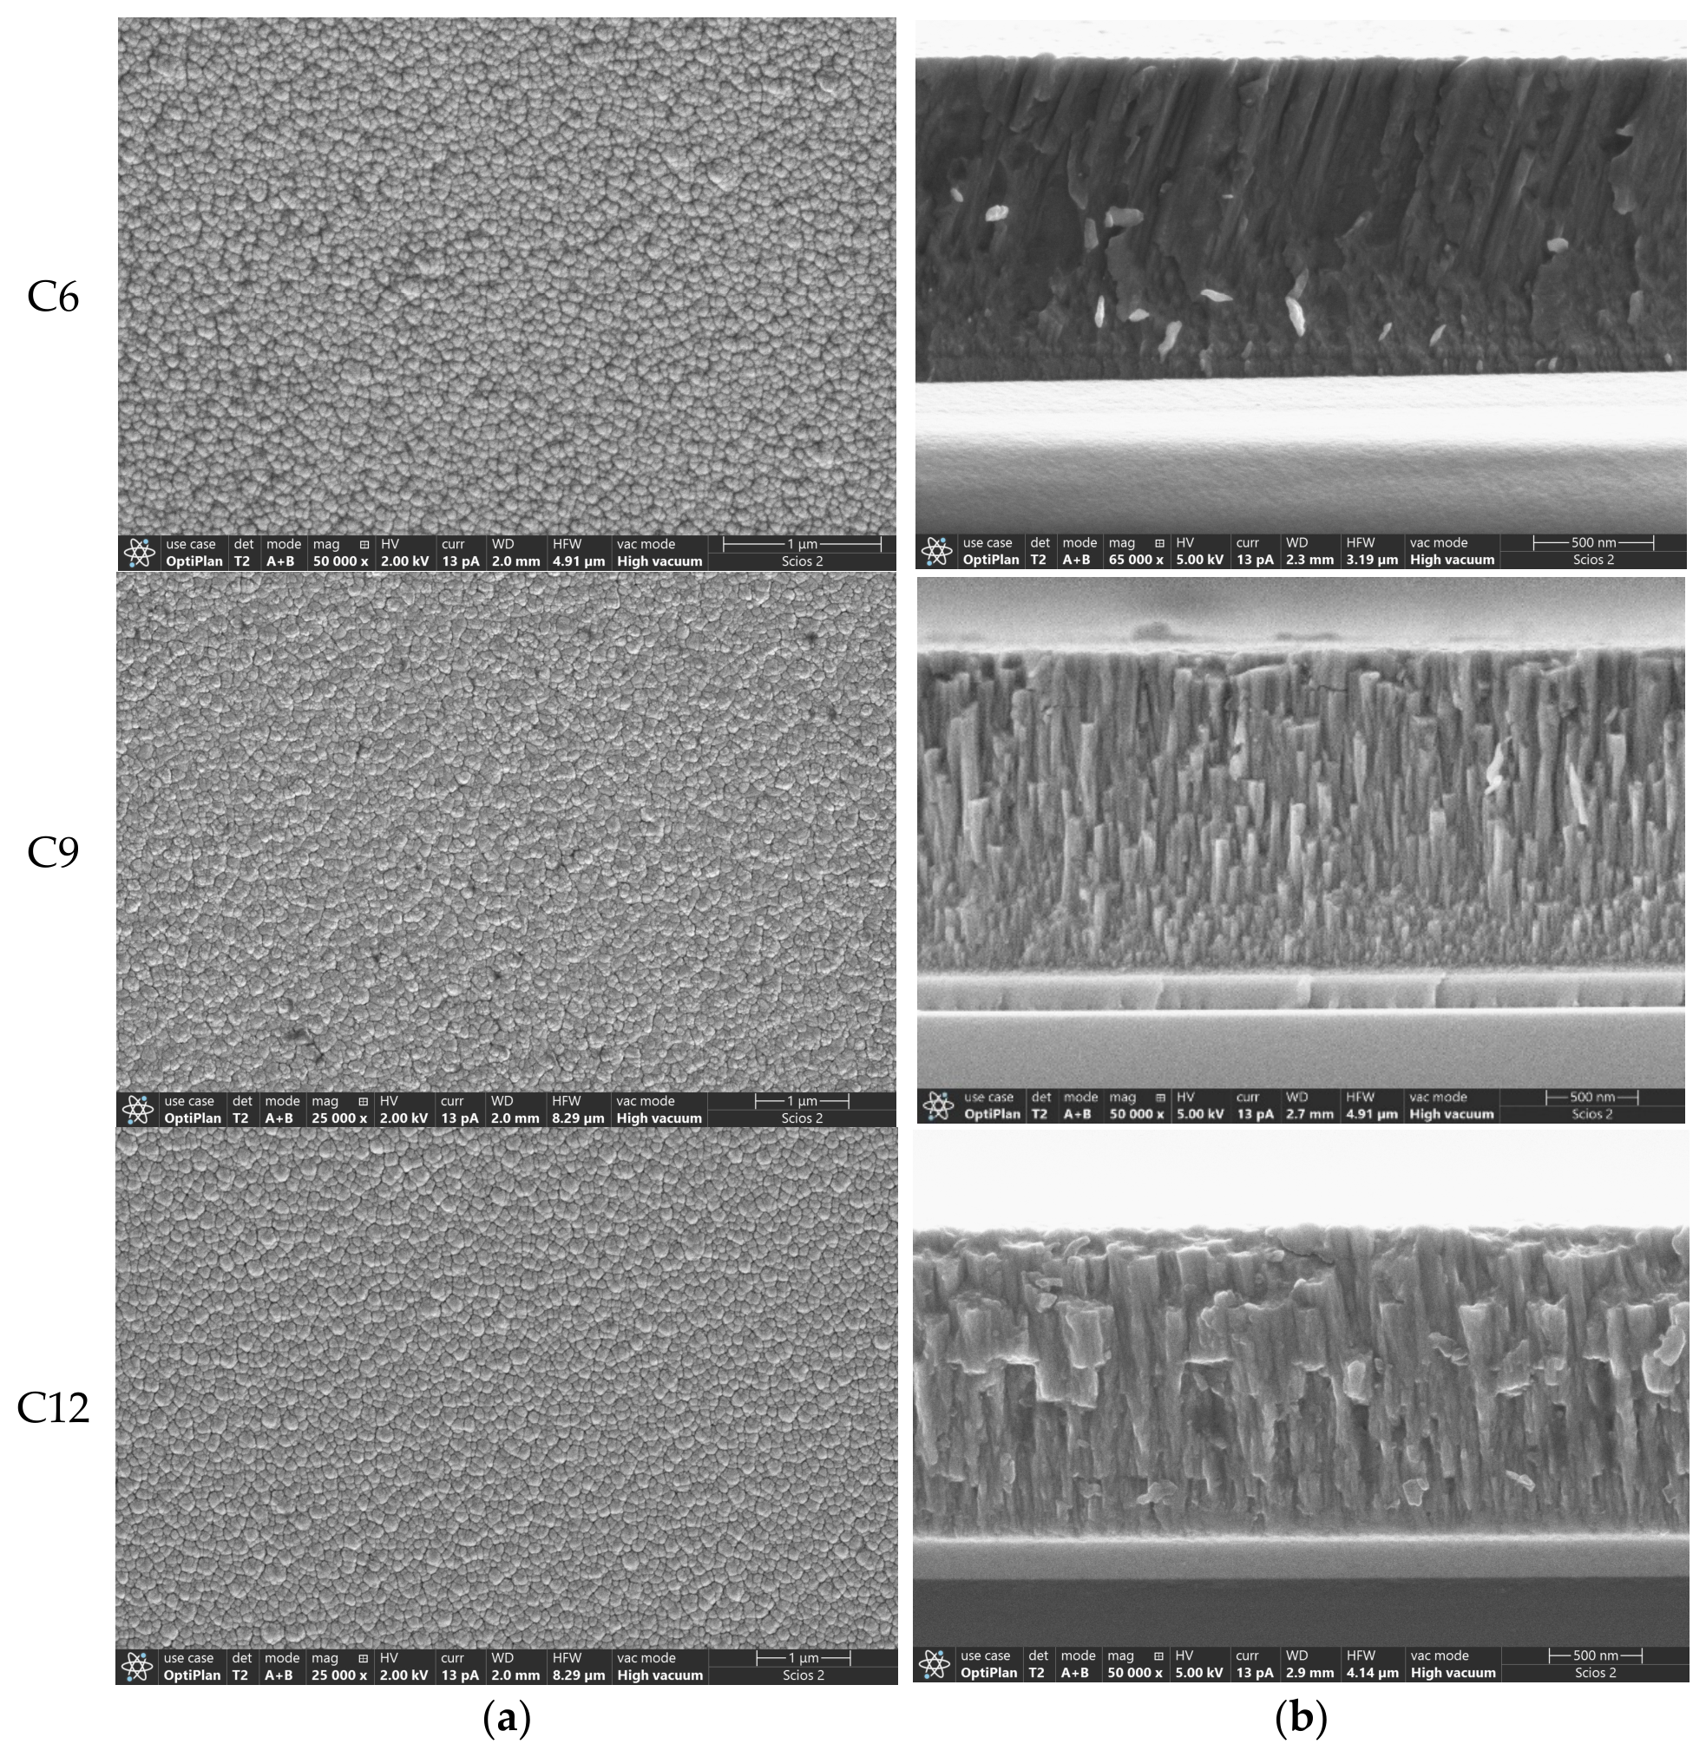
Figure 2a shows surface images of the coatings deposited with different carbon contents. All coatings exhibit a cauliflower-like, dome-shaped morphology.
Figure 2b shows cross-sectional images revealing a dense, homogeneous columnar growth structure. The column widths correspond reasonably with the grain sizes observed in the surface images. The C6 coating exhibits oblique columnar growth, the origin of which is not fully understood and requires further investigation.
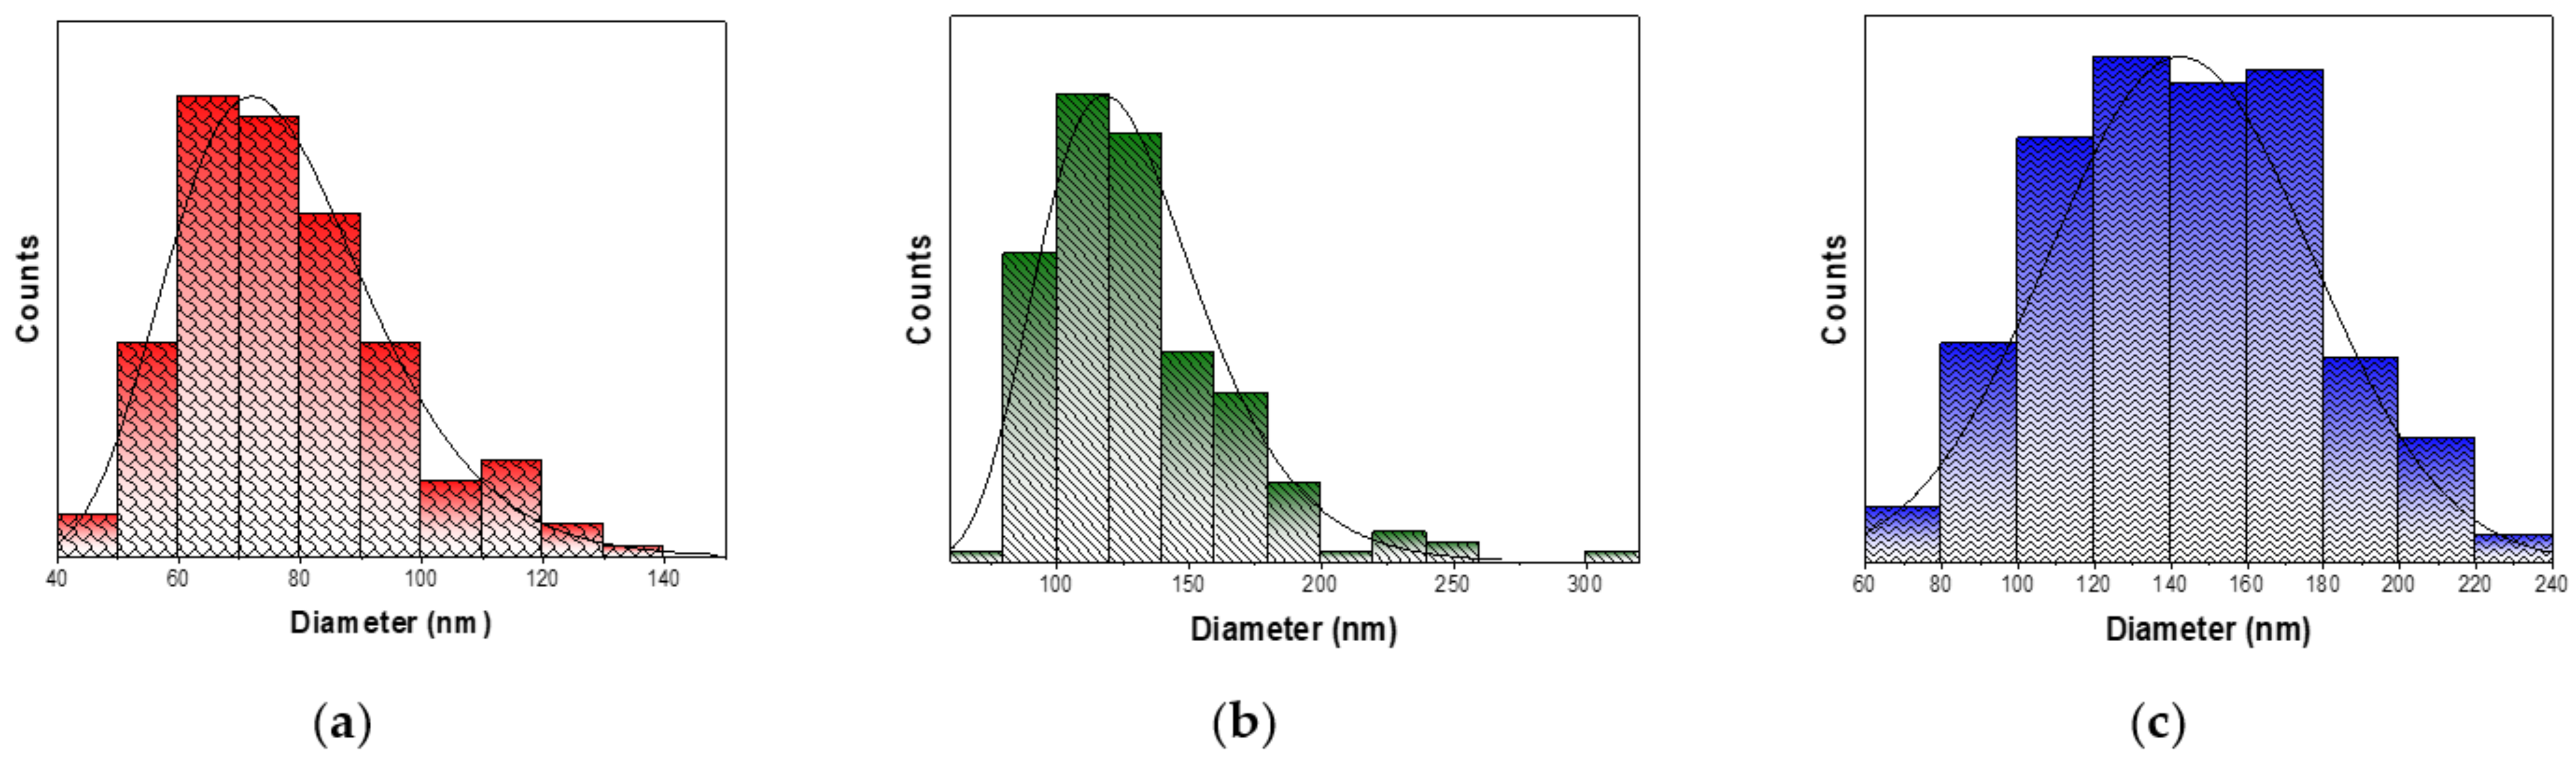
The average grain sizes of the deposited coatings, determined from FESEM surface images using ImageJ software, were approximately 70 ± 10.5 nm for C6 (lowest carbon content), 130 ± 20.9 nm for C9, and 140 ± 25.3 nm for C12, as shown in
Figure 3.
It should be noted that the XRD-derived crystallite size (coherently diffracting domains) decreases with increasing carbon content, while the SEM-measured columnar grain size increases. This apparent discrepancy is physically consistent: higher carbon incorporation introduces lattice strain and secondary phase nucleation, refining crystallite size, while enhanced surface diffusion and columnar coalescence during deposition promote wider morphological grains. These two metrics represent distinct structural length scales and do not contradict one another.
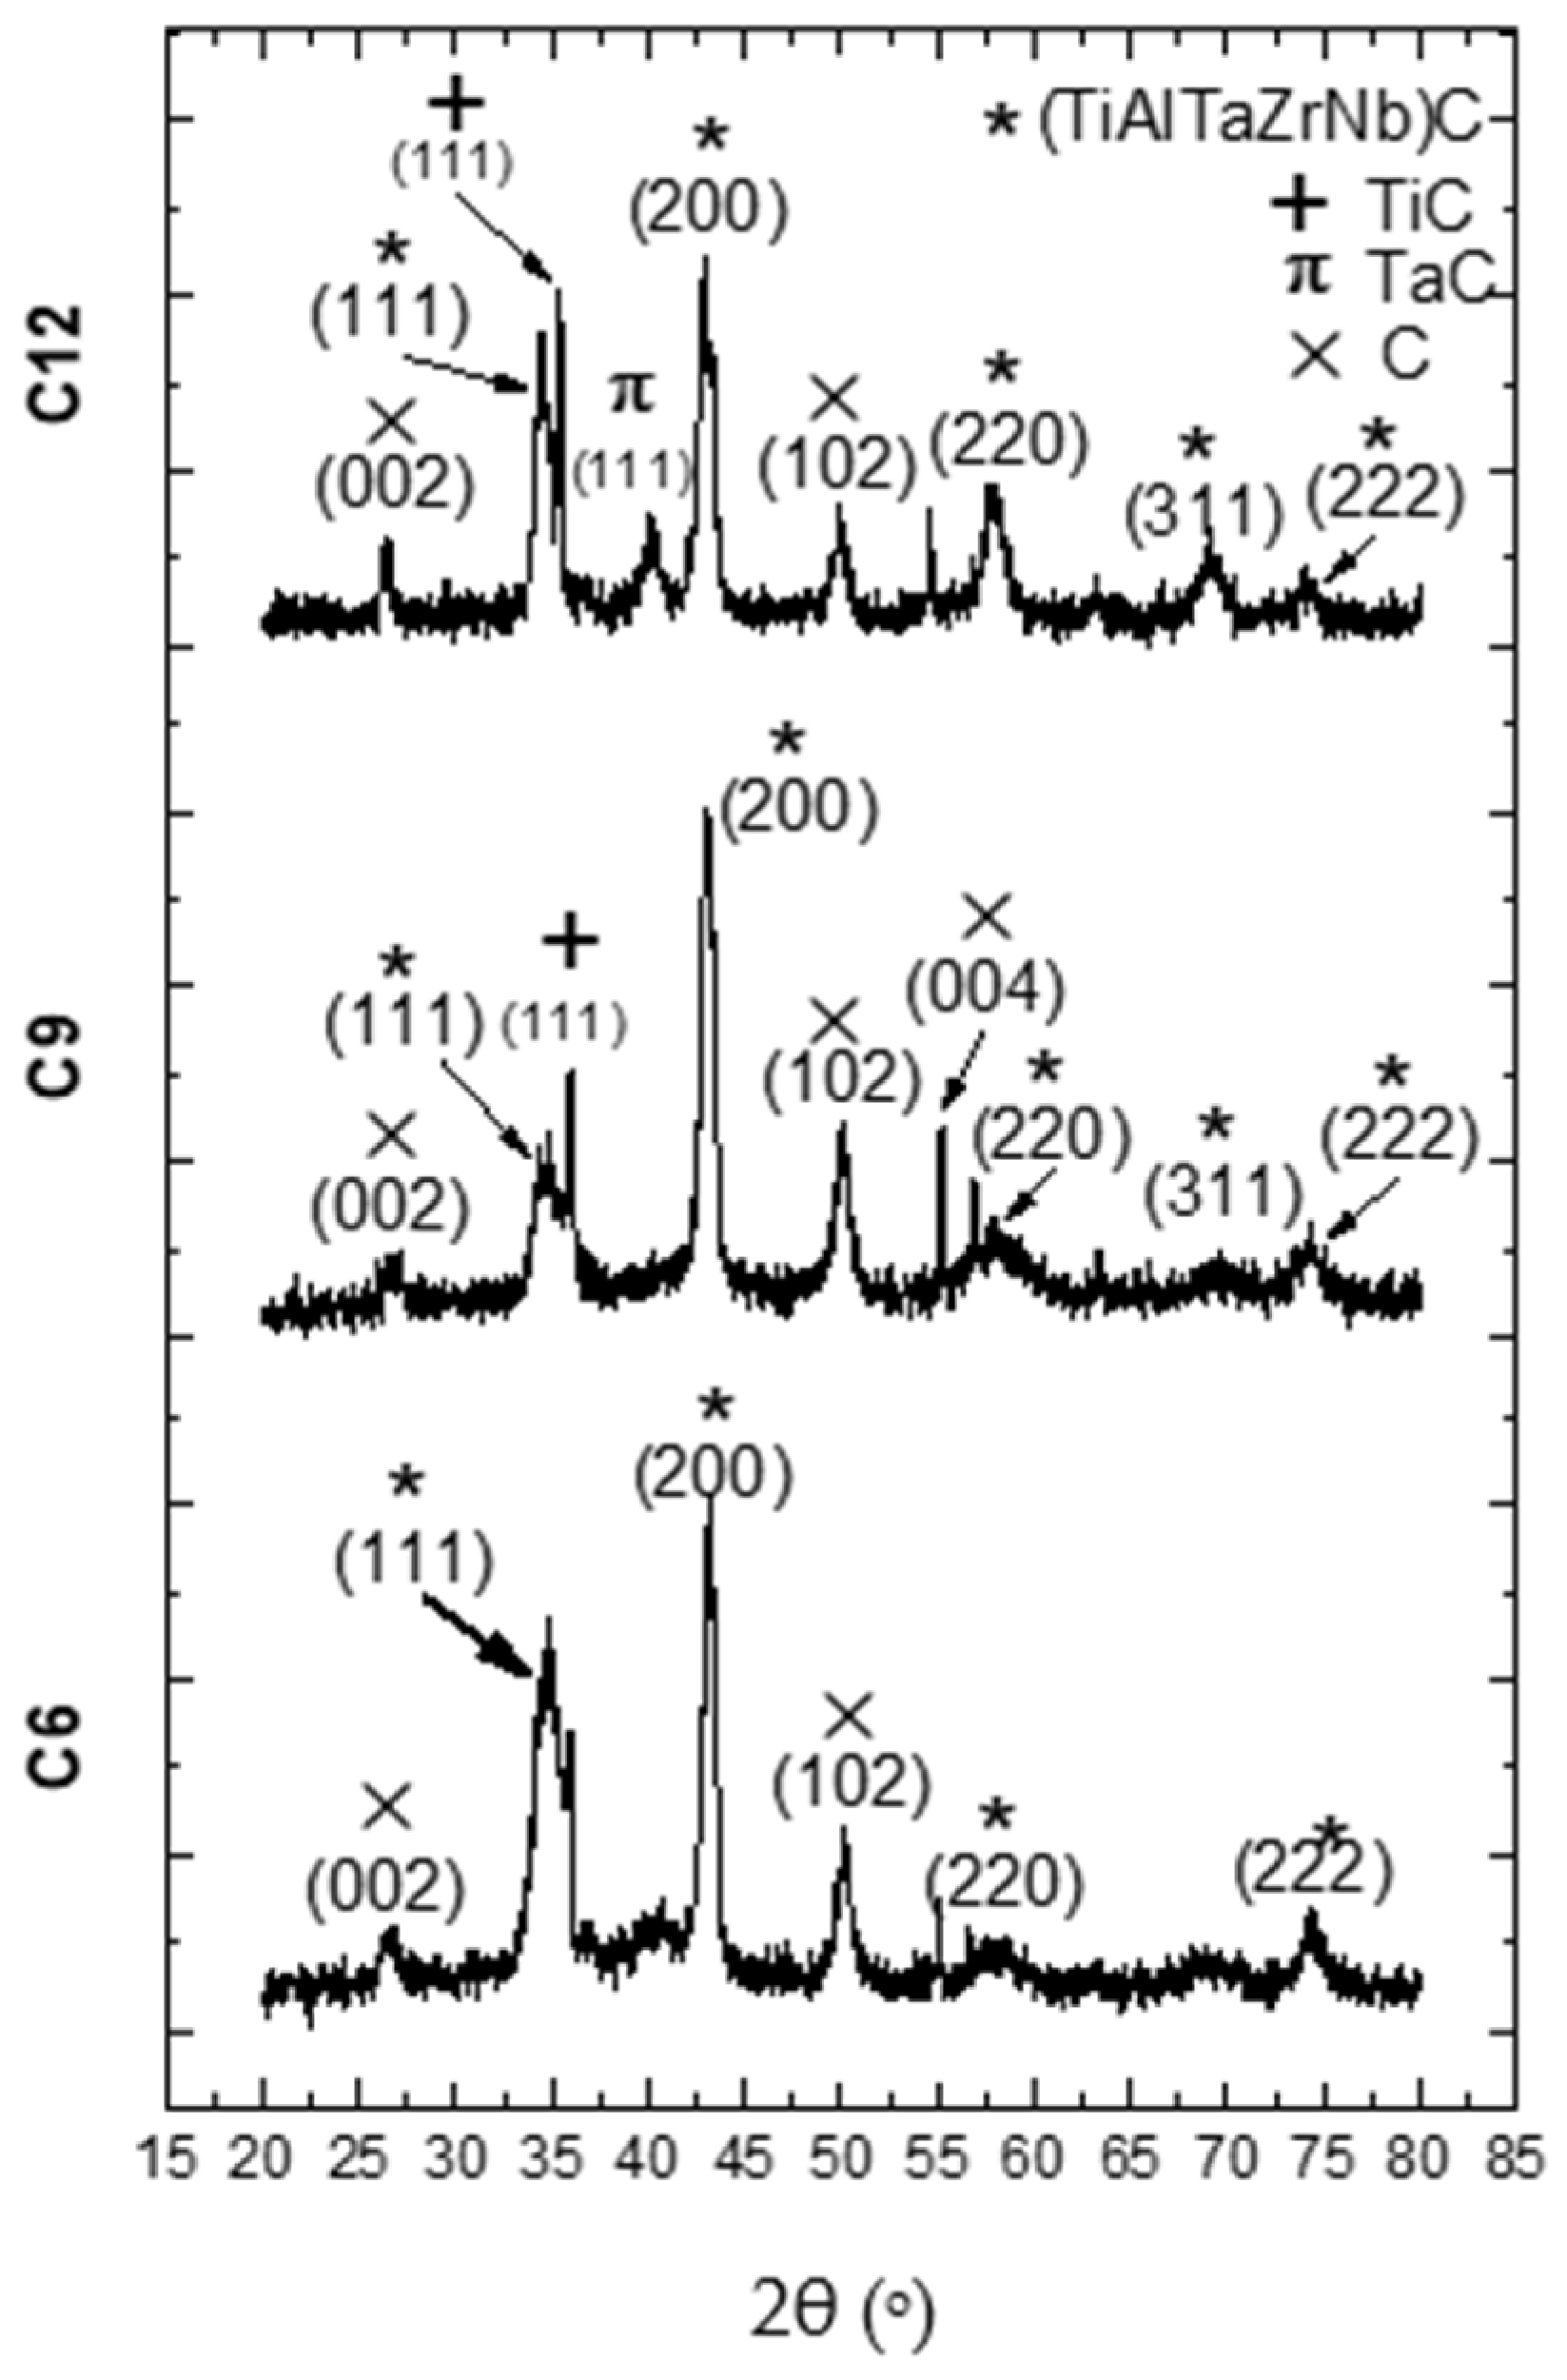
The XRD diffraction patterns of the deposited (TiAlTaZrNb)Cx coatings are shown in
Figure 4. All patterns exhibit a face-centered cubic (FCC) NaCl-type structure characteristic of high-entropy carbides, with preferential growth in the (200) plane and, to a lesser extent, in the (111) plane. Additional peaks corresponding to TiC (111) at 35.5° (JCPDS card No. 65-8804), TaC (111) at 40° (JCPDS card No. 03-065-0282), and graphite are also observed.
Similar results were reported by Rahmadtulloh et al. [
18], who deposited TiZrNbTaFeCx coatings with different carbon contents and observed that the preferred orientation changes from (200) to (111) as the carbon content increases, implying that the amount of carbon enhances the growth of the (111) plane and retards the growth of other orientations. Additionally, those researchers found that at low carbon contents, the coatings were amorphous, transitioning to a crystalline FCC structure as carbon content increased, accompanied by the formation of other carbides, including TiC. All coatings exhibit a peak associated with carbon (graphite); the carbon content is relatively low for samples C6 and C9 (sub-stoichiometric), contributing to the formation of TiC and subsequently to that of TaC in sample C12, which has the highest carbon content. The precipitation of binary carbides alongside the formation of the solid solution has been observed in high-entropy carbide coatings with low carbon contents [
23,
24]. Consequently, the C9 and C12 coatings are more accurately described as HEC-based multiphase nanocomposites rather than single-phase solid solutions.
Table 4 shows the crystallite size, interplanar distance values, and lattice parameters of the deposited high-entropy carbide coatings, calculated from the (200) peak of the XRD patterns using the Bragg and Debye–Scherrer equations. The (200) peak shifts from 43.0° for C6 to 43.2° for C9, and then to 42.9° for C12. These variations in lattice parameter (
Table 4) may be influenced by changes in solid solution effects, phase composition, or residual stress state. However, since residual stresses were not directly measured, no causal link between peak shifts and stress magnitudes can be established.
Despite the small changes in lattice parameter, these changes can influence the mechanical and tribological properties of the coatings, as discussed later. Similar observations are found in the literature: Zhu et al. [
22] reported that small changes in lattice parameter (from 0.42847 nm to 0.42785 nm) were accompanied by significant changes in residual stresses (from 0.41 GPa to 0.63 GPa) in TiCN coatings. Likewise, Rahmadtulloh et al. [
18] observed that variations in lattice parameter (from 0.4457 nm to 0.4447 nm) correlated with compressive residual stresses ranging from −1.36 GPa to −0.99 GPa in TiZrNbTaFeCx coatings.
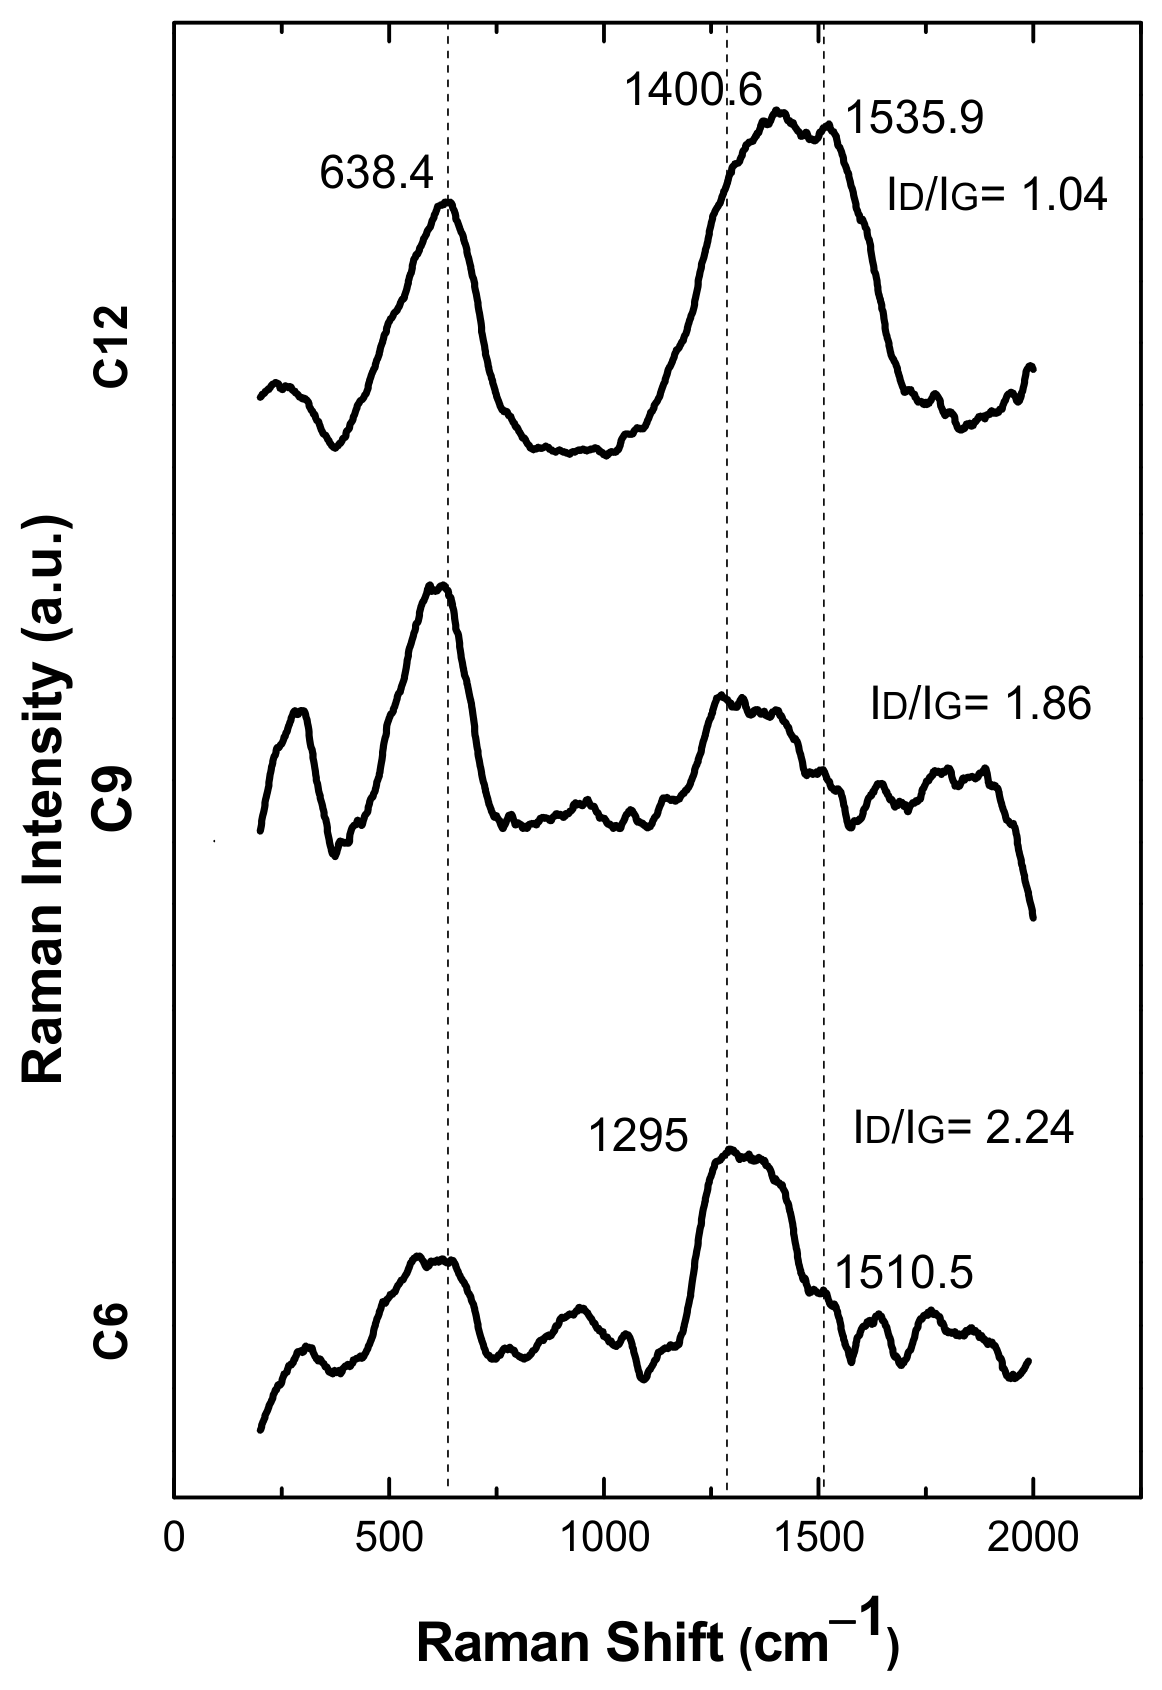
Figure 5 shows the Raman spectra of the deposited (TiAlTaZrNb)Cx coatings. In all coatings, two intense peaks are observed: for sample C6, they are centered at 1295 cm
−1 and 1510.5 cm
−1, which shift to 1405.6 cm
−1 and 1535.9 cm
−1 for coating C12. These two peaks are attributed to the symmetric A
1g vibration mode of amorphous carbon (D band) and the symmetric E
2g vibration mode of graphitic carbon (G band), respectively.
The D and G bands increase in intensity with increasing carbon content, suggesting that higher methane flow results in a greater amount of carbon that does not react with the metals in the high-entropy alloy and remains as free carbon in the deposited coatings. The shift of the D and G peaks to higher wavenumbers, accompanied by a decreased ID/IG ratio, indicates a higher content of free carbon with sp2 bonds and greater structural order. Additionally, peaks were observed in the 397–770 cm−1 range, corresponding to the A1g and Eg vibrational modes of the metal carbides present in the solid solution of the high-entropy carbide matrix.
Despite the decrease in the I
D/I
G ratio with increasing methane flow, particularly for C12, the hardness and Young’s modulus decrease, which is attributed to increased graphite formation and TiC/TaC precipitation, as discussed in
Section 3.2. Nikitin et al. [
25] found similar results when synthesizing carbides, nitrides, and carbonitrides of high-entropy Ti-Zr-Nb-Hf-Ta alloys by high-speed arc discharge plasma jet. They observed a peak centered at 1360 cm
−1 assigned to graphite (D band), another at 1570 cm
−1 from amorphous carbon (G band), and additional peaks between 500 and 700 cm
−1 corresponding to metallic carbonitride bonds. Similar results were obtained by Kao et al. [
26] in their Raman evaluations of CrNbSiTaZr high-entropy carbide coatings deposited by reactive RF magnetron sputtering. The Raman spectra exhibited two broad, intense peaks around 1390 cm
−1 and 1563 cm
−1, representing disordered (D-band) and graphitic (G-band) carbon structures. They also found that hardness decreases with increasing acetylene flow due to greater amorphous carbon or graphite phase formation in the coatings.
3.2. Evaluation of Mechanical and Tribological Properties
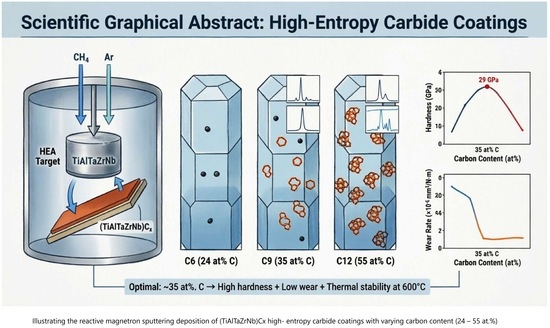
Table 5 shows the hardness and Young’s modulus of the deposited coatings as a function of carbon content. Both properties initially increased slightly with increasing carbon content, from 27.9 GPa to 28.7 GPa and from 275 GPa to 350 GPa for samples C6 and C9, respectively. However, given the overlap within experimental uncertainty, the hardness reaches a plateau/optimal window around ~35 at.% C rather than a sharp peak. For sample C12 (55.3 at.% C), both properties decreased to 20.0 GPa and 223 GPa, respectively.
The increase in hardness from C6 to C9 results principally from solid solution strengthening associated with a higher packing factor of the high-entropy carbide solid solution, higher configurational entropy of the coating, as well as greater lattice distortion of the crystal lattice. The formation of secondary phases in sample C12, such as TiC, TaC, graphite, and possibly amorphous carbon (as observed by XRD and Raman), led to a reduction in the mixing entropy and a decrease in hardness. In addition to target poisoning, the reduction in the Ar/CH
4 ratio with increasing methane flow also decreases the intensity of argon ion bombardment during deposition, which could affect the lattice parameter and defect structure of the coatings. However, the dominant factors affecting the mechanical properties remain the phase composition and the presence of soft carbon-rich phases. While residual stress variations cannot be quantified from the XRD data alone, the observed lattice parameter changes (
Table 4) may be related to differences in the coating microstructure and phase composition, which in turn influence the mechanical properties. However, the dominant factors affecting the hardness decrease in C12 remain the phase composition and the presence of soft carbon-rich phases.
On the other hand, the C12 coating exhibited the smallest thickness (1.9 µm,
Table 3), which may influence its mechanical response, although thickness alone is not a direct indicator of residual stress state. These statements are consistent with the observations of other authors [
26,
27,
28], who deposited high-entropy carbides of (CrNbSiTaZr), (TiCrZrVNb), and (CrNbSiTiZr), respectively. While it is true that variations in the crystal lattice correlate with changes in hardness, the exact and significant contribution of residual compressive stress remains unquantified due to measurement limitations encountered in this study. We acknowledge that the lack of direct residual stress measurements prevents us from definitively deconvoluting the contributions of solid solution strengthening, grain size effects, and residual stress to the observed hardness variations. Future studies employing techniques such as X-ray diffraction sin
2ψ or substrate curvature measurements would be valuable to quantify the role of residual stresses.
Table 5 also presents the H
2/E and H
3/E
2 ratios, which are indicators of elastic deformation capacity and resistance to plastic deformation, respectively. Sample C6 exhibited the highest values for both ratios (H
2/E ≈ 2.81, H
3/E
2 ≈ 0.28), suggesting theoretically better tribological behavior based solely on elastic-plastic parameters. However, it is well established that wear resistance is influenced by multiple factors beyond these ratios, including microstructure, phase composition, coefficient of friction, and the presence of lubricious phases such as graphite or amorphous carbon. As will be discussed below, the actual wear performance is governed by a complex interplay of these factors. Nonetheless, all coated systems exhibited superior mechanical properties compared to the uncoated AISI H13 steel substrate, which showed a hardness of 5.5 GPa and a Young’s modulus of 210 GPa.
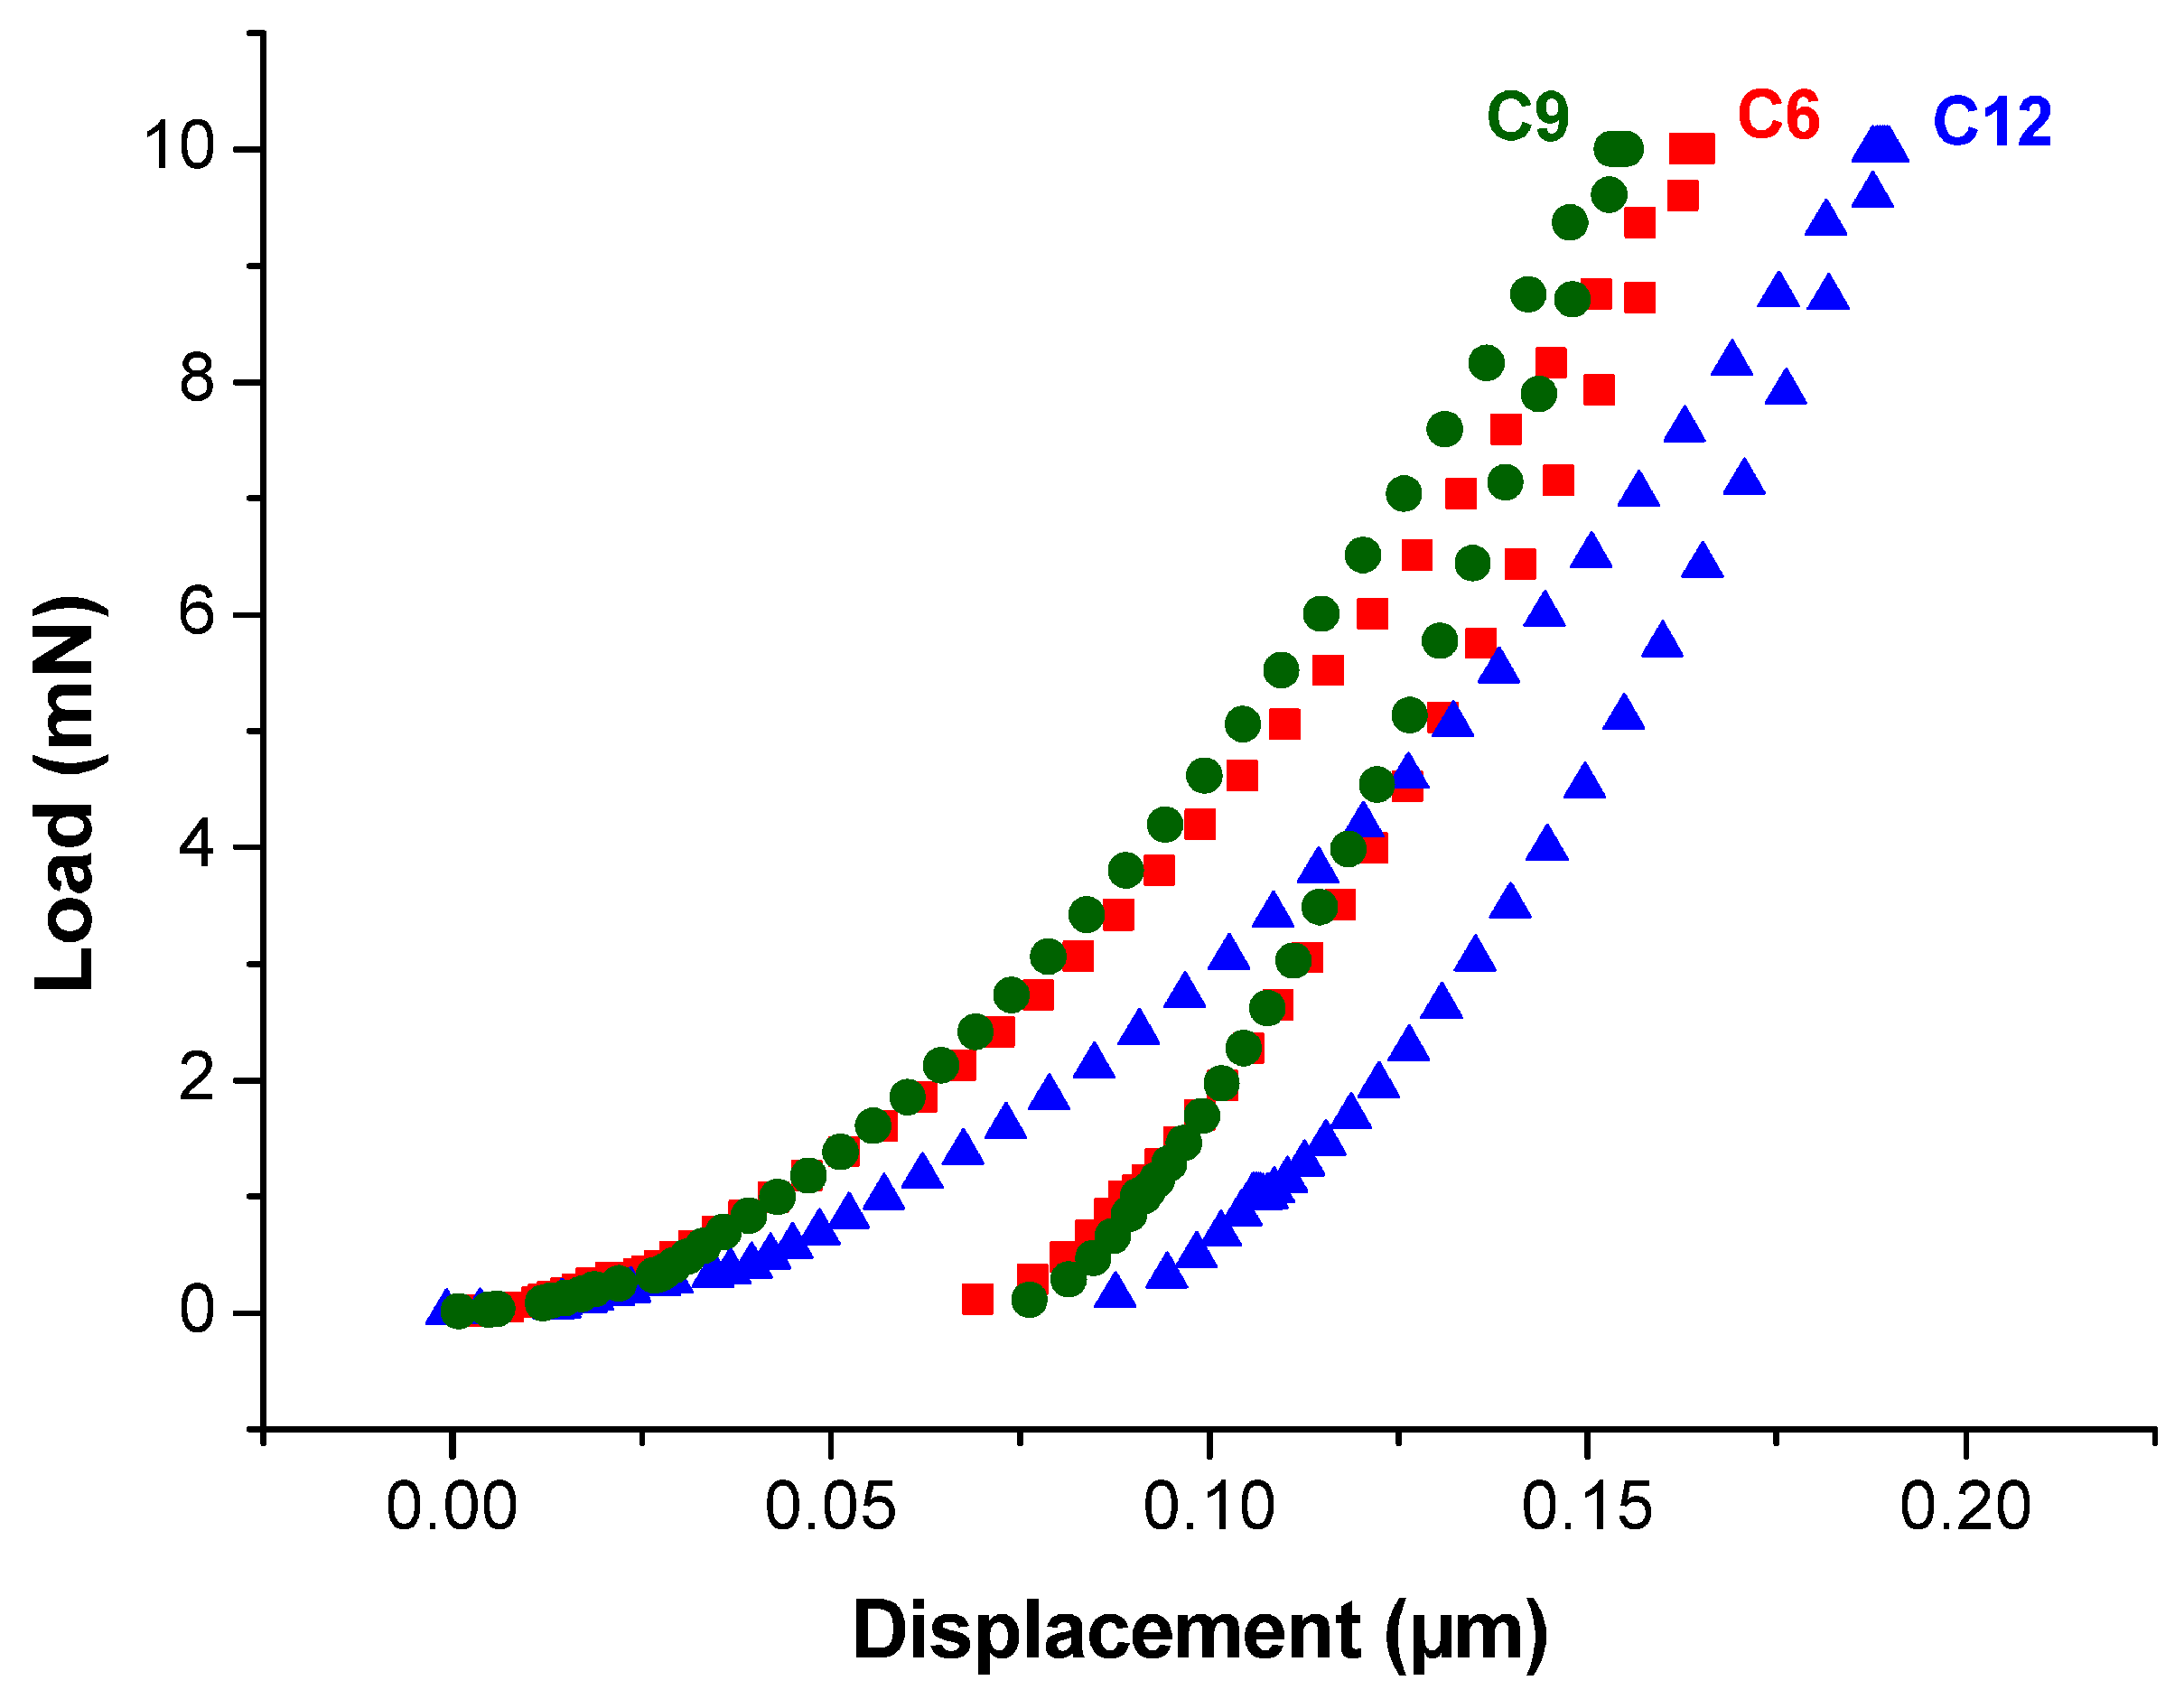
Figure 6 shows the load–displacement curves of the three coatings. The C9 coating exhibited the lowest penetration depth under the same maximum load (10 mN), which correlates with its highest hardness (28.7 GPa) and greater resistance to plastic deformation. In contrast, the C12 coating showed the highest penetration depth, consistent with its lower hardness (20.0 GPa) and higher susceptibility to permanent deformation.
The slope of the unloading segment of each curve is related to the elastic modulus of the coating. The steeper unloading slopes observed for C6 and C9, compared to C12, indicate higher stiffness and greater elastic recovery. This behavior is consistent with the Young’s modulus values reported in
Table 5 (275 GPa and 350 GPa for C6 and C9, respectively, versus 223 GPa for C12).
Although C9 presented the highest hardness and C6 exhibited the best H/E and H3/E2 ratios (suggesting superior theoretical wear resistance), the actual tribological performance is influenced by additional factors, as discussed in the following section.
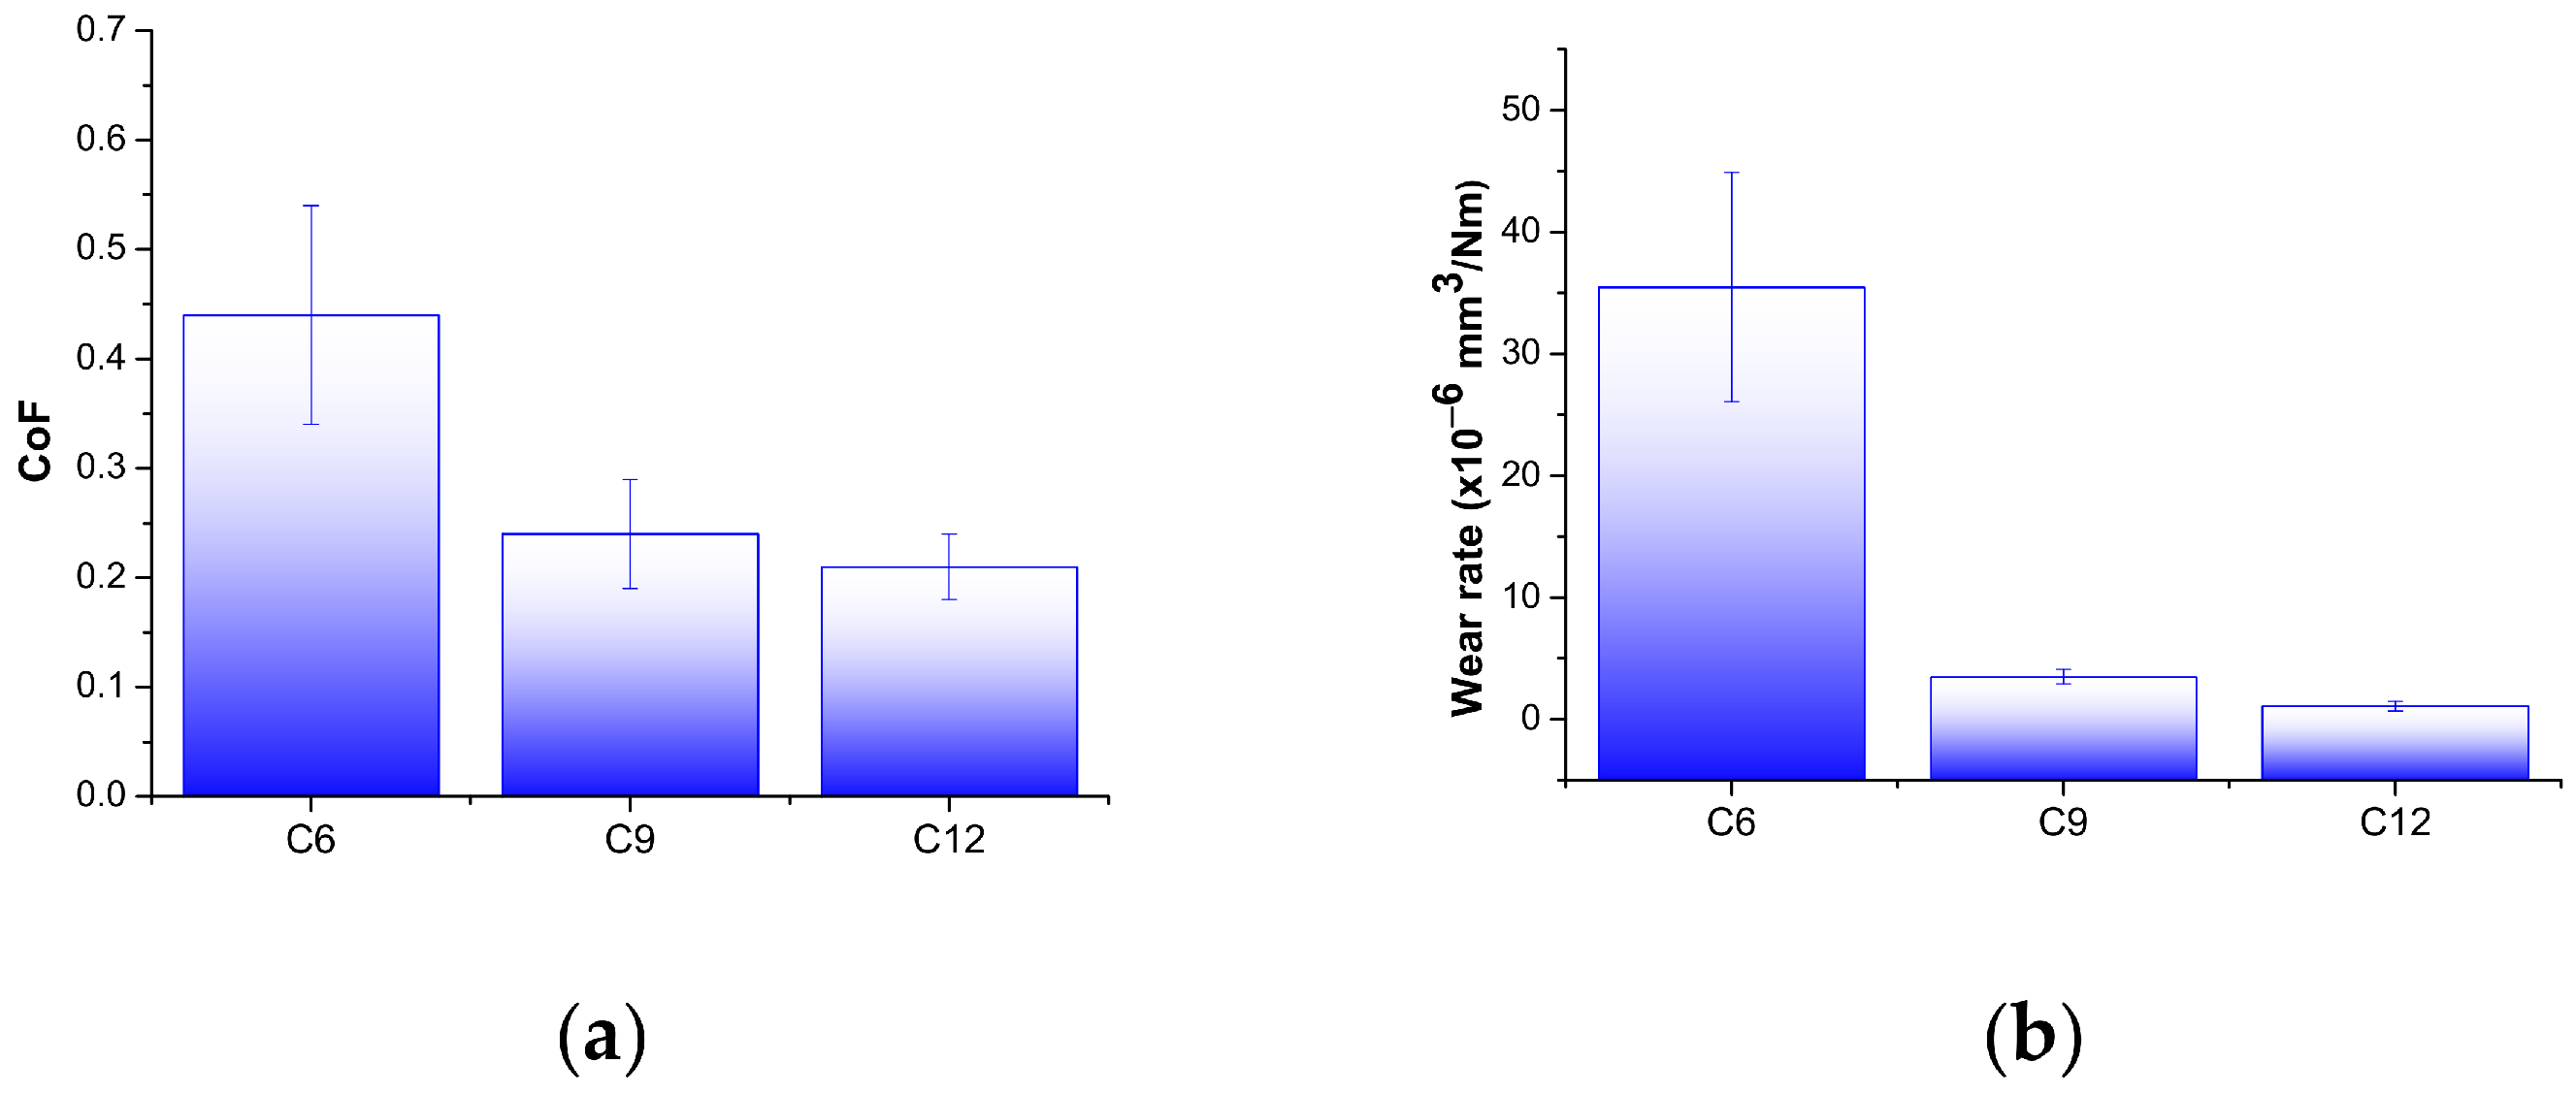
Figure 7 illustrates a systematic reduction in both the coefficient of friction (CoF) and the specific wear rate with increasing carbon content. The CoF decreases from ~0.40 for the C6 coating to ~0.20 for C12, while the wear rate drops by nearly one order of magnitude, from 35 × 10
−6 to 1.7 × 10
−6 mm
3/(N·m). This pronounced tribological enhancement is primarily driven by the solid-lubricating action of carbon-rich phases (graphitic and amorphous carbon) that segregate to grain boundaries and the sliding interface. This mechanism is directly corroborated by Raman spectroscopy (
Figure 5), where the progressive decrease in the I
D/I
G ratio with higher methane flow indicates an evolution toward more ordered sp
2-bonded graphitic domains. The concurrent reduction in I
D/I
G ratio and wear rate strongly supports the hypothesis that increasingly ordered carbon structures facilitate the in situ formation of a low-shear-strength tribofilm during sliding, which effectively mitigates abrasive and adhesive wear. Although the precipitation of secondary carbides (TiC, TaC) at elevated carbon levels marginally reduces the configurational entropy of the high-entropy solid solution, the dominant role of the lubricious carbon network ultimately governs the superior wear resistance observed for the C12 coating.
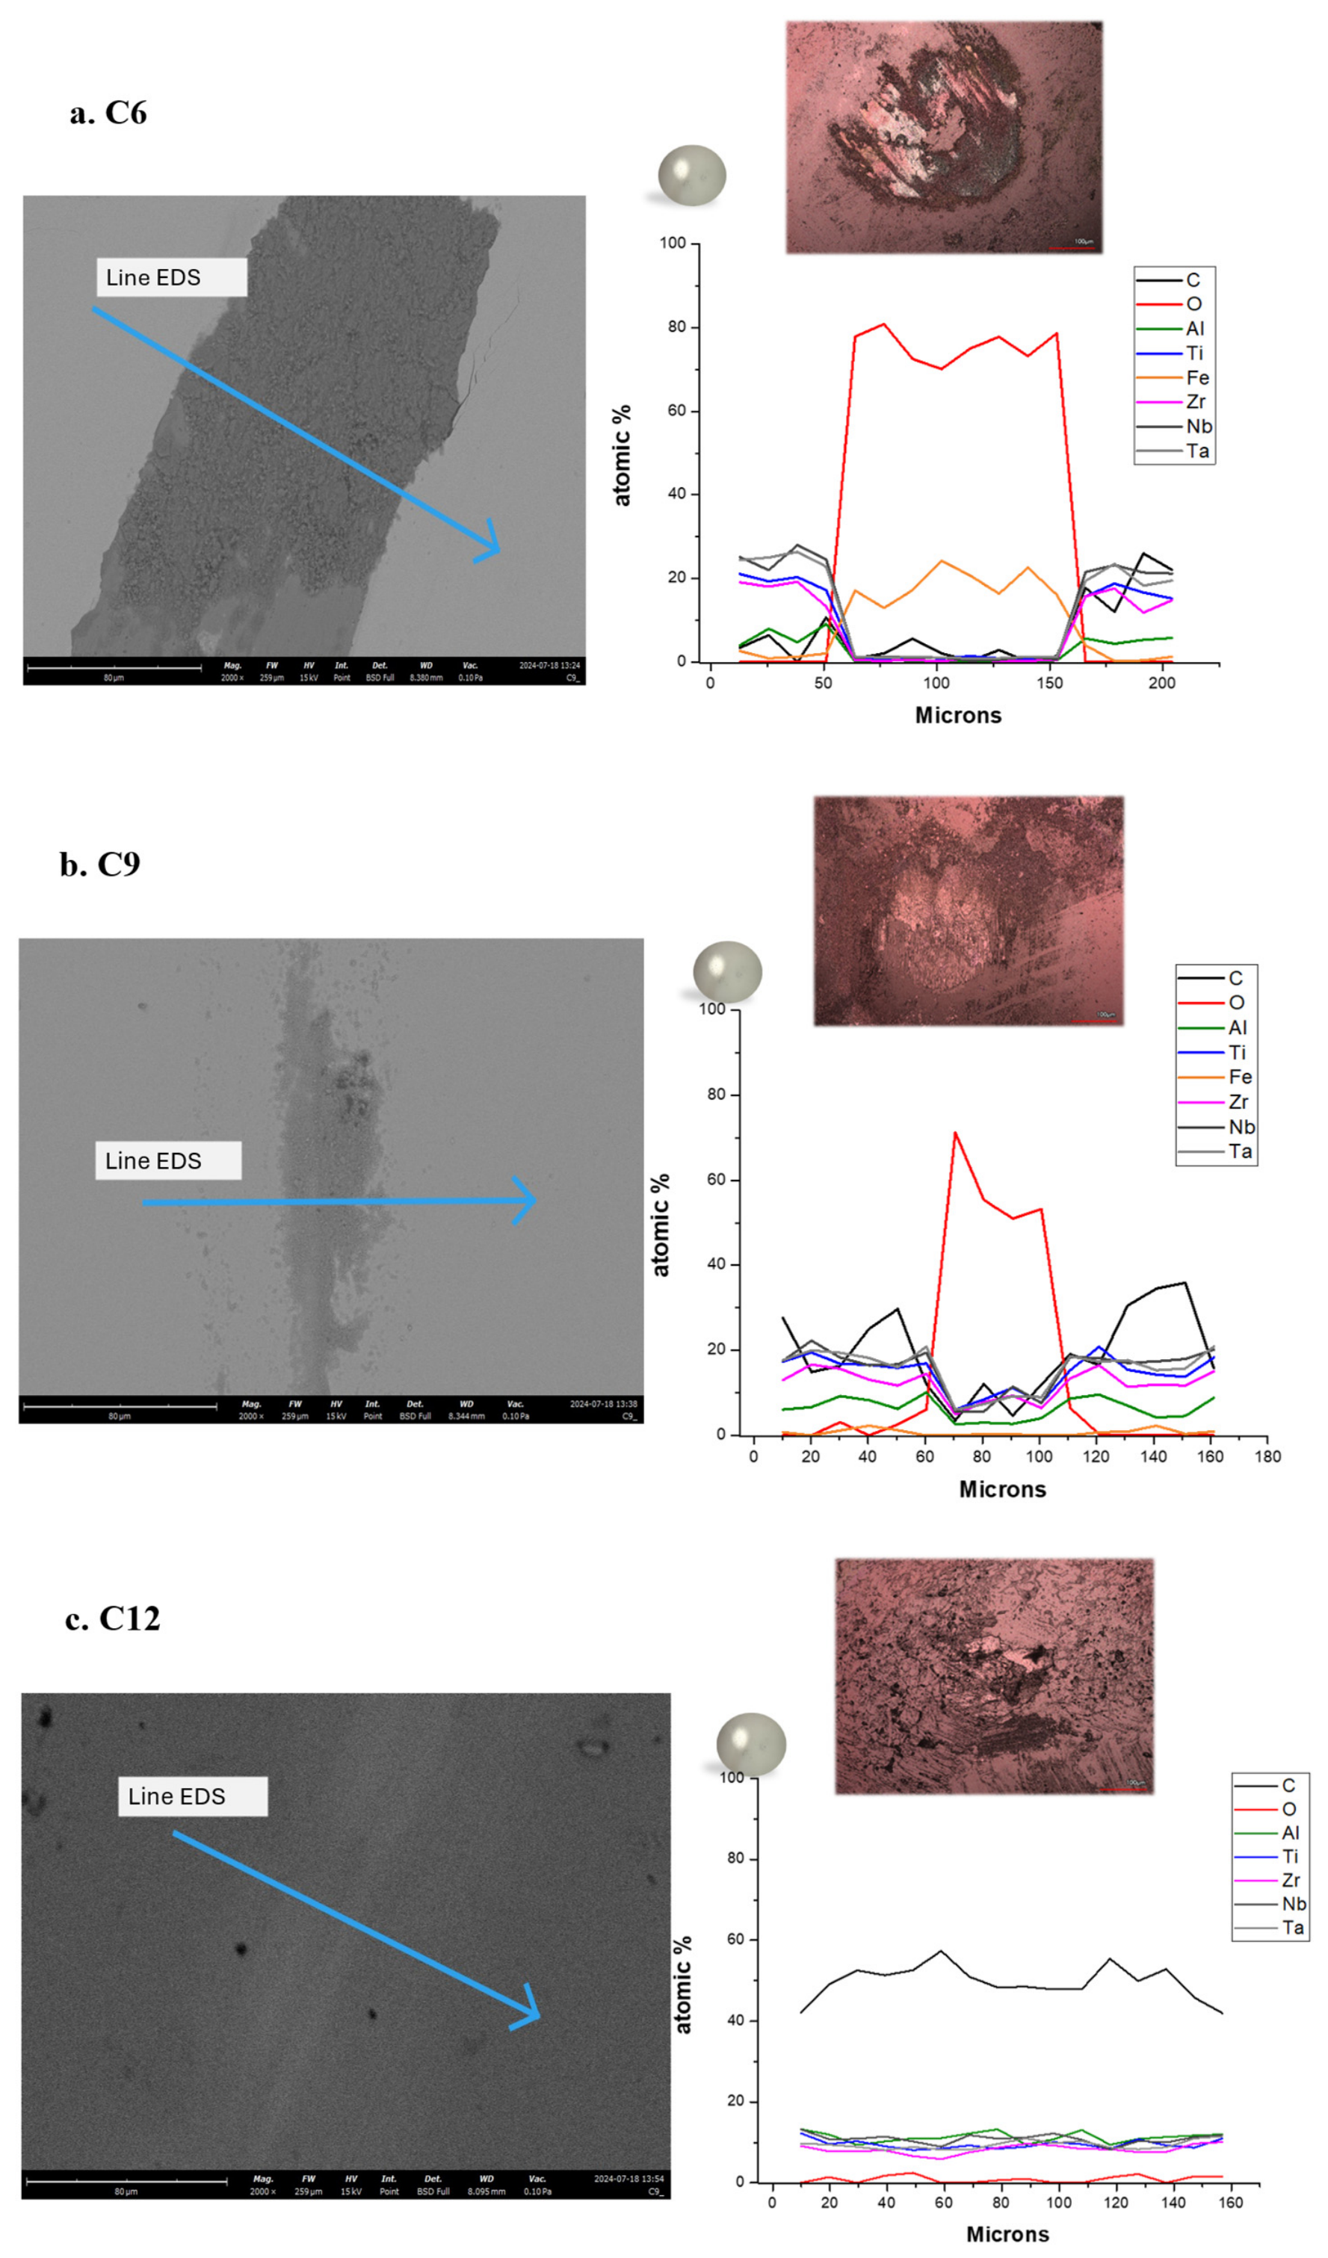
Figure 8 shows SEM images of the wear tracks, elemental chemical composition determined by line EDS, and optical images of the alumina counterbodies for the three (TiAlTaZrNb)Cx coatings.
For the C6 coating, the SEM image (
Figure 8) shows delamination and microcracks along the wear track path, characteristic of mixed wear modes. The line EDS profile reveals increased oxygen and iron content in the wear zone, indicating high oxidation (tribo-oxidation) and exposure of the steel substrate (iron signal from AISI H13). The optical image of the counterbody shows significant wear and adhered coating material. Overall, the C6 coating exhibits a combination of tribo-oxidative, adhesive, and abrasive wear modes.
For the C9 coating, the SEM surface image shows less pronounced wear than C6, with abrasive and adhesive wear but no delamination or peeling of the coating from the steel substrate. Some wear and adhered coating material are observed on the alumina ball. However, the high oxygen content in the wear pattern of this coating also suggests some degree of tribo-oxidative wear.
The C12 coating exhibits a very imperceptible wear pattern in the SEM image. In the line EDS profile, neither oxygen nor iron is visible, indicating that the steel substrate was not exposed during the tribological test. These observations are consistent with its low coefficient of friction and wear rate shown in
Figure 7.
While direct spectroscopic analysis of the wear track (e.g., Raman or XPS) would provide definitive confirmation of tribofilm chemistry, the combined evidence from EDS line profiling (complete suppression of Fe/O signals), the strong correlation between the decreasing ID/IG ratio and CoF reduction, and established literature on carbon-rich HEC systems strongly supports the formation of a low-shear-strength carbonaceous tribofilm. Future work will prioritize in situ or post-wear spectroscopic mapping to directly validate this mechanism.
The delamination observed in the C6 coating highlights the importance of interfacial toughness. While a metallic interlayer was employed to enhance adhesion, quantitative scratch/adhesion testing was beyond the scope of this study. Future work will include standardized adhesion evaluation to correlate interfacial strength with carbon stoichiometry and wear performance.
Table 6 summarizes the mechanical and tribological properties of high-entropy carbide coatings reported in selected studies from the literature, together with the results obtained in the present work.
The evolution of mechanical and tribological properties with increasing carbon content follows a consistent trend across all studies: hardness initially increases up to an optimal carbon concentration, and then decreases due to excess free carbon (amorphous or graphitic) precipitating at grain boundaries. Concurrently, the coefficient of friction and wear rate decrease with higher carbon content, demonstrating the solid lubrication effect of carbon-rich phases. Kao et al. [
24,
27] also observed that coatings with the highest carbon content exhibited the lowest wear rates, despite reduced hardness.
Quantitative differences exist among studies. Jhong et al. [
26] reported significantly lower wear rates (~10
−7 mm
3/(N·m)) compared to our work (~10
−6 mm
3/(N·m)), while Kao et al. [
27] achieved higher initial hardness (~37 GPa) than our maximum (~29 GPa). These variations are likely due to differences in coating composition, deposition technique, testing conditions, or counterbody material. Nevertheless, the overall trend confirms that carbon content is a key parameter for tuning the balance between hardness and tribological performance in high-entropy carbide coatings.
3.3. Thermal Stability Study
The (TiAlTaZrNb)Cx coatings deposited onto silicon (100) substrates were annealed at 600 °C for 60 min at a pressure of 5 × 10
−2 mbar and subsequent cooling under a nitrogen atmosphere (99.9% purity) to evaluate their thermal stability.
Table 7 presents the hardness and Young’s modulus values measured one day after annealing.
Considering the standard deviations, coatings C6 and C9 maintained their hardness and elastic modulus after annealing (27.9 ± 3.17 GPa vs. 27.9 ± 1.1 GPa as-deposited for C6; 26.6 ± 3.11 GPa vs. 28.7 ± 1.6 GPa as-deposited for C9). In contrast, coating C12 showed a slight decrease in hardness from 20.0 ± 1.0 GPa (as-deposited) to 15.4 ± 1.17 GPa after annealing, accompanied by a reduction in Young’s modulus from 223.4 ± 15.2 GPa to 184.2 ± 14.5 GPa. The H2/E and H3/E2 ratios of C12 decreased after annealing (from 1.79 to 1.29, and from 0.16 to 0.11, respectively), indicating a reduction in its elastic deformation capacity and resistance to plastic deformation, consistent with the observed decrease in hardness. Despite this reduction, the coating remained structurally stable and no delamination was observed.
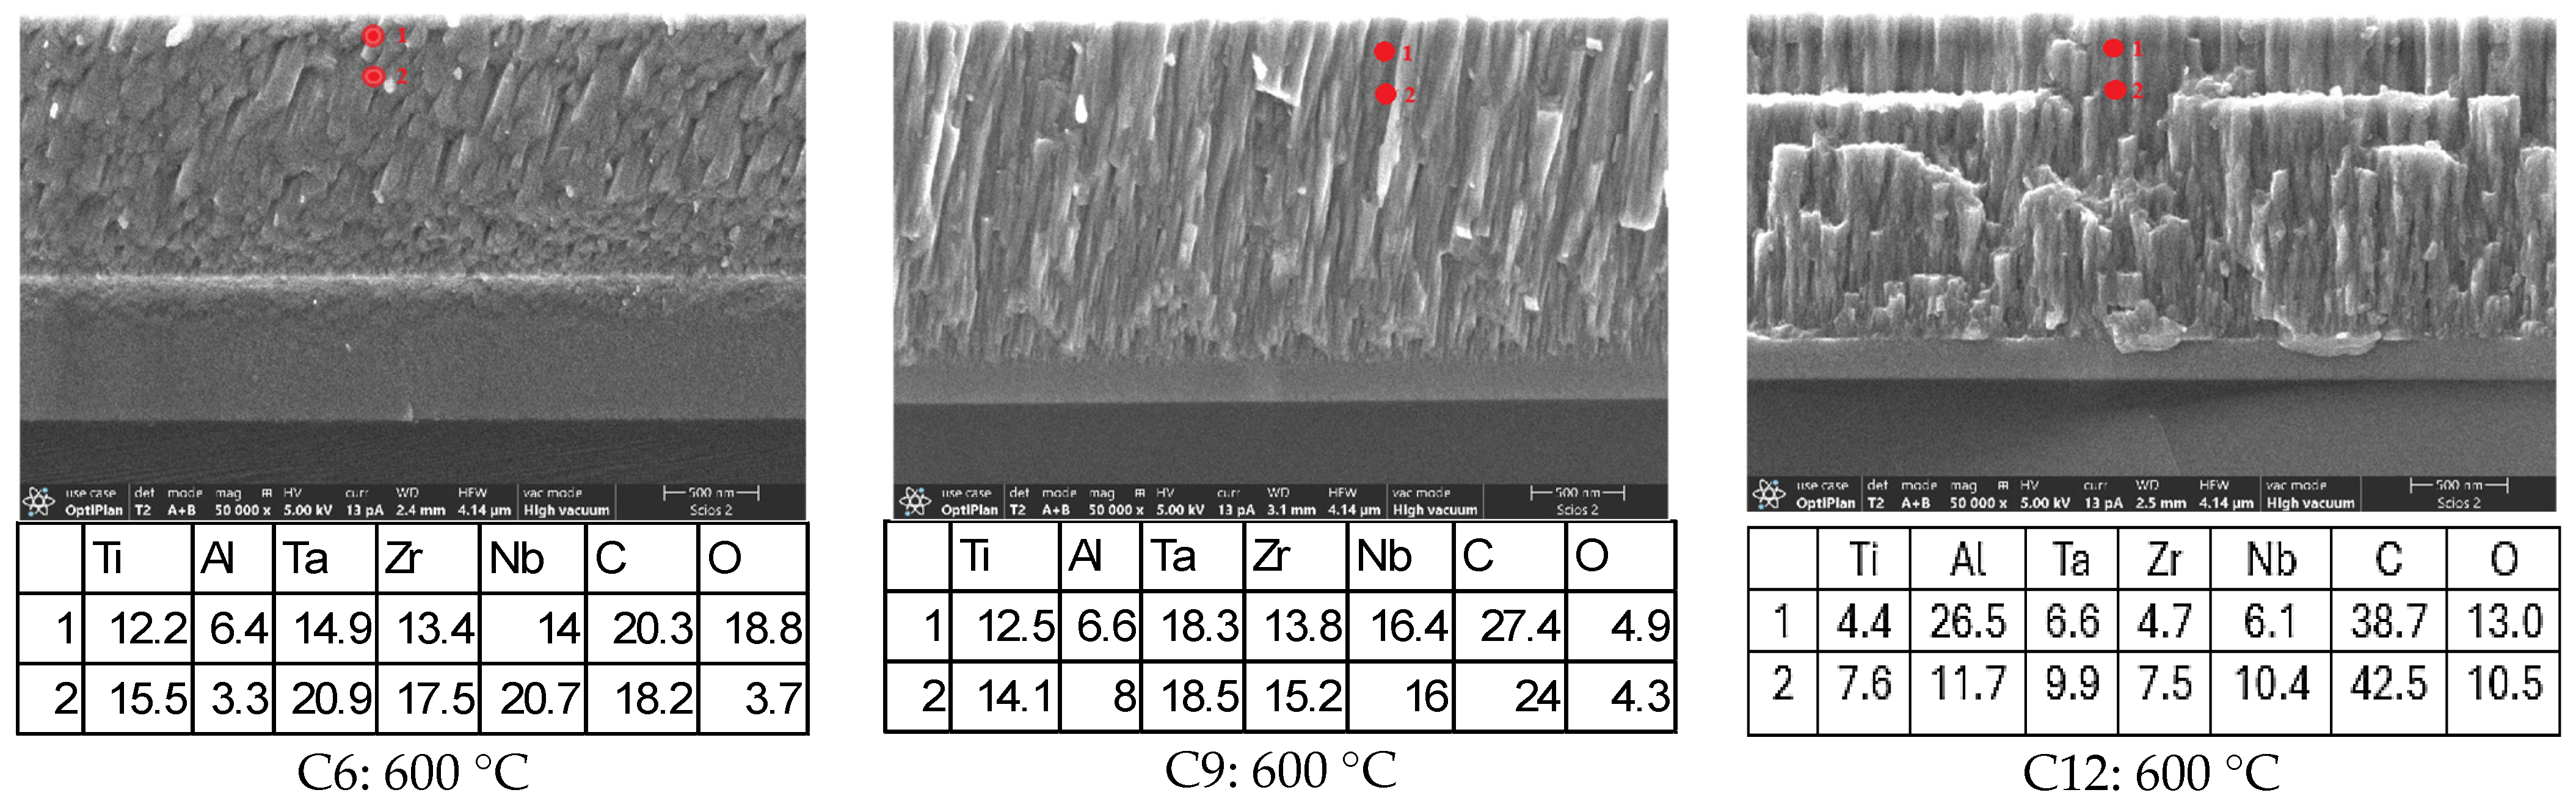
Figure 9 shows cross-sectional SEM images of the three coatings after annealing at 600 °C. All coatings retained their columnar structure, and no visible oxide layer was observed on their surfaces. The stepped fracture pattern observed in the cross-section of the C12 coating is particularly notable and may be related to the presence of secondary phases (TiC, TaC, graphite) at grain boundaries, which can act as stress concentrators during brittle fracture of the silicon substrate.
EDS analysis performed at two points (Point 1 at ~100 nm from the surface, Point 2 at ~300 nm into the bulk) revealed that the oxygen content near the surface was higher than in the bulk for all coatings, indicating that oxidation was limited to the near-surface region (first ~200 nm). This superficial oxidation did not significantly deteriorate the microstructure or the mechanical properties of the coatings, as confirmed by the SEM images and hardness values.
The increased oxygen and carbon content (no carbon depletion observed) near the surface after annealing at 600 °C at an intermediate low pressure can be explained as follows: At temperatures below 500 °C, oxygen atoms diffuse into the near-surface region of the HEC lattice, occupying interstitial sites and partially substituting for carbon atoms. This leads to the formation of a protective oxycarbide layer (e.g., (Ti,Ta,Zr,Nb)(C,O)) that limits further inward oxygen diffusion. Notably, the formation of this oxycarbide phase incorporates carbon into the surface lattice, which accounts for the observed carbon enrichment rather than depletion in the near-surface region. At higher temperatures (not reached in this study), the formation of stable metal oxides such as TiO
2, Ta
2O
5, Nb
2O
5, and Al
2O
3 would occur, and a further temperature increase could lead to the evolution of CO and CO
2, thereby promoting coating oxidation [
30,
31]. According to thermochemical data for transition metal carbides [
32], the equilibrium partial pressure of CO over MC phases at 873 K is extremely low under conditions of low residual oxygen impurities (<1 ppm O
2 in N
2) and surface-adsorbed H
2O. Therefore, significant decarburization via gaseous species does not occur at the tested temperature, and the near-surface carbon enrichment is consistent with the formation of a stable oxycarbide phase rather than carbon loss.
In summary, the (TiAlTaZrNb)Cx coatings with low to intermediate carbon content (C6 and C9, ~24–35 at.% C) exhibited good intrinsic thermal stability at 600 °C, maintaining their columnar microstructure and hardness. The high-carbon coating (C12, ~55 at.% C) showed a moderate reduction in hardness (from 20.0 GPa to 15.4 GPa) but remained structurally stable. It should be noted that this assessment reflects microstructural and mechanical stability at intermediate low pressure and reduced oxygen presence. The oxidation resistance of these coatings at higher temperatures (800–1000 °C) under ambient atmosphere requires further investigation. Nonetheless, the optimal carbon content for balanced as-deposited and post-annealing performance is approximately 35 at.%.
Under fully atmospheric, highly oxidizing conditions, the degradation mechanisms would likely be more severe, including (1) enhanced formation of volatile oxide species (particularly WO3 and MoO3 if present, though these are not in our composition); (2) accelerated internal oxidation and formation of complex oxide scales; (3) potential carbon loss through CO/CO2 evolution at higher temperatures; and (4) possible spallation due to thermal expansion mismatch between the oxide scale and the underlying carbide coating. However, the presence of Al in our coating may promote the formation of a protective Al2O3 layer under oxidizing conditions, potentially improving oxidation resistance compared to Al-free refractory carbide systems. Future work will address oxidation resistance under ambient atmosphere to provide a more complete assessment for practical deployment.



 ,
,