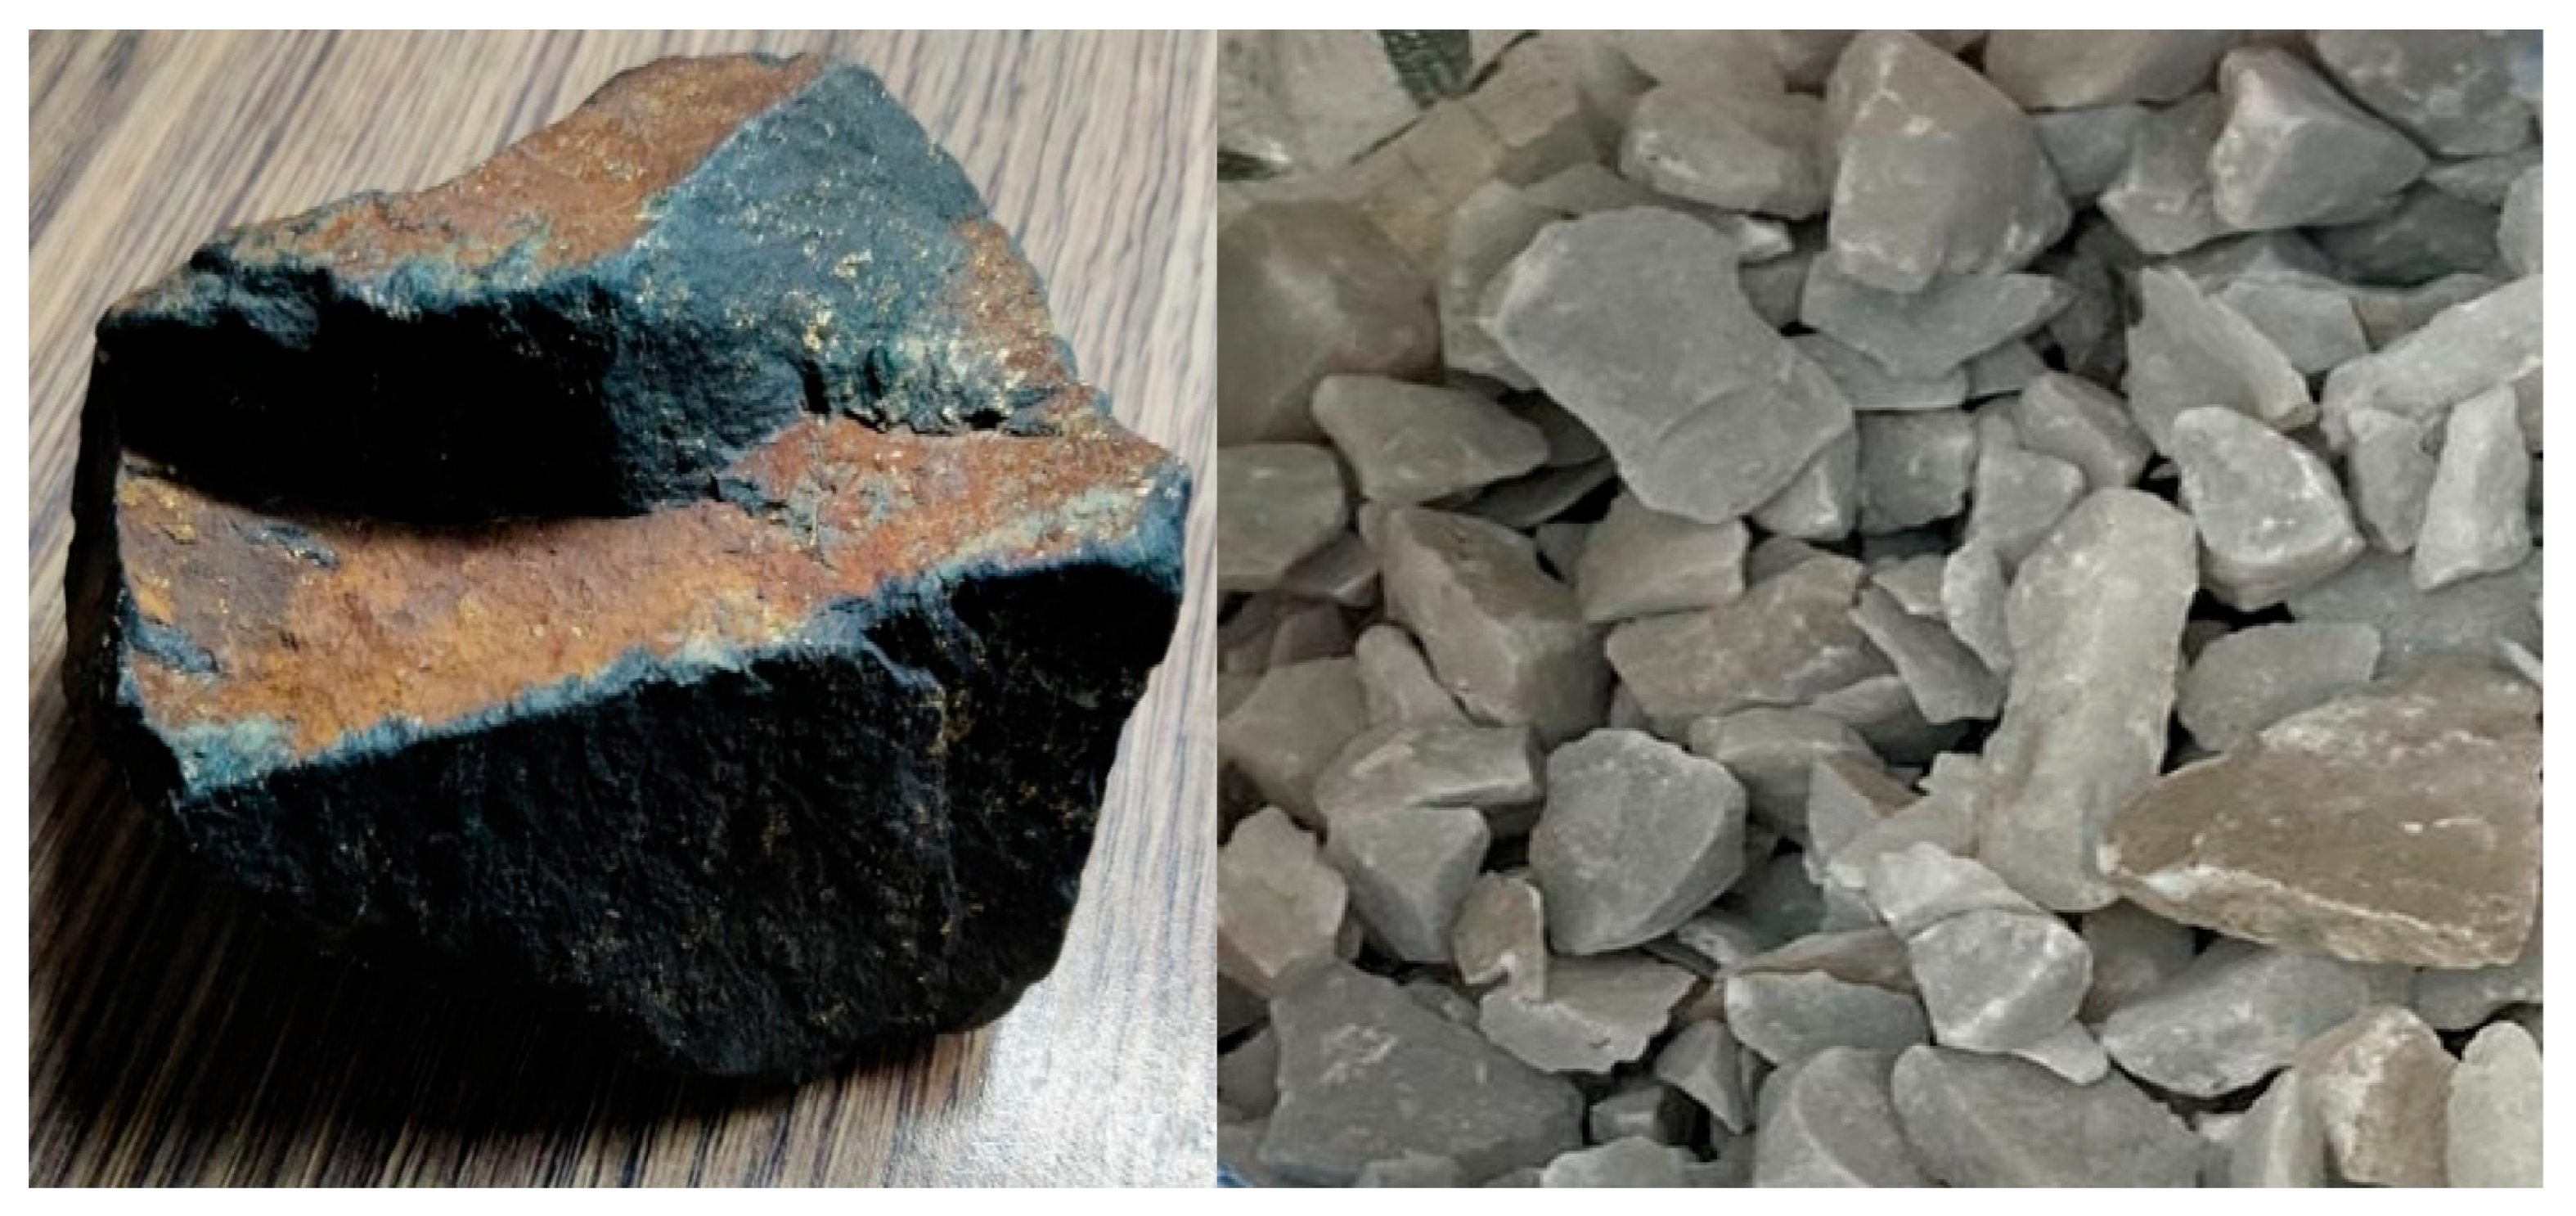
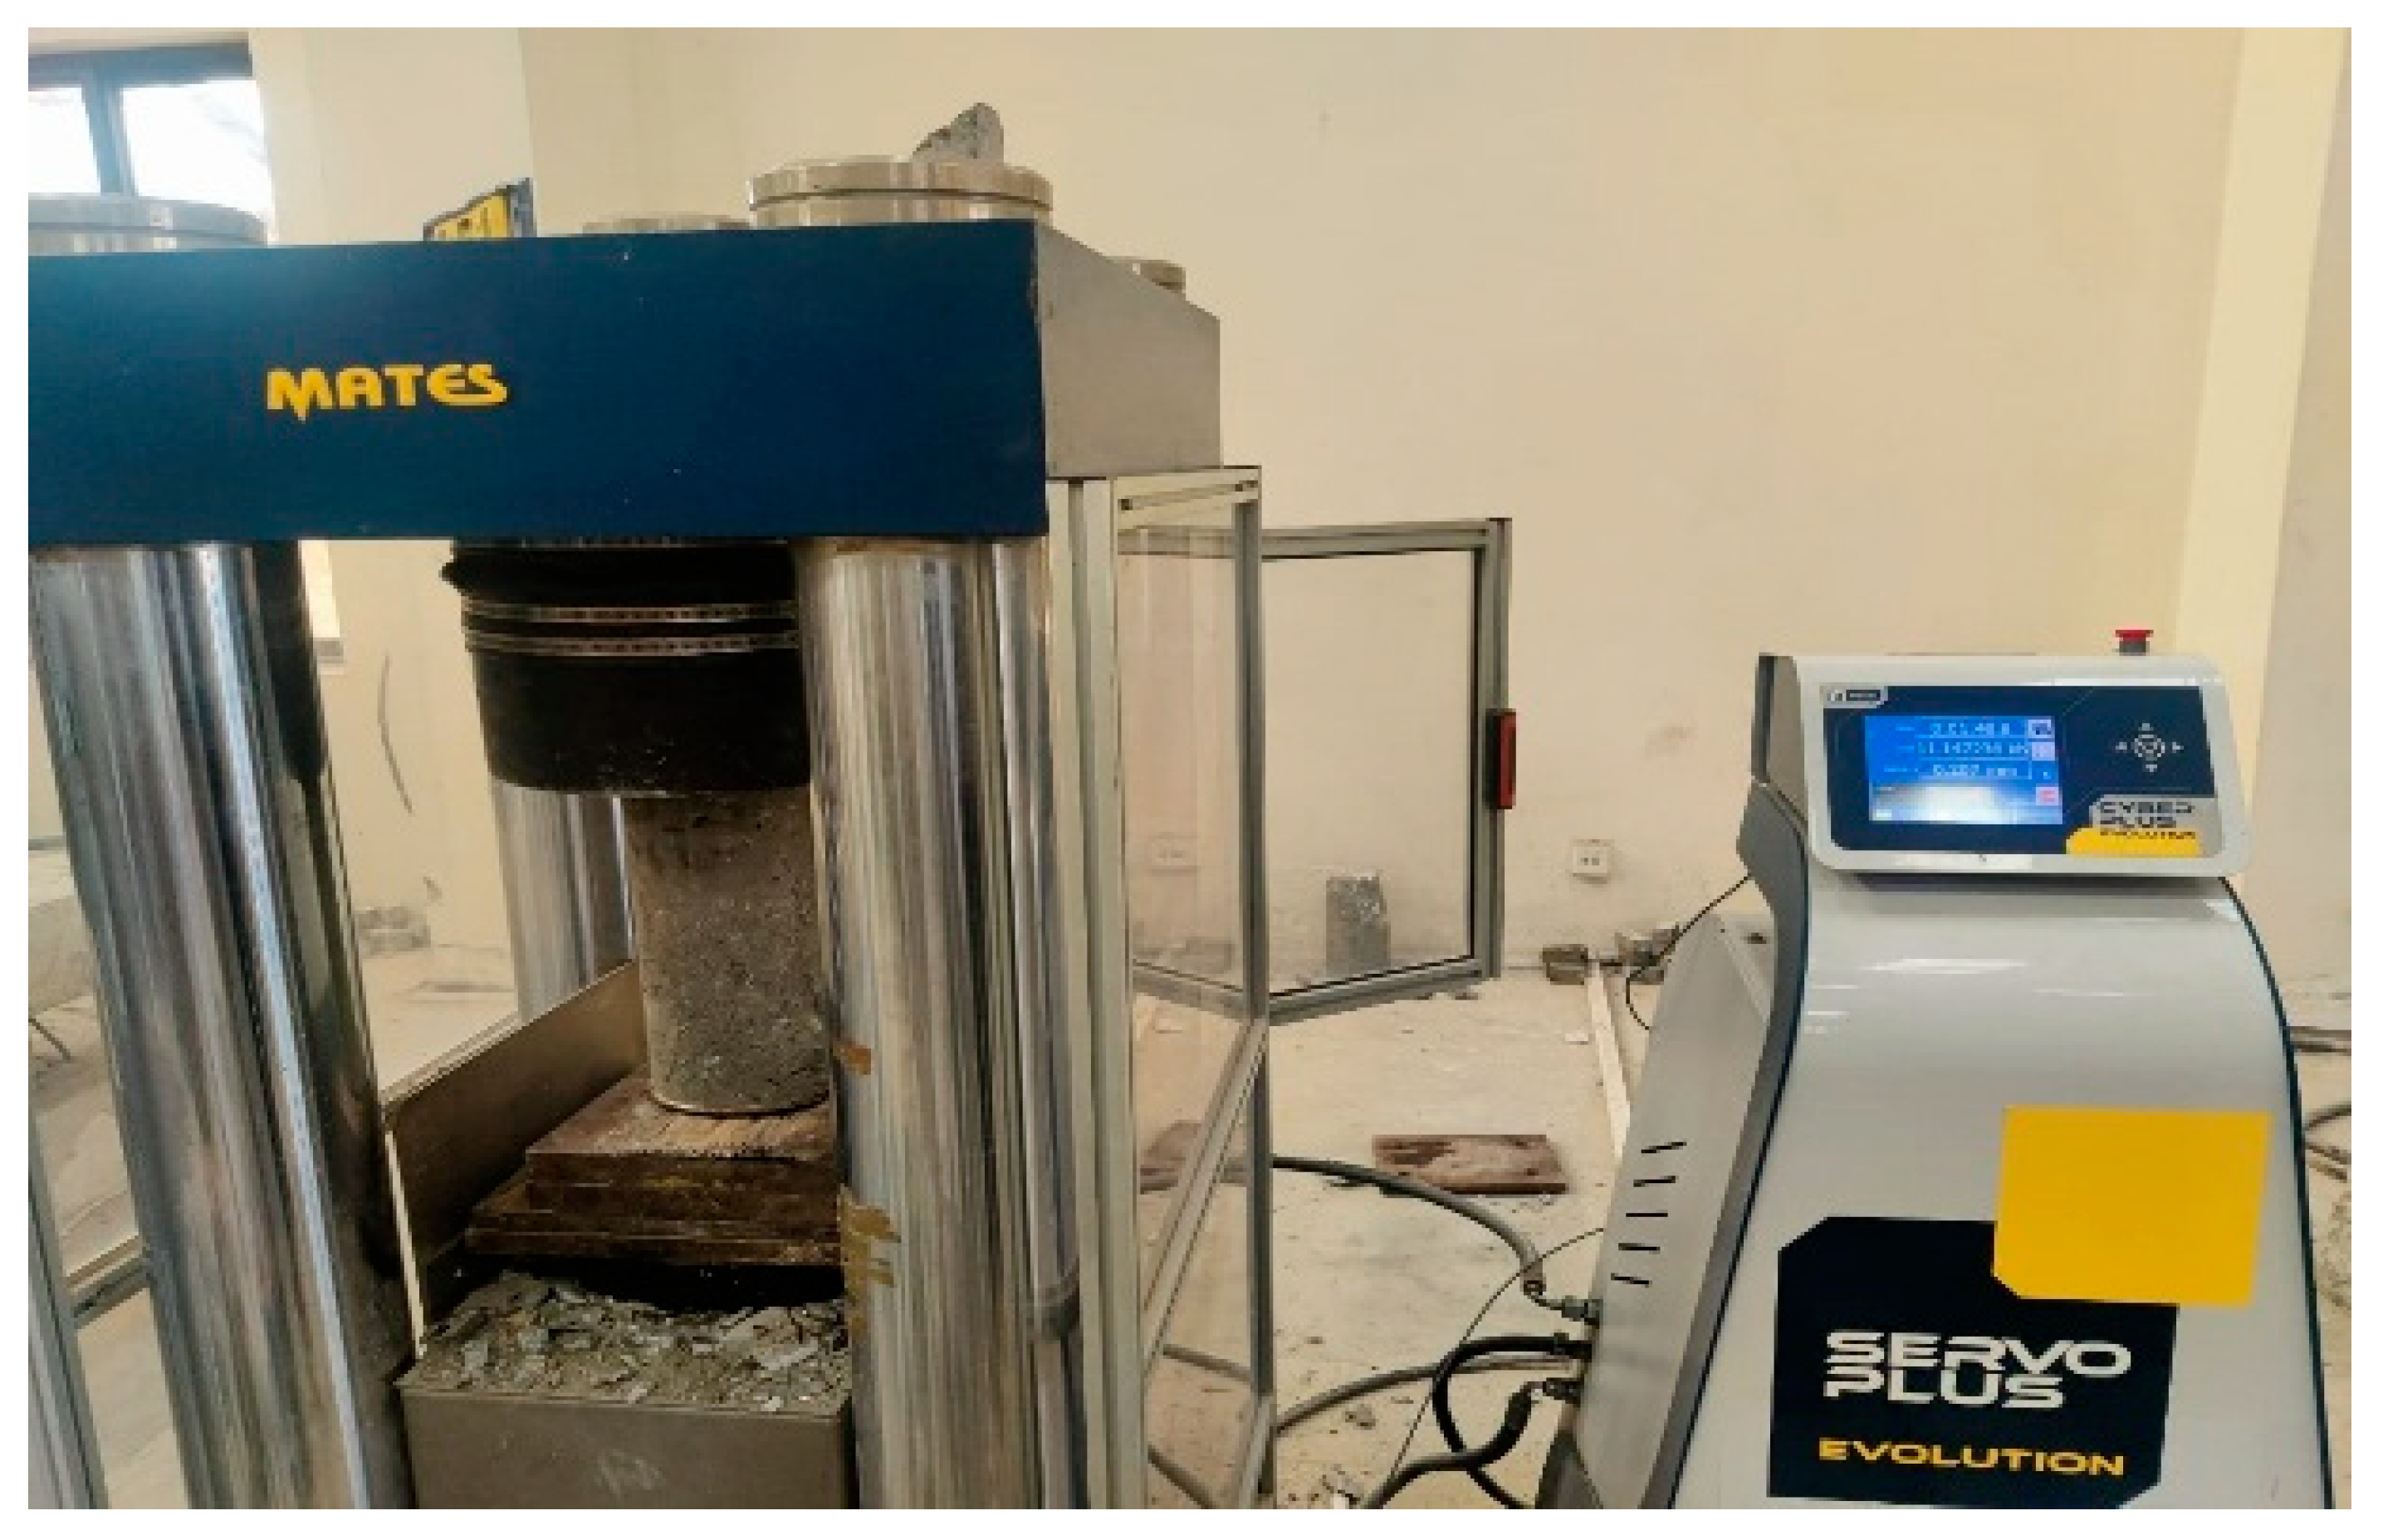
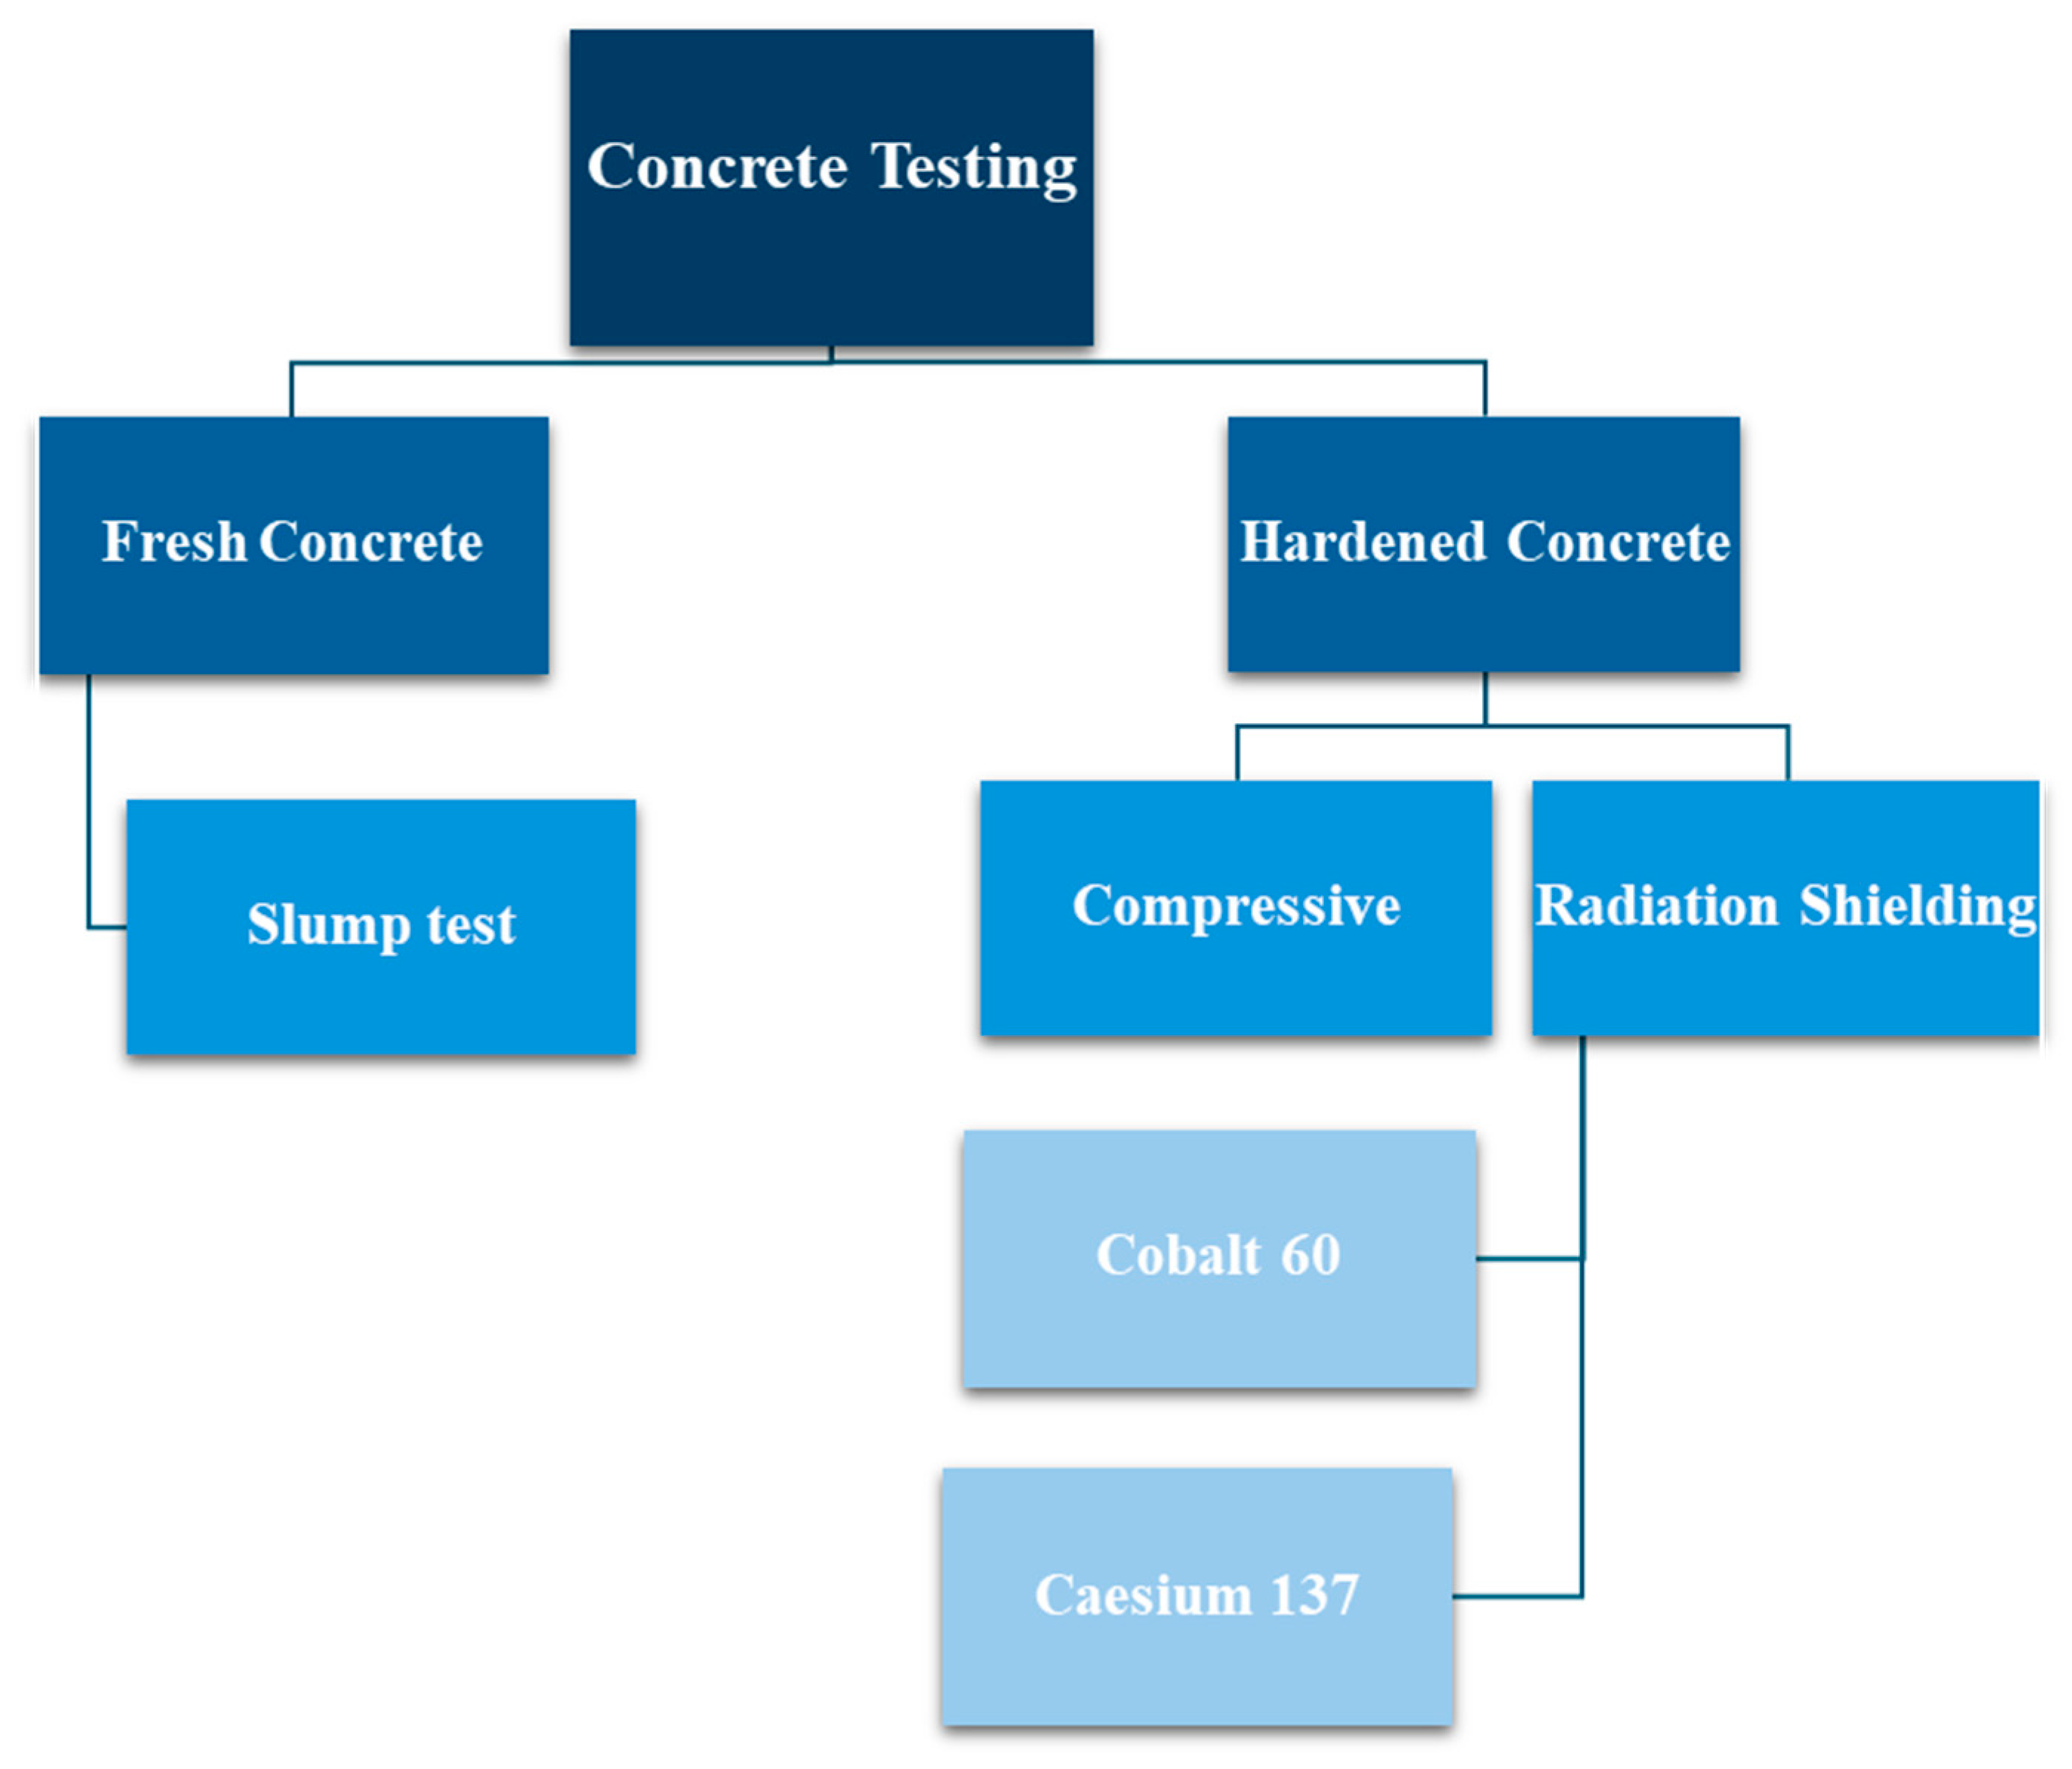
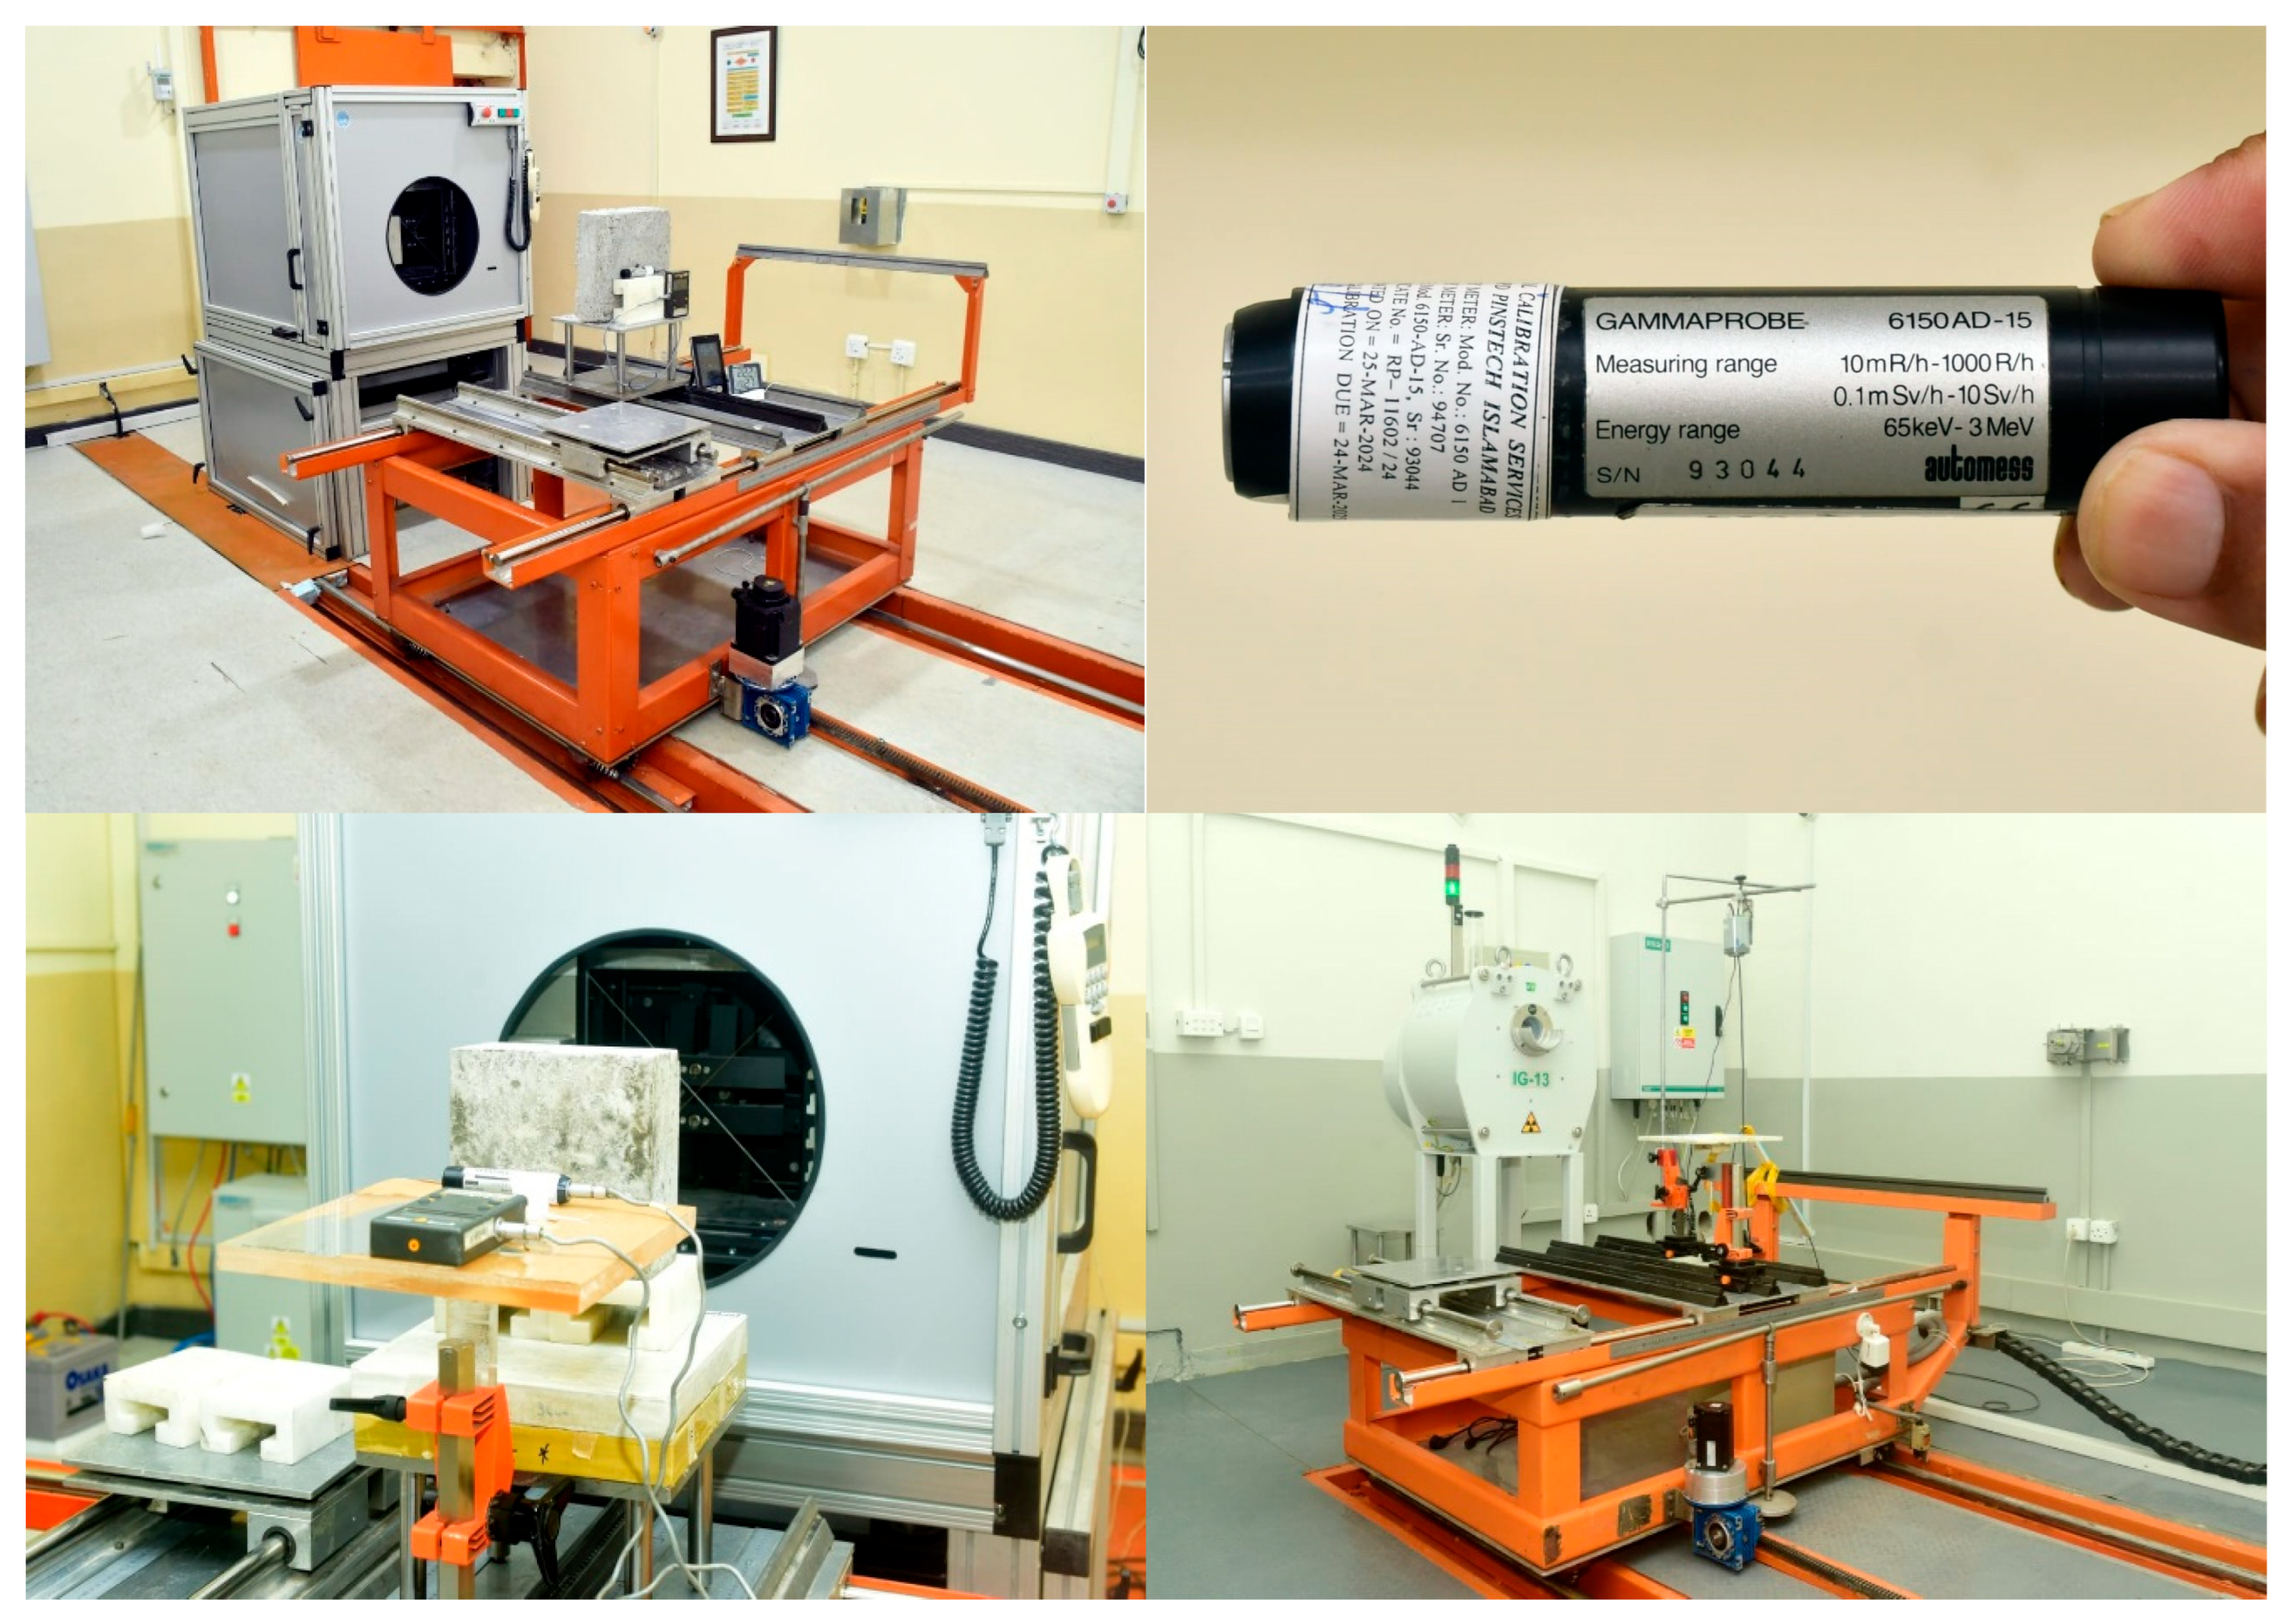
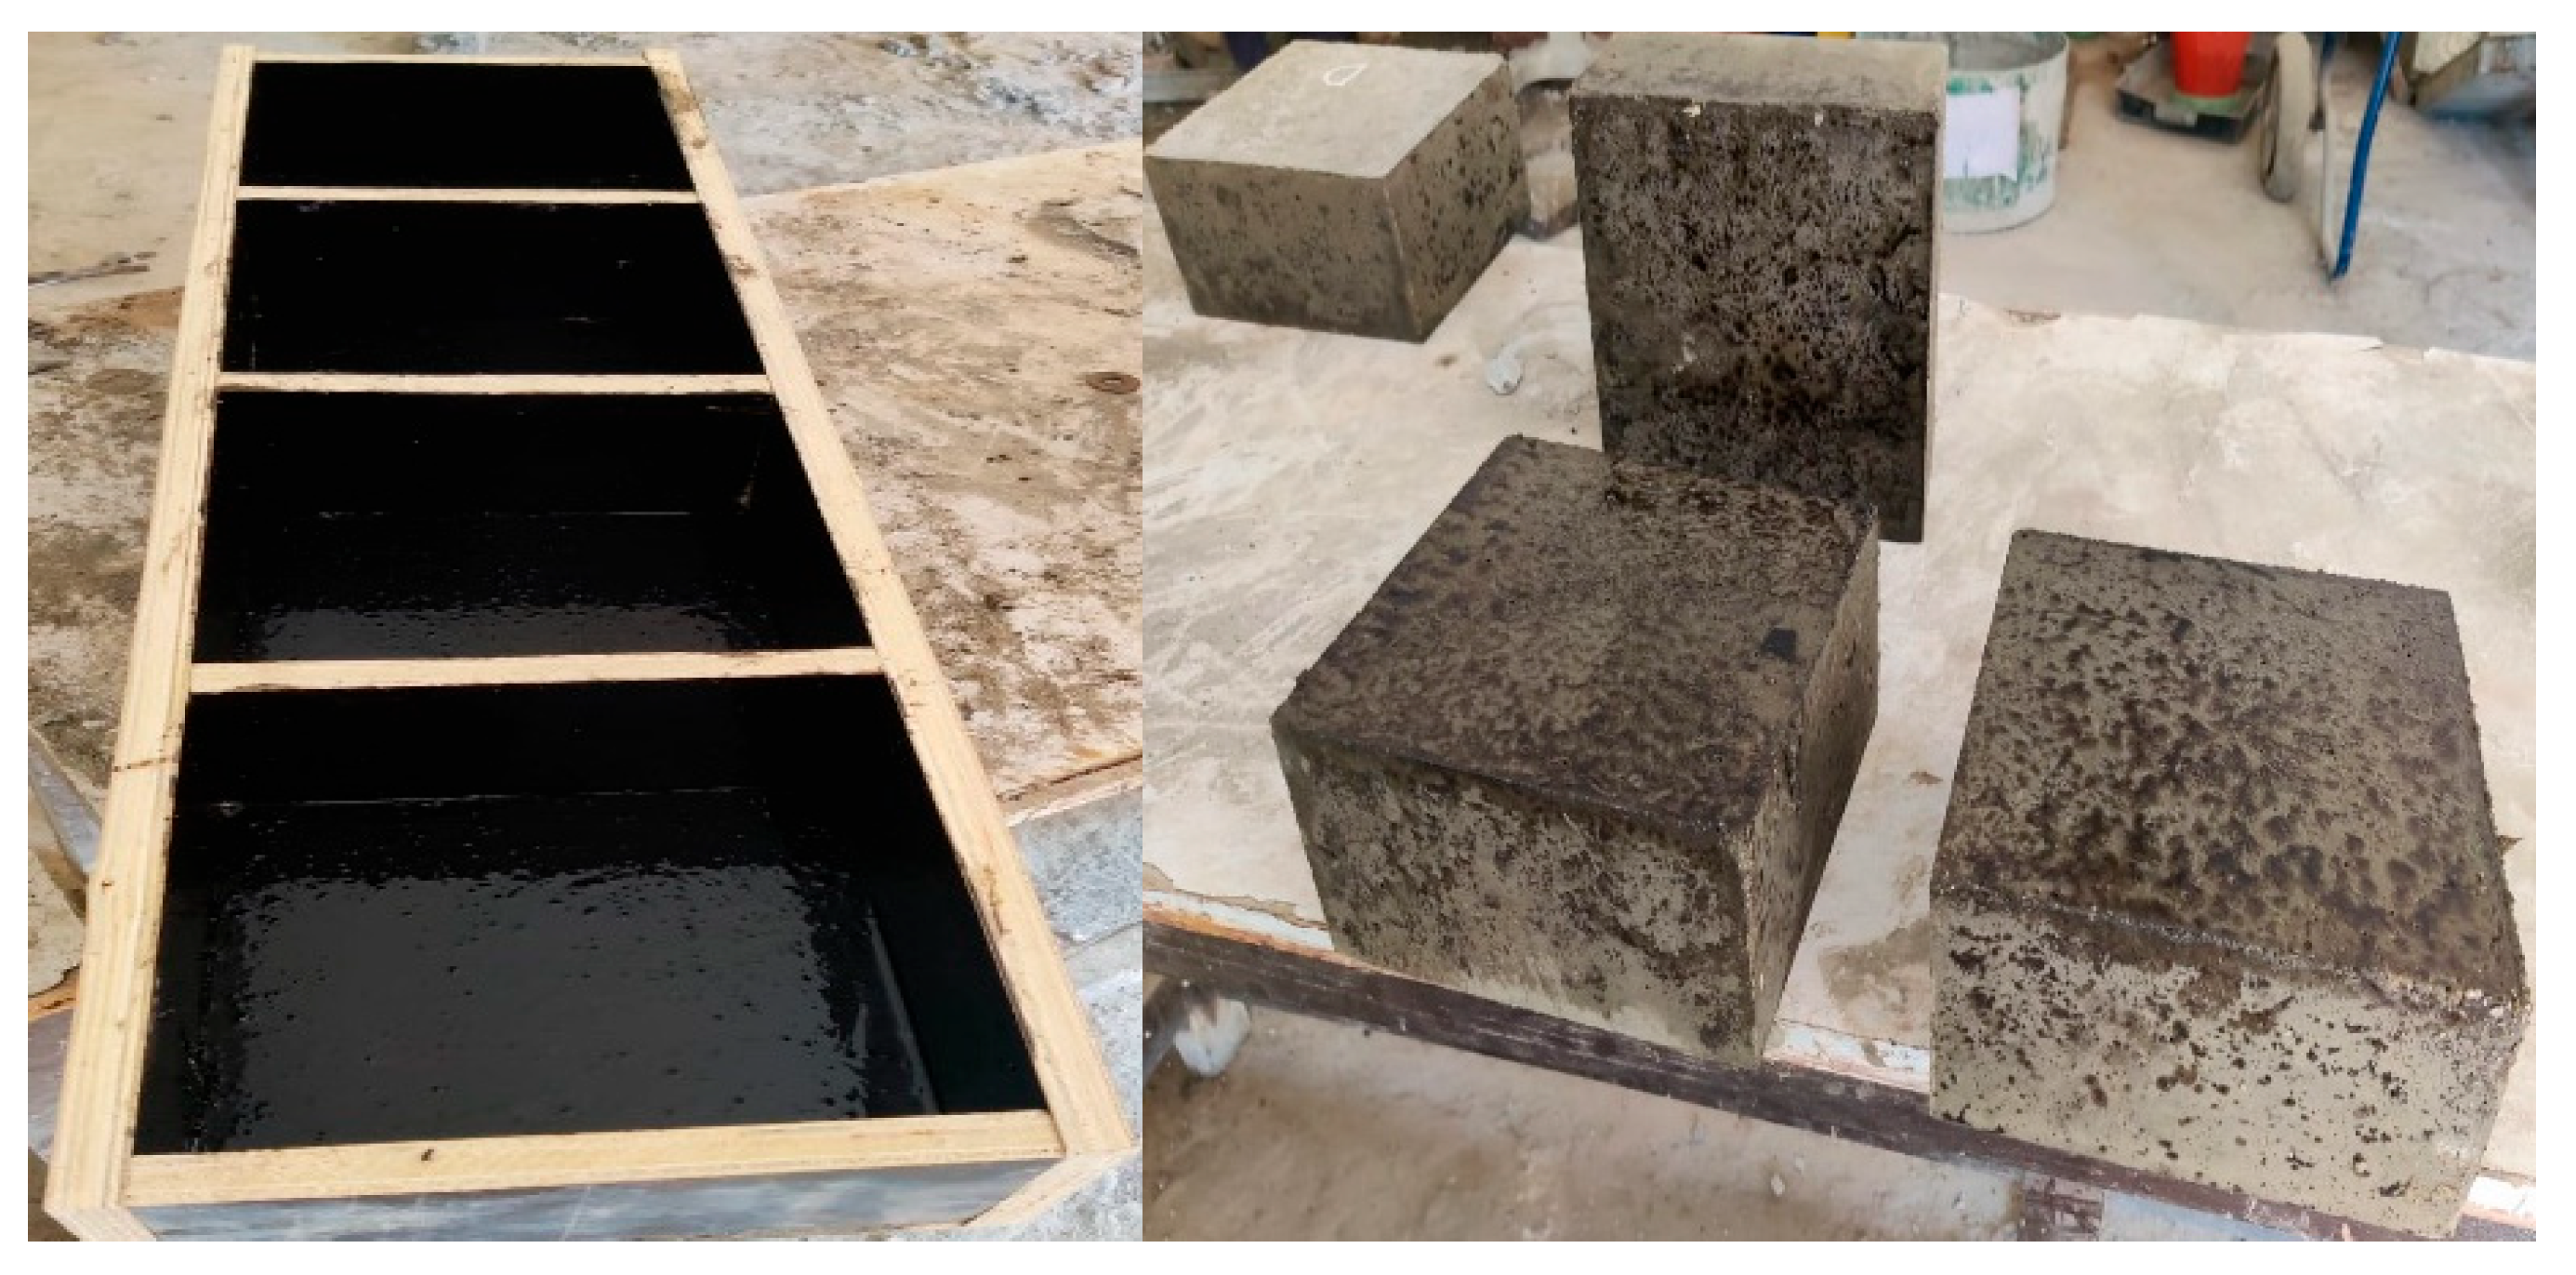
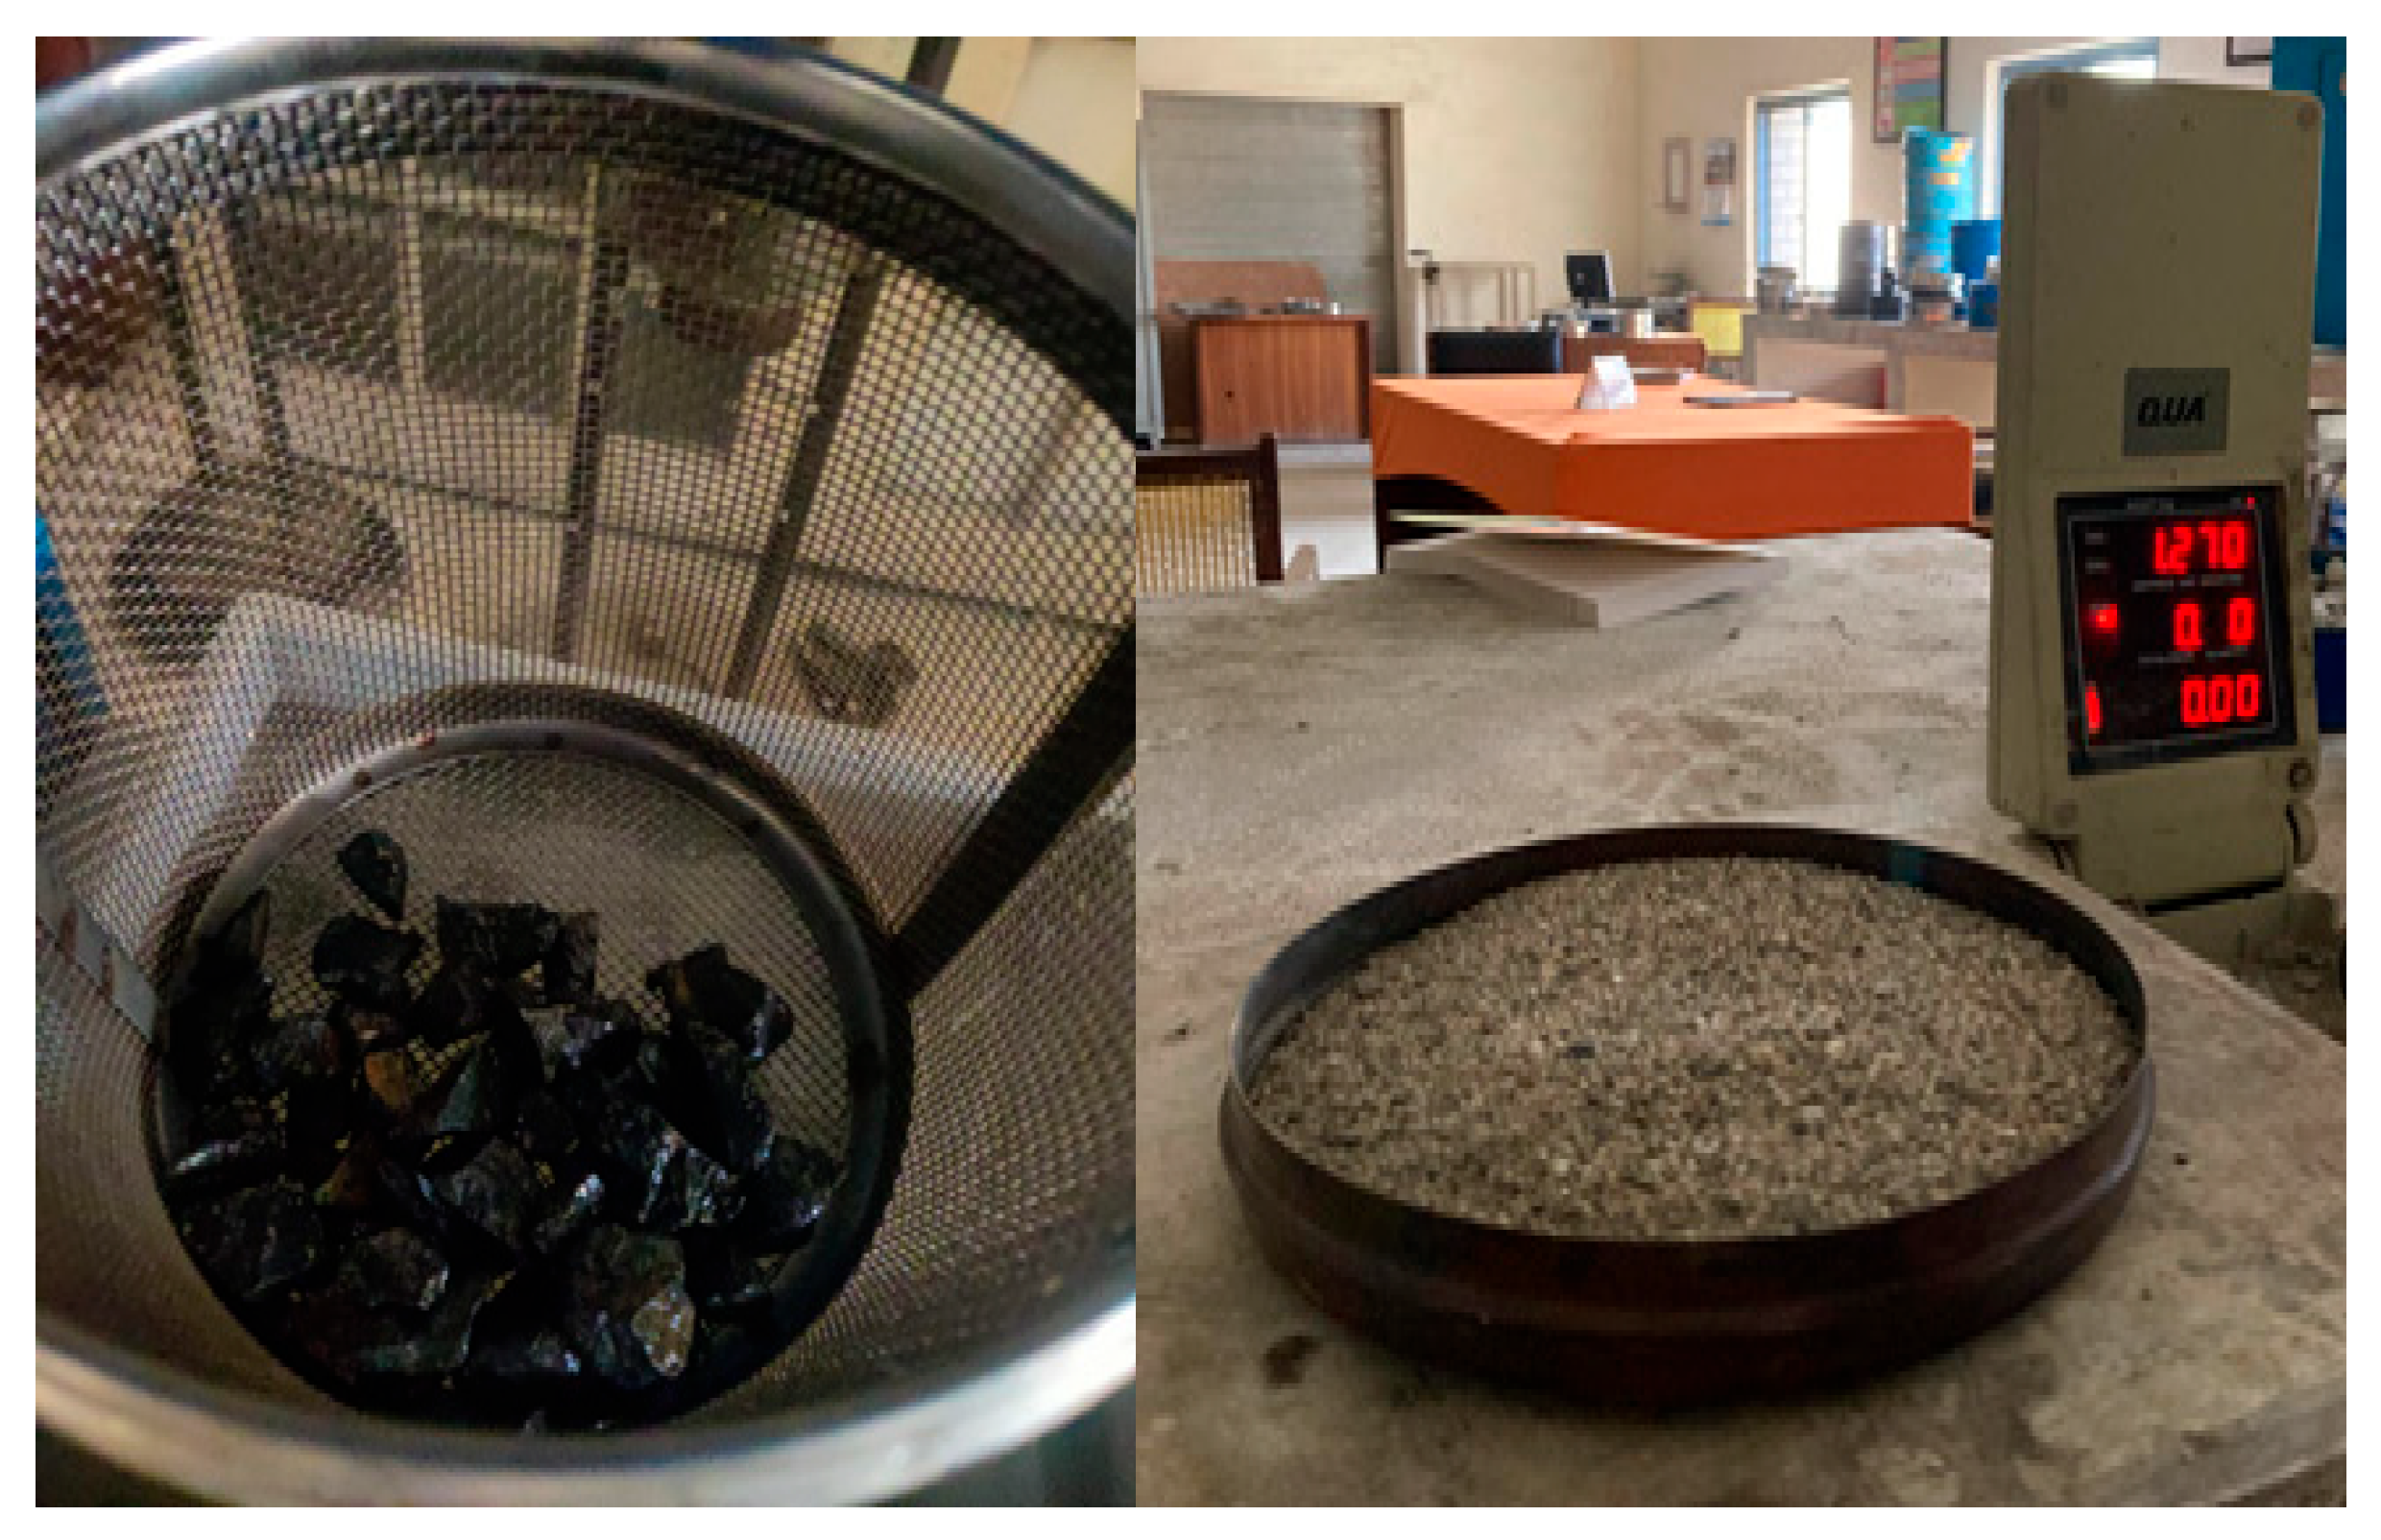
3.1. Tests Performed on Aggregates
Sieve analysis was conducted to determine the particle size distribution of the coarse aggregates. The maximum aggregate size was found to be 19 mm, indicating a well-graded distribution suitable for dense and uniform concrete. This gradation minimizes voids and segregation, improving compaction and overall strength, which is particularly beneficial for high-density mixes containing magnetite and dolomite.
The three different coarse aggregates used in this study (normal, magnetite, and dolomite aggregates) were treated in the same way as per the ASTM C33 [
33], ensuring a consistent and comparable gradation envelope across all mixes. The gradation of the coarse aggregate meeting ASTM C33 [
33], Size No. 67 (maximum size of 19 mm), is shown in
Table 4. All three coarse aggregates, i.e., normal, magnetite, and dolomite, were made to meet this gradation curve in order to achieve similar packing densities in all mixes. This uniformity in maximum aggregate size eliminates gradation as an independent variable, allowing the observed differences in compressive strength and radiation attenuation between mixes to be attributed directly to aggregate type and density rather than particle size distribution effects.
Specific gravity tests were carried out following ASTM C127 [
34] and ASTM C128 [
35]. The normal coarse and fine aggregates exhibited values of 2.65 and 2.64, respectively, as presented in
Table 5, confirming good quality and low porosity. In comparison, magnetite and dolomite showed higher specific gravities of 4.8 and 2.9, respectively, which significantly enhance the density and radiation-shielding potential of the concrete.
The absorption capacities determined according to ASTM C127 [
34] and ASTM C128 [
35] were 1.45% for coarse and 3.51% for fine aggregates, as indicated in
Table 6. The higher absorption of fine aggregates was considered during mix design to maintain the target water-to-cement ratio. Moisture contents of 1.01% (coarse) and 3.36% (fine) were also recorded to ensure accurate batching adjustments.
The fineness modulus (FM) of the fine aggregate was determined as 2.34 in accordance with ASTM C136 [
43] as shown in
Figure 6. This value indicates that the sand used was relatively fine, falling near the lower limit of the standard range, as indicated in
Table 6.
3.3. Compressive Strength Results
Compressive strength data were collected from the testing and are shown in
Table 8. Mix 1 (50% magnetite, 25% dolomite) had a strength value of 25.83 MPa (3747 psi) at day 28, which was 25.2% greater than the strength of the control 20.62 MPa (2991 psi), whereas Mix 2 (25% magnetite, 50% dolomite) produced a strength value of 22.92 MPa (3324 psi), which is 11.1% better than the control mix, at 20.62 MPa (2991 psi). The increasing values of strength as a function of increasing magnetite were because of its angular form with a high hardness (density ρ = 5.17 g/cm
3). Both hybrid mixes exceeded the designed strength target value of 20.68 MPa (3000 psi) at day 28.
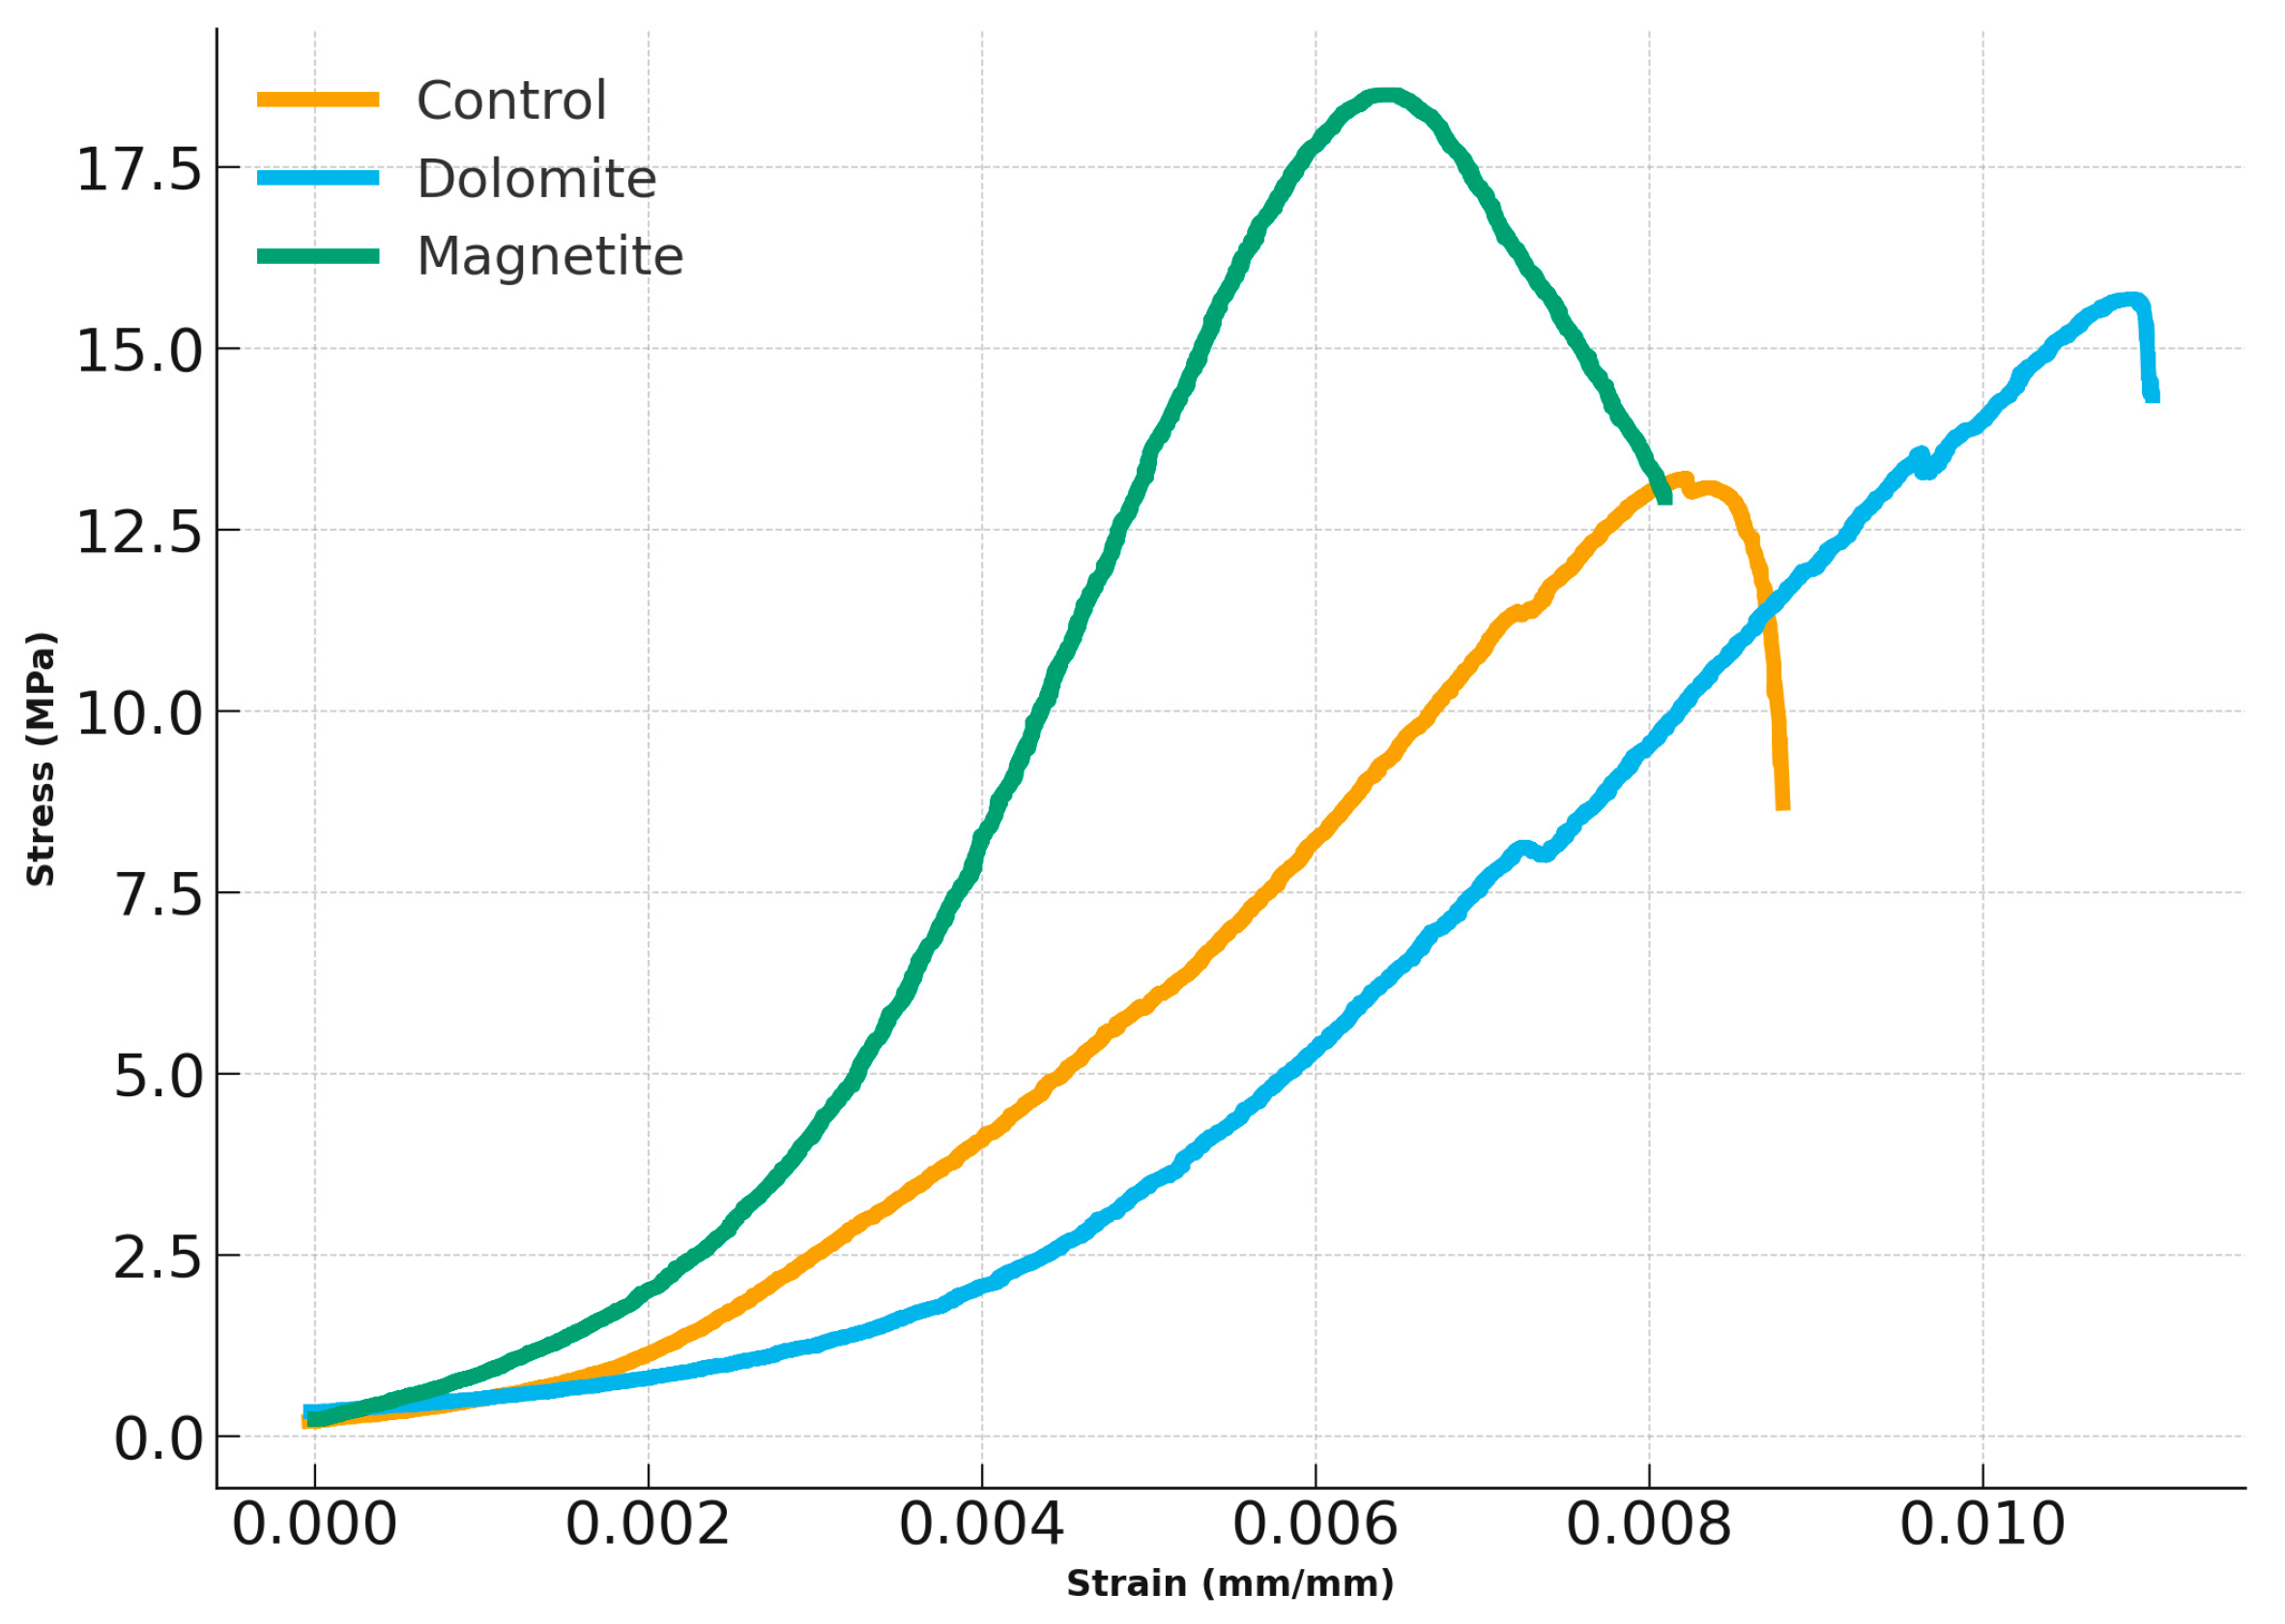
At 7 days, all three mixes exhibited the classic compressive response of concrete (
Figure 7): an initial “toe” region with low stiffness, as seating effects and micro-void closure dominate; a quasi-linear hardening segment as the matrix and aggregates share load; a nonlinear pre-peak regime as microcracks nucleate and coalesce primarily at the interfacial transition zone (ITZ); a peak stress; and a post-peak softening governed by cracking localization and aggregate/paste failure. The ordering of peak strengths is clear; magnetite is approximately 17.5 MPa at 0.0064 strain > dolomite is approximately 15.4 MPa at ~0.0109 > and the control mix is 13.MPa at ~0.0082. This ranking aligns with expectations from aggregate physics, as magnetite aggregate is denser, stiffer, and typically enhances the load-bearing skeleton earlier in the loading history, while the conventional control mix relies more on paste contribution and a weaker ITZ. Dolomite sits between the two, with better deformability but not the same early stiffness as magnetite.
The most striking feature is the pace of the magnetite mix picking up stress. By ~0.005 strain, the magnetite curve is already around 14 MPa, whereas control and dolomite are only 6 MPa and 3 MPa, respectively, as illustrated in
Figure 8. Mechanically, this implies the effective stiffness is much higher for the magnetite mix once the toe-in is cleared and the load path quickly engages a stiff aggregate skeleton, meaning the paste and ITZ are sufficiently sound at 7 days to transfer load efficiently into the dense magnetite particles. In short, magnetite “locks up” early, reducing compliance and elevating stress for a given strain.
However, there is a trade-off that shows up in the strain at peak. The magnetite mix peaks at 0.006 to 0.0065, notably earlier than dolomite (0.0109) and control (0.0082). This is the signature of a more brittle response. The likely mechanism is modulus mismatch at the ITZ, where the very stiff magnetite particles concentrate stresses in the surrounding paste; as loading proceeds, microcracks initiate and link up along the ITZs, so once the network percolates, the specimen reaches peak and the drop beyond is relatively abrupt.
The dolomite mix climbs more leisurely. At 0.005 strain, dolomite is only 3.5 MPa, but it keeps hardening steadily up to 15.7 MPa at 0.0109. This curve shape shows aggregate stiffness is lower and the ITZ is comparatively more forgiving; microcracks nucleate later and accumulate more gradually, and the system absorbs more inelastic deformation before peak. Up to the peak, the area under the curve comes out largest for dolomite among the 7-day mixes (0.0627 MPa strain to peak vs. 0.0445 for magnetite and 0.0424 for control), indicating greater energy absorption prior to failure. The physical picture is that the lower contrast in stiffness between dolomite and paste reduces stress concentration at the ITZ, delaying unstable crack growth.
The control mix sits between these two, being more compliant than magnetite and less ductile than dolomite. It peaks at 13.2 MPa around 0.0082 strain, with a moderate drop thereafter. This behaviour is consistent with a typical crushed-rock aggregate concrete at an early age.
In all three curves, as strain moves past 0.003 to 0.004, the slope decreases noticeably. This is the regime in which distributed microcracking begins to dominate. In magnetite concrete, because the aggregate carries load efficiently, the transition is sharp: once the ITZ starts to microcrack, the load transfer path degrades quickly, and peak arrives earlier. In dolomite, microcracking is more diffuse and progresses over a wider strain band, so it has a smoother approach to peak and more gradual post-peak softening.
Compressive strength depends on the stiffness and strength of paste (C-S-H gel, capillary porosity), aggregate stiffness and shape, ITZ thickness/defects, and confinement from lateral restraint created by internal aggregate interlock. Magnetite’s high particle stiffness and likely angularity promote early confinement and high apparent stiffness, but a stiffer skeleton also means less tolerance for strain. Dolomite’s more compliant skeleton allows microcracks to spread and blunt, so it can carry load at higher strains, even if ultimate stress is lower. The control mix mirrors the classic concrete response without the extreme effects seen in the other two.
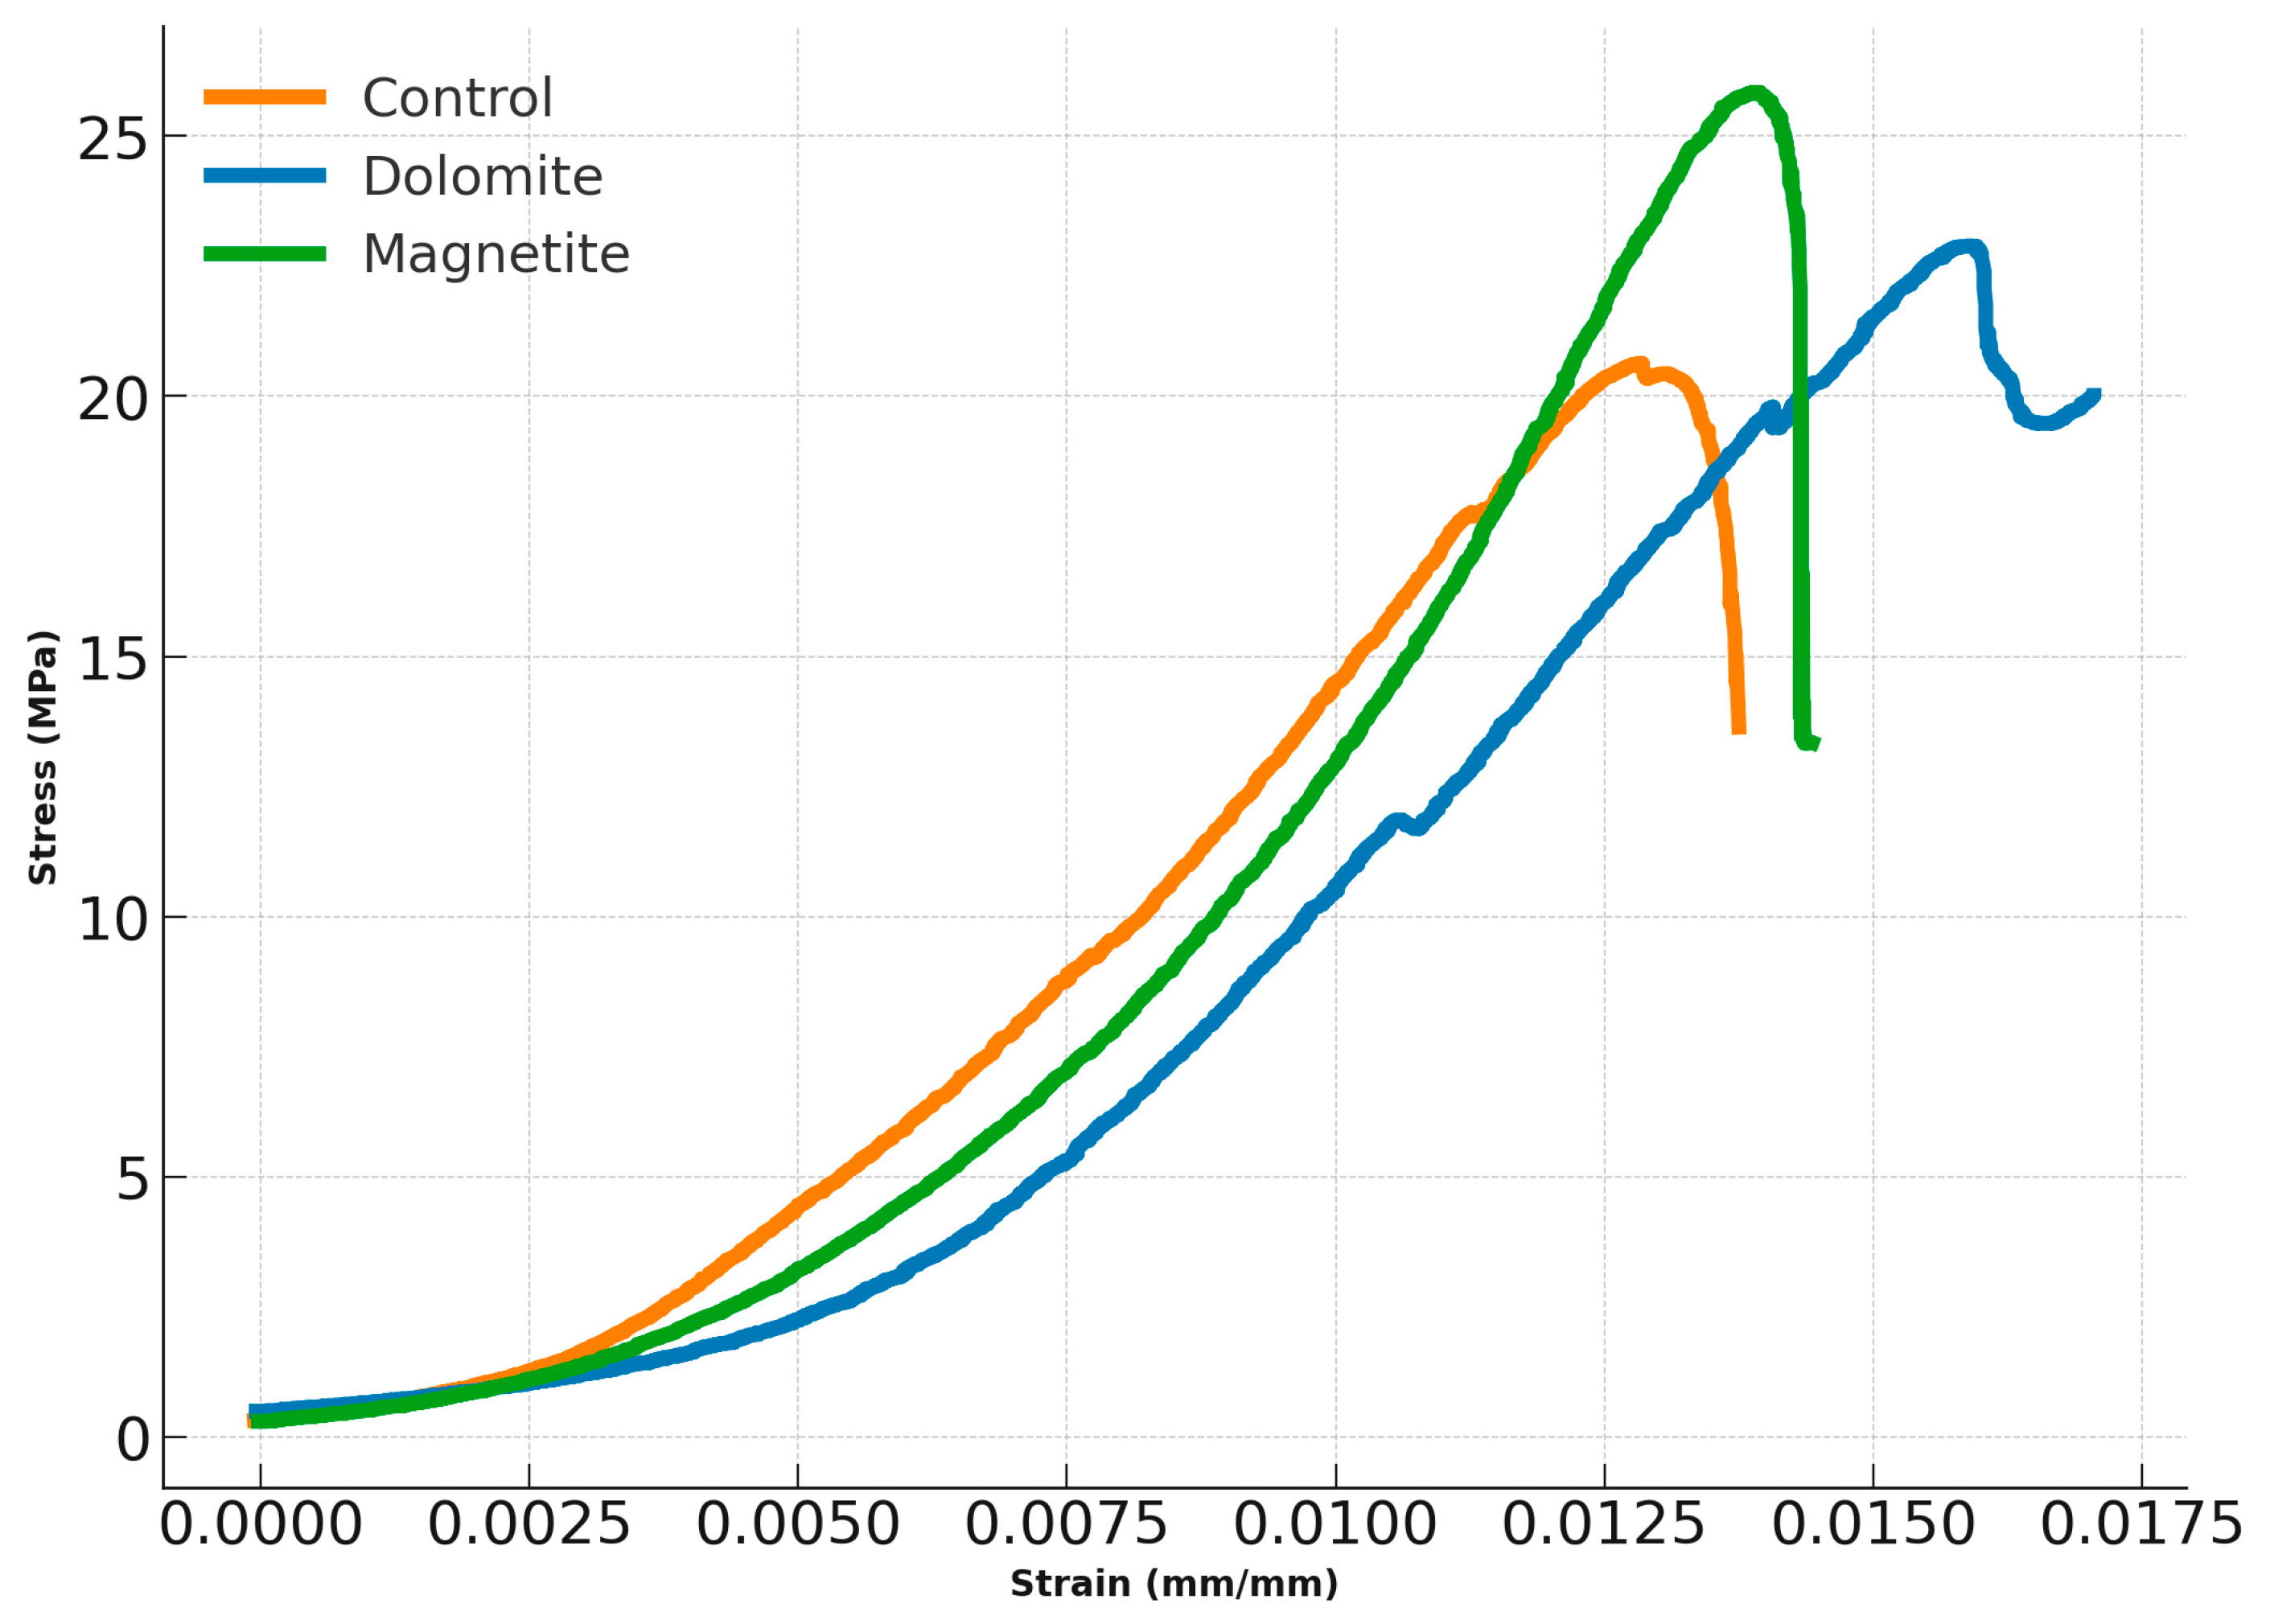
At 28 days, the microstructure matures, more hydration products fill capillary pores, ITZ porosity drops, and paste stiffness increases (
Figure 8). All three mixes shift upward and to the right higher strengths and larger strains at peak. Measured peaks move to 25.8 MPa at 0.0139 (Magnetite), 22.6 MPa at 0.0156 (Dolomite), and 20.6 MPa at 0.0128 (Control), as illustrated in
Figure 8. Relative to 7 days, this is roughly a +40% (Magnetite), +45% (Dolomite), and +56% (Control) gain in peak stress, with similarly notable increases in the strain at peak. This is a demonstration of ITZ strengthening and paste densification with curing.
Looking closely at the first 1% strain, the ordering there is subtle. In the curve, at 0.010 strain, the control mix is 14.5 MPa, slightly above dolomite (10.6 MPa) and close to magnetite (13.0 MPa). This means at service-level strains, the control mix’s paste and aggregate system is stiffened substantially by curing, closing the gap with magnetite and surpassing dolomite in the mid-strain regime. Dolomite’s lower stiffness means less stress concentration at the ITZ. The curve therefore bends up more strongly in the 0.010–0.015 strain band, catching and then nearing magnetite in stress just before magnetite peaks. This is because dolomite stores more deformation before hitting its maximum stress. The post-peak shapes separate the mixes. Magnetite shows a steep drop after peak, characteristic of a brittle transition where the ITZ/paste around very stiff particles gives way and localized crushing propagates quickly. Dolomite, in contrast, keeps carrying high stress even past 0.017 strain, with only gentle undulations consistent with progressive microcracking, frictional sliding, and aggregate interlock rather than a single catastrophic crushing front. The control mix sits in between a distinct drop after 0.0128 peak but not as abrupt as magnetite.
The area under the curve to peak confirms this maturation. By 28 days, all three increase markedly: the control mix shows a 0.104 MPa–strain ratio, dolomite 0.128, and magnetite 0.119. This ranking means that while magnetite wins on ultimate strength, dolomite wins on pre-peak energy capacity, and the control mix—though it gains the most strength percentage-wise—still exhibits the least energy absorption to peak among the three. This implies that if ductility/energy dissipation is important, dolomite aggregate is attractive; if peak strength and density matter most, magnetite is compelling; and if economy and predictable moderate behaviour are the priority, the control mix is acceptable.
Continued hydration produces more C-S-H and fills capillary voids, improving the stiffness and strength of the paste and ITZ. This why the control mix, which relies more on paste quality than “super-stiff” aggregate, shows the largest percent gain in peak stress (≈+56%). The stiffer aggregates (magnetite) already provided a strong skeleton at 7 days; their relative gain is a bit smaller because the paste is no longer the bottleneck to the same extent.
As the ITZ densifies, the effective contact area and bond between paste and aggregate increase, raising the stresses that can be transmitted before microcracks localize. This particularly helps mixes where the aggregate/paste stiffness mismatch is high (magnetite), evidenced by the much larger strain at peak at 28 days (0.0139 vs. 0.0064 at 7 days). Essentially, the skeleton carries more load for longer before brittle localization kicks in.
The abrupt drop in the magnetite curve after the peak indicates crack localization and crushing of a narrow zone (a “shear band”) that forms once the ITZ gives way. Dolomite’s extended tail suggests distributed damage, microcracks continue to form and slide, but aggregate interlock and frictional bridging maintain load over a wider strain window. The control mix shows a moderate post-peak descent, consistent with a typical aggregate/paste balance. Similar instability phenomena in terms of localized energy dissipation and strain concentration have also been found to exist in the case of studies conducted on brittle geomaterials. Earlier studies have revealed that when the strain energy stored within the structure exceeds a certain limit, there is the possibility of local crack growth and degradation of the structural material causing sudden softening after peak loading. Hence, the observed decrease in stress in the case of magnetite-filled mixes could be due to localized energy dissipation and crack formation [
24].
In sum, the 28-day curves demonstrate the expected strengthening and “stretching” of the response with curing, while preserving the aggregate-driven mechanical response. Magnetite provides the highest strength and a sharper post-peak; dolomite demonstrates the highest energy capacity and ductility, while the control mix has solid all-round performance with big curing gains.
3.6. Comparison of Control Mix, Mix 1, and Mix 2 in Terms of Radiation Shielding Performance
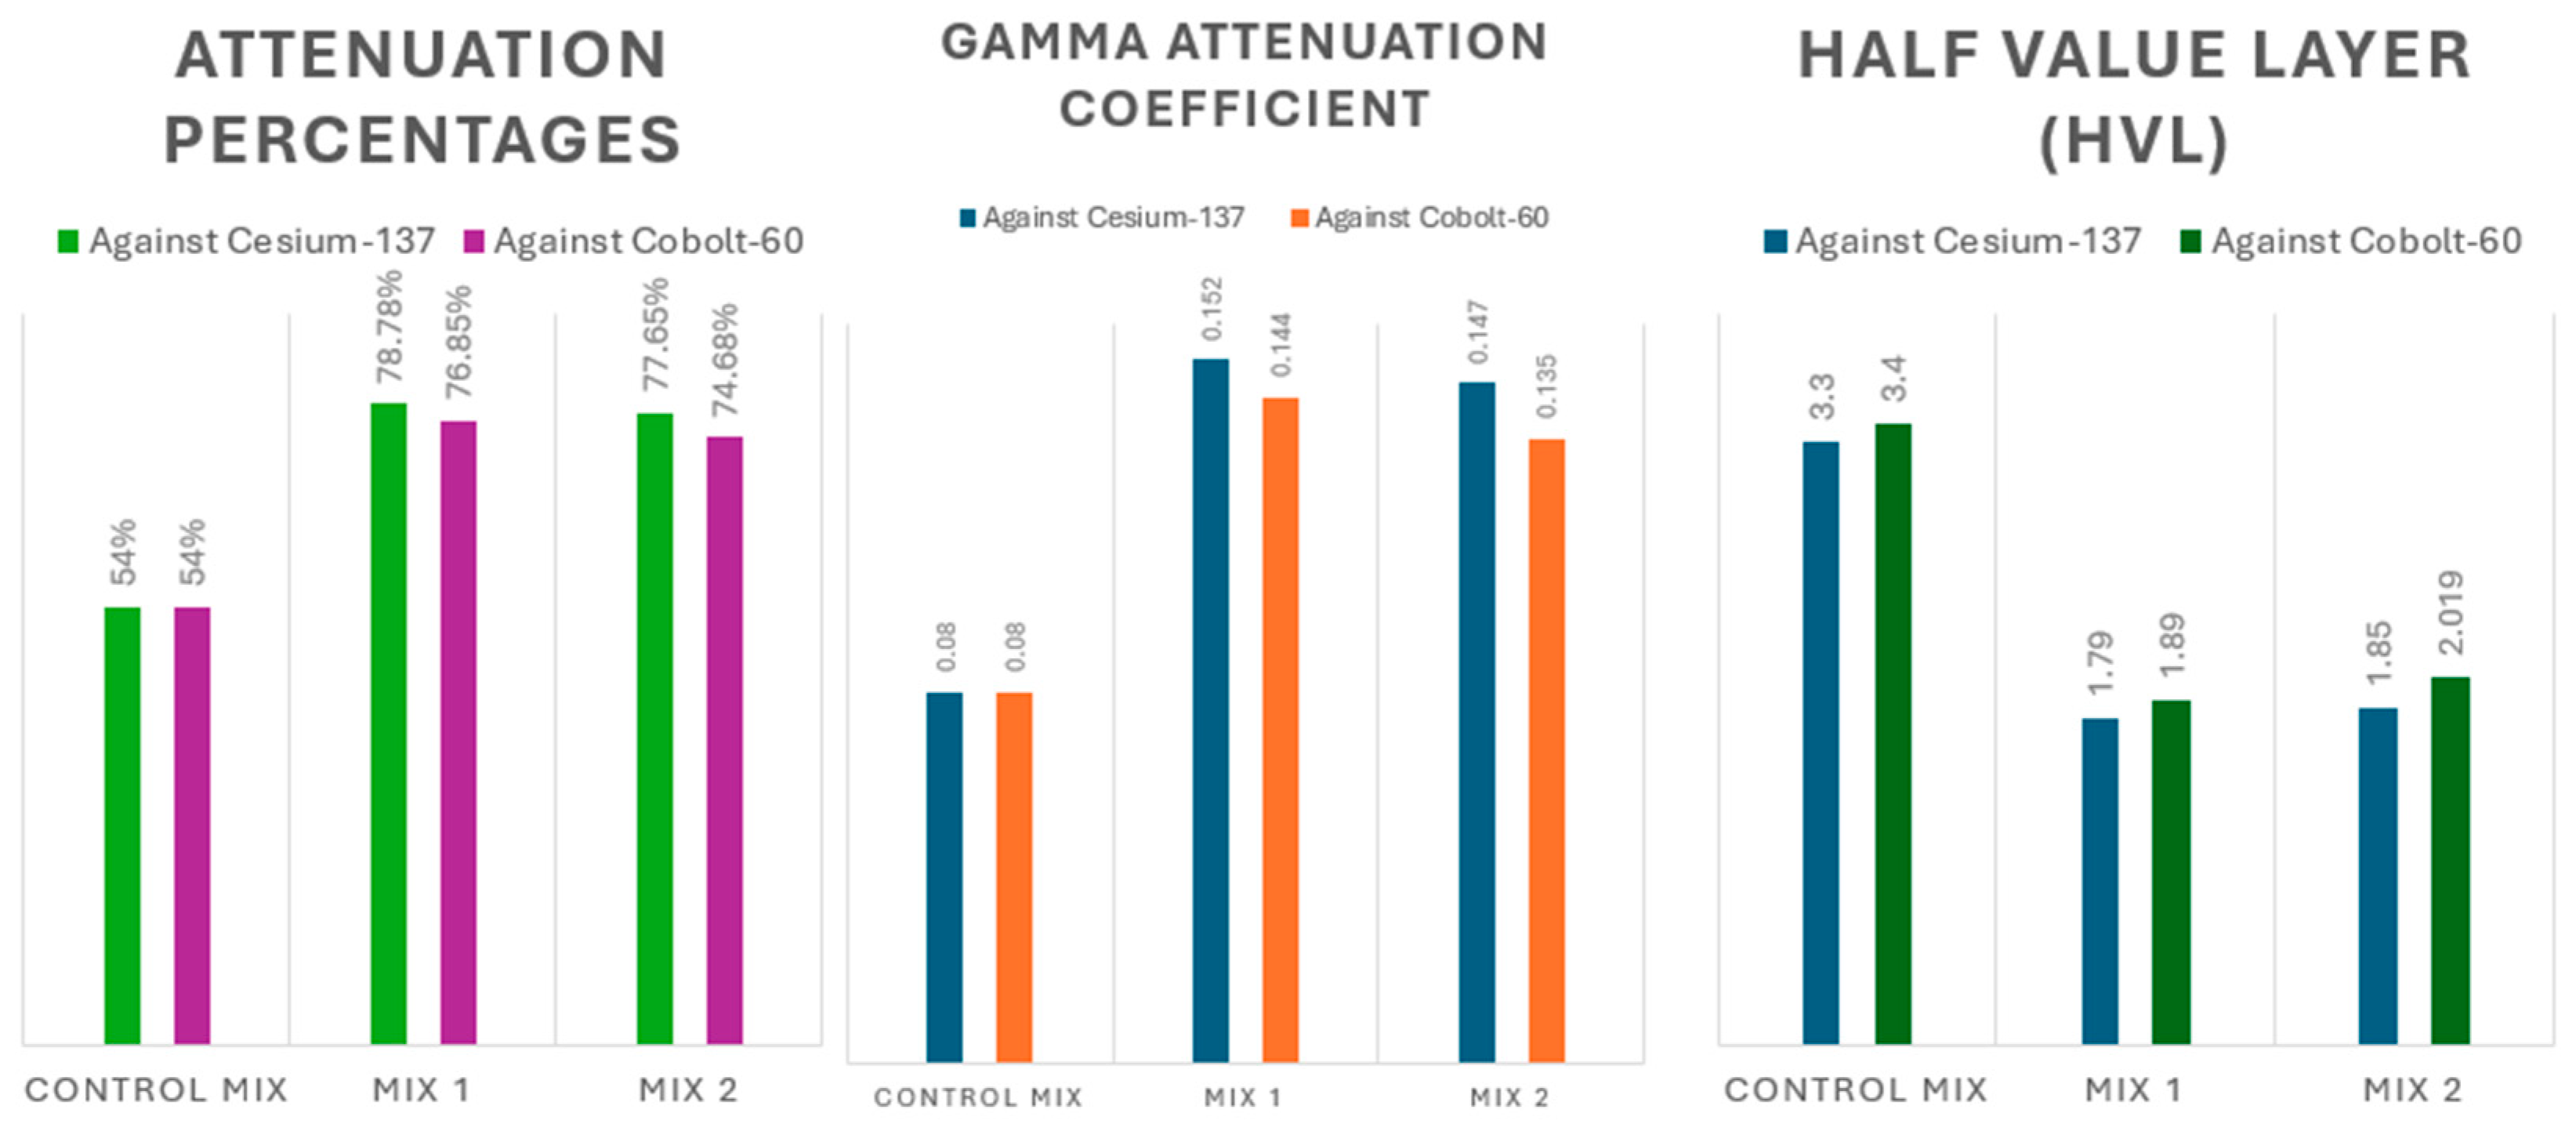
Figure 9 illustrates a comparative analysis of the attenuation percentage, gamma attenuation coefficient, and half-value layer for three different concrete mixes—the control mix, Mix 1, and Mix 2—when exposed to gamma radiation from Cesium-137 (0.6 MeV) and Cobalt-60 (1.2 MeV).
Figure 9.
Comparative analysis of radiation shielding performance of control, Mix 1, and Mix 2 concrete specimens under Cesium-137 and Cobalt-60 gamma radiation.
Figure 9.
Comparative analysis of radiation shielding performance of control, Mix 1, and Mix 2 concrete specimens under Cesium-137 and Cobalt-60 gamma radiation.
According to the literature, the control mix made with conventional aggregates provides all the necessary structural properties; however, it shows low radiation attenuation capability, offering only 54% shielding efficiency against gamma radiation. The corresponding half-value layers derived from the measured coefficients equal 8.38 cm against Cs-137 and 8.64 cm against Co-60. Research also indicates that a total concrete thickness of about 50.8 cm is required for the control mix to block 99% of gamma radiation [
3,
21,
44,
45].
In comparison, Mix 1, which incorporates 50% magnetite and 25% dolomite as partial coarse aggregate replacements, shows a substantial improvement with 78.78% attenuation against Cesium-137 and 76.85% against Cobalt-60. The corresponding half-value layers derived from the measured coefficients equal 1.79 in against Cs-137 and 1.89 in against Co-60. This research indicates that a thickness of about 300 mm is required for Mix 1 to block 99% of gamma radiation which is 26% less than control mix.
Mix 2, formulated with 25% magnetite and 50% dolomite, also delivers enhanced performance relative to the control mix, achieving 77.65% attenuation for Cesium-137 and 74.68% for Cobalt-60. The corresponding half-value layers derived from the measured coefficients equal 1.85 in against Cs-137 and 2.019 in against Co-60.
Mix 1 reduces required wall thickness by 41% compared to conventional concrete for 99% gamma attenuation, from 508 mm to 300 mm., representing a 41% decrease in concrete material requirements. The shielding potential of mixing high-density aggregates in different proportions is demonstrated by Mix 2, which performs noticeably better than the control mix despite being marginally less effective than Mix 1. This comparison emphasizes how important aggregate proportioning and selection are to concrete optimization for radiation shielding applications, especially for nuclear infrastructure.




 ,
,