Article

Corrosion Behavior of HVAF-Sprayed WC-10Co-4Cr Coatings in H2SO4 and HNO3 Environments

1
Key Laboratory of Materials and Surface Technology (Ministry of Education), School of Materials Science and Engineering, Xihua University, Chengdu 610039, China
2
School of Mechanical Engineering, Chengdu University, Chengdu 610106, China
*
Authors to whom correspondence should be addressed.
Materials 2026, 19(11), 2343; https://doi.org/10.3390/ma19112343
Submission received: 18 April 2026 / Revised: 11 May 2026 / Accepted: 16 May 2026 / Published: 1 June 2026
(This article belongs to the Section Corrosion)

Abstract

Three WC-10Co-4Cr coatings with different WC grain sizes were prepared by high-velocity air-fuel (HVAF) spraying. The corrosion behaviors were systematically evaluated in 0.2 mol/L H2SO4 and 0.4 mol/L HNO3 solutions through immersion tests and electrochemical measurements. The results reveal that WC grain size governs coating microstructural integrity, mechanical properties, and corrosion resistance. Among the three coatings, the medium-grained (MG) coating exhibits an optimized balance between compact microstructure, high microhardness, superior fracture toughness, and the best corrosion resistance in both acidic environments. The coarse-grained (CG) coating exhibits the worst corrosion resistance owing to its wide grain boundaries and high porosity, while the fine-grained (FG) coating is similarly compromised by slightly higher porosity and residual stress-induced microcrack networks that facilitate electrolyte penetration. The corrosion proceeds via preferential dissolution of Co in the CoCr binder phase driven by micro-galvanic coupling with WC, followed by WC particle detachment and pit formation. In a 0.4 mol/L HNO3 solution, the strong oxidizing nature accelerates both binder dissolution and direct WC oxidation.

1. Introduction

Tungsten carbide (WC)-based cermet coatings, particularly in the WC-Co and WC-Co-Cr systems, are among the most important protective coatings in surface engineering. This is primarily because the combination of a hard WC phase and a ductile metallic binder phase (e.g., Co or CoCr) provides an exceptional balance of high hardness, outstanding wear resistance, and favorable corrosion resistance. Consequently, they have been extensively applied in marine engineering, petrochemical sectors, energy equipment, and aerospace applications [1,2]. In recent years, high-velocity air-fuel (HVAF) spraying has garnered escalating attention as a competitive alternative for depositing WC-based hard coatings. Compared with conventional high-velocity oxygen-fuel (HVOF) spraying, HVAF utilizes lower-cost, higher-pressure compressed air as the combustion-supporting agent, thereby drastically reducing the processing cost. Concurrently, the lower flame temperature and oxygen-lean atmosphere inherent in HVAF spraying effectively suppress the decarburization and oxidation of WC, thus mitigating the porosity of the as-deposited coatings [3,4,5,6]. Consequently, HVAF-sprayed coatings generally exhibit superior wear and corrosion resistance, positioning HVAF as a promising technique for fabricating high-performance cemented carbide coatings [7]. For example, Owoseni et al. [8] recently revealed that HVAF-sprayed WC-CoCr coatings on aluminum alloy achieved a specific wear rate as low as 1.7 × 10⁻⁸ mm3/Nm, markedly superior to that of HVOF coatings (16.7 × 10⁻⁸ mm3/Nm). Lakshmi et al. have further substantiated the advantages of the HVAF process. Thin WC-10Co-4Cr coatings (≈100 µm) deposited by HVAF exhibit approximately 2–4 times higher corrosion resistance than conventional thick coatings (≈300 µm), and carbide size significantly influences the corrosion rate [9]. These results confirm the technological advantages of HVAF for fabricating high-performance WC-based coatings.
In contrast to conventional WC–Co cermet systems, WC–Co–Cr coatings have garnered widespread research attention due to their superior synergy of mechanical properties and corrosion resistance [10,11]. Prior investigations have validated the corrosion-enhancing effect of Cr addition: corrosion tests on WC–6Co, WC–11Co, and WC–16.5Co cermet coatings in sulfuric acid and simulated seawater environments revealed that Cr-modified WC–Co coatings possess markedly enhanced corrosion resistance relative to their Cr-free counterparts [2,12]. Further studies focusing on the corrosion behavior of WC–Co-based coatings under diverse pH conditions similarly demonstrated that Cr-free WC–Co coatings exhibit significantly higher corrosion rates than Cr-containing coatings [13,14,15]. Additionally, Zhou et al. [16,17,18] deposited WC–Co and WC–Co–Cr coatings onto 45 steel substrates and explored their corrosion mechanisms via electrochemical characterization, and the corresponding results indicated that the WC–Co–Cr coating possessed the maximum charge transfer resistance, confirming that Cr addition substantially boosts the coating’s corrosion resistance. This notable improvement is primarily ascribed to the formation of a CoCr alloy binder phase (via partial Cr dissolution), which exhibits far superior corrosion resistance compared to the pure Co binder phase [14,19]. Recently, Wang et al. [20] compared the tribocorrosion behaviors of WC-10Co-4Cr, WC-20Cr3C2-7Ni, and Cr3C2-25NiCr cermet coatings fabricated by HVAF thermal spraying and demonstrated that HVAF-sprayed WC-10Co-4Cr coatings exhibit the best tribocorrosion resistance owing to the higher hardness of WC and more uniform phase distribution. They also presented that a higher concentration of Cr in the coatings facilitates the development of a comprehensive and continuous Cr2O3 protective film, which exhibits enhanced shear properties, delivering more effective interfacial lubrication and thereby substantially reducing the friction coefficient. By introducing the Cr element in the form of Cr2(C,N) into the WC-Co cemented carbide system, He et al. [21] found that the tendency for preferential corrosion induced by Co pools can be effectively mitigated. The Cr element is oxidized during polarization to form a dense Cr2O3 passive film that acts together with other corrosion products to resist attack by the corrosive medium, thereby significantly enhancing the corrosion resistance. These results offer a deeper understanding of the Cr modification mechanism.
In general, grain refinement increases the total interfacial area and promotes the formation of galvanic couples at the material surface. Both factors are theoretically expected to compromise the corrosion resistance of metallic/ceramic composite systems. However, the limited published literature regarding the effect of WC grain size on the corrosion behavior of WC-Co cemented carbide presents inconsistent and inconclusive findings. Tomlinson et al. [22] reported that passive current density increased with grain size in acidic media. Su et al. further found that by introducing Cu and Ni into ultra-coarse grain WC-8Co cemented carbides to modify the binder phase, the corrosion resistance in acidic solution could be significantly enhanced [23]. In NaOH solution, Kellner et al. [24] observed that the corrosion resistance of WC–Co hardmetals increases with decreasing grain size. They indicated that the effect of grain size, which contributes to fcc Co phase stabilization, plays a dominant role in the corrosion behavior. Smaller grain WC–Co hardmetals are enriched in W and C in the Co binder, which leads to a higher amount of fcc Co in the binder, resulting in lower current densities upon polarization. Recently, Zhang et al. [25] observed a similar trend that the corrosion resistance of cemented carbides decreases with increasing WC grain size, with grain boundaries acting as preferential corrosion attack sites. However, Human et al. [26,27] observed that grain size had a negligible effect on the corrosion behavior of WC-based hardmetals in acidic solutions.
Although these recent studies have advanced our understanding, they have mostly focused on bulk cemented carbides prepared by conventional powder metallurgy rather than thermally sprayed coatings. In addition, owing to the substantial discrepancies in the materials and electrolytes across these investigations, a definitive interpretation of the underlying corrosion mechanisms of WC-10Co-4Cr coatings remains unelucidated at this stage. The effects of WC grain sizes on corrosion of WC-10Co-4Cr coatings, particularly in acidic media, remain unclear. This strongly restricts the wider application of WC-10Co-4Cr coatings.
In order to explore the service properties under typical industrial acidic conditions, WC-10Co-4Cr coatings with various WC grain sizes are fabricated via HVAF thermal spraying in this work, and their corrosion behaviors are systematically investigated in two distinct aggressive acidic environments: 0.2 mol/L H2SO4 and 0.4 mol/L HNO3. The selection of these two acidic media allows for a comparative analysis of corrosion mechanisms under distinct conditions—H2SO4 primarily induces binder phase dissolution (the dominant failure mode for WC-based coatings in acidic environments), whereas HNO3, as a strong oxidizing acid, promotes the formation of surface passive films such as WO3, enabling an assessment of the interplay between WC grain size and passivation behavior. By systematically correlating WC grain size with electrochemical responses in these two media, this work aims to elucidate the underlying corrosion mechanisms of HVAF-sprayed WC-based coatings and to provide fundamental guidance for the grain size design of high-performance cermet coatings tailored for aggressive acidic environments.

2. Materials and Methods

2.1. Materials and High-Velocity Air Fuel Spraying

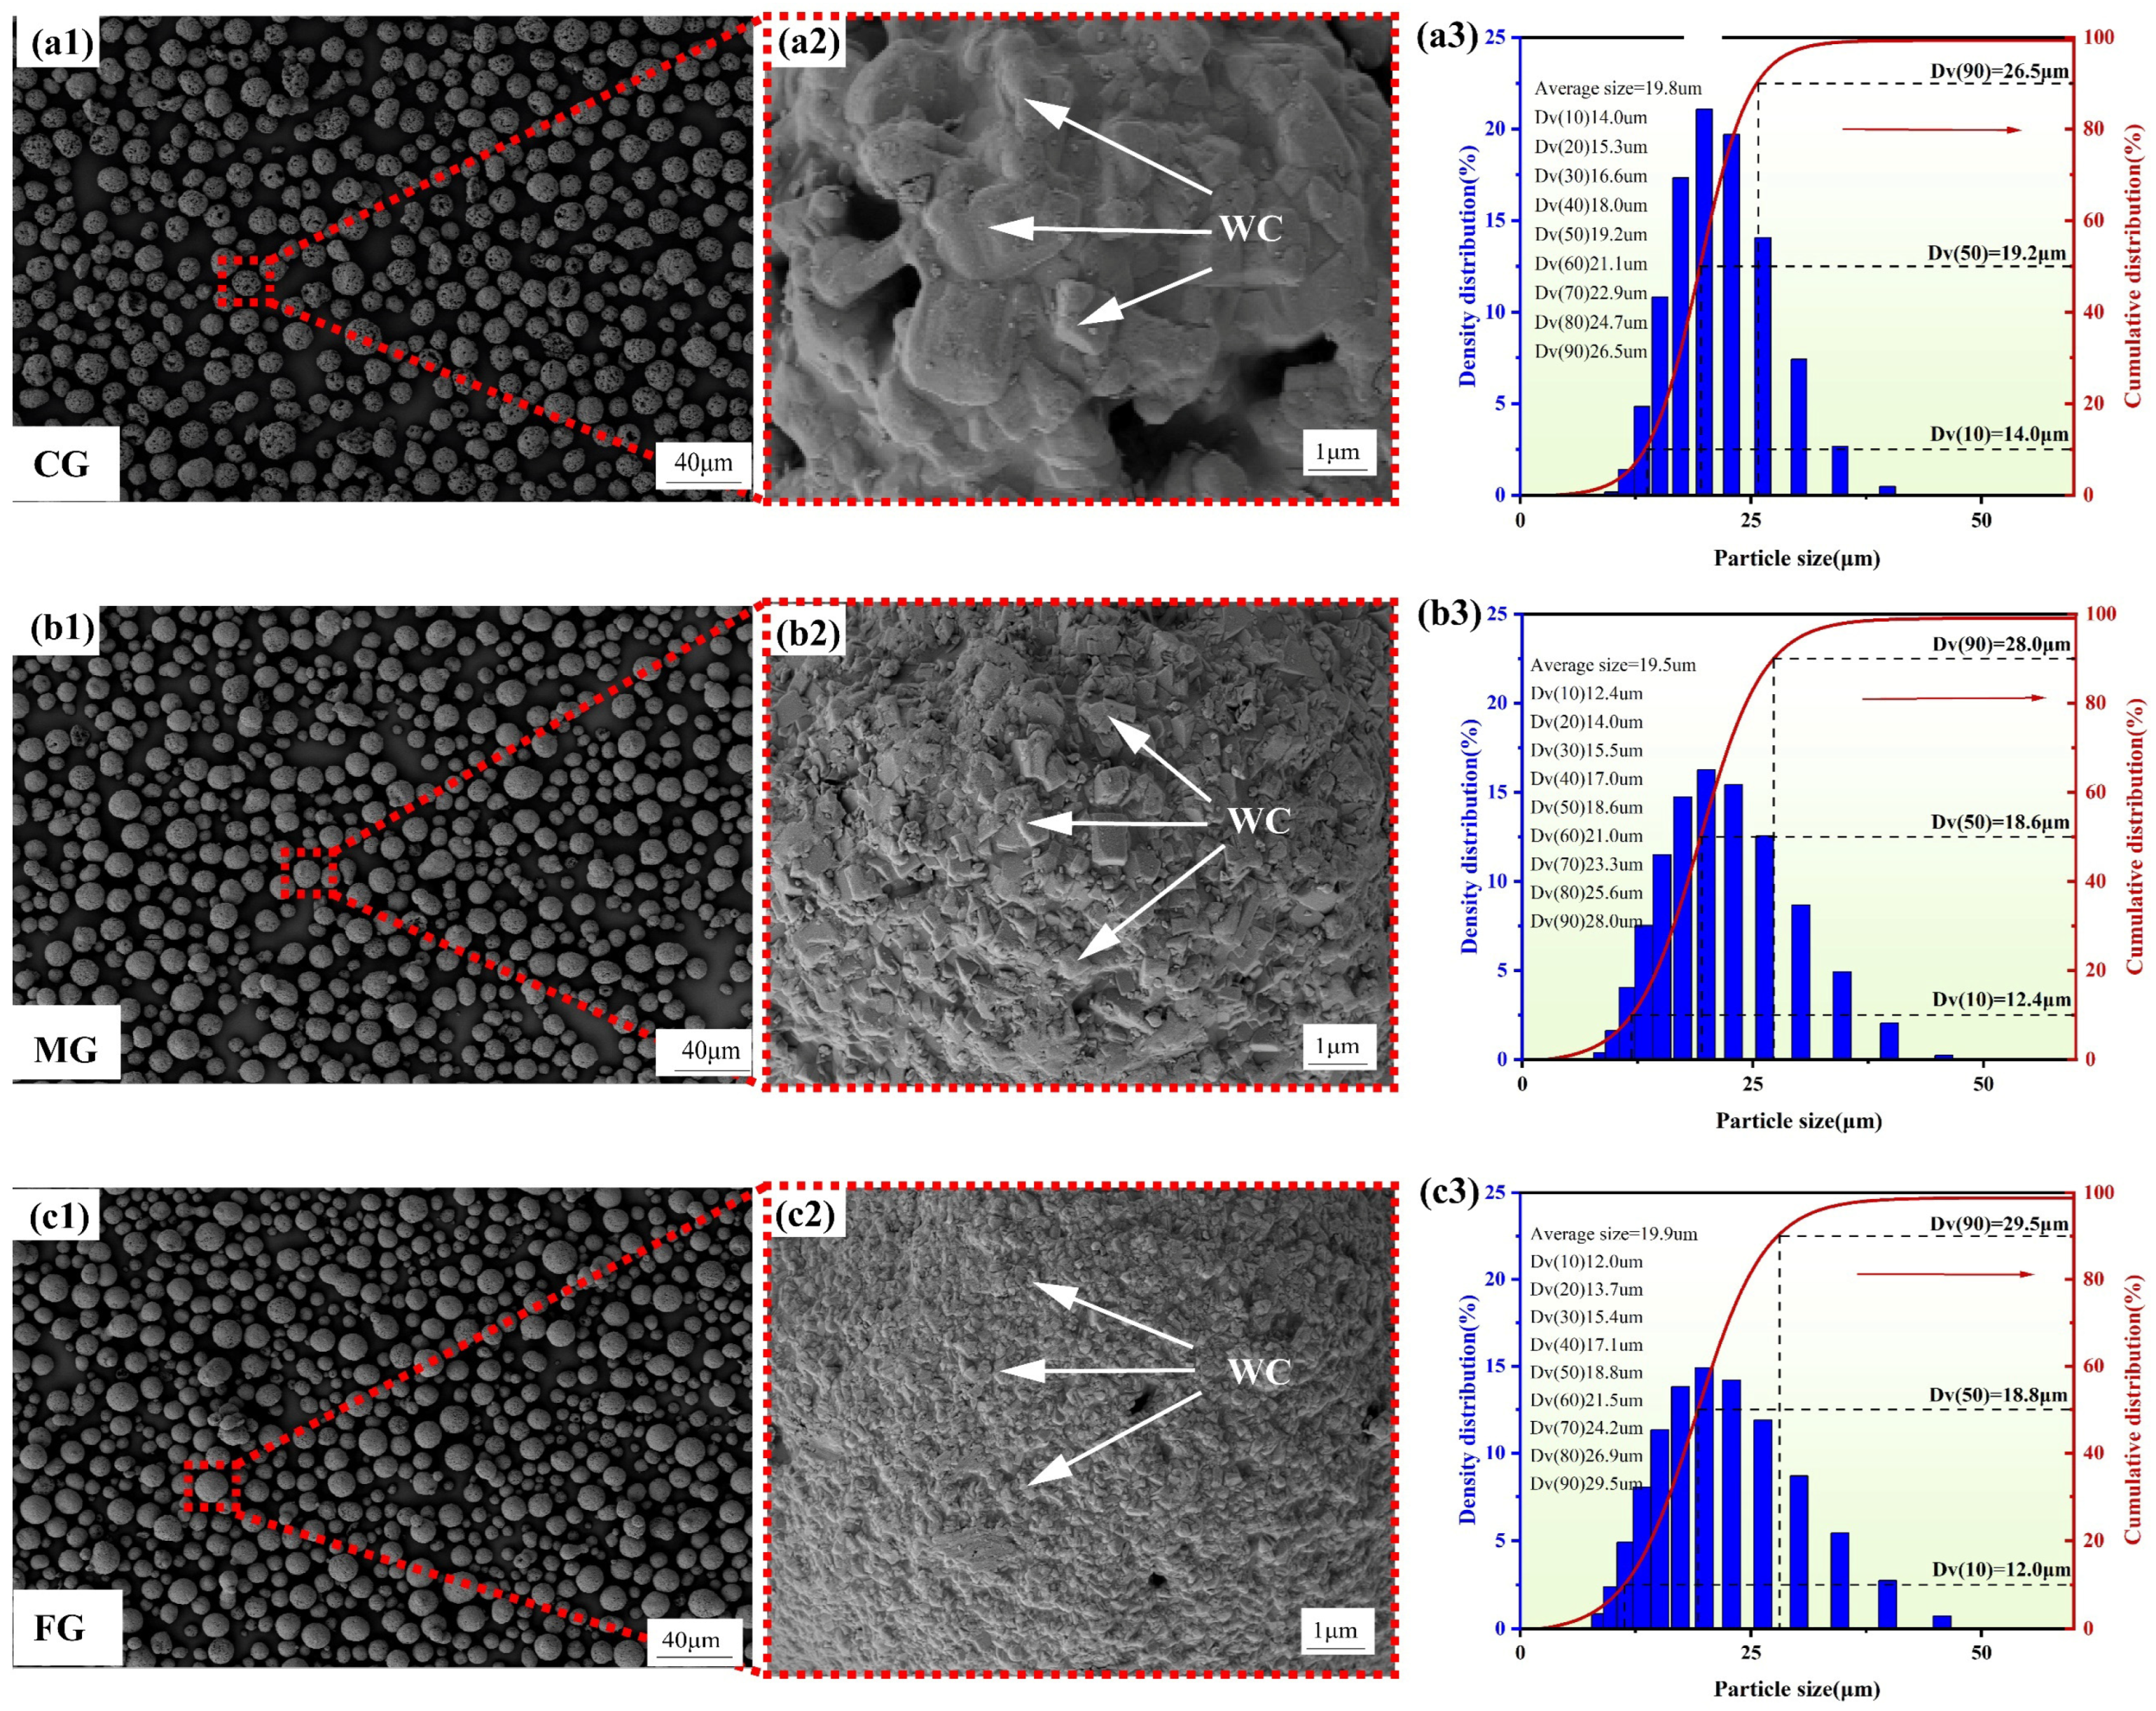
Three types of commercial WC-10Co-4Cr (wt.%) powders with different WC particle sizes, manufactured by Luoyang Jinlu Carbide Tools Co., Ltd. (Luoyang, China), were utilized as HVAF feedstocks. Figure 1 presents the SEM morphology and spherical particle size distribution of the purchased sintered WC-10Co-4Cr powders. In Figure 1(a1–c1), three WC-10Co-4Cr powder types are spherical, and inter-particle agglomeration was not detected. Particularly, the enlarged images in Figure 1(a2–c2) show that the irregularly shaped WC particles are wrapped by the CoCr binder phase. The WC-10Co-4Cr powders with coarse, medium, and fine WC particles are designated as CG, MG, and FG, respectively. Their WC particle size ranges are 1.5–3 µm, 0.5–1.5 µm, and 0.2–0.5 µm, respectively. Overall, the three powder types have similar spherical particle size distribution (see Figure 1(a3–c3)), which is beneficial to excellent flowability during HVAF spray and can largely guarantee the uniform chemical distribution and microstructure of sprayed coatings. A total of 304 stainless steel (304 SS) plates of 15 mm thick (supplied by Taiyuan Iron and Steel Co., Ltd., Taiyuan, China) were employed as the substrate for HVAF spraying. Prior to the spraying procedure, sandblasting was performed using 200–400 mesh Al2O3 abrasive to remove surface oxide scale and roughen the substrate, with the primary objective of enhancing the coating–substrate bond strength.
The WC-10Co-4Cr coatings on 304 SS were prepared using an HVAF spraying system (Model M2, UNIQUECOAT Inc., Oilville, VA, USA). Industrial-grade propane (purity ≥ 99.5%) was used as fuel gas, with dry compressed air serving as the oxidizer, ensuring a controlled flame temperature and minimizing powder oxidation during spraying. Nitrogen was employed as an inert protective gas as well as a transmission medium of spraying powder from the feeder to the spray gun. The optimized HVAF spraying parameters are listed in Table 1.

2.2. Characterization

To examine the microstructure and chemical composition of the coating specimen prepared by HVAF, the sample was sectioned into small cubes with dimensions of 10 mm × 10 mm × 5 mm using wire electrical discharge machining. Subsequently, the samples were ground with diamond abrasive papers in the order of 120, 300, 600, 1200, and 2000 grits, followed by polishing with 1.5 μm diamond paste. After that, the sample surfaces were ultrasonically cleaned in anhydrous ethanol using an ultrasonic cleaner (JP-010T, Shenzhen Jiemeng Cleaning Equipment Co., Ltd., Shenzhen, China) and dried with a hair dryer. The coating microstructure was examined using a scanning electron microscope (SEM, S-360, ZEISS, Oberkochen, Germany), with elemental composition analyzed by an energy-dispersive X-ray spectrometer (EDS, Ultim Max, Oxford, UK). Phase composition was determined by X-ray diffraction (XRD, DX-2700BH, Dandong, China). Further, electron backscatter diffraction (EBSD, detector Symmetry S3 equipped on SEM) with a step size setting of 0.06 μm was used to characterize the grain and phase structures of coatings.
The density of the coatings was measured using a balance (BS224S, Sartorius, Beijing, China) with a sensitivity of 0.0001 g, following the Archimedean method at room temperature (23 °C).
The hardness of the coatings was measured using a Vickers hardness tester (HV-30, Laizhou Huaze Testing Instrument Co., Ltd., Laizhou, China) under a load of 30 kgf. The indentation fracture toughness KIC) of the cermet materials was calculated using the Vickers hardness according to Equation (1) [28].
The bond strength between the coating and the substrate was measured using a universal testing machine (WDW-50, Jinan Shijin Group Co., Ltd., Jinan, China), and the test procedure was carried out in accordance with the GB/T 8642-2025 [29] standard.
K I C = 0.15 H V 30 / i = 1 4 L i
here, H V 30 represents the measured Vickers hardness (N/mm2), and L i is the length from the crack tip to the indentation (mm).

2.3. Corrosion Experiments

The corrosion behaviors of WC-10Co-4Cr coatings in 0.2 mol/L H2SO4 and 0.4 mol/L HNO3 solutions were evaluated. First, immersion tests were conducted. Before immersion, the samples were cleaned with ethanol and distilled water and then dried. The samples were then sealed with epoxy resin, and only the coated surfaces were exposed to corrosive solutions. Then, the initial weight of each sample was determined using an electronic balance with a precision of 0.1 mg and recorded as G1. Each sample was placed in a beaker with the coated surface facing upwards before adding corrosive solution. The beakers were then placed in a water bath with the temperature maintained at 35 ± 2 °C. Specimens were retrieved at 0.5, 1, 3, 4, 5, 7, and 10 days of immersion. The corrosive solutions were replaced every 12 h. After immersion, the samples were rinsed with deionized water, ultrasonically cleaned (in ethanol, 10 min) to eliminate corrosion products, dried, and weighed. The weight measured after the immersion test was recorded as G2. The mass loss W (mg) due to corrosion was thus calculated using Equation (2) [16]. Thus, the corrosion rate Cr (mm·y−1) can be calculated according to the classical weight-loss equation as follows [16]:
W = G 1 G 2
C r = 87.6 W ρ A t
where W is the mass loss (mg), ρ is the coating density (g·cm−3), A is the exposed surface area (cm2), and t is the immersion time (h). Each test was repeated five times, and the average value was reported.
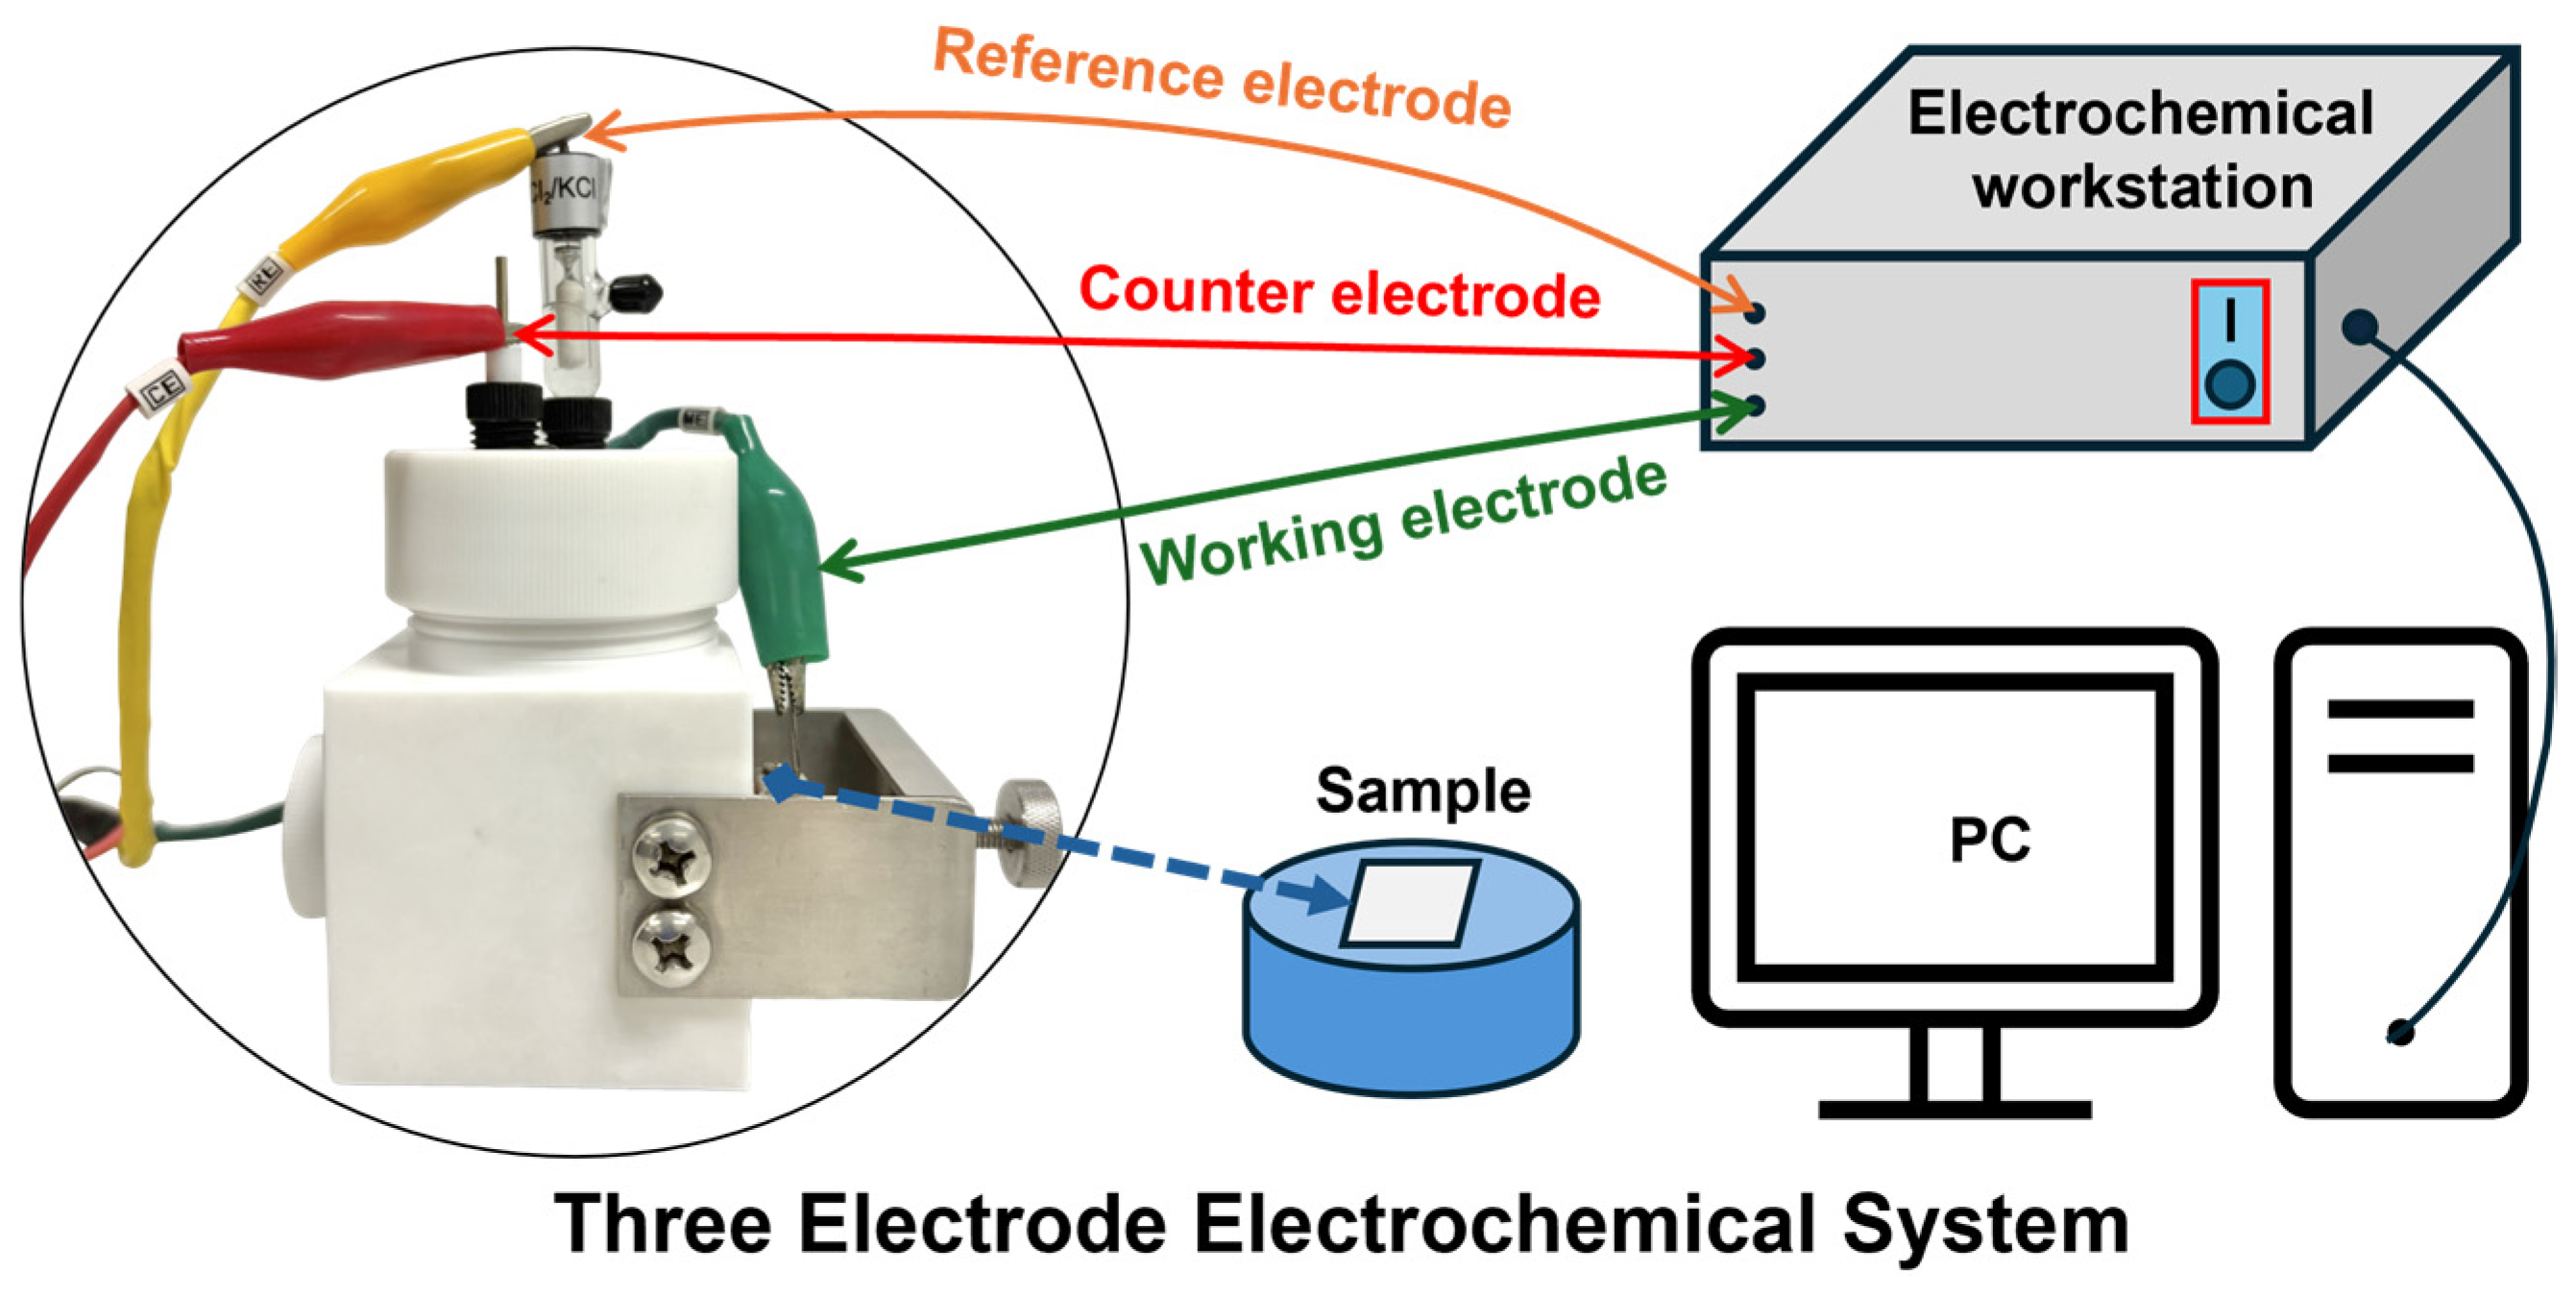
The electrochemical corrosion behaviors of WC-10Co-4Cr coatings were investigated using an electrochemical workstation (CS2350H, Wuhan KST Instruments Co., Wuhan, China). The schematic diagram of the electrochemical test setup is shown in Figure 2.
Prior to the experiment, the samples were sealed with epoxy resin, leaving the top surface (coating) exposed to the solution. The sample was then mounted to the three-electrode electrochemical cell with an exposure area of 1 cm2. The coating serves as the working electrode (WE), platinum as the counter electrode (CE), and a saturated calomel electrode (SCE) as the reference electrode (RE). They were tested in 0.2 mol/L H2SO4 and 0.4 mol/L HNO3 electrolyte solutions, respectively. All tests were conducted at a room temperature of about 25 °C. Initially, the open-circuit potential (OCP) of the sample was tested after 1 h immersion in the medium. Then, electrochemical impedance spectroscopy (EIS) measurements were performed. The frequency range for EIS was set from 105 Hz to 10−2 Hz. Subsequently, the kinetic potentiodynamic polarization (PDP) tests were carried out at a scan rate of 1 mV/s, covering a scan range from 0.5 V to +1.5 V (vs. OCP). After tests, the impedance data were analyzed and fitted using ZSimpWin 3.60 software. Tafel extrapolation was used to determine the corrosion current density (Icorr) based on the linear region of the polarization curves.
The surface corrosion morphologies of the samples and the chemical composition of corrosion products after immersion and electrochemical corrosion tests were observed using SEM and EDS, respectively. The depth of corrosion pits and surface roughness were measured using an optical profiler (OP, Bruker Contour GT-K 3D, Ettlingen, Germany). X-ray photoelectron spectroscopy (XPS, Thermo Scientific K-Alpha, Waltham, MA, USA) was used to analyze the elemental information in the corrosion products.

3. Result and Discussion

3.1. Microstructure and Properties of Coatings

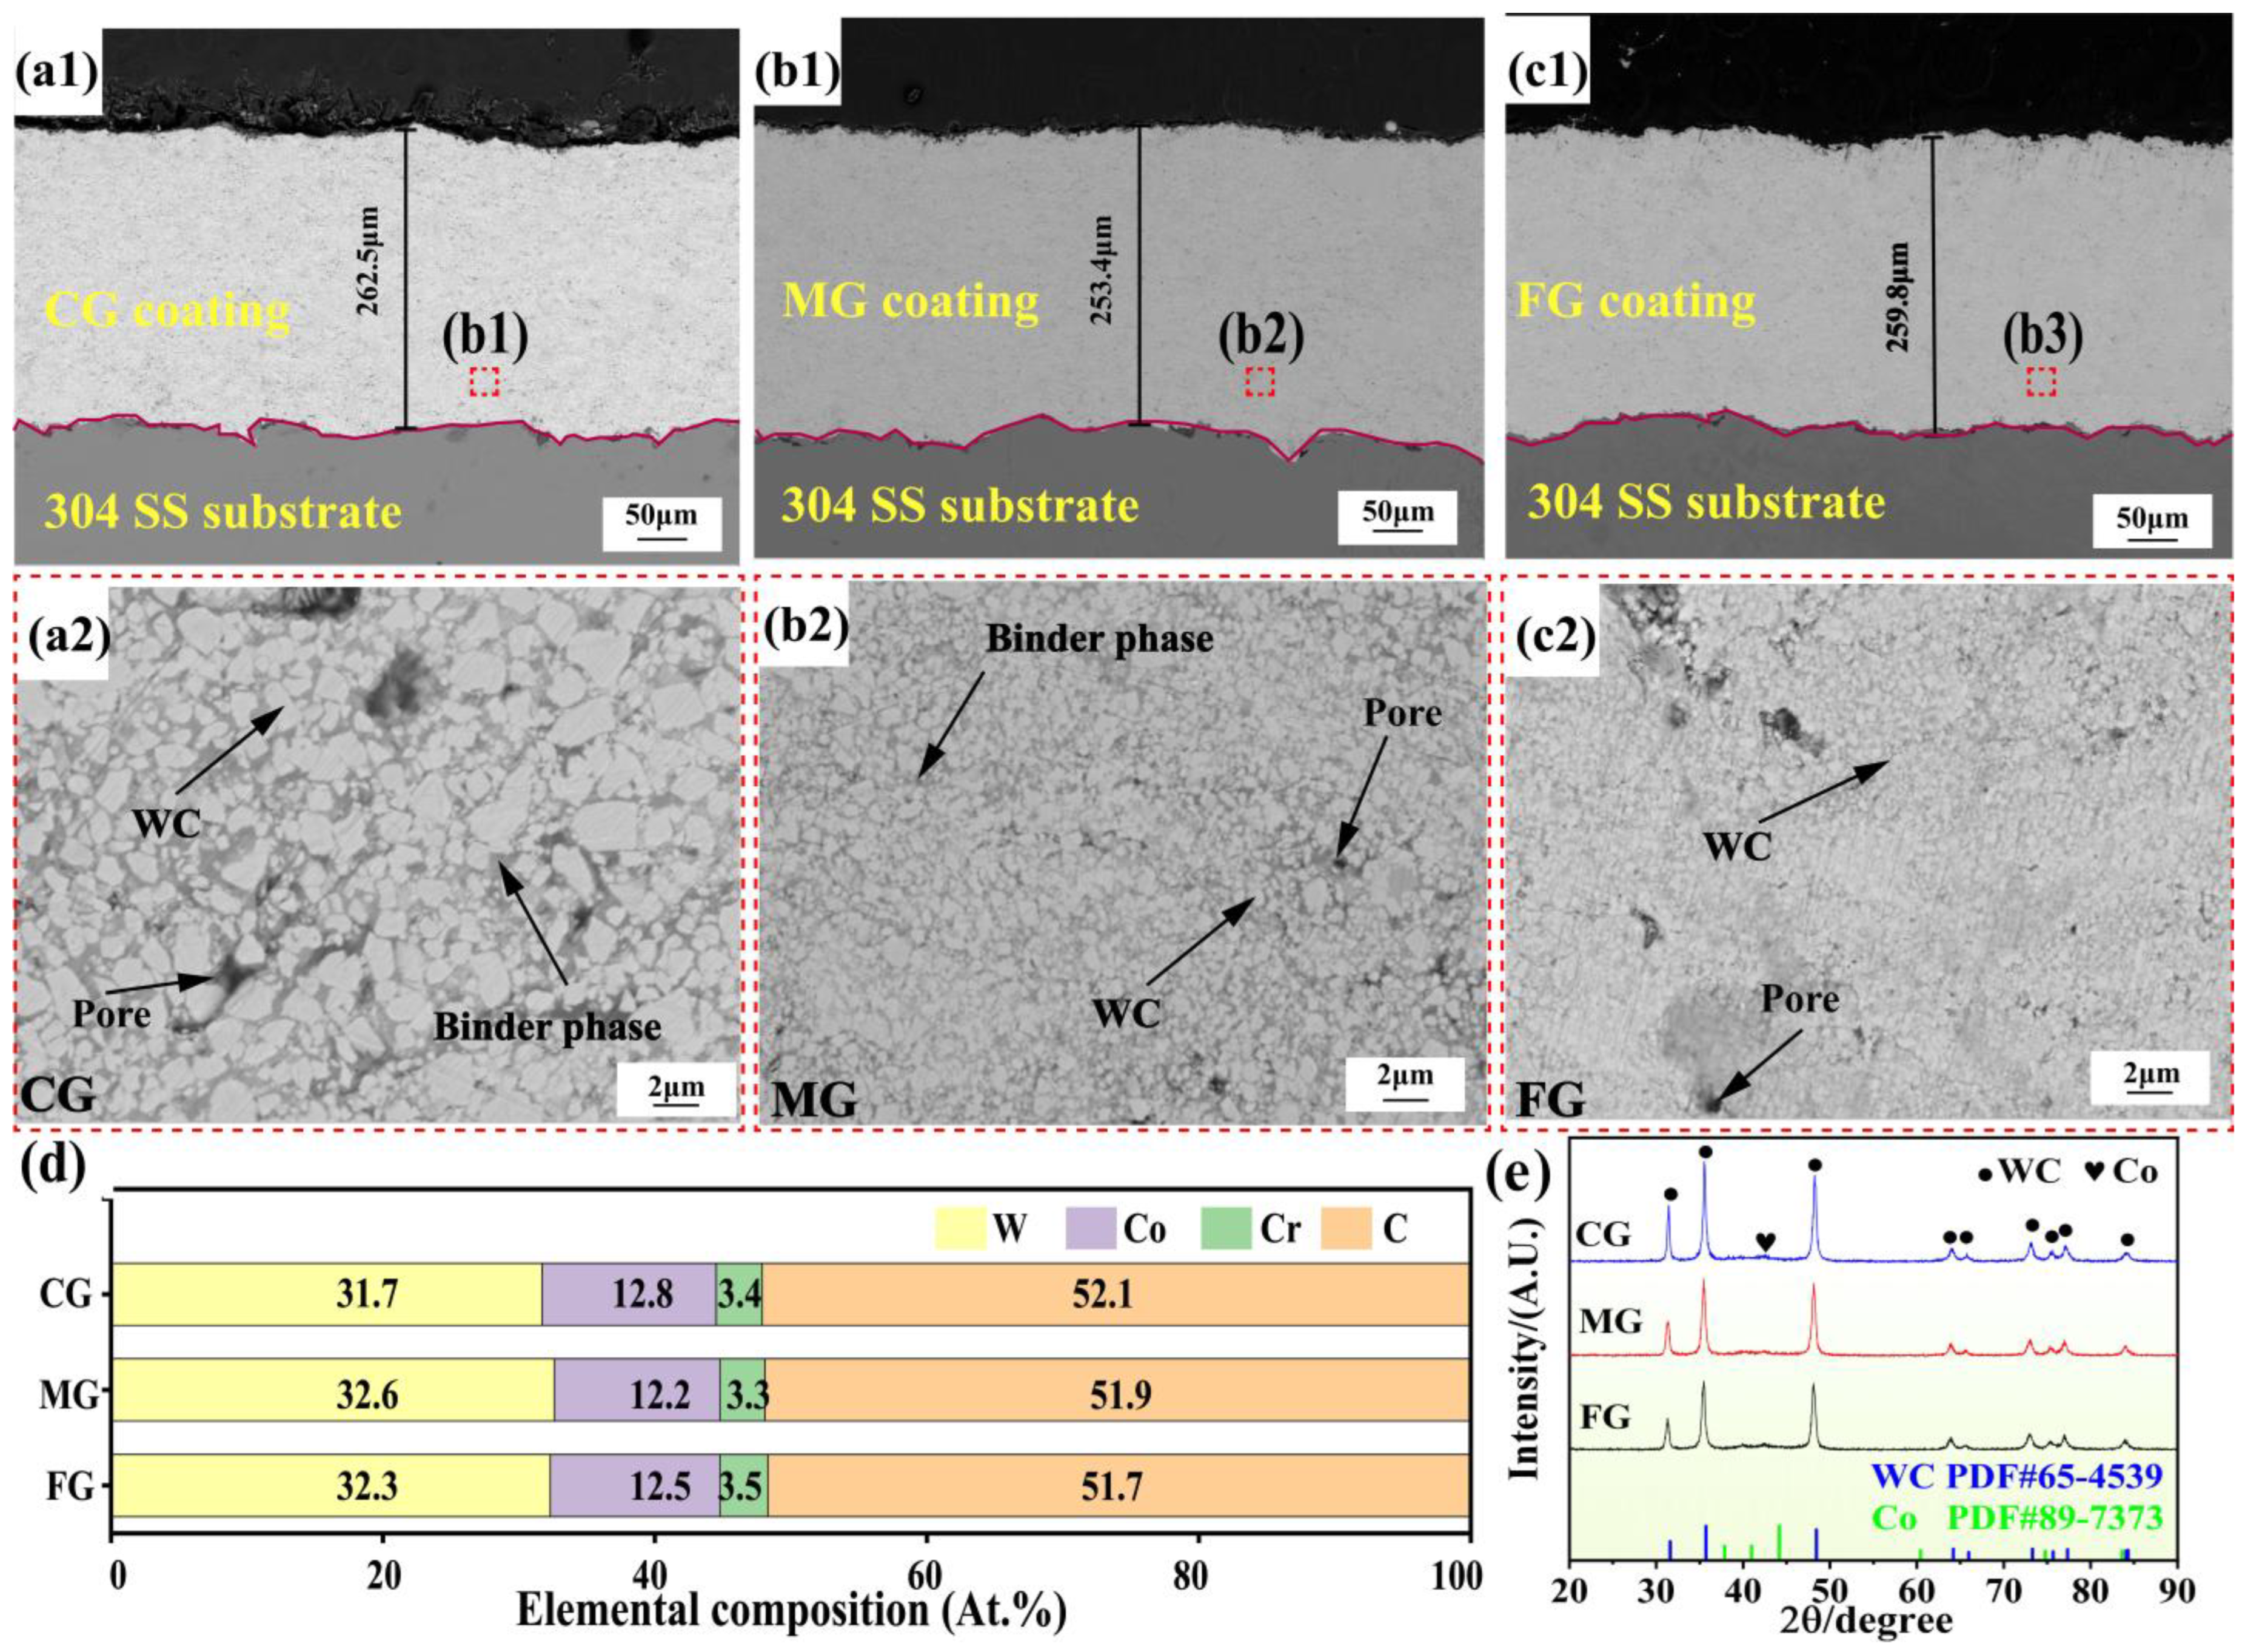
The cross-sectional SEM morphologies of CG, MG, and FG WC-10Co-4Cr coatings sprayed on 304 SS substrates are shown in Figure 3(a1–c2). The 304 SS substrate surfaces exhibit a rough and uneven topography due to sandblasting pre-treatment. A distinct interface between the coating and the substrate is evident, indicating that the bonding between them is primarily mechanical in nature, with no detectable elemental diffusion. The three coatings exhibit comparable thicknesses, ranging from 253.4 µm (MG) to 262.5 µm (CG). It is worth noting that although Cr is not presented in the XRD patterns due to the inherent detection limits of the technique, its presence is detected in the EDS analysis. Combining the results of EDS analysis (Figure 3d) and XRD analysis (Figure 3e), it can be concluded that the hexagonal crystal WC hard phase is dominant in the coatings, and the light-colored WC hard phase is uniformly dispersed within the gray CoCr binder phase, with no significant phase segregation (as shown in the higher magnification micrographs in Figure 3(a2–c2)). Among the three coatings, the MG coating comparatively displays a more uniform binder phase distribution with lower pore density compared to the other two coatings. The formation of pores is likely affected by the particle size of WC. Fine WC particles tend to agglomerate and possess insufficient kinetic energy for complete plastic deformation upon impact, leaving unfilled inter-particle voids, while coarse particles suffer from incomplete wetting by the CoCr binder phase during solidification, generating micropores at the WC/CoCr interface. Overall, all three coatings in this study can be considered dense and compact with occasional porosity preferentially located at the WC/CoCr binder phase interface.
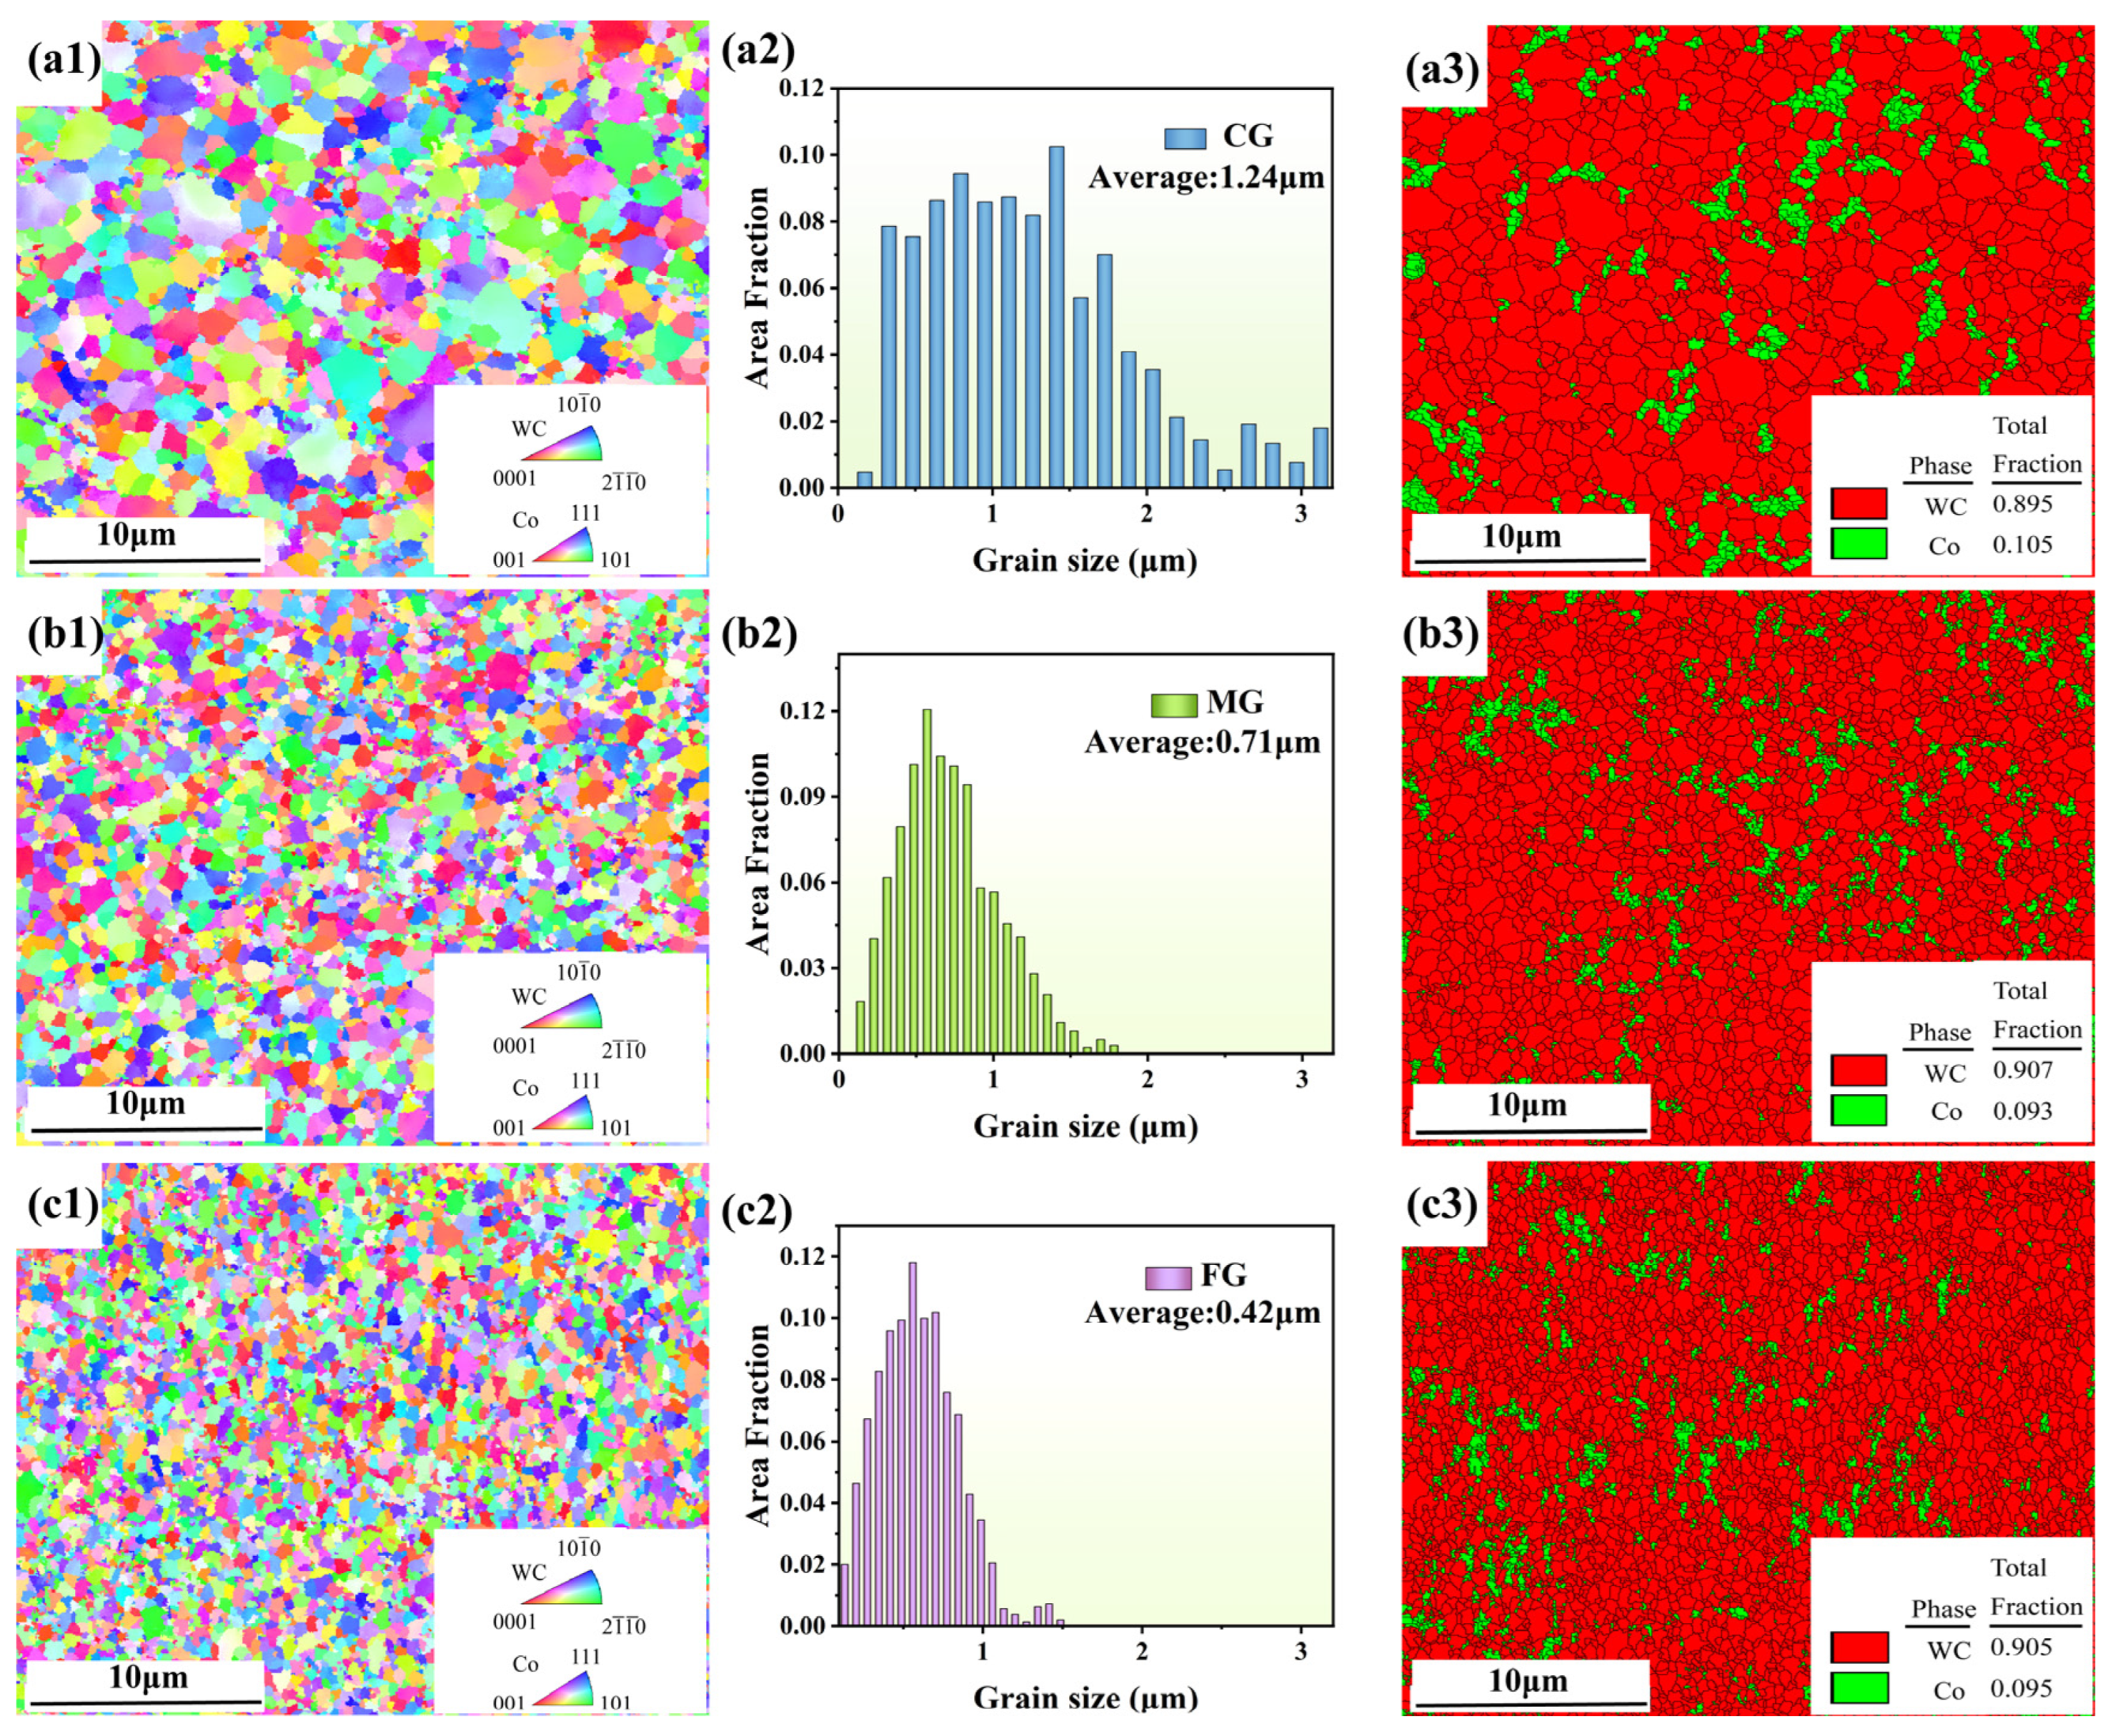
Figure 4 is the EBSD characterization results of the three coatings. The WC grains in all three coatings exhibit random crystallographic orientations. The grain sizes of the coatings are: CG coating displays a grain size range of 0.32 μm to 1.72 μm, with an average grain size of 1.24 μm; MG coating exhibits a grain size range of 0.39 μm to 0.91 μm, with an average grain size of 0.77 μm; and FG coating possesses the finest and most uniform microstructure, with grain sizes ranging from 0.27 μm to 0.84 μm and a mean grain size of 0.42 μm.
In all three coatings, the phase fractions of WC and CoCr binder phase are similar and generally uniformly distributed. This can be confirmed by the small porosity values shown in Table 2, where the coatings exhibit a low porosity variation. The FG coating shows slightly higher porosity and smaller indentation fracture toughness, but a higher bond strength and an obviously higher hardness than the other two coatings. This indicates that the influence of slight porosity differences on strength is limited. Instead, the Hall–Petch mechanism is dominant, i.e., the hardness of materials increases with decreasing grain size, whereas the fracture toughness decreases with decreasing grain size [30]. The results in this study are consistent with the behavior observed in sintered bulk WC–Co cemented carbides [31]. The bonding strengths of the three coatings show little variation and are all higher than 75 MPa, indicating that all coatings possess good bonding performance.
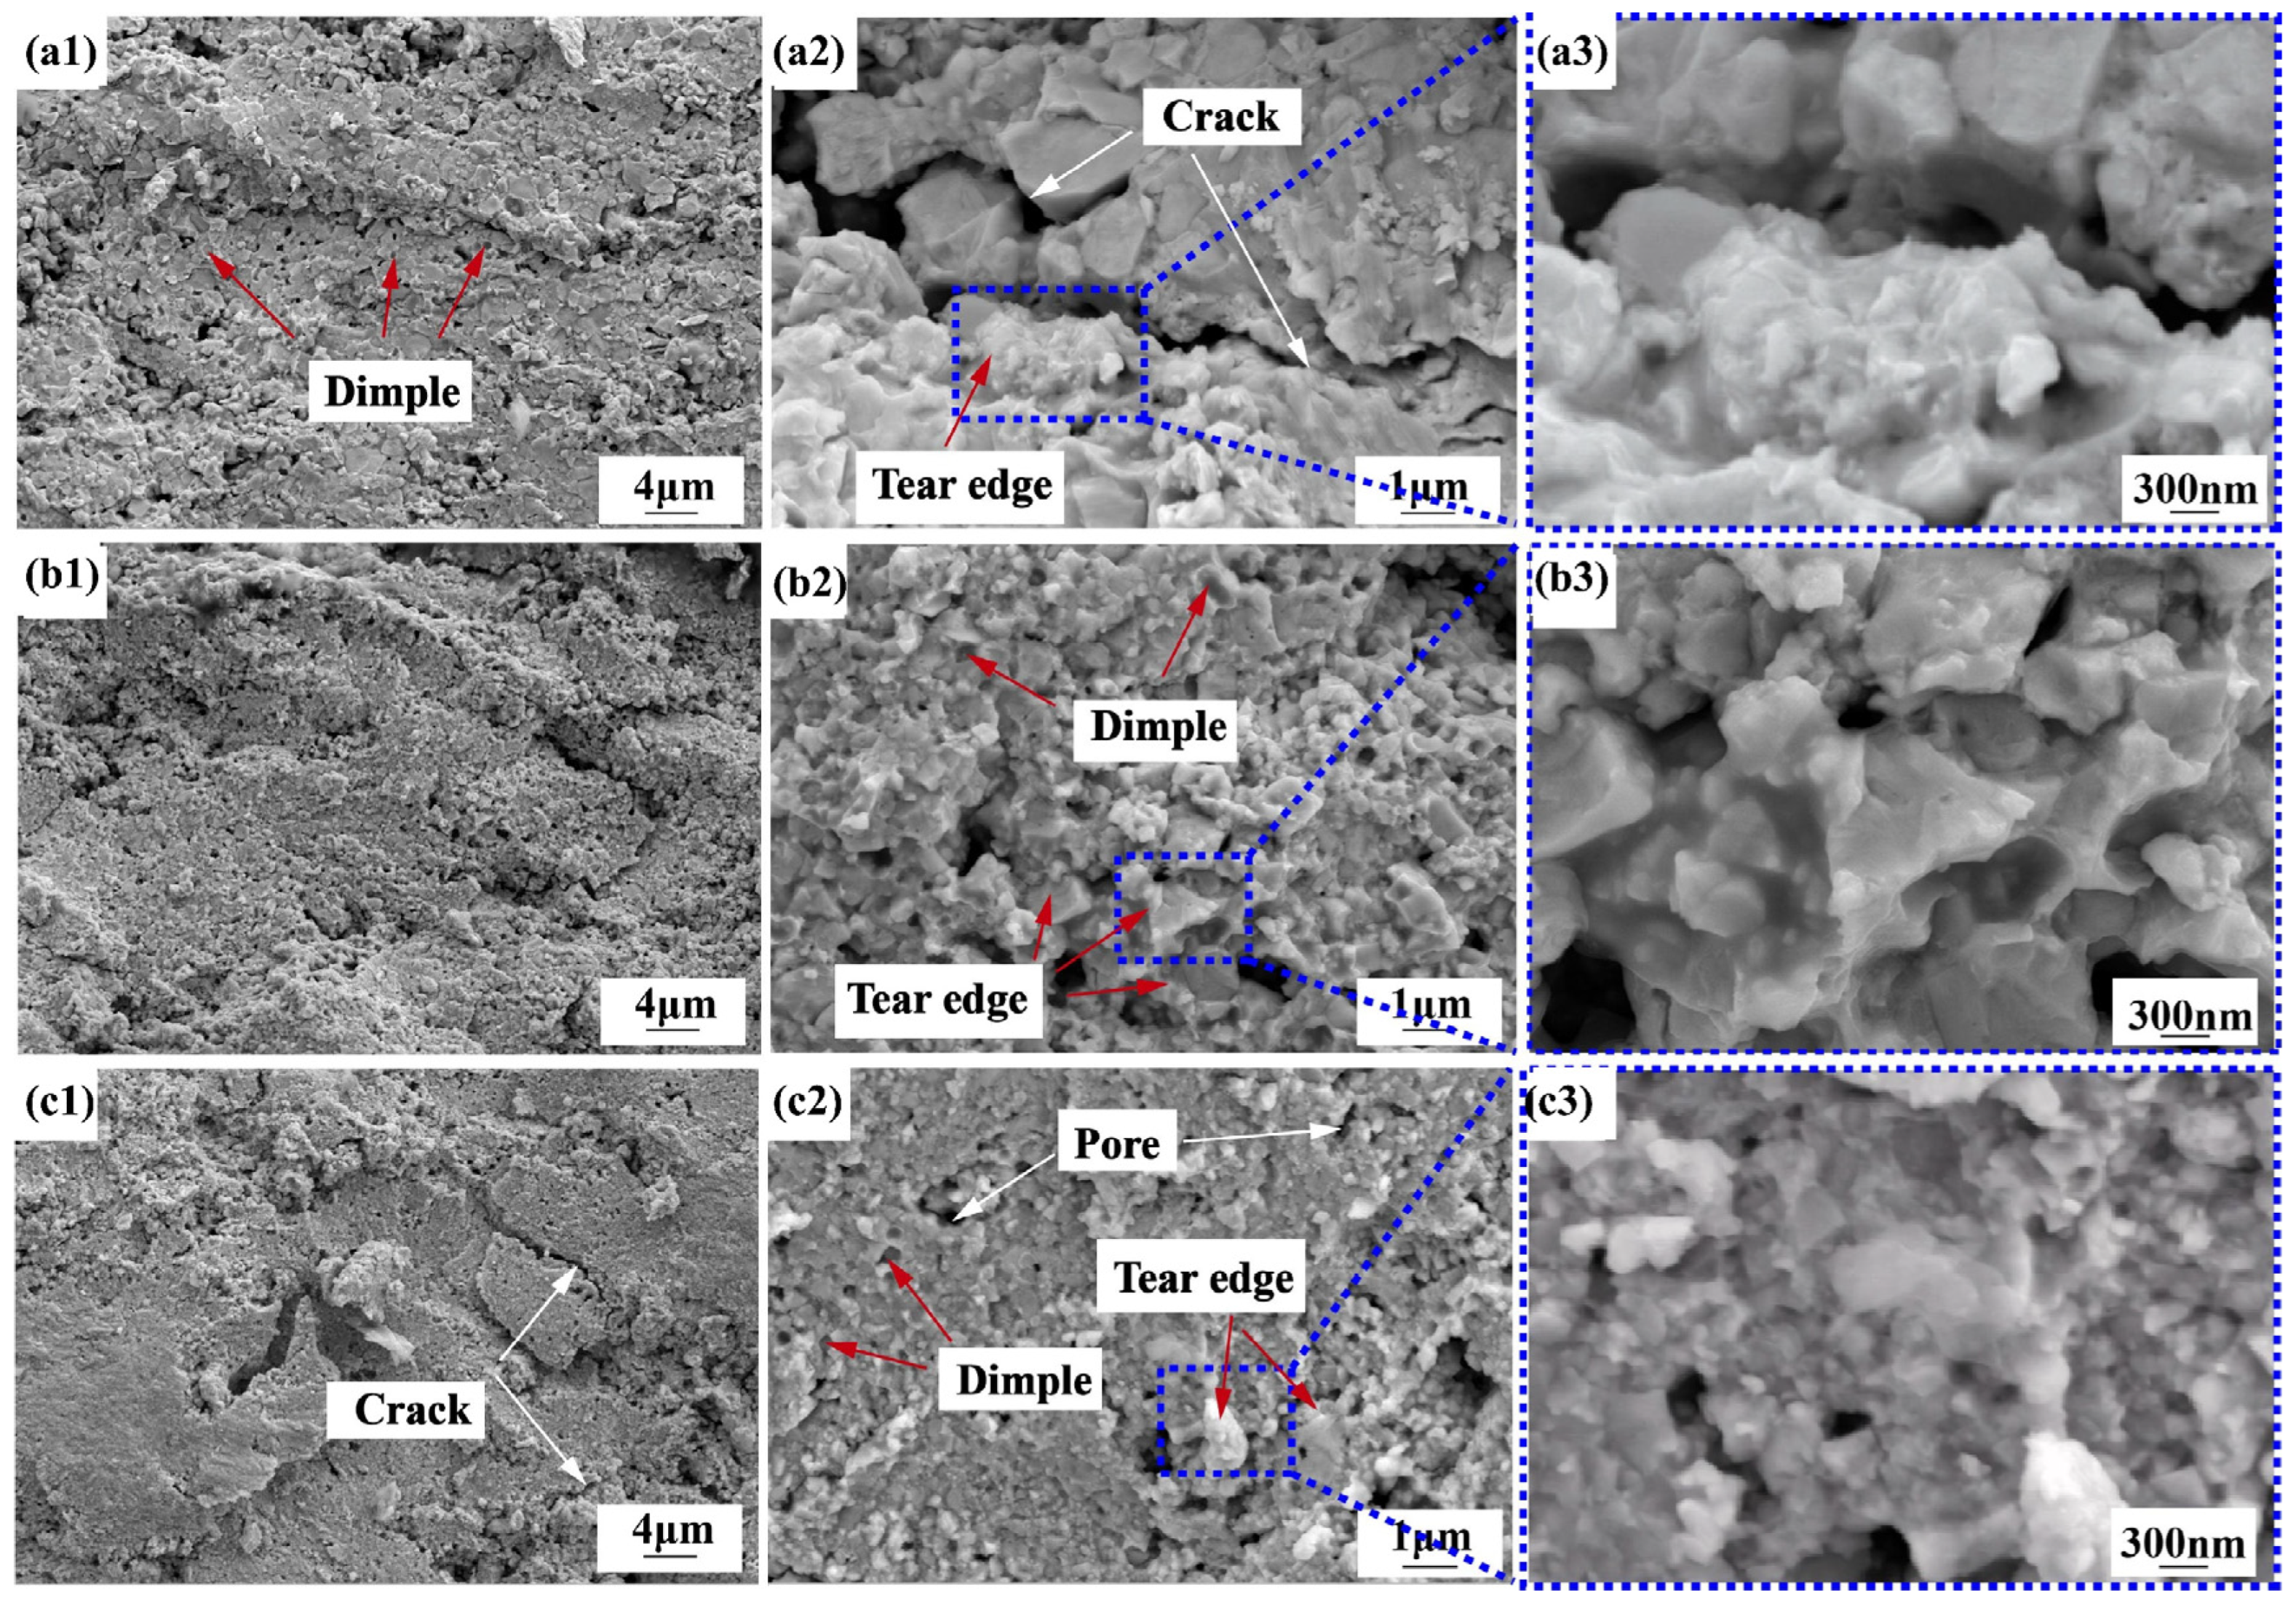
Figure 5 presents the fracture morphologies of WC-10Co-4Cr coatings with different grain sizes. Low-magnification SEM images in Figure 5(a1–c1) reveal that interfacial debonding of WC particles is the dominant failure mode in all three coatings, resulting in the formation of irregular dimples. The CG coating exhibits the highest number of voids and pits, with large and sparse dimples (Figure 5(a1)) originating from the overall debonding of individual WC particles. The relatively weaker interfacial bonding strength associated with coarse grains facilitates rapid crack propagation along the interface, while the low grain boundary density promotes relatively straight crack trajectories, collectively contributing to the large crack observed in this coating. In contrast, the FG coating (Figure 5(c1)) features fine, densely distributed dimples formed by the collective debonding of multiple fine WC particles. The high-grain boundary density compels cracks to deflect or transgranularly propagate, increasing crack path tortuosity and imparting greater resistance to crack propagation. Although grain refinement enhances the plastic deformation capacity of the binder phase, it simultaneously promotes a more heterogeneous binder distribution, with locally depleted regions susceptible to rapid microcrack coalescence—a factor that partially offsets the toughness improvement. The fracture behavior of the MG coating (Figure 5(b1)) is intermediate between that of the CG and FG coatings, characterized by uniformly distributed fine voids in conjunction with a reduced number of shorter cracks.

3.2. Immersion Corrosion

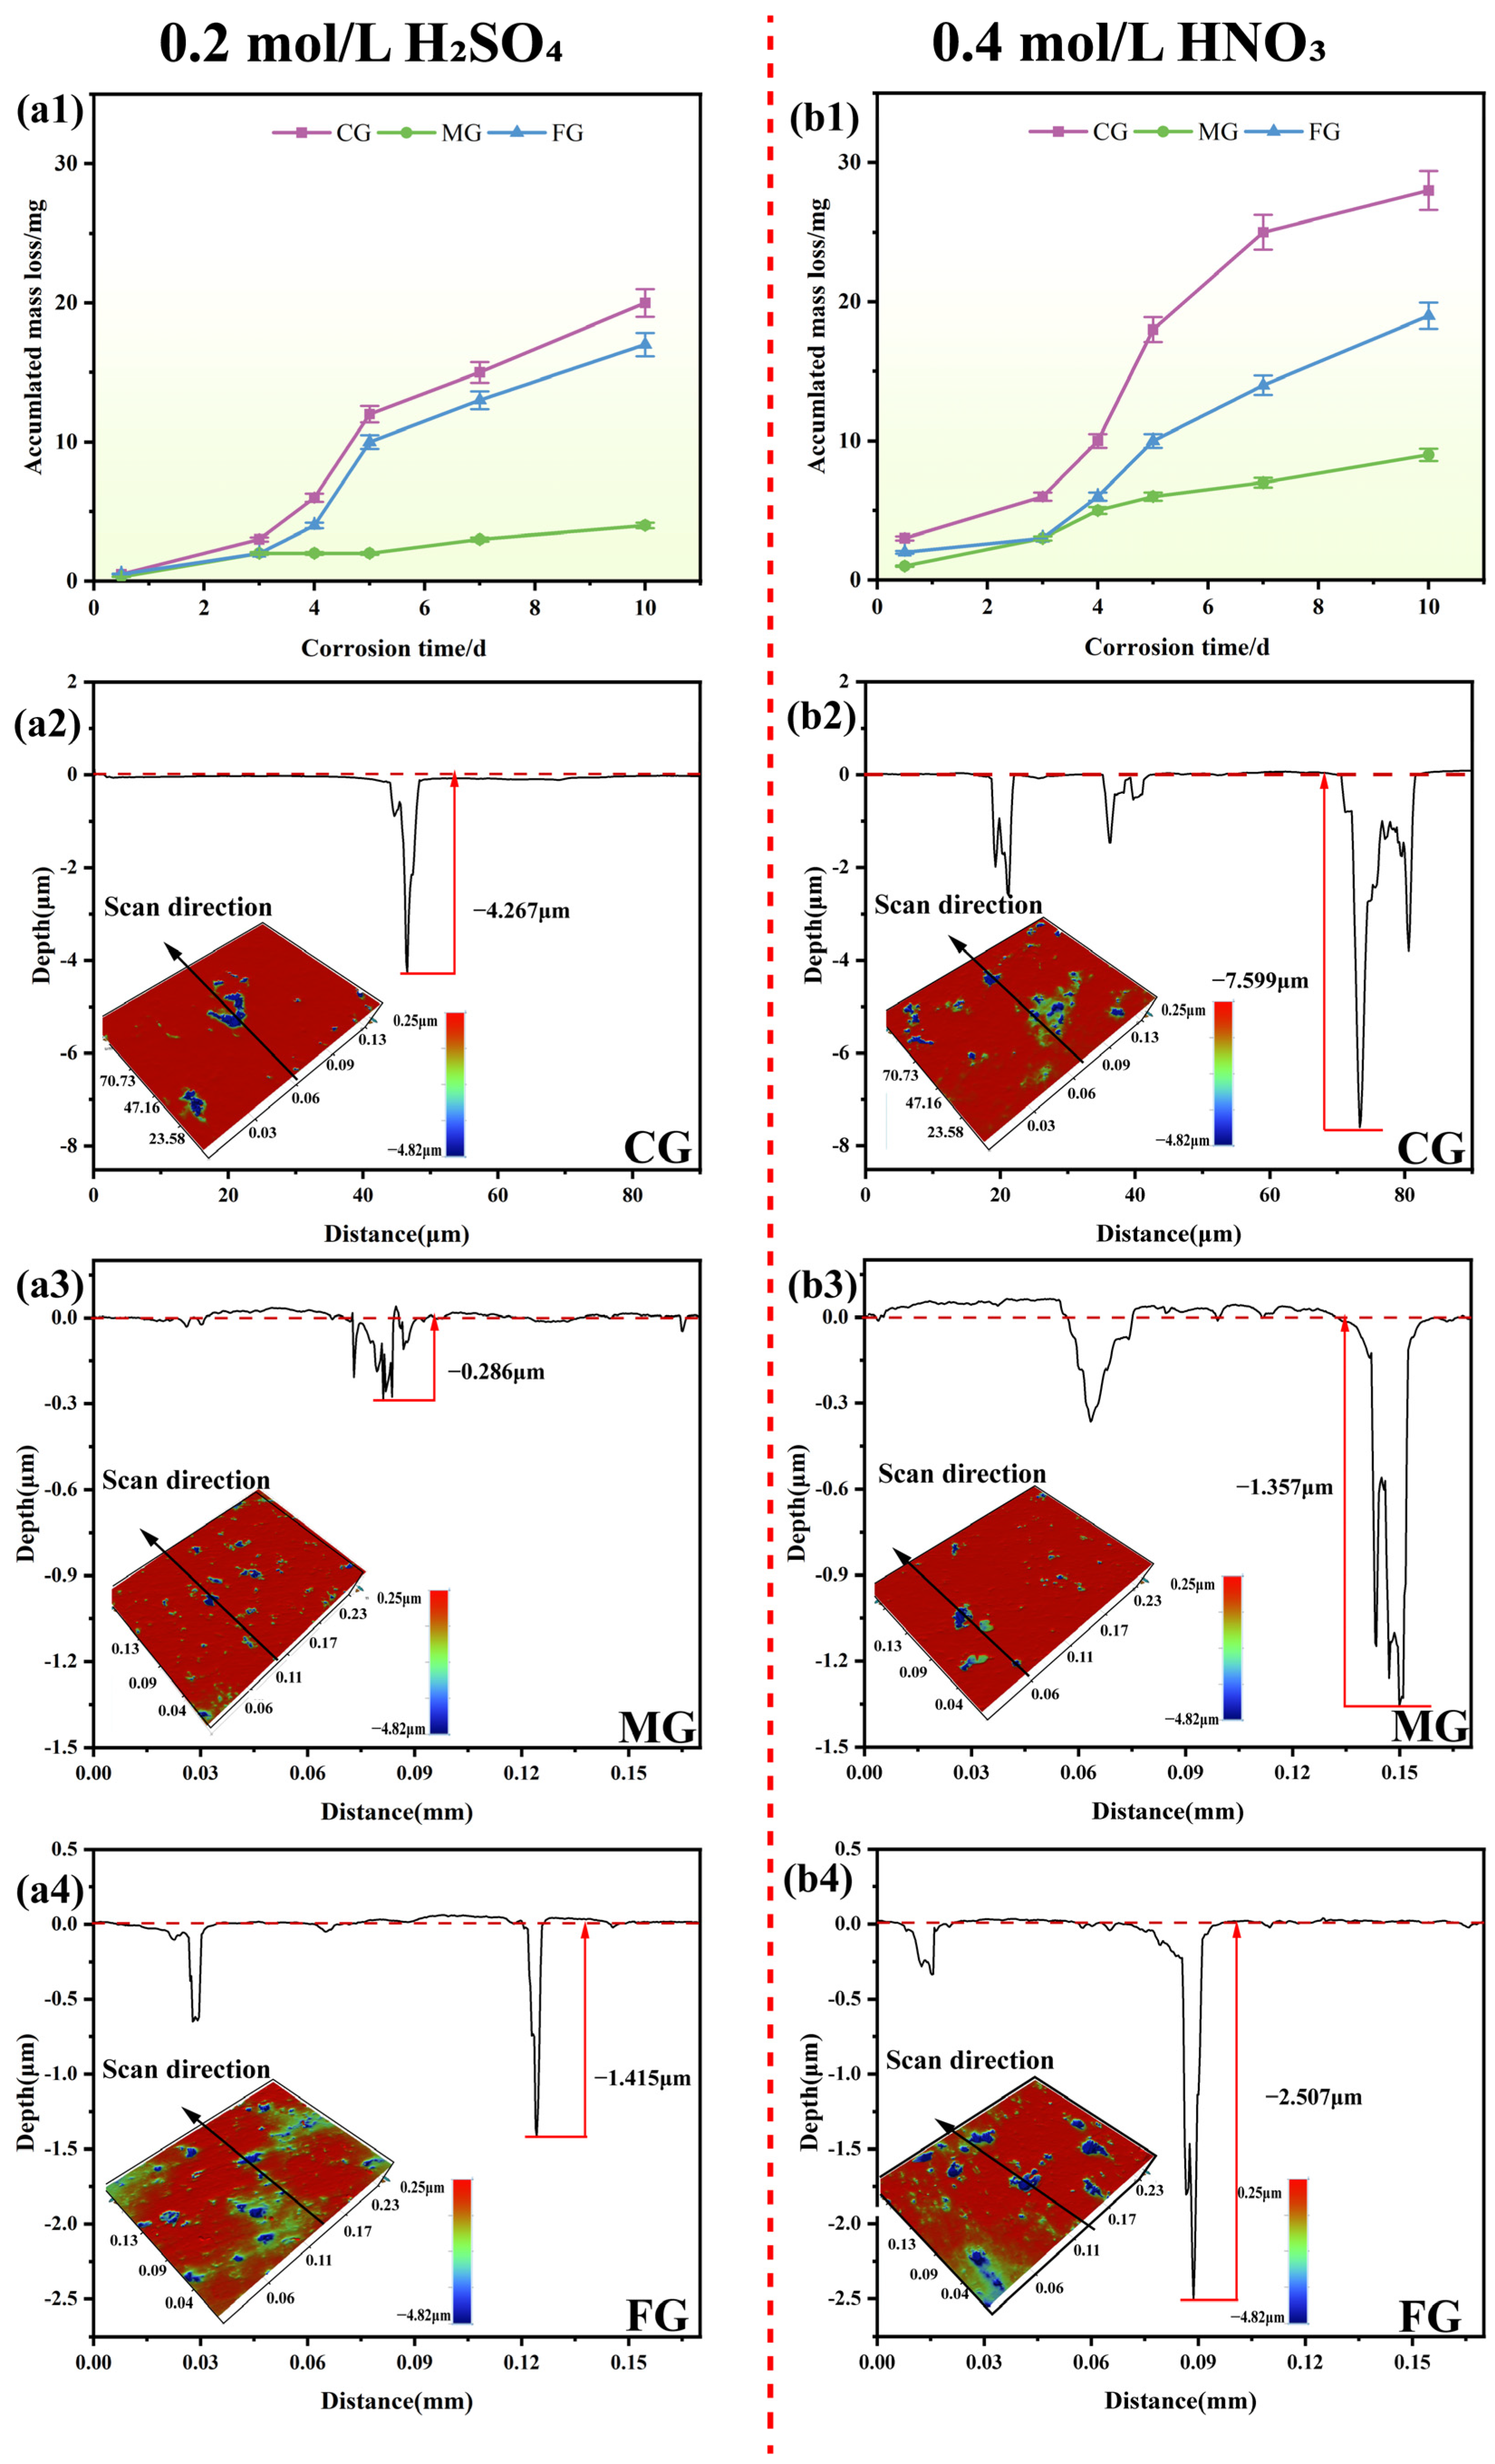
The average mass losses for CG, MG, and FG coatings after 10 days of immersion in 0.2 mol/L H2SO4 are 20 mg/cm2, 4 mg/cm2, and 17 mg/cm2, respectively. The corresponding values in 0.4 mol/L HNO3 are 28 mg/cm2, 9 mg/cm2, and 19 mg/cm2. The calculated corrosion rates for CG, MG, and FG coatings in 0.2 mol/L H2SO4 are 0.52 mm·year−1, 0.10 mm·year−1, and 0.44 mm·year−1, respectively. The corresponding values in 0.4 mol/L HNO3 are 0.73 mm·year−1, 0.23 mm·year−1, and 0.50 mm·year−1. Figure 6(a1) and Figure 6(b1) further show the relationship between accumulative mass loss and immersion time for the coatings in 0.2 mol/L H2SO4 and 0.4 mol/L HNO3 solutions, respectively. All three coatings exhibit higher mass losses and corrosion rates in the 0.4 mol/L HNO3 solution compared to those in the 0.2 mol/L H2SO4 solution. This difference is attributed to the strong oxidizing nature of HNO3, which promotes rapid oxidation of the metallic binder phase, forming soluble metal ions and thereby accelerating the structural degradation of the coating. Notably, in the 0.4 mol/L HNO3 medium, oxide corrosion products were visible upon recovery from the immersion solution, whereas no such corrosion products were observed on the samples retrieved from the 0.2 mol/L H2SO4 solution. In both corrosive acids, the corrosion rate shows a power law relationship with the corrosion time, which is consistent with the classic corrosion model. Under identical corrosion durations, the mass loss of the CG coating is the largest, while the MG coating is the lowest in both media, indicating a superior corrosion resistance of the MG coating. For FG coating with the finest microstructure, its lower corrosion resistance is likely due to the slightly higher porosity, which serves as a preferential pathway for corrosion medium penetration.
The three-dimensional surface morphologies of corroded coatings measured by optical profilometry after 10 days of immersion are presented in Figure 6(a2–b4). The results confirm that the CG coating exhibits the poorest corrosion resistance in both solutions, presenting the greatest pit depth (4.267 μm in 0.2 mol/L H2SO4 and 7.599 μm in 0.4 mol/L HNO3). In contrast, the MG coating demonstrates the best performance, suffering the least damage (0.286 μm in 0.2 mol/L H2SO4 and 1.357 μm in 0.4 mol/L HNO3). The FG coating displays an intermediate level of damage (1.415 μm in 0.2 mol/L H2SO4 and 2.507 μm in 0.4 mol/L HNO3). These findings indicate that the corrosion resistance of the HVAF sprayed WC–10Co–4Cr coatings was synergistically influenced by WC grain size and microstructural porosity. The CG coating, with its coarse grains and sparse grain boundaries, tends to concentrate the corrosion current on a few sites, accelerating localized dissolution. Once these boundaries are breached, entire large grains detach, forming deep pits that propagate and rapidly roughen the surface, markedly diminishing corrosion resistance. Conversely, the FG coating, despite its fine grains and short grain-boundary migration distances, fails to effectively eliminate porosity, allowing the corrosive medium to readily penetrate the coating surface.
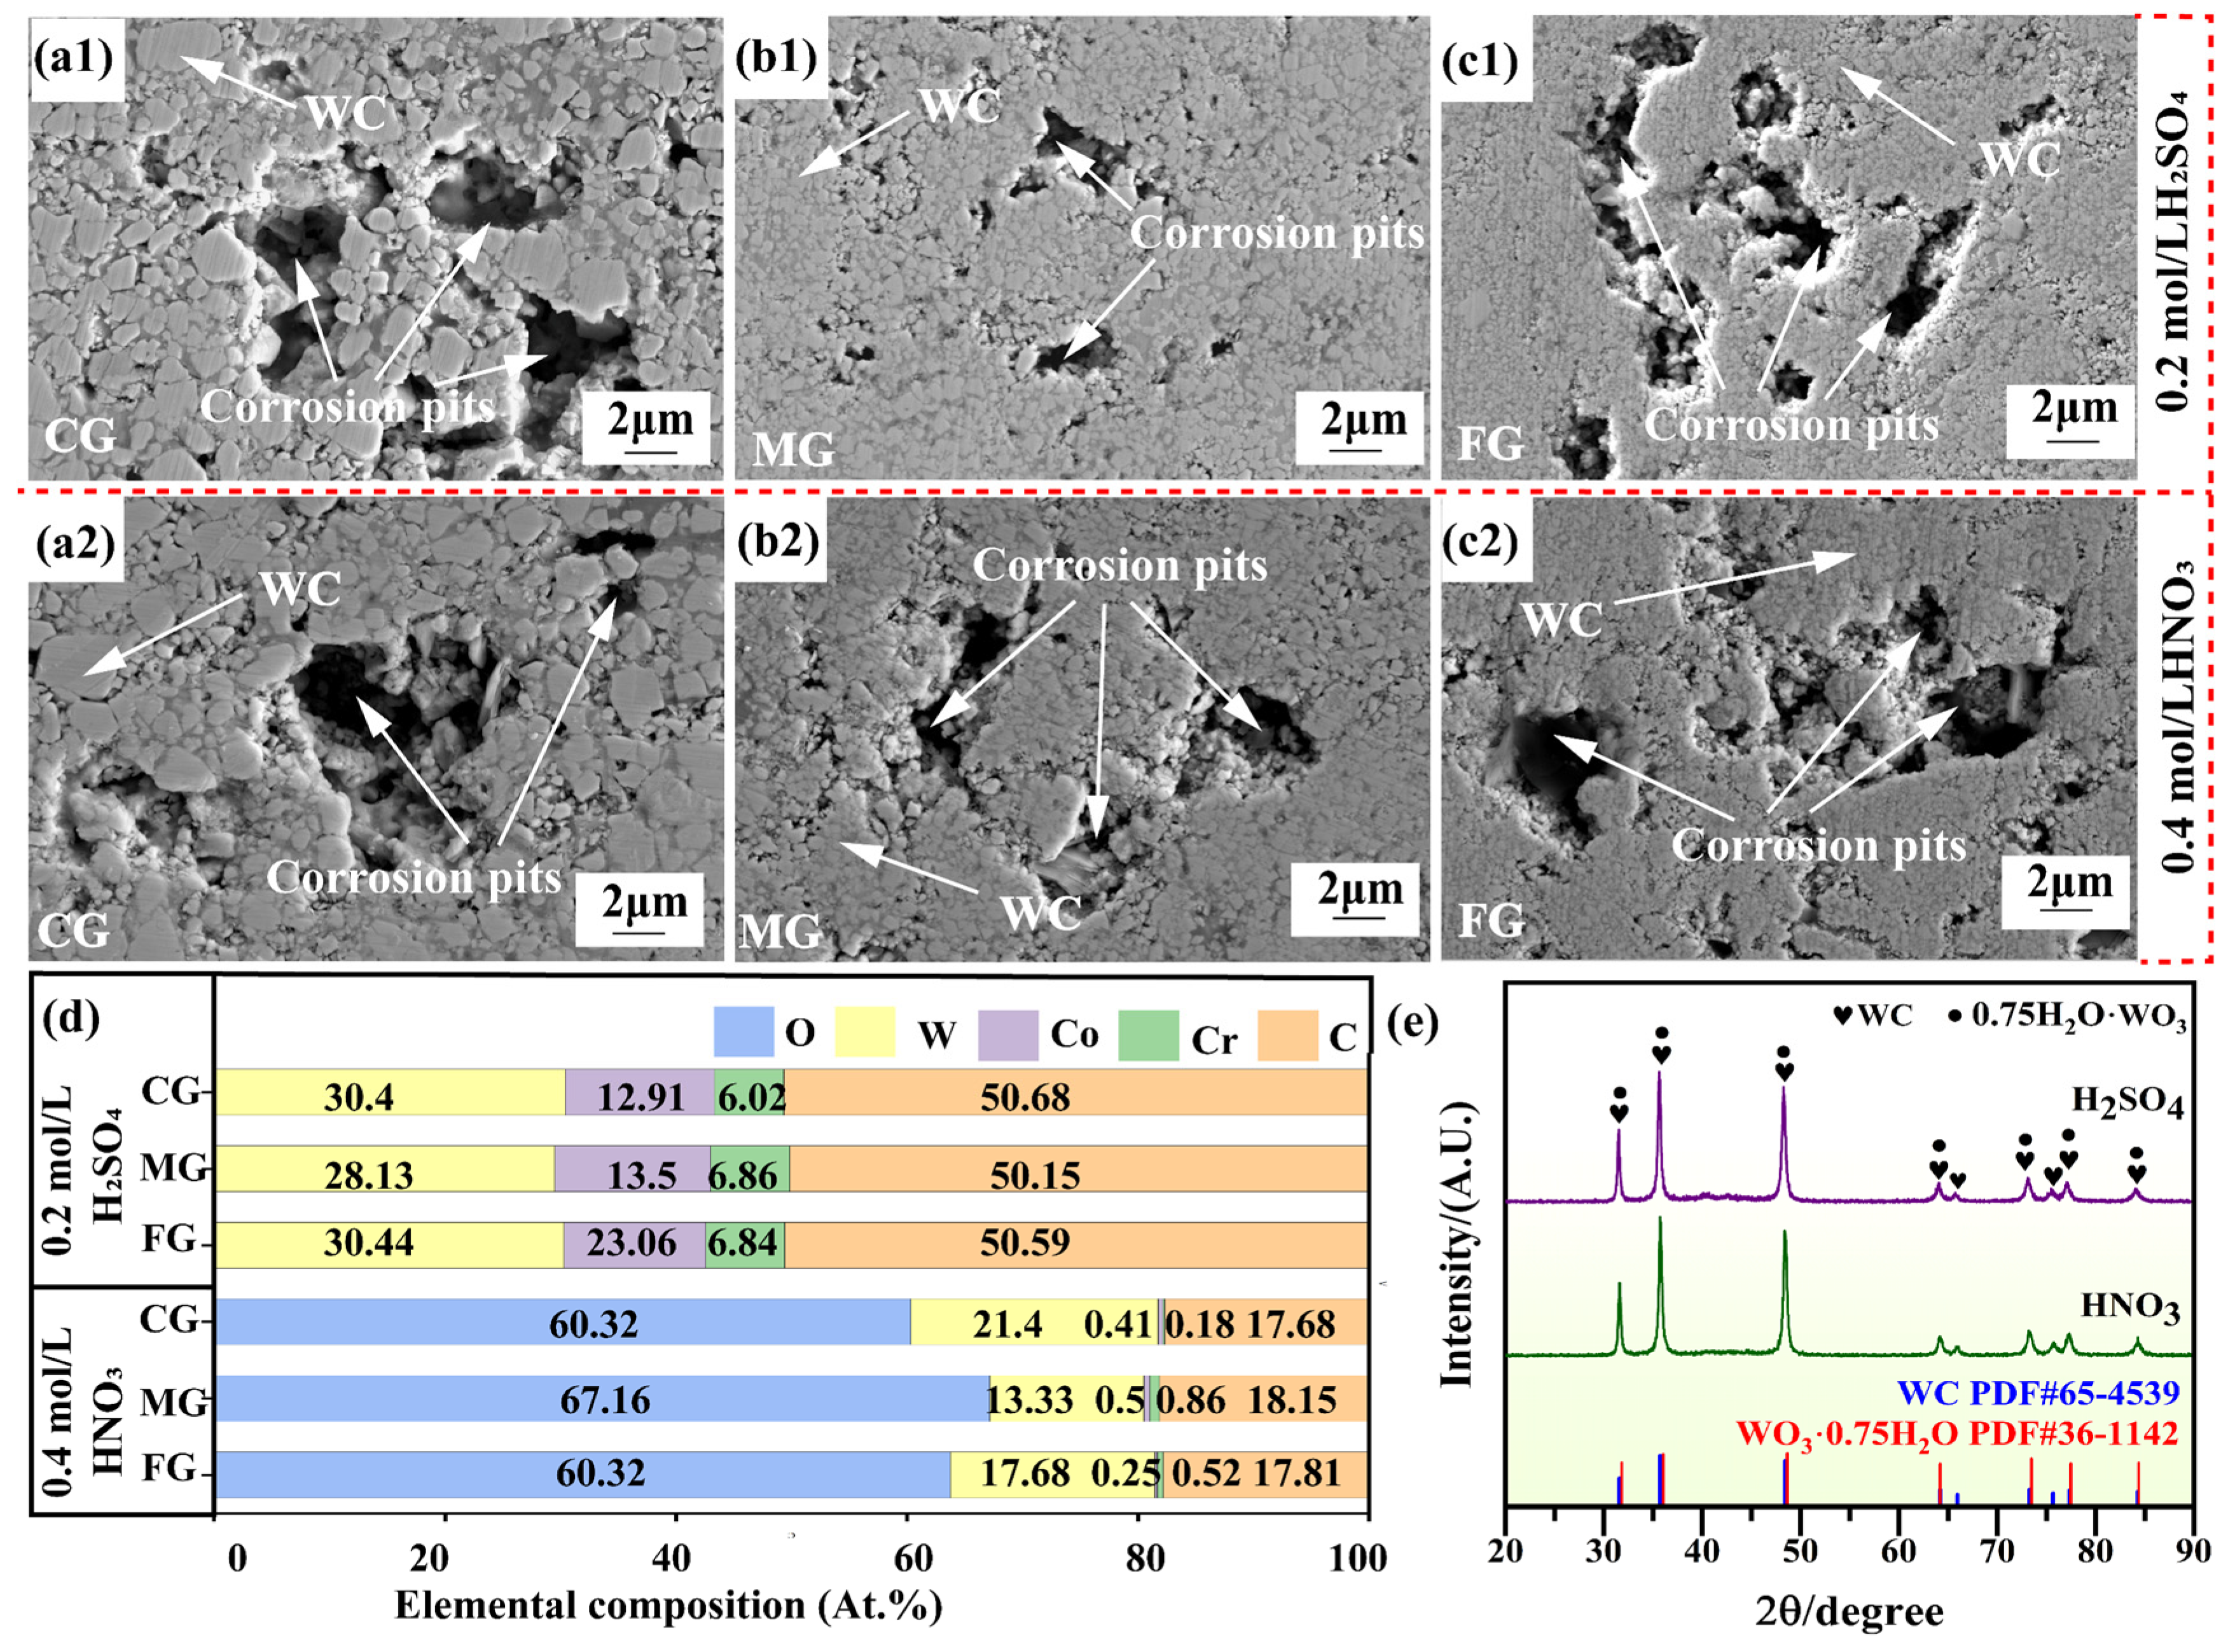
Figure 7(a1–c2) shows the surface morphologies of the corroded coatings. It is further revealed that the pit density of the MG coating is lower than that of the CG and FG coatings, consistent with the smallest accumulative mass loss and lowest pit depths presented above, thereby corroborating the superior corrosion resistance of the MG coating. The corrosion damage initiated preferentially at the WC/CoCr interphases, forming typical corrosion trenches. This phenomenon originates from the electrochemical micro-galvanic cell formed in the acidic medium, where the WC phase acts as the cathode and the CoCr binder phase undergoes preferential dissolution as the anode. The electrochemical reaction ultimately leads to WC particle debonding and pit formation.
The EDS elemental analysis of the corroded regions (as shown in Figure 7d) shows that a large amount of O is present on the sample surfaces immersed in the 0.4 mol/L HNO3 solution, whereas no O is detected for samples immersed in the 0.2 mol/L H2SO4 solution. The atomic percentage of W and C elements increases slightly (1.4%), and the fraction of Cr doubles compared to the elemental composition of samples before immersion (Figure 3d), confirming the chemical inertness of the WC hard phase and the corrosion resistance property of Cr. The Co element loss in the binder phase exceeded 2%, verifying the preferential dissolution of the metallic binder phase. According to the XRD analysis shown in Figure 7e, the oxide formed in the HNO3 environment is WO3·0.75H2O.
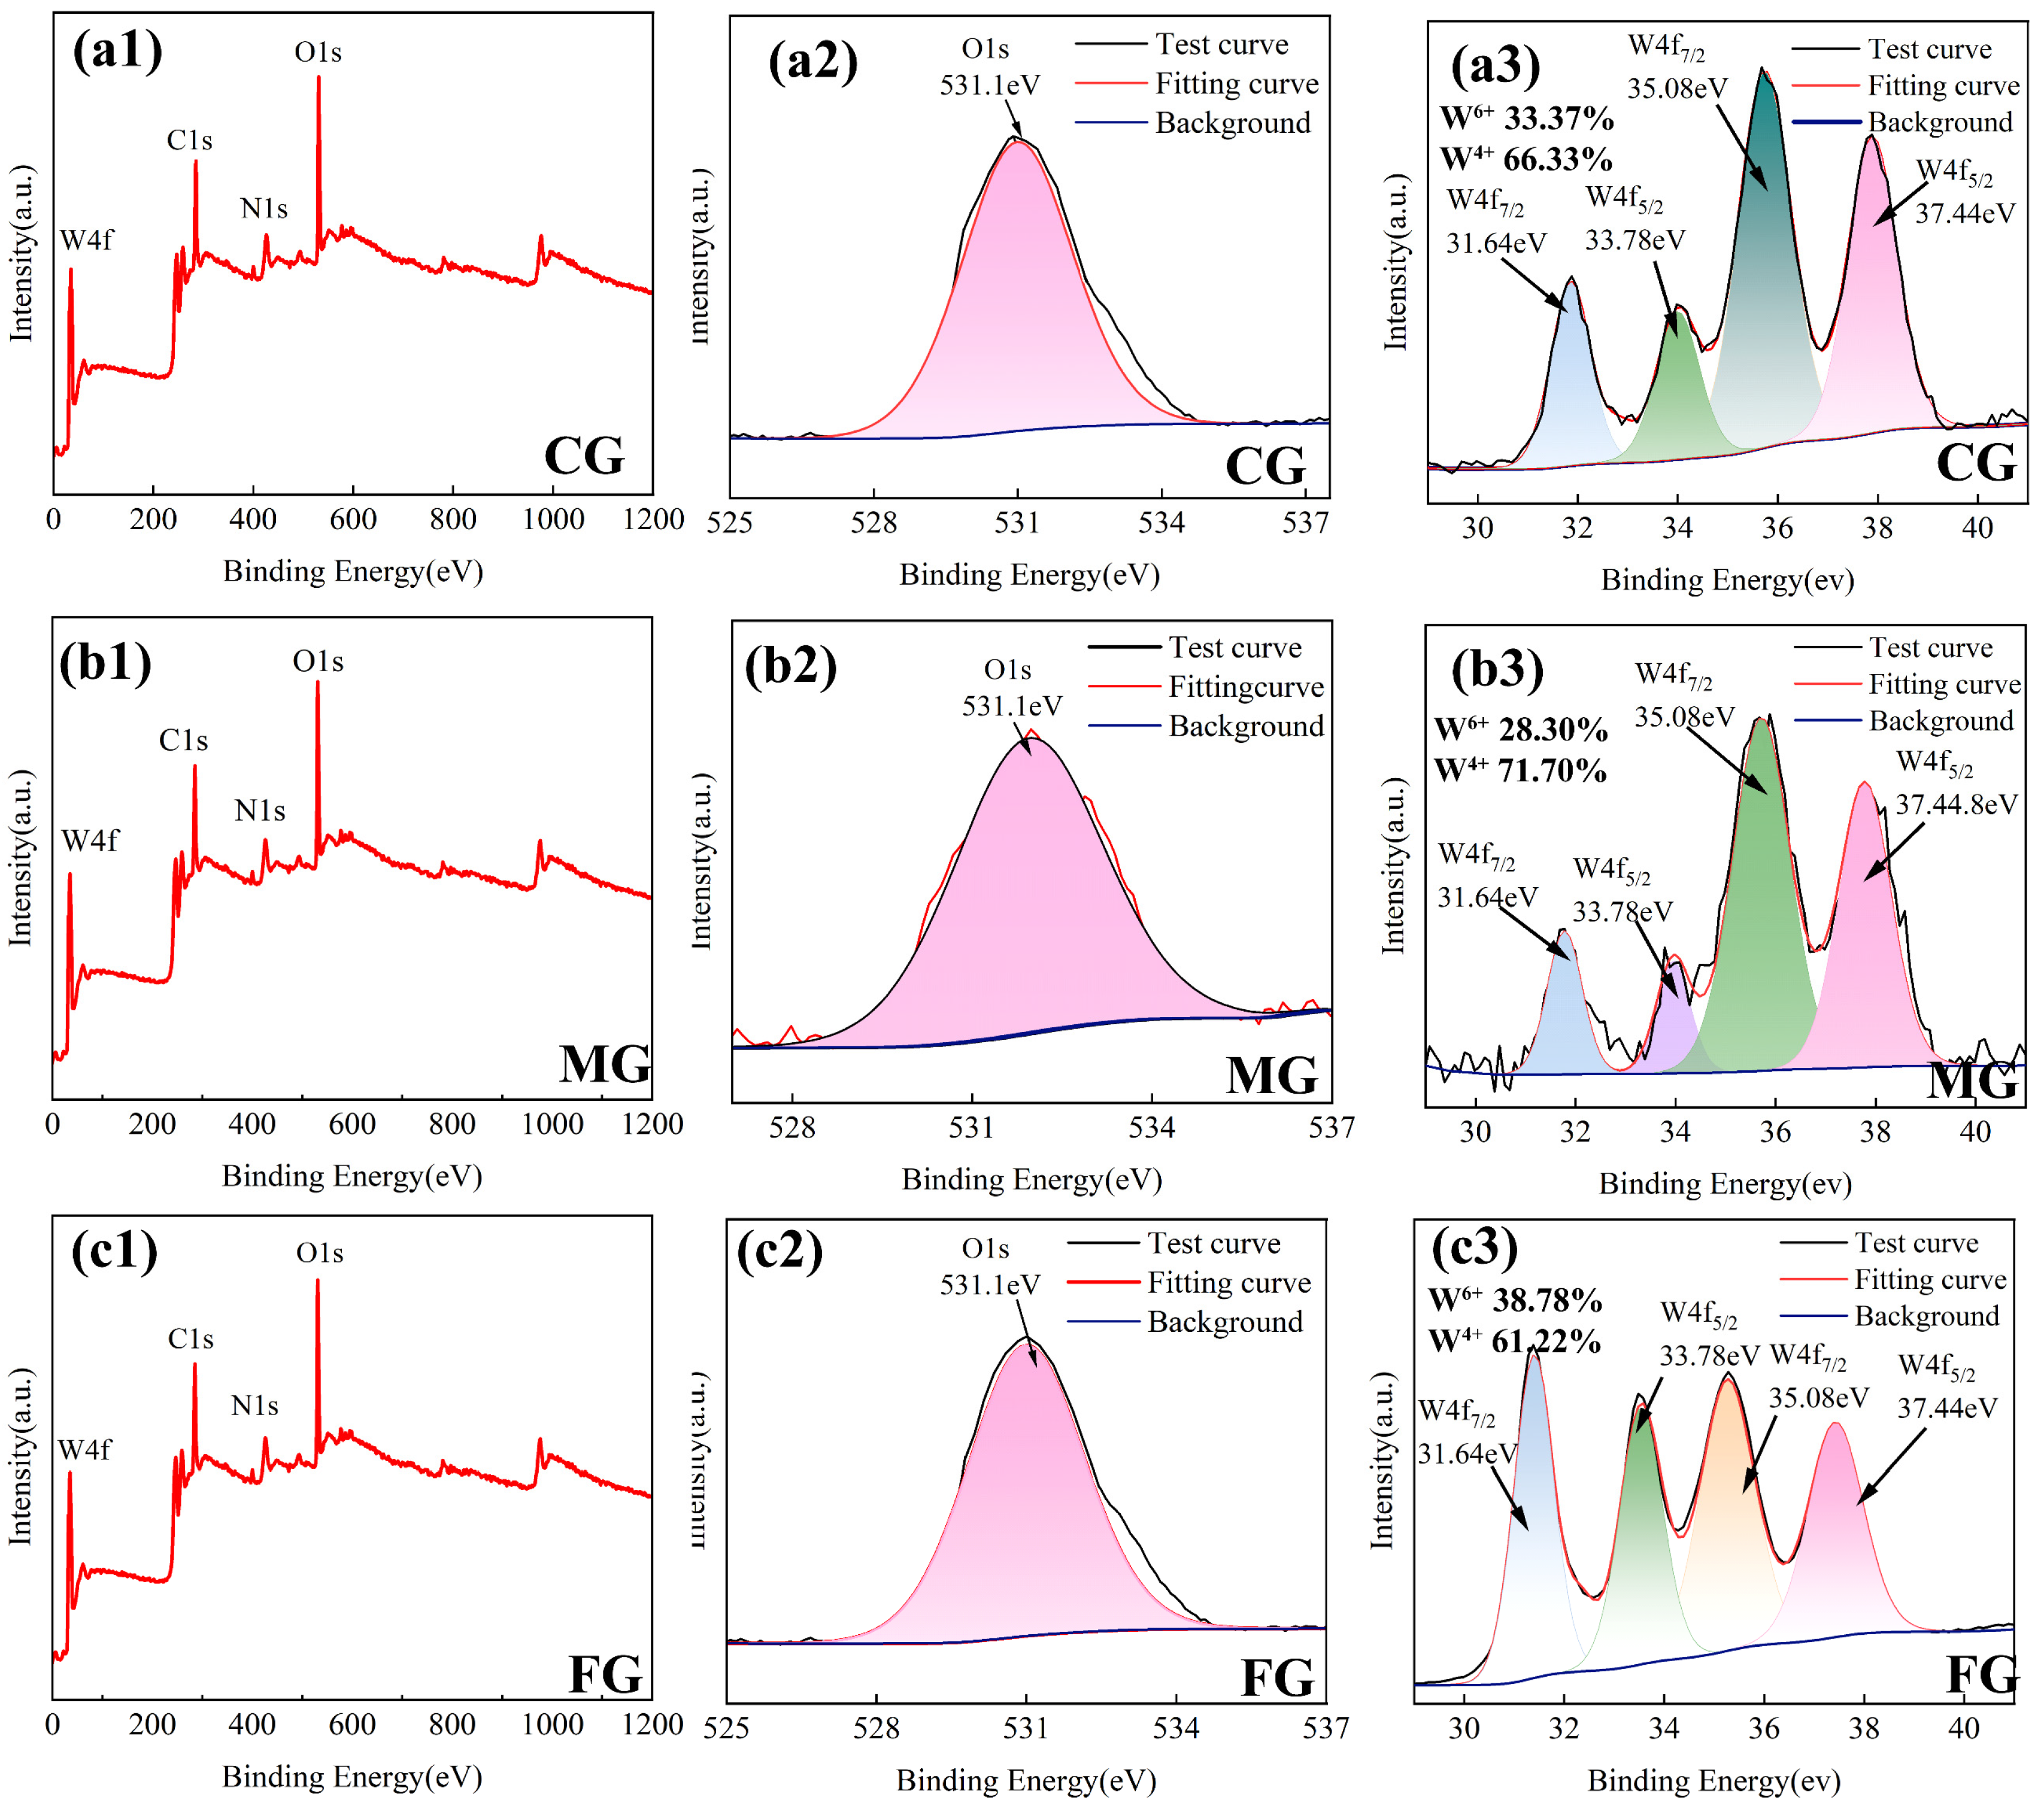
To further define the presence of oxide formed in the 0.4 mol/L HNO3 solution, XPS analysis was applied, and the results are shown in Figure 8. The W 4f spectrum exhibited characteristic double peaks at 35.08 eV (W 4f7/2) and 37.44 eV (W 4f5/2), confirming the presence of the W6+ oxidation state. Additionally, the strong peak at 531.1 eV in the O 1s spectrum corresponds to the W-O chemical bond. Collectively, these results suggest that the hard phase WC was oxidized to WO3·0.75H2O during the corrosion process. The related corrosion reactions are as follows [19,30]:
W C + 2 H N O 3 = W O 3 + H 2 +   C O 2 +   N O
W O 3 + 0.75 H 2 = W O 3 · 0.75 H 2 O
By comparing the W6+ and W4+ proportion shown in Figure 8(a3–c3), the proportion of W6+ (representing the content of WO3·0.75H2O oxide) is the smallest for MG (28.3% compared to 33.37% for CG and 38.78% for FG). This is another piece of evidence supporting that the MG coating has the highest corrosion resistance among the three coatings.

3.3. Electrochemical Corrosion

3.3.1. OCP and Potentiodynamic Polarization Tests

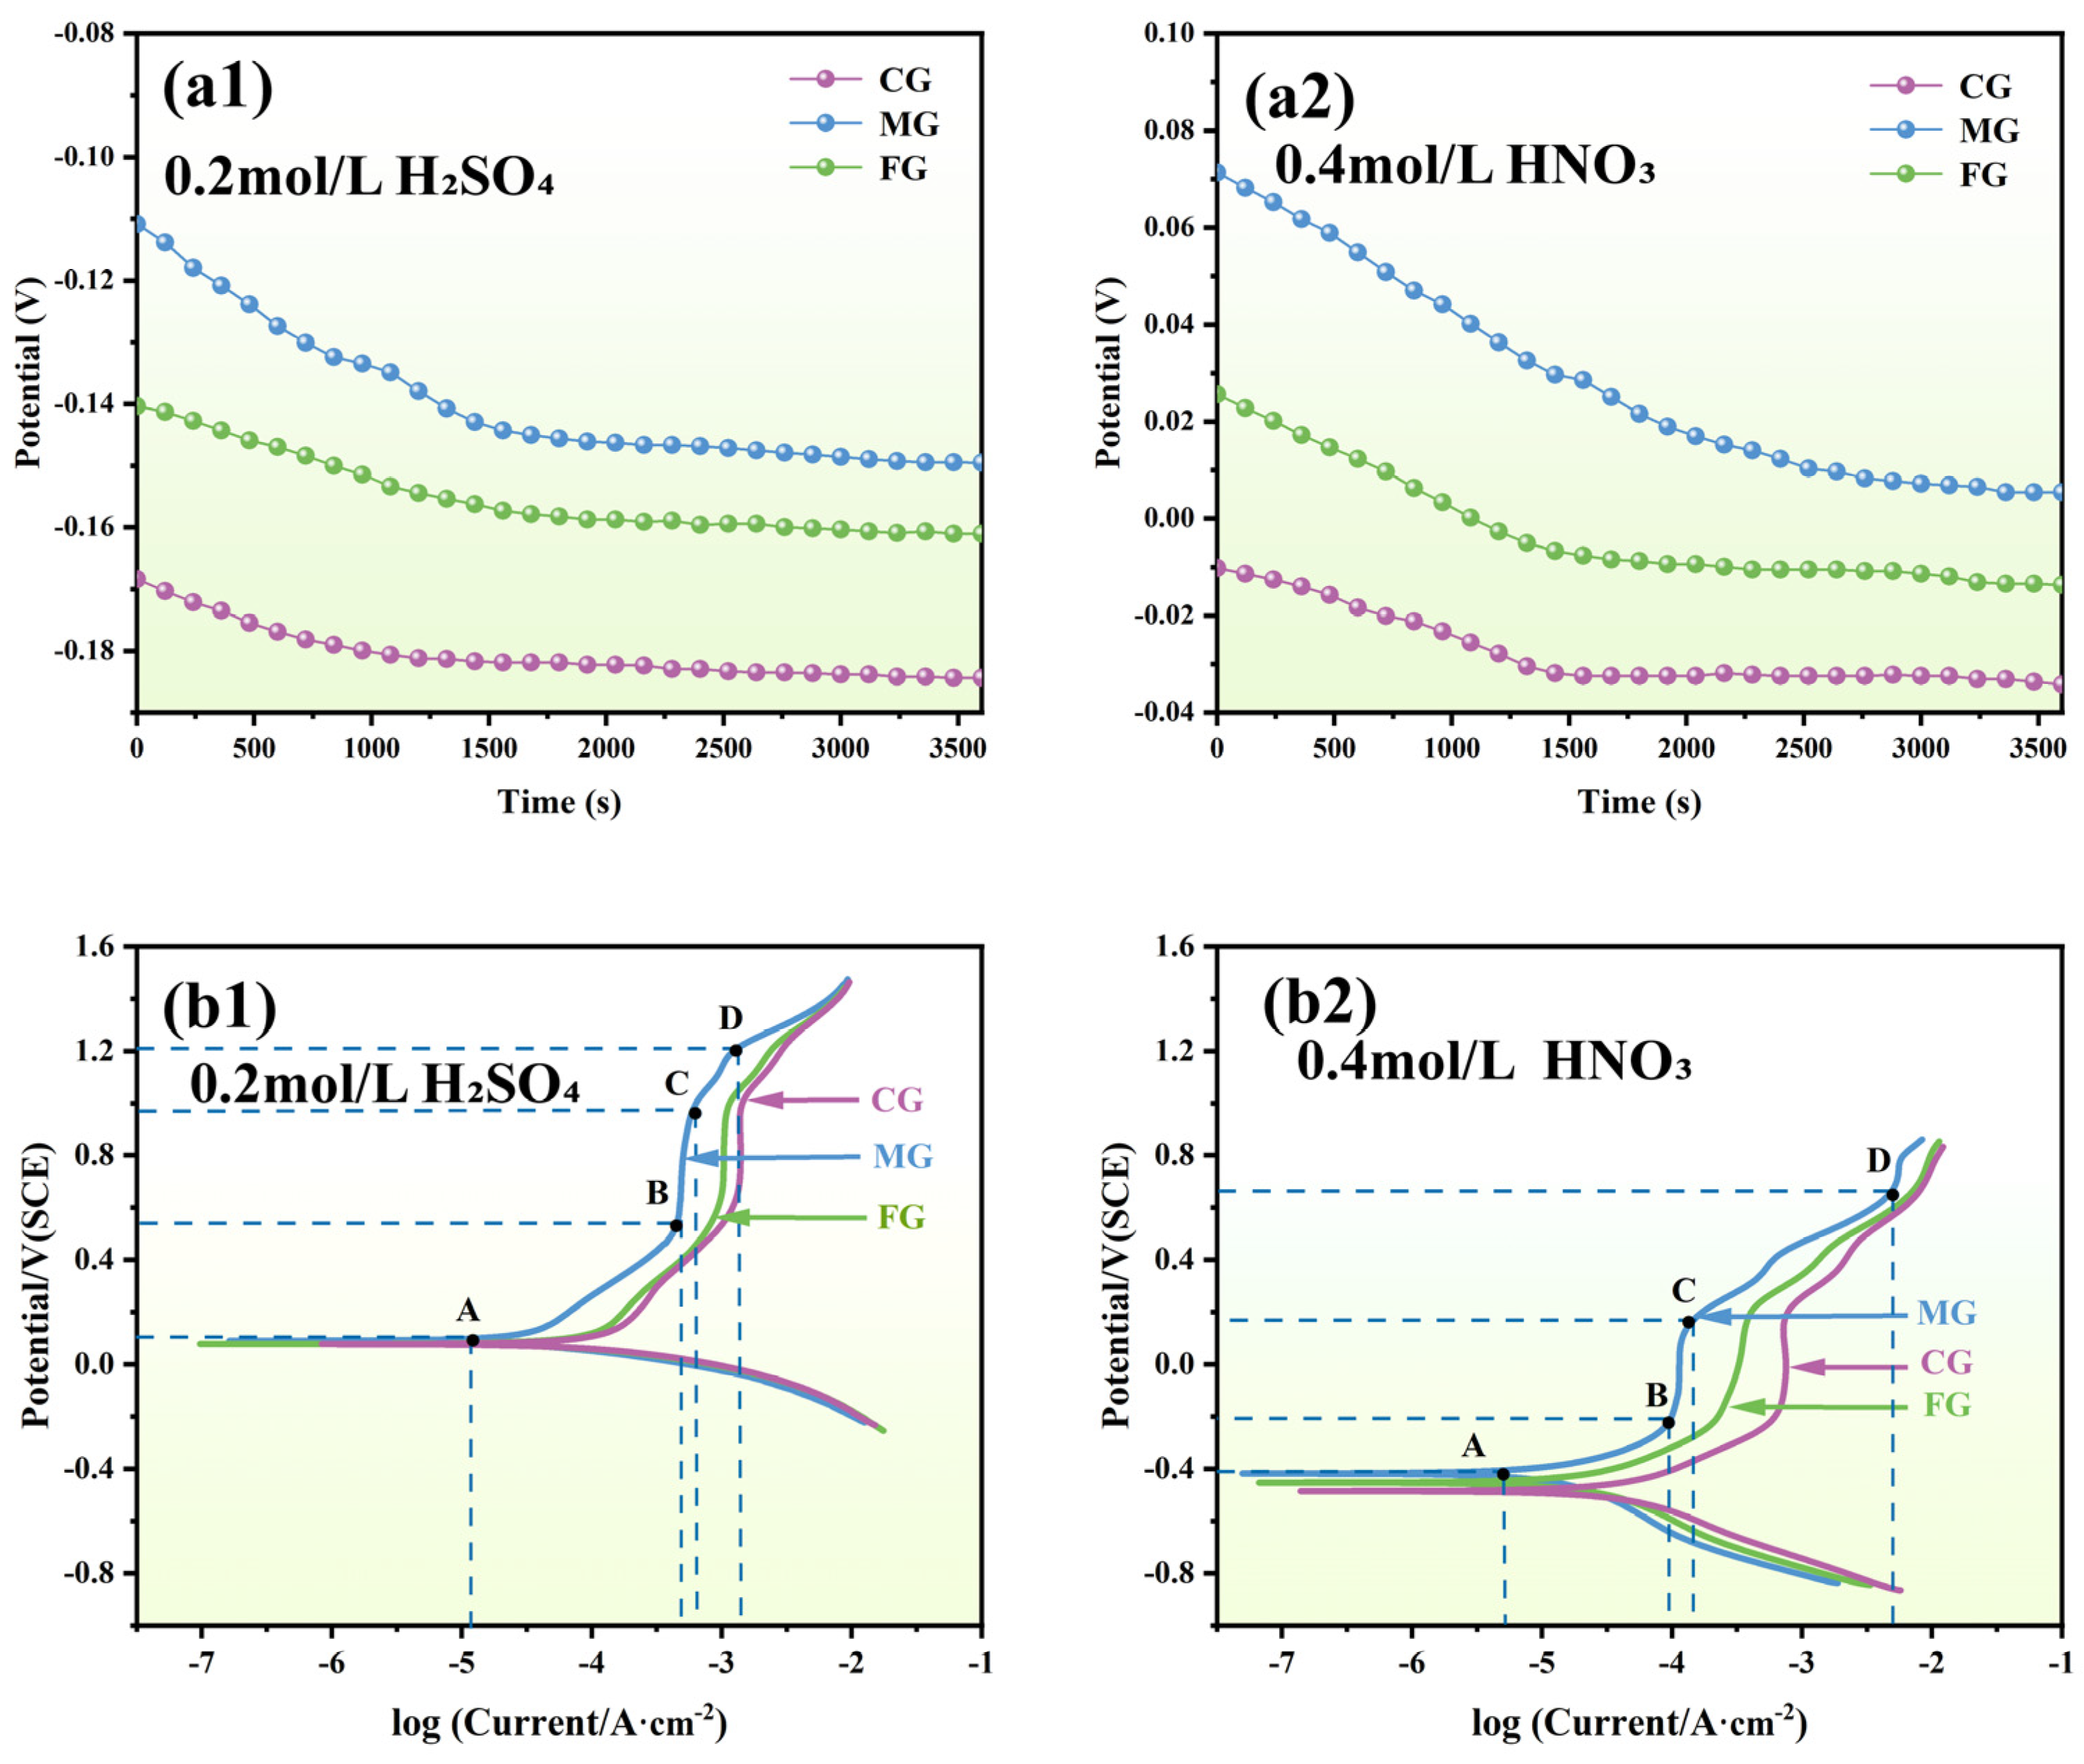
Figure 9(a1) and Figure 9(a2) present the OCP curves of the three types of coatings (CG, MG, and FG) after 1 h of immersion in 0.2 mol/L H2SO4 and 0.4 mol/L HNO3, respectively. The experimental results indicate that the OCP values of all three coatings gradually decreased and stabilized within 25 min (with fluctuations < ±5 mV), suggesting the formation of a stable corrosion product layer on the coating surface in the acidic medium, which may effectively suppress the initiation of localized pitting. In HNO3, the stable potential of the MG coating was −0.14 V, which is 40 mV and 20 mV more positive than that of CG (−0.18 V) and FG (−0.16 V), respectively. In H2SO4, the stable potential of MG (0.005 V) was also significantly higher than that of CG (−0.033 V) and FG (−0.013 V). According to the principles of corrosion thermodynamics, a higher stable OCP indicates lower electrochemical activity and a stronger passivation ability of the material [10]. This data further confirms that MG exhibits the best corrosion resistance in both acidic environments, which is highly consistent with the previous weight loss test and micro-morphology analysis results.
Figure 9(b1,b2) present the polarization curves of three types of coatings (CG, MG, and FG) in 0.2 mol/L H2SO4 and 0.4 mol/L HNO3, which can be divided into four typical stages: (1) Active dissolution region (A,B): In HNO3 solution, when the potential is below −0.13 V, and in H2SO4 solution, when the potential is below 0.12 V, the Co binder phase preferentially undergoes anodic dissolution (Co → Co2+ + 2e) [19], resulting in an exponential increase in corrosion current density with the positive shift in potential. (2) Stable passivation region (B,C): As the corrosion potential increases, the increasing rate of corrosion current density decreases, reaching a stable region. The oxidation reaction of Cr (Cr + 2H2O → CrO2 + 4H+ + 3e) [19], which dominates and forms a Cr-based passive film on the surface, inhibits further electrochemical corrosion. The corrosion current density stabilizes in the range of 0.46–0.59 mA/cm2 in HNO3 and 0.1–0.14 mA/cm2 in H2SO4, respectively. (3) Overpassivation region (C,D): As the potential continues to increase, the passivated state of the coating is disrupted (CrO2 +2H2O → CrO42− + 4H+ + 2e) [19], and the corrosion is accelerated, leading to a near-linear increase in corrosion current density. The current density in HNO3 solution sharply rises to 1.35 mA/cm2, while it increases to 4.9 mA/cm2 in H2SO4 solution. (4) Pseudo passivation region (after point D) (Figure 9(b1)): As the corrosion potential increases, the current density continues to rise but at a progressively slower rate. This is primarily due to the accumulation of the corrosion product WO3 at the surface, which hinders diffusion of the corrosive species into the deeper coating and results in a phenomenon similar to passivation.
The Tafel fitting data (Table 3) confirm that MG exhibits the best electrochemical performance. In HNO3 solution, the corrosion potential of MG (−0.360 V) is 18 mV and 17 mV more positive than that of coarse-grained CG (−0.348 V) and ultrafine-grained FG (−0.347 V), respectively. Also, its corrosion current density (0.03 mA/cm2) is reduced by 70% compared to CG (0.10 mA/cm2) and by 67% compared to FG (0.09 mA/cm2). In the H2SO4 environment, this advantage is more pronounced. The corrosion potential of MG (−0.081 V) is 65 mV more positive than that of CG (−0.146 V), and its corrosion current density (0.01 mA/cm2) is reduced by 66% compared to CG and by 50% compared to FG. Overall, the electrochemical activity and corrosion sensitivity of the three coatings follow the sequence of MG > FG > CG.

3.3.2. Electrochemical Impedance Spectroscopy

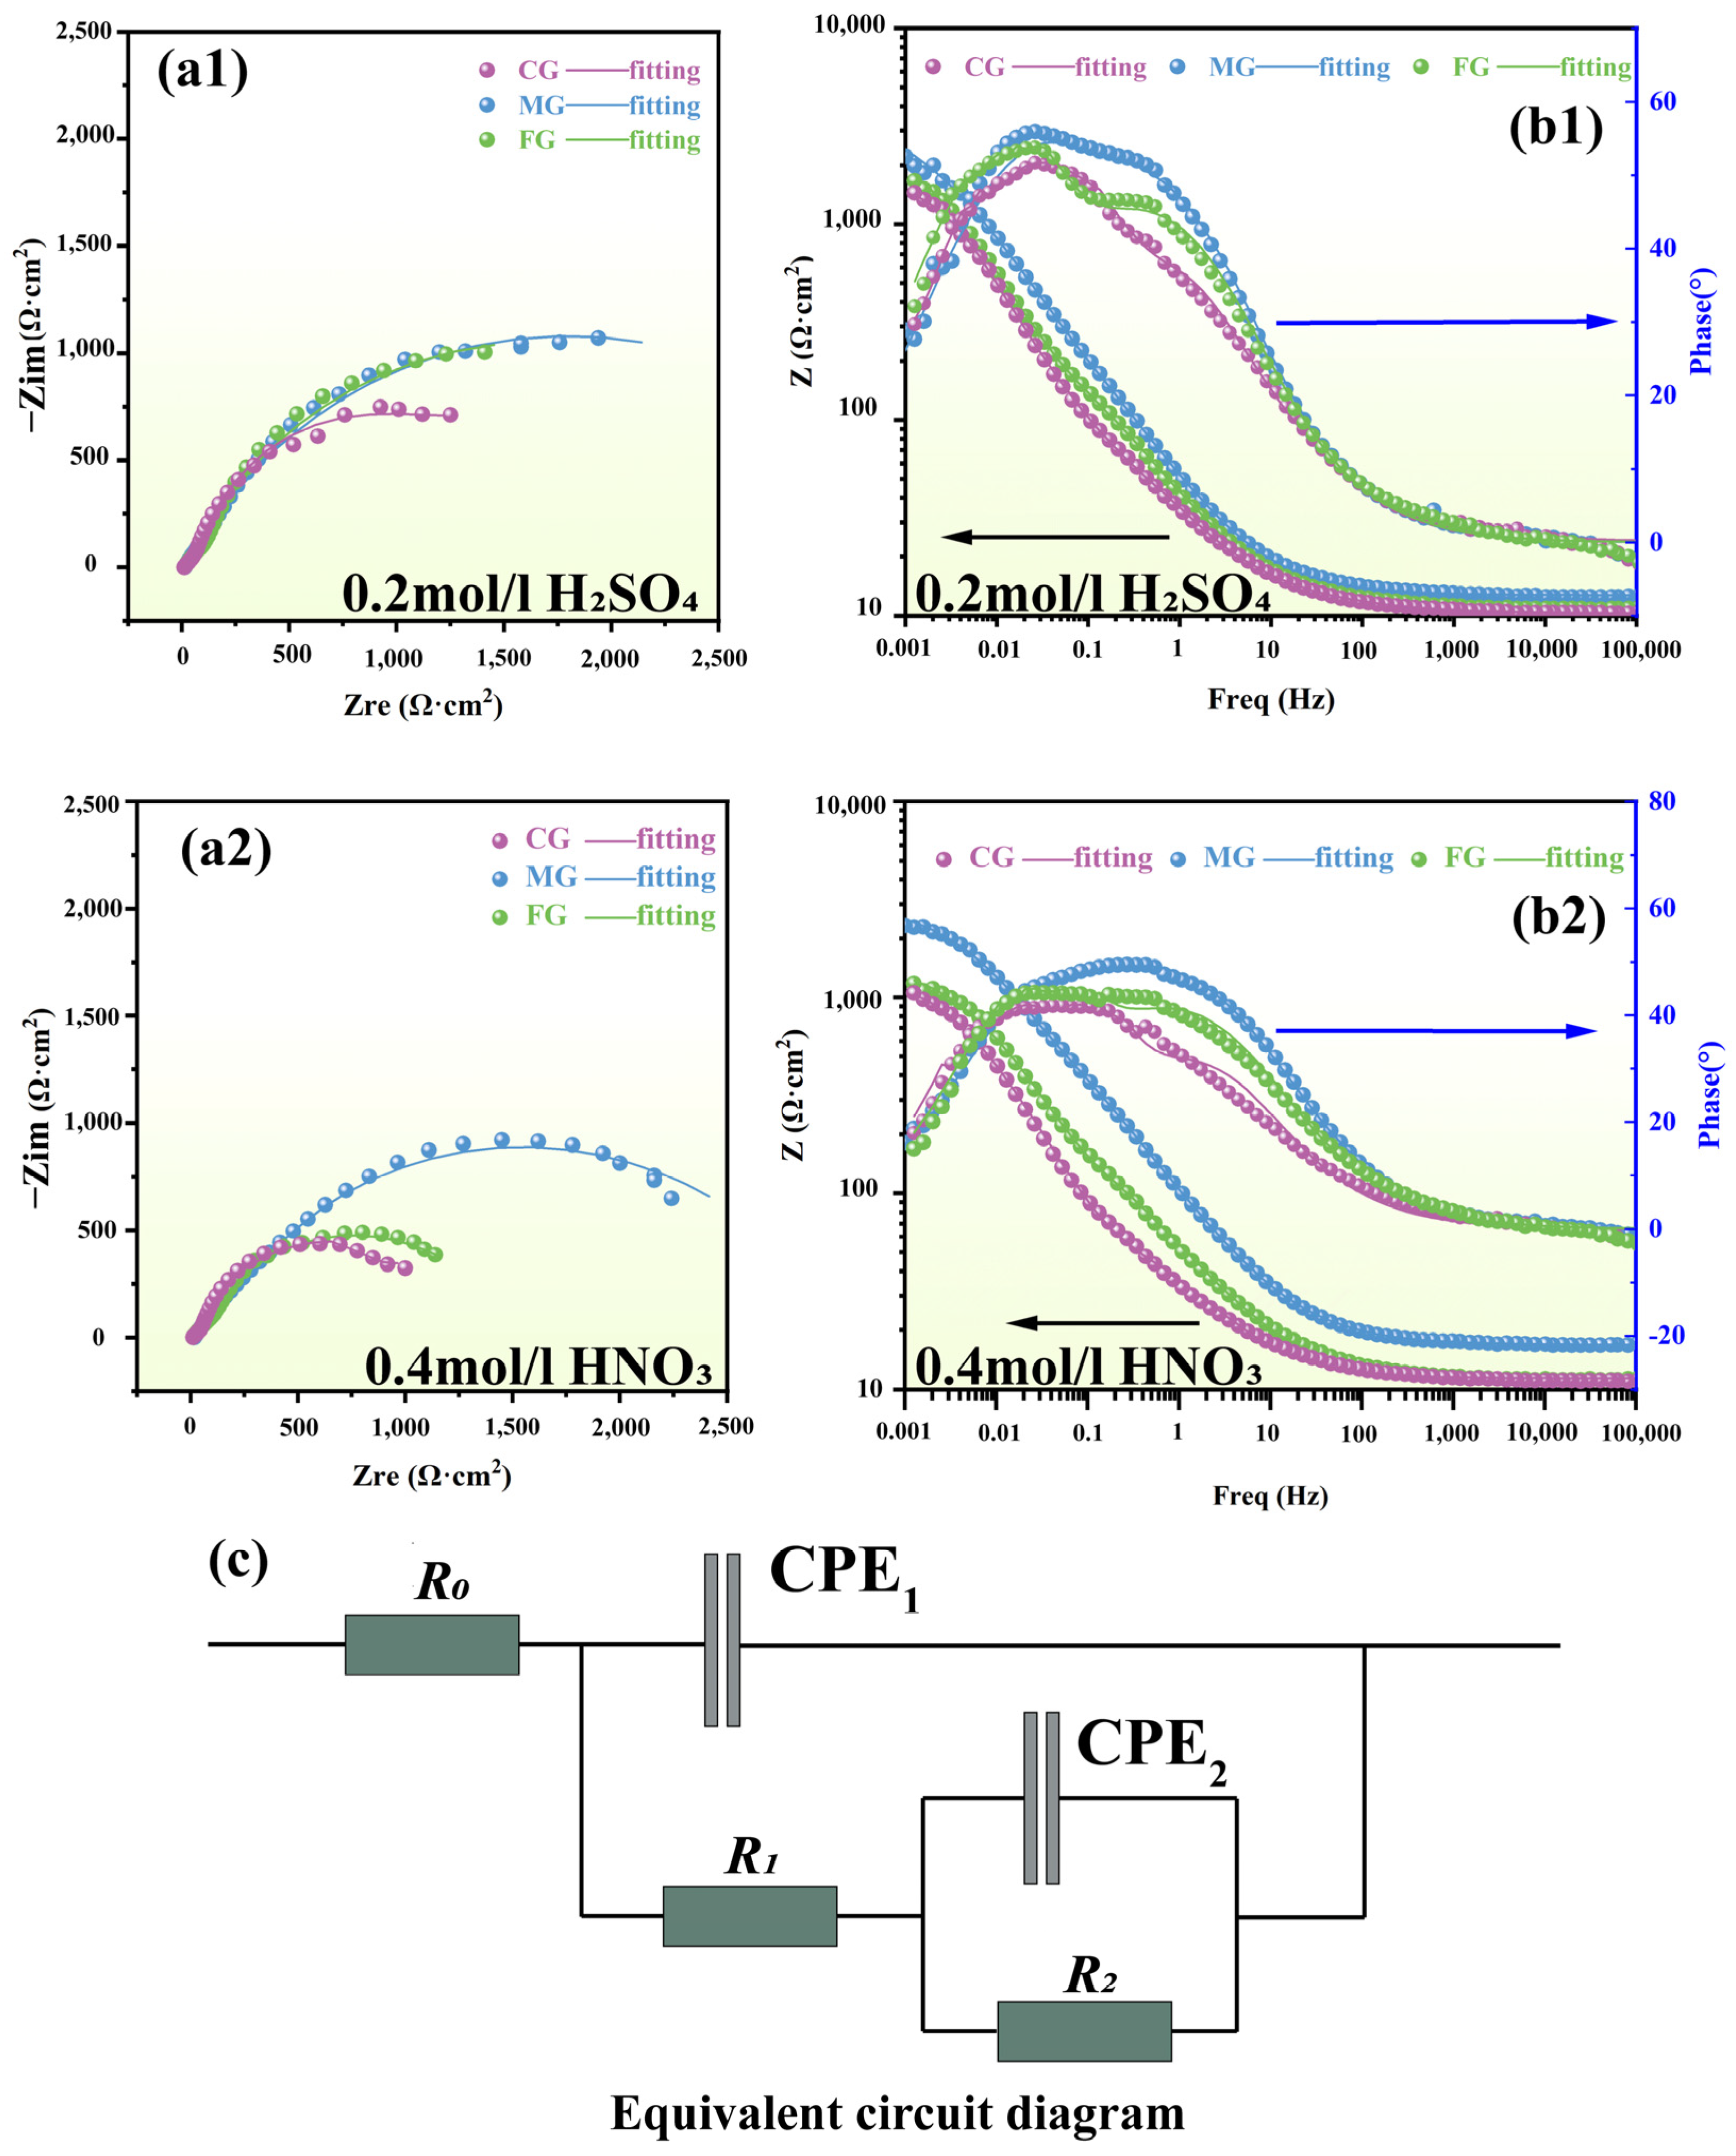
From the Nyquist and Bode plots of the three different coatings tested in 0.2 mol/L H2SO4 and 0.4 mol/L HNO3 solutions shown in Figure 10, all coatings exhibited similar impedance behavior in both media, i.e., an indistinct capacitive arc appeared in the high-frequency region, accompanied by a larger capacitive arc in the low-frequency region. The Bode phase plots in Figure 10(b1,b2) reveal double time constants, with the second phase peak in the high-frequency region being partially obscured. The first high-frequency arc, corresponding to the pre-dissolution/adsorption initiation of cobalt within the electric double layer, reflects the process in which cobalt atoms in the binder phase lose electrons and form cobalt ions in the double layer; the second low-frequency arc represents the charge-transfer resistance (Rct), and an increase in its radius signifies enhanced corrosion resistance [32]. MG exhibited the highest Rct, followed by FG and then CG. This trend is consistent with the previous analysis of polarization curves, corrosion current density, and corrosion potential. The characteristics of the outer layer are reflected at high frequencies, while those of the inner layer are reflected at mid-frequencies, and the low-frequency range reflects the intersection of the substrate and coating [33]. A high-frequency phase angle dropping below 20° indicates a gradual decline in the protective capability of the coating. At mid-frequencies, the phase angles of all coatings rapidly decrease, indicating coating penetration and the onset of corrosion degradation. During this stage, the decline in phase angle for the MG coating is relatively slow, likely due to the deposition of corrosion degradation products at coating defect sites. Overall, the MG coating demonstrates the best corrosion resistance.
An equivalent circuit model shown in Figure 10c was used to fit the impedance data, which has been previously applied in studies of plasma-sprayed WC-Co coatings [34]. The circuit consists of the solution resistance ( R 0 ), two resistive elements ( R 1 and R 2 ) associated with interfacial electrochemical processes, and two constant phase elements (CPE1 and CPE2) introduced to replace ideal capacitors in order to account for surface and interface inhomogeneity. The impedance of the CPE is defined as [6]
Z C P E = 1 / Q 0 ( j ω ) α
Calculations indicate that the equivalent capacitance value of the MG coating is lower than that of the other two coatings. A large amount of charge tends to accumulate preferentially along the WC/CoCr interface. When the charge concentration reaches a critical value, it will trigger the dissolution of the binder phase, leading to a decrease in the charge transfer resistance of the coating. In comparison, the charges in the MG coating are more uniformly distributed on the surface of the binder phase, thus avoiding local charge accumulation. This conclusion can be verified by comparing the charge transfer resistance R 1 . The impedance expression of the equivalent circuit is [6]
Z = R 0 + 1 1 1 1 R 2 + Q 2 0 ( j w ) α 2 + R 1 + Q 1 0 ( j w ) α 1
Here, Q 0 is the CPE coefficient, α is the CPE exponent (0 ≤ α ≤ 1), j is the imaginary unit, and ω is the angular frequency. When ω → 0, the total polarization resistance ( R p ) satisfies R p = R 1 + R 2 . The fitting data of the EIS for coatings tested in the 0.2 mol/L H2SO4 and 0.4 mol/L HNO3 solutions are summarized in Table 4 and Table 5, respectively. The calculations reveal that the R p values of MG are always higher than those of CG and FG under the same conditions, indicating its lower electron mobility and conductivity. Since the material’s polarization resistance is inversely proportional to the corrosion rate, the EIS results further demonstrate that the MG coating exhibits the best corrosion resistance. This explains why the corrosion current density and corrosion rate of MG are lower than those of CG and FG. The equivalent circuit fitting with (χ2) values in the range of 10−2 to 10−5 indicates good fitting quality [35].

3.3.3. Corrosion Morphology and Composition Analysis

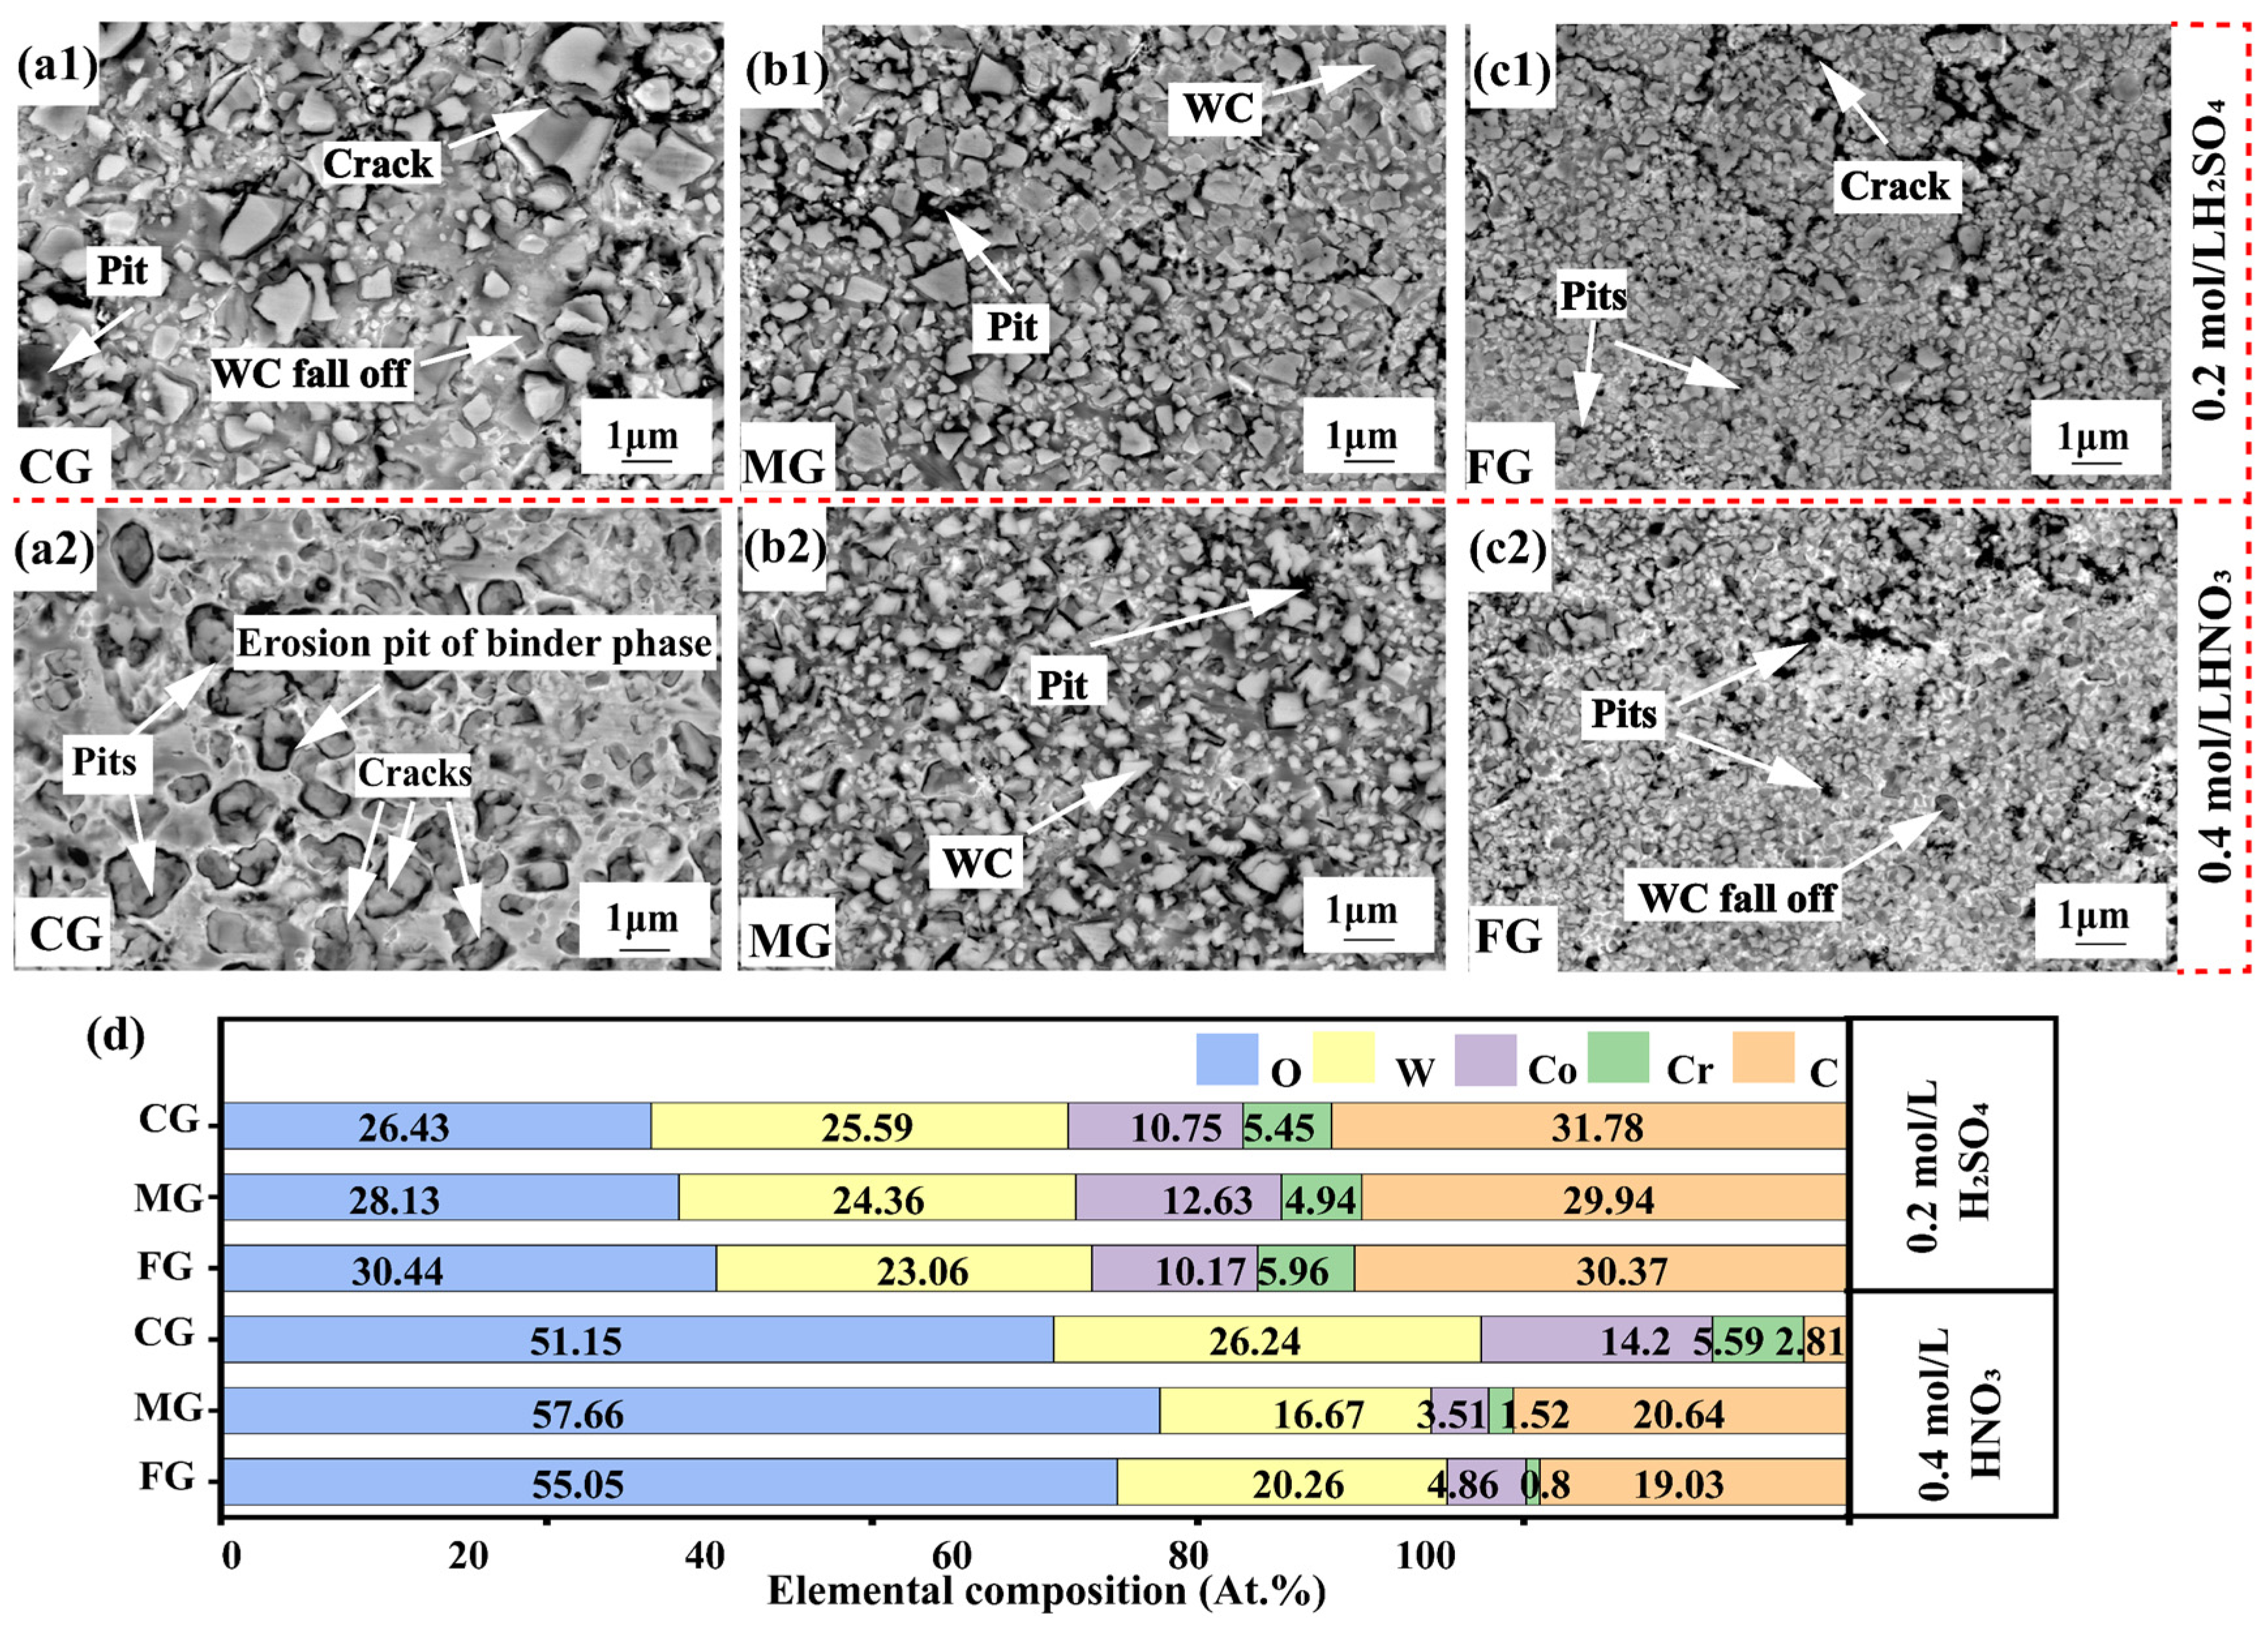
Figure 11(a1–c2) illustrate the post-corrosion surface morphologies of the three WC-10Co-4Cr coatings. Most of the WC hard phases are surrounded by a dark halo, which originates from the preferential dissolution of the CoCr binder phase at the immediate periphery of the WC particles. This phenomenon is triggered by the galvanic corrosion between WC and the CoCr binder phase under an applied voltage/current: Co undergoes selective dissolution due to its lower corrosion potential, especially at the WC/CoCr interface. The continuous dissolution of the binder phase ultimately leads to the detachment of WC particles, forming characteristic pits.
Research indicates that the addition of Cr significantly enhances corrosion resistance through a threefold synergistic mechanism, including ① forming a denser Co-Cr binder phase, ② generating a protective Cr2O3 oxide film in situ during the corrosion process, and ③ leveraging Cr’s own passivation ability to protect the binder phase from dissolution. This is supported by the EDS analysis as shown in Figure 11d, where the increased O content and decreased Co content within the corroded areas indicate electrochemical dissolution of Co [36].
Grain size impacts the coating defect density and thus has a decisive influence on the degree of corrosion. MG exhibits a few shallow surface pits and microcracks. CG shows a high-density network of pits, and FG displays extensive microcrack propagation. This corrosion pattern is consistent with the Tafel polarization and Nyquist analysis results. The superior corrosion resistance of MG benefits from the fewer pores and compact microstructure during manufacturing. CG forms more pores due to the larger intergranular spacing, while the FG coating develops microcracks influenced by residual stress. These structural defects provide preferential pathways for the penetration of corrosive media. Within the acidic media, the leaching of Co2+ and Cr3+ destabilizes the passive film structure. When the amount of binder phase dissolution exceeds a critical value, it triggers the detachment of WC particles, forming characteristic pit structures. The pits in Figure 7 are formed when the binder phase dissolves to a certain extent and can no longer encapsulate the WC particles, eventually causing the detachment of these particles.

3.3.4. Mechanism of Electrochemical Corrosion

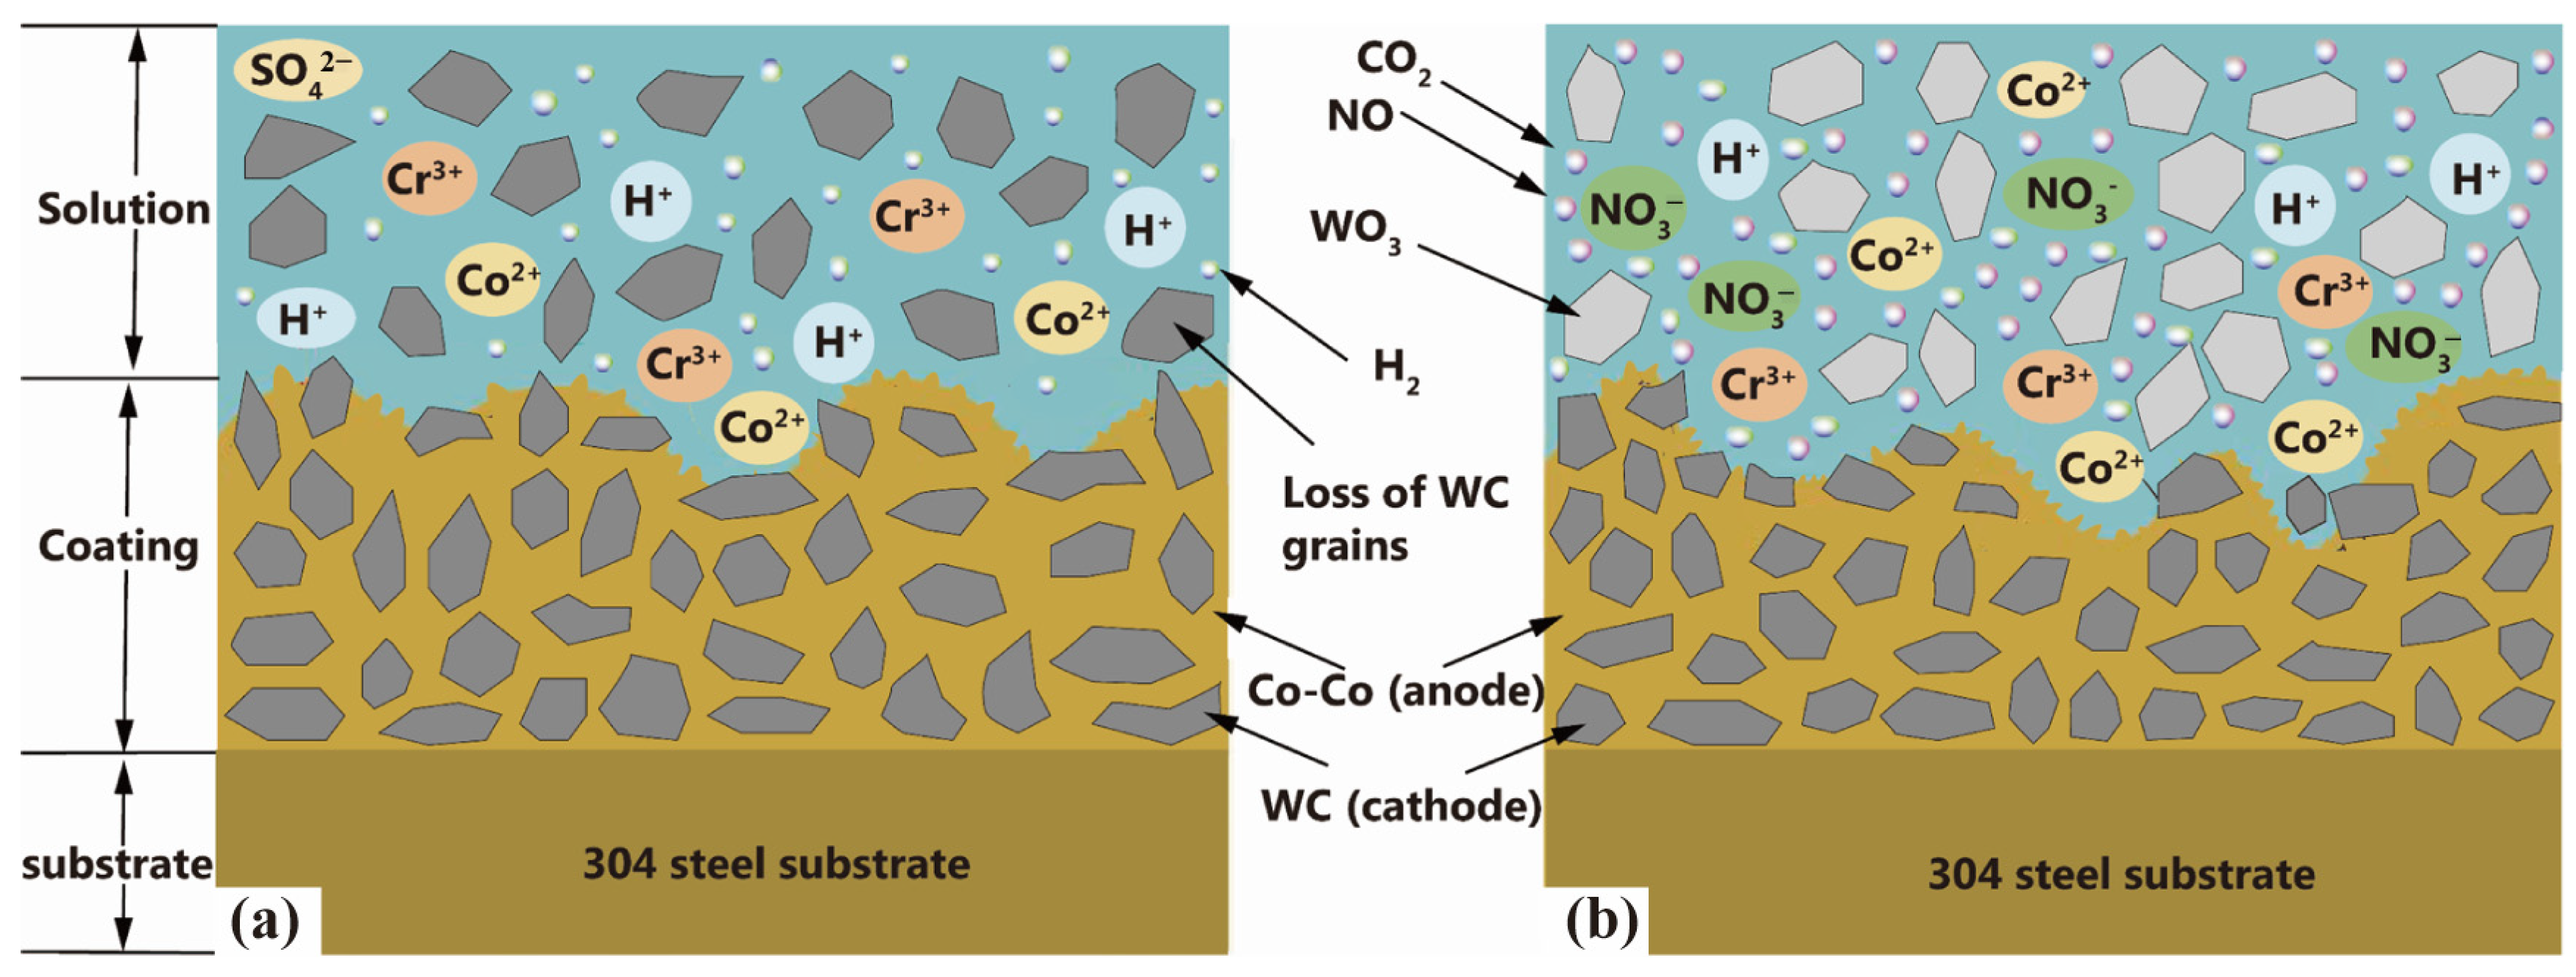
The above results indicate that the MG coating exhibits the best corrosion resistance in both 0.2 mol/L H2SO4 and 0.4 mol/L HNO3 solutions, followed by the FG coating, with the CG coating showing the poorest performance. The corrosion resistance of the coatings is significantly correlated with microstructural defects (pores, cracks, and binder phase composition and proportion), and the different oxidizing nature of the acids results in different corrosion mechanisms and corrosion products. Figure 12 presents the schematic view of the corrosion models of the three coatings in the two acidic environments. The CG coating, with its large WC grain size, has wider grain boundaries and more pores, allowing the corrosive solution to penetrate rapidly and accelerate the corrosion in both acid solutions. The FG coating, with the smallest grain size and a relatively high porosity, provides rapid penetration pathways for H+ and SO42− through surface pores and interlayer cracks in 0.2 mol/L H2SO4, accelerating the anodic dissolution reaction of Co in the binder phase.
Since H2SO4 has a relatively weak oxidation ability towards WC, the initial corrosion is primarily characterized by the dissolution of the Co phase. The fine WC particles, having insufficient pinning depth, are prone to detachment from the substrate after the Co phase is corroded. This leads to surface roughening and the exposure of new active areas, further promoting the hydrogen evolution reaction [19,30].
2 H + + 2 e H 2
High porosity and interconnected pores allow the corrosive medium to penetrate rapidly into the coating, establishing an autocatalytic cycle that ultimately triggers synergistic uniform corrosion and particle detachment. In CG and FG coatings, coarse pores and non-uniform WC distribution create local WC-rich cathodes and adjacent CoCr binder anodes; the resulting potential difference drives micro-galvanic cells in which the Co anode is forced to supply more electrons and dissolves preferentially, so the more WC particles agglomerate, the more severe the corrosion. By contrast, the MG coating’s low porosity and uniformly dispersed WC produce a relatively homogeneous potential field, markedly weakening micro-galvanic effects and yielding only mild attack. In addition, the in situ Cr2O3 passive film, though only marginally stable in nitric acid, still partly suppresses anodic dissolution and further reduces the corrosion rate. In the HNO3 environment, the strong oxidizing nature of HNO3 fundamentally alters the corrosion mechanism. Nitrate ions (NO3) directly participate in the cathodic reduction reaction (Equation (7)), accelerating the oxidative dissolution of Co and Cr through the following equations [19,30]:
Cathode :   N O 3 + 4 H + + 3 e N O +   2 H 2 O
Anode :   C o C o 3 + + 3 e ;   C r C r 3 + + 3 e
For the FG coating, the high porosity allows HNO3 to penetrate rapidly. The detached WC particles are instantaneously oxidized (Equation (9)) [19,30], forming porous WO3 and gaseous products, which trigger layer-by-layer spalling and pitting. The interlayer cracks serve as preferential pathways for the longitudinal diffusion of nitric acid, leading to delamination.
W C + 10 H N O 3 W O 3 + C O 2 +   10 N O 2 +   5 H 2 O
However, the strong oxidizing nature of HNO3 diminishes this advantage. Once the corrosive medium penetrates through local defects, the galvanic corrosion at the WC/CoCr interface is intensified. Meanwhile, the oxidation of WC to WO3 weakens the mechanical support, ultimately leading to structural collapse—a phenomenon particularly pronounced in layered coatings, where corrosion propagates along interlayer weak zones to form a “sandwich-like” corrosion morphology.

4. Conclusions

The main conclusions of this study are summarized as follows:
(1)
WC grain size influences the microstructure and corrosion resistance of HVAF-sprayed WC-10Co-4Cr coatings. Among the three coatings studied, the MG coating (average WC grain size of 0.77 μm) achieves the highest corrosion resistance.
(2)
The corrosion resistance of HVAF-sprayed WC-10Co-4Cr coatings is synergistically controlled by WC grain size and microstructural defect density. In both 0.2 mol/L H2SO4 and 0.4 mol/L HNO3 media, corrosion initiates through preferential anodic dissolution of Co in the CoCr binder phase driven by micro-galvanic coupling with the WC hard phase, followed by progressive WC particle detachment and pit formation. The CG coating exhibits the worst corrosion resistance owing to its wide grain boundaries and high porosity, while the FG coating is similarly compromised by slightly higher porosity and residual stress-induced microcrack networks that facilitate electrolyte penetration.
(3)
Electrochemical measurements confirm that the MG coating exhibits the most noble corrosion potential, the lowest corrosion current density, and the highest total polarization resistance. These features are attributable to its compact microstructure and uniform binder phase distribution, which suppress micro-galvanic activity and promote a more homogeneous passive film. EIS analysis further reveals that the MG coating has the lowest equivalent capacitance and the highest charge transfer resistance, indicating more effective inhibition of charge-carrier transport across the coating–electrolyte interface.
(4)
The two acidic environments impose distinct corrosion mechanisms. In 0.2 mol/L H2SO4, corrosion proceeds primarily by selective Co dissolution and H2 evolution, with limited oxidation of the WC phase. In 0.4 mol/L HNO3, the strong oxidizing nature of NO3 accelerates both binder dissolution and direct WC oxidation, generating WO3·0.75H2O corrosion product. This oxide layer partially retards further diffusion of corrosive species but also weakens mechanical support, eventually leading to WC particle detachment and pitting.
The results of this study provide a valuable reference for HVAF-sprayed WC-10Co-4Cr coatings used in typical industrial acidic environments. To better understand the coating performance under actual service conditions, further investigations should focus on the dynamic corrosion or wear–corrosion synergistic behavior of this coating material. Moreover, long-term immersion or field service evaluation experiments are necessary to validate the coating’s long-term durability in real-world environments.

Author Contributions

Y.C.: Writing—review and editing, Writing—original draft, Methodology, Investigation, and Formal analysis. W.W.: Writing—review and editing, Validation, Supervision, Funding acquisition, and Conceptualization. M.L.: Writing—review and editing, Formal analysis, Supervision, and Funding acquisition. S.X.: Investigation and Formal analysis. W.L.: Methodology, Investigation, and Formal analysis. J.S.: Supervision and Funding acquisition. K.F.: Writing—review and editing and Methodology. All authors have read and agreed to the published version of the manuscript.

Funding

This research was funded by National Magnetic Confinement Fusion Program of China (2024YFE03260100), National Natural Science Foundation of China (12305307), Chengdu Science and Technology Project (2025-YF08-00207-GX), Sichuan Science and Technology Program (2023YFG0078). National Natural Science Foundation of China (12275224).

Data Availability Statement

The original contributions presented in this study are included in the article. Further inquiries can be directed to the corresponding authors.

Conflicts of Interest

The authors declare no conflicts of interest.

Abbreviations

The following abbreviations are used in this manuscript:
HVAFHigh-velocity air-fuel
HVOFHigh-velocity oxygen-fuel

References

  1. Ludwig, G.A.; Malfatti, C.F.; Schroeder, R.M.; Ferrari, V.Z.; Muller, I.L. WC10Co4Cr coatings deposited by HVOF on martensitic stainless steel for use in hydraulic turbines: Resistance to corrosion and slurry erosion. Surf. Coat. Technol. 2019, 377, 124918. [Google Scholar] [CrossRef]
  2. Zhou, Y.; Liu, X.; Kang, J.; Yue, W.; Qin, W.; Ma, G.; Fu, Z.; Zhu, L.; She, D.; Wang, H.; et al. Corrosion behavior of HVOF sprayed WC-10Co4Cr coatings in the simulated seawater drilling fluid under the high pressure. Eng. Fail. Anal. 2020, 109, 104338. [Google Scholar] [CrossRef]
  3. Wang, Q.; Zhang, S.; Cheng, Y.; Xiang, J.; Zhao, X.; Yang, G. Wear and corrosion performance of WC-10Co4Cr coatings deposited by different HVOF and HVAF spraying processes. Surf. Coat. Technol. 2013, 218, 127–136. [Google Scholar] [CrossRef]
  4. Jafari, M.; Enayati, M.H.; Salehi, M.; Nahvi, S.M.; Park, C.G. Comparison between oxidation kinetics of HVOF sprayed WC–12Co and WC–10Co–4Cr coatings. Int. J. Refract. Met. Hard Mater. 2013, 41, 78–84. [Google Scholar] [CrossRef]
  5. Picas, J.A.; Rupérez, E.; Punset, M.; Forn, A. Influence of HVOF spraying parameters on the corrosion resistance of WC–CoCr coatings in strong acidic environment. Surf. Coat. Technol. 2013, 225, 47–57. [Google Scholar] [CrossRef]
  6. Qian, C.; Liu, Q.; Li, K.; Ma, L.; Cai, Z. Electrochemical corrosion behavior variation of WC-10Co4Cr coating subjected to different magnetic treatments and its mechanism. Corros. Sci. 2024, 229, 111883. [Google Scholar] [CrossRef]
  7. Picas, J.A.; Punset, M.; Baile, M.T.; Martín, E.; Forn, A. Properties of WC-CoCr Based Coatings Deposited by Different HVOF Thermal Spray Processes. Plasma Process. Polym. 2009, 6, S948–S953. [Google Scholar] [CrossRef]
  8. Owoseni, T.A.; Gupta, M.; Joshi, S.V.; Ingmar, M.; Varis, T. Wear and Corrosion of HVAF and HVOF-Sprayed WC-CoCr Coatings on Aluminum Alloy. J. Therm. Spray Technol. 2025, 34, 970–991. [Google Scholar] [CrossRef]
  9. Lakshmi, D.V.; Babu, P.S.; Wasekar, N.P.; Sivakumar, G.; Prasad, M.J.N.V. Electrochemical corrosion behavior of thin and thick WC-10Co-4Cr coatings deposited by HVAF thermal spray technique. Surf. Coat. Technol. 2025, 511, 132318. [Google Scholar] [CrossRef]
  10. Katiyar, P.K.; Randhawa, N.S. Corrosion behavior of WC-Co tool bits in simulated (concrete, soil, and mine) solutions with and without chloride additions. Int. J. Refract. Met. Hard Mater. 2019, 85, 105062. [Google Scholar] [CrossRef]
  11. Souza, V.A.D.; Neville, A. Corrosion and synergy in a WCCoCr HVOF thermal spray coating—Understanding their role in erosion–corrosion degradation. Wear 2005, 259, 171–180. [Google Scholar] [CrossRef]
  12. Yi, D.; Chen, L.; Liu, H.; Wang, B.; Nie, C. Research Progress on Electrochemical Corrosion Behaviour of Cemented Carbide. Cem. Carbides 2012, 29, 238–253. [Google Scholar] [CrossRef]
  13. Hu, K.; Liu, X.; Zhang, S.; Xue, Z.; Yang, Y.; Yang, K. Tribocorrosion behavior of HVOF sprayed WC-based cermet coatings in sodium chloride solution environment in relation to binder phases. Surf. Coat. Technol. 2022, 435, 128248. [Google Scholar] [CrossRef]
  14. Perry, J.M.; Neville, A.; Wilson, V.A.; Hodgkiess, T. Assessment of the corrosion rates and mechanisms of a WC–Co–Cr HVOF coating in static and liquid–solid impingement saline environments. Surf. Coat. Technol. 2001, 137, 43–51. [Google Scholar] [CrossRef]
  15. Jin, P.; Kong, D.; Wei, X.; Yin, C. Research on Corrosion Behavior of WC Based Cemented Carbide in Alkaline Solution. Cem. Carbides 2018, 35, 403–410. [Google Scholar] [CrossRef]
  16. Ali, N.; Fulazzaky, M.A. The empirical prediction of weight change and corrosion rate of low-carbon steel. Heliyon 2020, 6, e05050. [Google Scholar] [CrossRef]
  17. Sherif, E.-S.M.; El Rayes, M.M.; Abdo, H.S. WC-Co and WC-Co-Cr Coatings for the Protection of API Pipeline Steel from Corrosion in 4% NaCl Solution. Coatings 2020, 10, 275. [Google Scholar] [CrossRef]
  18. Zuo, X. Effect of WC Size on the Performances of WC-10Co-4Crcoatings by HVOF. Master’s Thesis, Central South University, Changsha, China, 2014. [Google Scholar]
  19. Wang, H.; Lu, H.; Song, X.; Yan, X.; Liu, X.; Nie, Z. Corrosion resistance enhancement of WC cermet coating by carbides alloying. Corros. Sci. 2019, 147, 372–383. [Google Scholar] [CrossRef]
  20. Wang, Y.; Hu, C.; Wang, Y.; Fang, H.; Li, J.; Yu, J. Tribocorrosion behaviors of WC-10Co-4Cr, WC-20Cr3C2-7Ni, and Cr3C2-25NiCr cermet coatings fabricated by HVAF thermal spraying. Tribol. Int. 2025, 211, 110900. [Google Scholar] [CrossRef]
  21. He, M.; Ouyang, Z.; Zhong, Q.; Zhang, J.; Li, Z.; Ye, J. Enhancement of Mechanical Properties and Corrosion Resistance of Dual-Scale Structured WC-10Co Cemented Carbides via Cr-N Dual-Functional Regulation. Metals 2026, 16, 447. [Google Scholar] [CrossRef]
  22. Tomlinson, W.J.; Ayerst, N.J. Anodic polarization and corrosion of WC-Co hardmetals containing small amounts of Cr3C2 and/or VC. J. Mater. Sci. 1989, 24, 2348–2352. [Google Scholar] [CrossRef]
  23. Su, W.; Xie, R.; Luo, W.; Tang, X.; Zhu, R. Enhanced the mechanical properties and corrosion resistance of ultra-coarse grain WC-8Co cemented carbides by the introduction of Cu and Ni. Mater. Lett. 2025, 378, 137567. [Google Scholar] [CrossRef]
  24. Kellner, F.J.J.; Hildebrand, H.; Virtanen, S. Effect of WC grain size on the corrosion behavior of WC–Co based hardmetals in alkaline solutions. Int. J. Refract. Met. Hard Mater. 2009, 27, 806–812. [Google Scholar] [CrossRef]
  25. Zhang, X.; Zhang, S.; Yang, C.; Sun, Z.; Ding, J. Corrosion resistance of pressure/pressureless sintered cemented carbides with/without graphene oxide in NaOH solution. Int. J. Refract. Met. Hard Mater. 2024, 125, 106908. [Google Scholar] [CrossRef]
  26. Human, A.M.; Exner, H.E. Electrochemical behaviour of tungsten-carbide hardmetals. Mater. Sci. Eng. A 1996, 209, 180–191. [Google Scholar] [CrossRef]
  27. Human, A.M.; Exner, H.E. The relationship between electrochemical behaviour and in-service corrosion of WC based cemented carbides. Int. J. Refract. Met. Hard Mater. 1997, 15, 65–71. [Google Scholar] [CrossRef]
  28. Schubert, W.D.; Neumeister, H.; Kinger, G.; Lux, B. Hardness to toughness relationship of fine-grained WC-Co hardmetals. Int. J. Refract. Met. Hard Mater. 1998, 16, 133–142. [Google Scholar] [CrossRef]
  29. GB/T 8642-2025; Thermal Spraying—Determination of Tensile Adhesive Strength. Standardization Administration of China: Beijing, China, 2025.
  30. Wan, W.; Xiong, J.; Yang, M.; Guo, Z.; Dong, G.; Yi, C. Effects of Cr3C2 addition on the corrosion behavior of Ti(C, N)-based cermets. Int. J. Refract. Met. Hard Mater. 2012, 31, 179–186. [Google Scholar] [CrossRef]
  31. Kresse, T.; Meinhard, D.; Bernthaler, T.; Schneider, G. Hardness of WC-Co hard metals: Preparation, quantitative microstructure analysis, structure-property relationship and modelling. Int. J. Refract. Met. Hard Mater. 2018, 75, 287–293. [Google Scholar] [CrossRef]
  32. Wang, J.; Jiang, H.; Chang, X.; Zhang, L.; Wang, H.; Zhu, L.; Qin, S. Effect of Cu content on the microstructure and corrosion resistance of AlCrFeNi3Cux high entropy alloys. Corros. Sci. 2023, 221, 111313. [Google Scholar] [CrossRef]
  33. Toorani, M.; Aliofkhazraei, M.; Golabadi, M.; Rouhaghdam, A.S. Effect of lanthanum nitrate on the microstructure and electrochemical behavior of PEO coatings on AZ31 Mg alloy. J. Alloys Compd. 2017, 719, 242–255. [Google Scholar] [CrossRef]
  34. Saenger, R.; Martin, D.; Gabrielli, C. Electrochemical characterization of plasma sprayed WC–Co coatings by impedance techniques. Surf. Coat. Technol. 2005, 194, 335–343. [Google Scholar] [CrossRef]
  35. Nichul, U.; Hiwarkar, V. Carbon dot complimentary green corrosion inhibitor for crystallographically textured beta C titanium alloy for marine application: A state of art. J. Alloys Compd. 2023, 962, 171116. [Google Scholar] [CrossRef]
  36. Messner, M.; Walczyk, D.J.; Palazzo, B.G.; Norris, Z.A.; Taylor, G.; Carroll, J.; Pham, T.X.; Hettinger, J.D.; Yu, L. Electrochemical oxidation of metal carbides in aqueous solutions. J. Electrochem. Soc. 2018, 165, H3107–H3114. [Google Scholar] [CrossRef]
Figure 1. SEM morphologies of the WC-10Co-4Cr powders with various WC particle sizes and their spherical particle size distribution: CG (a1a3); MG (b1b3); FG (c1c3).
Materials 19 02343 g001
Figure 2. Schematic illustration of the electrochemical corrosion test setup.
Materials 19 02343 g002
Figure 3. Cross-sectional morphologies of the WC–10Co–4Cr coatings: CG coating (a1,a2); MG coating (b1,b2); FG coating (c1,c2), the EDS analysis (d), and XRD analysis (e) of the coatings.
Materials 19 02343 g003
Figure 4. EBSD results of the WC–10Co–4Cr coatings showing crystallographic orientation, grain size distribution and phase composition: CG (a1a3); MG (b1b3); FG (c1c3).
Materials 19 02343 g004
Figure 5. Fracture morphologies of WC–10Co–4Cr coatings: CG (a1a3); MG (b1b3); FG (c1c3).
Materials 19 02343 g005
Figure 6. Mass loss of WC–10Co–4Cr coatings in (a1) 0.2 mol/L H2SO4 and (b1) 0.4 mol/L HNO3 solutions, and the three-dimensional surface morphologies after 10 days of immersion in these solutions: CG coating (a2,b2); MG coating (a3,b3); FG coating (a4,b4).
Materials 19 02343 g006
Figure 7. Surface morphologies of corroded coatings after immersion in 0.2 mol/L H2SO4 (CG (a1), MG (b1), and FG (c1) coatings, respectively) and 0.4 mol/L HNO3 solutions (CG (a2), MG (b2), and FG (c2) coatings, respectively), (d) the EDS analysis of the corroded surfaces, and (e) XRD pattern of the corrosion products.
Materials 19 02343 g007
Figure 8. XPS spectra of the coatings after immersion in 0.4 mol/L HNO3 solution: CG (a1a3); MG (b1b3); FG (c1c3).
Materials 19 02343 g008
Figure 9. OCP curves (a1,a2) and potentiodynamic polarization curves (b1,b2) of CG, MG, and FG coatings after 1 h immersion in 0.2 mol/L H2SO4 and 0.4 mol/L HNO3 solutions.
Materials 19 02343 g009
Figure 10. Nyquist and Bode plots of the three coatings in 0.2 mol/L H2SO4 (a1,b1) and 0.4 mol/L HNO3 solutions (a2,b2) and the equivalent circuit model (c).
Materials 19 02343 g010
Figure 11. Corrosion morphologies of CG (a1,a2), MG (b1,b2), and FG (c1,c2) coatings in 0.2 mol/L H2SO4 solution and 0.4 mol/L HNO3 solutions, and the EDS analysis results (d).
Materials 19 02343 g011
Figure 12. Schematic diagrams showing the corrosion mechanisms of WC-10Co-4Cr coatings in (a) 0.2 mol/L H2SO4 and (b) 0.4 mol/L HNO3.
Materials 19 02343 g012
Table 1. Parameters of the HVAF spraying process.
Atmosphere /PSIFuel Pressure
/PSI
Nitrogen Flow Rate
/Slpm
Chamber Pressure/PSISubstrate Temperature °CPowder Feed Rate
g/min
Spray Distance
mm
95832366100~150100150
Table 2. Mechanical properties of WC-10Co-4Cr coatings with different WC grain sizes.
CoatingPorosity
(%)
Bonding Strength
(MPa)
Hardness
(HV30)
Indentation Fracture Toughness
(KIC, MPa·m1/2)
CG0.9 ± 0.178 ± 1.41153 ± 8.86.9 ± 0.2
MG0.9 ± 0.179 ± 2.01195 ± 7.85.9 ± 0.2
FG1.1 ± 0.180 ± 2.01239 ± 9.65.2 ± 0.2
Table 3. Fitting parameters of potentiodynamic polarization curves.
SolutionSpecimensEcorr (V)χ2 (1 × 10⁻²) β a (mV·dec−1) β c (mV·dec−1)icorr (mA·cm2)
H2SO4CG0.15 ± 0.0082.27 ± 0.100105.10 ± 4.730251.01 ± 11.3000.03 ± 0.004
MG0.08 ± 0.0051.47 ± 0.007103.43 ± 4.650305.62 ± 13.7500.01 ± 0.002
FG0.11 ± 0.0072.00 ± 0.009110.76 ± 4.900299.91 ± 13.5000.02 ± 0.003
HNO3CG−0.35 ± 0.0125.22 ± 0.240581.50 ± 26.17074.60 ± 3.3600.10 ± 0.010
MG−0.33 ± 0.0093.36 ± 0.150559.80 ± 25.1905.90 ± 0.2700.03 ± 0.004
FG−0.35 ± 0.0113.64 ± 0.160416.40 ± 18.740−28.00 ± 1.2600.09 ± 0.009
Table 4. Fitting data of EIS for coatings tested in the 0.2 mol/L H2SO4 environment.
ParametersCGMGFG
R 0 (Ω·cm2)11.40 ± 0.52016.81 ± 0.76011.38 ± 0.051
Q 1 0 (×10−3−1 cm−2 Sn)7.63 ± 0.3403.1 ± 0.1405.83 ± 0.026
α10.68 ± 0.0280.65 ± 0.0260.64 ± 0.025
R 1 (kΩ·cm2)0.07 ± 0.0031.78 ± 0.0810.282 ± 0.013
Q 2 0 (×10−3−1 cm−2 Sn)0.17 ± 0.0034.72 ± 0.2127.10 ± 0.320
α20.95 ± 0.0300.99 ± 0.0100.99 ± 0.010
R 2 (kΩ·cm2)1.24 ± 0.0561.34 ± 0.0611.26 ± 0.057
R p (kΩ·cm2)1.26 ± 0.0573.14 ± 0.1421.56 ± 0.070
χ2 (1 × 10⁻²)0.87 ± 0.0390.33 ± 0.0150.78 ± 0.035
Table 5. Fitting data of EIS for coatings tested in the 0.4 mol/L HNO3 environment.
ParametersCGMGFG
R 0 (Ω·cm2)10.26 ± 0.46012.80 ± 0.58011.08 ± 0.500
Q 1 0 (×10−3−1 cm−2 Sn)17.81 ± 0.8006.26 ± 0.2807.91 ± 0.360
α10.98 ± 0.0040.68 ± 0.0280.66 ± 0.027
R 1 (kΩ·cm2)0.41 ± 0.0181.53 ± 0.0691.09 ± 0.049
Q 2 0 (×10−3−1 cm−2 Sn)33.61 ± 1.5102.71 ± 0.1228.06 ± 0.363
α20.99 ± 0.0100.99 ± 0.0100.99 ± 0.010
R 2 (kΩ·cm2)0.87 ± 0.0393.04 ± 0.1372.38 ± 0.107
R p (kΩ·cm2)1.28 ± 0.0584.57 ± 0.2063.47 ± 0.156
χ2 (1 × 10⁻²)0.93 ± 0.0420.61 ± 0.0270.61 ± 0.027
Disclaimer/Publisher’s Note: The statements, opinions and data contained in all publications are solely those of the individual author(s) and contributor(s) and not of MDPI and/or the editor(s). MDPI and/or the editor(s) disclaim responsibility for any injury to people or property resulting from any ideas, methods, instructions or products referred to in the content.