3.1. Microstructure and Mechanical Properties
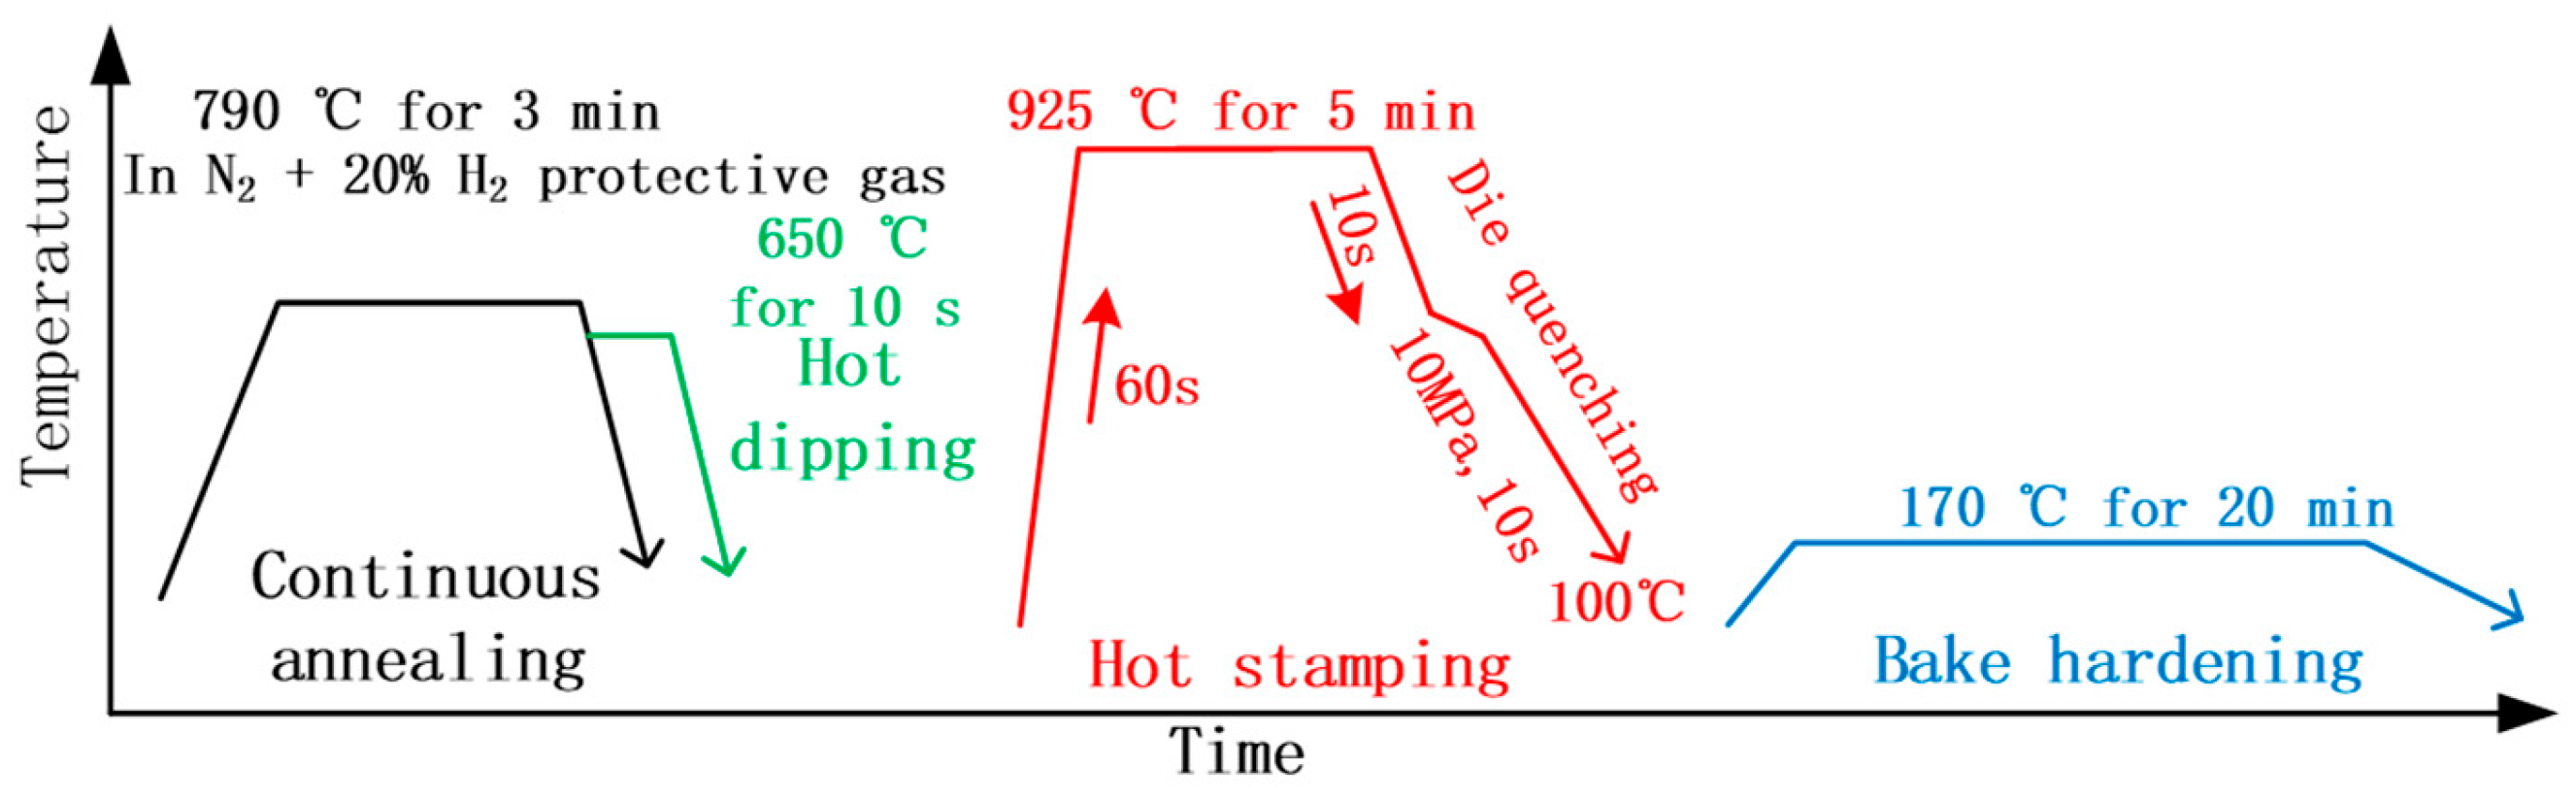
Hot dipping did not affect the phase transformation of the steel substrate, as its temperature was even lower than the continuous annealing temperature (
Figure 1). That is to say, the microstructural evolution of the steel substrate should be similar for both processes.
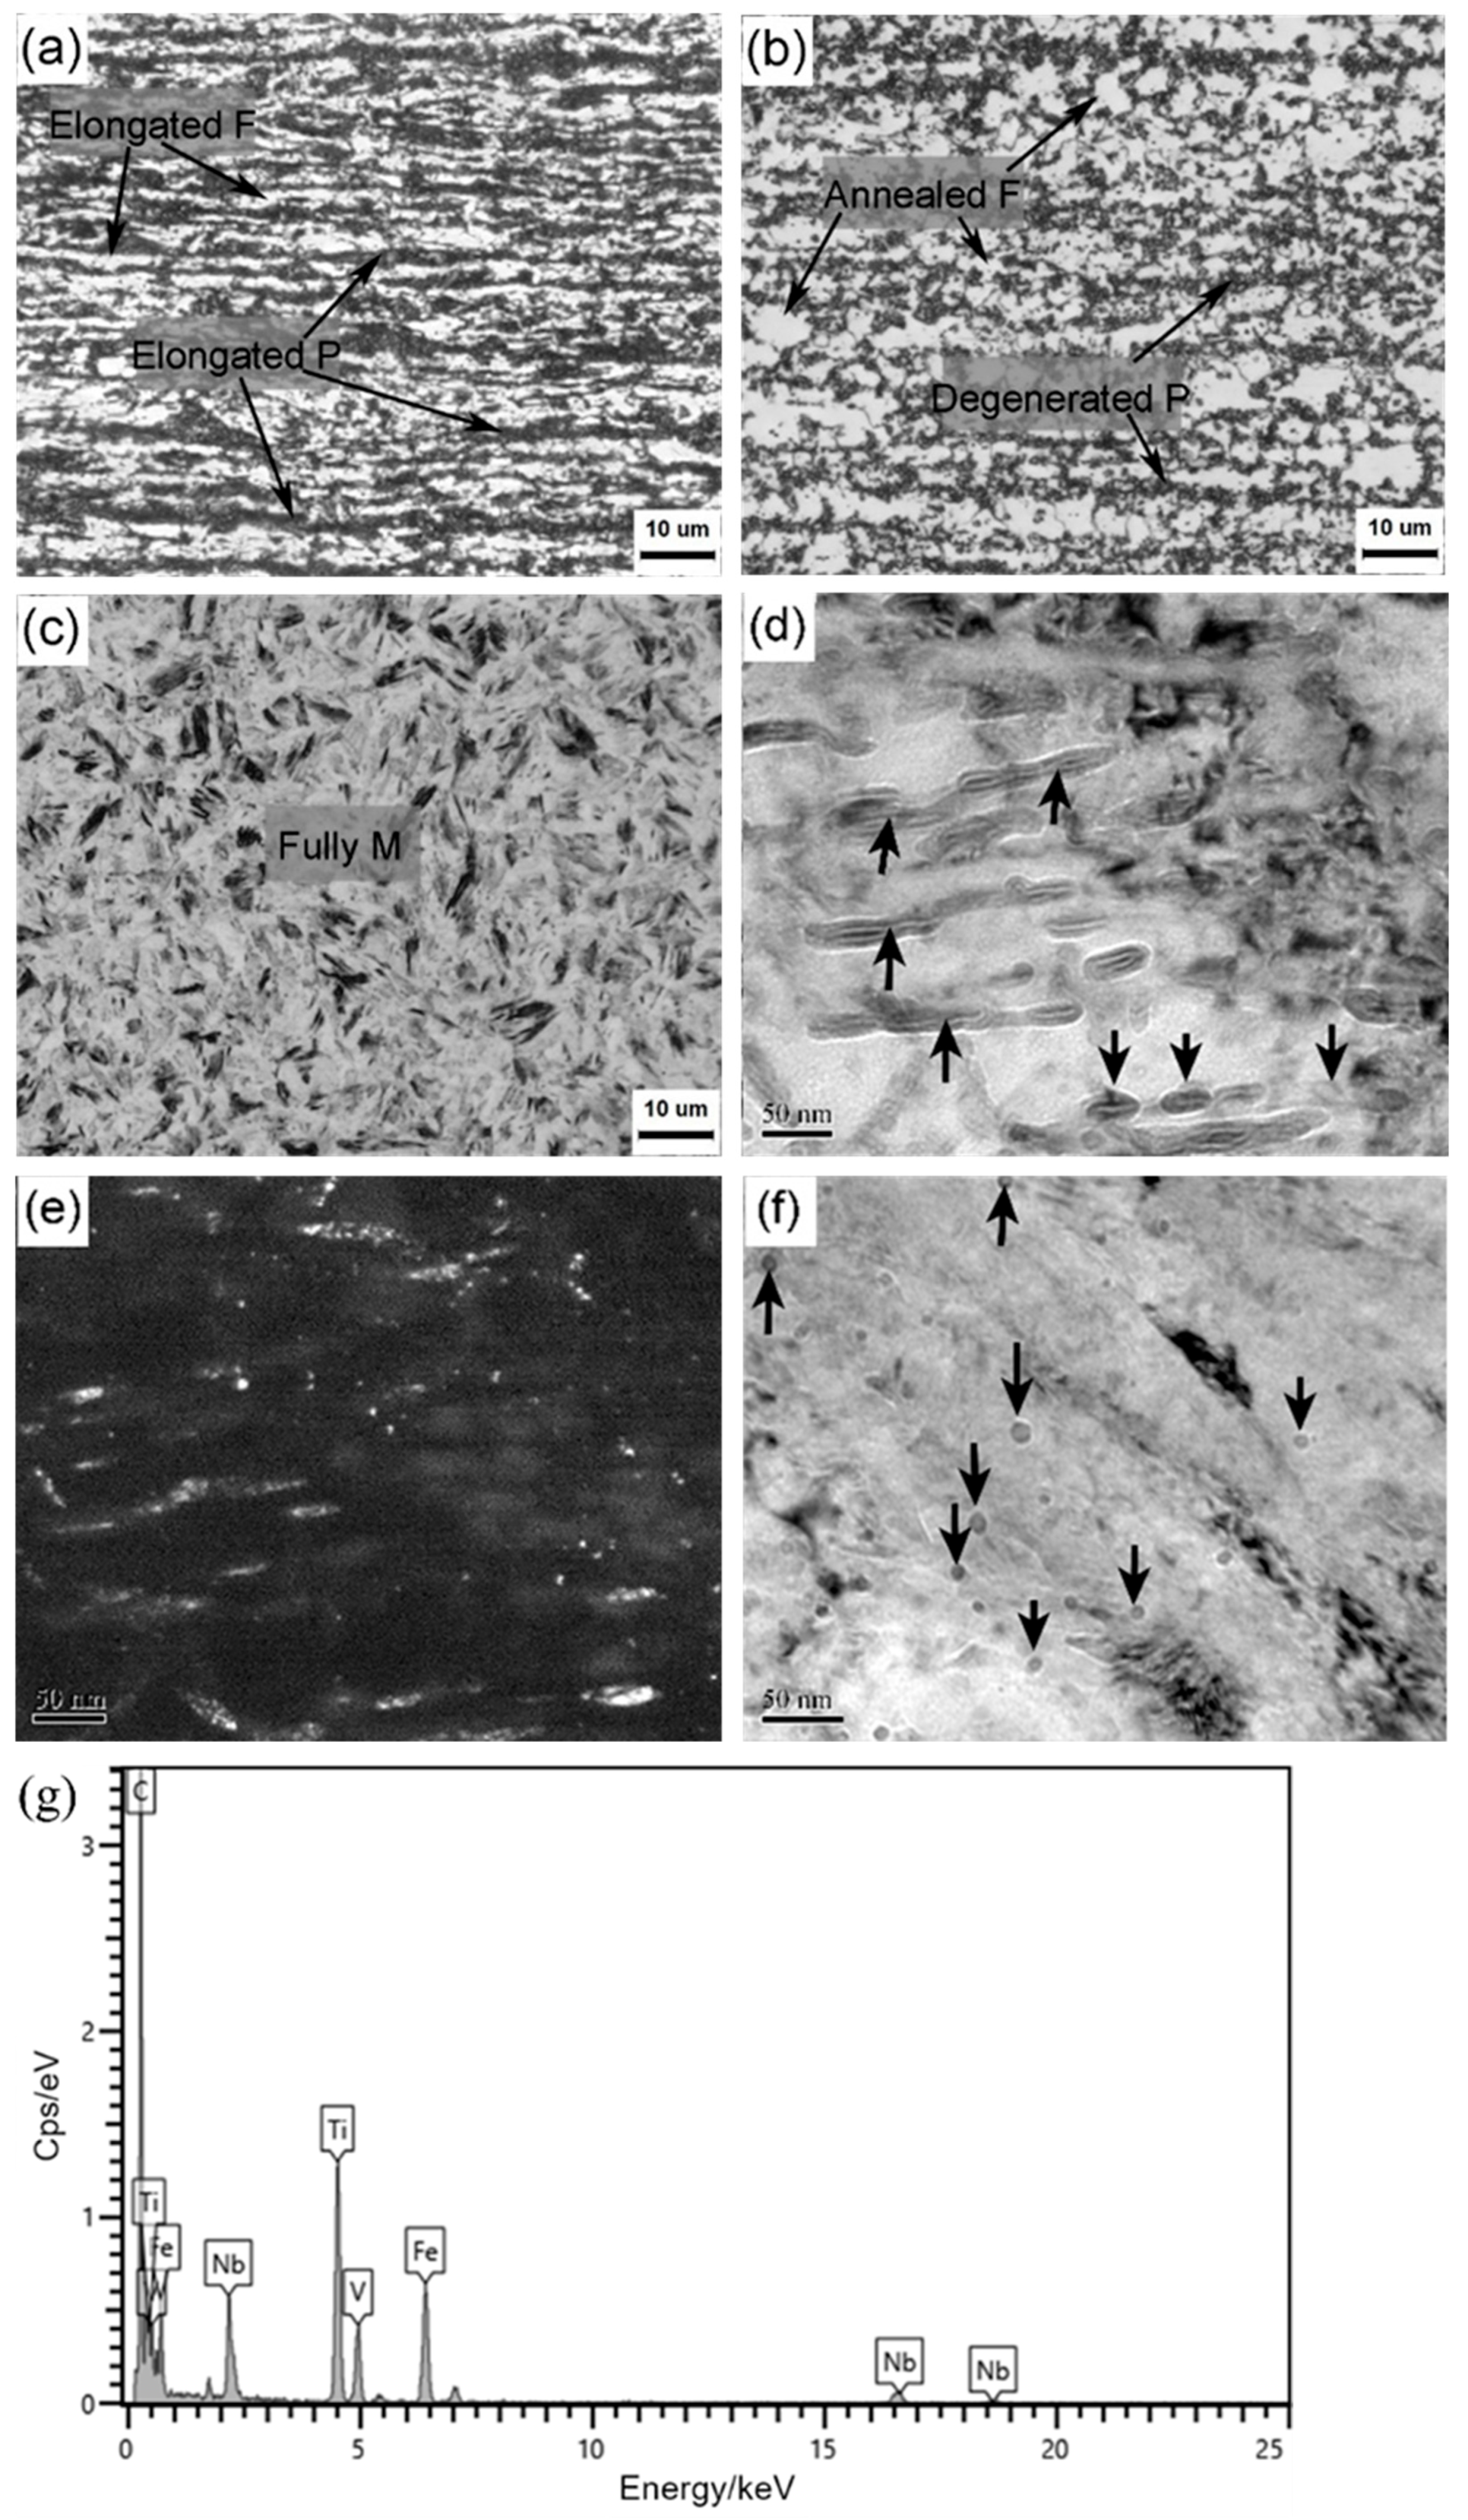
Figure 2 shows microstructure characters at different typical processing steps. The cold-rolled specimens had pancake-shaped pearlite (P) and ferrite (F) that were distributed alternatively on the cross section, and their elongation direction was parallel to the rolling direction, i.e., horizontal direction (
Figure 2a). After continuous annealing, the microstructure exhibited annealed polygonal ferrite and degenerated pearlite, as shown in
Figure 2b. This means that the deformed ferrite grains occurred to partial recrystallization behaviors, and the pearlite was degenerated into globular-like pearlite due to the annealing temperature a bit higher than the Ac1 temperature of this middle carbon steel. The full martensite (M) became the predominant microstructure after hot stamping (
Figure 2c), but it is hard to identify their intricate substructures clearly under optical microscope.
Using TEM observation, numerous carbides appeared inside the martensitic laths for the hot-stamped specimen (as arrowed in bright field image of
Figure 2d). According to our previous study [
26], the die quenching had a much lower cooling rate than the water quenching, especially below the martensite start transformation temperature (~315 °C), and the auto-tempering induced carbon redistribution and agglomeration in the carbon-supersaturated ferritic matrix, resulting in the formation of numerous short rod-like cementites in a thermodynamically stable mode [
27]. The dark field image in
Figure 2e indicates that these carbides were preferentially distributed along the specific orientation of martensitic laths, e.g., habit planes. The bake hardening did not change the overall microstructure because of the very low tempering temperature. However, besides these tempering carbides, many nano-sized precipitates were present on the martensitic matrix (arrowed in
Figure 2f). According to the EDX results (
Figure 2g), they were composed of the elements Nb, V, Ti and C, which should be originated from the upstream heat treatments, e.g., hot rolling and hot stamping. Their presence is partly responsible for the strength improvement by precipitation strengthening to achieve 2 GPa, as reported in the literature [
7,
26].
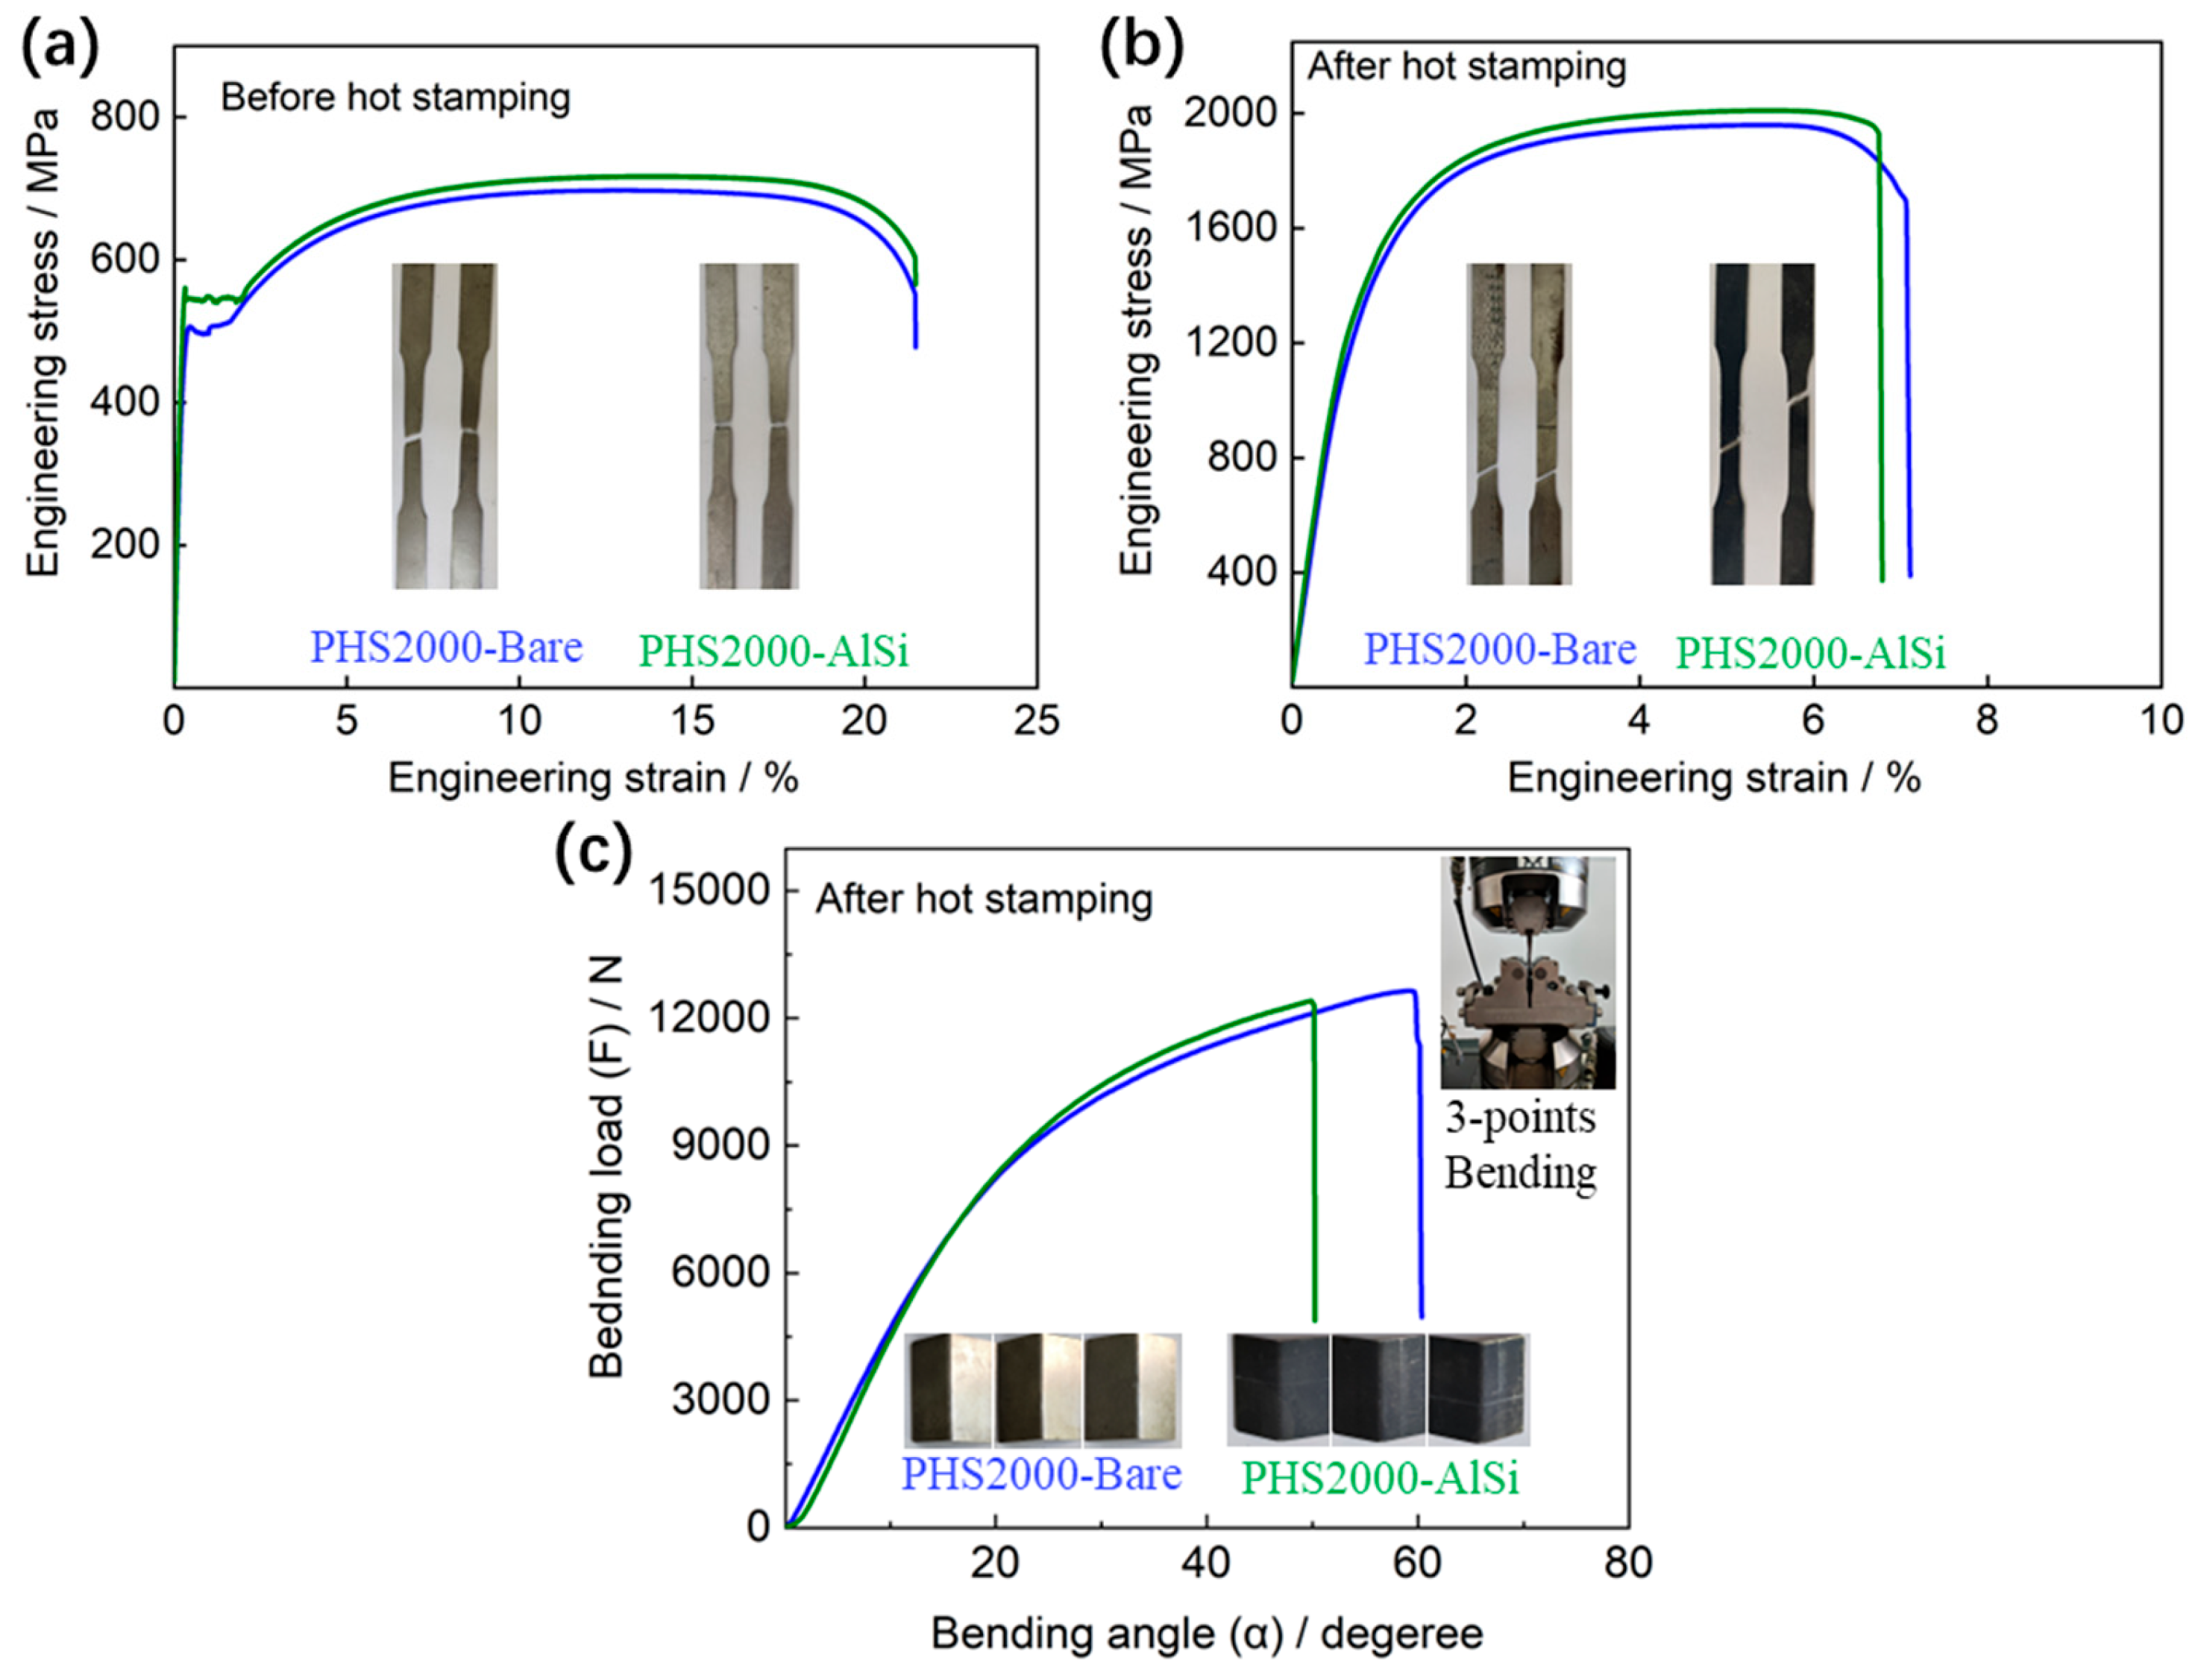
Figure 3a,b shows the engineering stress–strain curves of the investigated PHS2000-Bare and PHS2000-AlSi steels before and after the hot stamping steps. The result shows that the ultimate tensile strength and total elongation of two steels before hot stamping steps is almost the same, approximately 700 MPa. The yield strength of PHS2000-AlSi is slightly higher than that of PHS2000-Bare. After hot stamping, the ultimate tensile strength of PHS2000-Bare and PHS2000-AlSi steels is around 2000 MPa, with a total elongation of approximately 7%. The yield strengths of PHS2000-Bare and PHS2000-AlSi steels are 1395 MPa and 1428 MPa, respectively. However, the bending angle of PHS2000-Bare steel (59.1°) under the maximum bending load is greater than that of PHS2000-AlSi steel (49.8°), indicating that PHS2000-Bare steel has better toughness (
Figure 3c).
3.2. Al-Si Coating Layer
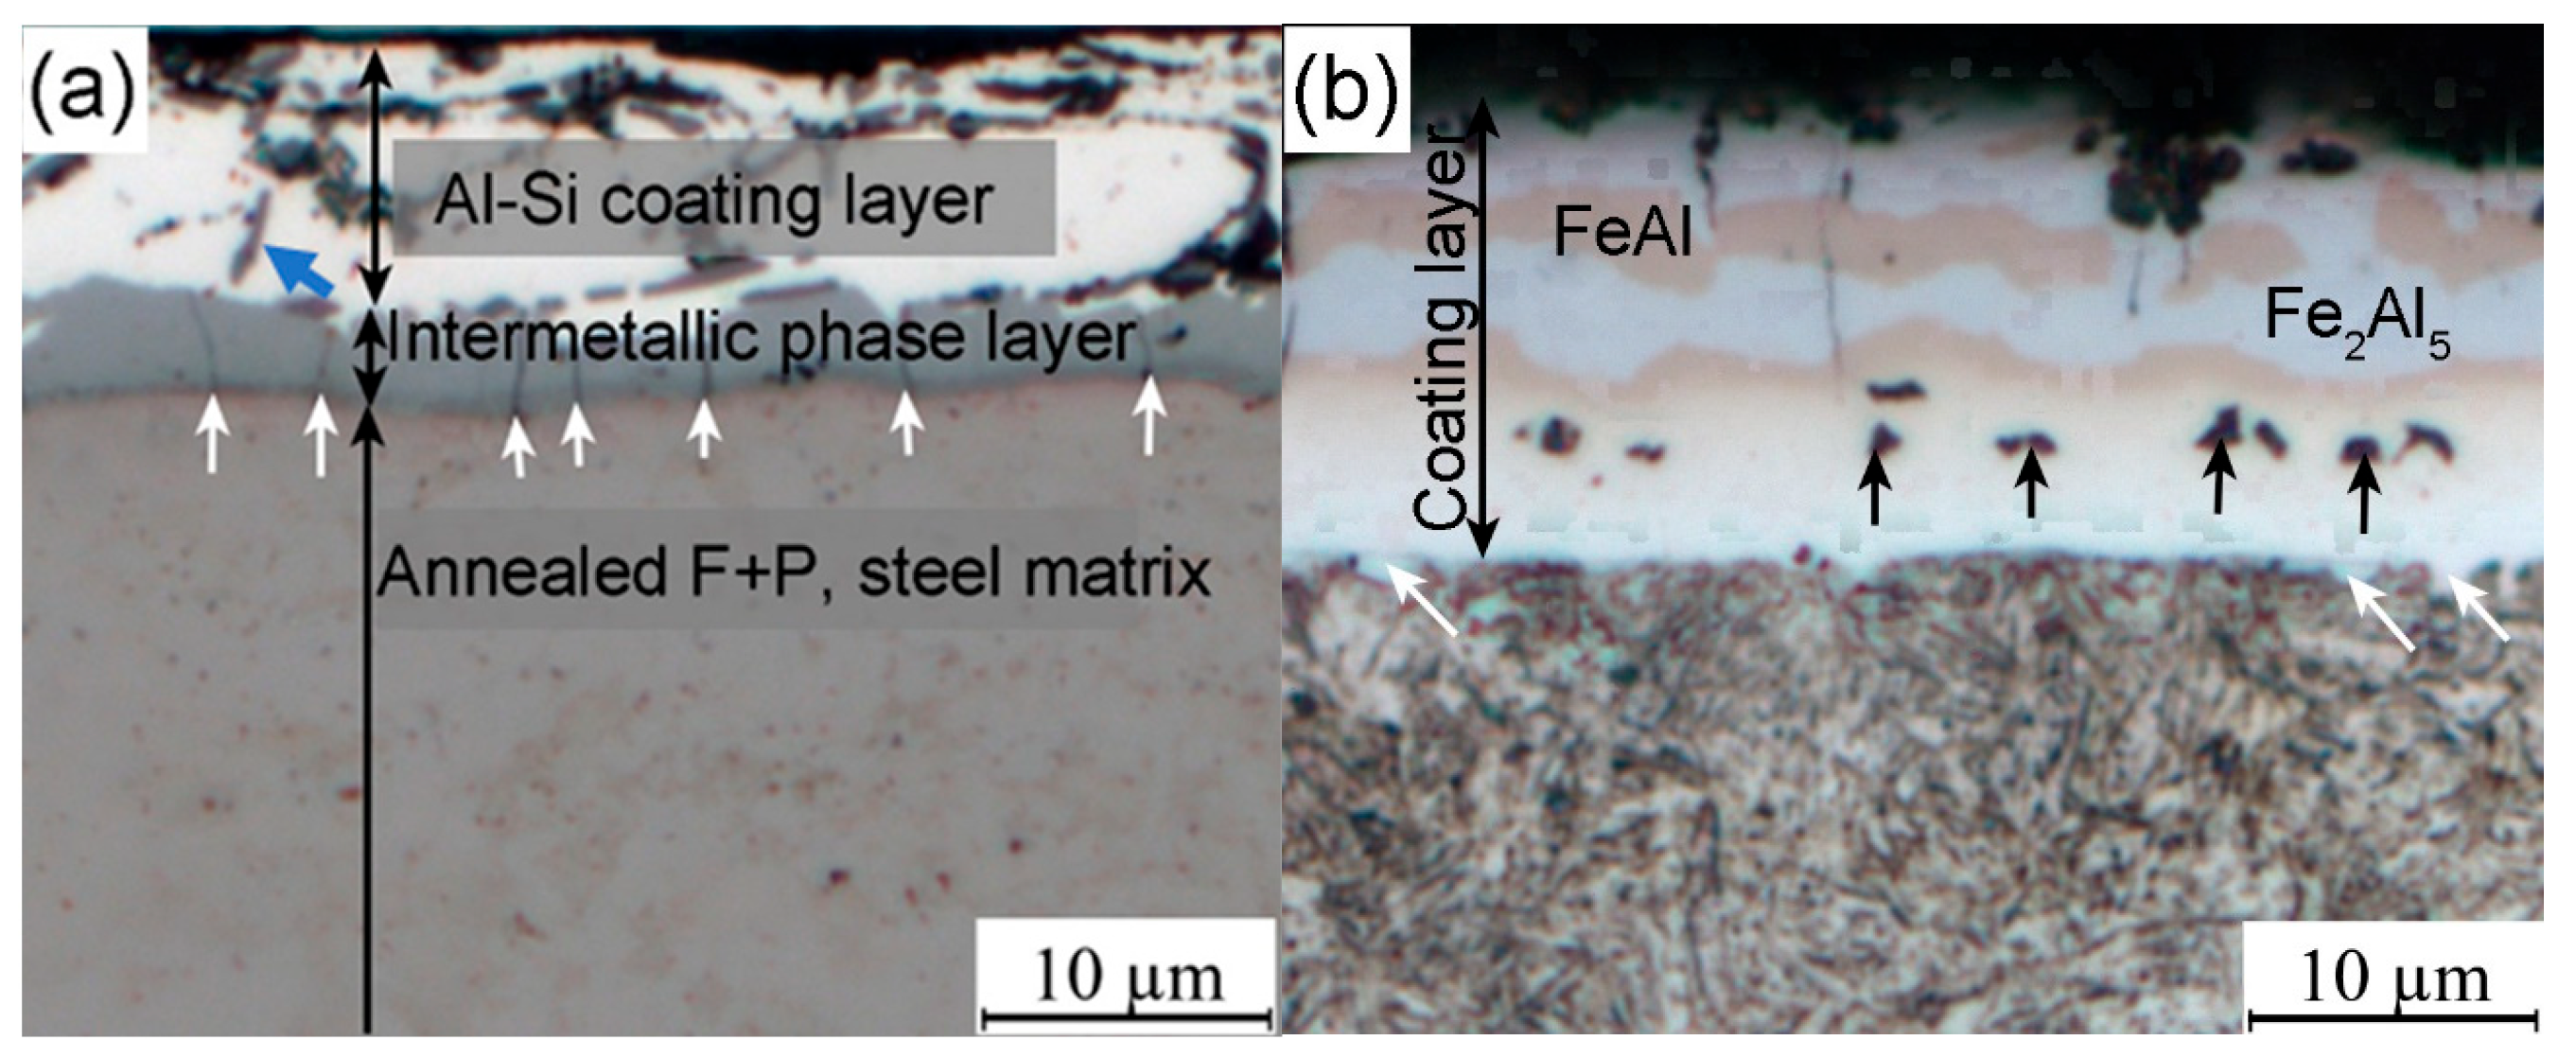
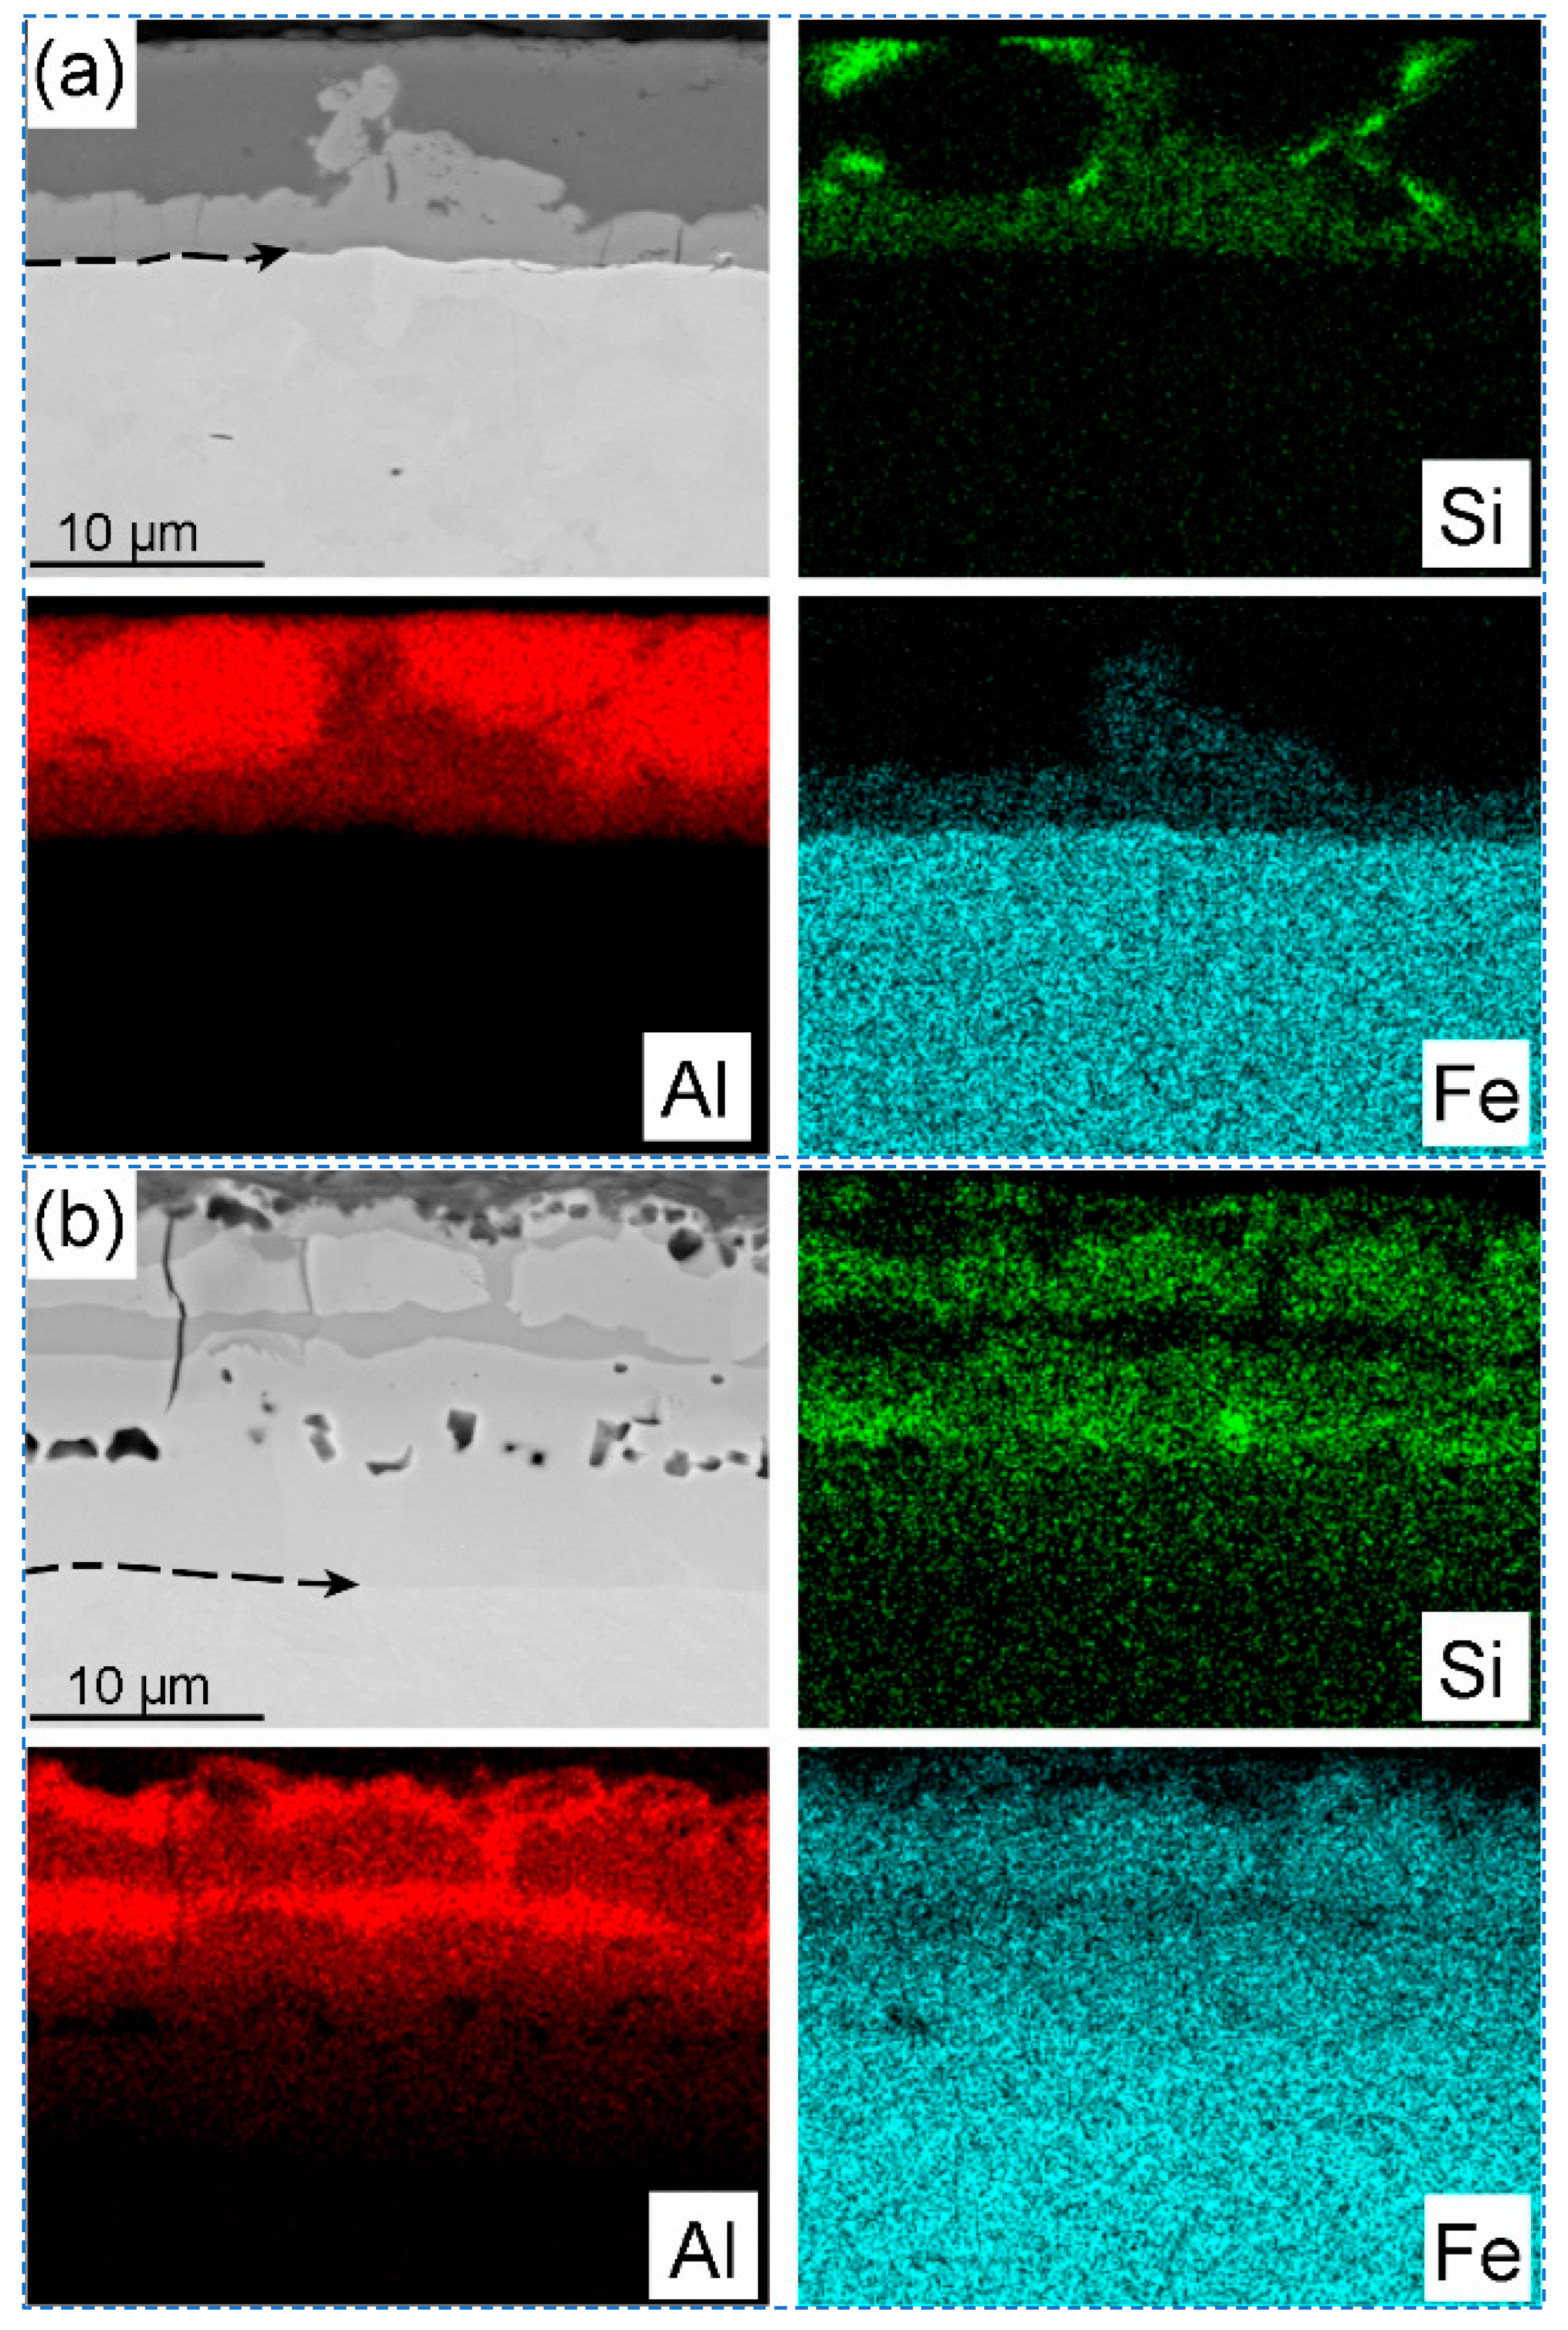
Figure 4 shows the morphology of Al-Si coating layer before and after the hot stamping, and the SEM images with EDS mapping in
Figure 5 represent the element’s distribution on the coating layer. Before the hot stamping process, the coating layer thickness of the hot-dipped samples was 10~14 μm, which actually includes two distinct sublayers (
Figure 4a and
Figure 5a). The outer layer was the solidification of the liquid Al-Si coating, which comprises irregular-shaped black phase and white matrix phase (
Figure 4a). Based on the elements mapping, these randomly distributed black particles are high-Si phase (marked by blue arrow in
Figure 4a) [
28], while the matrix phase should be a hypoeutectic Al-Si composition. By contrast, the inner gray layer is directly attached to the steel substrate, and the thickness ranges from 2.5 to 6 μm, with the irregular interface front adjacent to the Al-based melt (
Figure 4a). This layer is obvious on the SEM image (
Figure 5a) and has clear boundaries compared to the steel substrate and Al-based coating because of the atomic contrast difference. The arrow line in
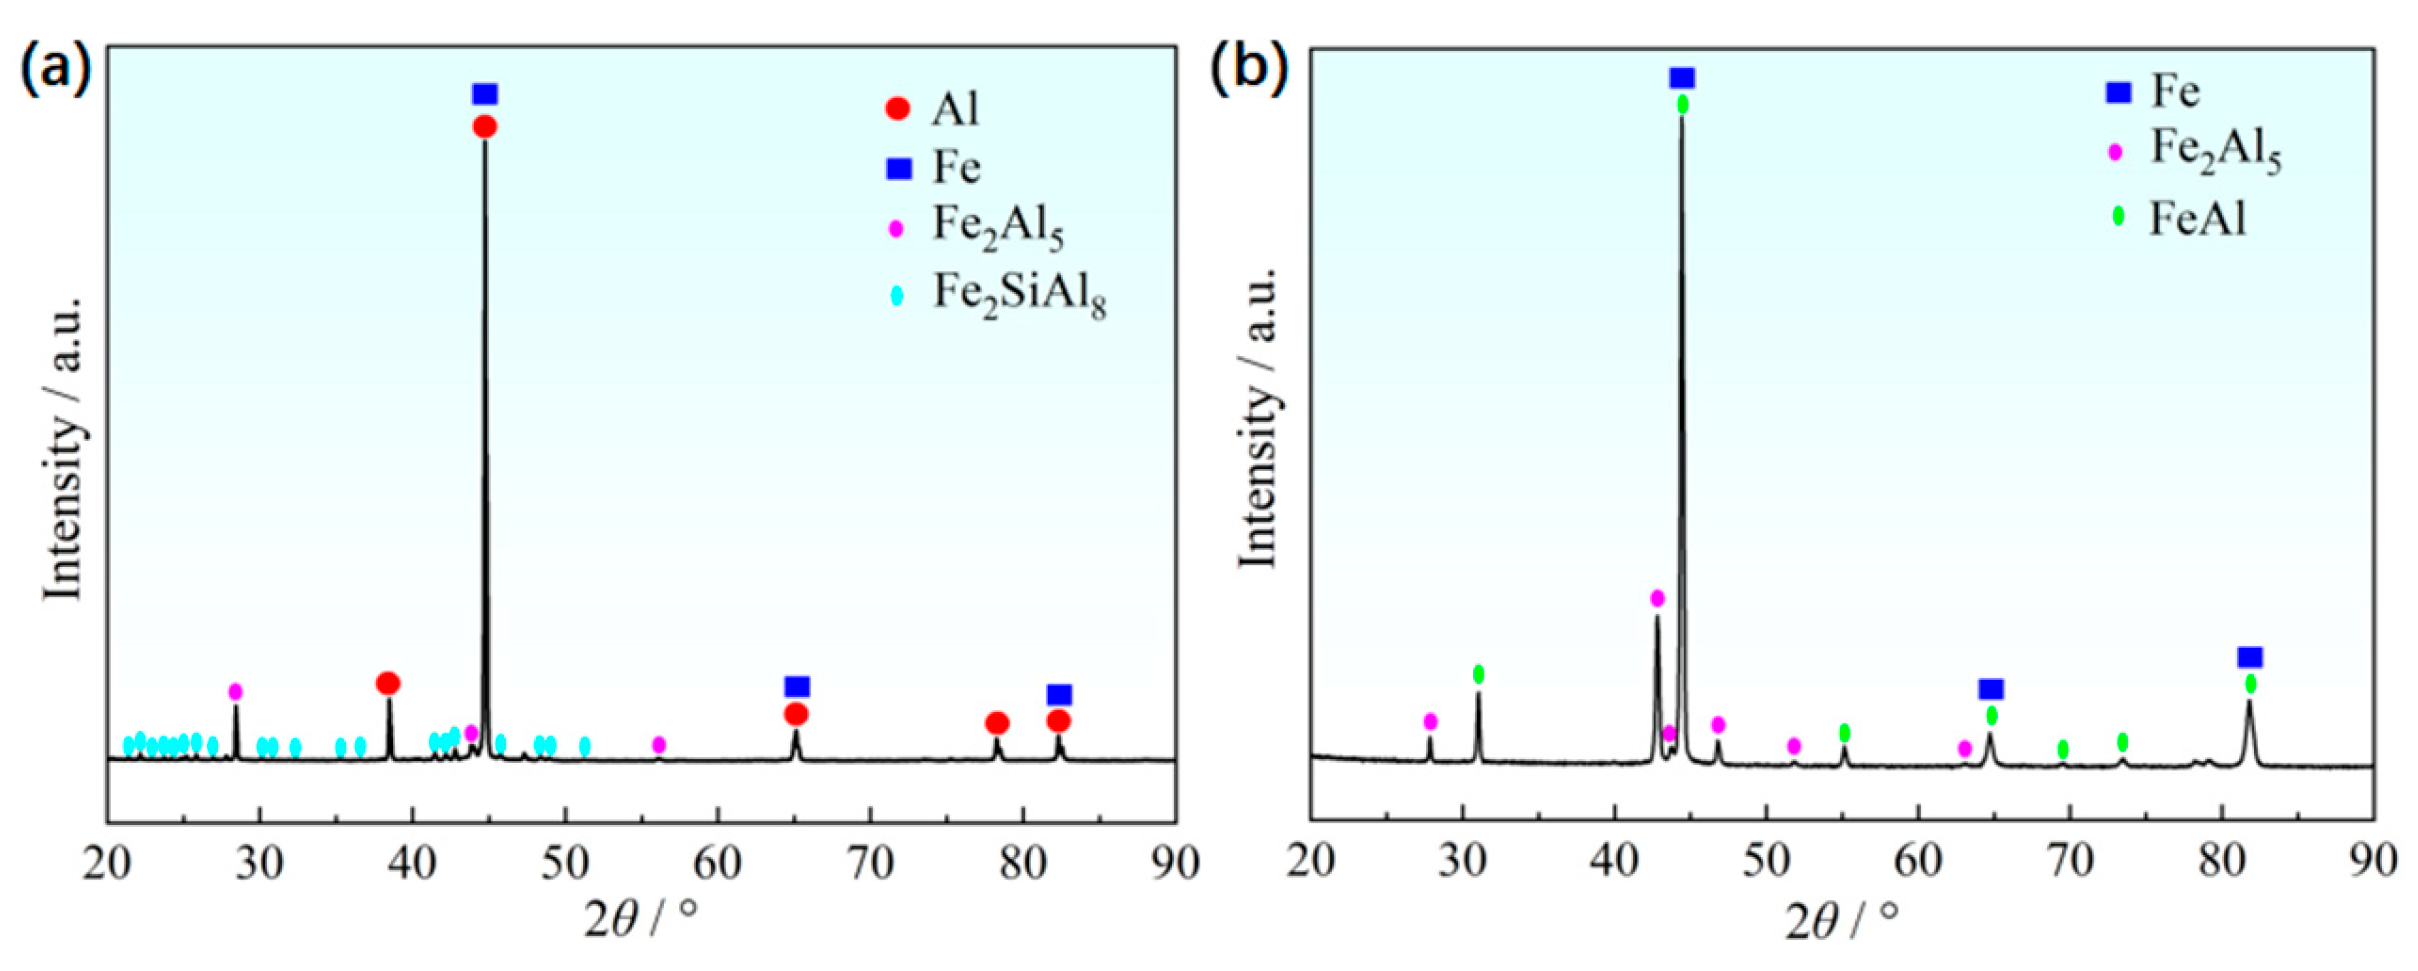
Figure 5a depicts a portion of the steel/coating interface. The elements Fe, Al, and Si mappings indicate that this sublayer must be the intermetallic phase that was formed in this ternary alloy system. That is, the Fe has reacted with the melting Al-Si to form the new intermetallic phase during the short time of hot dipping. According to X-ray diffraction patterns of the Al-Si coatings in hot-dipped condition, the new phases formed at the hot dipping stage consisted of Fe
2Al
5 and Fe
2SiAl
8 (
Figure 6a), and their type changed with the duration time due to intensive iron diffusion. This is consistent with the research results of Windmann and his colleagues [
29,
30]. Cheng and Wang [
31] also identified them as hexagonal Al
7Fe
2Si based on the EBSD pattern. In addition, many microcracks are present on this sublayer and vertical to the interface (arrowed in
Figure 4a) due to this Al-rich intermetallic phase having very high brittleness.
After the hot stamping, besides the martensite transformation for the steel substrate (
Figure 2c), the coating layer also obviously changed at a relatively high temperature. The new phases of coating layer in hot-stamped conditions consisted of Fe
2Al
5 and FeAl (
Figure 6b). The difference in the chemical potential of the elements Fe, Al, and Si between the coating layer and the steel substrate drives their intensive interdiffusion. As a result, their distribution is more homogeneous in the coating layer region compared to the former stage. Especially for Fe (
Figure 5b), the coating layer has a quite similar concentration as in the steel substrate because of the higher diffusivity of Fe atoms in the liquid Al compared to the diffusion of aluminum in solid γ-Fe [
29]. It is expected that some new intermetallic phases (e.g., FeAl, FeAl
3, and Fe
2Al
5) could be formed based on the Fe-Al phase diagram [
29].
Figure 4b shows the four sublayers’ morphology of the coating. Combined with the EDS mappings and the EBSD phase identification (given below), the top and third sublayers consist of the Fe
2Al
5 phase (light white area in
Figure 4b), while the other two sublayers are the FeAl phase (light brown). The Si presence to some extent influences the distribution of these intermetallic phases, as shown in the Si mapping (
Figure 5b) that the Si is relatively enriched on the FeAl phase, because this phase has higher solubility for Si than the Fe
2Al
5 phase.
When the Al-Si coating in the hot-dipped condition is heated at the austenitizing temperature, the Fe
2Al
5 phase located at the interface of the steel substrate transforms into the FeAl phase, mainly due to the diffusion of Fe into the coating and Al into the steel substrate. The highest Fe content in the coating is found directly at the interface to the steel substrate. Thus, the phase of type FeAl is first formed at this interface, and the layer grows towards the Al-Si coatings as the austenitization time increases [
28,
29]. Due to the low solubility of Si in the Fe
2Al
5 phase, Fe
3Al
2Si
3 forms at the grain boundaries of the Fe
2Al
5 phase during the austenitization process. Due to the diffusion of Fe, the Al-rich phase Fe
2SiAl
8 transforms into the Fe-rich Fe
2Al
5 phase during the austenitization process. The growth kinetics of Fe
2Al
5 are stronger than that of Fe
2SiAl
8 and Fe
3Al
2Si
3 [
29], so it occupies the largest volume proportion in the Al-Si coating. The formation mechanism of another type of FeAl phase is as follows: With the progress of austenitization, the Si in Fe
3Al
2Si
3 diffuses into the steel substrate. When the Si content in Fe
3Al
2Si
3 is below the critical value, it will transform into a more stable FeAl phase. Due to the formation of Fe
3Al
2Si
3 at the initial Fe
2Al
5 phase grain boundary, this type of FeAl phase is distributed in a band-shaped morphology in the Fe
2Al
5 phase.
Meanwhile, many micro-voids (signified with black arrows in
Figure 4b) can be observed at the bottom layer of the coating, which are known as Kirkendall voids due to the difference in the diffusion rate of the elements between the steel substrate and the Al-based coating [
29]. Therefore, the inner border of the Kirkendall voids is normally considered to be the original Al coating/steel substrate interface [
32]. However, these voids always distribute heterogeneously for industrial steel sheets and their formation depends on the soaking time [
29]. On account of the diffusion of Al into the steel substrate, the Al-rich ferrite layer could be formed in the vicinity of the interface adjacent to the steel substrate, and some fine ferrite grains have already grown into the steel matrix, as marked with white arrows in
Figure 4b. However, both the Al-rich ferrite layer and the FeAl phase have similar morphology and the same BCC crystal structure (given below), leading to the fact that they are not easy to take apart. To measure the coating layer thickness conveniently in industrial practice, here, we simply considered that the Al-rich ferrite layer is a part of the coating layer.
Figure 7 presents the Al-Si coating layer morphology of hot-stamped sheets that were extracted from different positions of the industrial production steel coil. The coating layer/steel interface appears clearly after the sample etching. It can be seen that the cross-sectional outline of the coating layer is not quite uniform, especially in the middle section of the steel coil that the outer layers sometimes disappear and sometimes become thicker, which makes the coating layer surface ragged. The entire thickness of coating layer was measured to be ~ 17 μm, excluding those areas with an unusual outline. By contrast, the bottom sublayer (including the newly formed Al-rich ferrite layer) is very uniform, and the main range of thickness is about 4.8~6.1 μm. Due to the presence of the brittle Fe2Al5 phase, the microcracks can be frequently observed at the outer layers of the coating, but they are always terminated at the interface of the bottom FeAl sublayer. These pre-existing microcracks will deteriorate the bending property as well as the corrosion resistance [
23]. In this sense, updating the current industrial processing parameters is necessary to avoid the appearance of a brittle phase in the Al-based coating layer. For example, appropriately extending the soaking time can promote the transition of brittle Fe
2Al
5 to the ductile FeAl phase [
29].
3.3. Crystallography
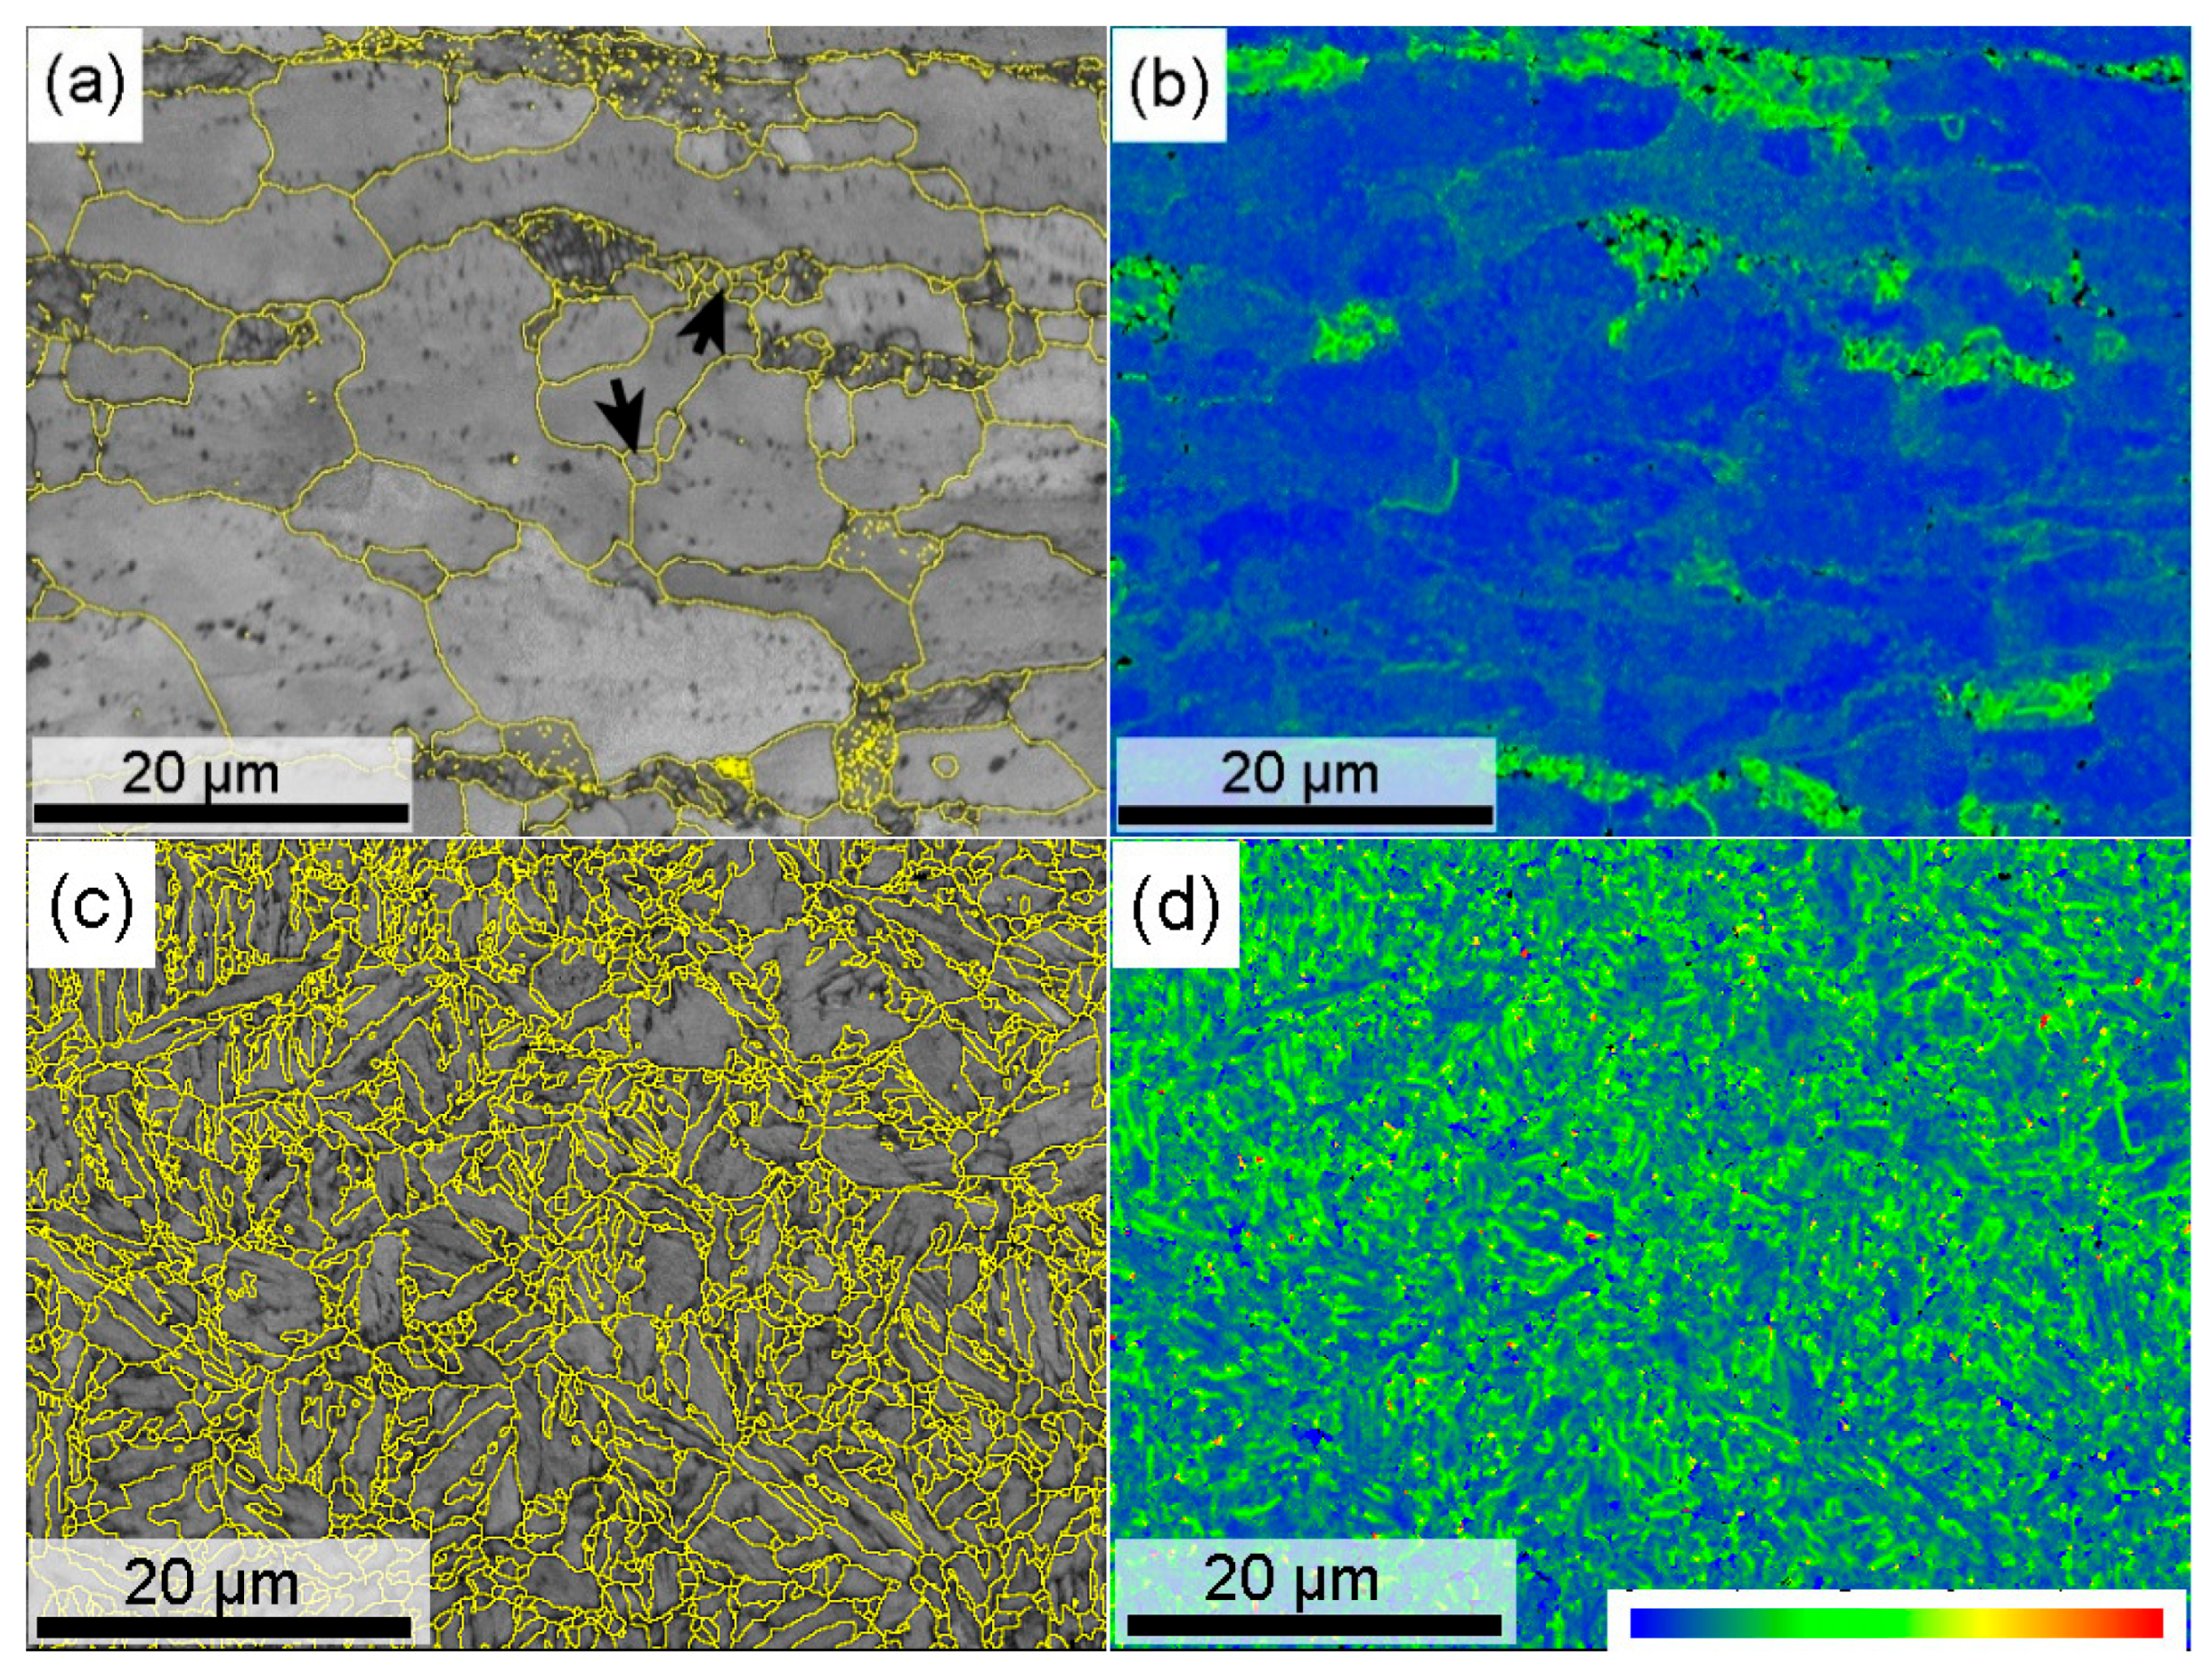
Figure 8 shows the EBSD results of the continuously annealed and hot-stamped microstructures at the steel substrate. The image quality map (
Figure 8a) exhibits two distinct band contrast domains. Combined with the microstructure in
Figure 2b, the dark gray domains imply that they have the lower band contrast, which must be the degenerated pearlite, since the phase interfaces inside the pearlite lowers the quality of Kikuchi pattern. The bright gray domains correspond to the annealed ferrite, including prior elongated coarse grains and newly recrystallized fine grains (arrowed). All these grains have grain boundaries with high misorientation angle (>10°), as delineated with yellow lines. Kernel average misorientation (KAM) maps, which were produced by a 5-pixel by 5-pixel filter with boundaries of misorientations greater than 5 ° excluded, represent the distribution of geometrically necessary dislocations [
33]. It is obvious that the degenerated pearlite domains have higher local misorientation than the ferrite grains. For individual ferrite grains, the greater the pancake shape remains, the higher the degree of local misorientation, which means the present intercritical annealing cannot eliminate the deformation dislocations completely.
After the hot stamping, the high density of high misorientation boundaries distribute evenly on the matrix (
Figure 8c), as the martensite transformation produces many block and packet boundaries with a higher misorientation angle in each prior austenite grain, which refines the effective grain size. Meanwhile, high density dislocations were induced to accommodate the intensive transformation strain during martensite transformation, as presented by the KAM map in
Figure 8d. These features should be responsible for the hot-stamped sample having an ultra-high strength. On the other hand, they also deteriorate the resistance to hydrogen embrittlement, because the interaction of hydrogen and mobile dislocations acts as a root to promote the hydrogen-induced cracking [
23]. In a sense, the hydrogen also threatens the delayed fracture of industrial products if a certain hydrogen is present, which implies that the hydrogen evolution needs to be clarified for every industrial production line to protect their products from delayed fracture.
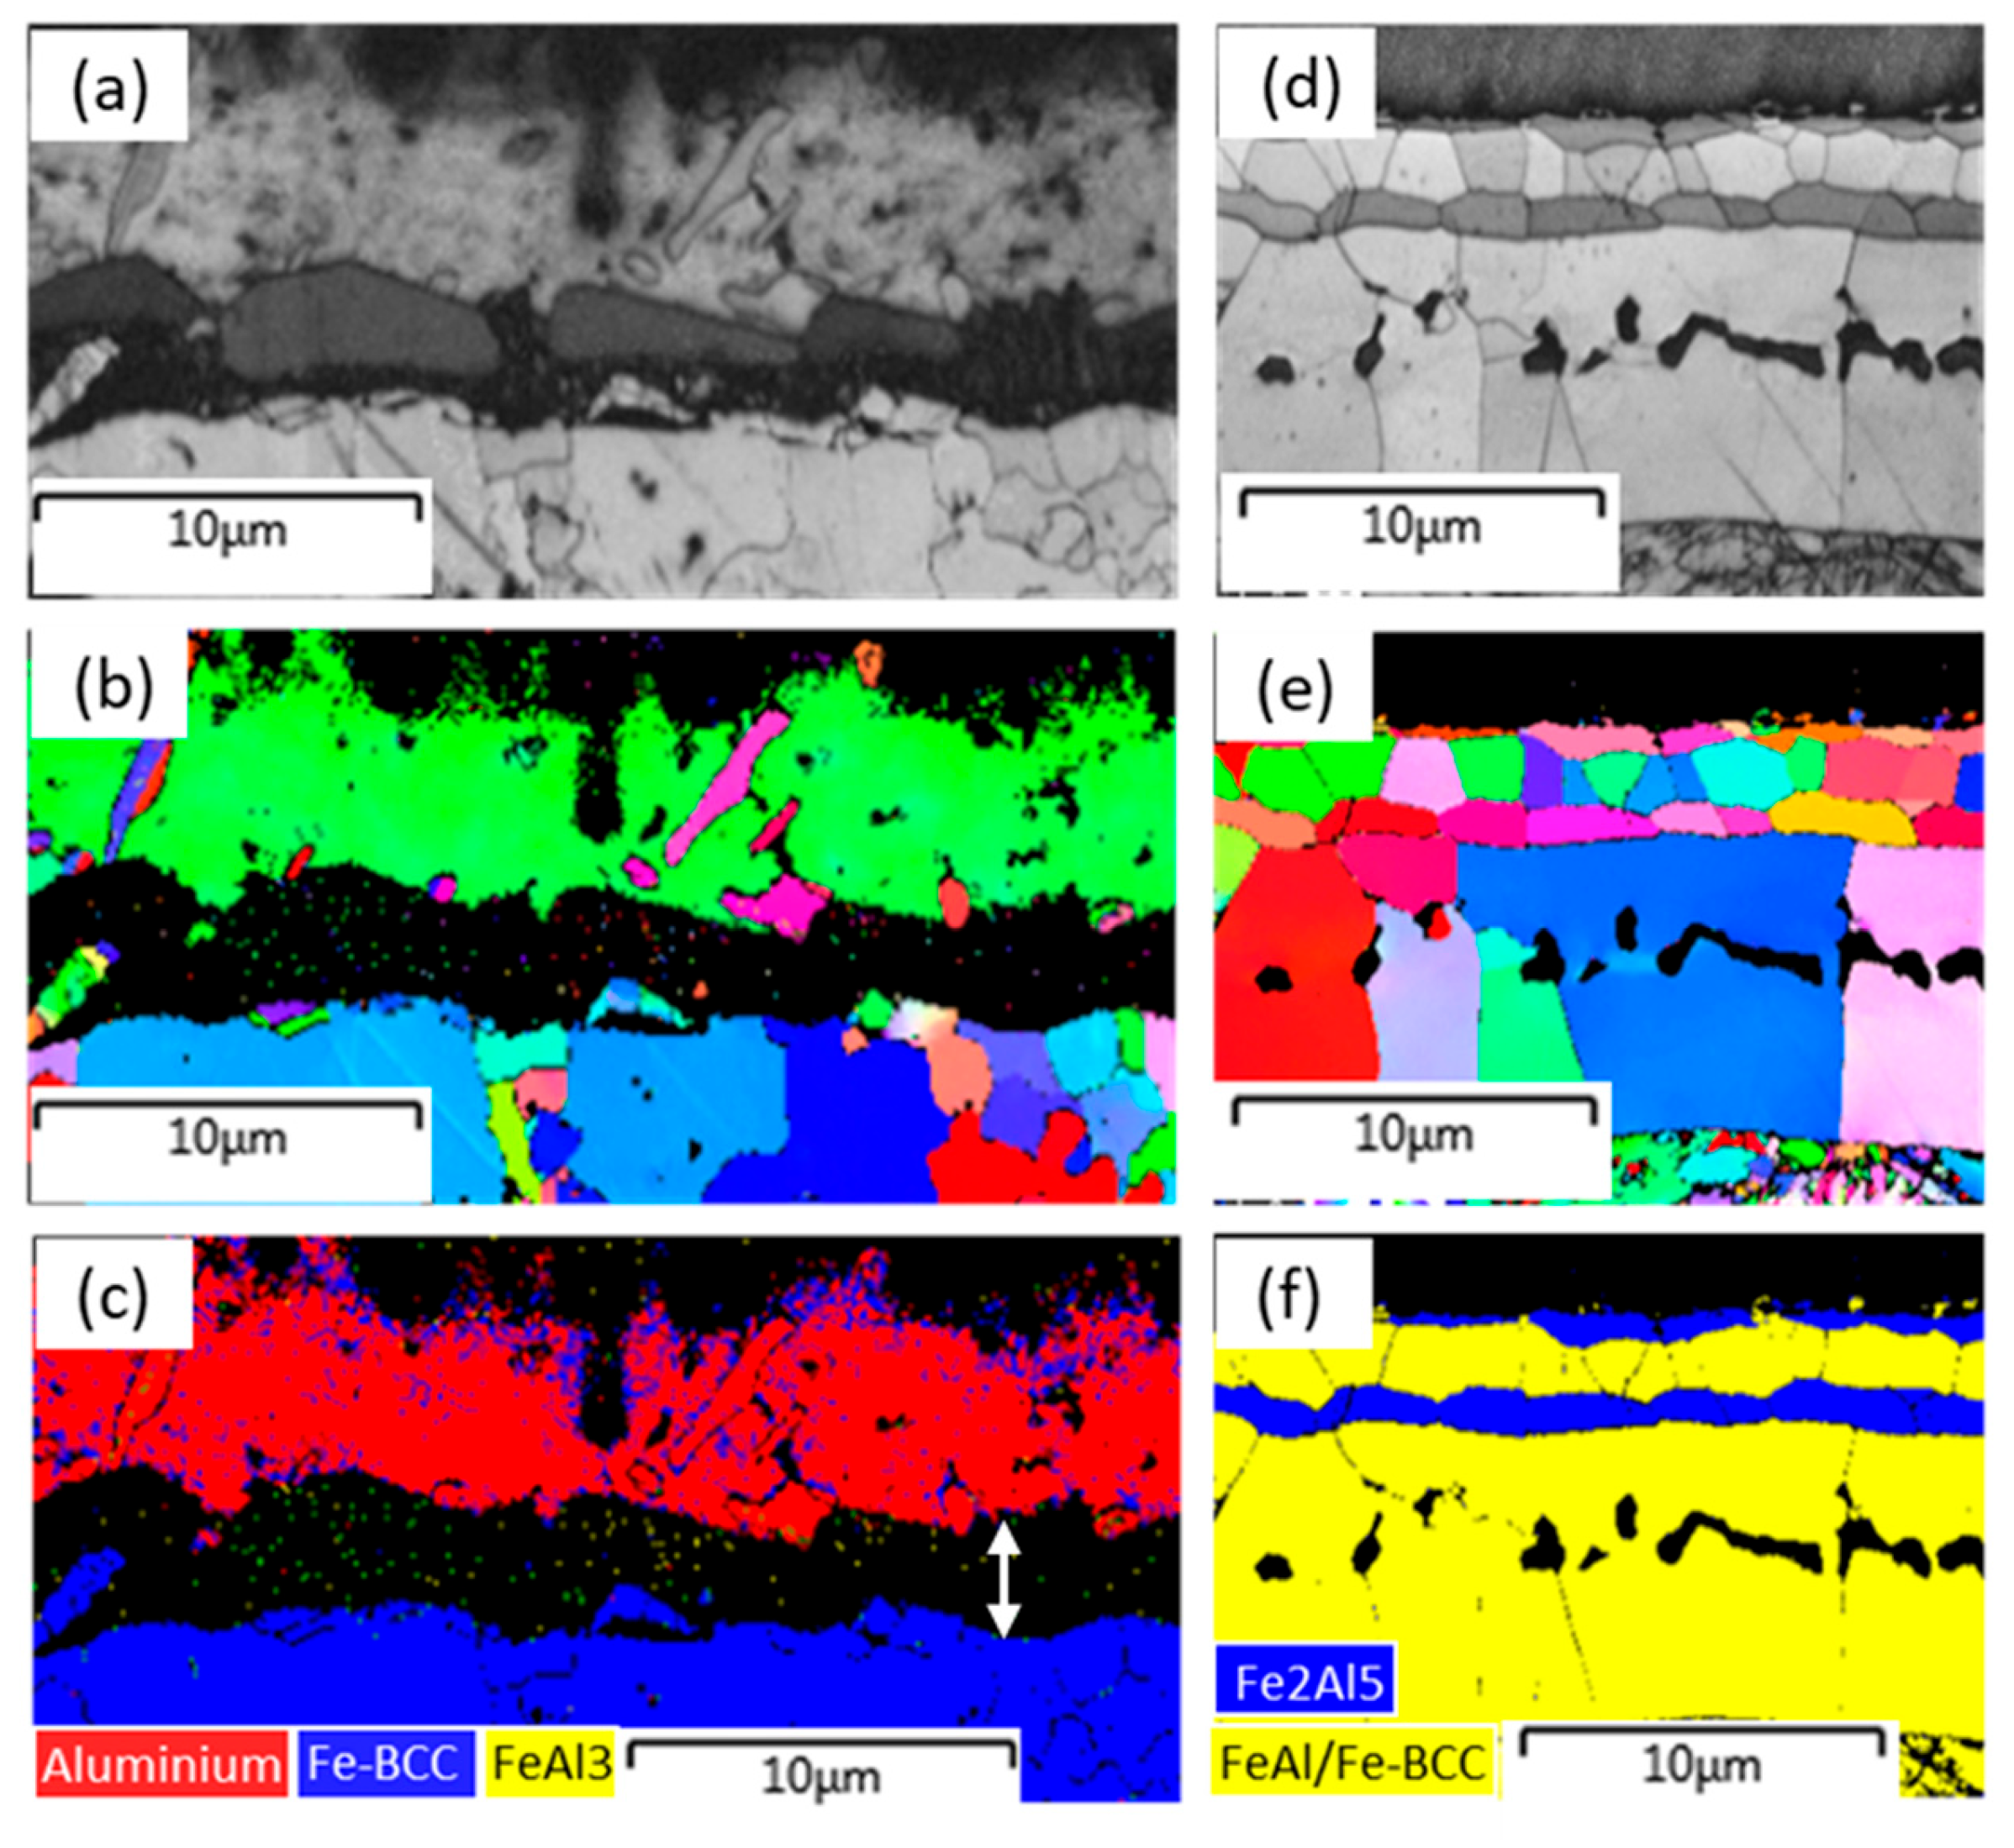
The crystallographic features of the coating layers before and after hot stamping are revealed in
Figure 9. Before the hot stamping, the outer coating layer was identified as a predominantly Al-based single crystal structure, and only a few of the fine Al-based grains with different orientations randomly distribute on this matrix orientation (
Figure 9a,b). In this study, the intermetallic layer between the Al-based coating and the steel substrate (double arrow in
Figure 9c) was not identified due to lack of the crystal data of this intermetallic phase in our EBSD software-Attec
® 5.0 SP1. As mentioned above, this phase should be Al8Fe2Si, and nearly no FeAl3 phase exists at the hot dipping stage.
After hot stamping, it is clear that the coating layer contains four sublayers, some of which have their own unique feature for crystallographic grains, which makes all sublayer boundaries very clear (
Figure 9d,e). In general, all grains at each sublayer have a character of random orientation. Based on the phase identification (
Figure 9e), the outermost and third sublayers are the Fe
2Al
5 phase with similar pancake-shaped grains. The second and bottom sublayers are the FeAl phase (or BCC type crystal), but their grain size is quite different. Note that the martensite at the bottom of
Figure 9e is also depicted in yellow because of the same BCC crystal structure. In the crystallography, the fourth sublayer exhibits typical columnar grains, as the grain boundaries are normally perpendicular to the interface boundary and cross the entire thickness. This sublayer contains two typical compositions of Fe-rich intermetallic phase and Al-rich alpha ferrite that are largely separated by the inner border of Kirkendall voids (
Figure 5b). Nevertheless, these individual columnar grains have an extremely uniform orientation, indicating that the Fe-rich intermetallic phase occurs at the epitaxial growth attached to the Al-rich ferrite grains. The growth of Al-rich ferrite is controlled by the diffusion of Al in γ-Fe; thus, the growth rate constant estimated is about 0.337 μm s
−1/2 based on the parabolic diffusion-controlled growth law (
, where
D is the thickness of the reaction phase,
t is the holding time,
k is the temperature-dependent rate constant). Although this value is nearly twice as high as the results (~0.185 μm s
−1/2) by Springer et al. [
34], who studied the growth rate of total Fe-Al reaction layer thickness at the lower temperature of 600 °C, this difference is acceptable due to its temperature dependence (the present soaking temperature was as high as 925 °C).
The main purpose of Al-based pre-coating is to prevent the strong oxidation of the steel sheets during austenitization at a high temperature. On the other hand, the presence of the coating layer also has some extra effects on the metallurgical behaviors and final mechanical properties. As mentioned above [
17,
18,
19,
20], the Al-Si coating layer has promoted the hydrogen uptake during hot stamping simulations. In combination with actual industrial production, the hydrogen evolution with and without hot dipping was comparatively explored below.
3.4. Hydrogen Evolution
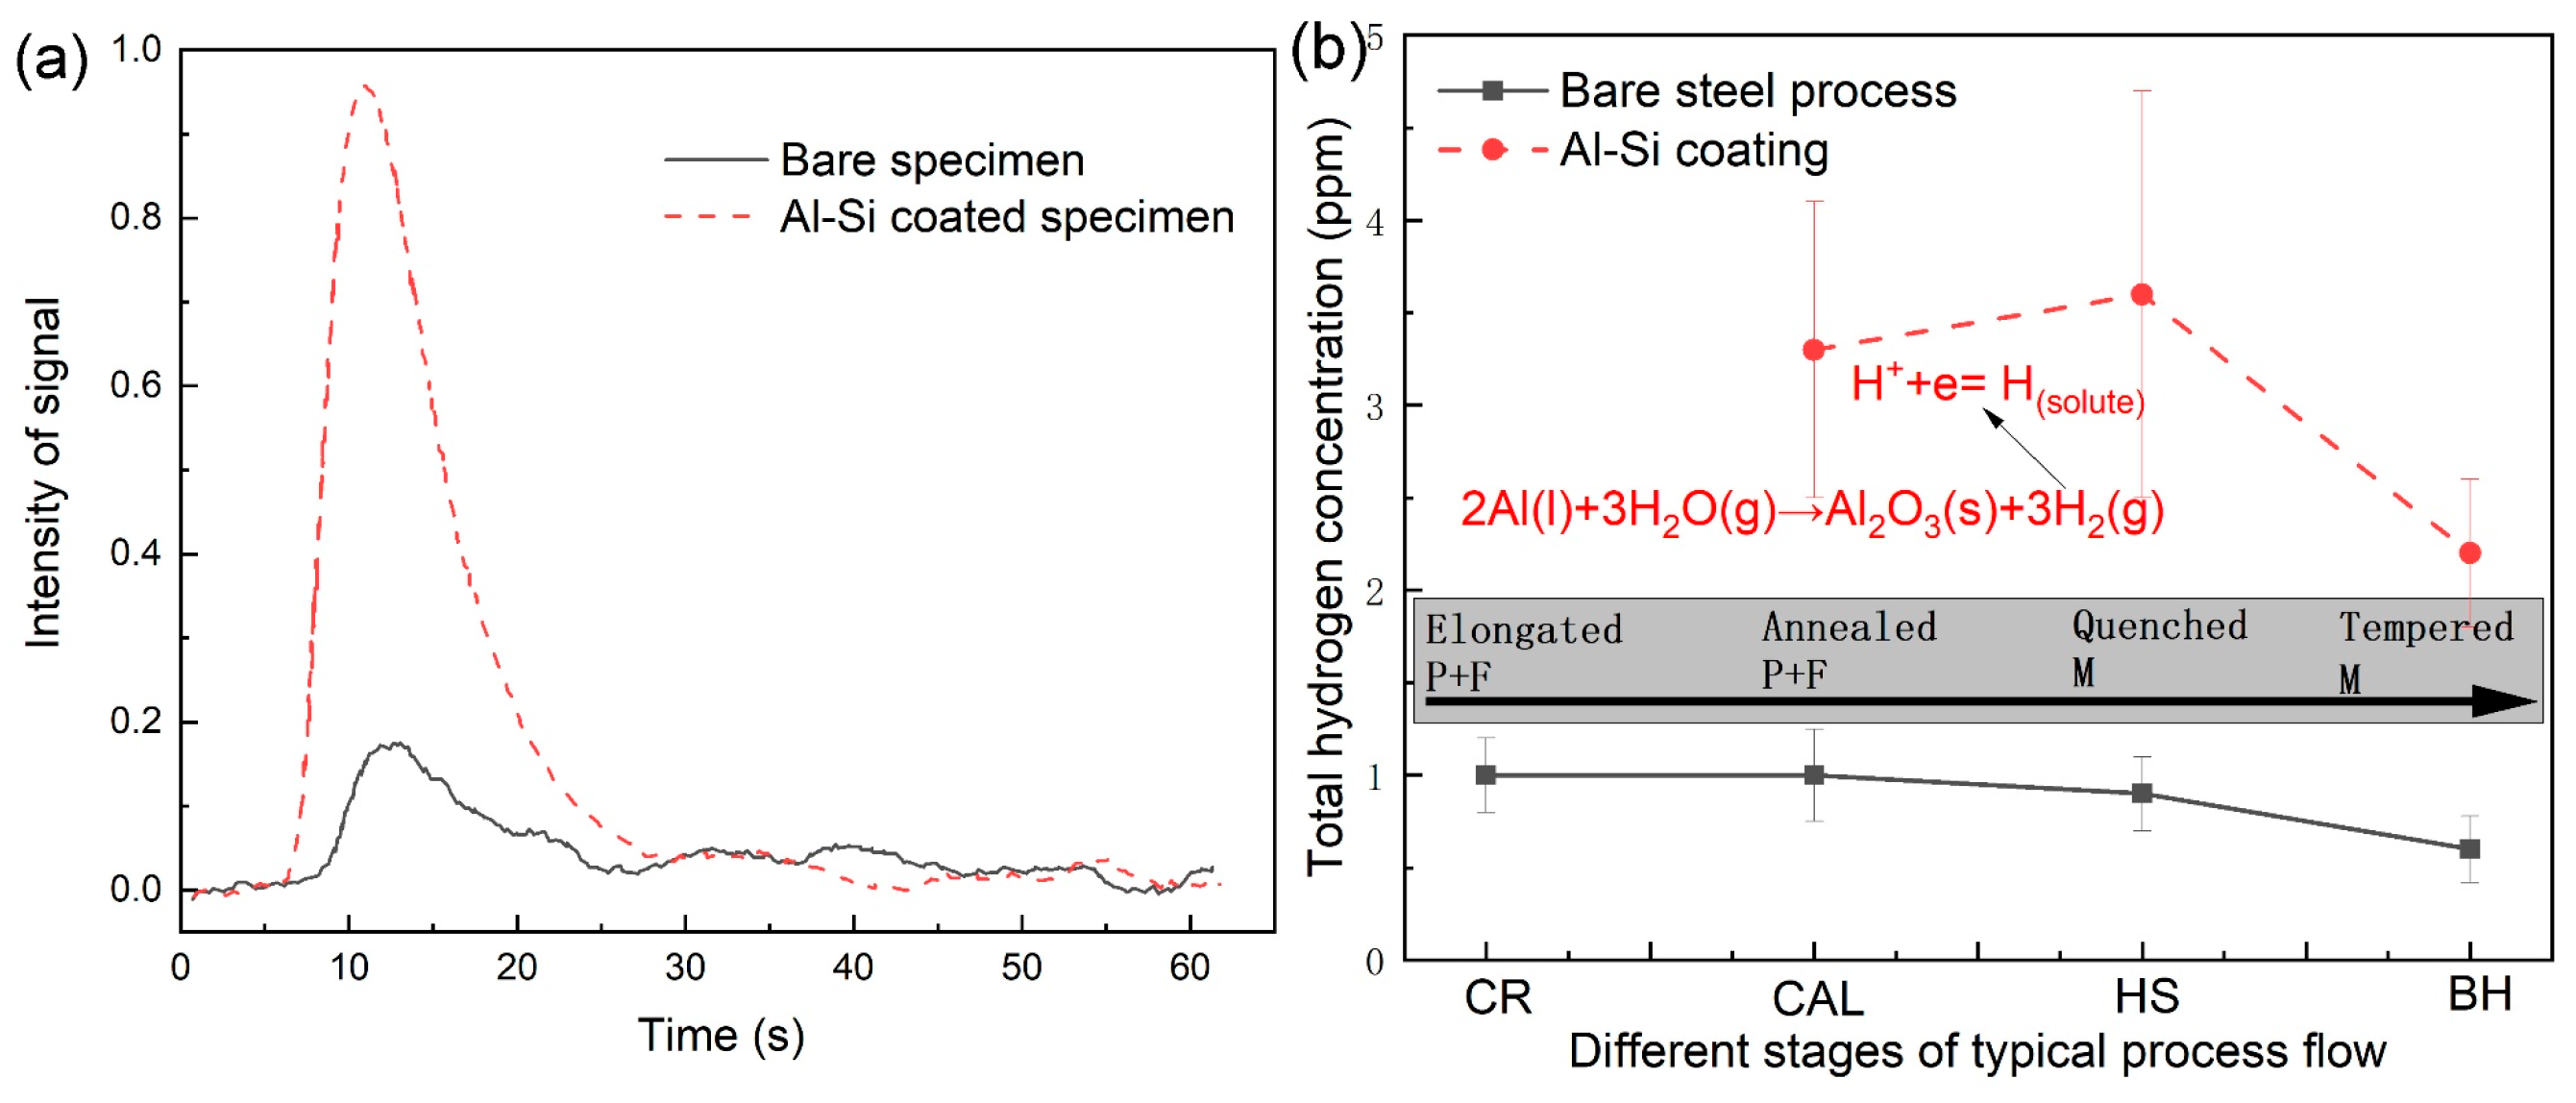
The curves of the hydrogen signal intensity of the bare steel and Al-Si-coated specimens at the hot stamping stage are exemplified in
Figure 10a. Obviously, the Al-Si-coated specimen has a significantly stronger hydrogen signal than the bare steel specimen. The total hydrogen content was determined based on the integral of these signal curves and calibration using standard Leco specimens.
Figure 10b summaries the total hydrogen content as a function of process steps for these industrial production flows, accompanied with the microstructural evolution. Note that it can be only regarded as semi-quantitative results because of the limits of resolution for the hydrogen analysis. For the bare steel process, the total hydrogen content is always kept at a very low level, normally lower than 1 ppm. By contrast, the hydrogen concentration for the Al-Si-coated specimens notably increased after hot-dip aluminizing, which is different from the reports in the literature [
14]. Subsequently, the hydrogen content further increased after hot stamping, which should be attributed to the fact that molten Al-Si coating layer reacts with moisture (dewing points) during austenitizing (as given by the chemical equation in
Figure 10b), producing hydrogen atoms that intrude into the steel substrate, since the diffusion coefficient of hydrogen in the molten Al-Si coating is very high (nearly 1 μm
2/s). At this moment, the microstructure at the steel substrate was fully austenitic, which has a higher solubility of hydrogen, leading to the net diffusion flow of hydrogen from liquid Al-based coating to the steel. These intruded hydrogen atoms will be trapped in the steel substrate after fast cooling due to the solidified coating layer preventing the hydrogen out-diffusion. This prevention is originated from the decrease in hydrogen diffusion coefficient in the coatings, as reported by Krid et al. [
20], because of a denser packing structure of the Fe
2Al
5 and the crystal lattice expansion and chemical trapping of hydrogen near the substitute elements, i.e., Si and Al. This is in good agreement with the results of hydrogen generation and uptake of the aluminized steel during laboratory-simulated hot stamping [
14,
15,
17,
18,
19,
20].
Similarly, the reason that relatively higher hydrogen content exists in the continuously annealed and hot-dip aluminized specimen is due to the presence of a hydrogen gas component in protective gas (i.e., N
2 + 20% H
2). The gaseous hydrogen can be absorbed on the surface of the steel sheet during continuous annealing. Actually, the gaseous hydrogen charging was usually conducted at a relatively higher temperature in order to accelerate the hydrogen permeation [
35]. A portion of the surface-absorbed hydrogen would be sealed by hot-dip aluminizing, because the hot-dip aluminizing was tightly followed by the continuous annealing (their interval time was less than 1 s), and the hot-dip process was completed in several seconds. By contrast, for the bare steel process, the annealed specimen surface might also have some absorbed hydrogen atoms, but they can escape quickly during cooling in air due to no obstacles of hydrogen degassing. That is the reason why the hot-dip aluminized specimen increased the hydrogen content notably compared to the specimen without the aluminizing process.
These hydrogen atoms that were sealed by a hot-dip-coated layer can be partly inherited to the hot stamping step or maybe degassed out during the reheating stage of the hot stamping. It is hard to determine whether the hydrogen atoms can be inherited between these two heat treatment steps. Valentini et al. [
21] demonstrated that the higher the initial hydrogen content, the higher the concentration of hydrogen can be obtained after hot stamping. This implies that the hydrogen in the hot-dipped samples can be partially retained to the hot-stamped specimens.
When the process moved to the bake hardening step, the hydrogen content decreased due to the hydrogen degassing for both processes. Irrespective of this, the Al-Si-coated specimens still have a relatively higher hydrogen content than the bare steel specimens, meaning that the coated layer inhibited the hydrogen out-diffusion during bake hardening process, and a portion of hydrogen that was produced during the former processing steps will be inherited into the products if the Al-Si-coated layer was present.
In combination with microstructural evolution, although the hydrogen content was increased at continuous annealing plus the hot-dip aluminizing step, it is less detrimental to the HE resistance of the steel sheet, since the degenerated pearlite and ferrite formed at this stage are not highly susceptible to the HE, and these hydrogen atoms can be partly degassed out at the next heat-treated step. However, hydrogen atoms that formed at the hot stamping stage due to the presence of Al-based layer mostly threaten the HE resistance of ultra-high-strength steels, because the martensite with high HE susceptibility forms simultaneously, and these hydrogen atoms can be largely inherited into the final products due to no heat treatments after bake hardening. Thus, the hydrogen-assisted delayed fracture of the Al-Si-coated steel sheets should be checked in future study, and the dehydrogenation process may be figured out to make their industrial application acceptable.
Based on the above analysis, strictly controlling the dew point of the furnace in the hot stamping process may be an effective measure to avoid the hydrogen embrittlement of PHS. Furthermore, based on the hydrogen evolution curves observed during various processing stages, low-temperature tempering (170 °C for 20 min) promotes hydrogen diffusion in hot-formed specimens whether Al-Si-coated or uncoated, resulting in reduced hydrogen content and consequently achieving a synchronous improvement in the hydrogen embrittlement resistance of PHS. Therefore, low-temperature tempering is also an effective measure to reduce the risk of the hydrogen embrittlement of PHS.
This study focuses on microstructural evolution and the internal hydrogen content of ultra-high-strength automotive steels during two typical industrial production flows, providing reference for the smooth industrial production of PHS production and ensuring the manufacturing of qualified automotive parts. Sufficient statistical data can indeed play a good supporting role in the conclusion. We did conduct the statistical analysis on the significant testing, such as hydrogen content determination. However, as mentioned above, the distribution and diffusion of hydrogen in steel are affected by many factors, and the detection method used in this paper has certain limitations, so the uncertainty was noticeable for every processing step. In the future, quantitative analysis, such as phase abundance, hydrogen embrittlement mechanism, and critical values leading to hydrogen embrittlement will be the focus of our research, including the detection and analysis of diffused hydrogen and non-diffusible hydrogen content using the equipment of thermal desorption spectroscopy (TDS).


