3.1. Furnace Samples
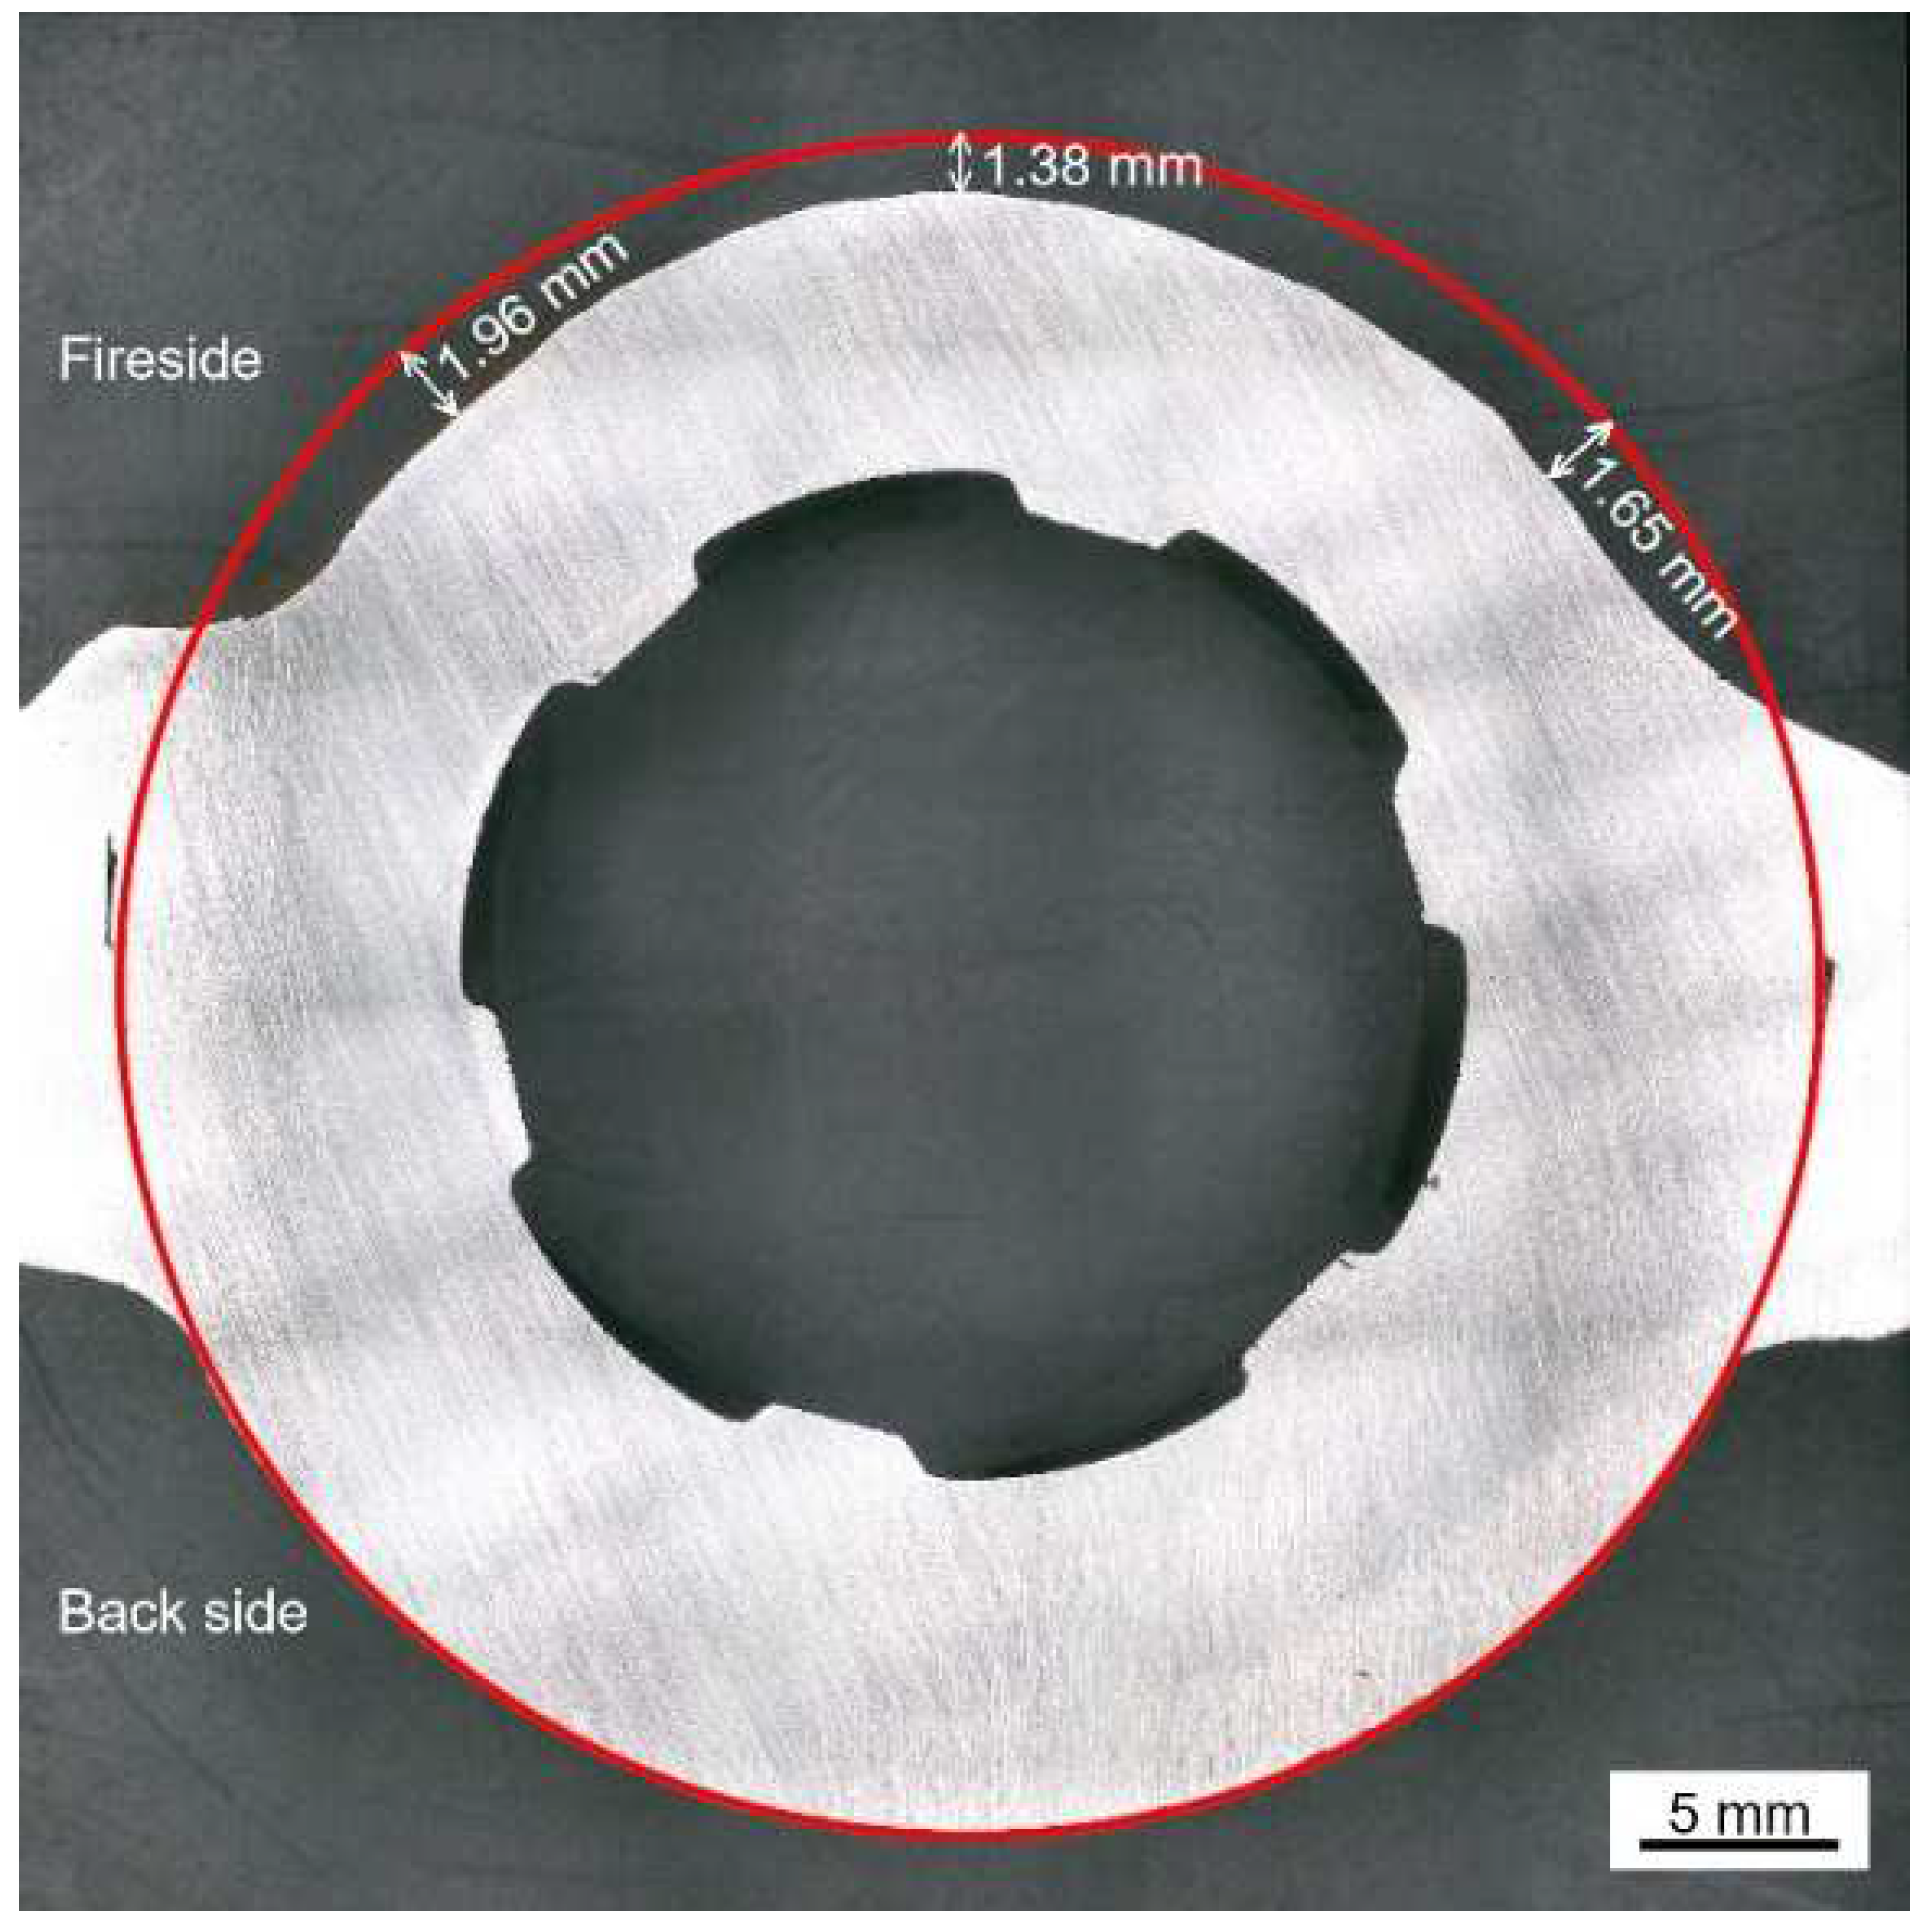
Figure 4 shows the cross-sectional micro-morphology of the water wall tube on the fireside.
As shown in
Figure 4a, the adherents on the surface of the water wall tubes can be divided into two parts, which include the salt deposit with a loose and porous structure and the corrosion scale with a relatively dense structure. The cracks and pores in the salt deposit and corrosion scale can act as diffusion pathways for corrosive gases to diffuse inwards. Discontinuous black island-like products were observed near the interface of the salt deposit and corrosion scale. Meanwhile, significant delamination was observed in both the salt deposit and corrosion scale, as shown in
Figure 4b,c.
Figure 5 shows the EPMA elemental distribution maps of the salt deposit.
The enrichment of the Pb element was observed in the bright region, while the enrichment of Fe and Zn was observed in the dark region. The distribution characteristic of the S element was basically similar with that of Pb and Zn, which proved the formation of Pb and Zn sulfides. The distributions of O and S in the Fe-enrich region proved the formation of Fe oxides and sulfides. In addition, the enrichment of Al, Si, and O was observed in the spherical particles and black island-like products, which proved the formation of silicates or aluminosilicates.
It has been widely reported that the salt deposits formed under oxy-fuel combustion consisted of silicates/aluminosilicates [
20], sulfates [
21] (CaSO
4, Na
2SO
4, K
2SO
4, etc.), and chlorides [
22,
23] (NaCl, KCl, etc.), which seemed to be quite different from the results obtained in this paper. Oxidizing and reducing atmospheres close to the water wall tubes were changed alternately inside of the coal-fired plant after the low-combustion modification. The volatility proportion of trace elements, such as Zn and Pb, was higher in reducing atmosphere than that in the oxidizing atmosphere [
24]. As a result, more gaseous Zn-/Pb-containing species reacted with H
2S and condensed onto the surfaces of the deposit in the reducing atmosphere. These Zn/Pb sulfides would affect the diffusion of H
2S- or S-containing species into the deep side of corrosion product, which may accelerate the corrosion rate [
25,
26].
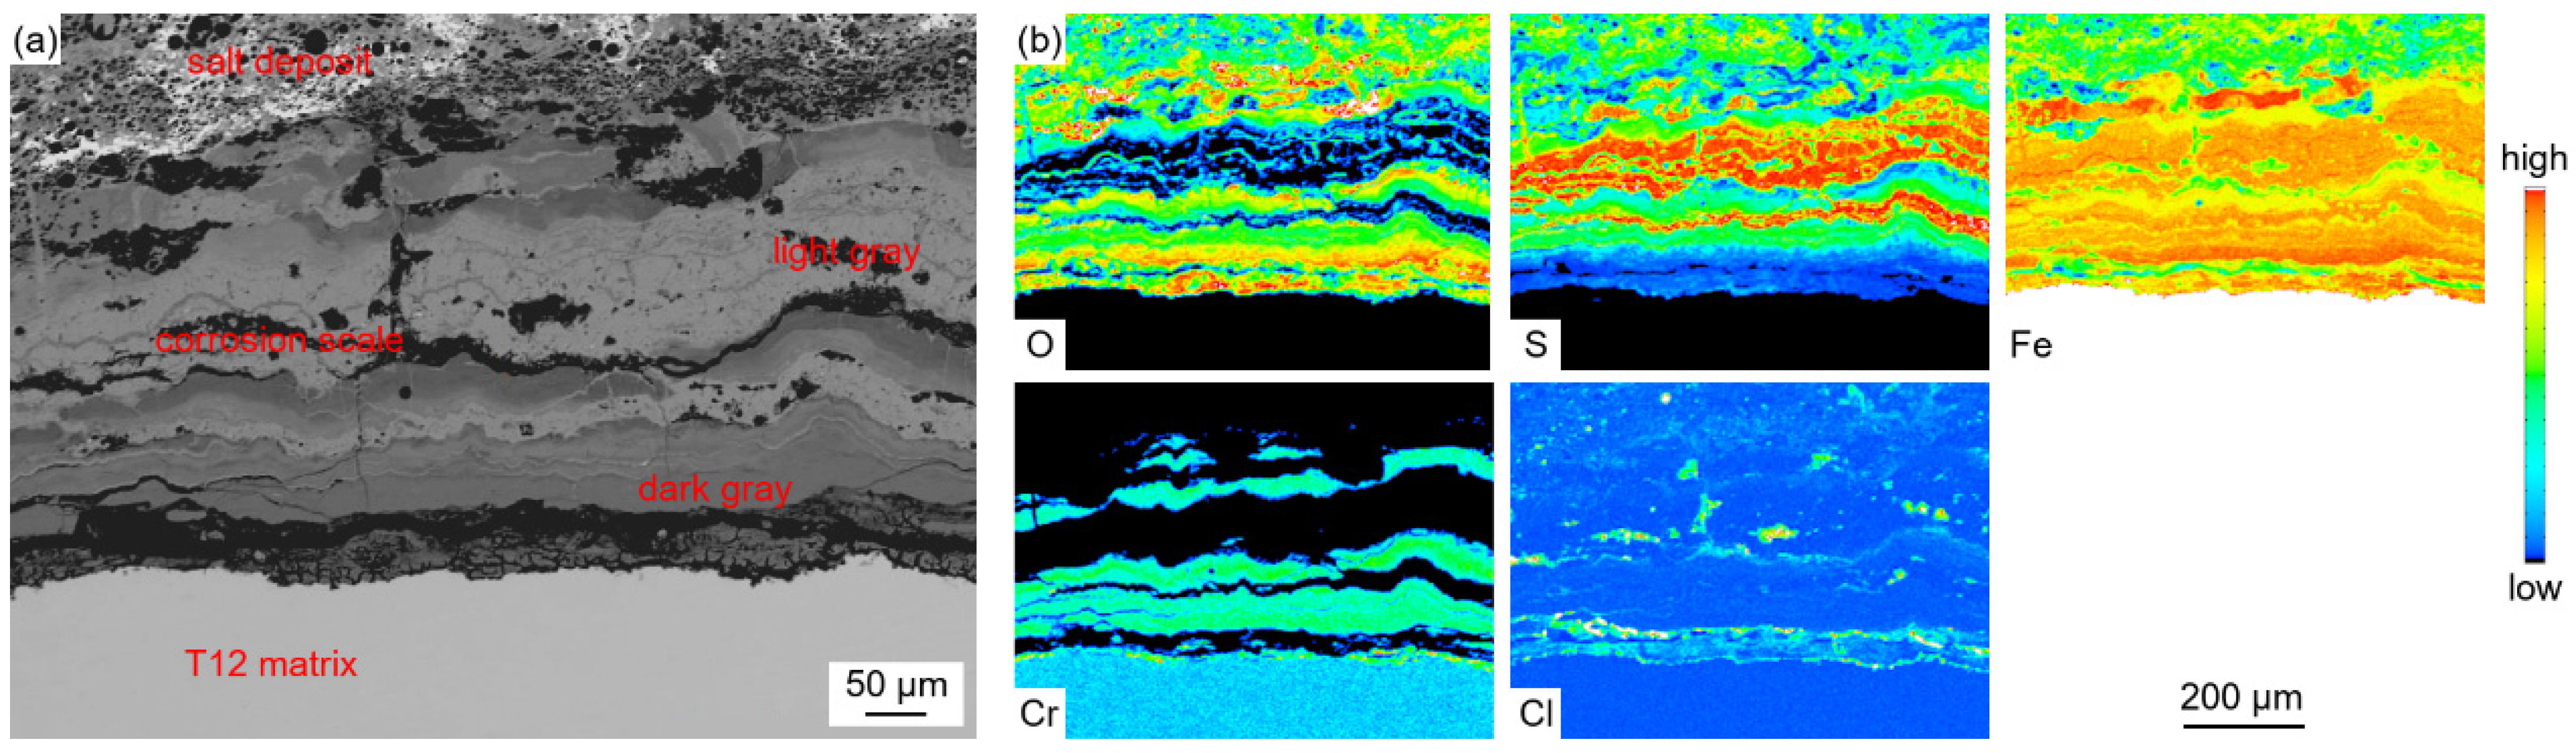
Figure 6 shows the EPMA elemental distribution maps of the corrosion scale.
The enrichment of the Fe element was observed in the whole profile section of the corrosion scale. The enrichment of S and O was observed in the light-gray parts and dark-gray parts, respectively. This indicated that the corrosion scale was composed of Fe oxides and sulfides. The distribution of Cr was found in the O-enriched region, which proved the formation of Fe-Cr spinel oxides. The distribution of S and O did not coincide with each other, which indicated the competing relationship between sulfation and oxidation during the corrosion process. Trace amounts of the Cl element were also observed in the corrosion scale. During combustion, Cl-containing species in coal and other inorganic salts deposited on the surface of the water wall tubes, forming low-melting-point co-crystals. These co-crystals diffused inwards along the cracks and pores in the salt deposit and corrosion scale.
Five points in
Figure 4b and four points in
Figure 4c were selected to contrast their compositions by EPMA and presented in
Table 4. The results show that the salt deposit contained heavy metal elements such as Pb, Zn, Sn, Sb, and so on, due to the direct condensation of metal vapors under the steep temperature gradient generated during combustion. The bright region was mainly composed of Pb sulfides, while the dark region can be divided into two parts. The parts represented by point 2 contained Pb and Zn sulfides, as well as Fe oxides and sulfides, and the parts represented by point 3 contain mainly Fe oxides and sulfides.
The corrosion scale mainly contained Fe, O, S, and Cr. The light-gray parts (represented by point 6 and point 8) contained Fe sulfides, and the dark-gray parts (represented by point 7 and point 9) contained Fe oxides and small amounts of Fe sulfides and Cr oxides.
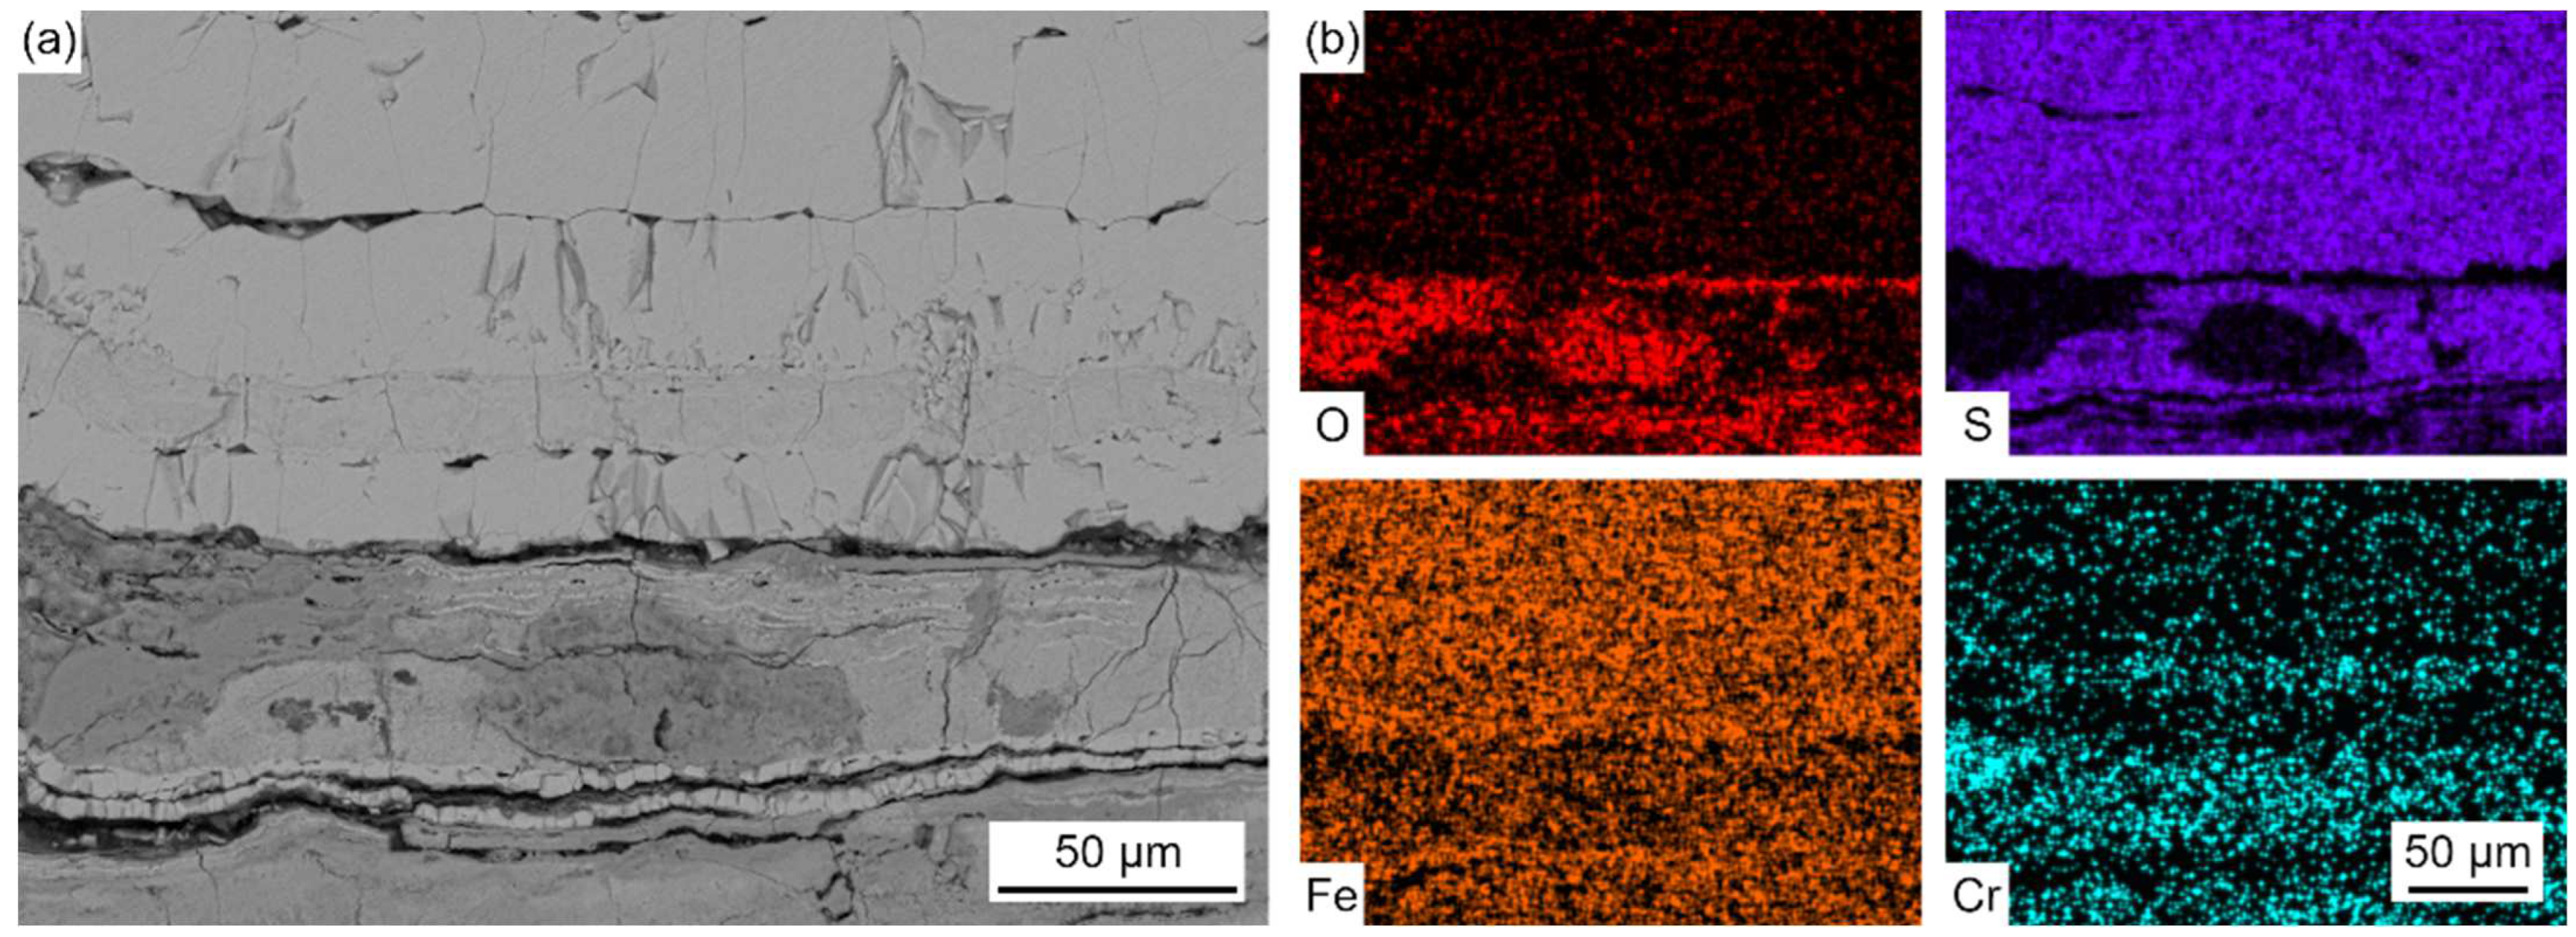
Figure 7 presents the elemental distribution map of metal substrates adjacent to the oxidation layer.
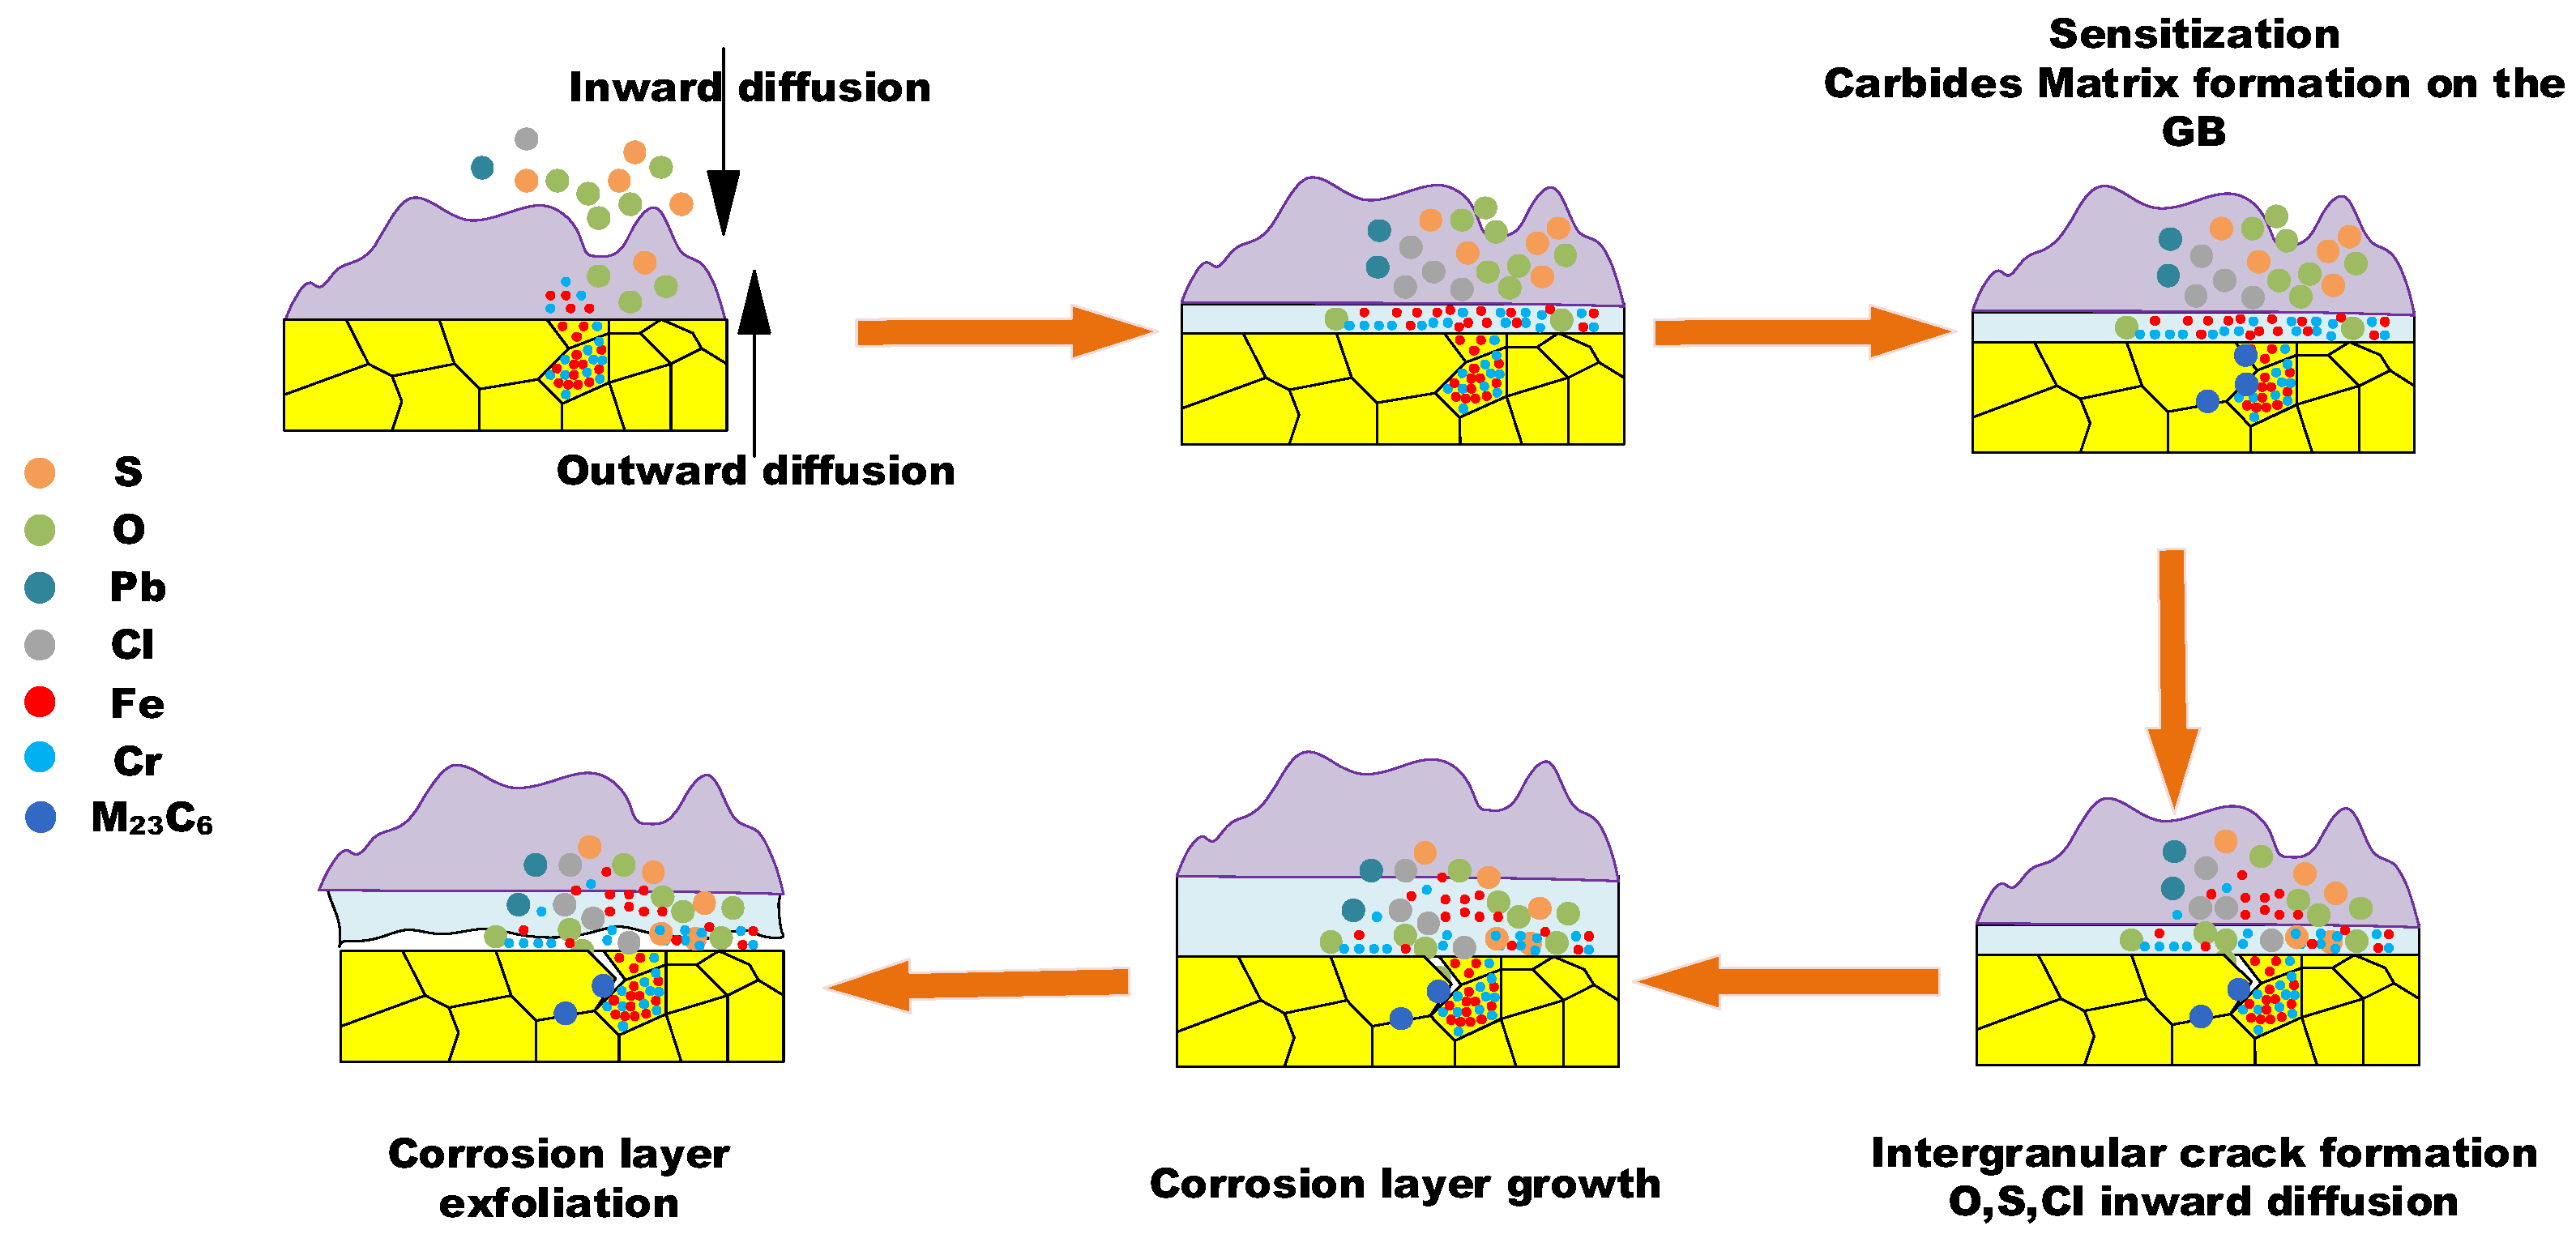
The BSE image magnifies the details of GB precipitation, segregation, and cracks, and the elemental map illustrates the sulfur and chlorine inward transportation and diffusion, and the enrichment of chromium at the GB precipitation phase.
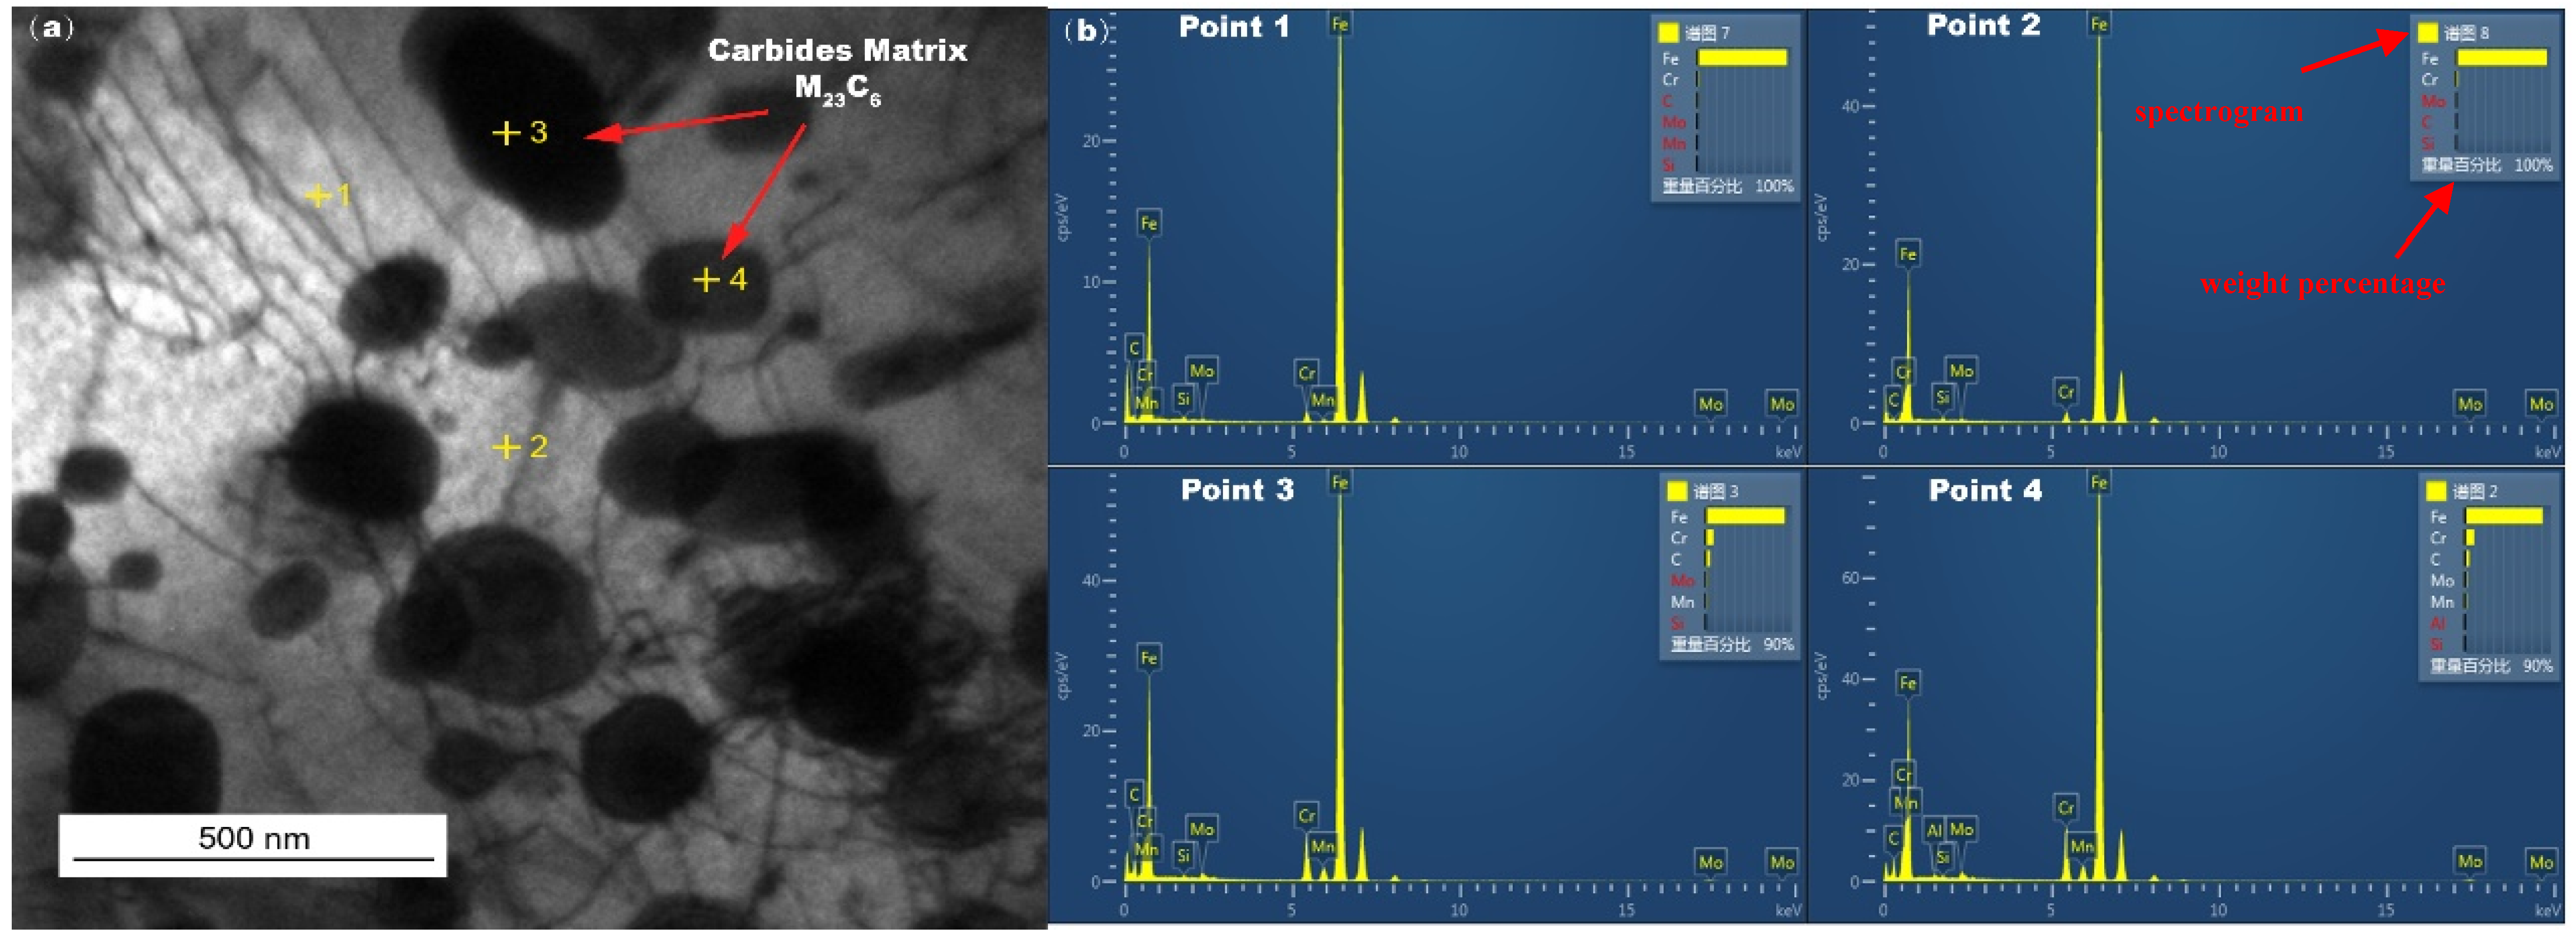
Figure 8 shows the TEM image of the in-furnace water wall tubes sampled at metal substrates after a long period of service, and grain boundary (GB) precipitated phases were found in the matrix of the water wall tubes. These precipitated phases were identified in
Table 5 as the carbide matrix M
23C
6 by EDS, which is mainly located in the vicinity of the GBs.
3.2. Laboratory Samples
Figure 9 shows weight-gain data and corrosion kinetic curve of the SA-213 T12 steel with no ash coating after exposure to the reducing atmosphere at 400 °C.
The weight-gain data increased with the exposure time. The corrosion kinetics can be fitted by the following equation:
where Δ
W is the weight change in the specimen (mg/cm
2),
n is the time exponent that describes the time dependence of oxide growth,
kp is the corrosion rate constant (mg/(cm
2h
n)), and t is the exposure time (h). The values of
kp and
n obtained from the corrosion experiment were 0.19 and 0.95, respectively. This indicates that the corrosion kinetics of the SA-213 T12 steel in the reducing atmosphere at 400 °C followed the linear law. This result agrees with the result reported by Xu et al. [
27]. Therefore, it can be deduced that the corrosion scale formed in the reducing atmosphere with CO and H
2S is nonprotective and cannot increase the difficulty of mass transfer. They also found that the corrosion rate of specimens in presence of CO was higher than that in absence of CO, because CO destroyed the formation of oxides that possessed slight corrosion resistance. In addition, the corrosion kinetics of 12Cr1MoV steel in an oxidizing atmosphere with SO
2 followed a parabolic law, as reported by Xu et al. [
27]. This difference between corrosion kinetics in a reducing atmosphere and an oxidizing atmosphere suggests that CO and H
2S can significantly promote corrosion.
Figure 10 shows the XRD pattern of SA-213 T12 steel with no ash coating after exposure to the reducing atmosphere at 400 °C for 600 h.
The diffraction results show that corrosion products were primarily composed of magnetite oxides (Fe3O4), spinel oxides (Fe3−xCrxO4, where x is the stoichiometric coefficient), Fe sulfides (FeS2 and Fe1−xS), and Cr sulfides (Cr3S4, Cr5S6, and Cr6S7).
Figure 11 shows the cross-sectional micro-morphology of the corrosion scale on SA-213 T12 steel with no ash coating after exposure to the reducing atmosphere at 400 °C for different times.
As shown in
Figure 11, the corrosion scale showed a double-layer structure. The outer layer was highly loose, with a large number of internal holes and cracks, and the thickness was approximately 160 μm, while the inner layer was relatively dense, and the thickness was approximately 45 μm. Transverse cracks were observed in the outer layer and near the interface of the outer layer and inner layer, which led to the spalling of the corrosion scale. In addition, cracks and pores in both the outer and inner layers can act as conduits for corrosive gases to diffuse inwards, increasing the corrosion rate and ultimately leading to a linear law of corrosion kinetics.
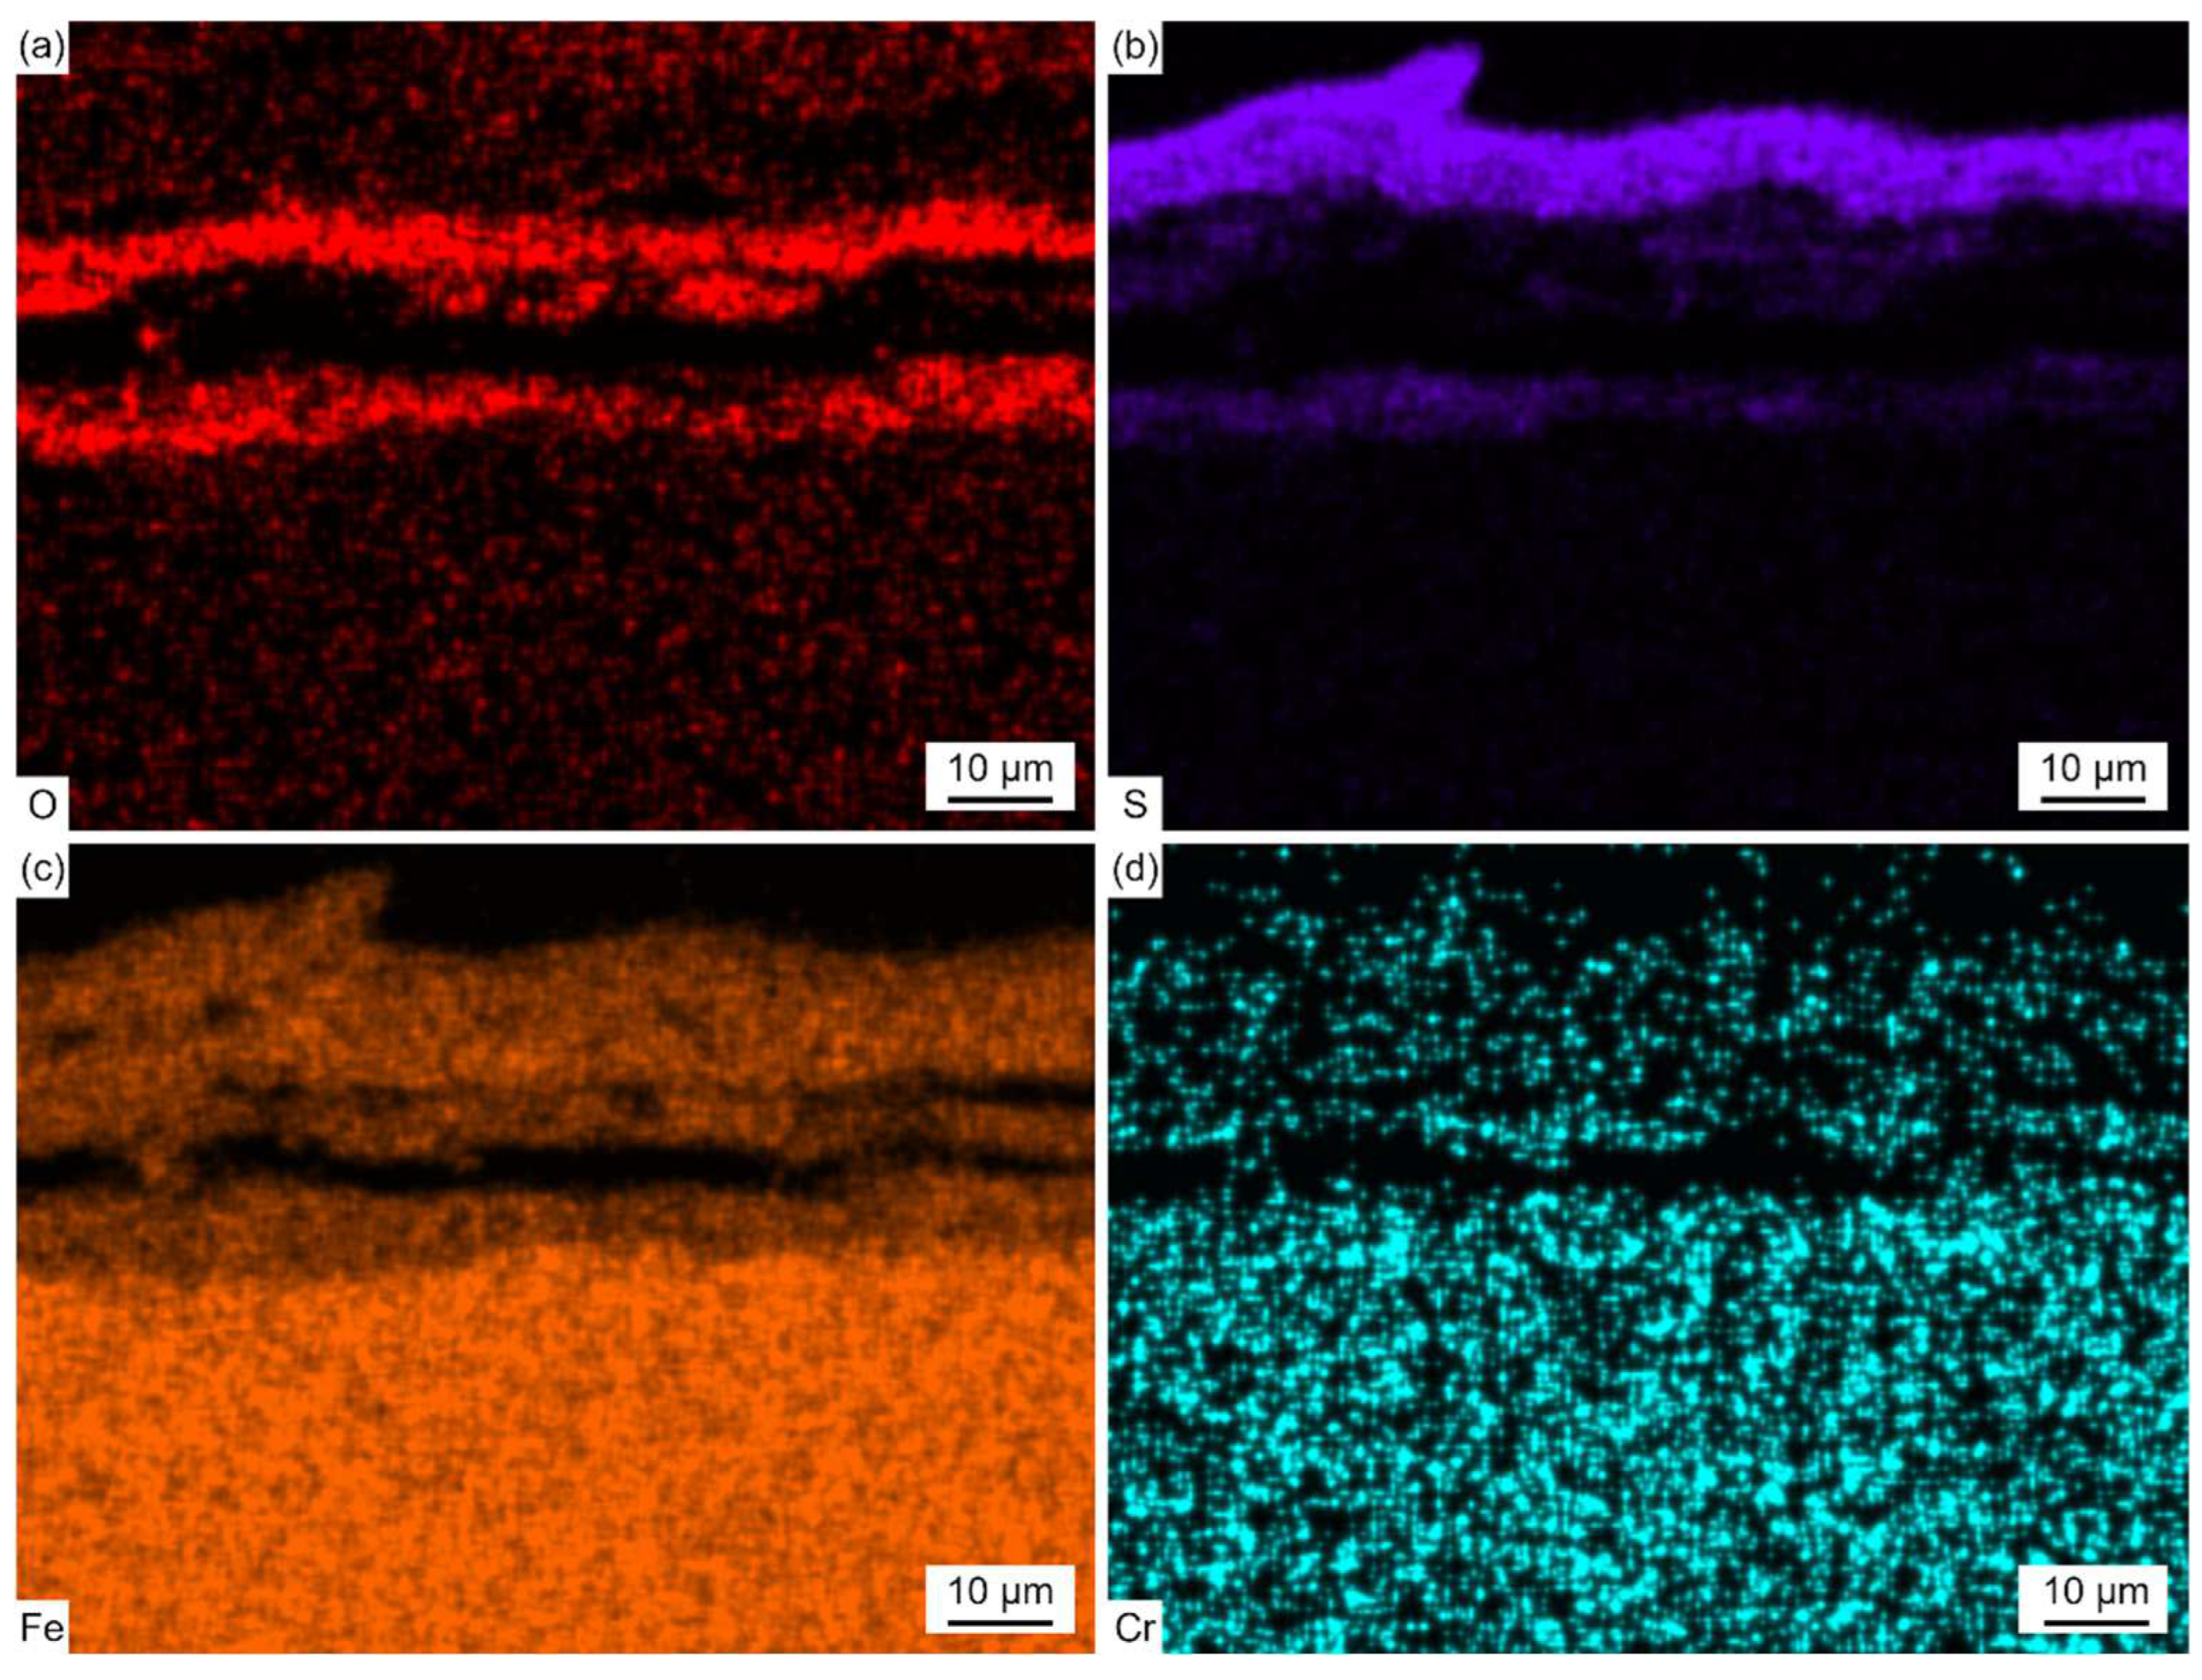
Figure 12 shows the EDS elemental distribution maps of the corrosion scale corresponding to the region (marked with the solid line) in
Figure 11a.
Fe and S were found in the outer layer, and Fe, Cr, O, and a trace amount of S were found in the inner layer. The thickness of the outer layer was comparable to that of the inner layer after exposure to the reducing atmosphere at 400 °C for 30 h. However, the thickness of the outer layer was much thicker than that of the inner layer, as shown in
Figure 11b,c. Thus, the growth rate of the outer layer was more rapid than that of the inner layer with the increase in the exposure time. This was due to the fact that, in the reducing atmosphere with a high concentration of CO, the oxidation process was strongly inhibited and sulfation predominantly took place.
Figure 13 shows the cross-sectional micro-morphology and EPMA elemental distribution maps of the corrosion scale on SA-213 T12 steel with no ash coating after exposure to the reducing atmosphere at 400 °C for 600 h.
As shown in
Figure 13b and
Table 6, the outer layer contained Fe and S, and the inner layer contained Fe, Cr, O, and S.
The distribution of Cr was in a layer form and the distribution of S was in a root-like form. The enrichment of O was near the interface of the corrosion scale and matrix. The enrichment of S and O did not coincide with each other as well. The characteristic distribution of S in the inner layer may be related to the inward diffusion of gas molecules. During the corrosion process, CO and H2S diffused inward along fast diffusion paths, like grain boundaries and cracks, in the inner layer. Then, some of the oxides near these paths directly reacted with H2S to form Fe sulfides, and some were first reduced by CO and then further reacted with H2S to form Fe sulfides. So, the distribution of S in the inner layer is basically similar with the inward diffusion paths of CO and H2S.
Combined with the XRD results in
Figure 10, it was confirmed that the outer layer was composed of Fe
1−xS and FeS
2, and the inner layer was composed of sulfides, including Fe
1−xS, FeS
2, Cr
3S
4, Cr
5S
6, and Cr
6S
7, and oxides, including Fe
3O
4 and Fe
3-xCr
xO
4. Due to the poor toughness of the sulfides formed in the outer layer, a large number of cracks were generated in the outer layer.
Figure 13 shows that the thicker outer corrosion scale layer is mainly composed of Fe sulfides, while the thinner inner corrosion layer is primarily composed of spinel oxides and magnetite oxides. It can be inferred that the presence of spinel oxides and magnetite oxides can further inhibit the inward transport and diffusion of S, while not inhibiting the outward diffusion of Fe. This characteristic of allowing easy cation transport while forming a diffusion barrier for anions causes the outer corrosion layer to grow faster and thicker, while the inner corrosion layer grows at a slower rate and is relatively thin.
Figure 14 shows the cross-sectional micro-morphology of the corrosion scale on SA-213 T12 steel with a real coal ash coating after exposure to the reducing atmosphere at 400 °C for 600 h. The adherents on the surface of the SA-213 T12 steel can be divided into two parts, the salt deposit with a loose and porous structure and the corrosion scale with a relatively dense structure, which was similar to the adherents found on the surface of the furnace samples in
Figure 4.
Figure 15 and
Figure 16 show the cross-sectional BSE images and EDS elemental distribution maps of the salt deposit and corrosion scale in
Figure 14.
As shown in
Figure 15, the salt deposit mainly contained Fe oxides and sulfides. The distribution of S and O did not coincide with each other as well. In addition, the enrichment of Al, Si, and O was observed in the spherical particles, which proved the formation of silicates or aluminosilicates. Compared with the results in
Figure 5, no heavy metal elements (such as Pb, Zn, Sn, and Sb) were found in the salt deposit formed on the laboratory samples with the real coal ash coating. This indicates that these elements were produced during the combustion of coal. The results of the laboratory samples with the real coal ash coating in
Figure 15 reveal the presence of distinct spheroidal Al-Si oxides within the salt deposits, which are consistent with the shape and distribution shown in
Figure 5. These Al-Si oxides are absent from the salt deposits in the results of the laboratory samples with no coal ash coating, as shown in
Figure 11. The relatively loose surroundings of these oxides provide highly favorable conditions for elemental transportation and diffusion. As shown in
Figure 16, the corrosion scale showed a double-layer structure. The outer layer contained Fe and S and the inner layer contained Fe, Cr, O, and S, which was similar to the results obtained in
Figure 12 and
Figure 13. The corrosion rate of the samples with real coal ash coating (~90 mg/cm
2) was higher than that of the samples with no ash coating (~80 mg/cm
2), which indicates that coal ash can promote the process of corrosion.


