
Polymerization of Poly(3,4-ethylenedioxythiophene) on Sulfated Cellulose Nanofiber and Its Conducting Property


Abstract

1. Introduction
2. Materials and Methods
2.1. Materials
2.2. Preparation of PEDOT:s-CNF Dispersions
2.3. Characterization Methods
3. Results and Discussion
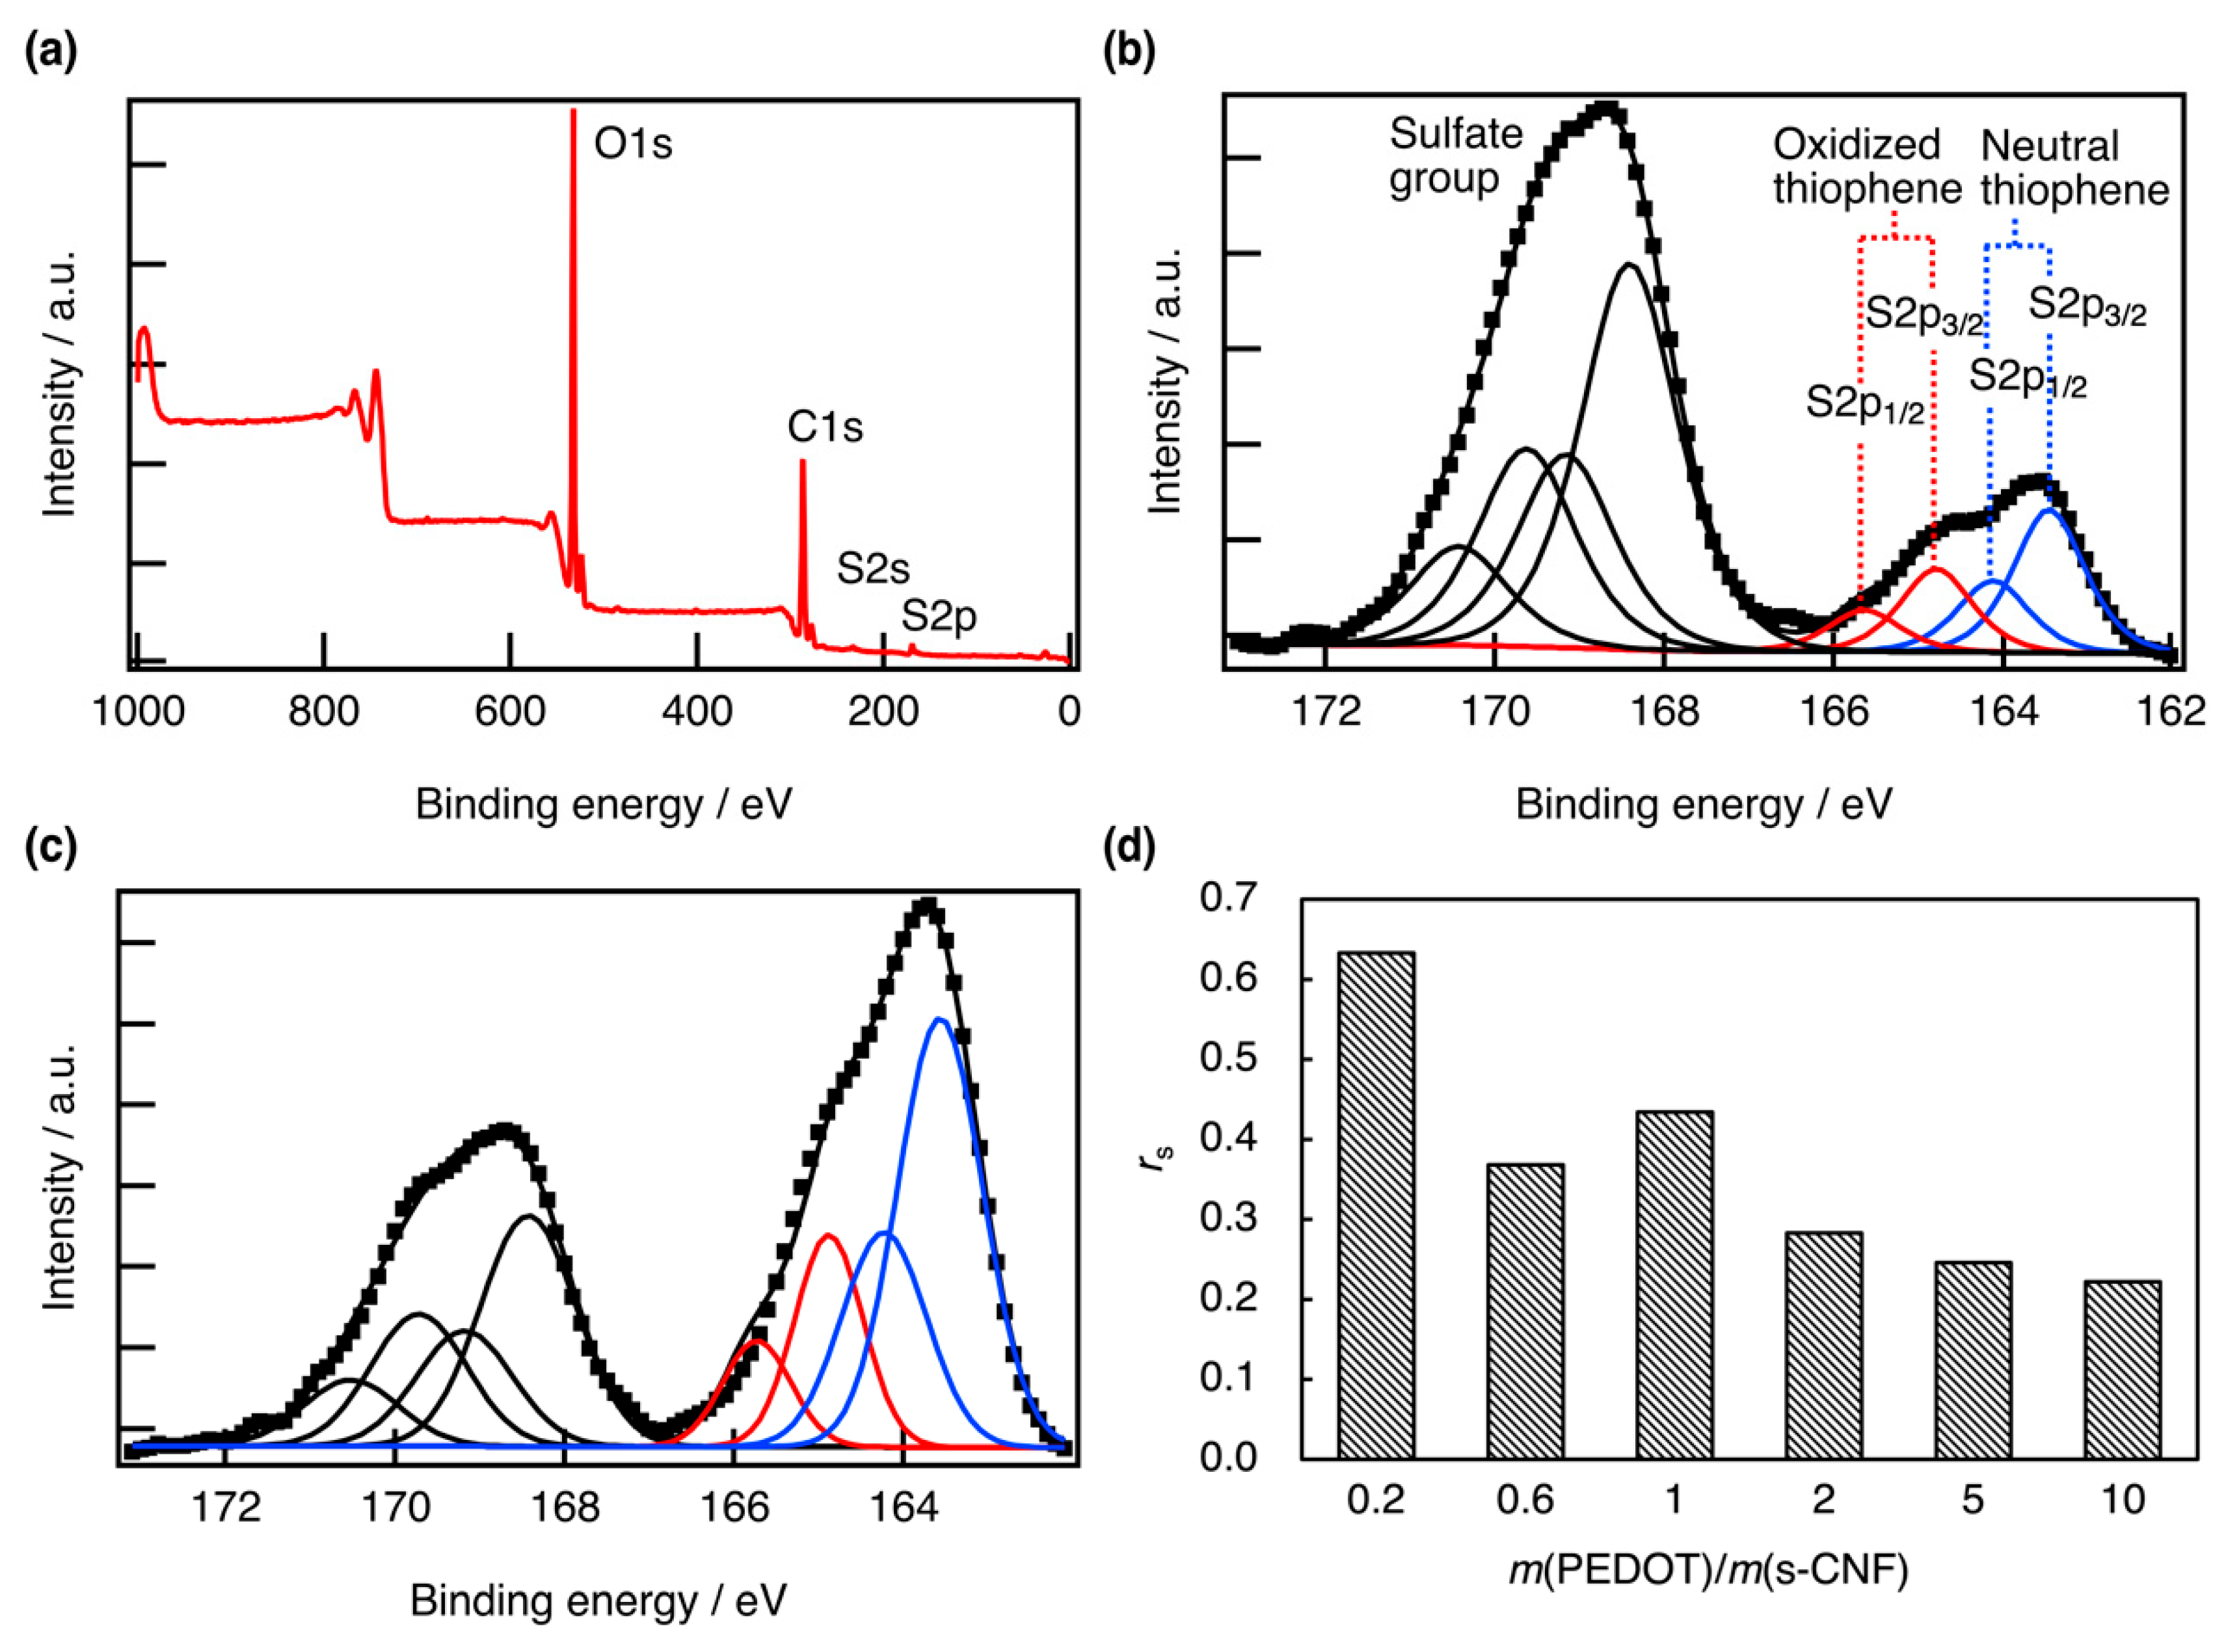
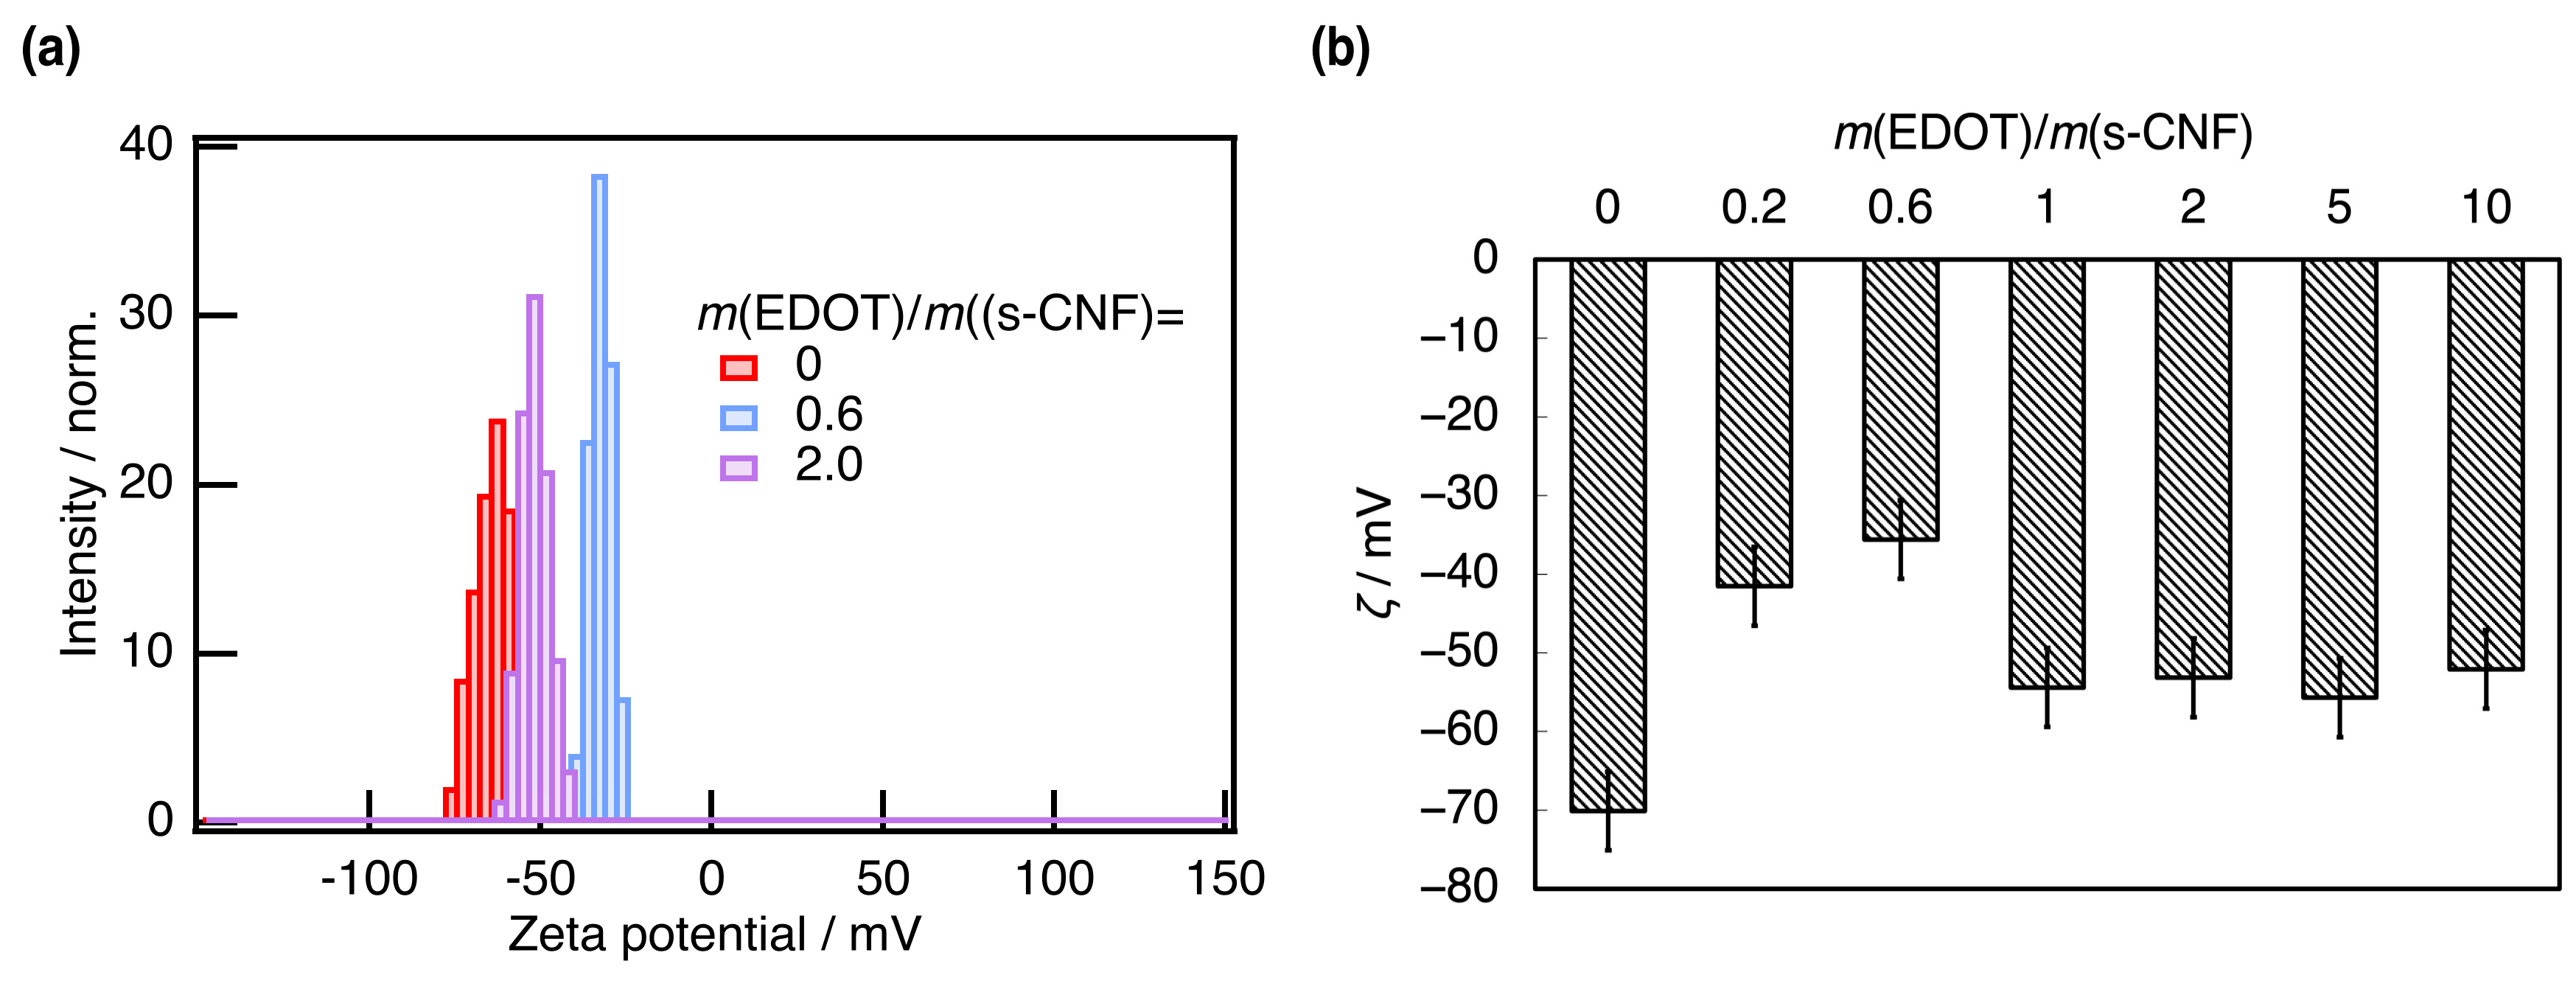
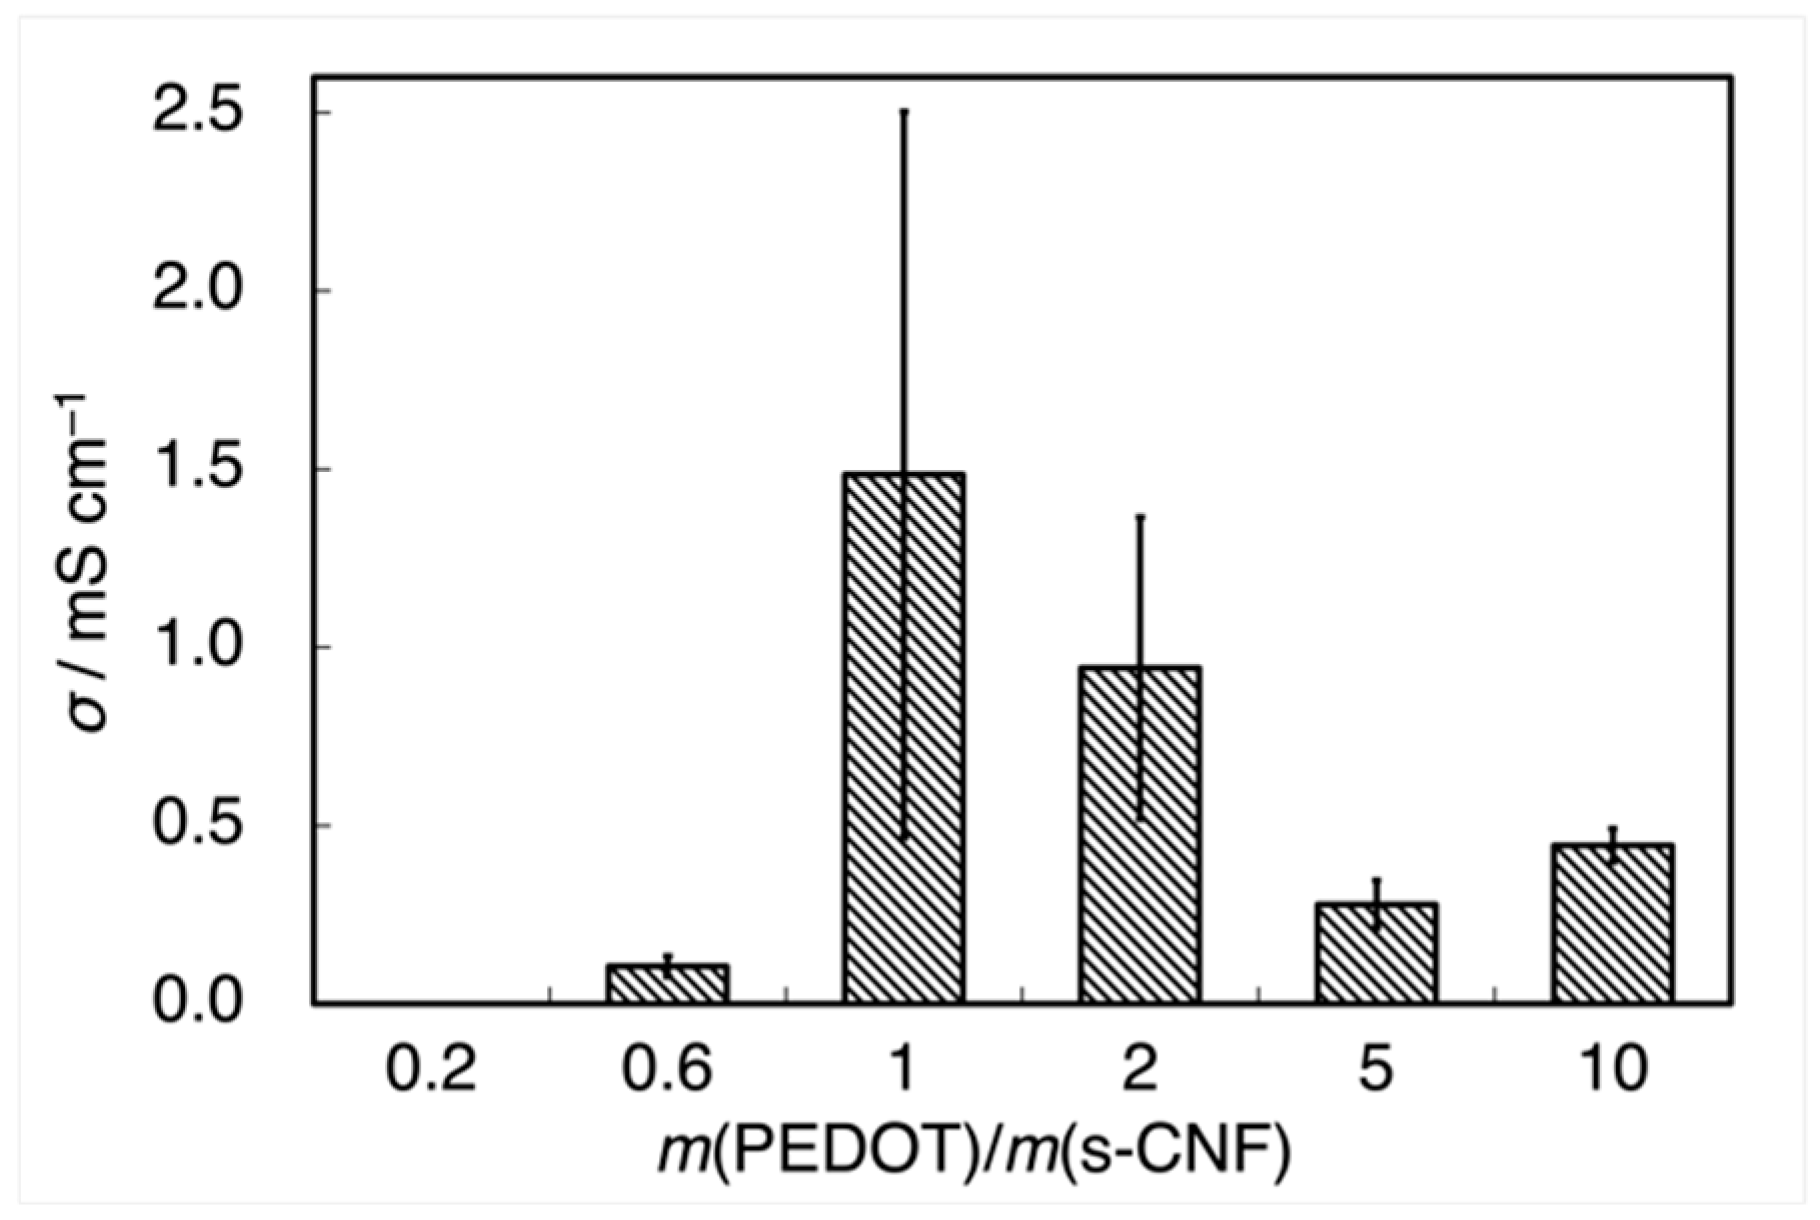
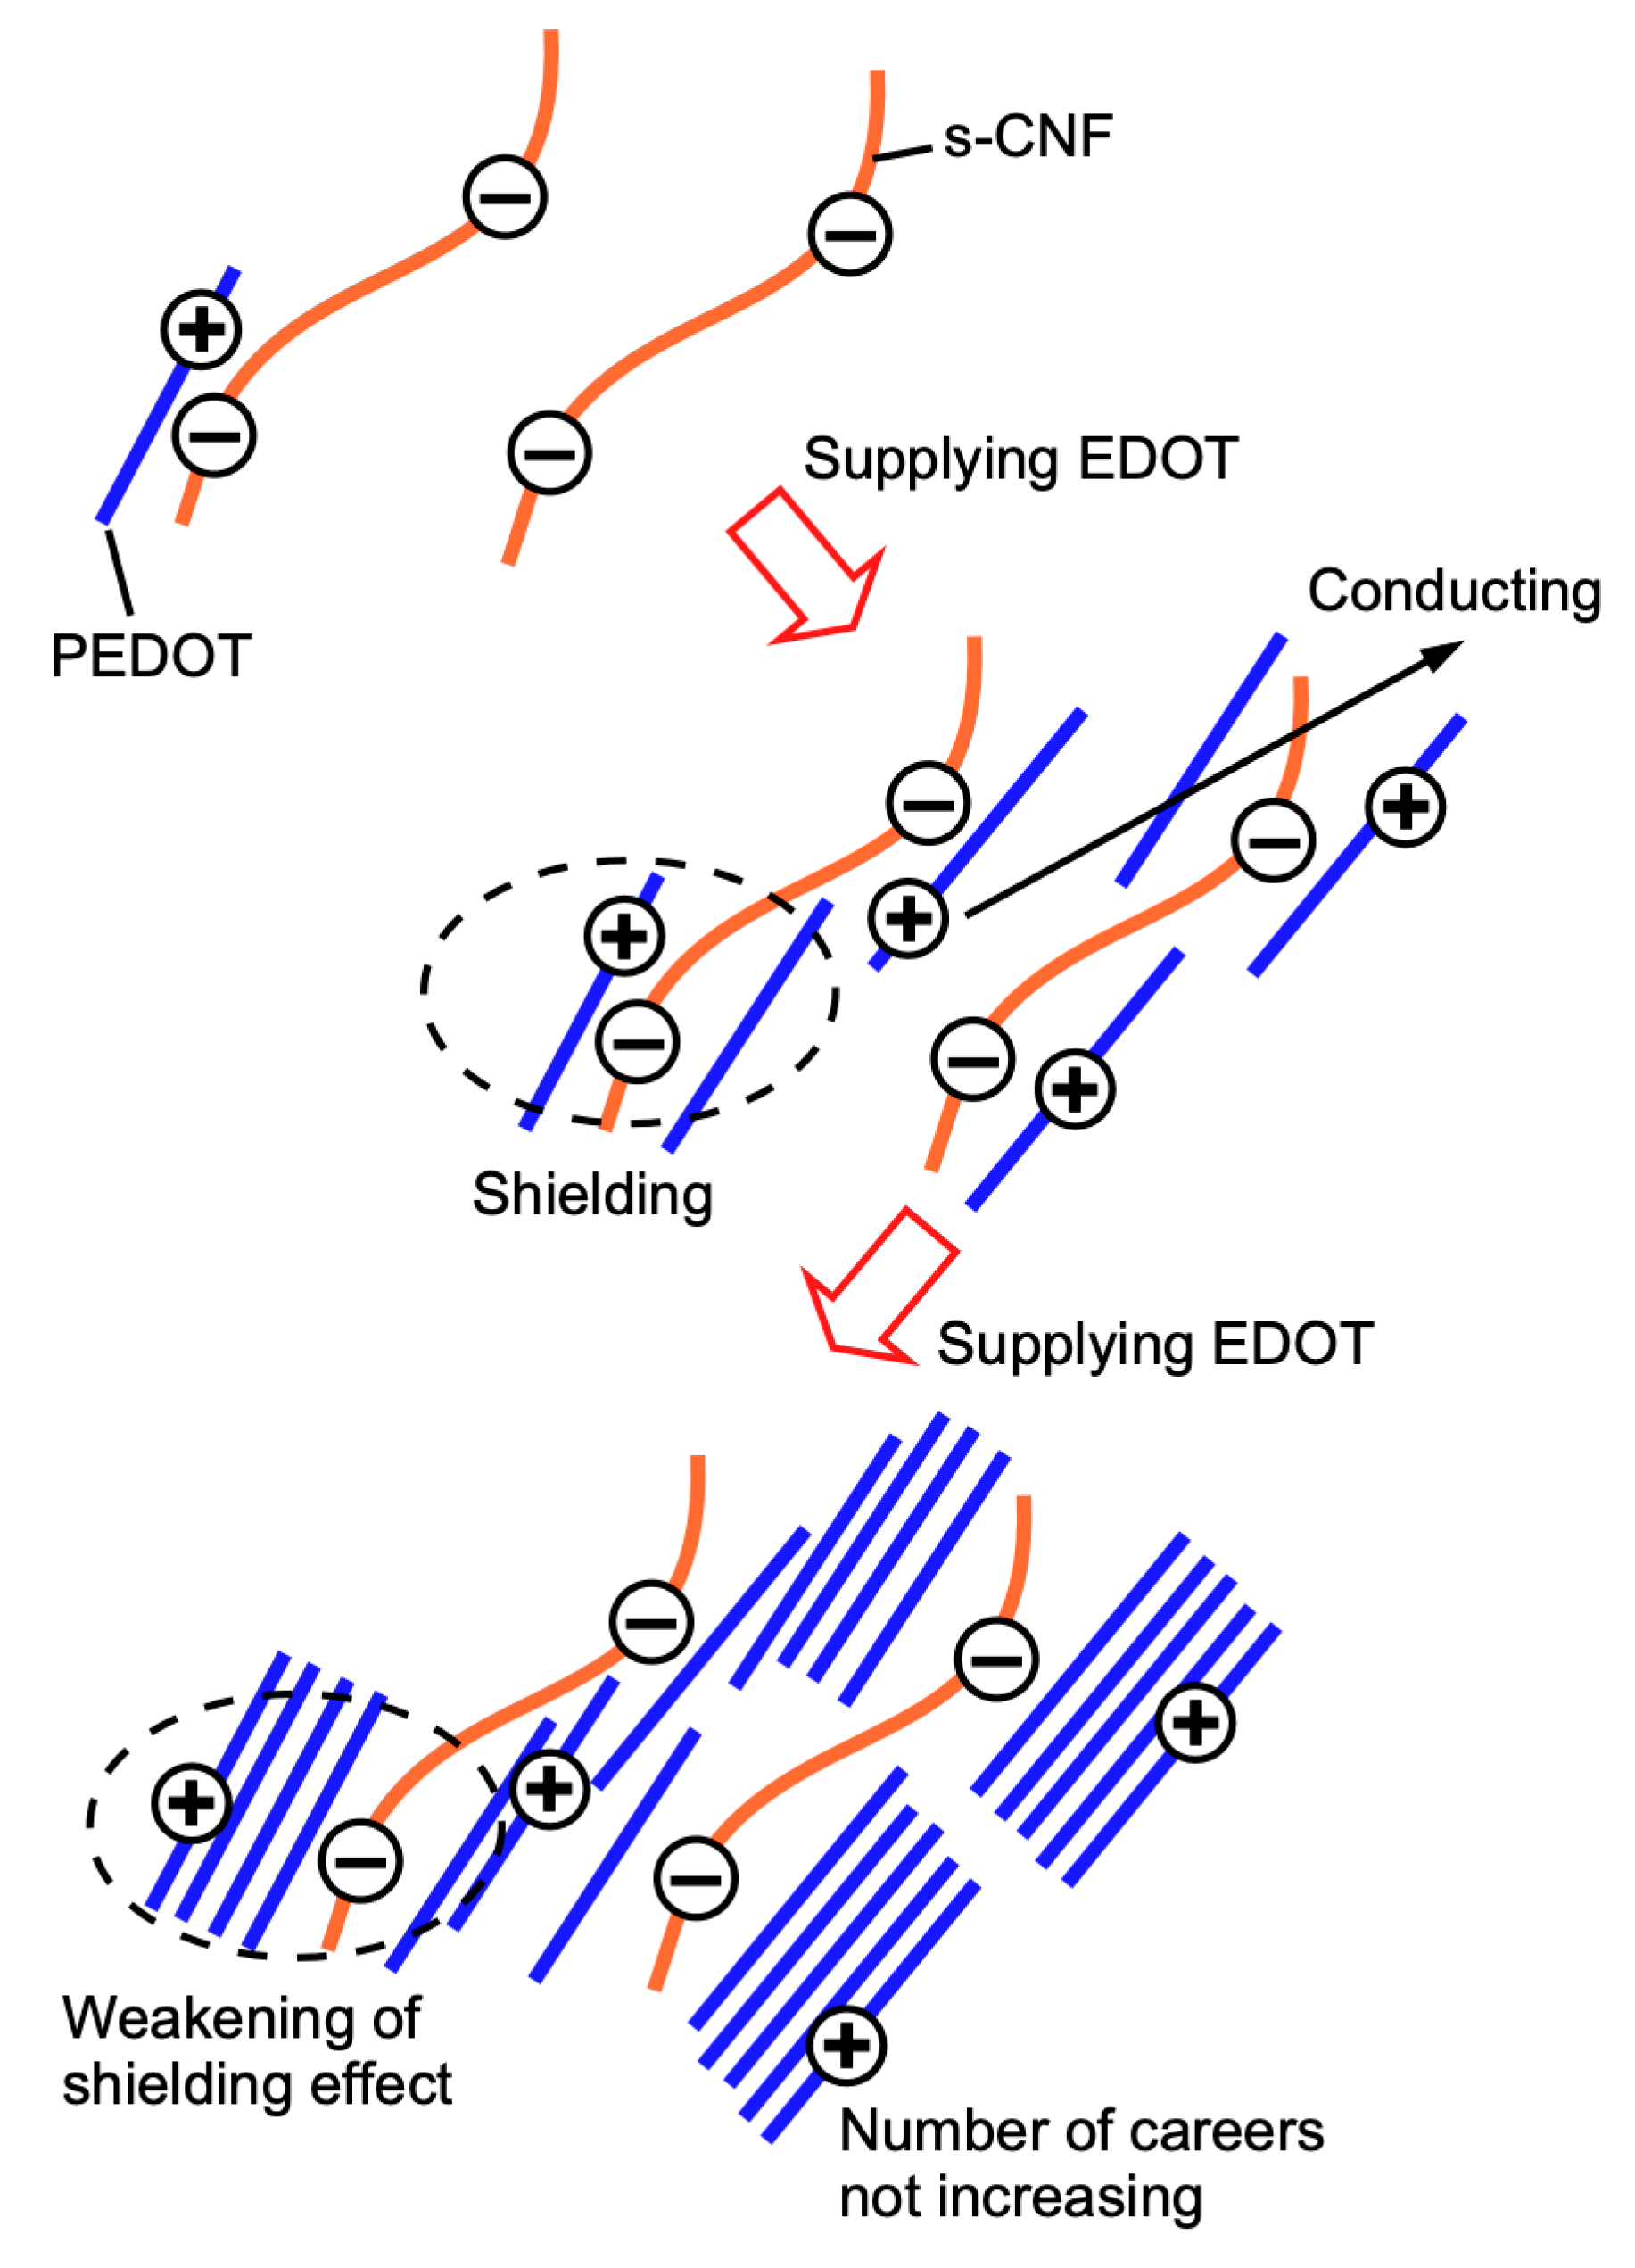
3.1. Properties of PEDOT:s-CNF
3.2. Properties of PEDOT:s-CNF:PTSA
3.3. PEDOT:s-CNF Dispersion Using s-CNF with Different DSs
4. Conclusions
Supplementary Materials
Author Contributions
Funding
Institutional Review Board Statement
Informed Consent Statement
Data Availability Statement
Acknowledgments
Conflicts of Interest
Abbreviations
| PEDOT | Poly(3,4-ethylenedioxythiophene) |
| PSS | Poly(styrene sulfonate) |
| CNF | Cellulose nanofiber |
| s-CNF | Sulfated cellulose nanofiber |
| PTSA | p-Toluenesulfonic acid |
| DBSA | Dodecylbenzenesulfonic acid |
| EDOT | 3,4-Ethylenedioxythiophene |
| DS | Degree of substitution |
| SNC | Nanocrystalline cellulose |
| KPS | Potassium persulfate |
| FT-IR | Fourier transform-infrared spectroscopy |
| UV-Vis | Ultraviolet–visible absorption |
| SEM | Scanning electron microscopy |
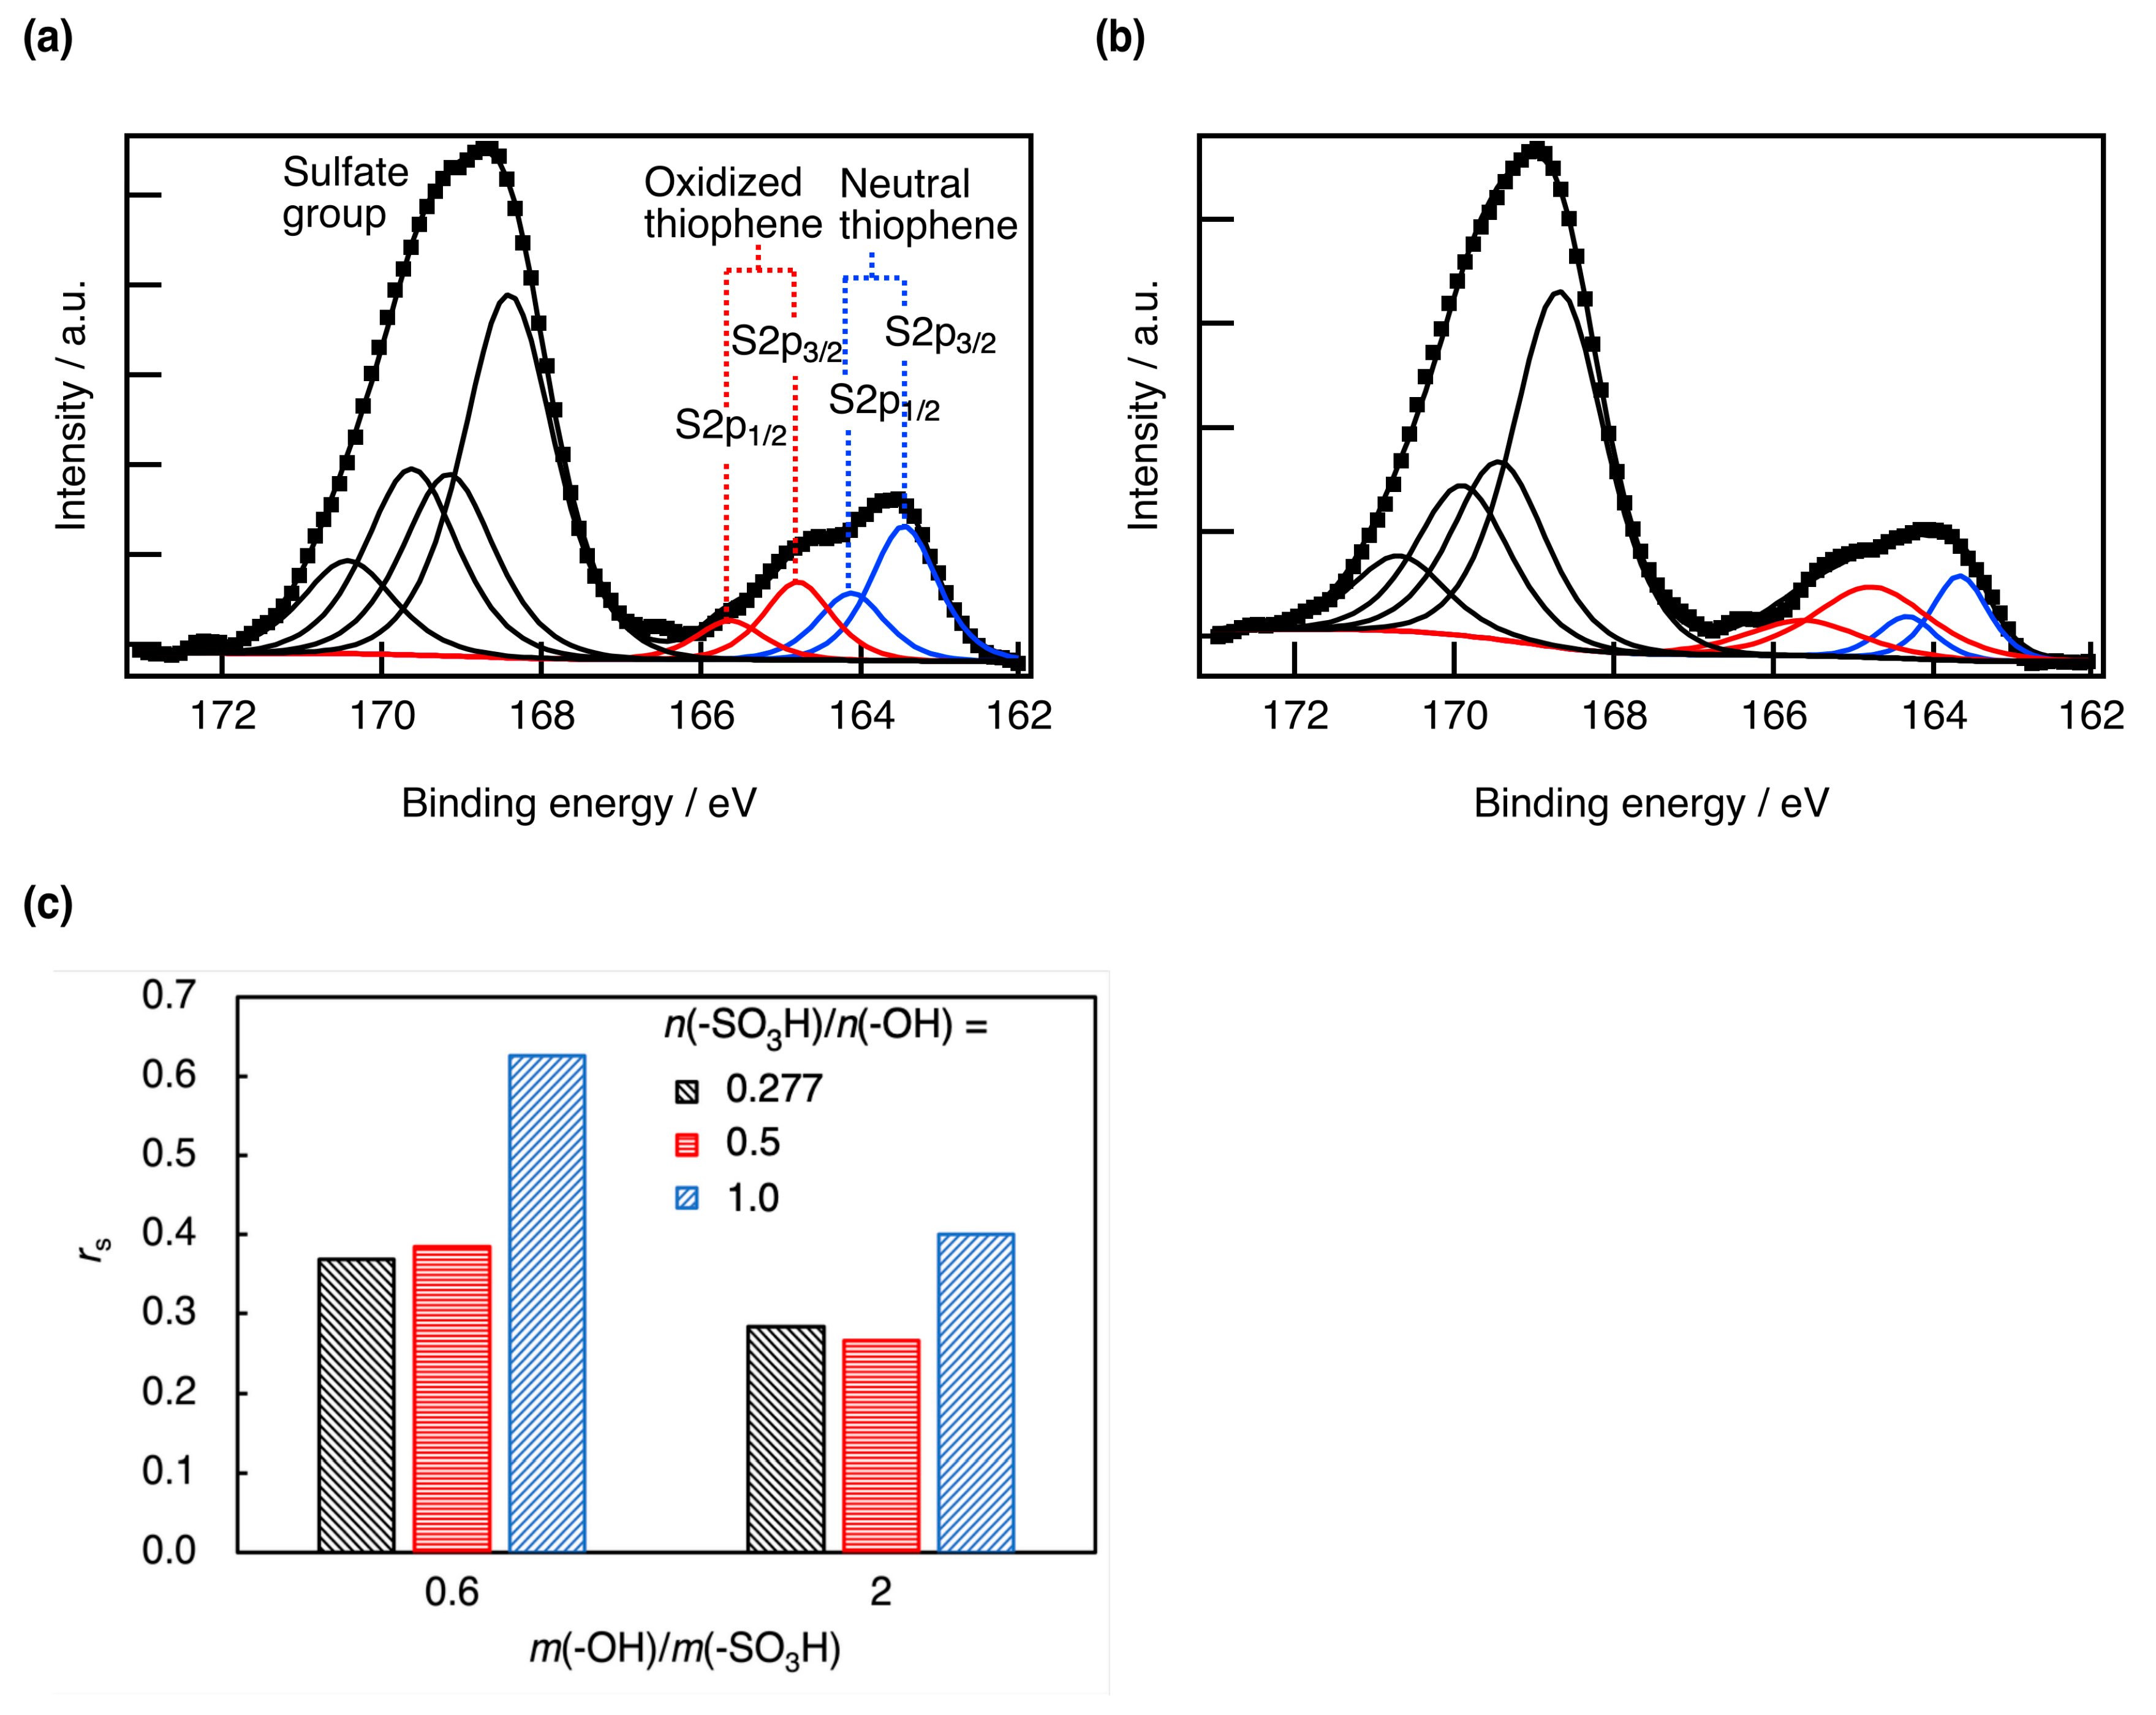
| XPS | X-ray photoelectron spectroscopy |
References
- Zhu, Z.; Liu, C.; Xu, J.; Jiang, Q.; Shi, H.; Liu, E. Improving the electrical conductivity of PEDOT: PSS films by binary secondary doping. Electron. Mater. Lett. 2016, 12, 54–58. [Google Scholar] [CrossRef]
- Crispin, X.; Marciniak, S.; Osikowicz, W.; Zotti, G.; Van der Gon, A.W.D.; Louwet, F.; Fahlman, M.; Groenendaal, L.; De Schryver, F.; Salaneck, W.R. Conductivity, morphology, interfacial chemistry and stability of poly (3,4-ethylene dioxythiophene)—Poly(styrene sulfonate): A photoelectron spectroscopy study. J. Polym. Sci. B Polym. Phys. 2003, 41, 2561–2583. [Google Scholar] [CrossRef]
- Winther-Jensen, B.; West, K. Vapor-phase polymerization of 3,4-ethylenedioxythiophene: A route to highly conducting polymer surface layers. Macromolecules 2004, 37, 4538–4543. [Google Scholar] [CrossRef]
- Tumová, S.; Malečková, R.; Kubáč, L.; Akrman, J.; Enev, V.; Kalina, L.; Vojtková, E.; Pešková, M.; Víteček, J.; Vala, M.; et al. Novel highly stable conductive polymer composite PEDOT: DBSA for bioelectronic applications. Polym. J. 2023, 55, 983–995. [Google Scholar] [CrossRef]
- Lv, R.; Sun, Y.; Yu, F.; Zhang, H. Fabrication of poly (3,4-ethylenedioxythiophene)-polysaccharide composites. J. Appl. Polym. Sci. 2012, 124, 855–863. [Google Scholar] [CrossRef]
- Kreuzer, L.P.; Betker, M.; Wolf, M.; Niebuur, B.J.; Ollivier, J.; Söderberg, L.D.; Roth, S.V. Impact of humidity on water dynamics and electrical conductivity in PEDOT:PSS/cellulose nanofibril nanocomposite films: Insights from quasi-elastic neutron scattering. Macromolecules, 2025; in press. [Google Scholar] [CrossRef]
- Lee, S.; Kim, D.; Meresa, A.A.; Chang, S.T.; Kim, F.S. Compatibility of cellulose-PEDOT:PSS composites and anions in solid-state organic electrochemical transistors. Carbohydr. Polym. 2025, 352, 123146. [Google Scholar] [CrossRef]
- Brooke, R.; Lay, M.; Jain, K.; Francon, H.; Say, M.G.; Belaineh, D.; Wang, X.; Håkansson, K.M.O.; Wågberg, L.; Engquist, I.; et al. Nanocellulose and PEDOT: PSS composites and their applications. Polym. Rev. 2023, 63, 437–477. [Google Scholar] [CrossRef]
- Zhou, S.Y.; Qiu, Z.; Stromme, M.; Wang, Z.H. Highly Crystalline PEDOT Nanofiber Templated by Highly Crystalline Nanocellulose. Adv. Funct. Mater. 2020, 30, 2005757. [Google Scholar] [CrossRef]
- Belaineh, D.; Andreasen, J.W.; Palisaitis, J.; Malti, A.; Håkansson, K.; Wågberg, L.; Crispin, X.; Engquist, I.; Berggren, M. Controlling the Organization of PEDOT: PSS on Cellulose Structures. ACS Appl. Polym. Mater. 2019, 1, 2342–2351. [Google Scholar] [CrossRef]
- Horikawa, M.; Fujiki, T.; Shirosaki, T.; Ryu, N.; Sakurai, H.; Nagaoka, S.; Ihara, H. The development of a highly conductive PEDOT system by doping with partially crystalline sulfated cellulose and its electric conductivity. J. Mater. Chem. C 2015, 3, 8881–8887. [Google Scholar] [CrossRef]
- Feng, X.; Wang, X.J.; Wang, M.; Zhou, S.H.; Dang, C.; Zhang, C.Z.; Chen, Y.; Qi, H.S. Novel PEDOT dispersion by in-situ polymerization based on sulfated nanocellulose. Chem. Eng. J. 2021, 418, 129533. [Google Scholar] [CrossRef]
- Li, J.X.; Simayi, R.; Abdiryim, T.; Jamal, R.; Helil, Z.; Zhang, H.J. Synthesis of poly (3,4-ethylenedioxythiophene)/sulfonated cellulose composites in different systems for the electrochemical sensing of paracetamol. Cellulose 2021, 28, 5559–5576. [Google Scholar] [CrossRef]
- Liu, H.; Geng, S.; Hu, P.; Qin, Q.; Wei, C.; Lv, J. Study of Pickering emulsion stabilized by sulfonated cellulose nanowhiskers extracted from sisal fiber. Colloid Polym. Sci. 2015, 293, 963–974. [Google Scholar] [CrossRef]
- Sun, F.; Liu, W.; Dong, Z.; Deng, Y. Underwater superoleophobicity cellulose nanofibril aerogel through regioselective sulfonation for oil/water separation. Chem. Eng. J. 2017, 330, 774–782. [Google Scholar] [CrossRef]
- Shaabani, A.; Rahmati, A.; Badri, Z. Sulfonated cellulose and starch: New biodegradable and renewable solid acid catalysts for efficient synthesis of quinolines. Catal. Commun. 2008, 9, 13–16. [Google Scholar] [CrossRef]
- Yoshida, K.; Nagaoka, S.; Horikawa, M.; Noguchi, H.; Ihara, H. Totally-organic near-infrared shielding materials by conductive cellulose nanofibers. Thin Solid Films 2020, 709, 138221. [Google Scholar] [CrossRef]
- Shallcross, R.C.; Stubhan, T.; Ratcliff, E.L.; Kahn, A.; Brabec, C.J.; Armstrong, N.R. Quantifying the extent of contact doping at the interface between high work function electrical contacts and poly (3-hexylthiophene) (P3HT). J. Phys. Chem. Lett. 2015, 6, 1303–1309. [Google Scholar] [CrossRef] [PubMed]
- Bubnova, O.; Khan, Z.U.; Malti, A.; Braun, S.; Fahlman, M.; Berggren, M.; Crispin, X. Optimization of the thermoelectric figure of merit in the conducting polymer poly (3,4-ethylenedioxythiophene). Nat. Mater. 2011, 10, 429–433. [Google Scholar] [CrossRef] [PubMed]


Disclaimer/Publisher’s Note: The statements, opinions and data contained in all publications are solely those of the individual author(s) and contributor(s) and not of MDPI and/or the editor(s). MDPI and/or the editor(s) disclaim responsibility for any injury to people or property resulting from any ideas, methods, instructions or products referred to in the content. |
© 2025 by the authors. Licensee MDPI, Basel, Switzerland. This article is an open access article distributed under the terms and conditions of the Creative Commons Attribution (CC BY) license (https://creativecommons.org/licenses/by/4.0/).
Share and Cite
Takahashi, N.; Ogo, A.; Shimomura, T. Polymerization of Poly(3,4-ethylenedioxythiophene) on Sulfated Cellulose Nanofiber and Its Conducting Property. Materials 2025, 18, 1273. https://doi.org/10.3390/ma18061273
Takahashi N, Ogo A, Shimomura T. Polymerization of Poly(3,4-ethylenedioxythiophene) on Sulfated Cellulose Nanofiber and Its Conducting Property. Materials. 2025; 18(6):1273. https://doi.org/10.3390/ma18061273
Chicago/Turabian StyleTakahashi, Naofumi, Atsuya Ogo, and Takeshi Shimomura. 2025. "Polymerization of Poly(3,4-ethylenedioxythiophene) on Sulfated Cellulose Nanofiber and Its Conducting Property" Materials 18, no. 6: 1273. https://doi.org/10.3390/ma18061273
APA StyleTakahashi, N., Ogo, A., & Shimomura, T. (2025). Polymerization of Poly(3,4-ethylenedioxythiophene) on Sulfated Cellulose Nanofiber and Its Conducting Property. Materials, 18(6), 1273. https://doi.org/10.3390/ma18061273