
Numerical Investigation and Multi-Objective Optimization on Forming Quality of CFRP/Al Self-Piercing Riveting Joint


Abstract
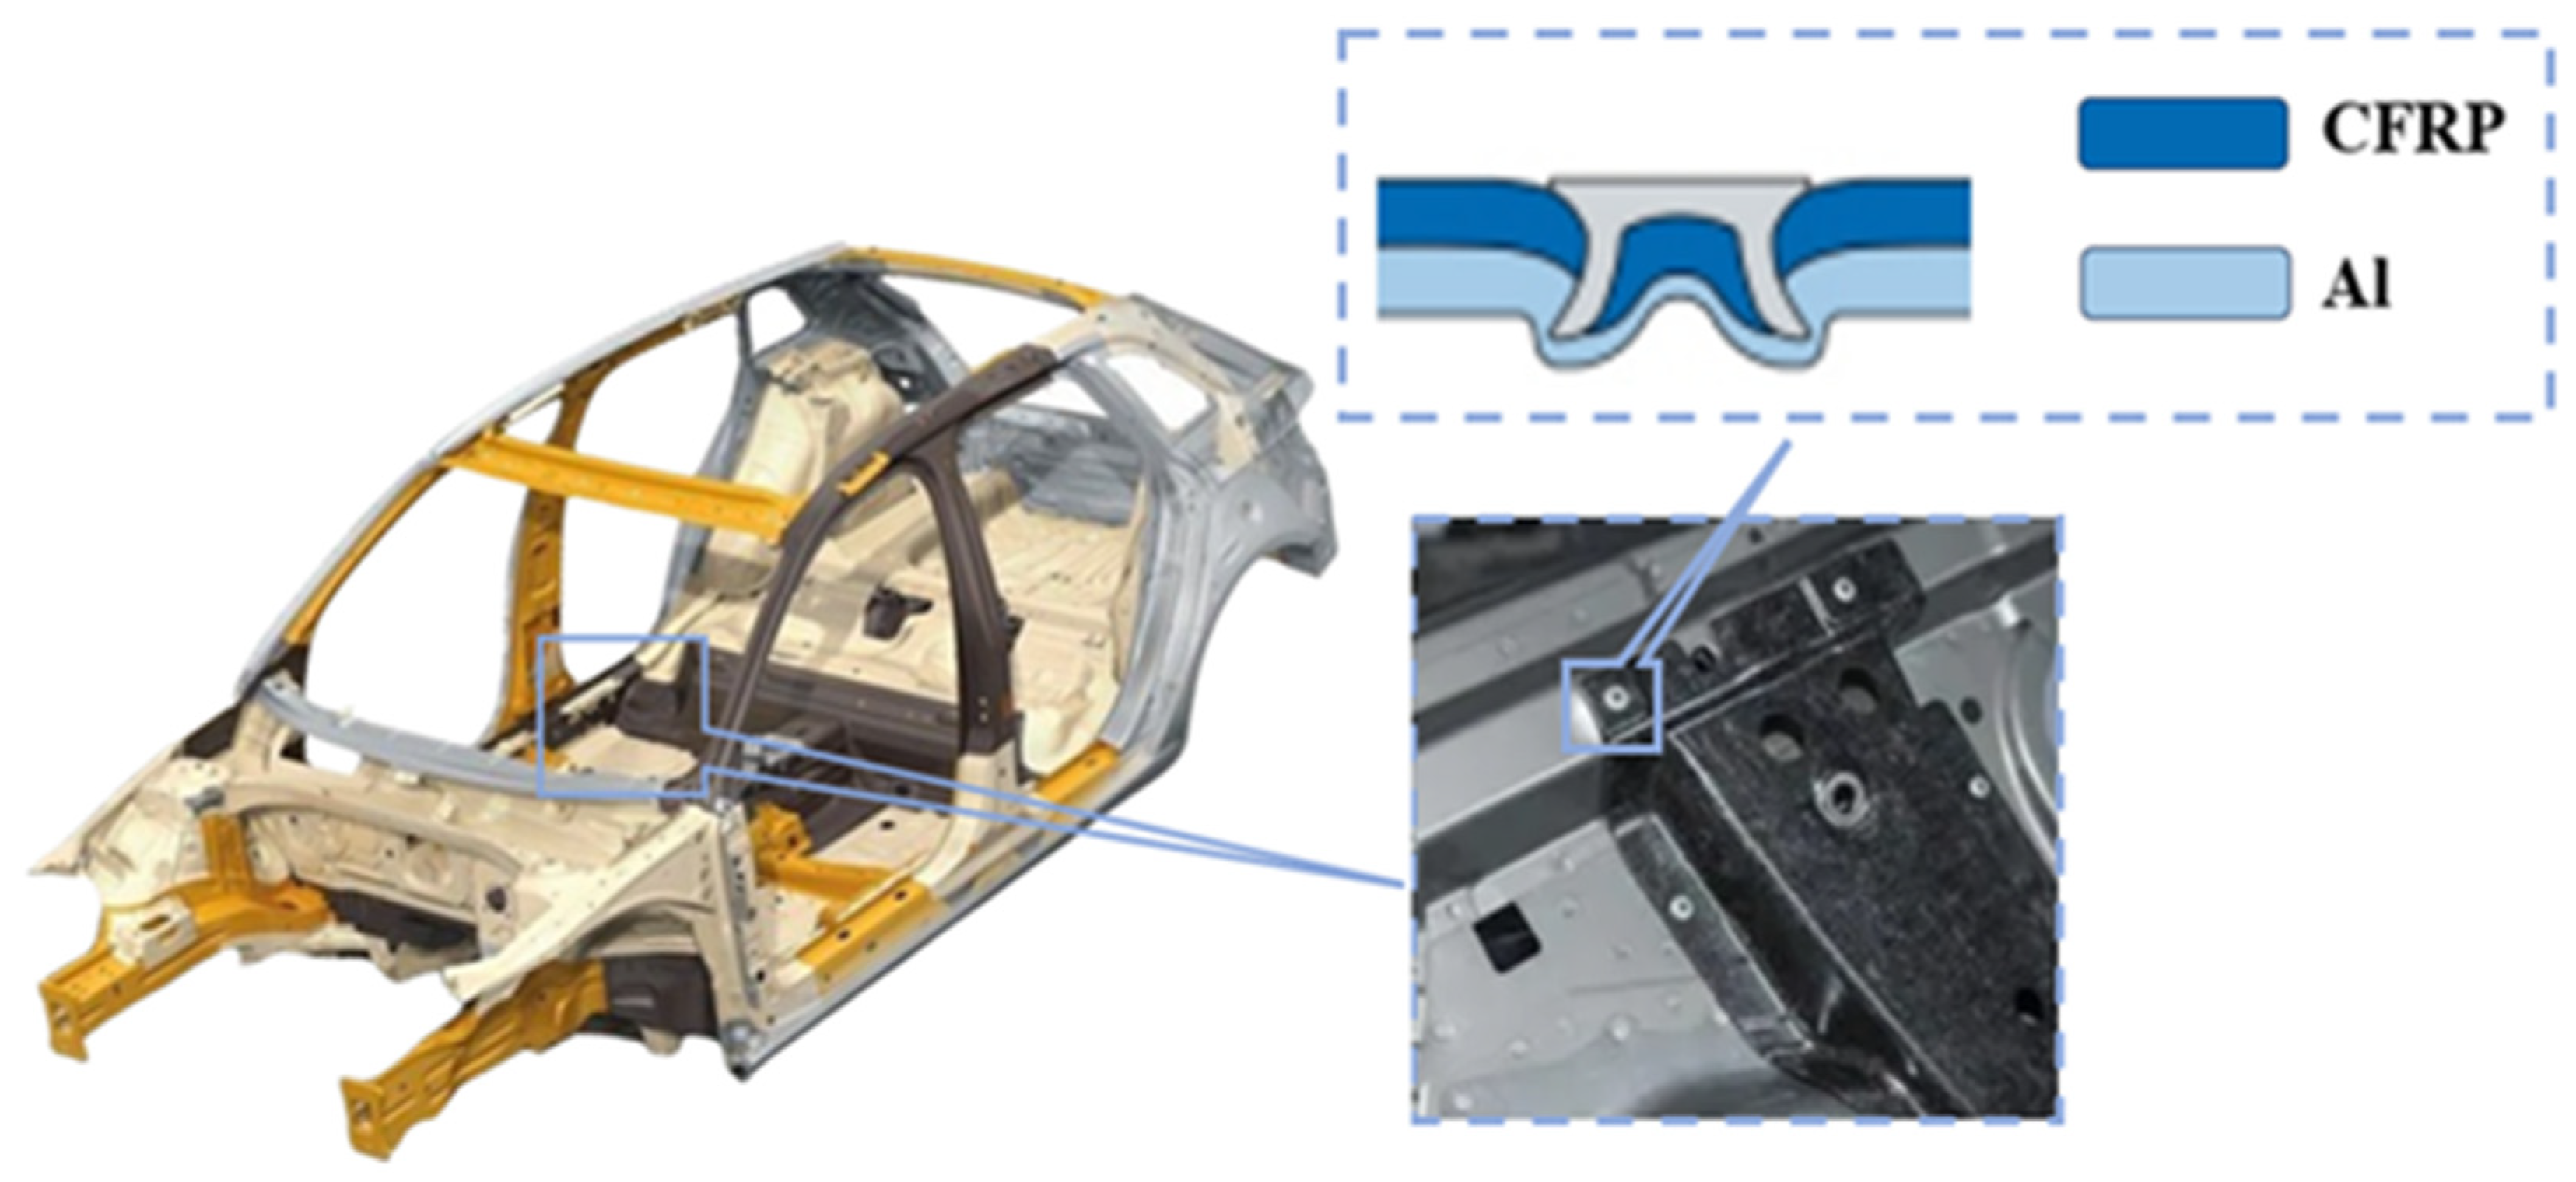
1. Introduction
2. Material Properties and Behaviors
2.1. Aluminum Alloy(Al) Plate
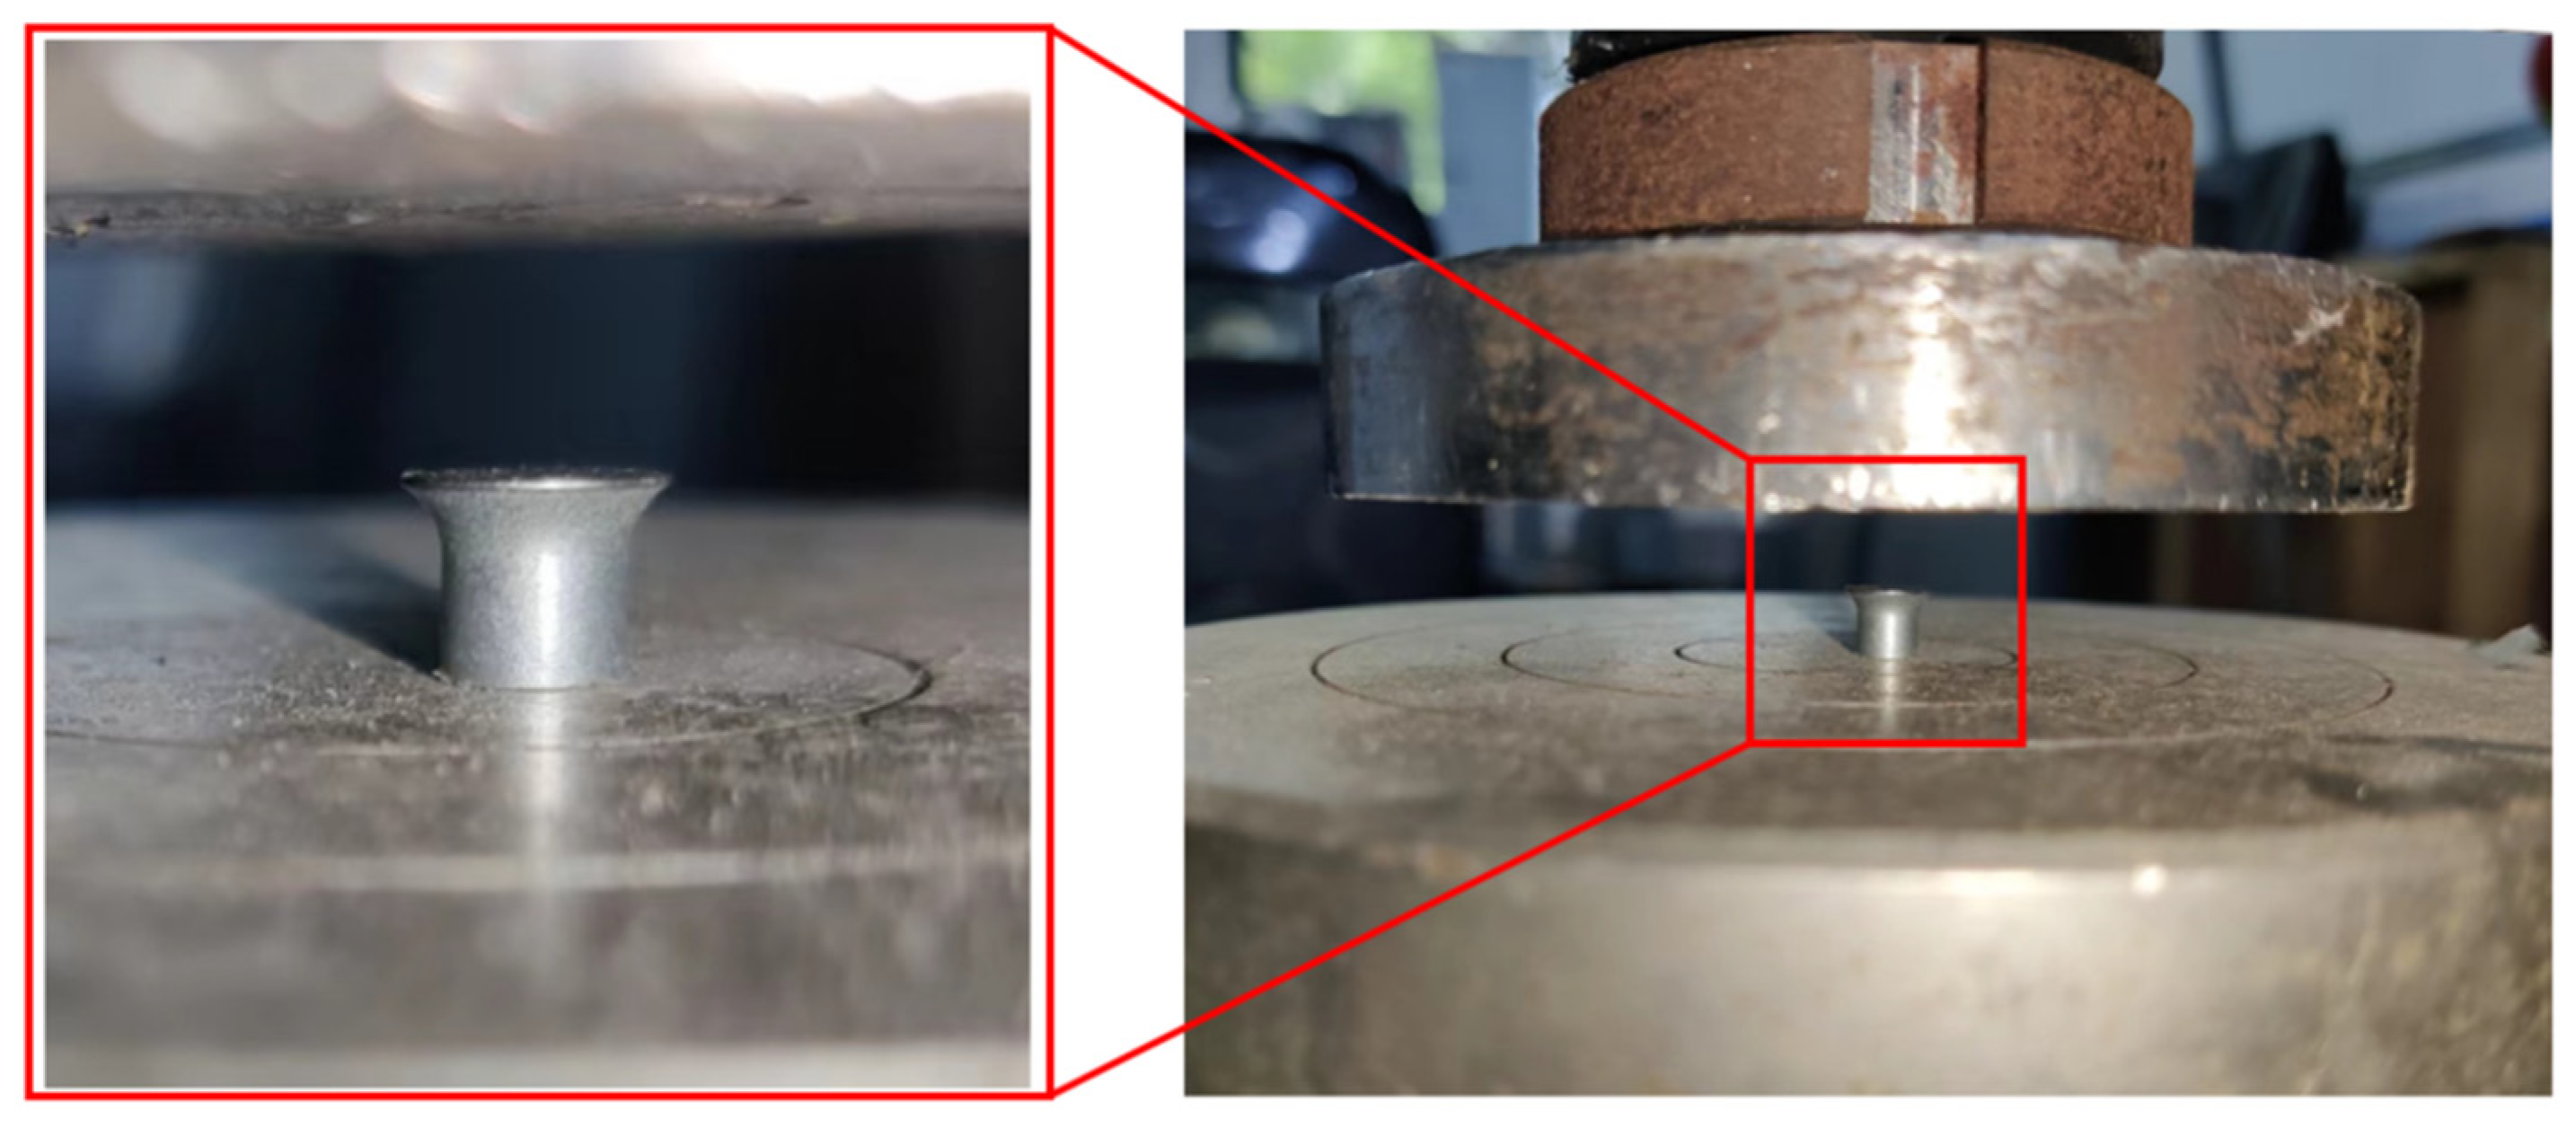
2.2. Self-Piercing Rivet
2.3. CFRP Plate
2.3.1. Constitutive Model
2.3.2. Damage Initiation Criterion and Evolution
2.3.3. Interlaminar Damage Model
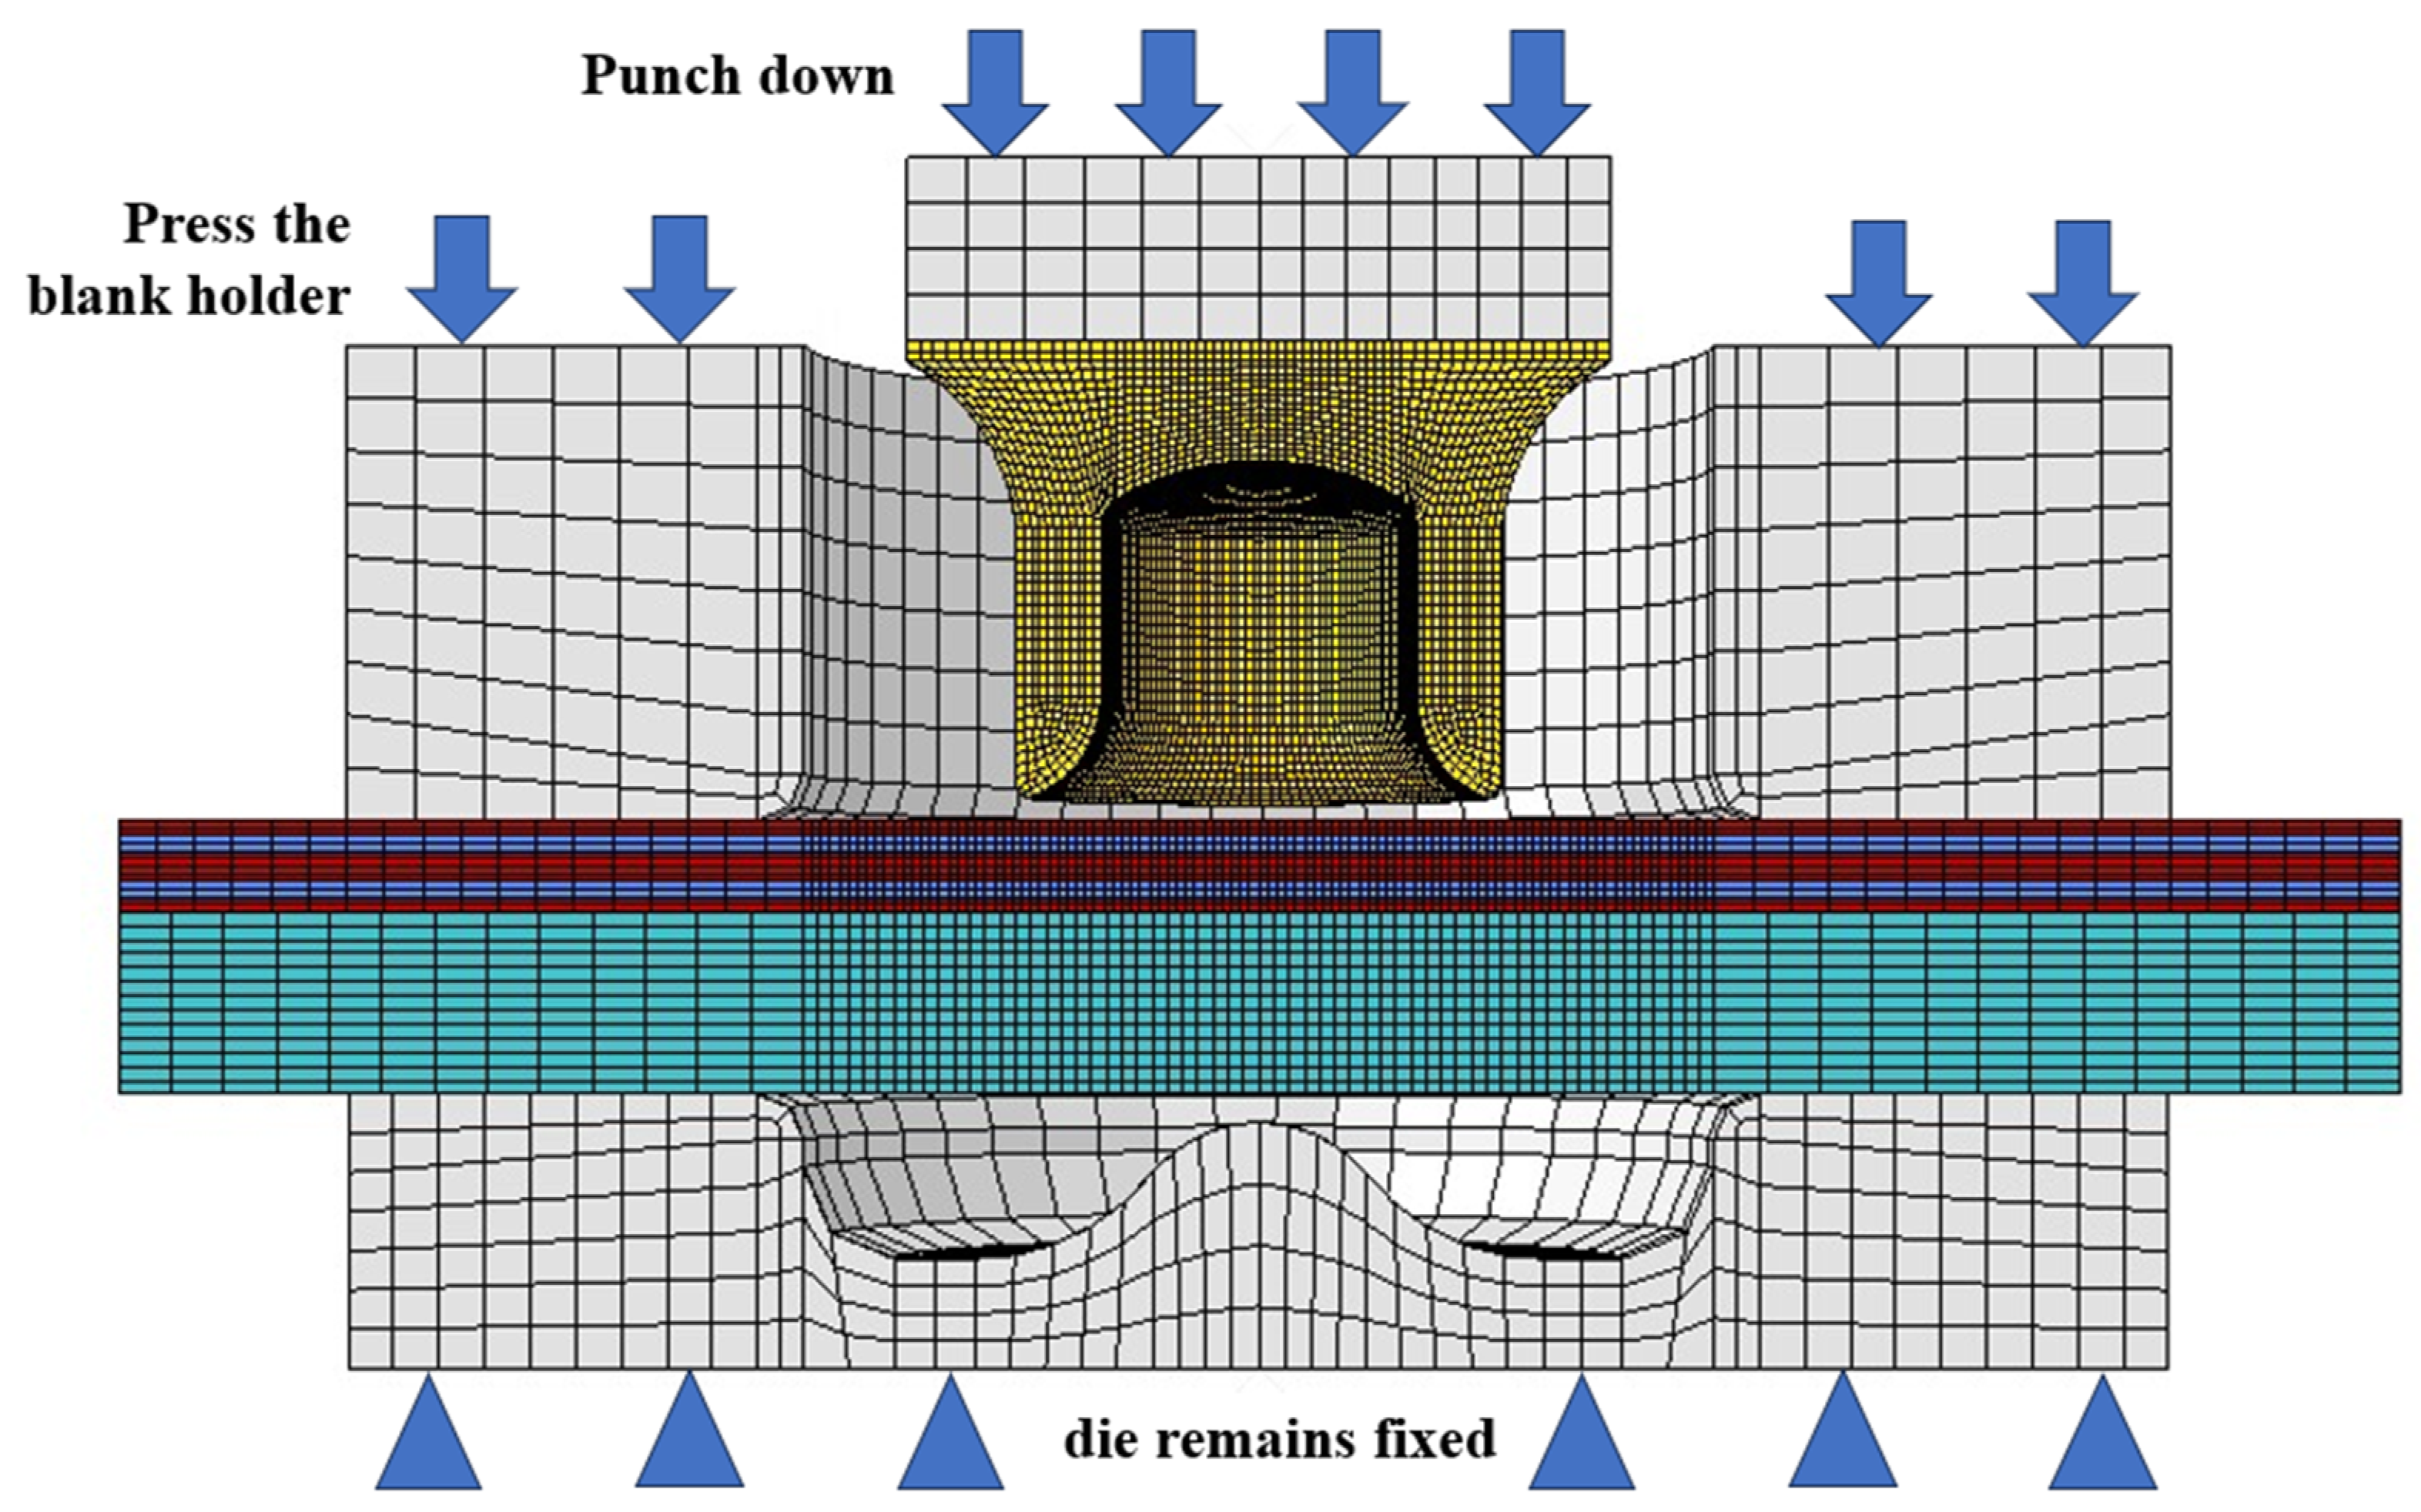
3. FE Modeling and Verification
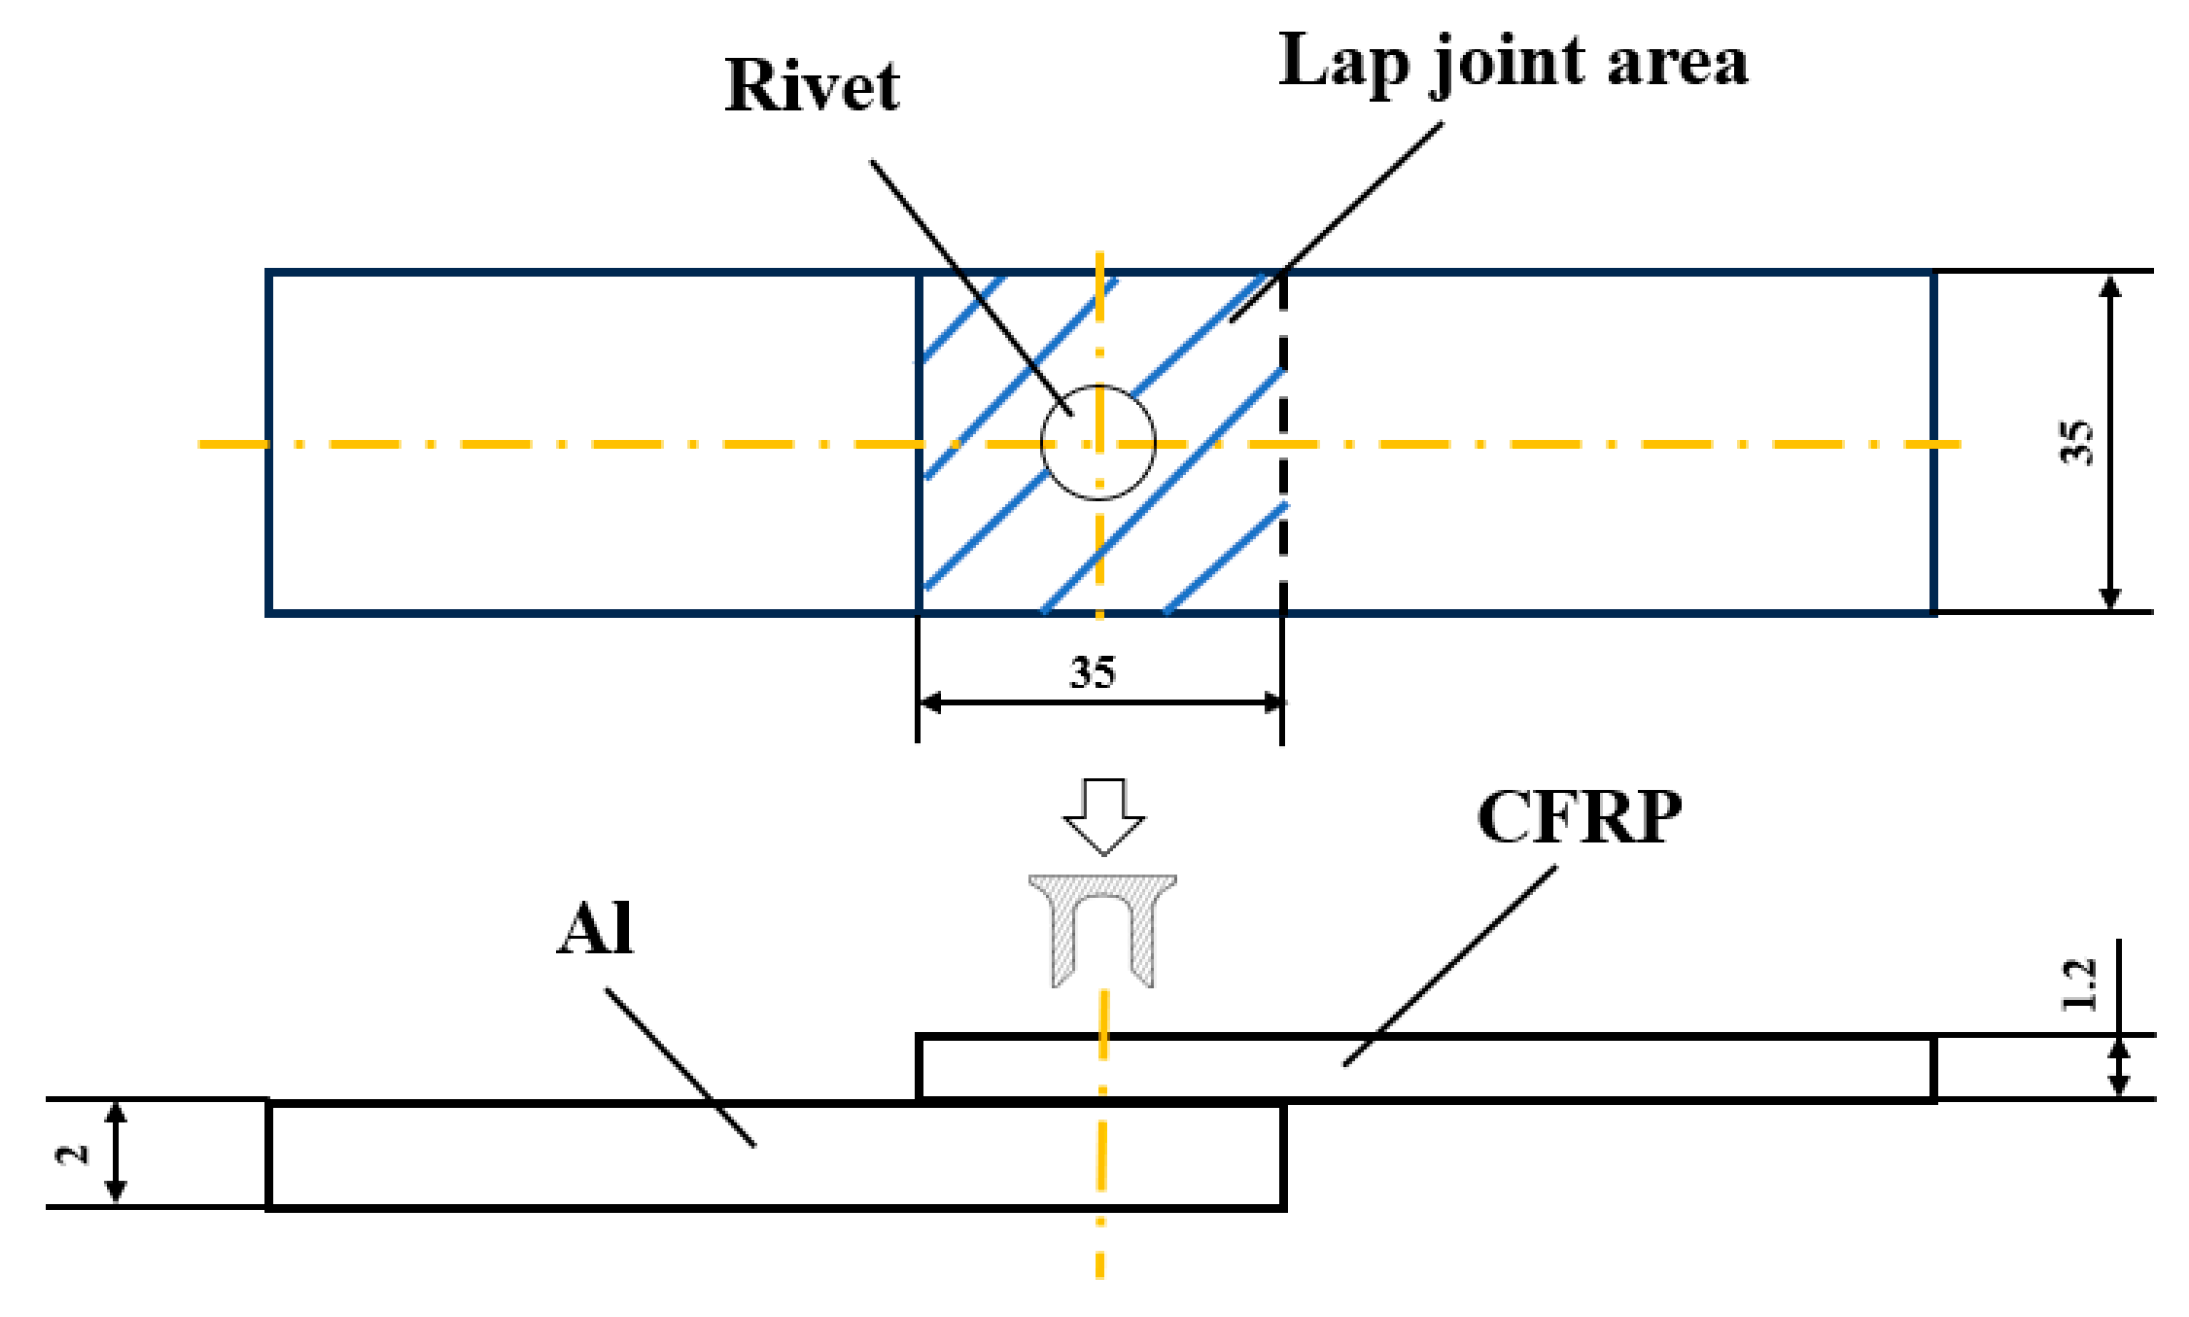
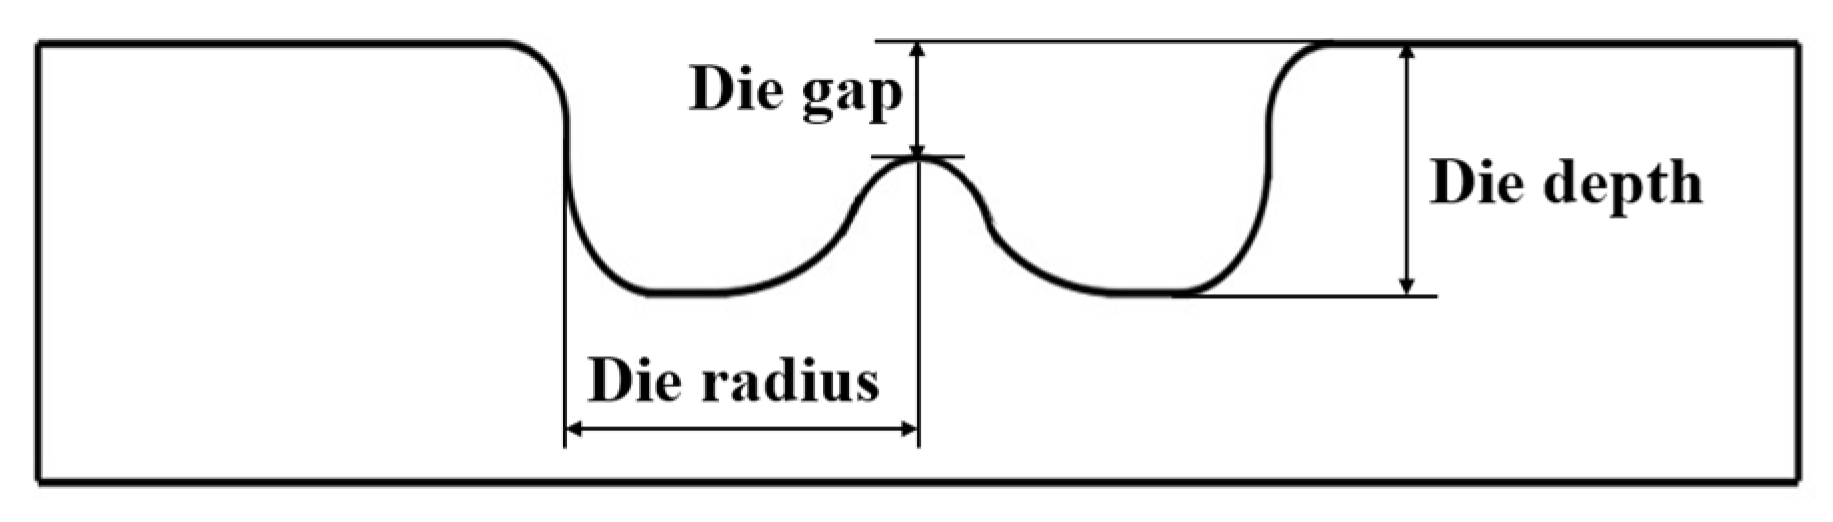
3.1. Geometry Configuration
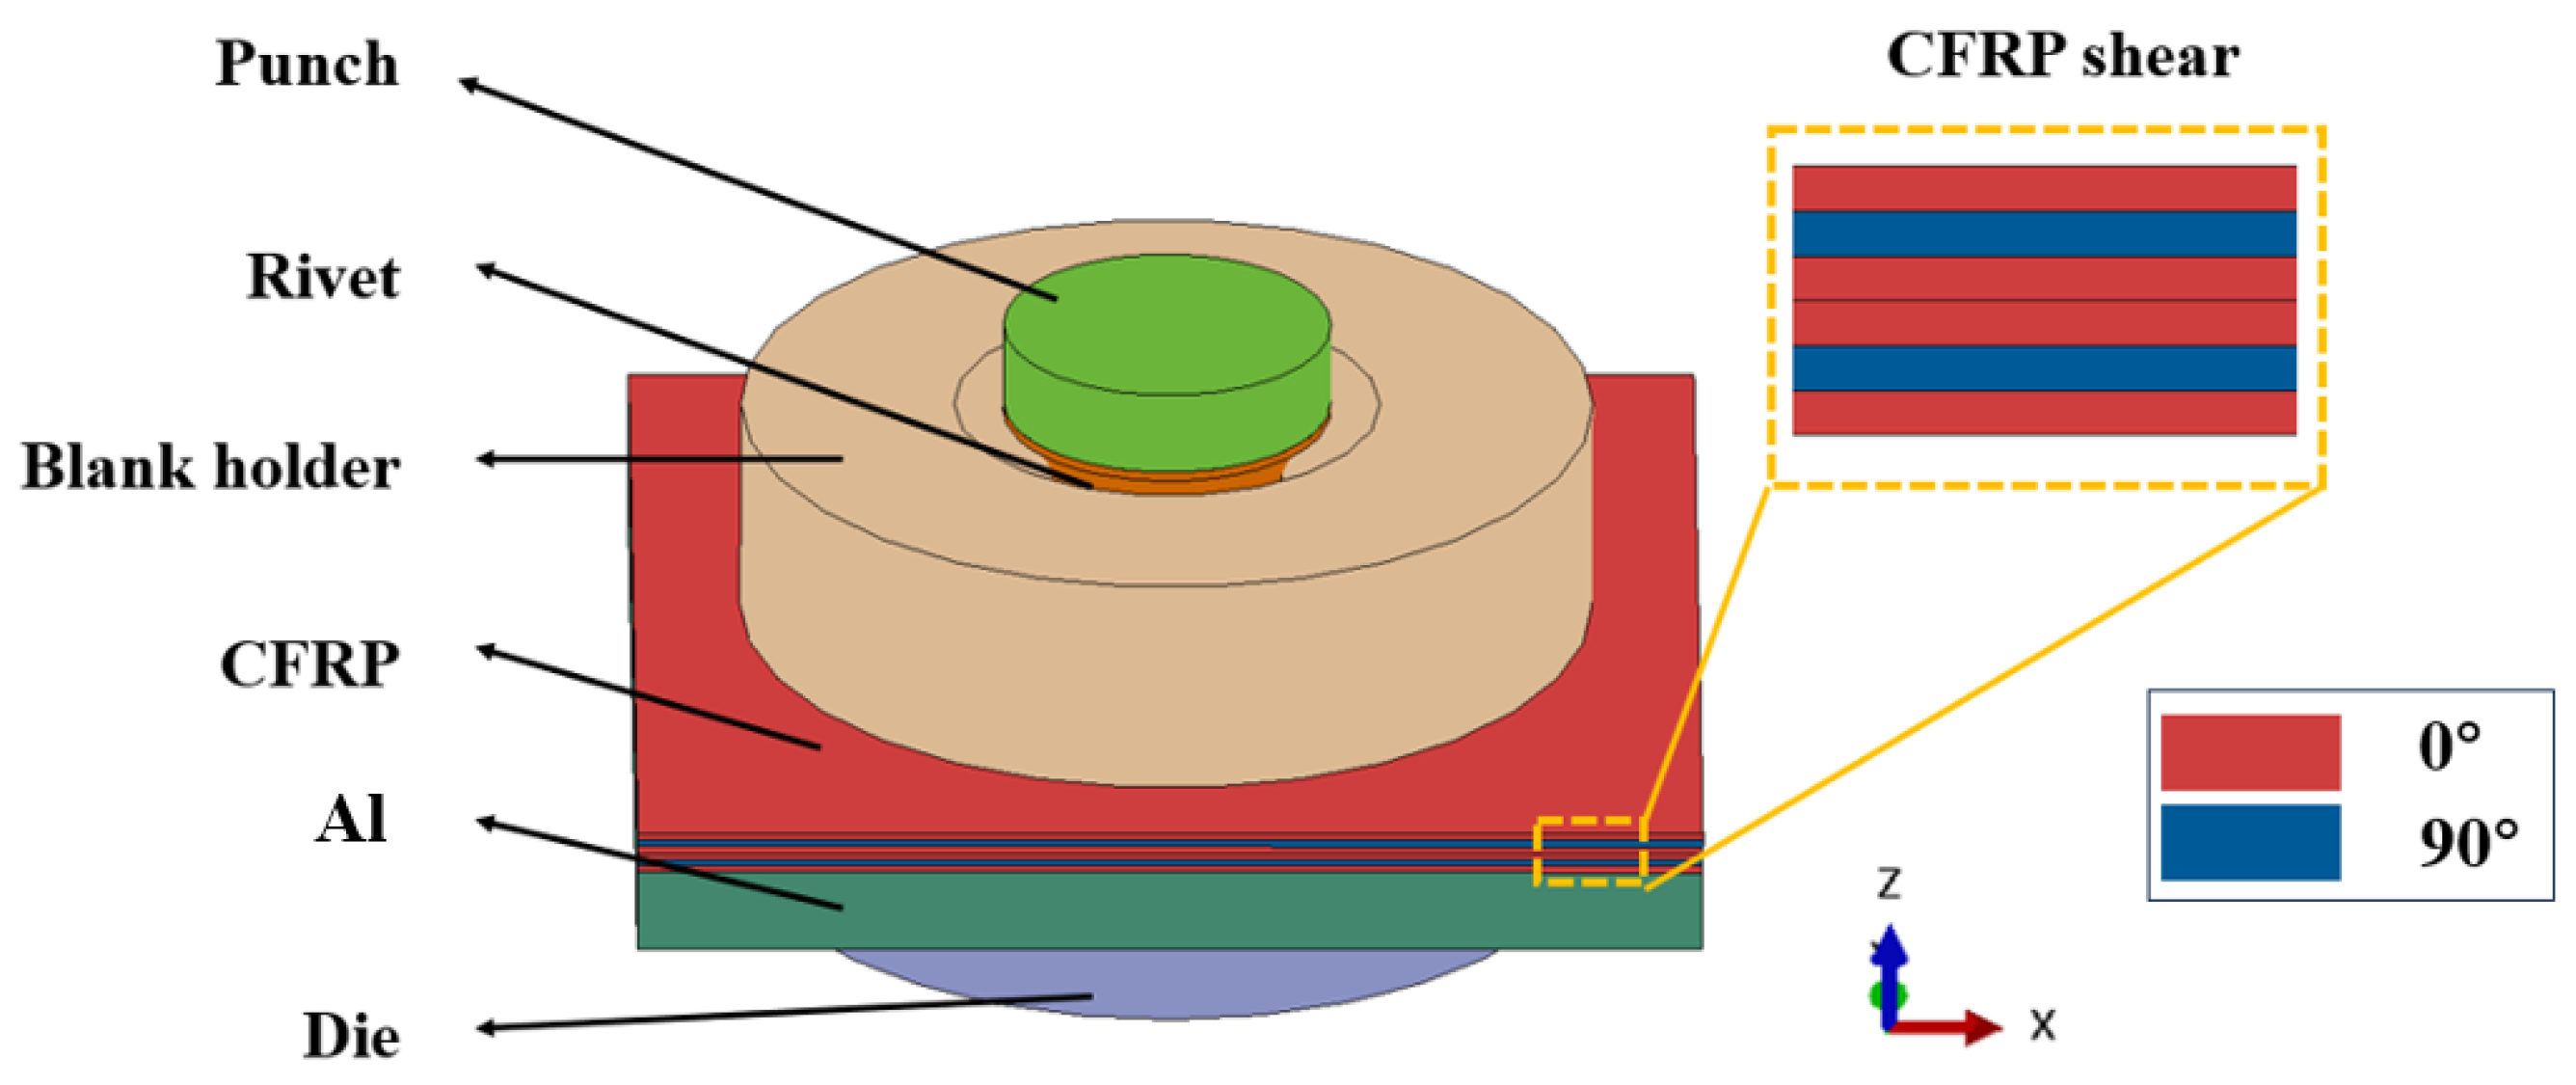
3.2. FE Modeling
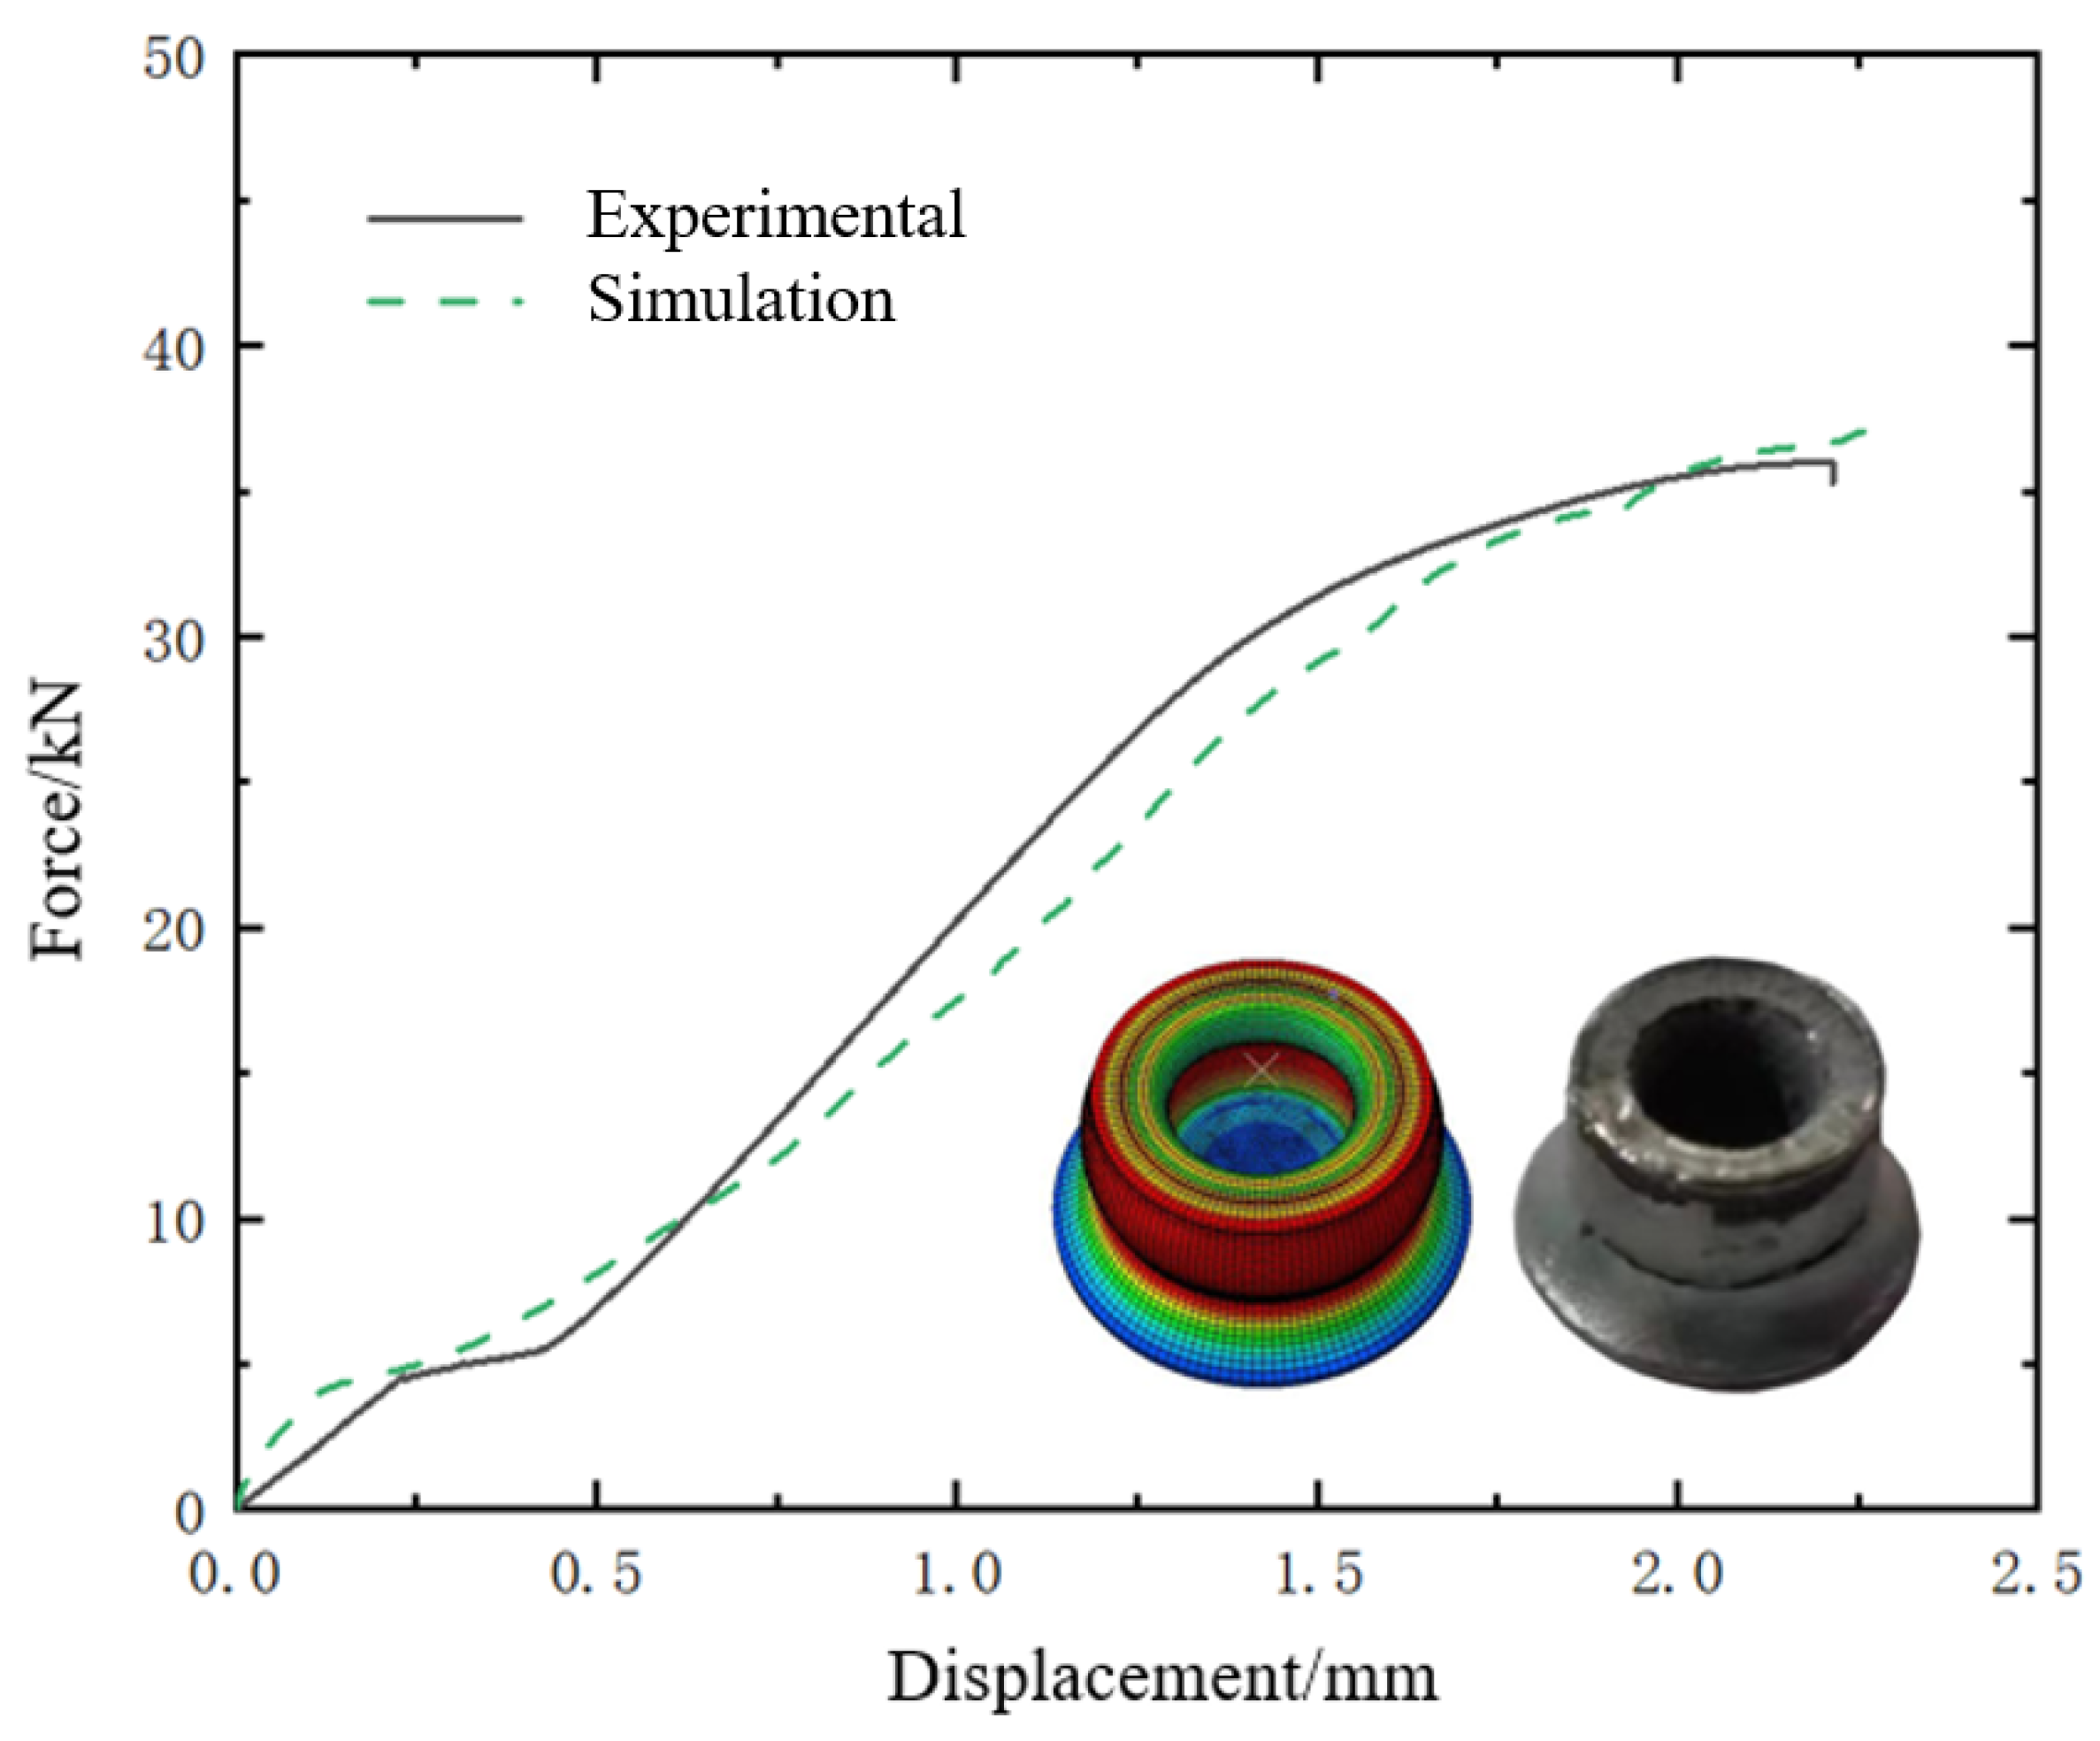
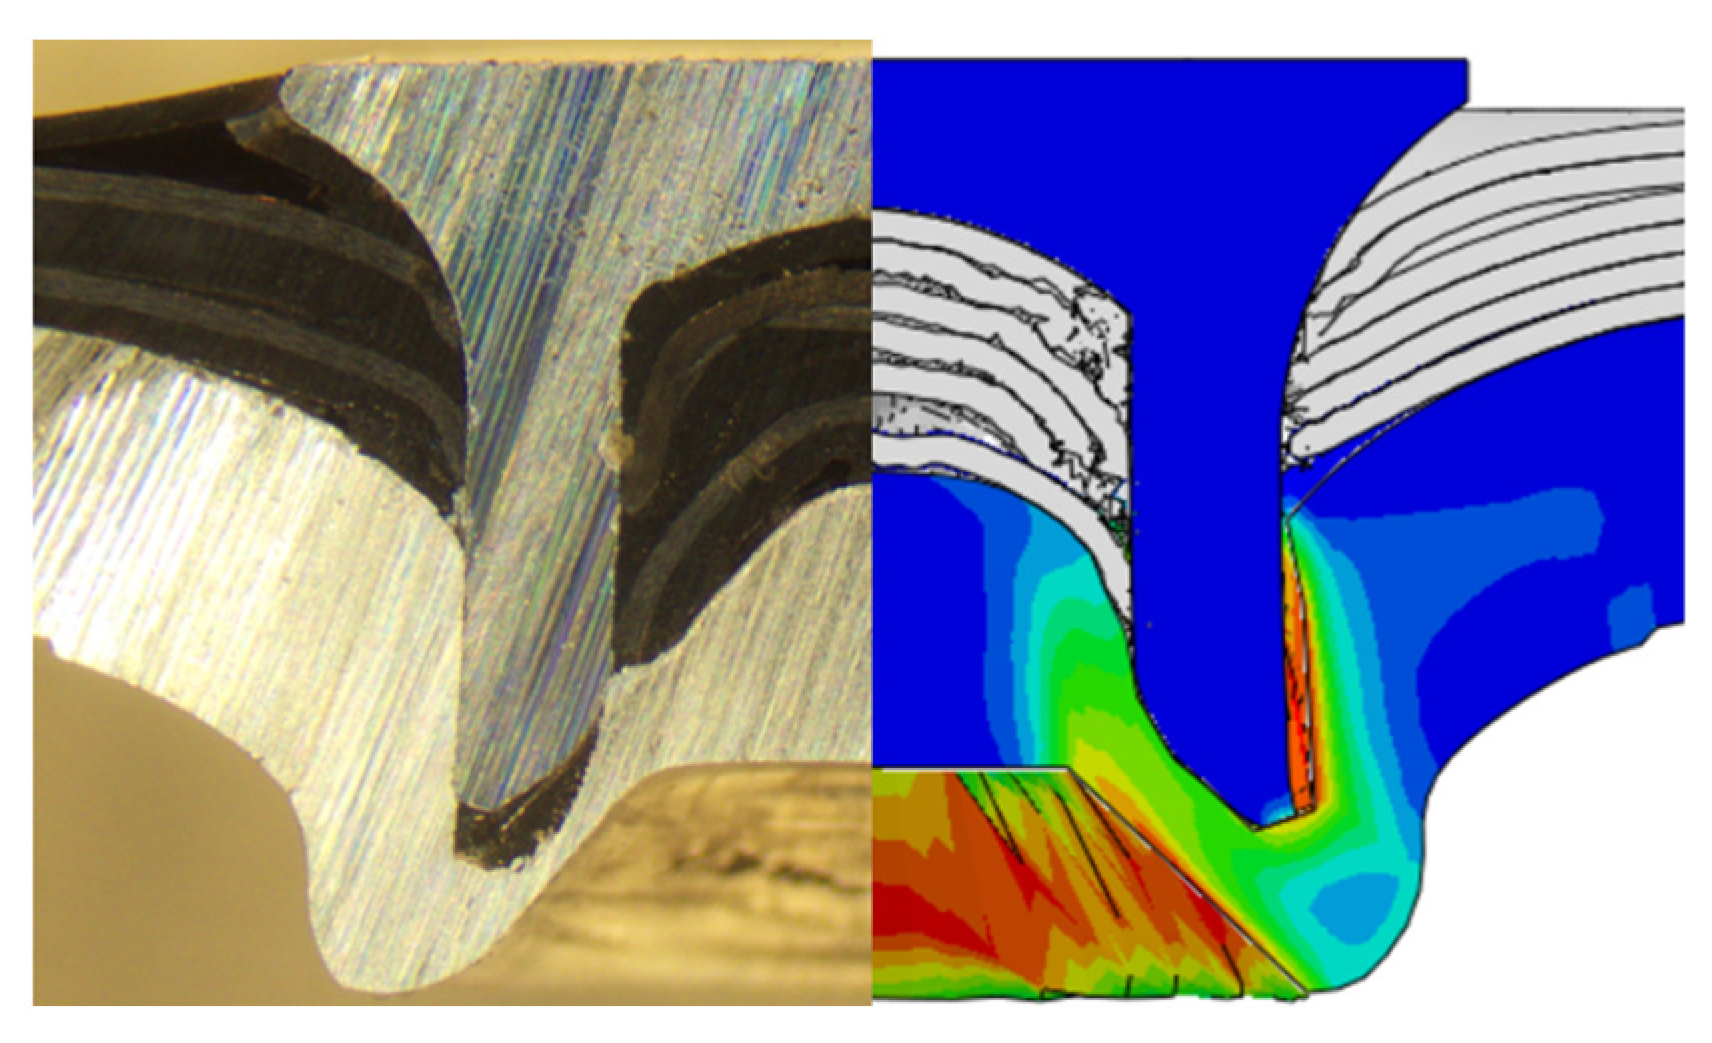
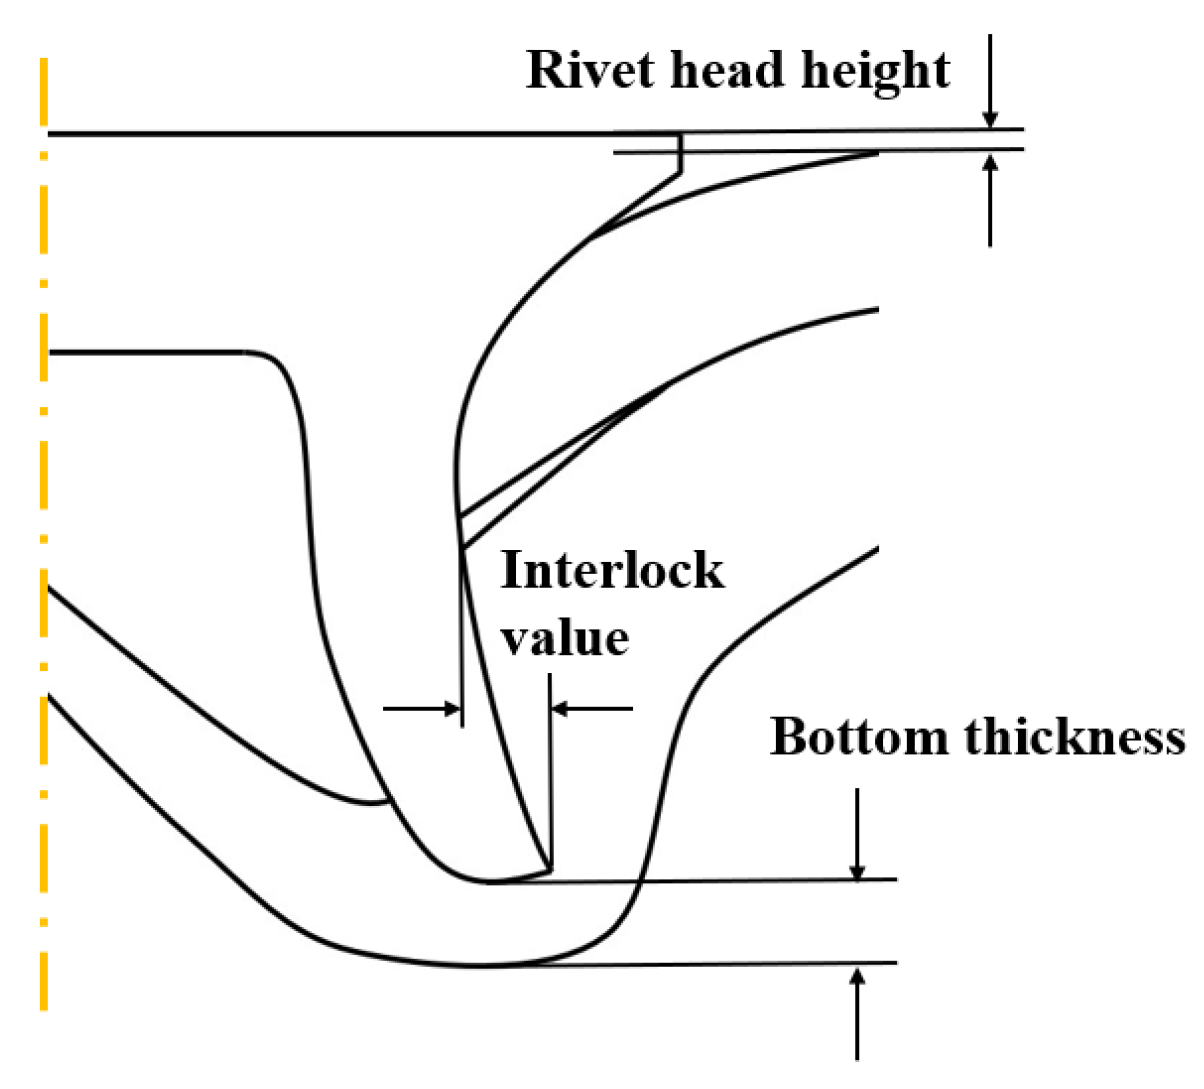
3.3. Verification of FE Models
4. Parameter Study
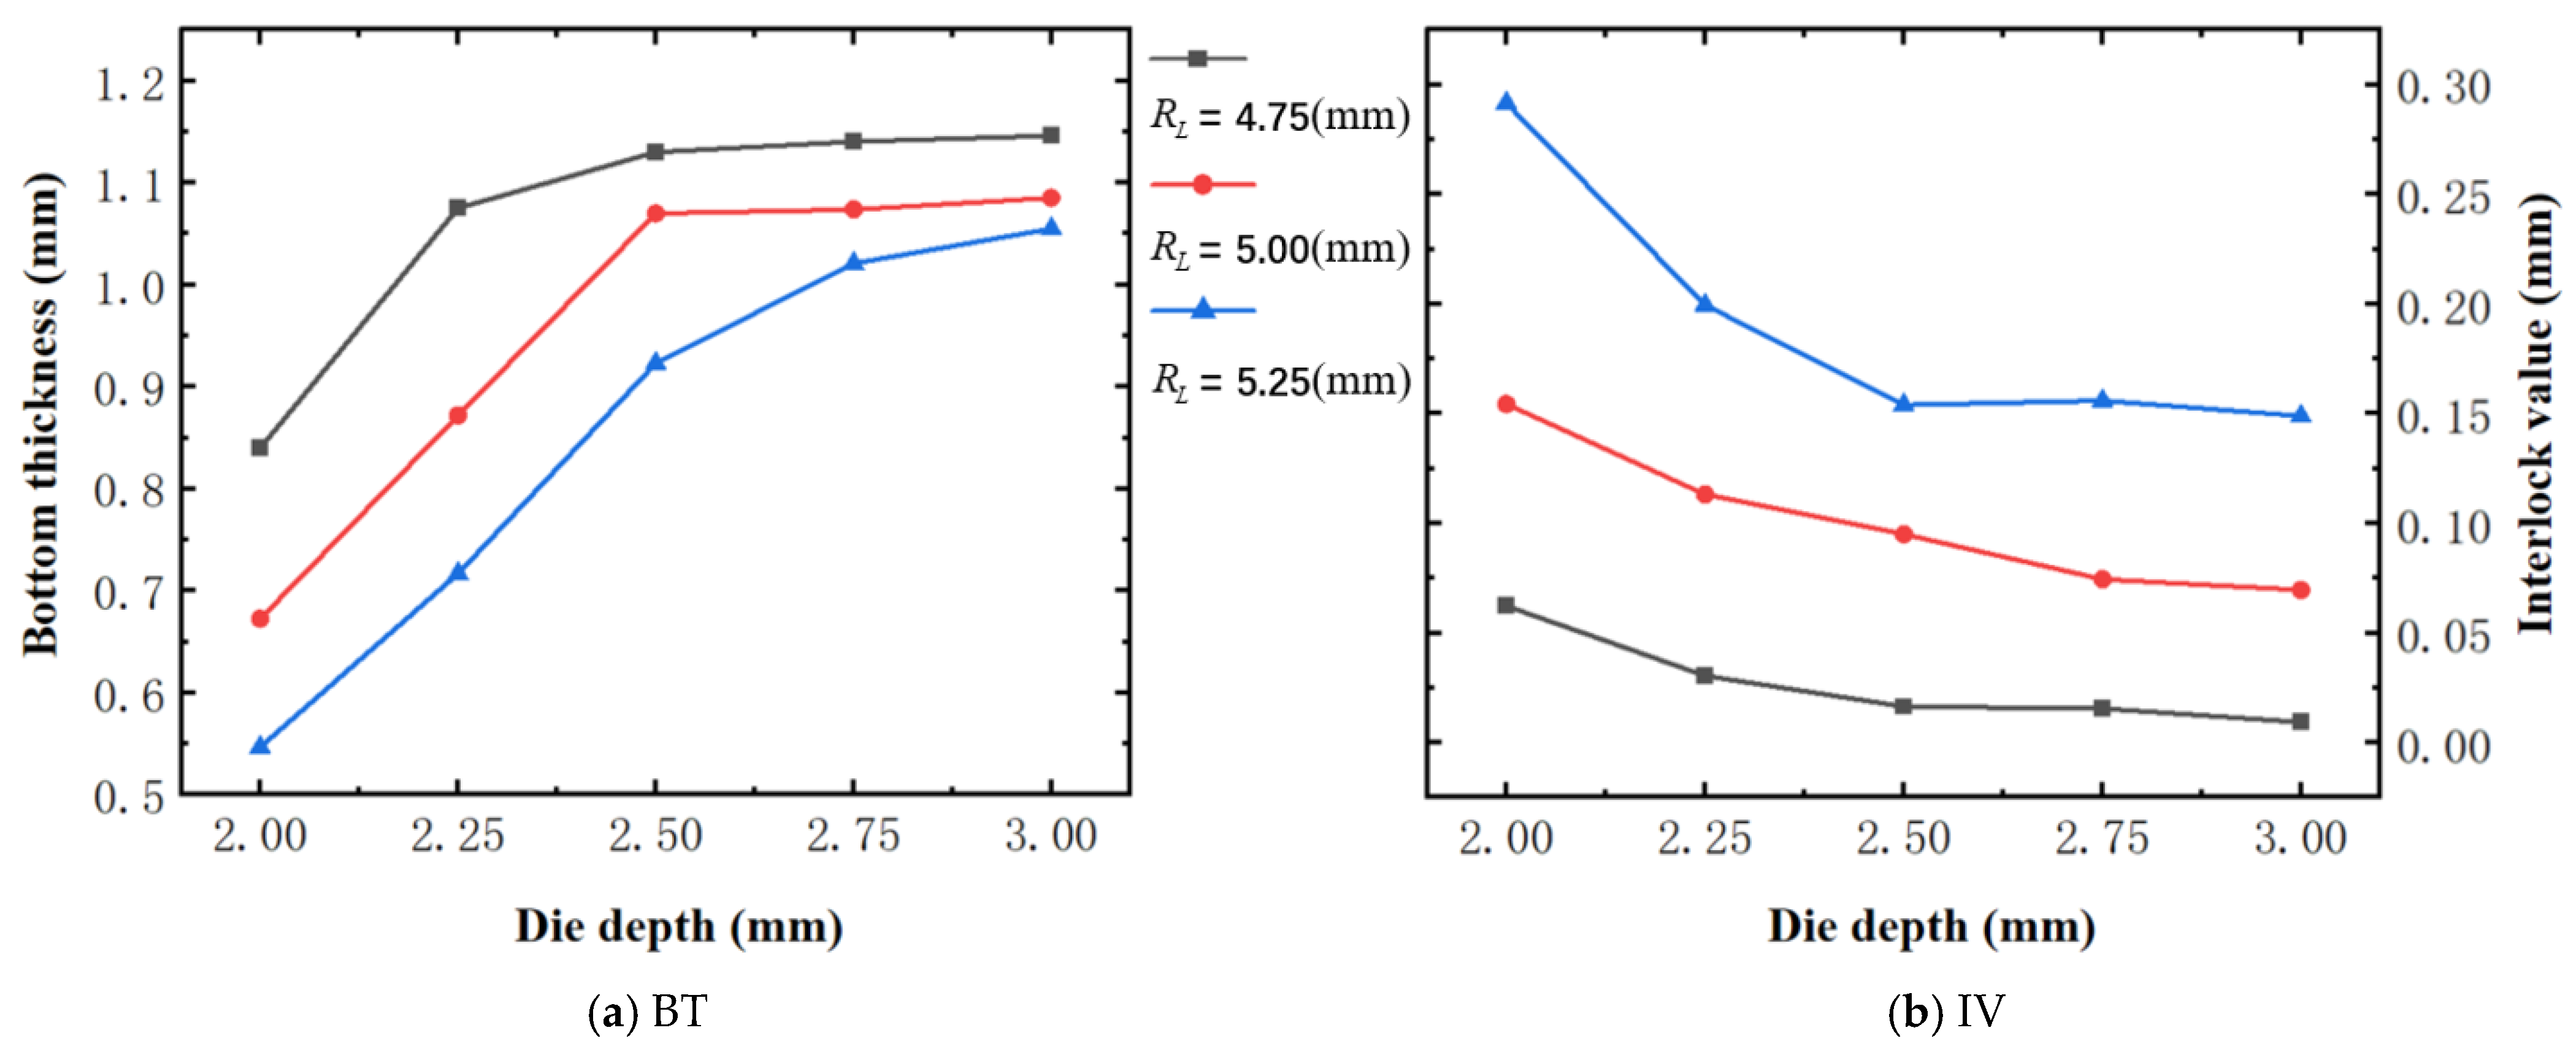
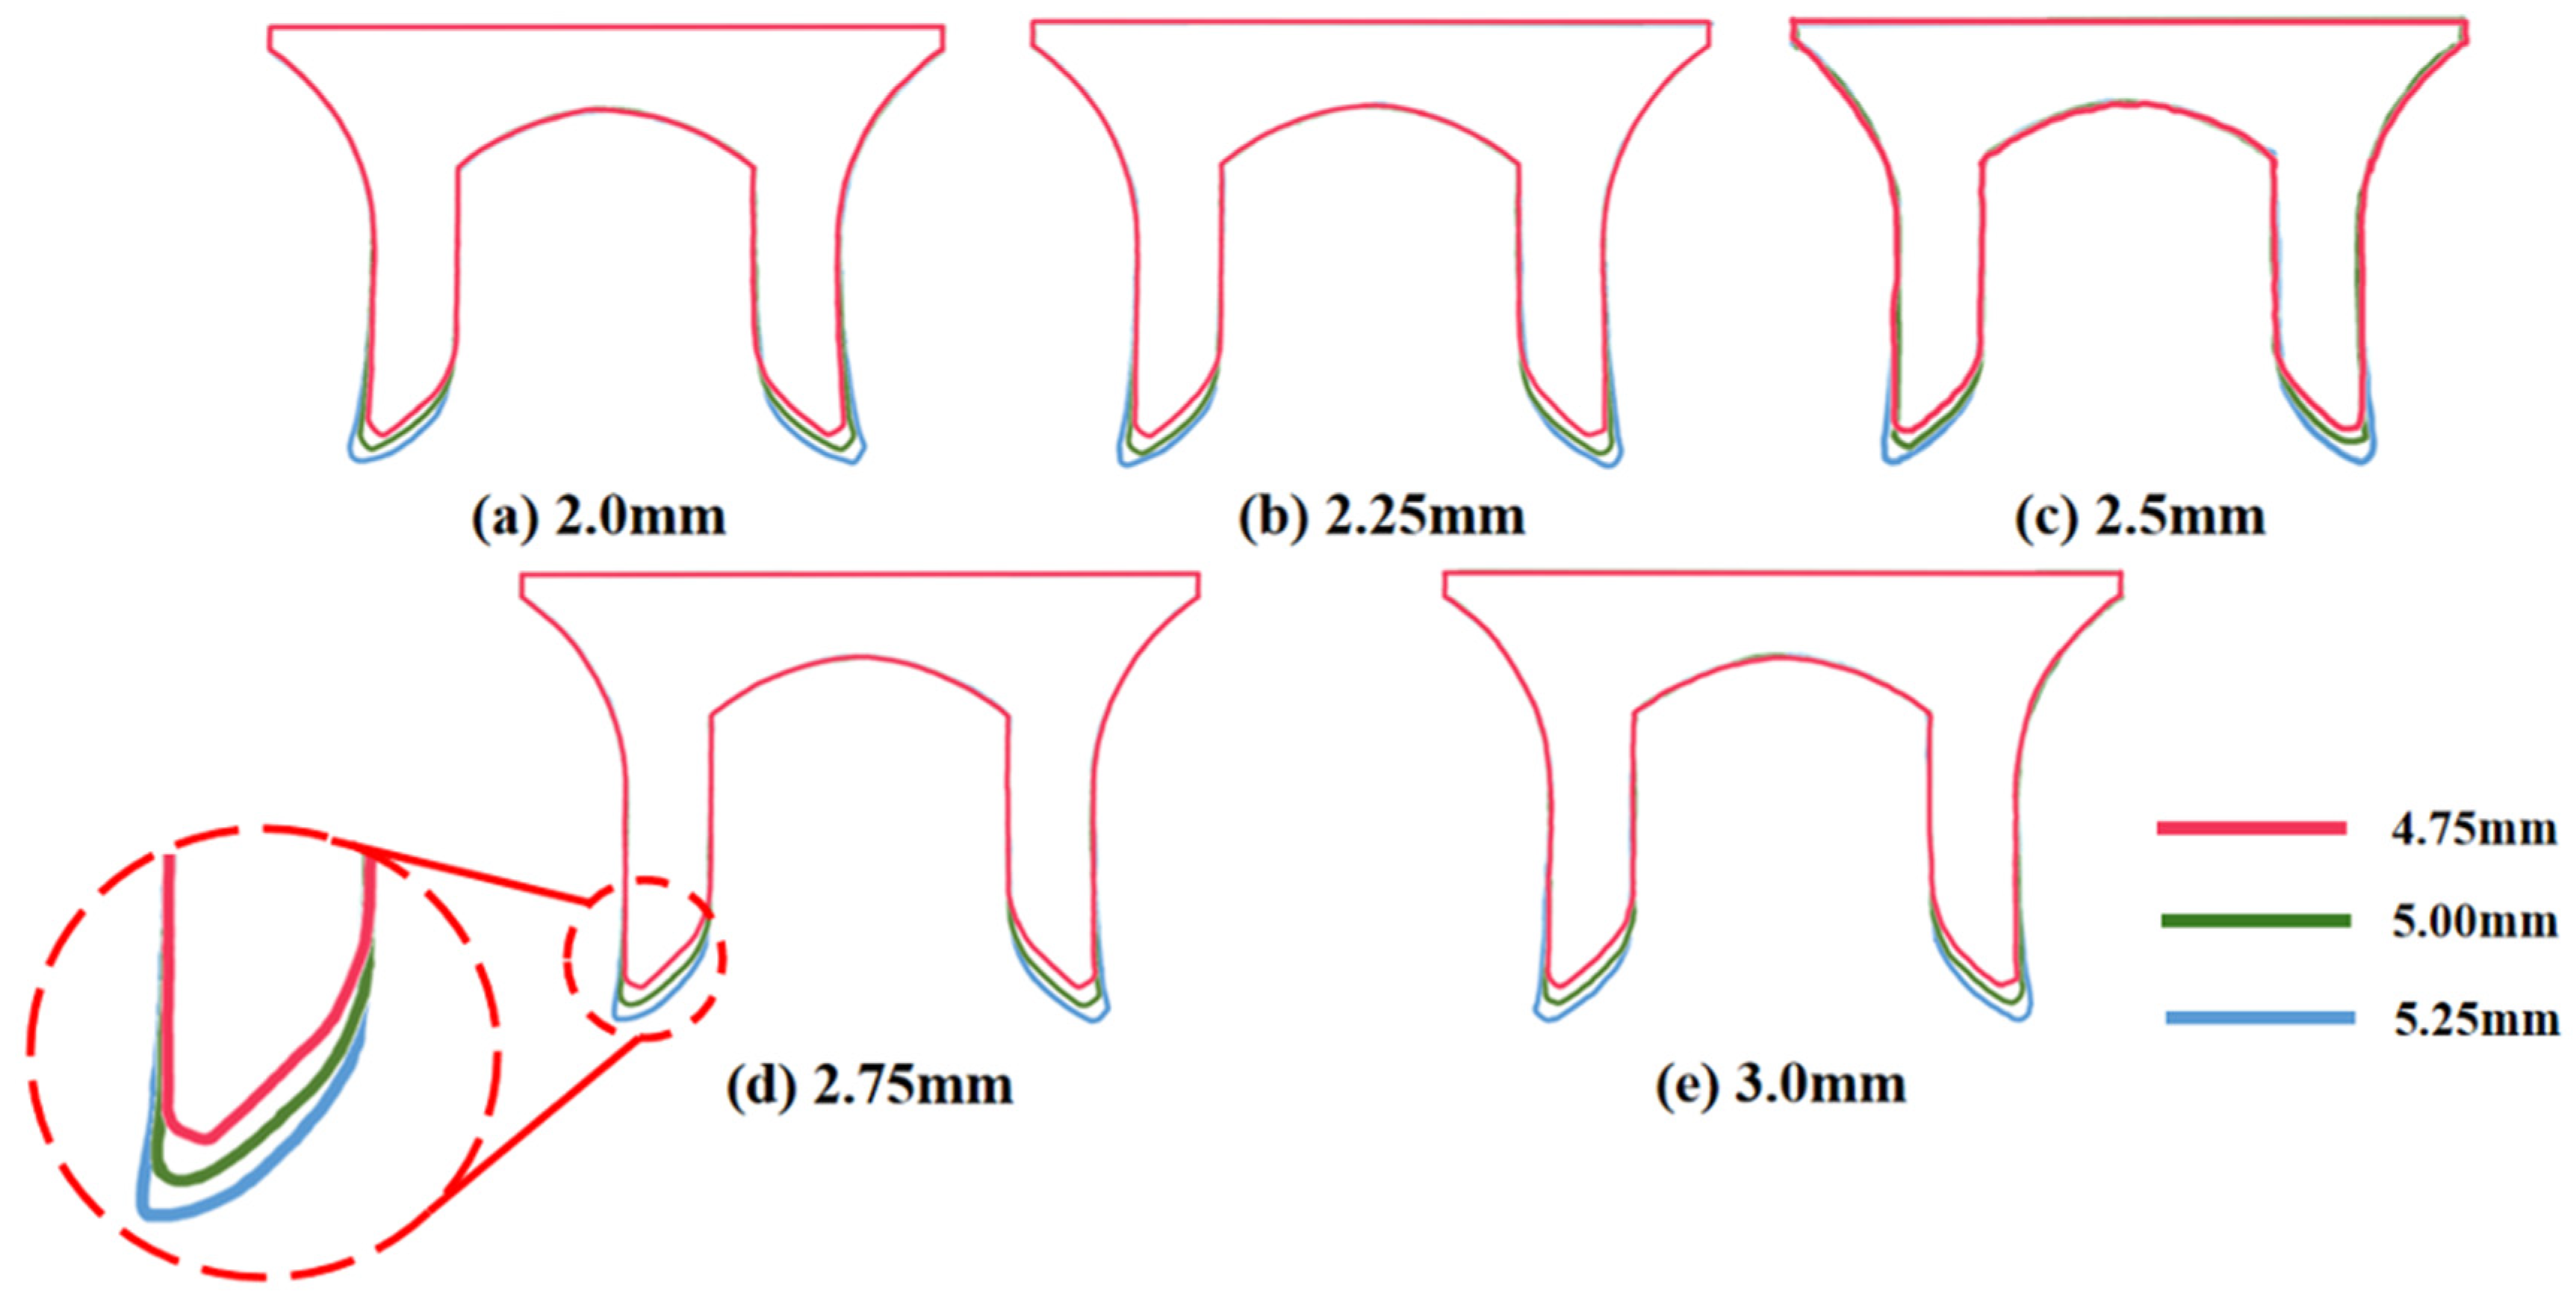
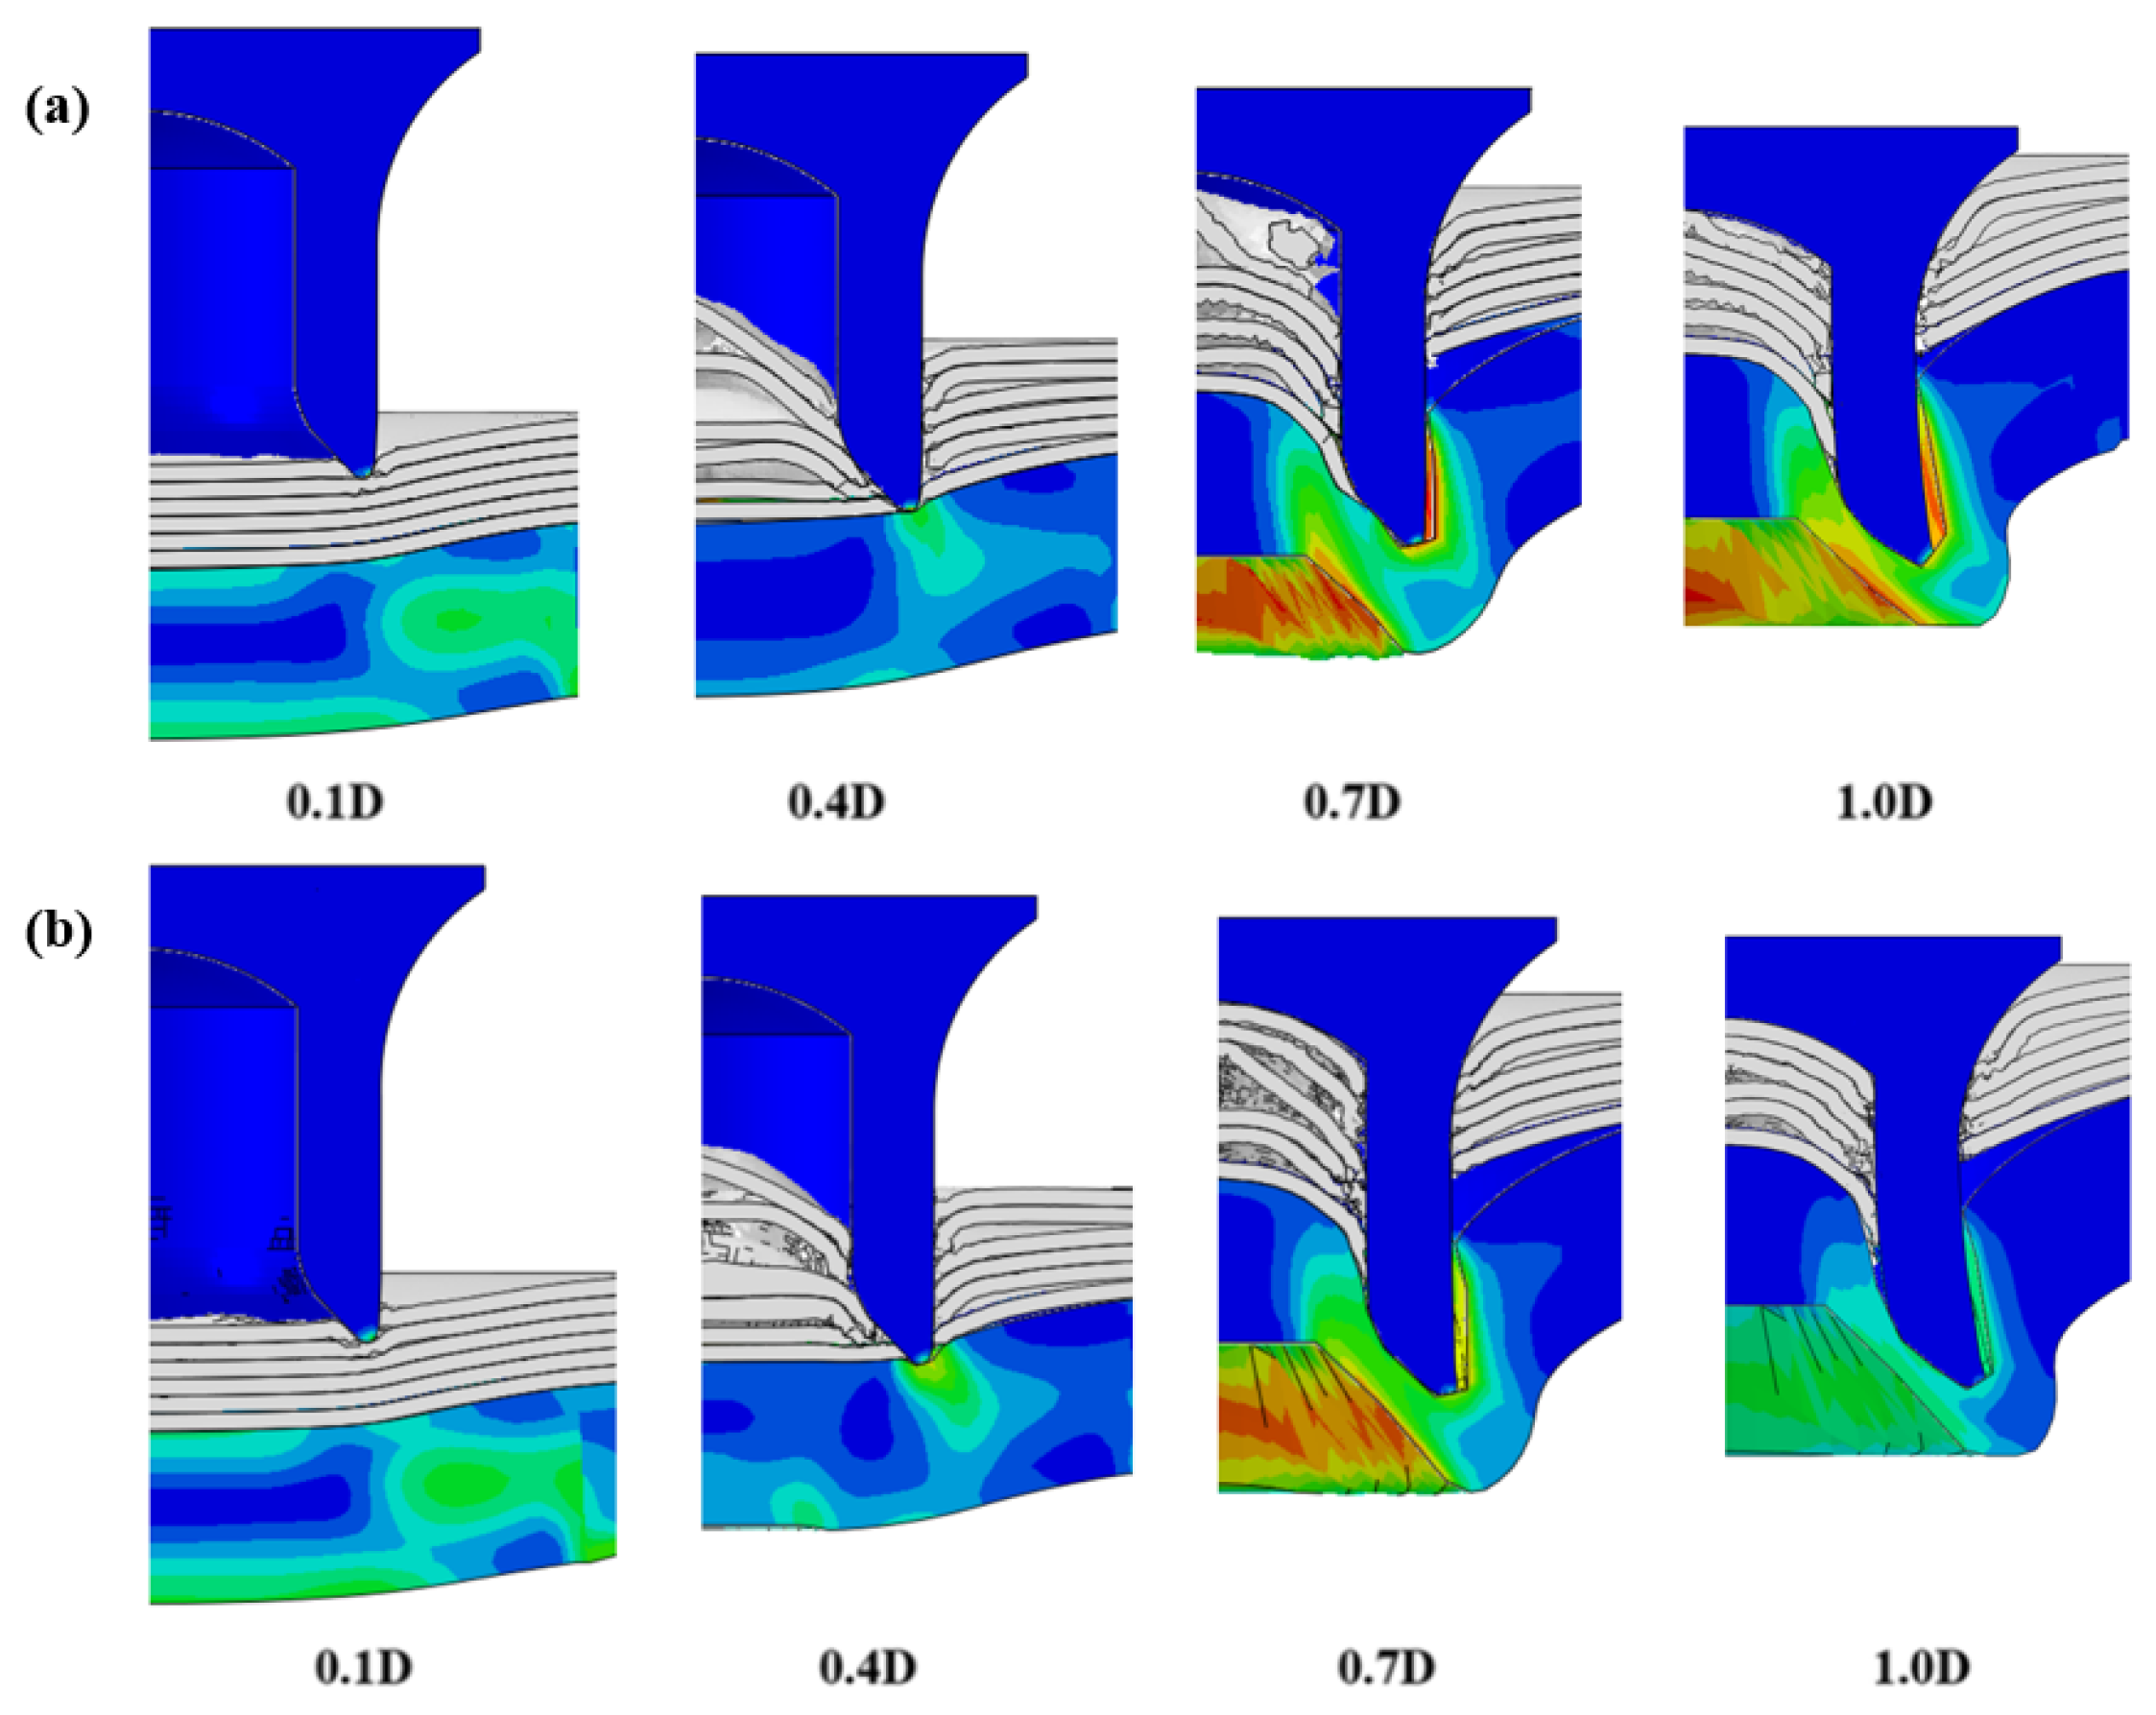
4.1. The Effect of Die Depth ()
4.2. The Effect of Die Gap ()
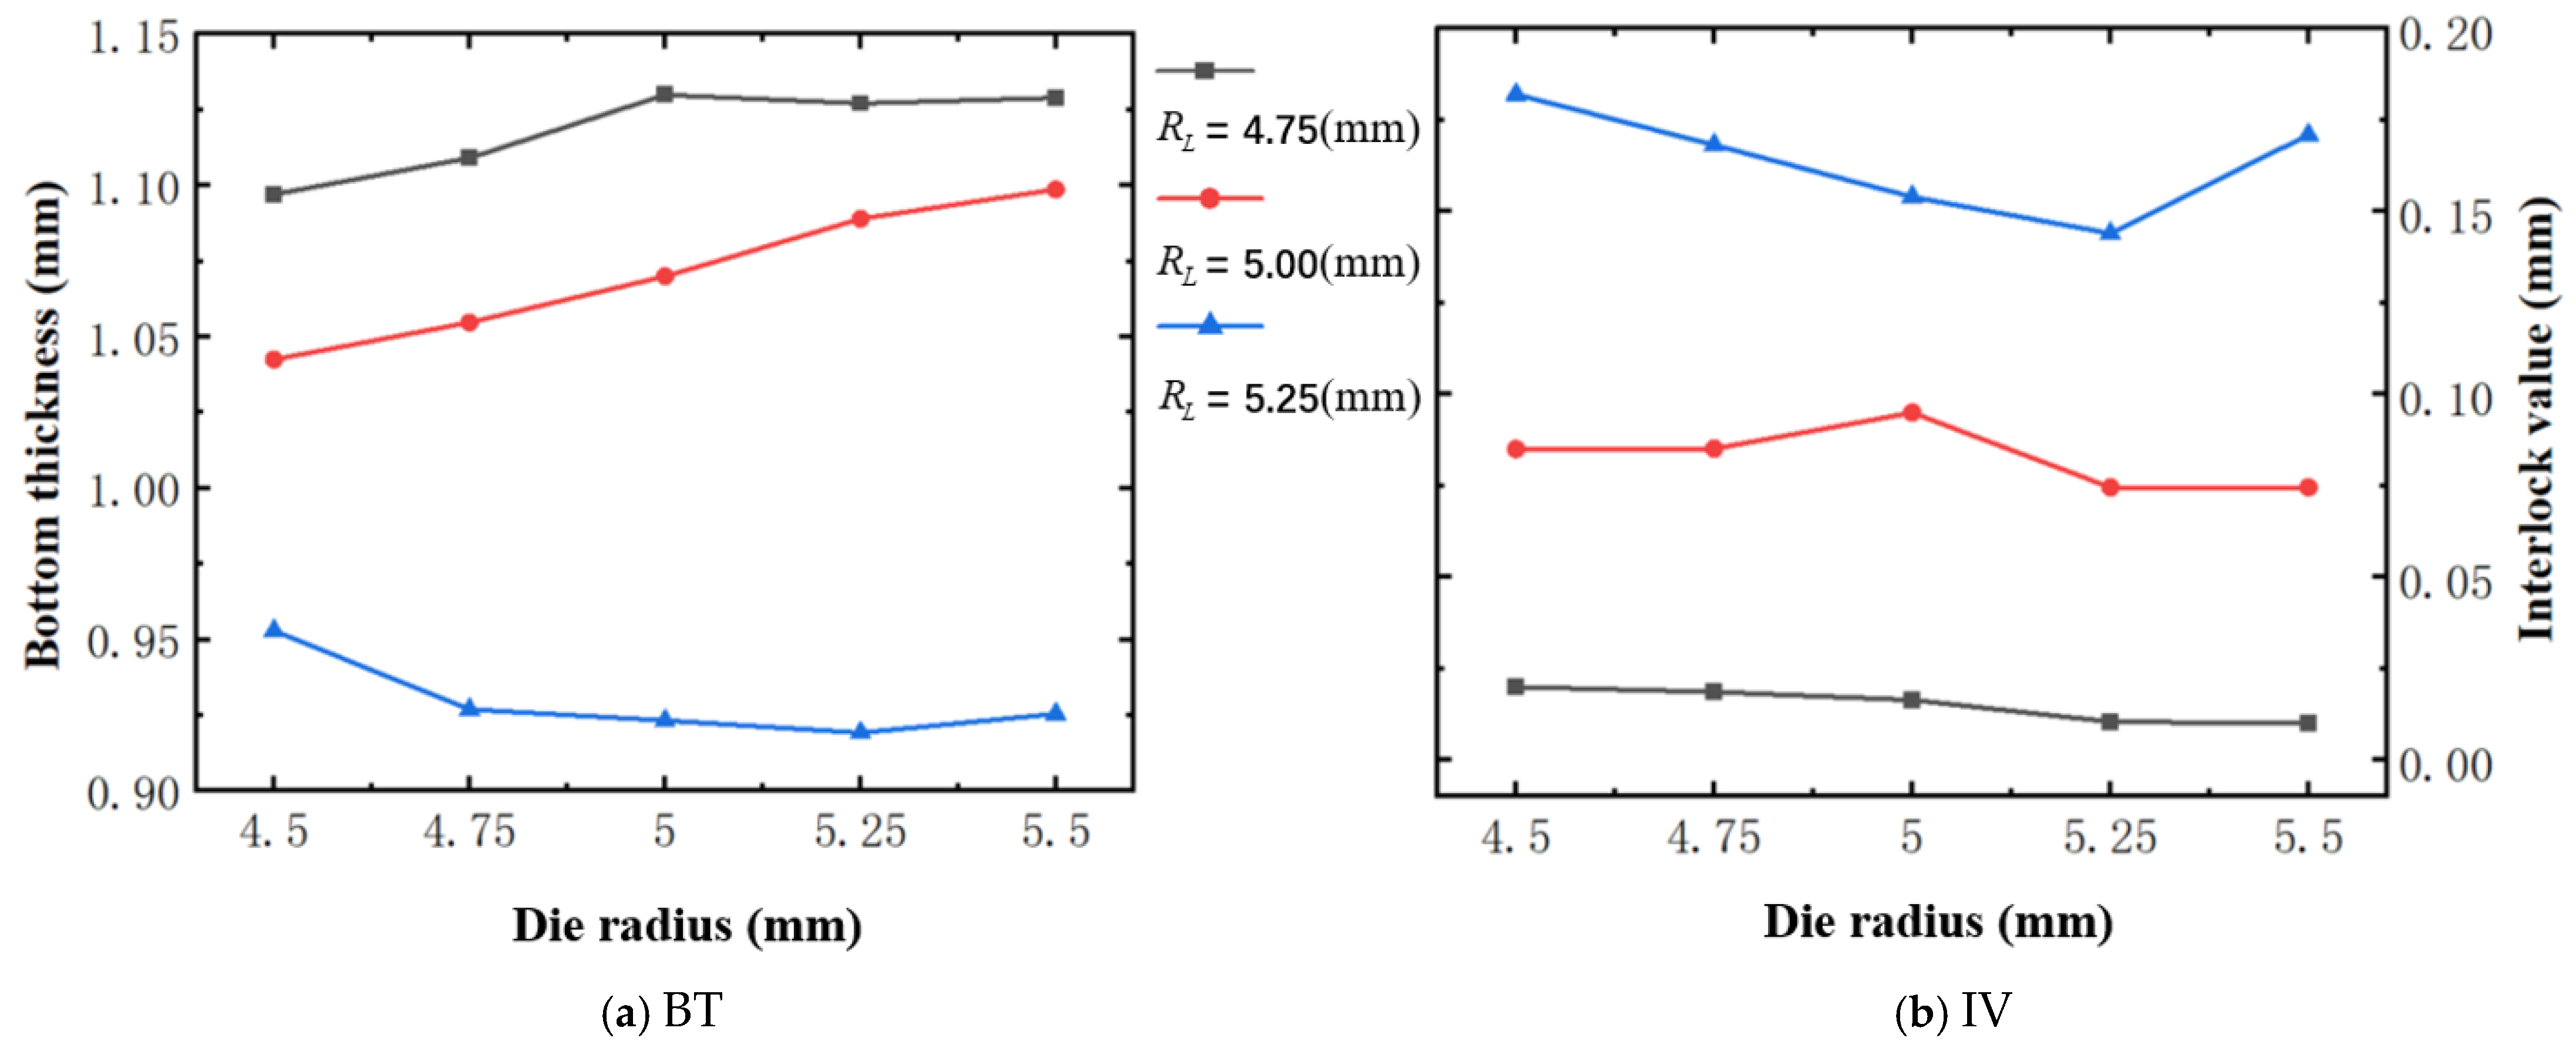
4.3. The Effect of Die Radius ()
5. Multi-Objective Optimization of Joint’s Forming Quality
5.1. Taguchi Method Coupled with TOPSIS
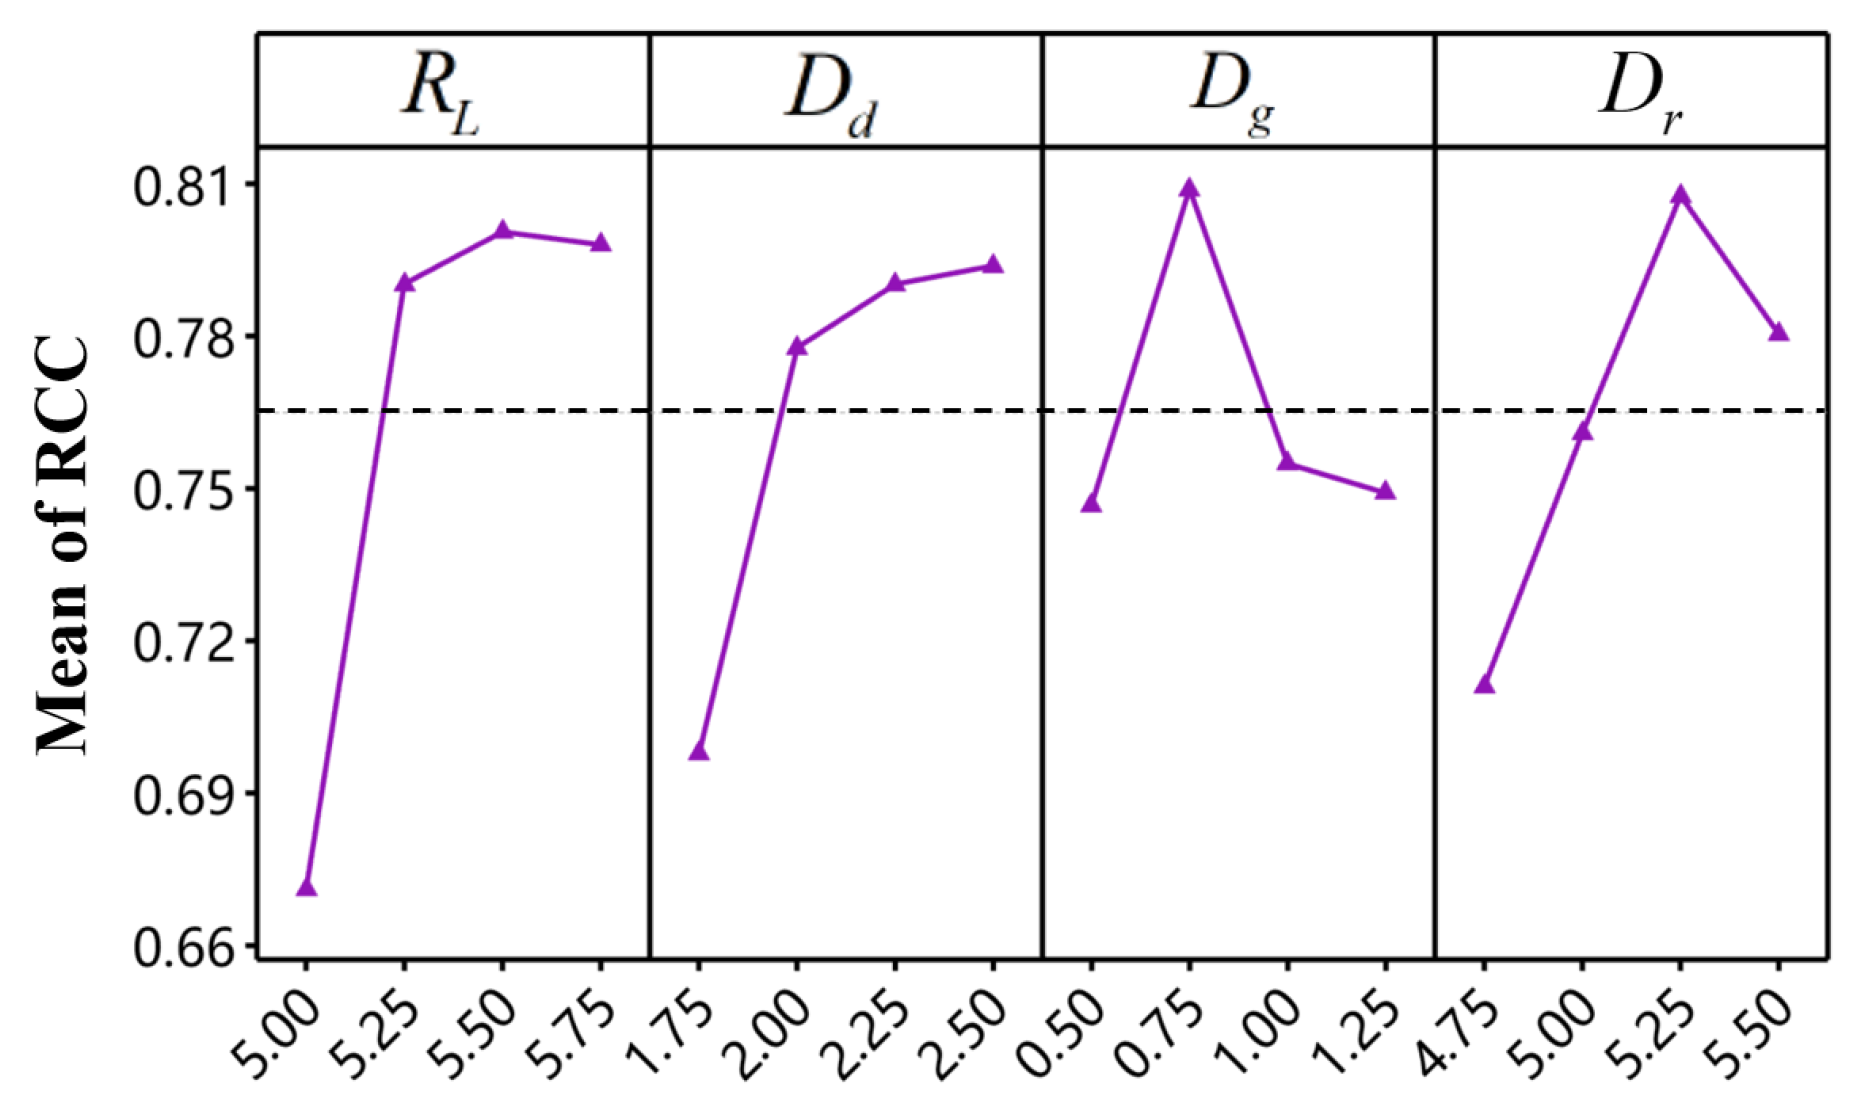
5.2. Results and Discussion
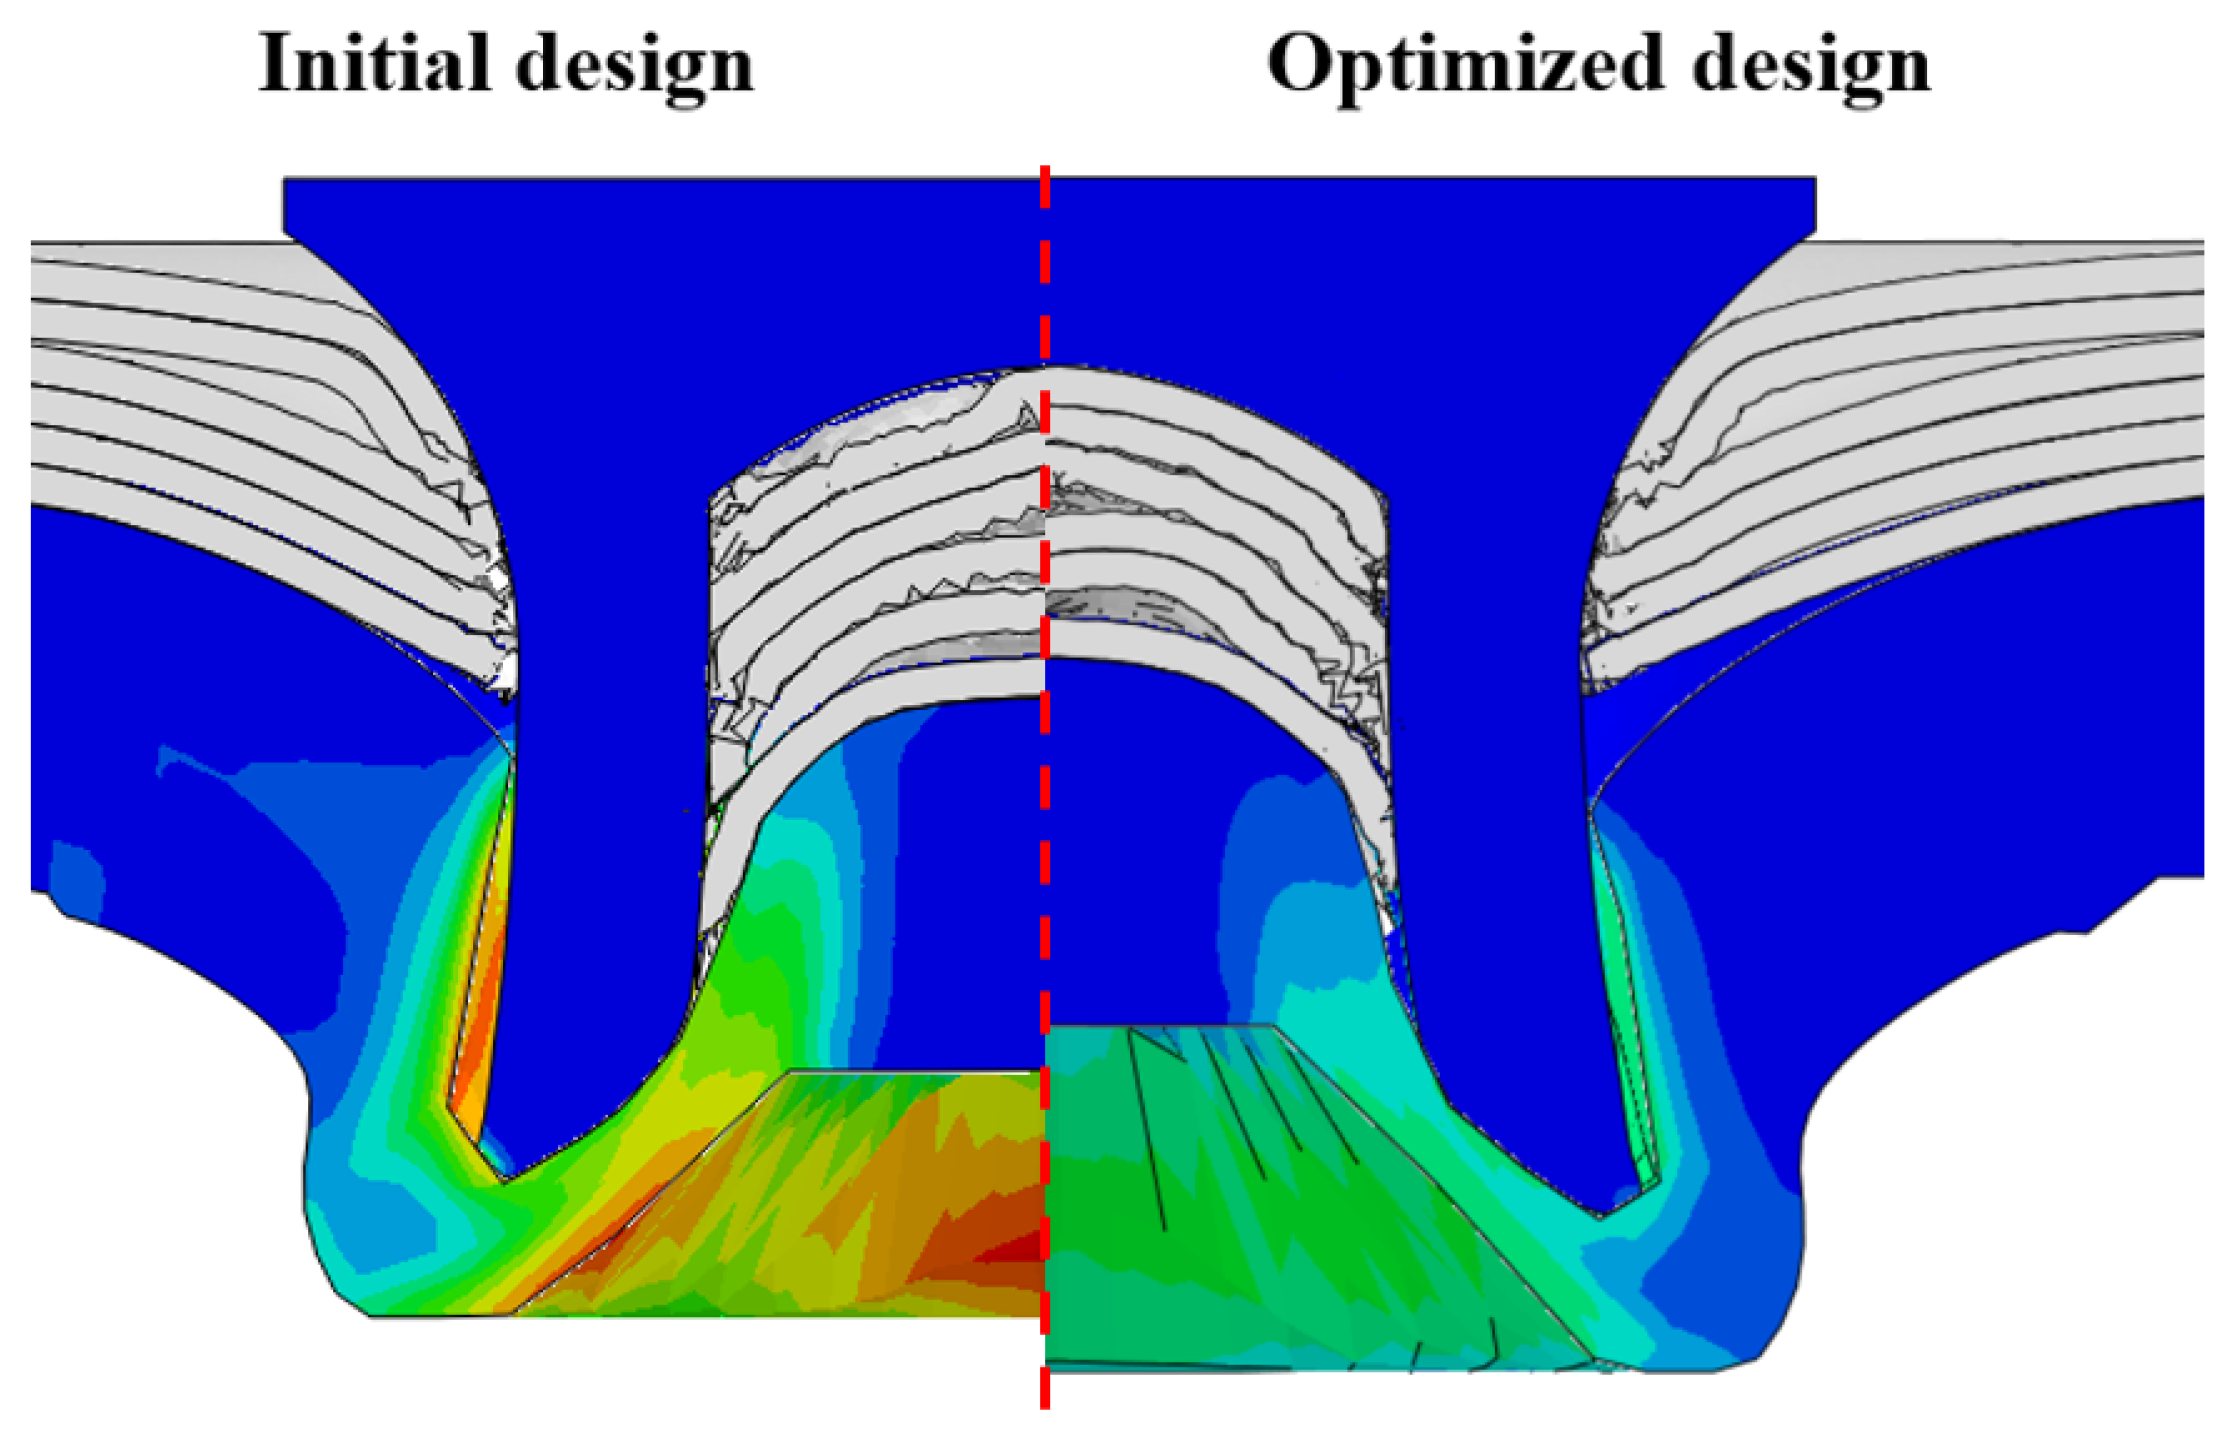
5.3. Optimization Results Validation
6. Conclusions
Author Contributions
Funding
Institutional Review Board Statement
Informed Consent Statement
Data Availability Statement
Conflicts of Interest
References
- Hesse, S.; Lukaszewicz, D.-J.; Duddeck, F. A method to reduce design complexity of automotive composite structures with respect to crashworthiness. Compos. Struct. 2015, 129, 236–249. [Google Scholar] [CrossRef]
- Liu, Y.; Zhuang, W. Self-piercing riveted-bonded hybrid joining of carbon fibre reinforced polymers and aluminium alloy sheets. Thin-Walled Struct. 2019, 144, 106340. [Google Scholar] [CrossRef]
- Galińska, A.; Galiński, C. Mechanical joining of fibre reinforced polymer composites to metals—A review. Part II: Riveting, clinching, non-adhesive form-locked joints, pin and loop joining. Polymers 2020, 12, 1681. [Google Scholar] [CrossRef] [PubMed]
- Barbosa, N.; Campilho, R.; Silva, F.; Moreira, R. Comparison of different adhesively-bonded joint types for mechanical structures. Appl. Adhes. Sci. 2018, 6, 15. [Google Scholar] [CrossRef]
- Haque, R. Quality of self-piercing riveting (SPR) joints from cross-sectional perspective: A review. Arch. Civ. Mech. Eng. 2018, 18, 83–93. [Google Scholar] [CrossRef]
- Karathanasopoulos, N.; Pandya, K.S.; Mohr, D. Self-piercing riveting process: Prediction of joint characteristics through finite element and neural network modeling. J. Adv. Join. Process. 2021, 3, 100040. [Google Scholar] [CrossRef]
- Ma, Y.; Lou, M.; Li, Y.; Lin, Z. Effect of rivet and die on self-piercing rivetability of AA6061-T6 and mild steel CR4 of different gauges. J. Mater. Process. Technol. 2018, 251, 282–294. [Google Scholar] [CrossRef]
- Wang, D.; Kong, D.; Xie, C.; Li, S.; Zong, L. Study on the effect of rivet die parameters on joint quality of self-piercing riveting employed 3D modeling and MCDM method. Int. J. Adv. Manuf. Technol. 2022, 119, 8227–8241. [Google Scholar] [CrossRef]
- Achira, S.; Abe, Y.; Mori, K.-i. Self-pierce riveting of three thin sheets of aluminum alloy A5052 and 980 MPa steel. Materials 2022, 15, 1010. [Google Scholar] [CrossRef]
- Zhou, Z.-J.; Huang, Z.-C.; Jiang, Y.-Q.; Tang, N.-L. Joining properties of SPFC440/AA5052 multi-material self-piercing riveting joints. Materials 2022, 15, 2962. [Google Scholar] [CrossRef]
- Du, Z.; Duan, L.; Jing, L.; Cheng, A.; He, Z. Numerical simulation and parametric study on self-piercing riveting process of aluminium–steel hybrid sheets. Thin-Walled Struct. 2021, 164, 107872. [Google Scholar] [CrossRef]
- Liu, Y.; Zhuang, W.; Luo, Y.; Xie, D.; Mu, W. Joining mechanism and damage of self-piercing riveted joints in carbon fibre reinforced polymer composites and aluminium alloy. Thin-Walled Struct. 2023, 182, 110233. [Google Scholar] [CrossRef]
- Wang, J.; Zhang, G.; Zheng, X.; Li, J.; Li, X.; Zhu, W.; Yanagimoto, J. A self-piercing riveting method for joining of continuous carbon fiber reinforced composite and aluminum alloy sheets. Compos. Struct. 2021, 259, 113219. [Google Scholar] [CrossRef]
- Park, N.; Kim, S.; Kim, M. Self-Piercing rivet joining of multi-material including CFRP: Experiments and FE modeling. Compos. Struct. 2023, 321, 117341. [Google Scholar] [CrossRef]
- Zhao, H.; Han, L.; Liu, Y.; Liu, X. Analysis of joint formation mechanisms for self-piercing riveting (SPR) process with varying joining parameters. J. Manuf. Process. 2022, 73, 668–685. [Google Scholar] [CrossRef]
- Ang, H.Q. An overview of self-piercing riveting process with focus on joint failures, corrosion issues and optimisation techniques. Chin. J. Mech. Eng. 2021, 34, 2. [Google Scholar] [CrossRef]
- Zheng, Q.; Guo, C.; Zhu, P.; Liu, J.; Ma, W.; Zhao, S. Optimisation of self-punching riveting process parameters for high-speed rail top plates. UPB Sci. Bull. Ser. D 2022, 84, 197–210. [Google Scholar]
- Kong, D.; Wang, D.; Xie, C.; Wang, S.; Zhang, X.; Zhang, Z. Investigation and optimization of structural parameters for the forming quality and mechanical properties of CFRP/Al self-piercing riveting. Int. J. Adv. Manuf. Technol. 2023, 127, 3297–3313. [Google Scholar] [CrossRef]
- Li, M.; Liu, Z.; Huang, L.; Chen, Q.; Zhai, Q.; Han, W.; Zhu, P. Multi-fidelity data-driven optimization design framework for self-piercing riveting process parameters. J. Manuf. Process. 2023, 99, 812–824. [Google Scholar] [CrossRef]
- Zhuang, W.; Chen, S.; Liu, Y. Influence of joining temperature on damage of warm self-piercing riveted joints in carbon fiber reinforced polymer and aluminum alloy sheets. J. Manuf. Process. 2023, 89, 77–91. [Google Scholar] [CrossRef]
- Hirsch, F.; Müller, S.; Machens, M.; Staschko, R.; Fuchs, N.; Kästner, M. Simulation of self-piercing rivetting processes in fibre reinforced polymers: Material modelling and parameter identification. J. Mater. Process. Technol. 2017, 241, 164–177. [Google Scholar] [CrossRef]
- Huang, L.; Shi, Y.; Guo, H.; Su, X. Fatigue behavior and life prediction of self-piercing riveted joint. Int. J. Fatigue 2016, 88, 96–110. [Google Scholar] [CrossRef]
- Li, D. Influence of aluminium sheet surface modification on the self-piercing riveting process and the joint static lap shear strength. Int. J. Adv. Manuf. Technol. 2017, 93, 2685–2695. [Google Scholar] [CrossRef]
- Liang, J.; Jiang, H.; Zhang, J.; Wu, X.; Zhang, X.; Li, G.; Cui, J. Investigations on mechanical properties and microtopography of electromagnetic self-piercing riveted joints with carbon fiber reinforced plastics/aluminum alloy 5052. Arch. Civ. Mech. Eng. 2019, 19, 240–250. [Google Scholar] [CrossRef]
- Ying, L.; Dong, Q.; Gao, T.; Dai, M.; Hu, P. Self-piercing riveting of dissimilar carbon fiber-reinforced composites and aluminum alloy sheets: State-of-the-art achievements. Int. J. Adv. Manuf. Technol. 2024, 130, 1–22. [Google Scholar] [CrossRef]
- Zhang, X.; He, X.; Xing, B.; Wei, W.; Lu, J. Pre-holed self-piercing riveting of carbon fibre reinforced polymer laminates and commercially pure titanium sheets. J. Mater. Process. Technol. 2020, 279, 116550. [Google Scholar] [CrossRef]
- Nelabhotla, D.; Jayaraman, T.; Asghar, K.; Das, D. The optimization of chemical mechanical planarization process-parameters of c-plane gallium-nitride using Taguchi method and grey relational analysis. Mater. Des. 2016, 104, 392–403. [Google Scholar] [CrossRef]
- Patel, V.; Tiwari, G.; Dumpala, R. Crashworthiness analysis of multi-configuration thin walled co-axial frusta tube structures under quasi-static loading. Thin-Walled Struct. 2020, 154, 106872. [Google Scholar] [CrossRef]
- Suresh, R.; Krishnaiah, G. Parametric optimization on single objective dry turning using Taguchi Method. Int. J. Innov. Eng. Technol. 2013, 2, 263–269. [Google Scholar]
- Xiong, F.; Wang, D.; Ma, Z.; Chen, S.; Lv, T.; Lu, F. Structure-material integrated multi-objective lightweight design of the front end structure of automobile body. Struct. Multidiscip. Optim. 2018, 57, 829–847. [Google Scholar] [CrossRef]
- Wang, S.; Wang, D. Research on crashworthiness and lightweight of B-pillar based on MPSO with TOPSIS method. J. Braz. Soc. Mech. Sci. Eng. 2019, 41, 498. [Google Scholar] [CrossRef]


| Material Constant | Value | Material Constant | Value |
|---|---|---|---|
| Young’s modulus (GPa) | Tensile strength (MPa) | ||
| Shear modulus (GPa) | Compressive strength (MPa) | ||
| Poisson’s ratio | Shear strength (MPa) |
| Failure Mode | Initial Damage Criterion |
|---|---|
| Fiber tensile damage () | |
| Fiber compressive damage () | |
| Matrix tensile damage () | |
| Matrix compressive damage () |
| Failure Mode | Damage Evolution Criterion |
|---|---|
| (MPa) | (MPa) | (MPa) | (J/m2) | (J/m2) | (J/m2) |
|---|---|---|---|---|---|
| 72 | 72 | 72 | 272 | 748 | 748 |
| Geometric Dimension | BT | IV | RHH |
|---|---|---|---|
| Experiment (mm) | 1.13 | 0.1 | 0.36 |
| Simulation (mm) | 1.07 | 0.095 | 0.36 |
| Relative error | −5.31% | −5.00% | 0% |
| Rivet Length ()/mm | Die Depth ()/mm | ||||
|---|---|---|---|---|---|
| 2.00 | 2.25 | 2.50 | 2.75 | 3.0 | |
| 4.75 |  |  |  |  |  |
| 5.00 |  |  |  |  |  |
| 5.25 |  | 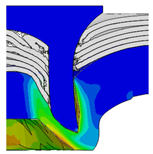 | 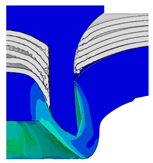 | 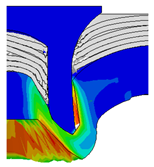 | 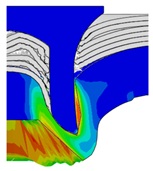 |
| Rivet Length ()/mm | Die Gap ()/mm | ||||
|---|---|---|---|---|---|
| 0.50 | 0.75 | 1.00 | 1.25 | 1.50 | |
| 4.75 |  |  |  |  |  |
| 5.00 |  |  |  |  |  |
| 5.25 |  |  |  |  |  |
| Rivet Length ()/mm | Die Radius ()/mm | ||||
|---|---|---|---|---|---|
| 0.50 | 0.75 | 1.00 | 1.25 | 1.50 | |
| 4.75 |  |  |  |  |  |
| 5.00 |  |  |  |  |  |
| 5.25 |  |  |  |  |  |
| Levels | Symbols | 1 | 2 | 3 | 4 |
|---|---|---|---|---|---|
| Rivet length (mm) | 5.00 | 5.25 | 5.50 | 5.75 | |
| Die depth (mm) | 1.75 | 2.00 | 2.25 | 2.50 | |
| Die gap (mm) | 0.50 | 0.75 | 1.00 | 1.25 | |
| Die radius (mm) | 4.75 | 5.00 | 5.25 | 5.50 |
| No. | Taguchi Experimental Design | Experimental Results | ||||||
|---|---|---|---|---|---|---|---|---|
(mm) | (mm) | (mm) | (mm) | BT () | SNR1 | IV () | SNR2 | |
| 1 | 5.00 | 1.75 | 0.50 | 4.75 | 50.163 | 34.008 | 26.963 | 28.615 |
| 2 | 5.00 | 2.00 | 0.75 | 5.00 | 69.718 | 36.867 | 22.146 | 26.906 |
| 3 | 5.00 | 2.25 | 1.00 | 5.25 | 87.086 | 38.799 | 17.322 | 24.772 |
| 4 | 5.00 | 2.50 | 1.25 | 5.50 | 110.477 | 40.865 | 14.648 | 23.316 |
| 5 | 5.25 | 1.75 | 0.75 | 5.25 | 47.342 | 33.505 | 44.264 | 32.921 |
| 6 | 5.25 | 2.00 | 0.50 | 5.50 | 58.026 | 35.272 | 30.018 | 29.548 |
| 7 | 5.25 | 2.25 | 1.25 | 4.75 | 73.611 | 37.339 | 24.067 | 27.628 |
| 8 | 5.25 | 2.50 | 1.00 | 5.00 | 97.048 | 39.740 | 18.830 | 25.497 |
| 9 | 5.50 | 1.75 | 1.00 | 5.50 | 36.565 | 31.261 | 45.530 | 33.166 |
| 10 | 5.50 | 2.00 | 1.25 | 5.25 | 44.266 | 32.921 | 35.610 | 31.031 |
| 11 | 5.50 | 2.25 | 0.50 | 5.00 | 60.739 | 35.669 | 31.555 | 29.981 |
| 12 | 5.50 | 2.50 | 0.75 | 4.75 | 85.675 | 38.657 | 27.067 | 28.649 |
| 13 | 5.75 | 1.75 | 1.25 | 5.00 | 25.501 | 28.131 | 50.899 | 34.134 |
| 14 | 5.75 | 2.00 | 1.00 | 4.75 | 34.126 | 30.662 | 44.407 | 32.949 |
| 15 | 5.75 | 2.25 | 0.75 | 5.50 | 51.294 | 34.201 | 40.207 | 32.086 |
| 16 | 5.75 | 2.50 | 0.50 | 5.25 | 74.799 | 37.478 | 38.846 | 31.787 |
| Means | Level | ||||
|---|---|---|---|---|---|
| SNR1 (LTB) | 1 | 37.63 | 31.73 | 35.61 | 35.17 |
| 2 | 36.46 | 33.93 | 35.81 | 35.1 | |
| 3 | 34.63 | 36.5 | 35.12 | 35.68 | |
| 4 | 32.62 | 39.19 | 34.81 | 35.4 | |
| Delta | 5.02 | 7.46 | 0.99 | 0.57 | |
| Rank | 2 | 1 | 3 | 4 | |
| Total mean | 35.34 |
| Means | Level | ||||
|---|---|---|---|---|---|
| SNR2 (LTB) | 1 | 25.9 | 32.21 | 29.98 | 29.46 |
| 2 | 28.9 | 30.11 | 30.14 | 29.13 | |
| 3 | 30.71 | 28.62 | 29.1 | 30.13 | |
| 4 | 32.74 | 27.31 | 29.03 | 29.53 | |
| Delta | 6.84 | 4.9 | 1.11 | 1 | |
| Rank | 1 | 2 | 3 | 4 | |
| Total mean | 29.56 |
| No. | Experiment Levels | Normalization of SNR Values () | Weighted Values () | Relative Closeness Coefficient (RCC) (LTB) | Rank | |||||
|---|---|---|---|---|---|---|---|---|---|---|
| SNR1 (LTB) | SNR2 (LTB) | SNR1 (LTB) | SNR2 (LTB) | |||||||
| 1 | 1 | 1 | 1 | 1 | 0.239 | 0.241 | 0.1070 | 0.1332 | 0.479 | 16 |
| 2 | 1 | 2 | 2 | 2 | 0.260 | 0.226 | 0.1160 | 0.1252 | 0.761 | 11 |
| 3 | 1 | 3 | 3 | 3 | 0.273 | 0.208 | 0.1220 | 0.1153 | 0.730 | 13 |
| 4 | 1 | 4 | 4 | 4 | 0.288 | 0.196 | 0.1285 | 0.1085 | 0.714 | 14 |
| 5 | 2 | 1 | 2 | 3 | 0.236 | 0.277 | 0.1054 | 0.1532 | 0.824 | 3 |
| 6 | 2 | 2 | 1 | 4 | 0.248 | 0.248 | 0.1109 | 0.1375 | 0.802 | 6 |
| 7 | 2 | 3 | 4 | 1 | 0.263 | 0.232 | 0.1174 | 0.1286 | 0.783 | 8 |
| 8 | 2 | 4 | 3 | 2 | 0.280 | 0.214 | 0.1250 | 0.1186 | 0.752 | 12 |
| 9 | 3 | 1 | 3 | 4 | 0.220 | 0.279 | 0.0983 | 0.1543 | 0.776 | 9 |
| 10 | 3 | 2 | 4 | 3 | 0.232 | 0.261 | 0.1035 | 0.1444 | 0.787 | 7 |
| 11 | 3 | 3 | 1 | 2 | 0.251 | 0.252 | 0.1122 | 0.1395 | 0.818 | 5 |
| 12 | 3 | 4 | 2 | 1 | 0.272 | 0.241 | 0.1216 | 0.1333 | 0.821 | 4 |
| 13 | 4 | 1 | 4 | 2 | 0.198 | 0.287 | 0.0885 | 0.1588 | 0.712 | 15 |
| 14 | 4 | 2 | 3 | 1 | 0.216 | 0.277 | 0.0964 | 0.1533 | 0.761 | 10 |
| 15 | 4 | 3 | 2 | 4 | 0.241 | 0.270 | 0.1076 | 0.1493 | 0.830 | 2 |
| 16 | 4 | 4 | 1 | 3 | 0.264 | 0.267 | 0.1179 | 0.1479 | 0.888 | 1 |
| Means | Level | ||||
|---|---|---|---|---|---|
| RCC (LTB) | 1 | 0.671 | 0.698 | 0.747 | 0.711 |
| 2 | 0.790 | 0.778 | 0.809 | 0.761 | |
| 3 | 0.801 | 0.790 | 0.755 | 0.808 | |
| 4 | 0.798 | 0.794 | 0.749 | 0.781 | |
| Delta | 0.130 | 0.096 | 0.062 | 0.097 | |
| Rank | 1 | 3 | 4 | 2 | |
| Total mean | 0.765 |
| BT (mm) | IV (mm) | |
|---|---|---|
| Initial design | 0.707 | 0.199 |
| Optimized design | 0.779 | 0.267 |
| Improvement rate | 10.18% | 34.17% |
Disclaimer/Publisher’s Note: The statements, opinions and data contained in all publications are solely those of the individual author(s) and contributor(s) and not of MDPI and/or the editor(s). MDPI and/or the editor(s) disclaim responsibility for any injury to people or property resulting from any ideas, methods, instructions or products referred to in the content. |
© 2025 by the authors. Licensee MDPI, Basel, Switzerland. This article is an open access article distributed under the terms and conditions of the Creative Commons Attribution (CC BY) license (https://creativecommons.org/licenses/by/4.0/).
Share and Cite
Xiong, F.; Yu, X.; Zhang, S.; Wang, D.; Xu, H. Numerical Investigation and Multi-Objective Optimization on Forming Quality of CFRP/Al Self-Piercing Riveting Joint. Materials 2025, 18, 1233. https://doi.org/10.3390/ma18061233
Xiong F, Yu X, Zhang S, Wang D, Xu H. Numerical Investigation and Multi-Objective Optimization on Forming Quality of CFRP/Al Self-Piercing Riveting Joint. Materials. 2025; 18(6):1233. https://doi.org/10.3390/ma18061233
Chicago/Turabian StyleXiong, Feng, Xuehou Yu, Shuai Zhang, Dengfeng Wang, and Hongyu Xu. 2025. "Numerical Investigation and Multi-Objective Optimization on Forming Quality of CFRP/Al Self-Piercing Riveting Joint" Materials 18, no. 6: 1233. https://doi.org/10.3390/ma18061233
APA StyleXiong, F., Yu, X., Zhang, S., Wang, D., & Xu, H. (2025). Numerical Investigation and Multi-Objective Optimization on Forming Quality of CFRP/Al Self-Piercing Riveting Joint. Materials, 18(6), 1233. https://doi.org/10.3390/ma18061233