3.1. Validation of Simulation Model
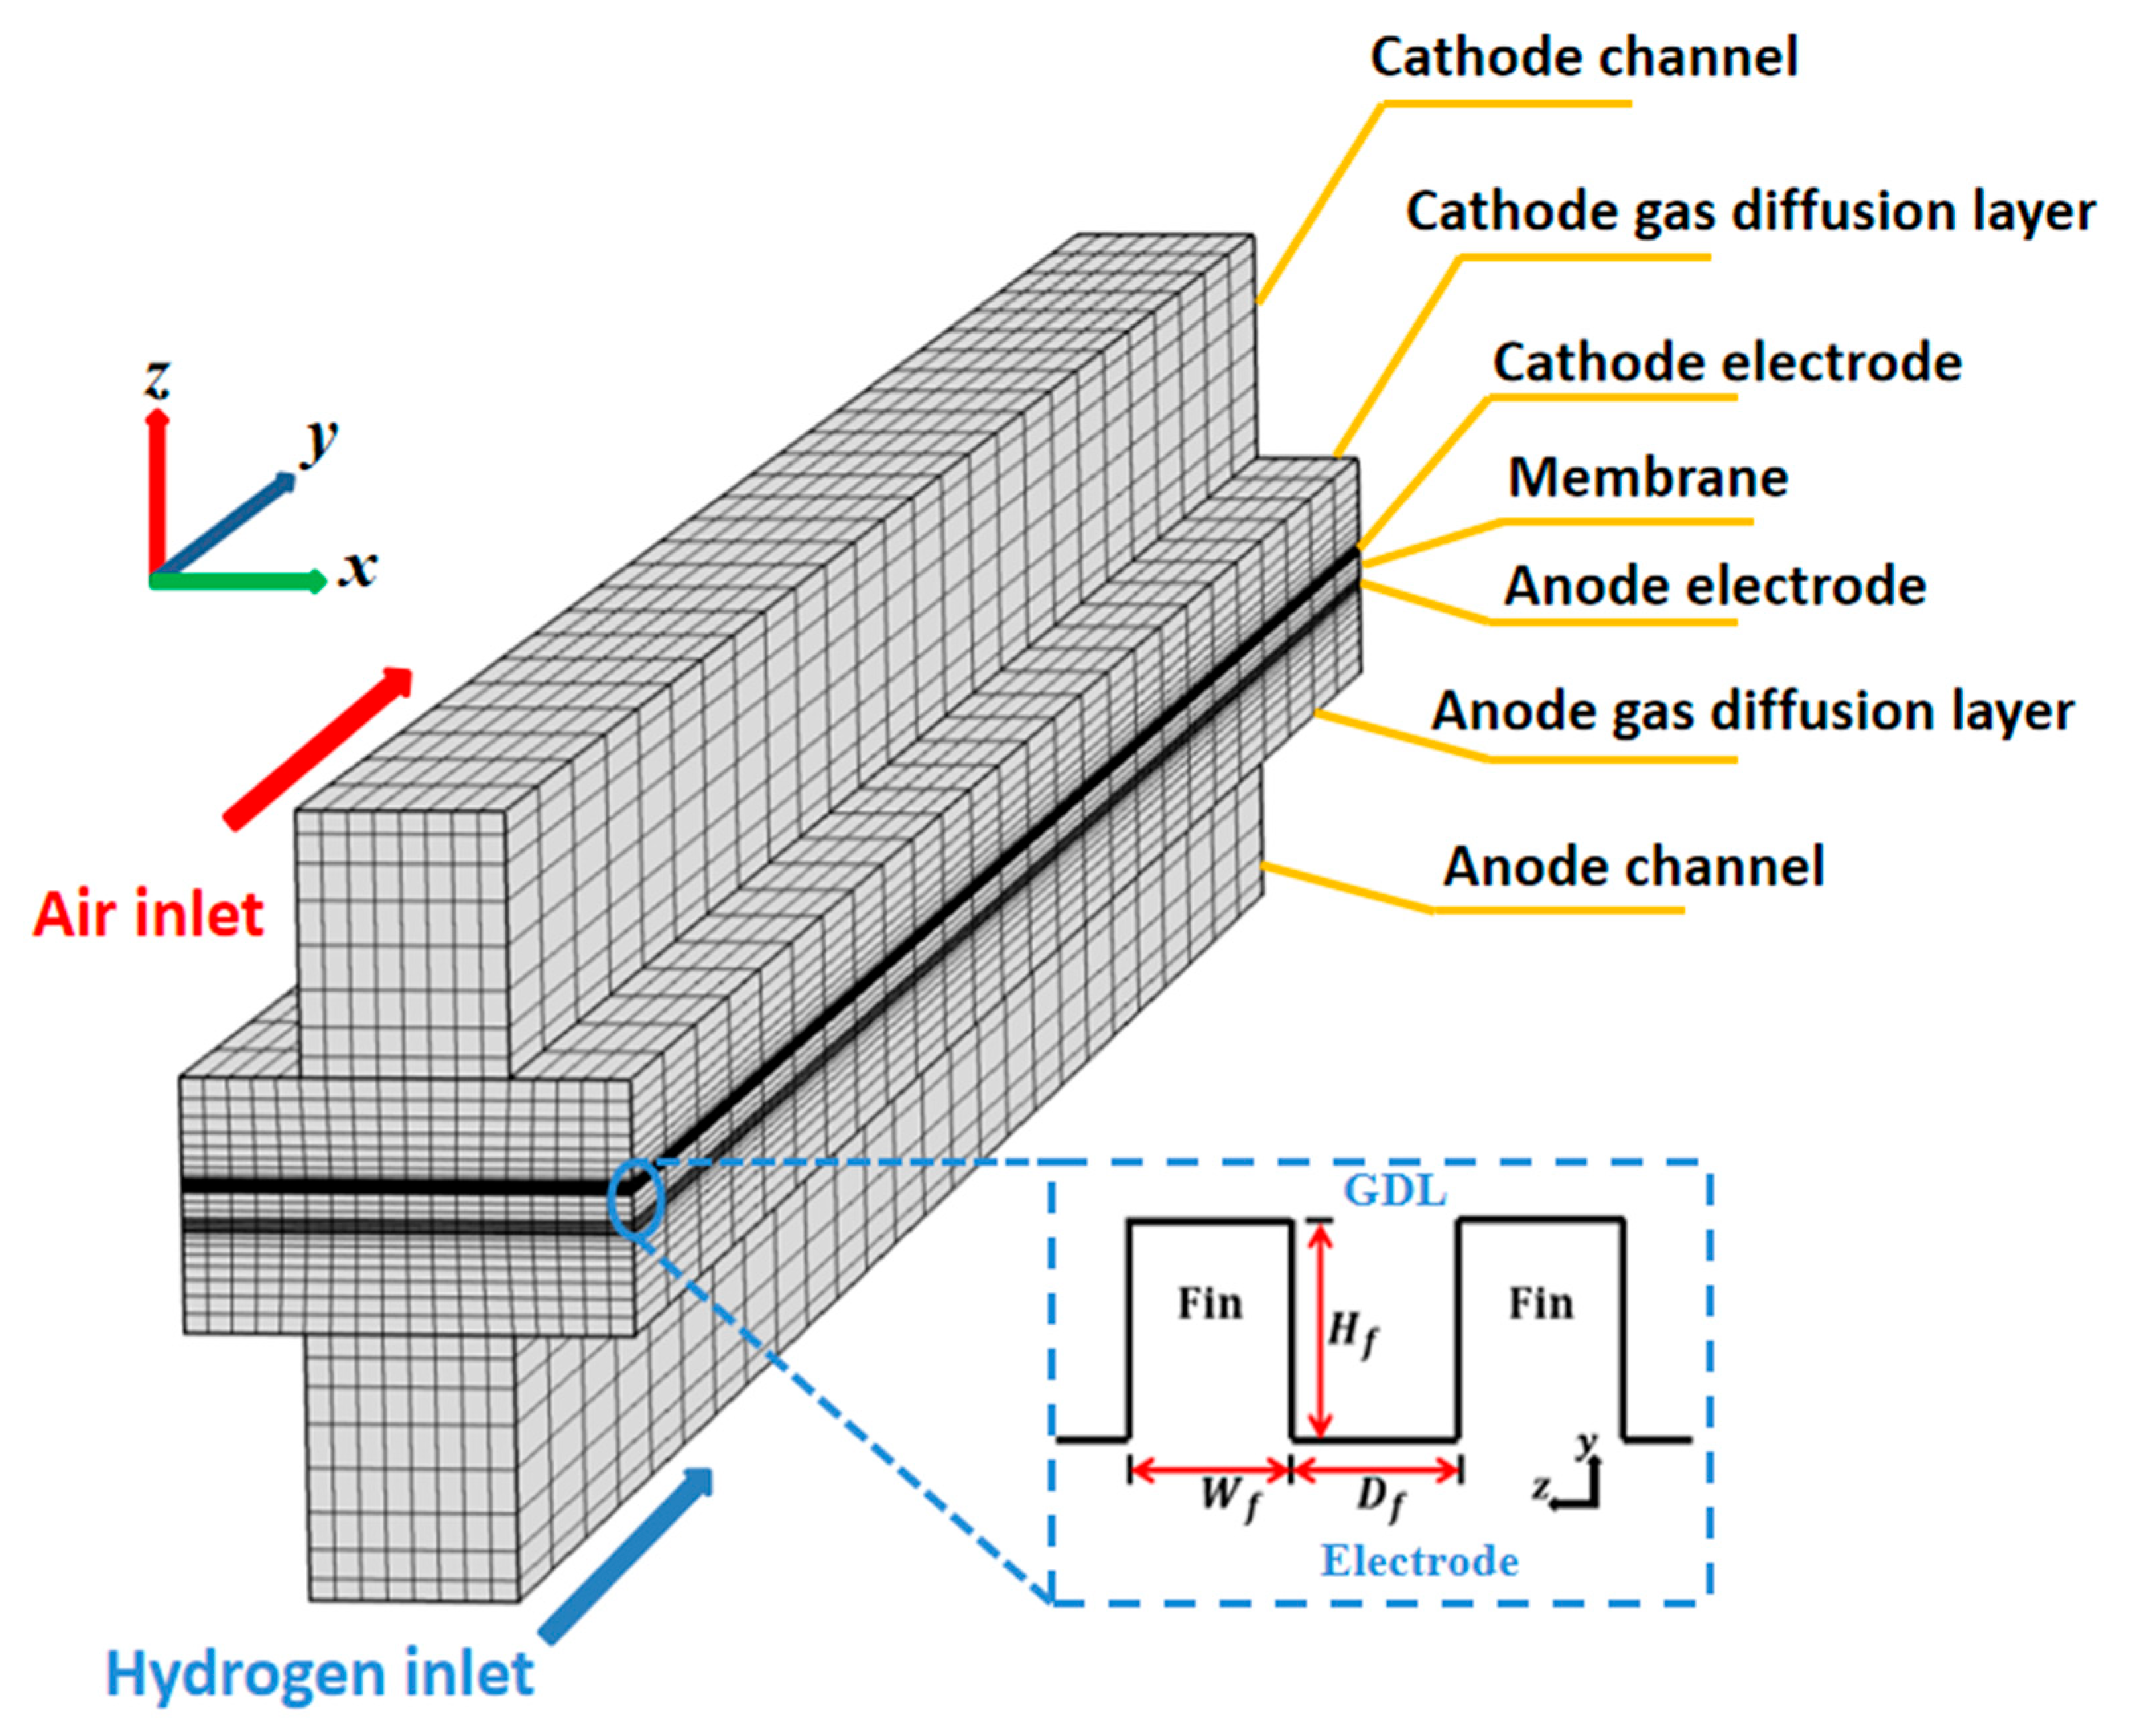
In our study, we used a fin-like surface electrode structure, where the distance between two adjacent fins was varied according to four different fin density ratios, with three various aspect ratio structures to investigate the effects of the novel electrode surface structure.
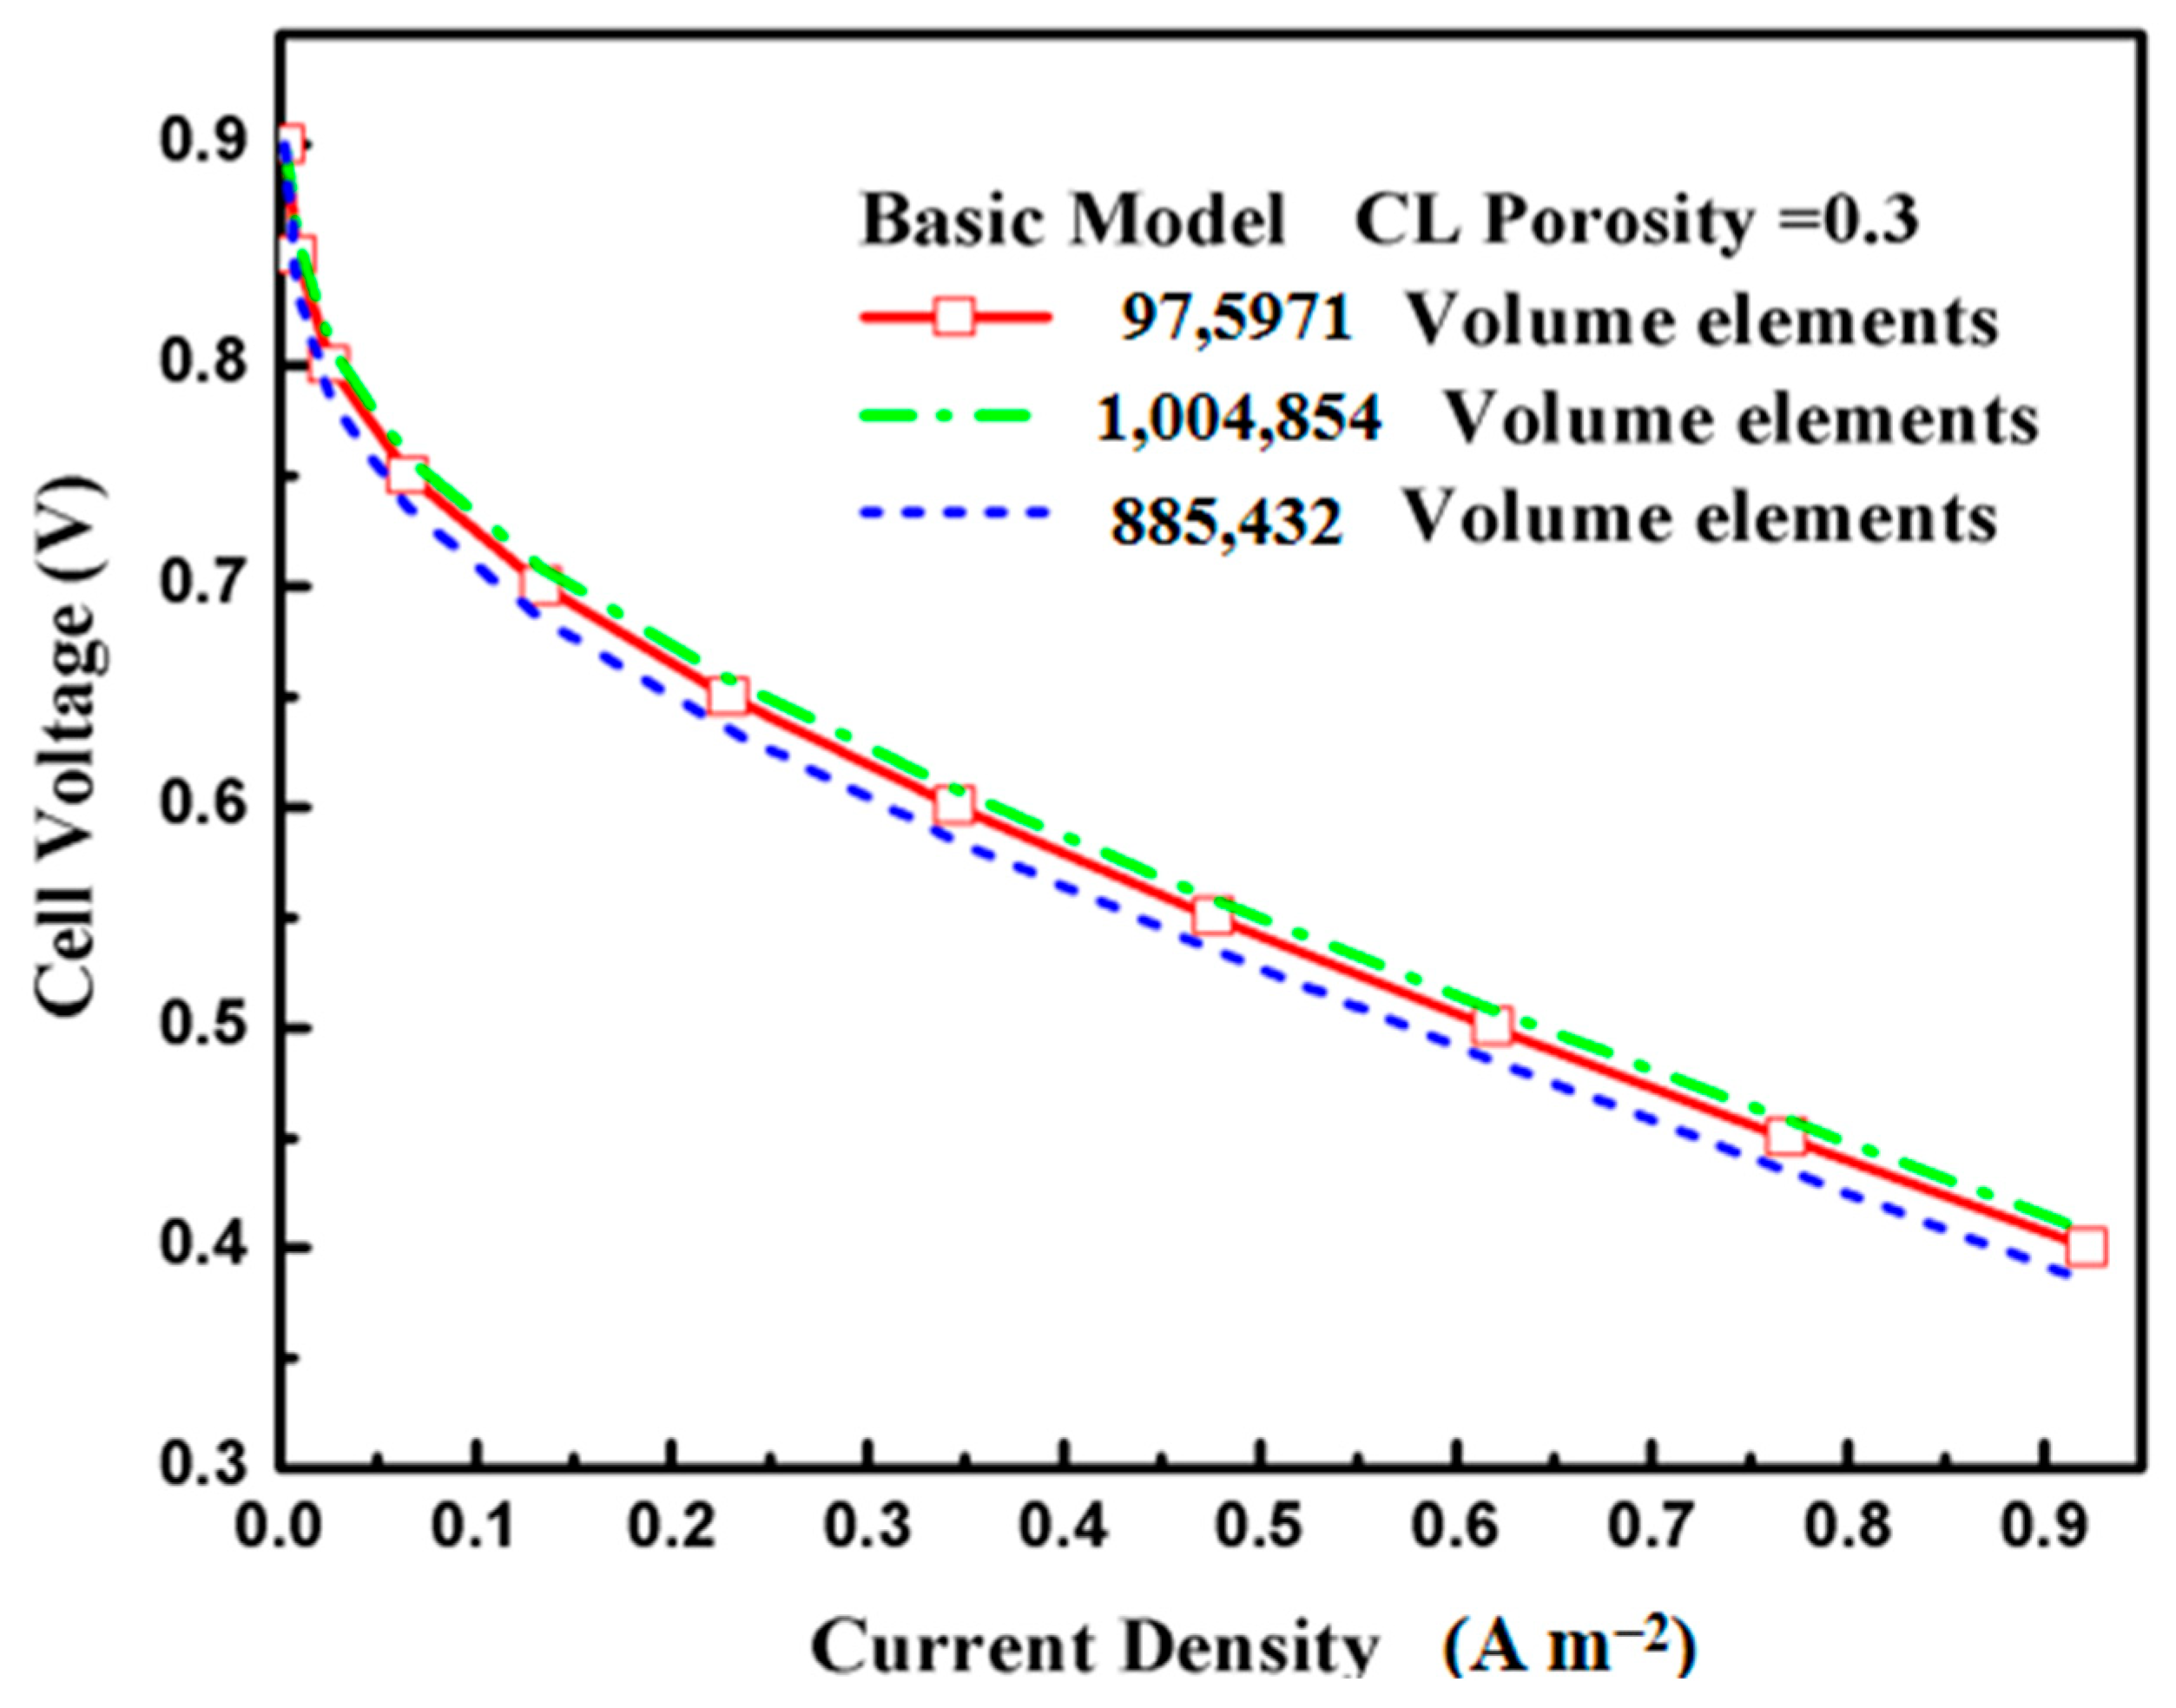
Table 5 lists the sizes of the different types of fin cases used in the present study. Based on the original model, for example, three different grids resolutions of 885,432 elements, 1,004,854 elements, and 975,971 elements were created under the same conditions to verify the independence of the mesh. The model polarization curves for different mesh numbers are shown in
Figure 3. A grid number of 975,971 was chosen in this simulation, and the model polarization curves for the different mesh numbers shown in the graph are less than 0.06%. Moreover, the grid numbers of the different cases and fin densities chosen in this simulation are shown in
Table 6. In order to verify whether the model can predict the PEMFC performance correctly, the experimental values under the same geometric and boundary conditions were compared with the simulation.
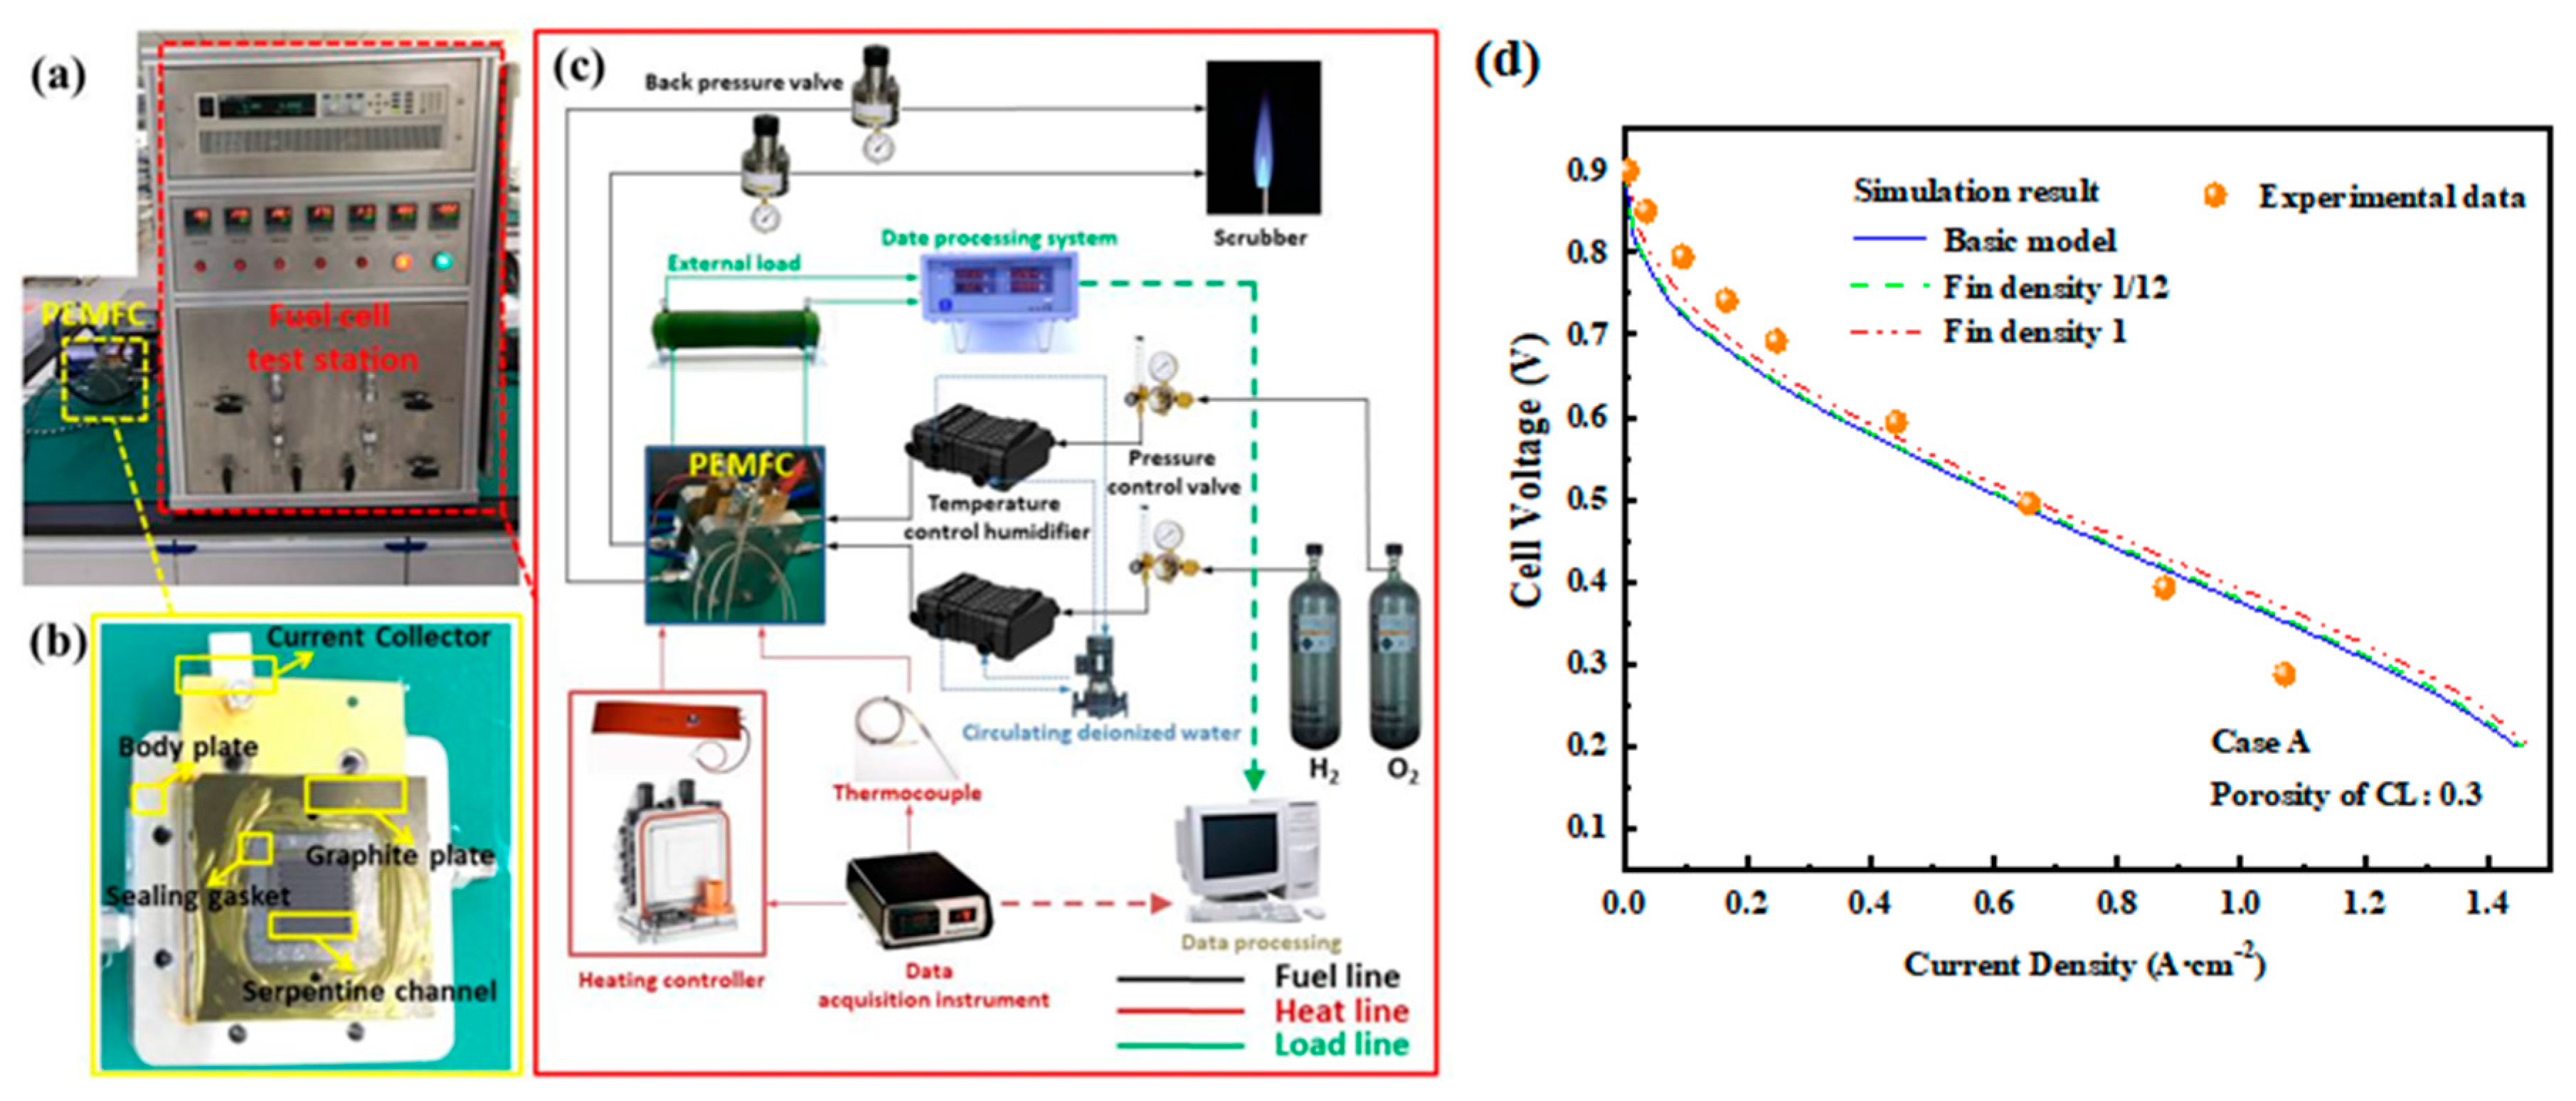
The polarization curve of a single cell based on the same operating conditions as the simulation experiment was obtained using the fuel cell testing platform at the Academy for Advanced Interdisciplinary Studies, Peking University. A typical PEMFC single-cell test system is shown in
Figure 4a. A commercial perfluorosulfonic acid proton exchange membrane, Nafion 212, was used as the electrolyte membrane. The main steps for single-cell preparation are as follows [
29,
30,
31,
32]:
- (1)
Pre-treatment of the Proton Exchange Membrane
First, the Nafion 212 membrane is treated in a 5% hydrogen peroxide solution at 80 °C for 1 h to remove impurities. It is then washed with deionized water and immersed in a 5% H2SO4 solution for 1 h to ensure full protonation. Afterward, the membrane is washed with deionized water and dried completely in a vacuum drying oven at 40 °C for later use.
- (2)
Preparation of Catalyst Ink
Catalyst ink with 10% Pt/C is then mixed with a 5% Nafion solution at a 3:1 ratio in isopropanol and ultrasonically dispersed for 1 h using an ultrasonic homogenizer to form a homogeneous catalyst slurry.
- (3)
Fabrication of Membrane Electrode Assembly (MEA)
A gas diffusion electrode (GDE) is prepared by uniformly coating a hydrophobic carbon paper microporous layer (0.02 m × 0.02 m) with a mixture of Pt/C (loading: 0.5 mg/cm2). The membrane electrode assembly (MEA) is then formed by hot pressing two GDEs onto a pretreated proton exchange membrane using a hot press machine at 150 °C, 10 MPa, for 15 min.
- (4)
Single-Cell Assembly
In the PEMFC, the end plates and bipolar plates serve to support the internal structure and conduct current. The graphite flow field plate functions as a gas channel, with a serpentine flow field design on the inner side. Sealing rings around the cell prevent leakage of reactant gases. The fuel cell is sealed with plastic gaskets and assembled using screws. Before operation, gas is introduced to check the sealing integrity of the system.
- (5)
Activation of the MEA Before Operation
Before the PEMFC power output test begins, the MEA must be fully activated to ensure that the polymer structure inside the newly prepared proton exchange membrane is sufficiently hydrated and has high ionic conductivity. In this experiment, a constant current and constant voltage alternation method is used. First, the MEA is operated at a constant voltage of 0.3 V for 1 h. Then, a constant current of 1 A is applied, increasing by 0.5 A every 20 min, and maintained for 1 h. These two operating modes are repeated until the voltage reaches or falls below 0.3 V. The hydration process of the proton exchange membrane is facilitated by water generated from the cathodic electrochemical reaction and the humidified reactant gases at the anode and cathode inlets. Additionally, during transitions between constant current and constant voltage operation, nitrogen purging for 2 min is performed to remove excess liquid water from the flow channels, preventing electrode surface flooding due to excessive electrochemical reactions. The activation process is considered complete when the operating current of the test cell remains stable with less than 10% fluctuation over 1 h.
Figure 4b,c show schematic diagrams of the PEMFC single-cell test system. During the experiment, hydrogen at the anode and oxygen at the cathode were released from gas storage tanks, with the pressure regulated by valves and the gas flow controlled by mass flow meters to meet experimental requirements. The reactant gases then entered a temperature-controlled humidifier for humidification. After being heated to the preset temperature by a temperature controller, the gases entered the PEMFC, where oxidation occurred at the anode and reduction occurred at the cathode. The fuel cell body was temperature-controlled by an external heating belt connected to a heating system, combined with a thermocouple temperature measurement system. The generated current was regulated by an external circuit load, which recorded the varying current and voltage data. Finally, the exhaust gases were discharged through an outlet pipeline for combustion and exhaust gas treatment.
As illustrated in
Figure 4, the polarization curves at different fin densities are all in good agreement with the theoretical values. The difference due to the pore size distribution and porosity of the porous electrodes significantly affects the transfer of gases and ions, and these details may not be accurately captured, leading to concentration polarization errors related to mass transfer.
Figure 4.
(a) PEMFC testing platform; (b) assembly process flowchart of PEMFC; (c) test system flowchart; (d) polarization curves compared with the experimental values.
Figure 4.
(a) PEMFC testing platform; (b) assembly process flowchart of PEMFC; (c) test system flowchart; (d) polarization curves compared with the experimental values.
3.2. Oxygen Concentration Distribution
The performance of a fuel cell is determined by the reactant species participating in the reaction; therefore, the variation in the concentration of the reactants is considered an important part of this study [
6]. The water that exists in the system can be regarded as gaseous under the condition of a high operating temperature; thus, the obstacle effect of liquid water in the gas diffusion layer can be neglected [
27].
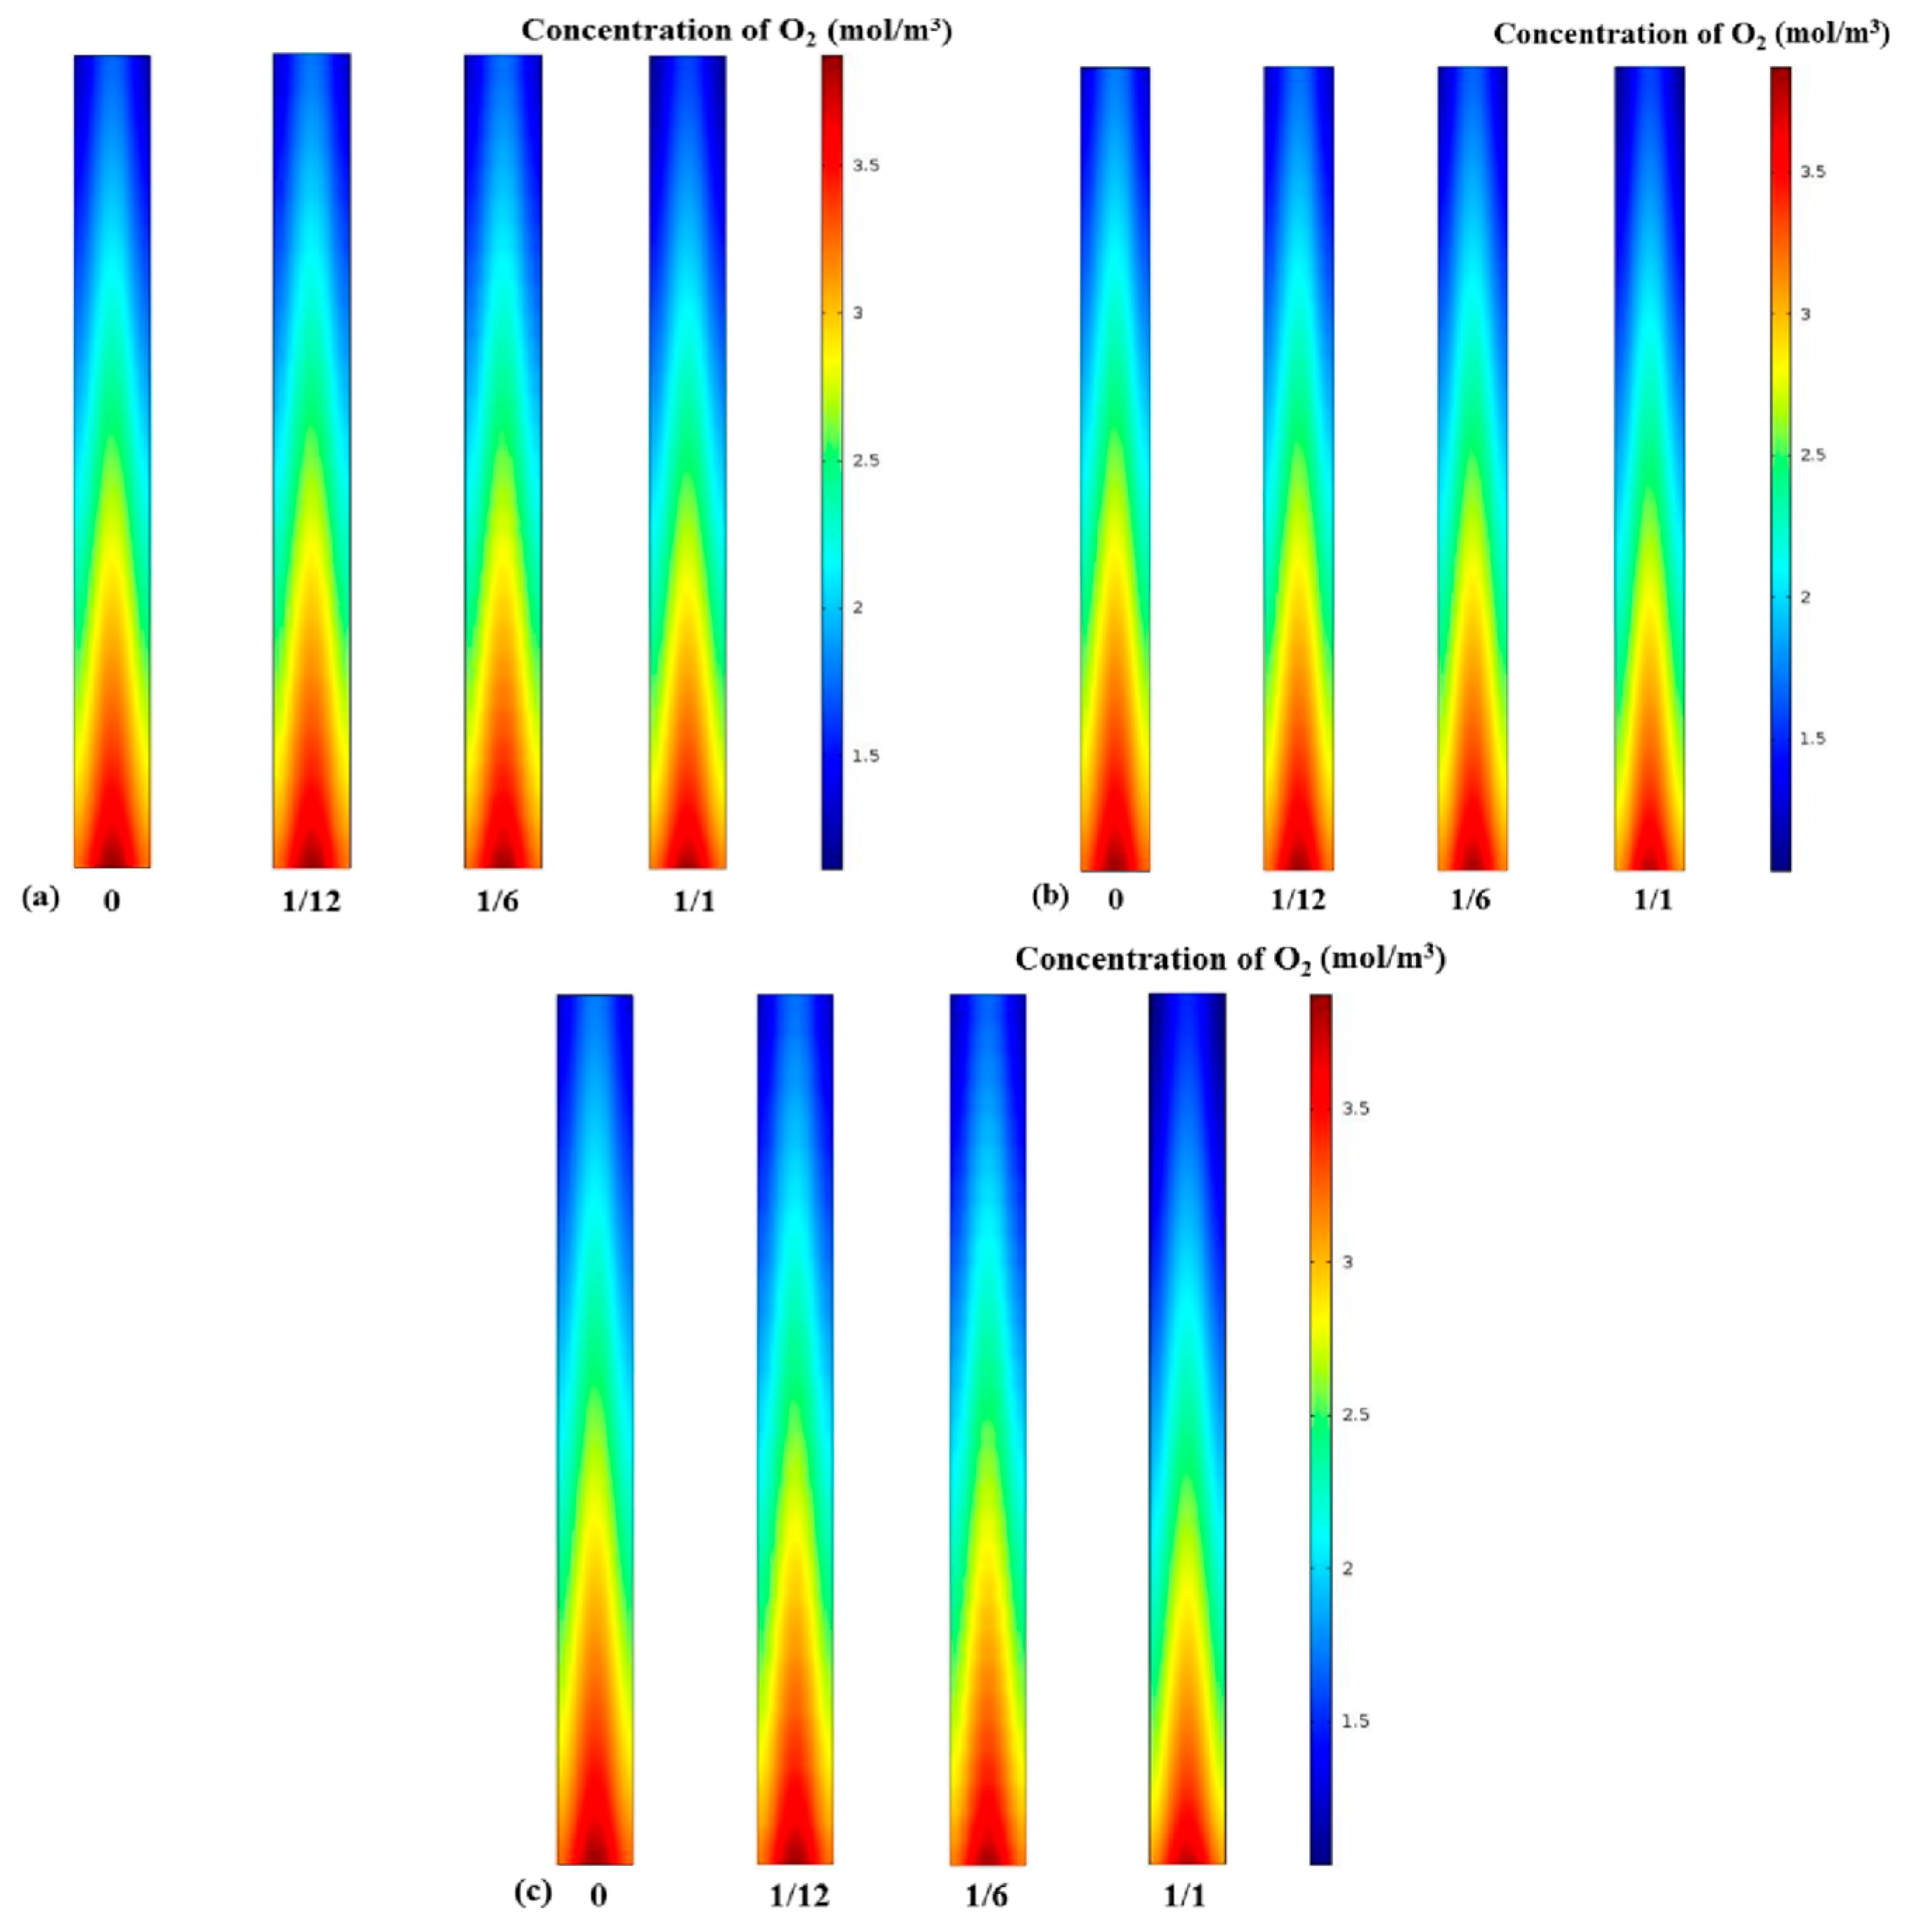
Figure 5 shows the influence of different fin densities on the molar concentration of oxygen at the interface between the PEM and the cathode GDL. At an operating cell voltage of 0.4 V, it is found from
Figure 5 that the distribution of oxygen molar concentration depends on the electrode fin density, position, and the aspect ratio of the fins. Clearly, the oxygen concentration at the inlet side of the air is higher than downstream because oxygen continues to be consumed by reduction reactions. Also, it can be observed in all three cases that along the length of the channel, the saturation of oxygen at the median position is higher than at the bilateral positions, as the diffusion effect at the underside of the GC is better than at the two bilateral positions [
36].
Figure 5a,c show that under the same fin density, more oxygen was consumed in Case C than in other cases. Furthermore, these contours disclose that the oxygen mole concentration decreased as the number of electrode fins increased, which is mainly due to the fin-made electrode having a larger reaction surface area.
3.3. Kinetic Characteristics of Electrochemical Reaction
Current density and cell potential, as well as reactant concentration, are the key factors that affect the performance of a fuel cell.
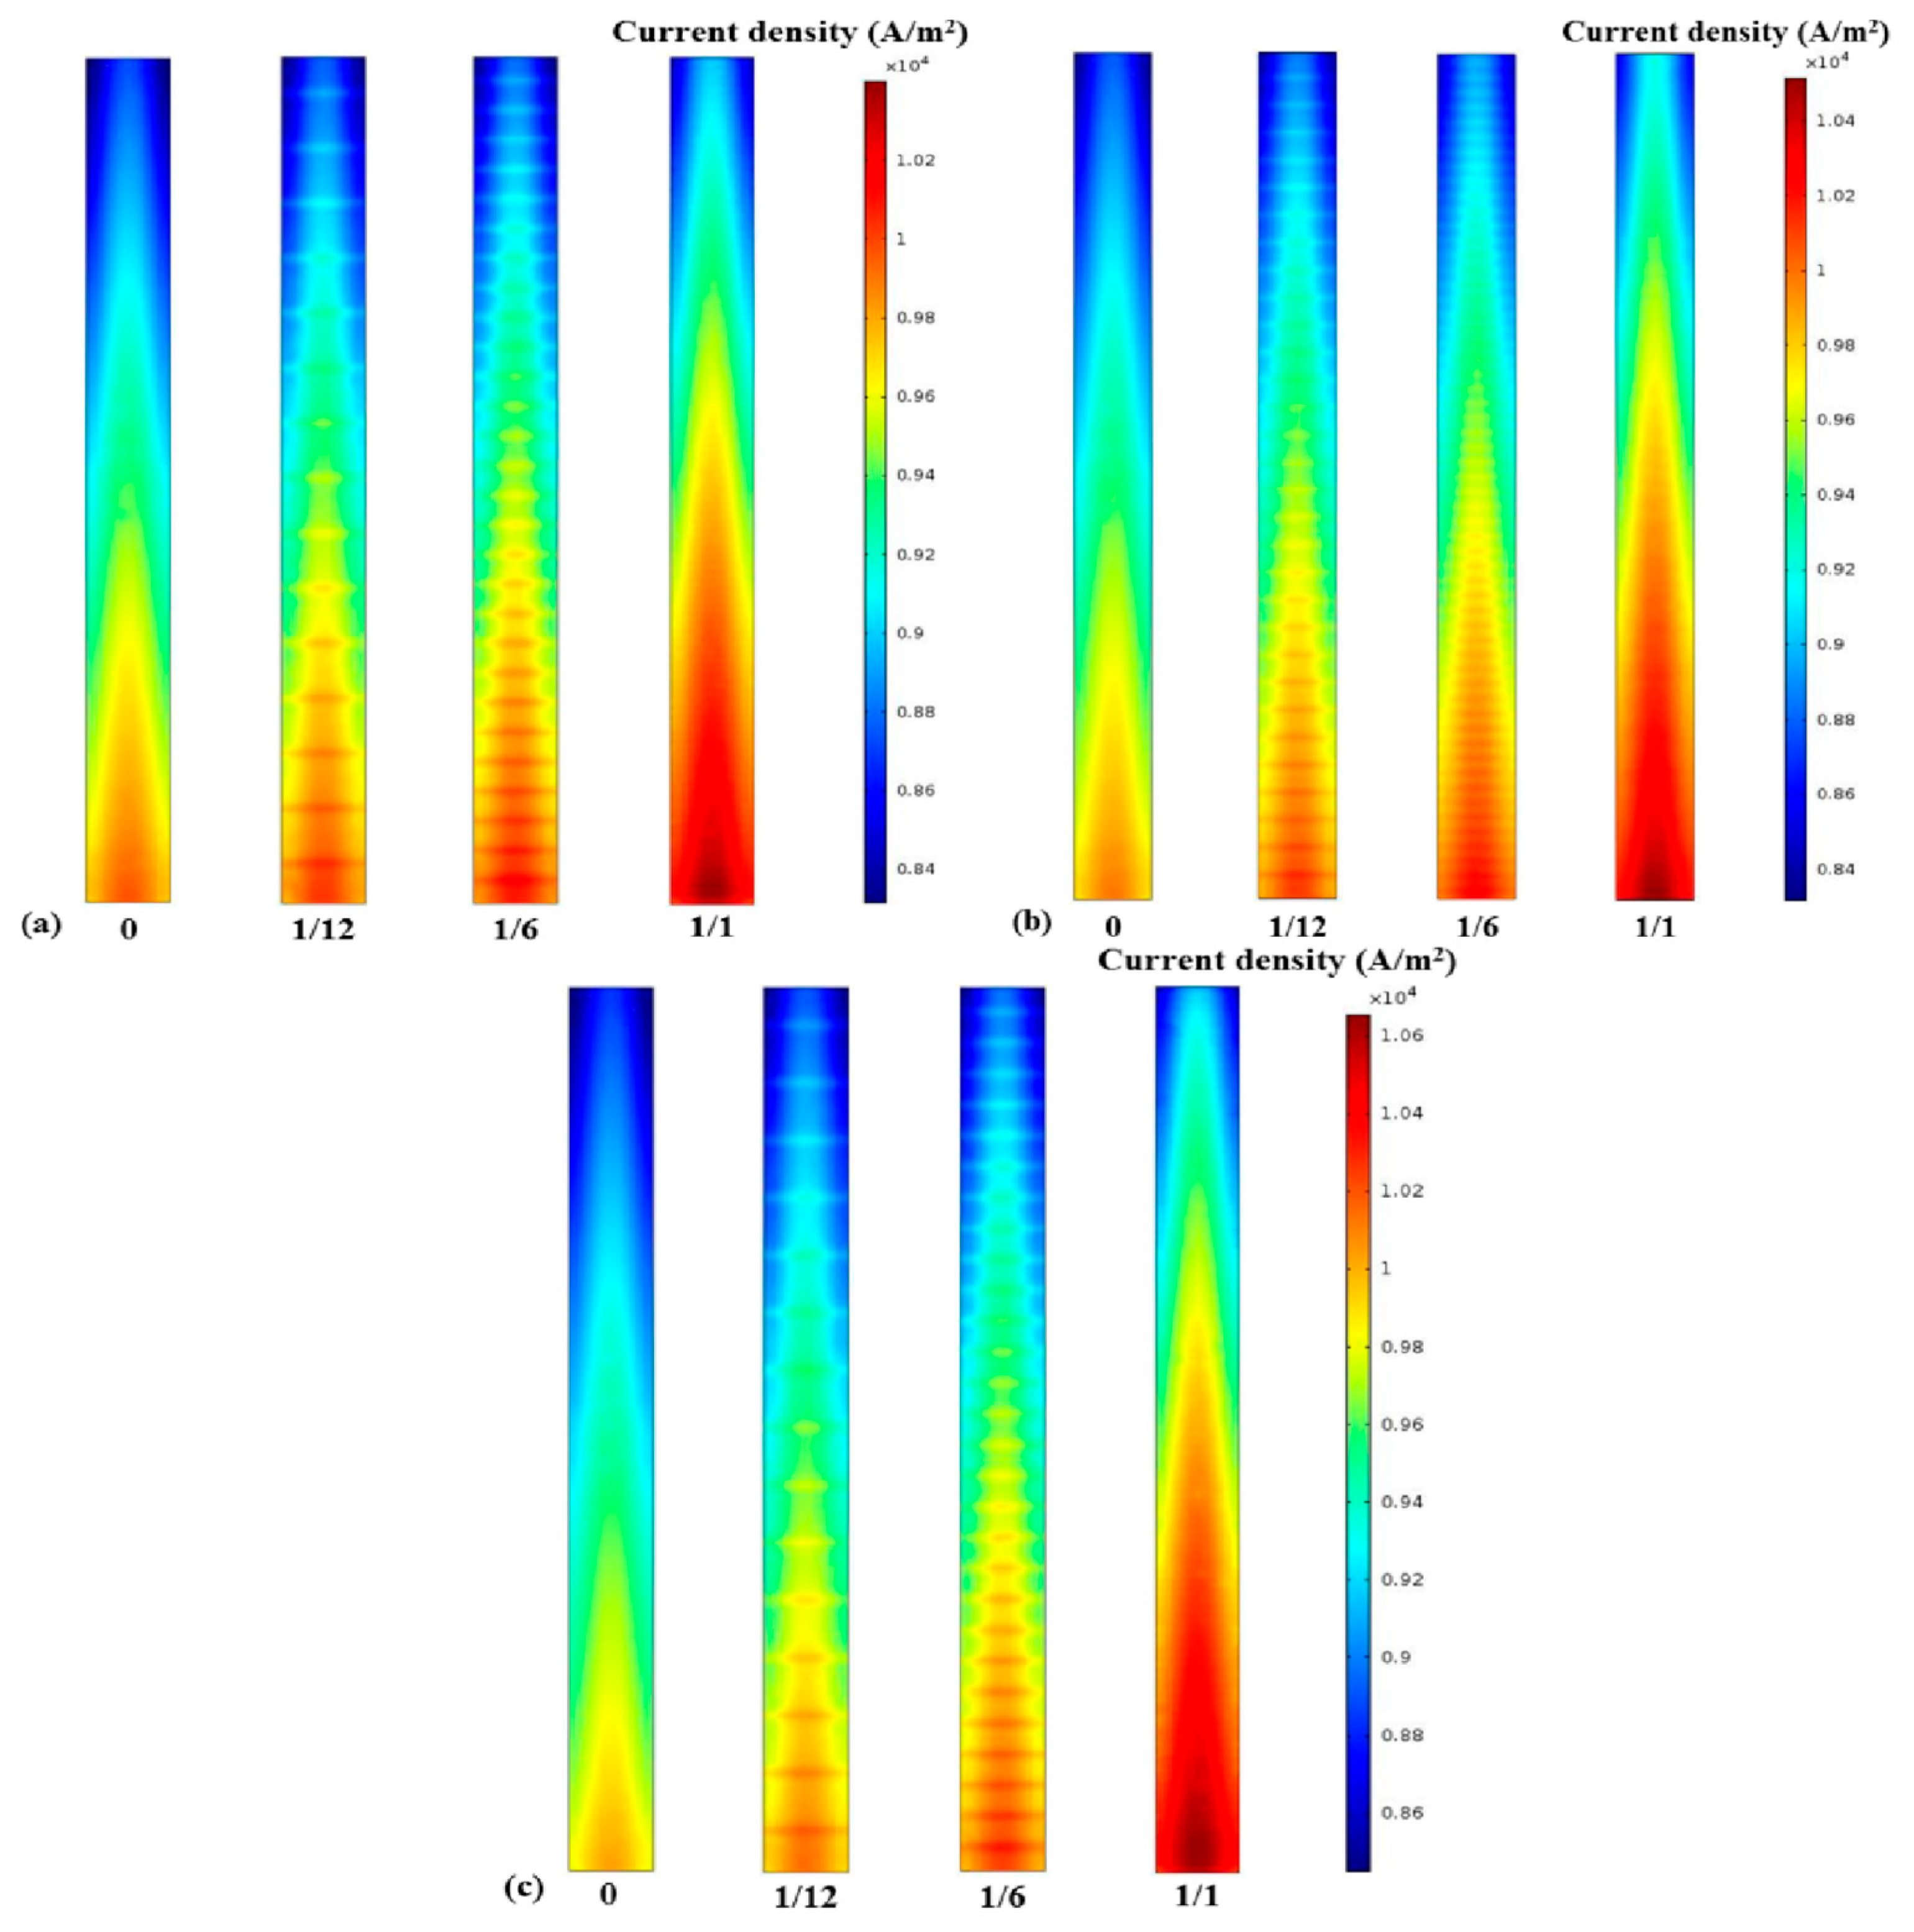
Figure 6 shows the current density contours for the different aspect ratios and fin densities of the electrode fins. A similar trend for current density in the intermediate layer of the PEM is clearly seen. The current density of the upstream reactant is higher than that of the downstream one, no matter what the electrode structure is. The current density reaches the maximum at the mid-position of the proton exchange membrane along the axis of the length direction, which is similar to the concentration distribution of oxygen. It is evident from
Figure 6a,c that certain electrode geometries, especially those with a larger specific surface area and more intensive fin density, can obtain a higher current density. Therefore, to elucidate the influence of electrode structure on current density under different cell voltage conditions [
10],
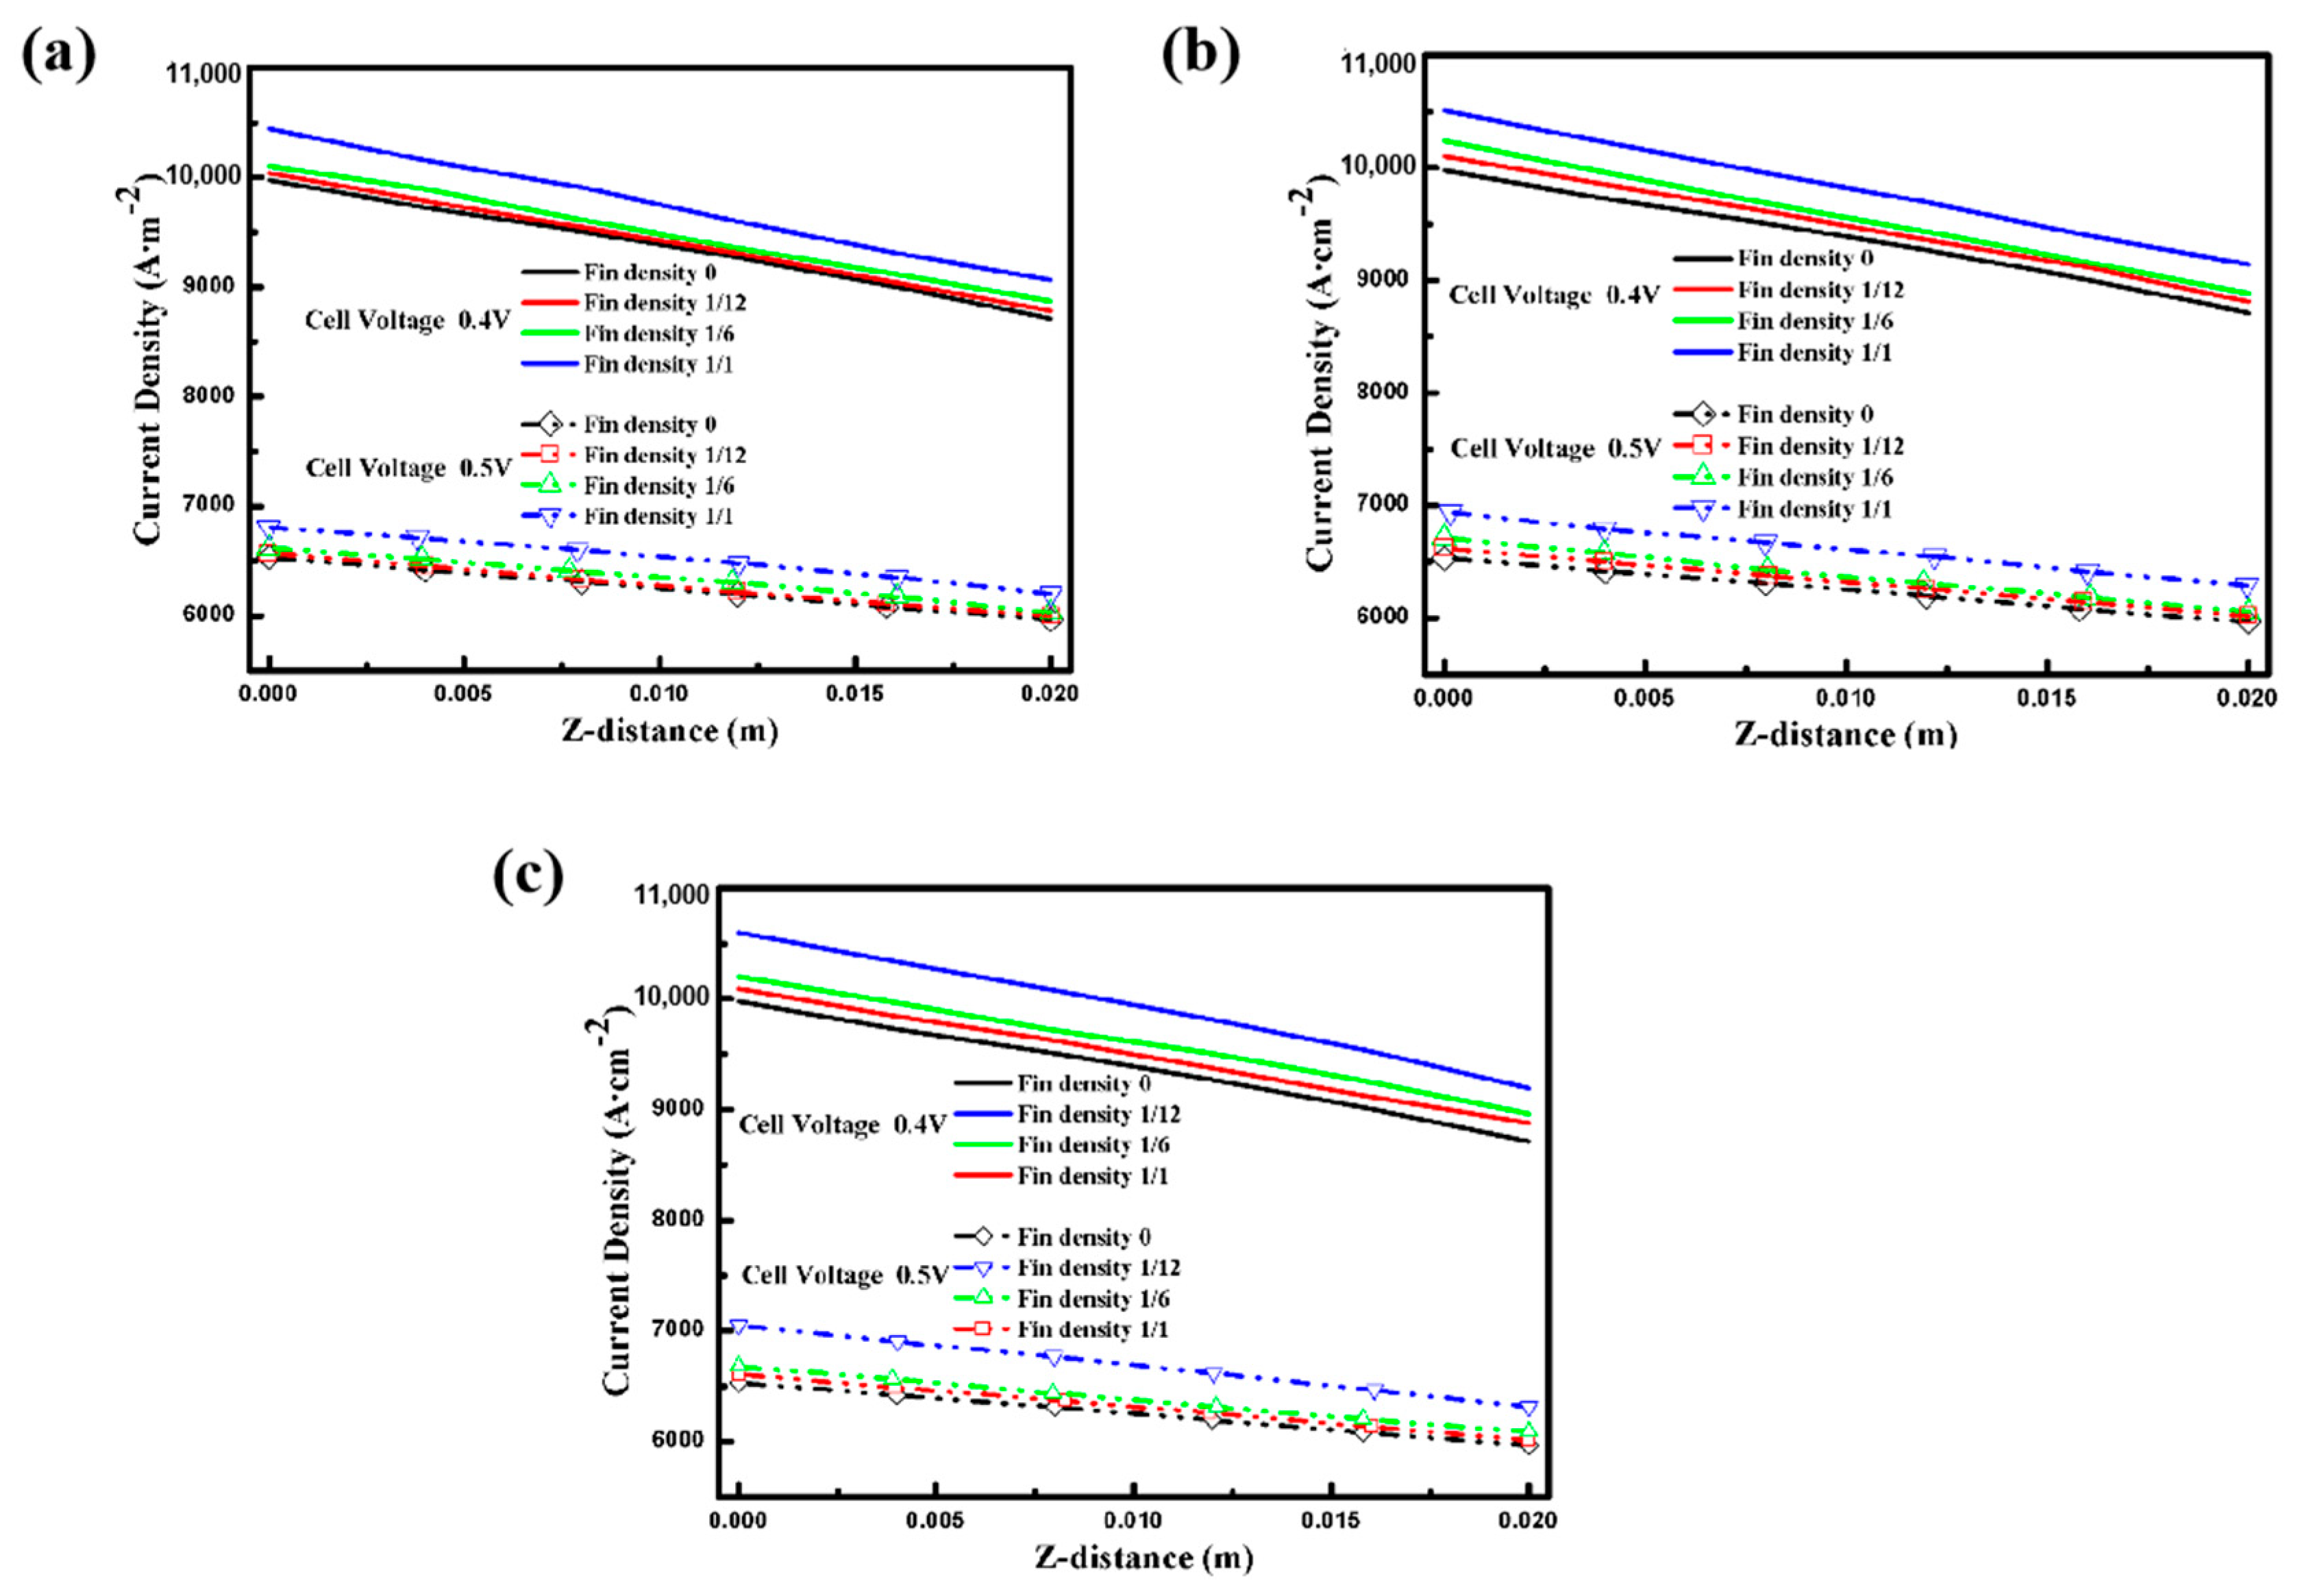
Figure 7 depicts the current density at the center line of the PEM interlayer under different conditions. In accordance with previous discussions, the electrochemical reaction intensity is limited gradually along the inlet direction of the reactant due to the constant consumption of oxygen, so the current density decreases, following the same trend as the reactant concentration [
12]. Moreover, the results indicate that the performance of the cell increases with the larger contact area between the electrode and the GDL. Thus, the cell performance with an electrode fin density of up to 1 was the best, as shown in
Figure 7c. Furthermore, although the current density distribution trend is the same at cell voltages of 0.4 V and 0.5 V, the overall performance is lower at 0.5 V due to the weaker electrochemical reaction rate.
In order to analyze the quantitative performance of the fuel cell with the electrode fin structure, the current density and output power under different operating conditions were comparatively studied.
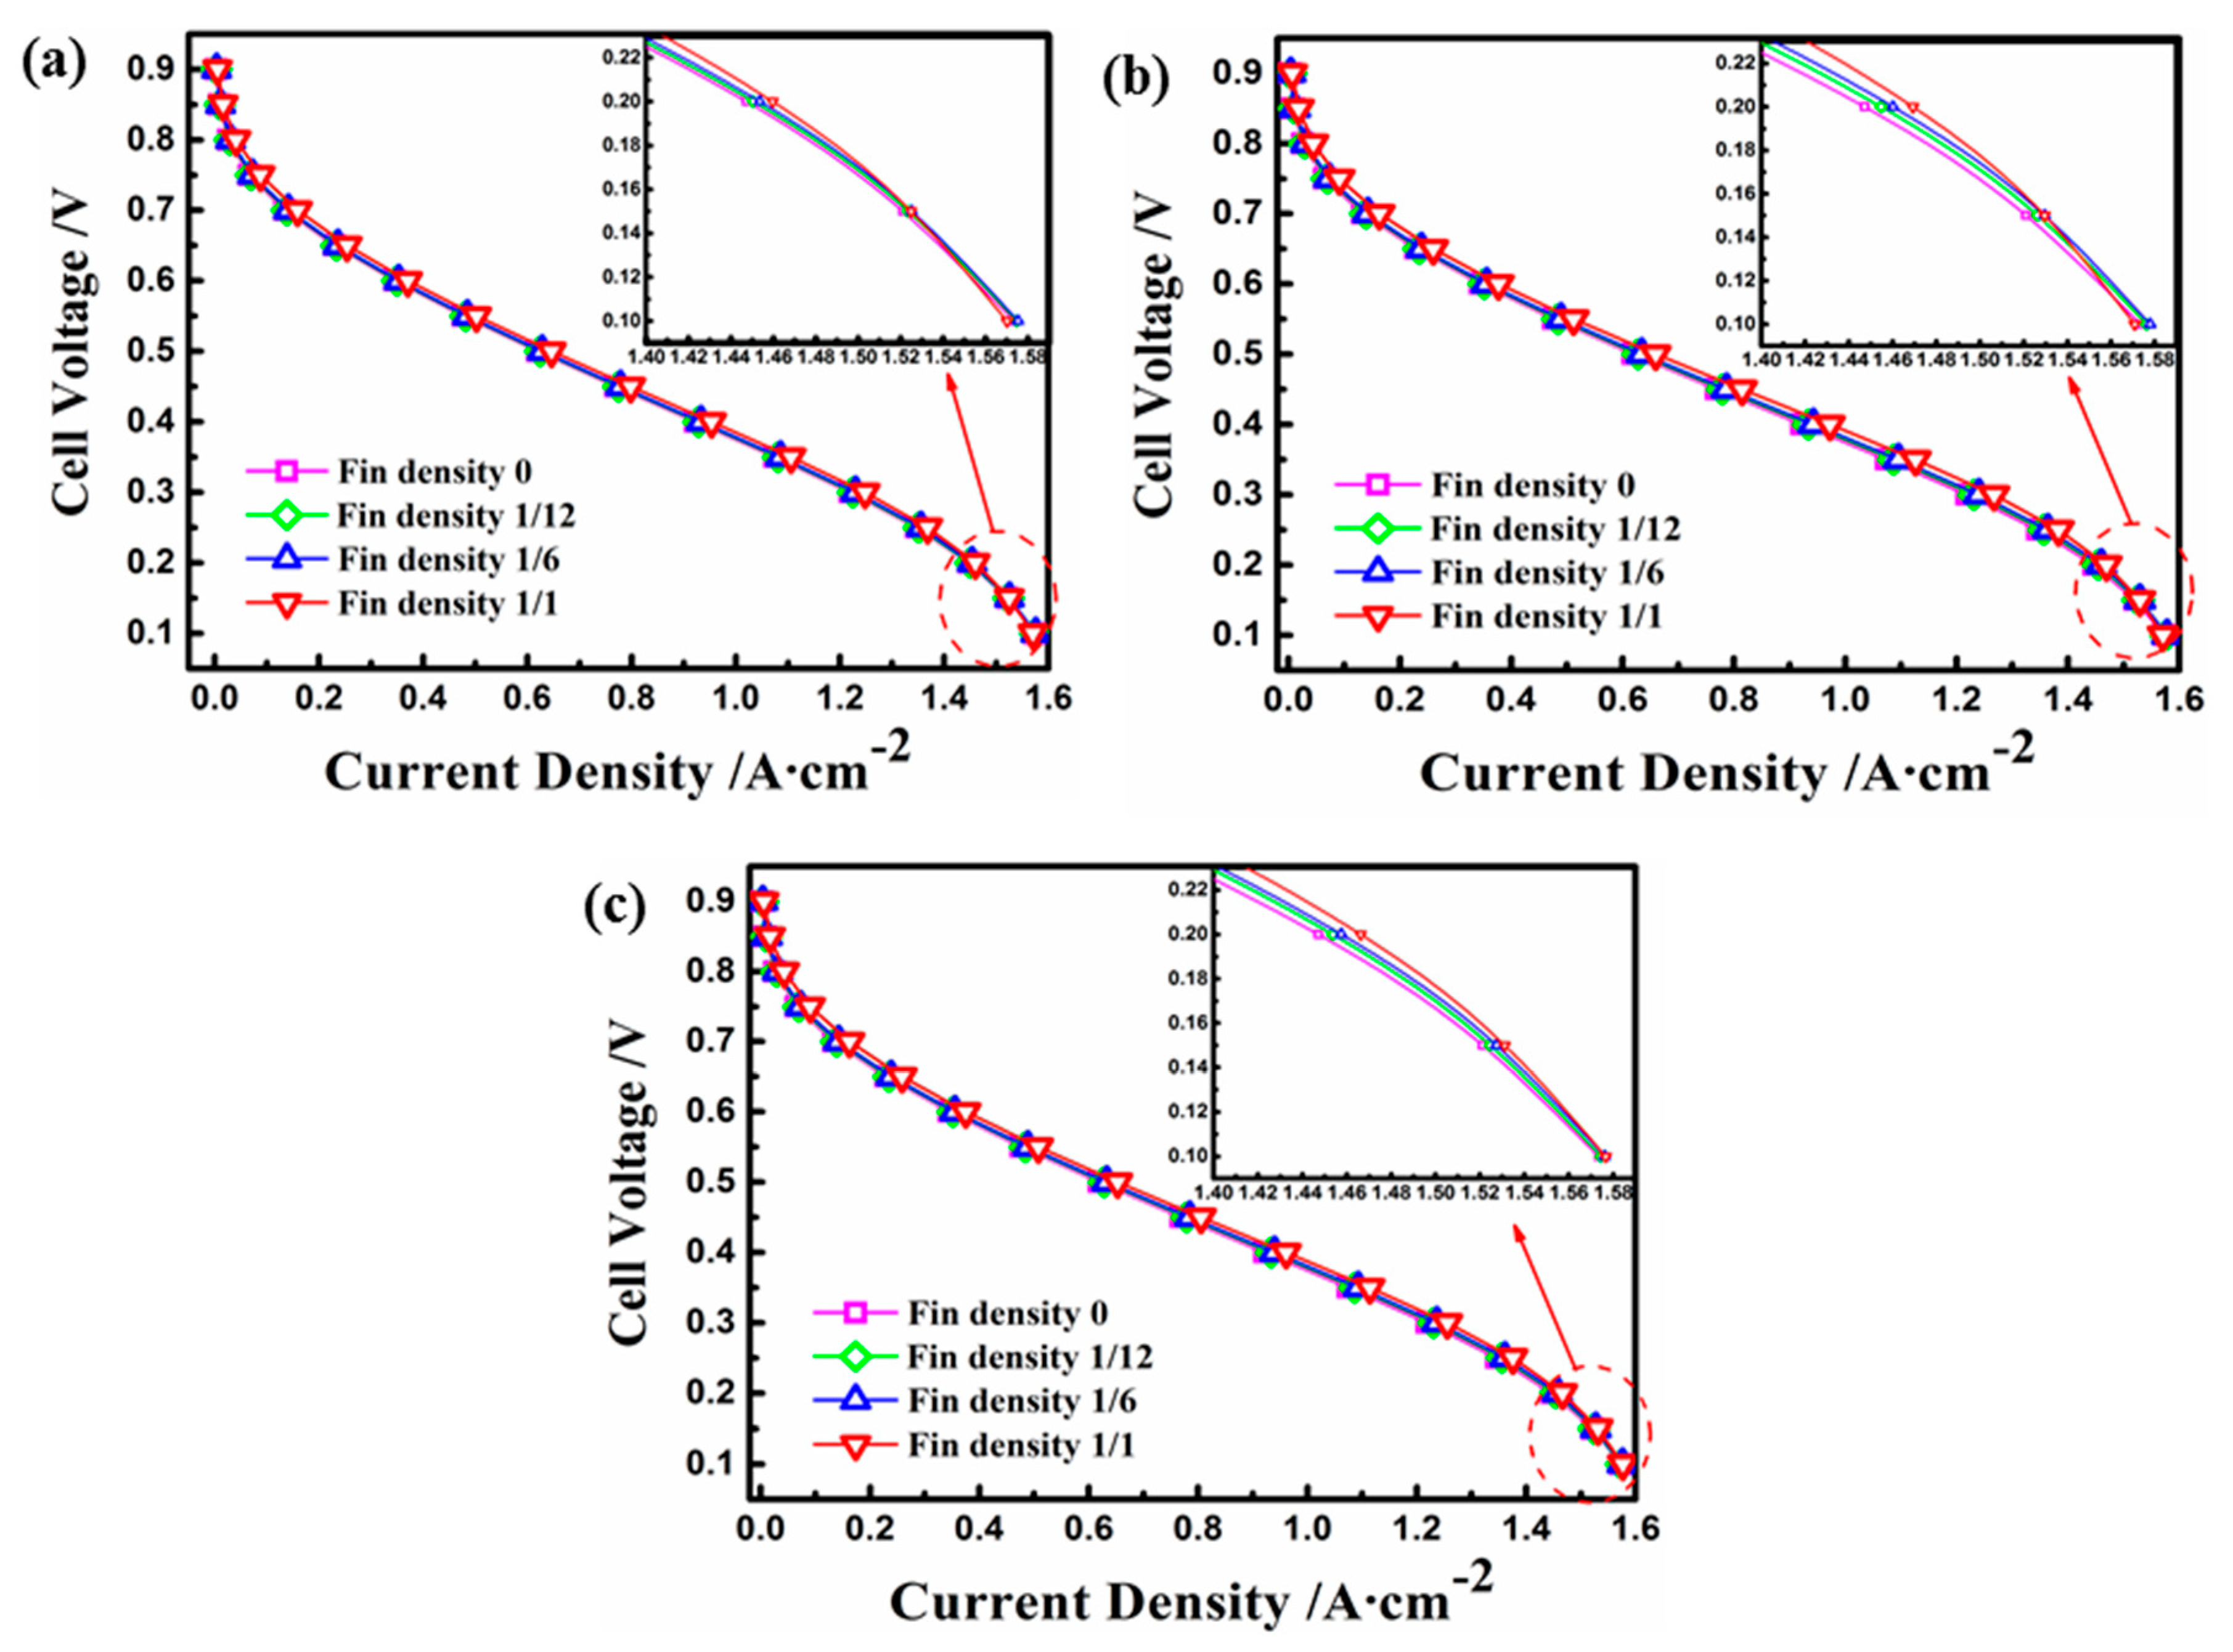
Figure 8 presents the polarization curves of current density and operating voltage with the various electrode fins. In general, the results indicate that with the decrease in operating voltage, the current density increased gradually. Furthermore, the performance of the fuel cell increased when the density of the electrode fin increased in the same case, and the optimal performance occurred when the density was equal to 1. At an operating voltage of 0.4 V, for instance, the model with a fin density of 1 improved the current density in Cases A to C by 3.3%, 4.2%, and 5.4%, respectively, compared with the basic model. However, under the same fin density, the case with a high aspect ratio had the highest current density when the operating voltage was less than 0.4 V because of the largest contact area under the same electrode surface, and the concentration polarization of Case B was more obvious at the voltage of 0.1 V.
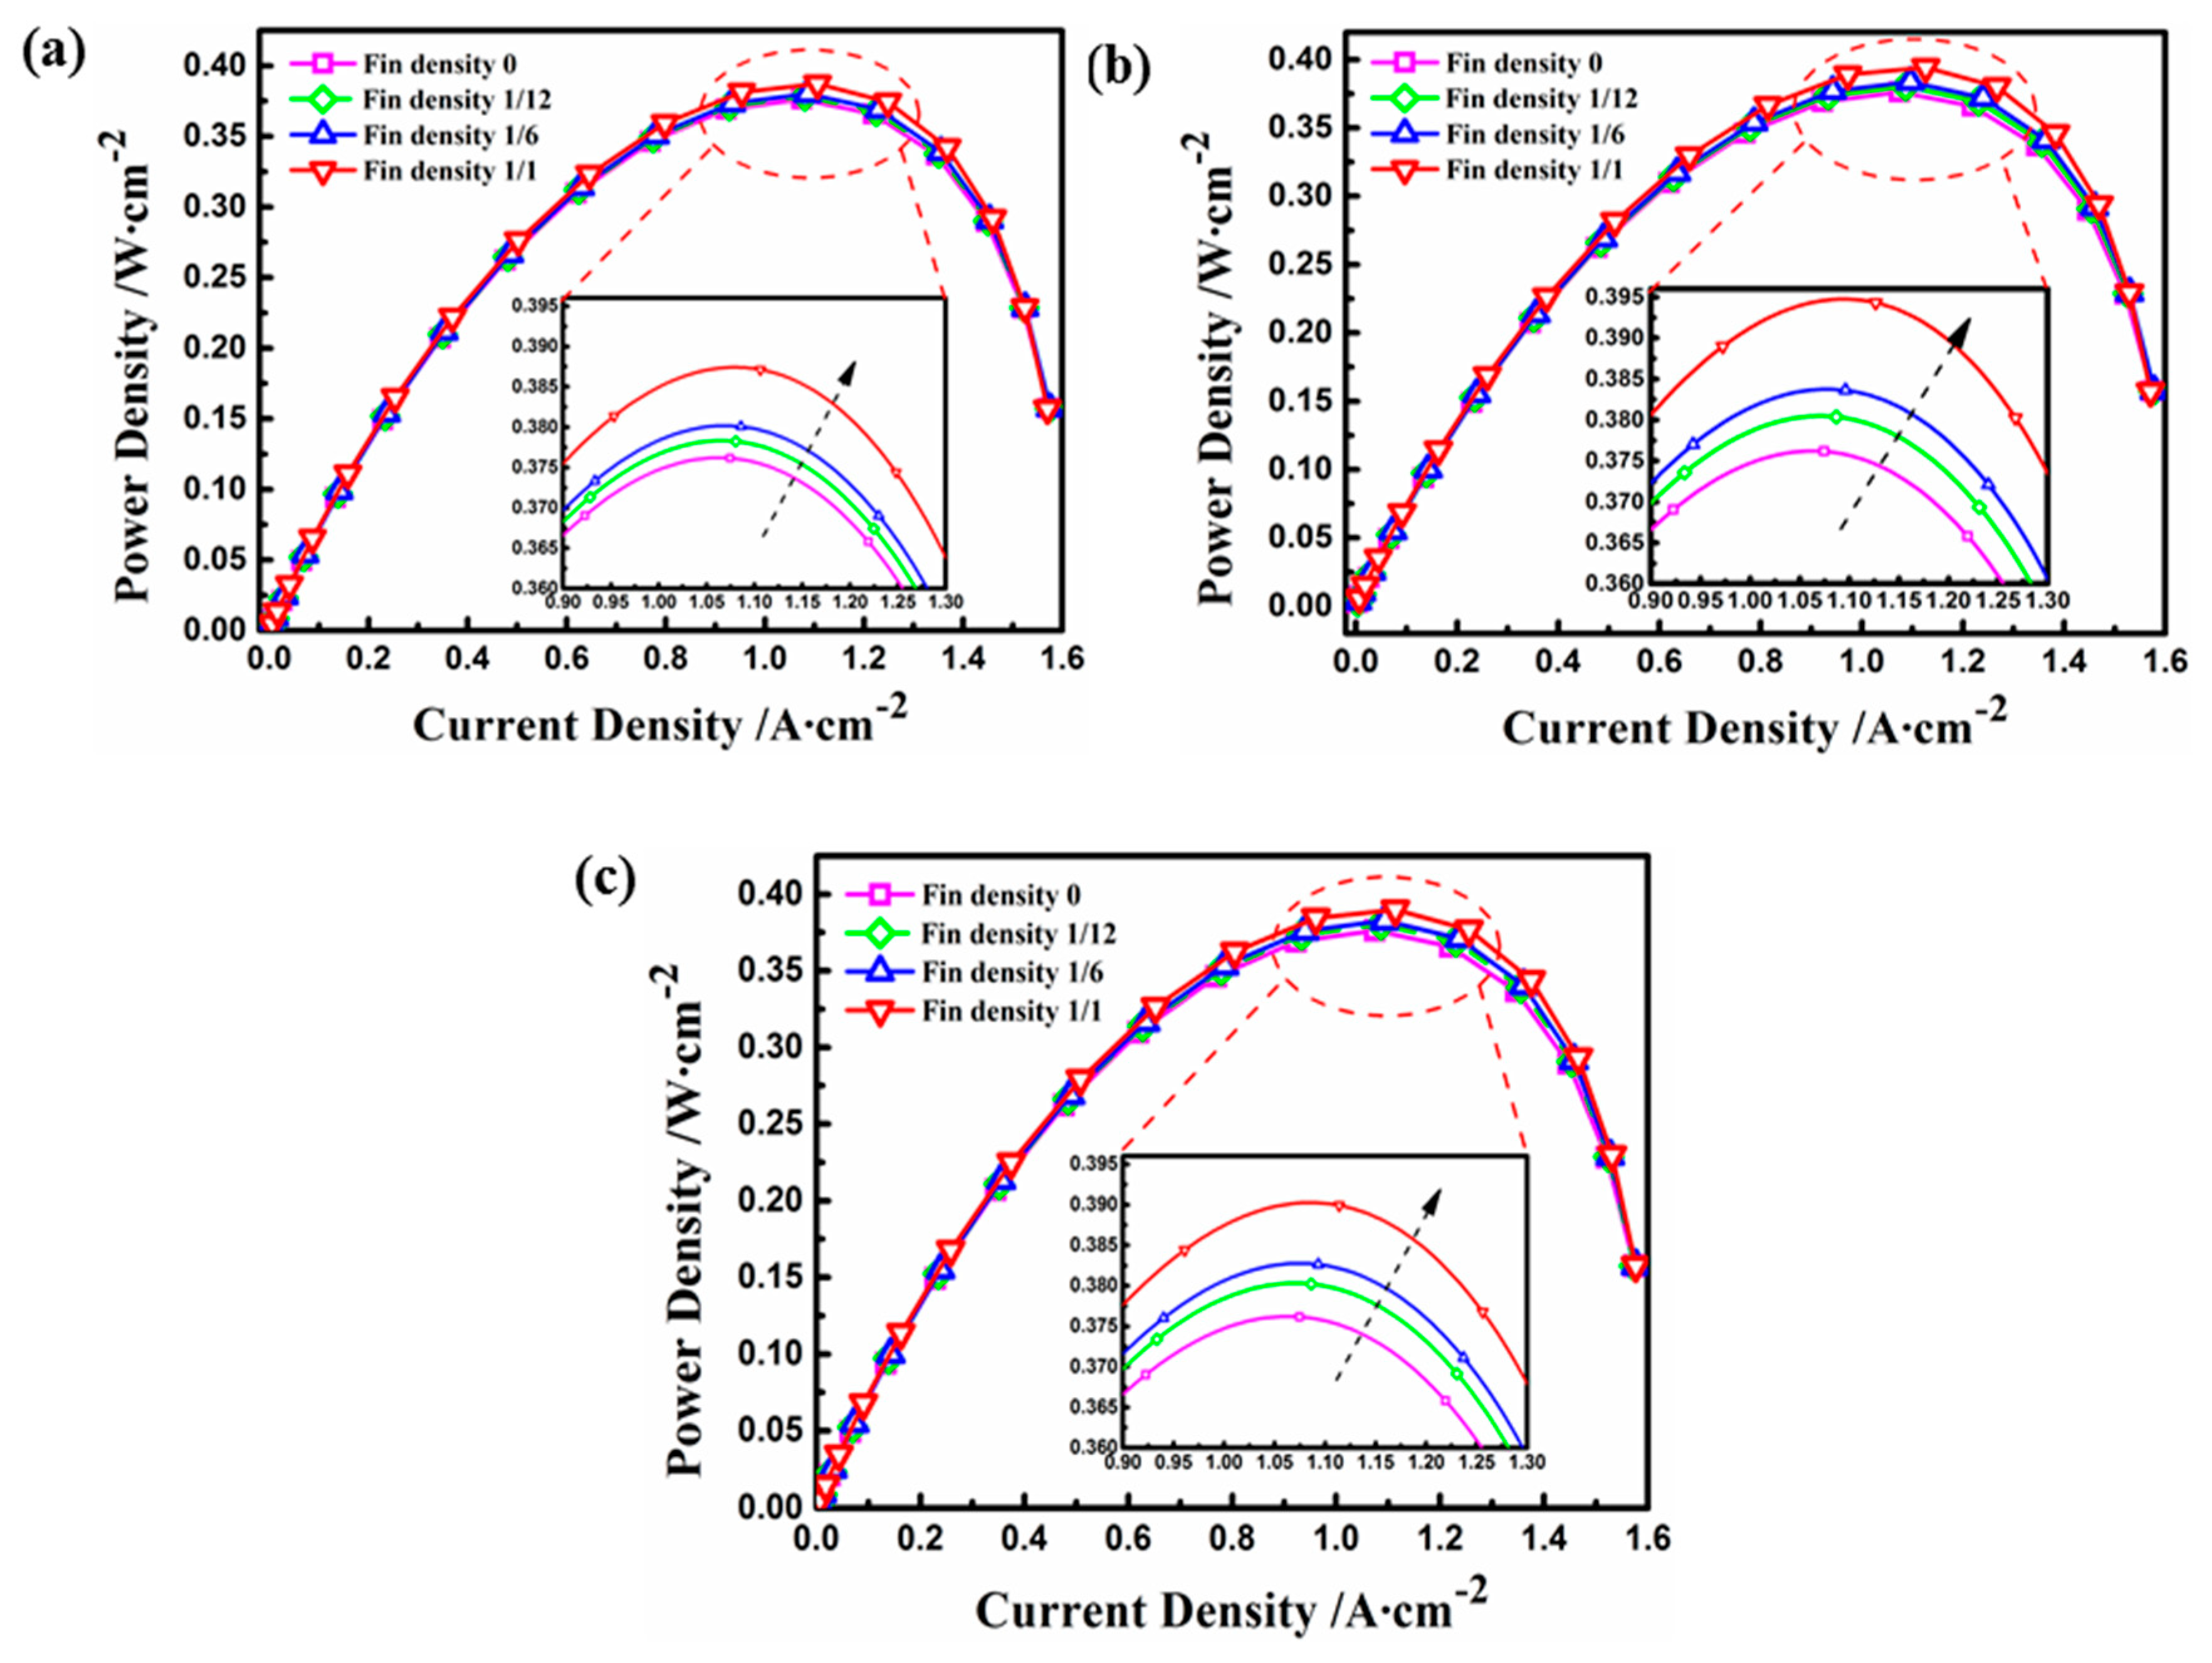
Figure 9 shows the influence of different electrode structures on power density. Generally speaking, as the operating voltage increased, the output power for each working condition reached the maximum value under an operating voltage between 0.3 and 0.4 V. The results show that the optimum performance, in terms of power density, was obtained by increasing the electrode fin density and the aspect ratio [
27]. Moreover, the maximum values of power density for Cases A, C, and B were 0.387
, 0.390
, and 0.395
, respectively, corresponding to an increase of 4.3%, 5.1%, and 6.5% compared with the maximum power density of 0.371
for the basic model.
3.4. Overpotential Distribution on the Surface of the Fin
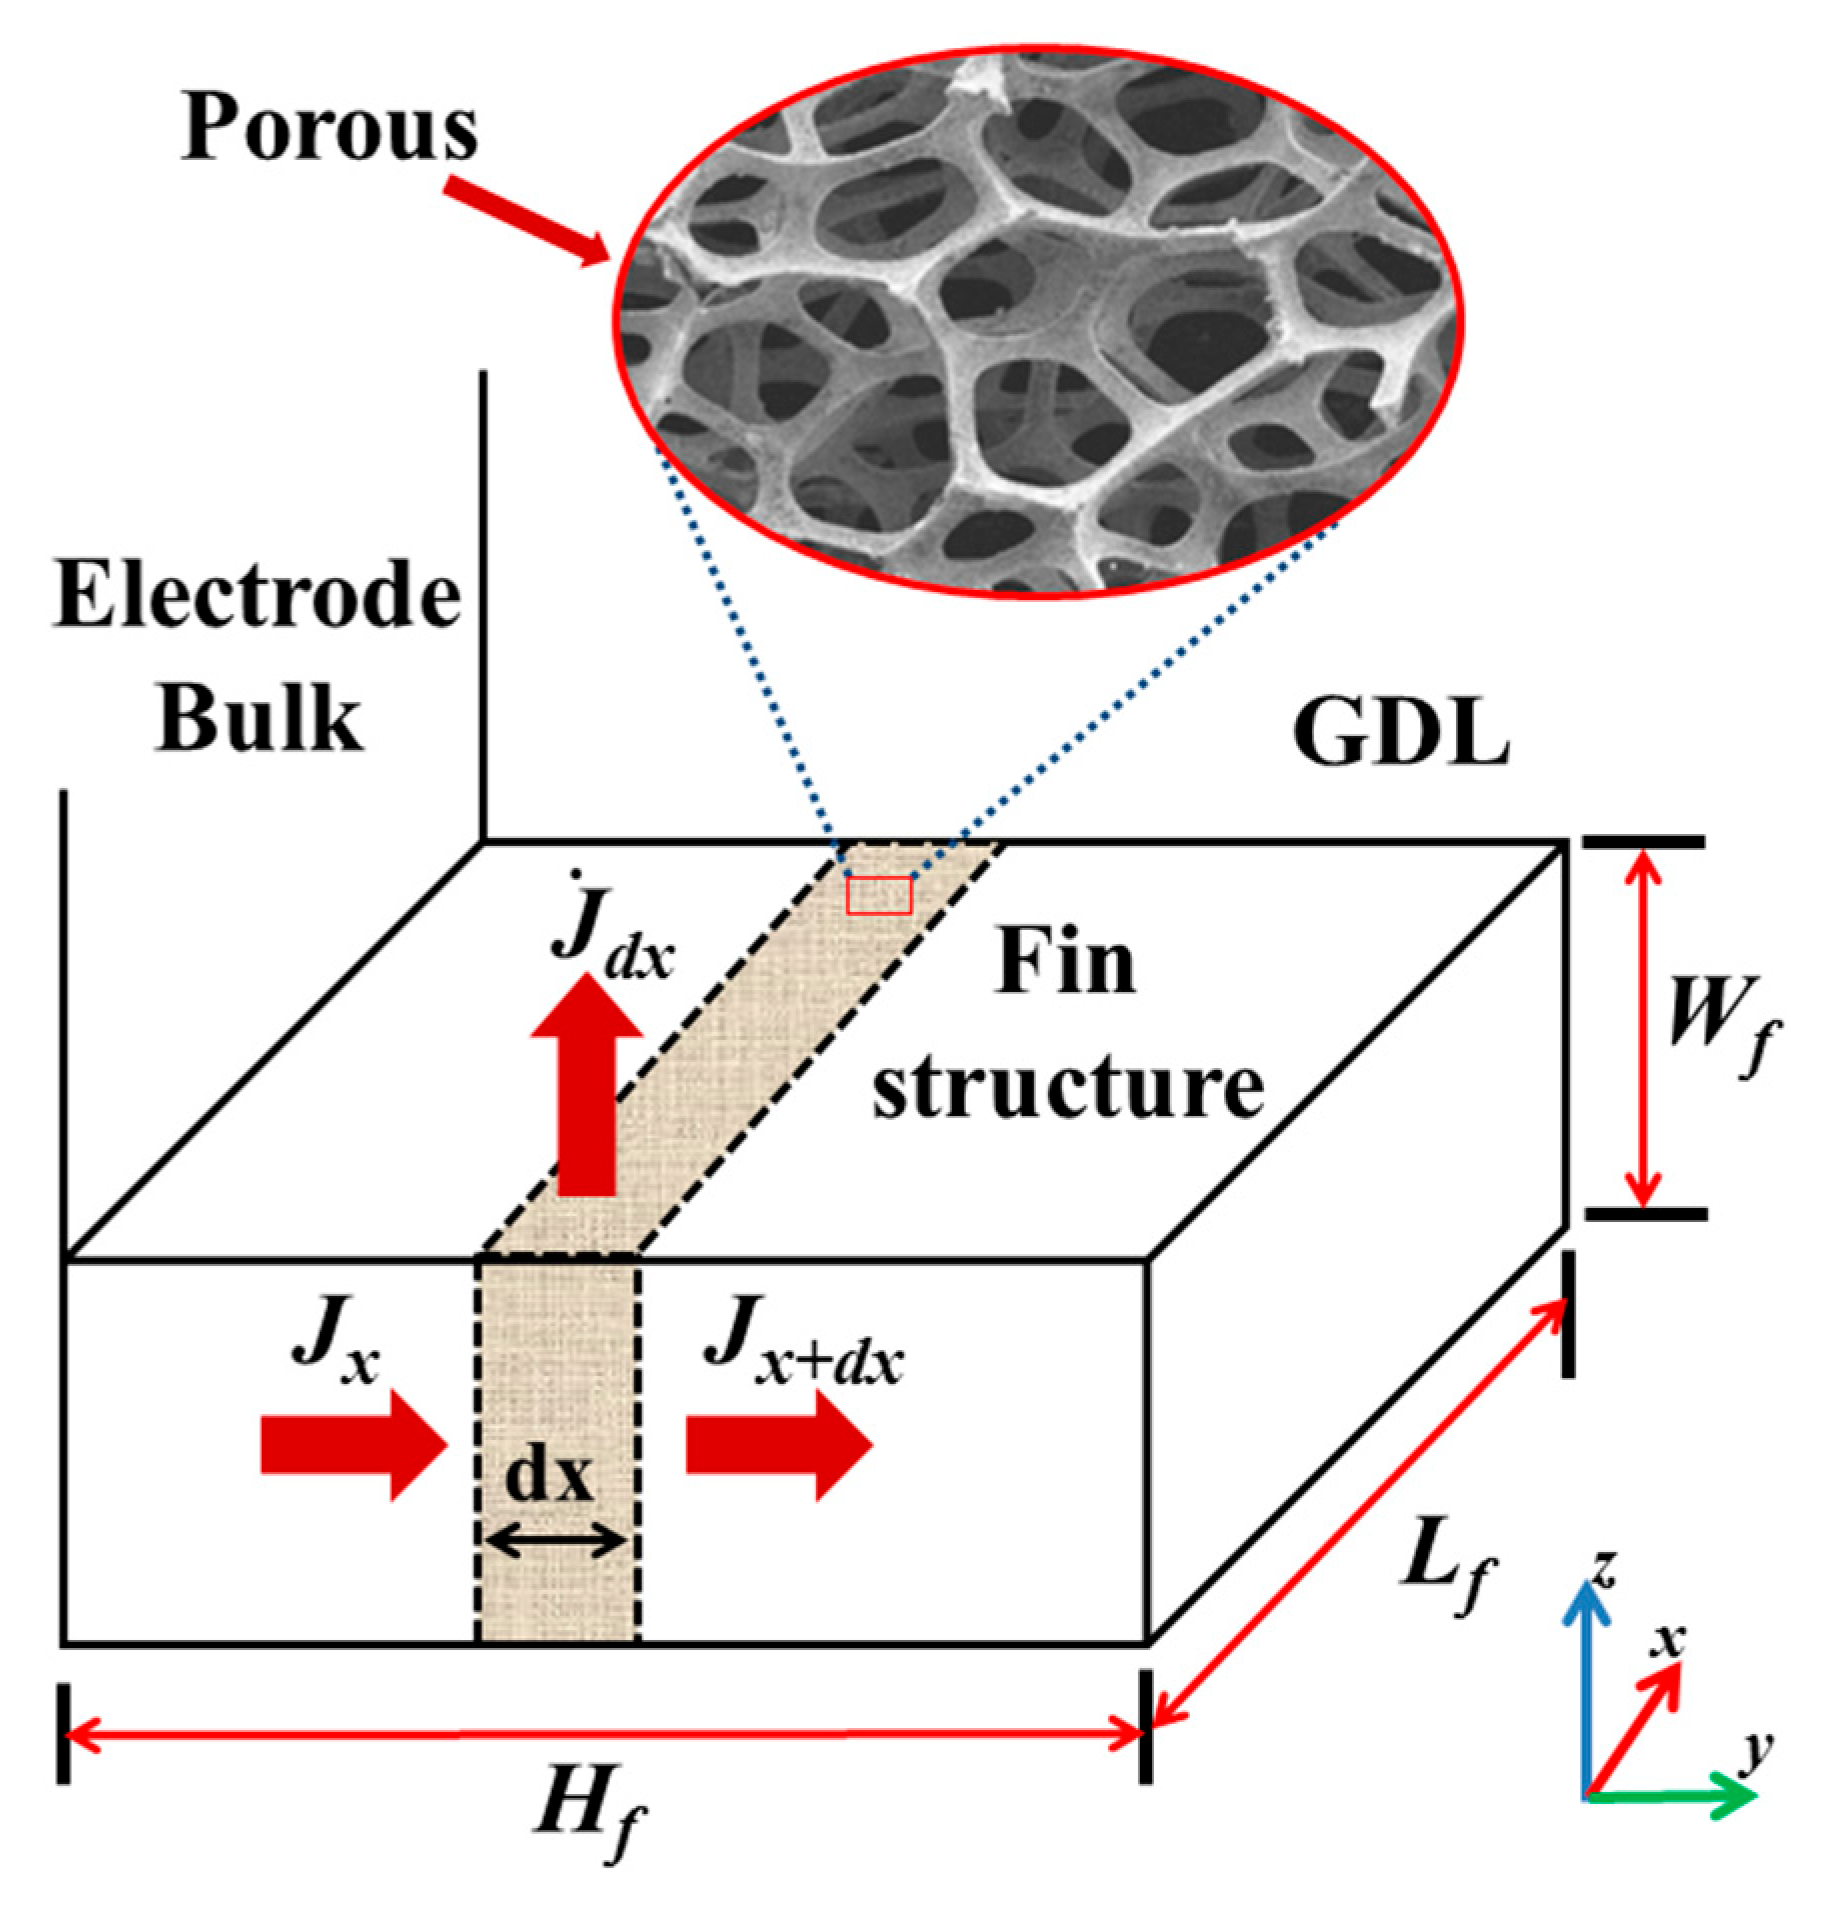
As discussed previously, the fin structure of the porous electrode can improve the performance of the fuel cell by enlarging the surface contact area between the electrode and the GDL. Thus, investigating the voltage loss behavior of the fin structure helps to reveal the mechanism for its electrochemical kinetics performance. With an electrode fin density of 1/12 in the sample cases, the overpotential distribution in the height direction of the fin (
) was compared with the theoretical solution given by Equation (17). The internal resistance of the electrode
is shown in
Table 7, which is composed of mass transfer resistance, ohmic internal resistance, and polarization internal resistance. It can be solved by the slope of the polarization curve.
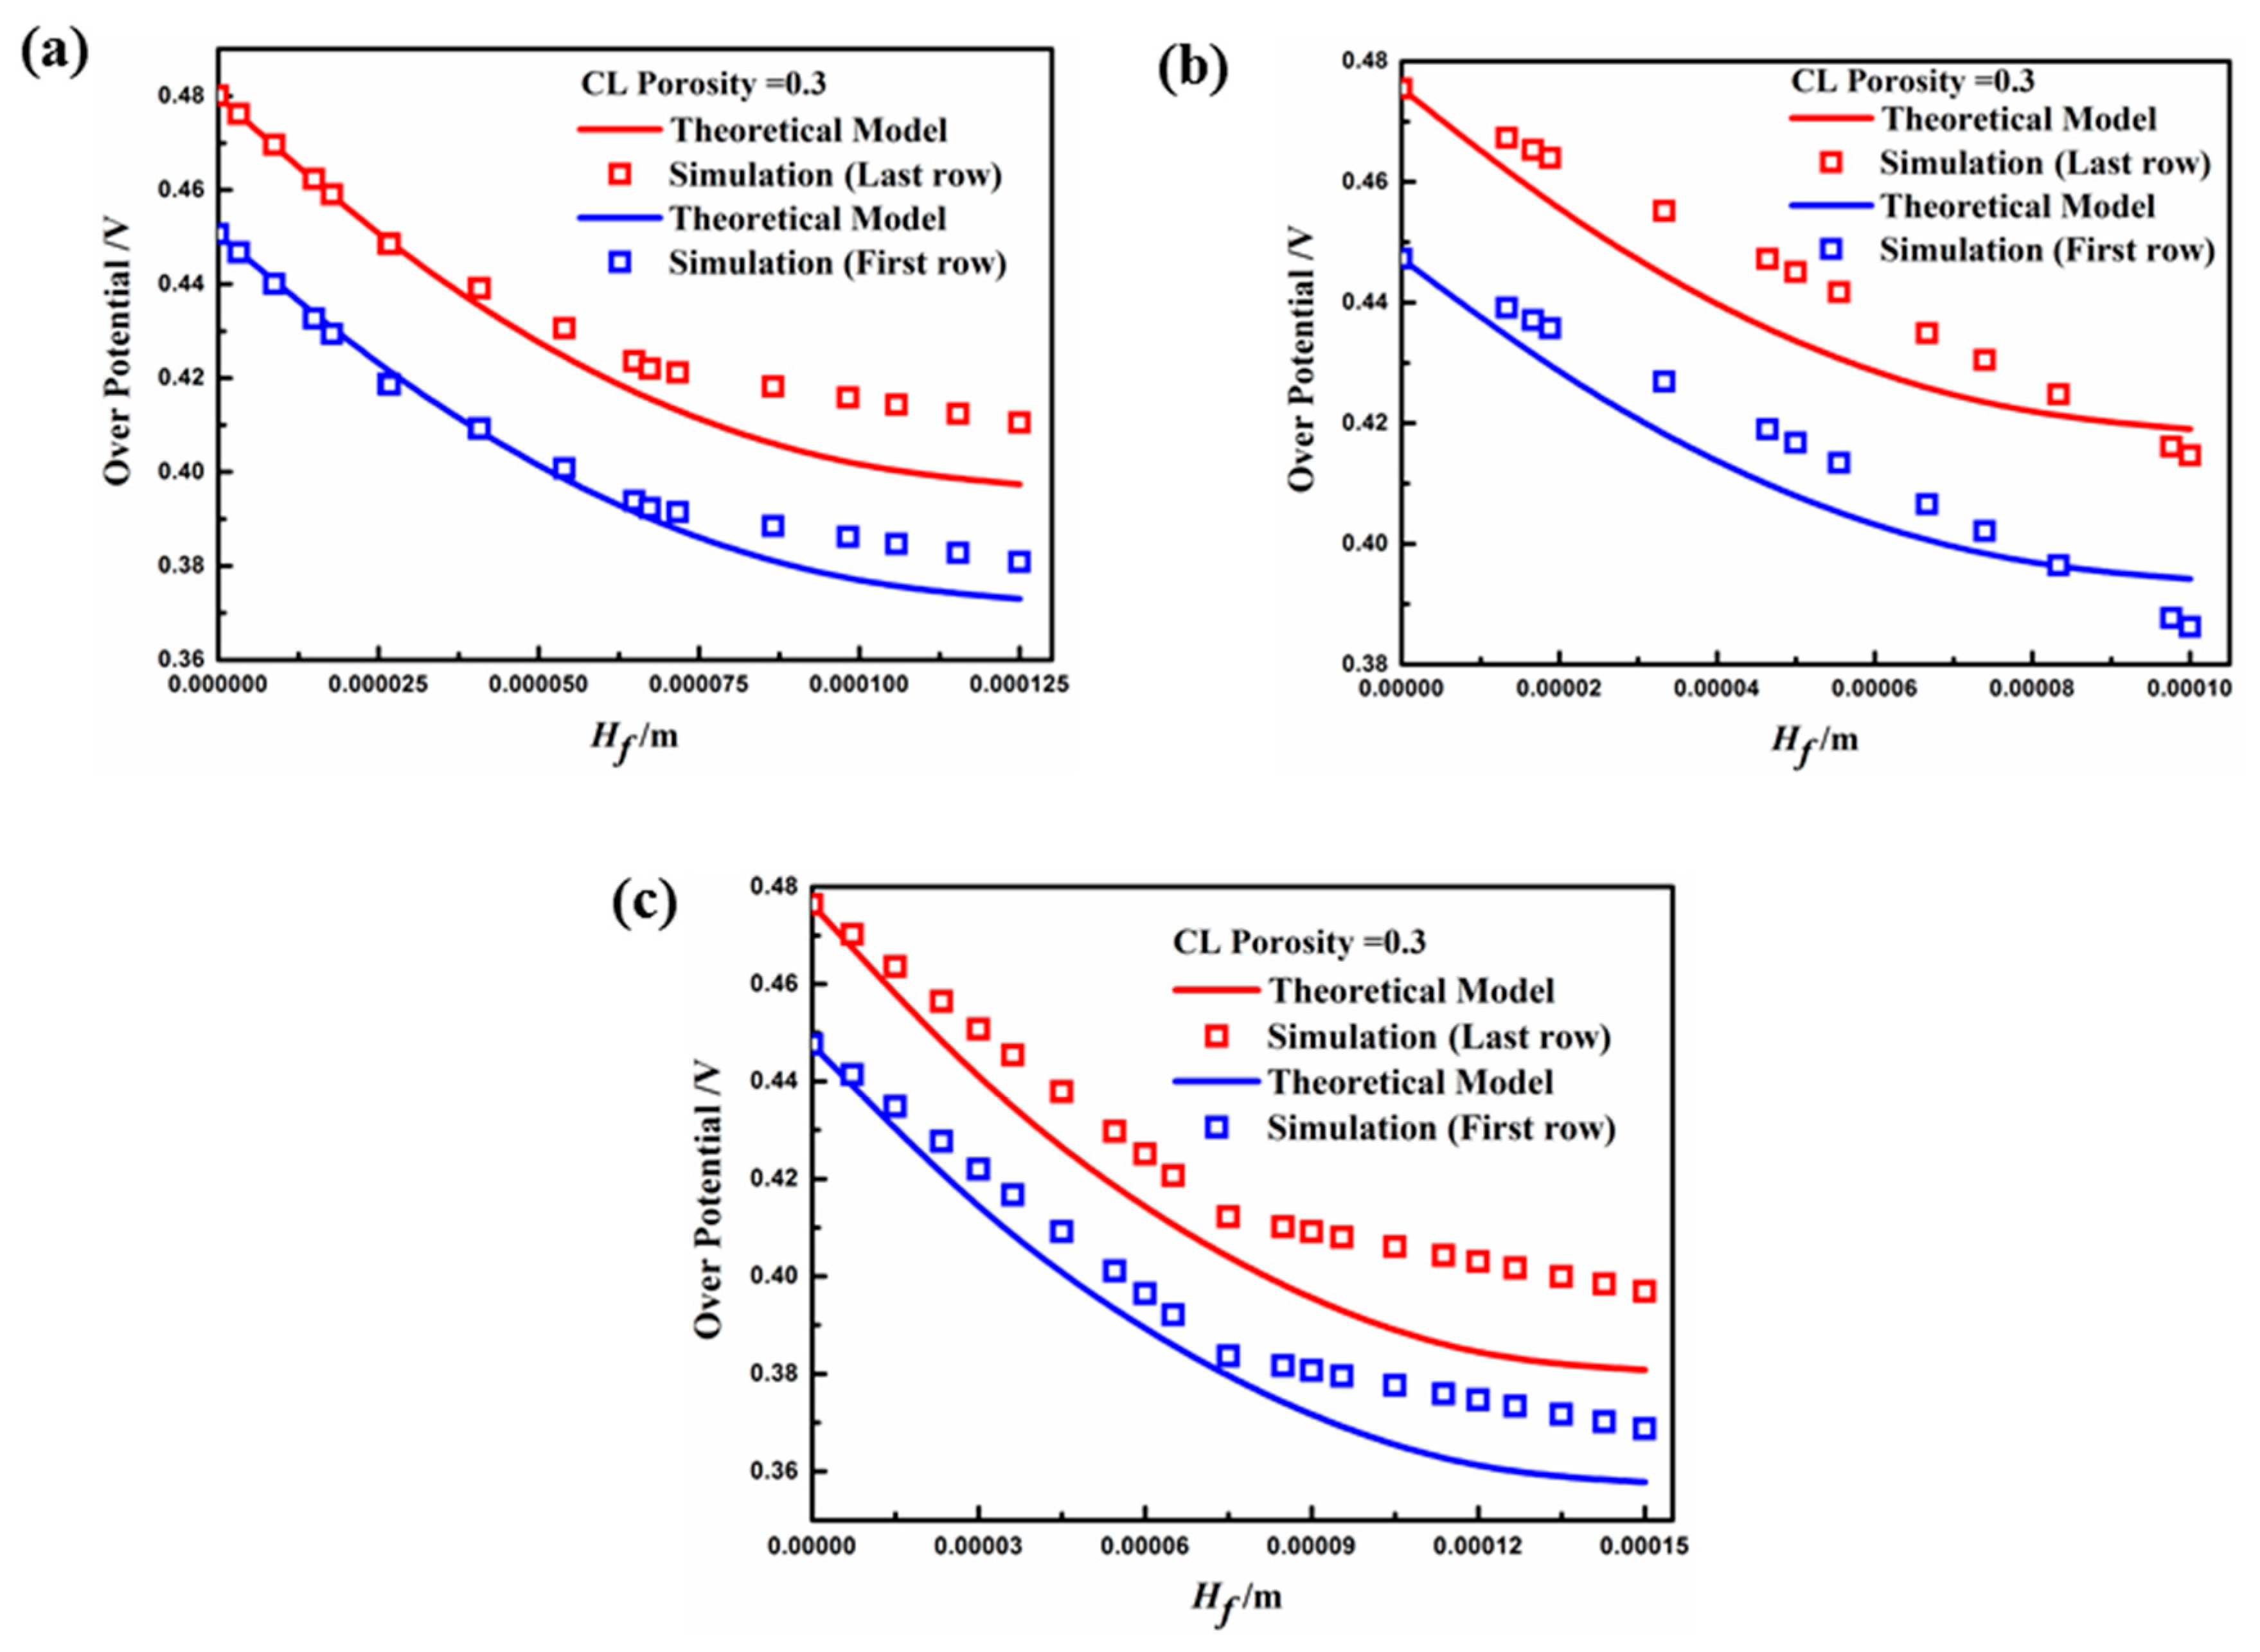
Figure 10 depicts the distribution of overpotential along the
y-direction of both the first and last rows of the fin, which coincides well with the mathematical model under the electrode porosity of 0.3. The overpotential gradually decreases along the fin height direction, which is due to the sufficient concentration of the contact reactant at the top of the fin, and the concentration polarization occurred at the base position more obviously. In this figure, the variability between the theoretical model and simulation value is the lowest for Case B, then Case C, and finally Case A. The smaller aspect ratio and larger width of the electrode fin resulted in a non-uniform overpotential distribution along the cross-section of the height direction. Thus, the surface overpotential was smaller than at the central part of the fin molding, leading to a decrease in the current through the electrode surface (the source term). Hence, the overpotential distribution of Case A was almost linear. In addition, the overpotential of the first row of fins was smaller than that of the last row for each case, because the reactants were markedly consumed from the first row to the last row, resulting in insufficient concentrations and polarization.
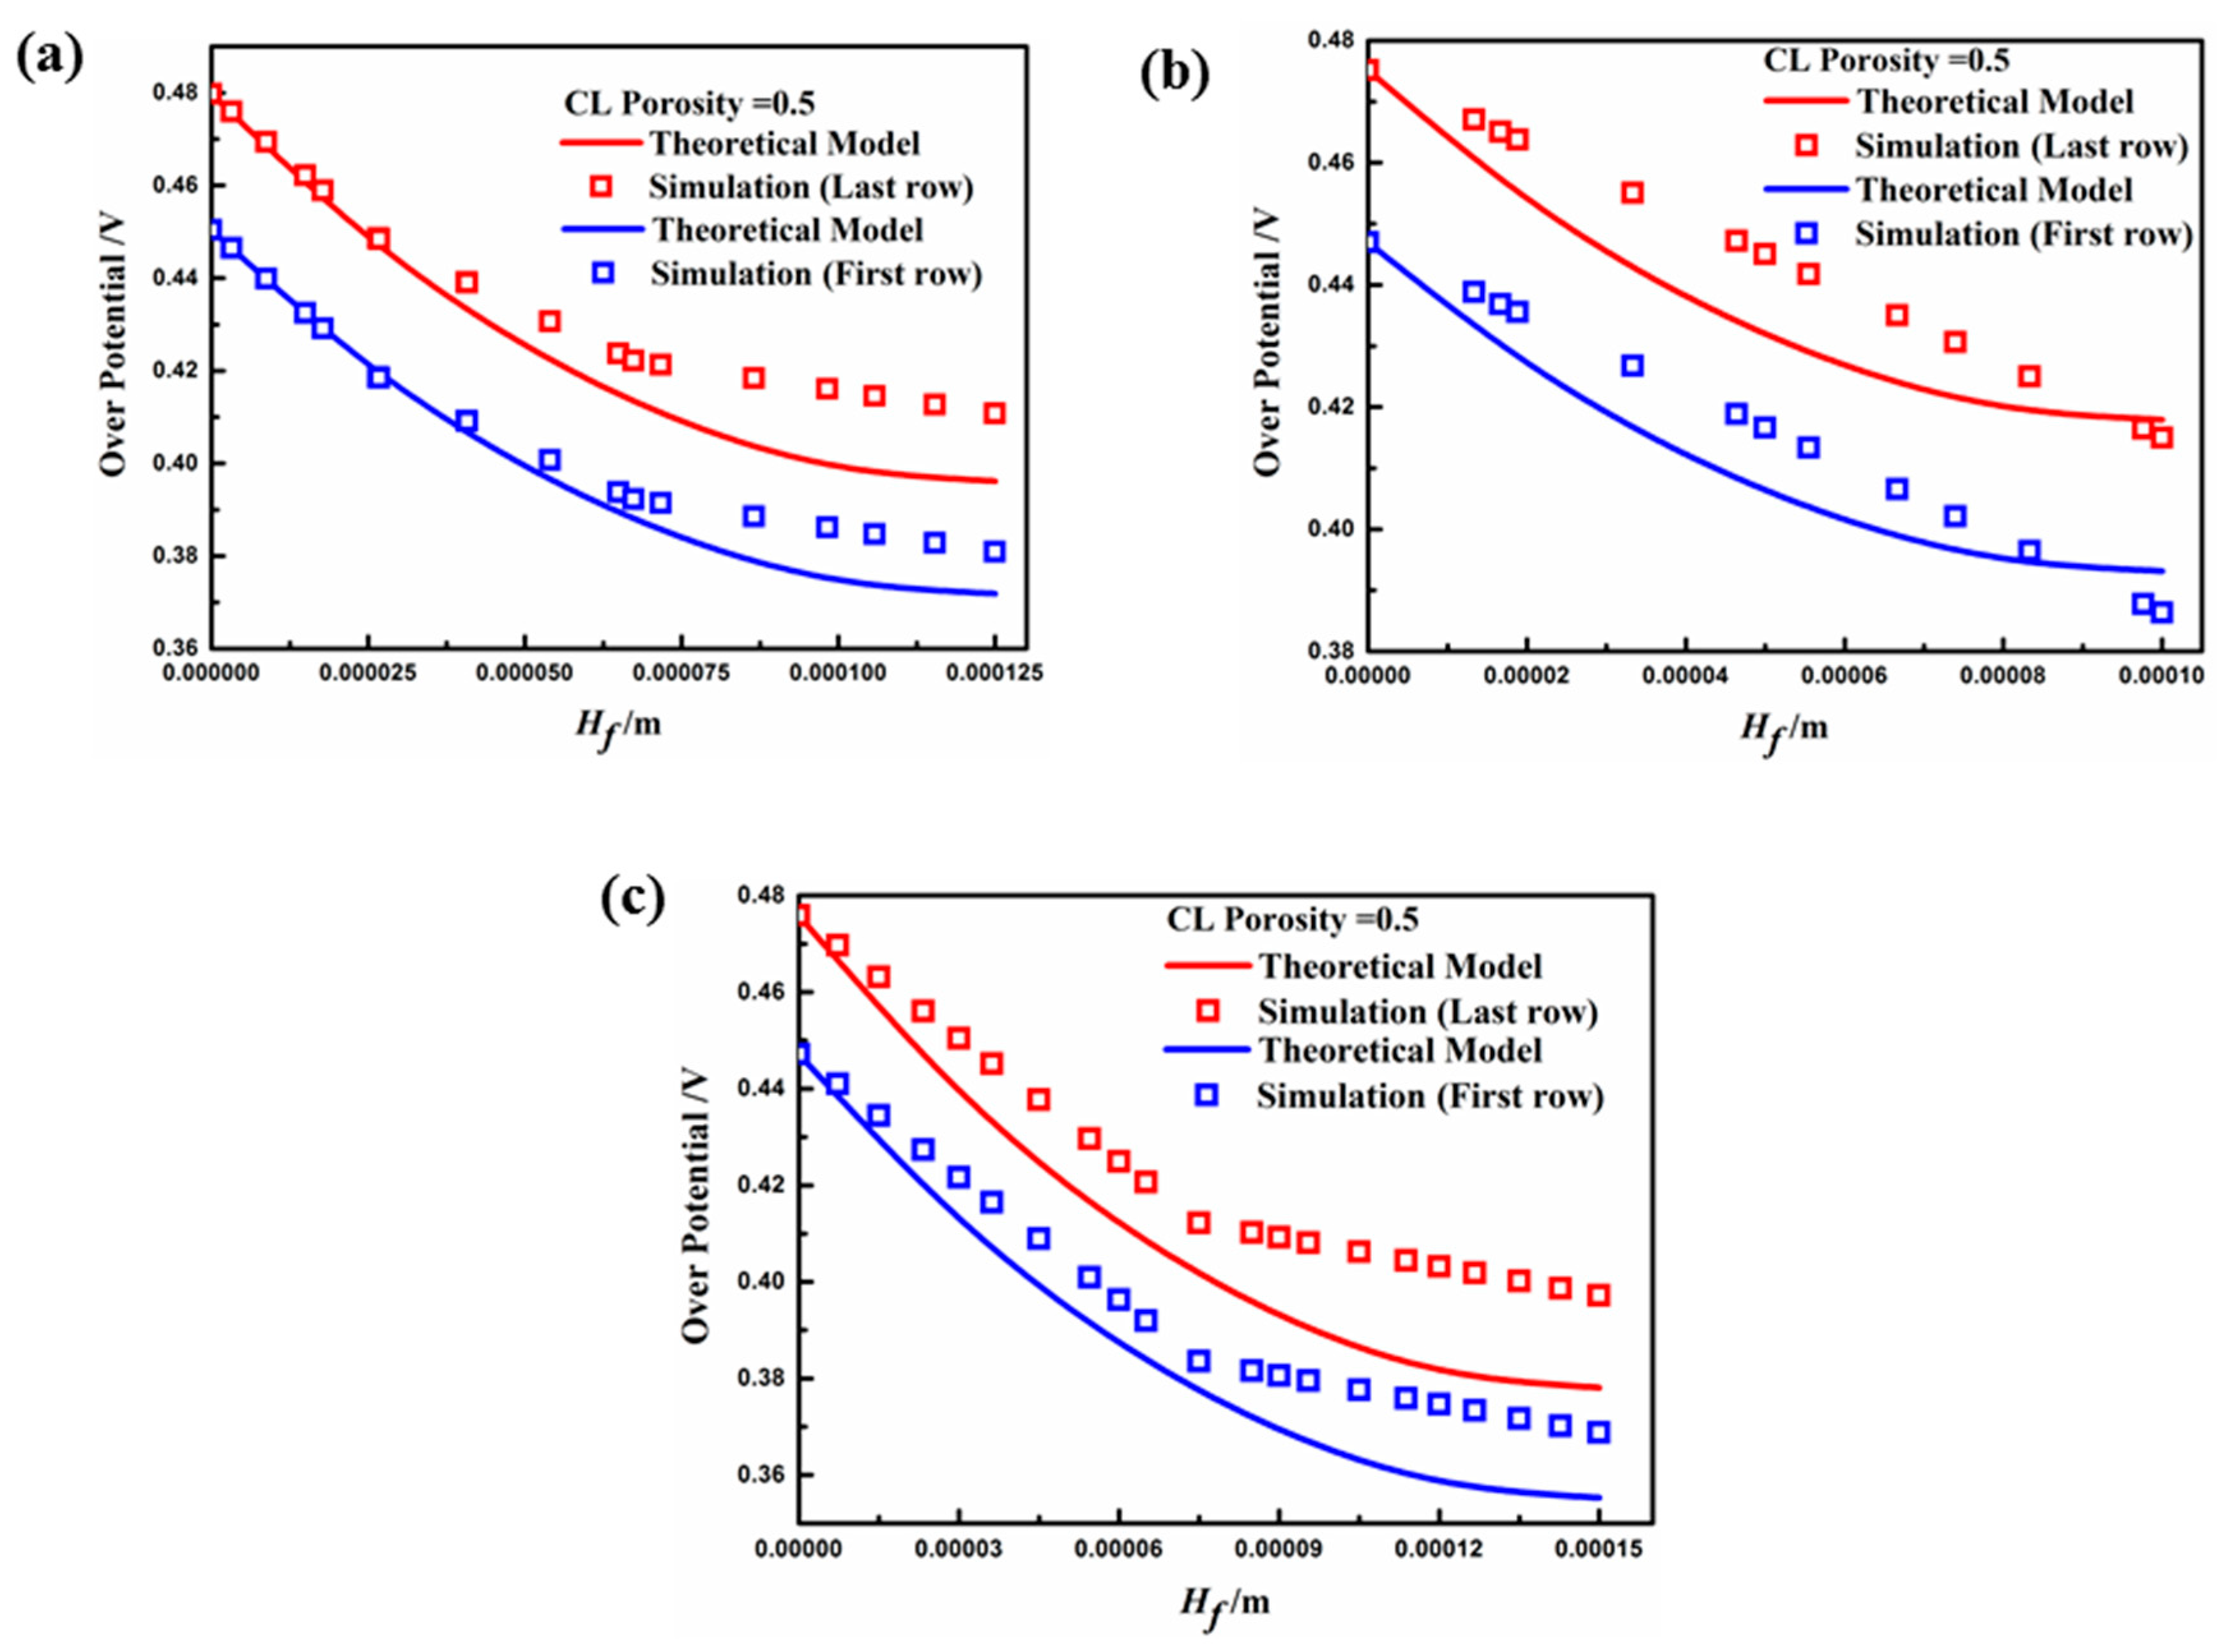
Figure 11 presents the distribution of overpotential in the
y-direction of the fin when the porosity of the porous electrode was 0.5. The results show that the overpotential distribution of the simulation results in both the first and last rows of the fin coincides with the theoretical model. However, the electrochemical reaction is slightly enhanced due to the increase in the electrode porosity, which raises the reactant concentration at the contact area on the electrode fin. Thus, the electrode fin in Case C had the best performance when the operating voltage was higher than 0.4 V, due to an especially marked decrease in the average overpotential, which is consistent with previous analyses. It should be noted that, through theoretical model calculations, the effect mechanism of electrode surface overpotential on the performance of fin sizes can effectively explain the kinetic characteristics for different aspect ratios. Furthermore, the fin structure of porous electrodes can be optimized using a suitable model for different PEMFCs in future research.


