Article

Physicochemical Properties of Hematite Nanoparticles Obtained via Thermogravimetric Conversion of Biosynthesized Nanomaghemite

by
Juan A. Ramos-Guivar
1,*,
Mercedes del Pilar Marcos-Carrillo
1,
Renzo Rueda-Vellasmin
1,
Erich V. Manrique-Castillo
1,
Noemi-Raquel Checca-Huaman
2,
Bruno L. D. Santos
3,
Waldemar A. A. Macedo
3,4 and
Edson C. Passamani
5
1
Grupo de Investigación de Nanotecnología Aplicada para Biorremediación Ambiental, Energía, Biomedicina y Agricultura (NANOTECH), Facultad de Ciencias Físicas, Universidad Nacional Mayor de San Marcos, Av. Venezuela Cdra 34 S/N, Ciudad Universitária, Lima 15081, Peru
2
Centro Brasileiro de Pesquisas Físicas (CBPF), R. Xavier Sigaud, 150, Urca 22290-180, RJ, Brazil
3
Centro de Desenvolvimento da Tecnologia Nuclear, CDTN, Belo Horizonte 31270-901, MG, Brazil
4
Programa de Pós-Graduação em Ciências-Física de Materiais, Universidade Federal de Ouro Preto-UFOP, Ouro Preto 35402-136, MG, Brazil
5
Department of Physics, Federal University of Espírito Santo-UFES, Vitória 29075-910, ES, Brazil
*
Author to whom correspondence should be addressed.
Materials 2025, 18(20), 4677; https://doi.org/10.3390/ma18204677 (registering DOI)
Submission received: 16 September 2025 / Revised: 5 October 2025 / Accepted: 10 October 2025 / Published: 12 October 2025
(This article belongs to the Special Issue Synthesis and Characterization Techniques for Nanomaterials)

Abstract

Hematite nanoparticles ( α Fe 2 O 3   NPs ) were synthesized through a thermal conversion of synthetic and biosynthesized nanomaghemite ( γ Fe 2 O 3   NPs ) precursors. X-ray diffraction data confirmed phase-pure hematite with crystallite sizes of 54 and 56 nm for the H1 and H2 samples, respectively. Transmission electron microscopy (TEM) revealed a bimodal-like distribution feature (peaks at 18.5 and 35.5 nm) for the H1 sample, while the histogram plot of the H2 sample displayed a homogeneous particle size distribution with a mean size of 28 nm. X-ray photoelectron spectroscopy confirmed Fe3+ ions as the dominant oxidation state in both samples. In addition, while 57Mössbauer spectroscopy indicated relaxation effects and line broadening for the H1 sample at both 300 K and 16 K, consistent with incomplete γ α transformation, the H2 sample exhibited spectra at the same temperatures resembling a bulk-like hematite. Magnetometry supported these findings since the H1 sample showed enhanced coercivity (2.2 kOe) and remanence (0.23 emu/g), features attributed to a residual ferrimagnetic contribution of γ Fe 2 O 3   NPs , and the H2 sample exhibited weaker ferromagnetism, as typically found in nanoscale hematite. These results highlight the synergistic use of X-ray photoelectron and Mössbauer spectroscopies, and magnetic measurements to reveal subtle multiphase coexistence, demonstrating that precursor chemistry and biosynthetic functionalization decisively govern the structural and magnetic evolution of γ α Fe 2 O 3   NPs .

1. Introduction

Iron oxides are among the most studied metal oxides due to their abundant availability, low toxicity, and versatile physicochemical properties [1,2]. Among these, hematite (α-Fe2O3) is the most thermodynamically stable phase under ambient conditions and exhibits unique structural, electronic, and magnetic characteristics that make it attractive for a broad range of applications [3]. α-Fe2O3 crystallizes in the rhombohedral corundum structure (space group R-3c), where Fe3+ cations occupy two-thirds of the octahedral sites within a hexagonal close-packed array of oxygen anions [4]. This arrangement confers high chemical stability and a moderate bandgap energy of ~2.1 eV, making it suitable for photoelectrochemical water splitting [5], photocatalysis [6], lithium-ion batteries, and environmental remediation [7], among other applications.
When the particle size is reduced to the nanometric scale (< 100 nm), α-Fe2O3 exhibits remarkable size-dependent properties. Nanohematite ( α Fe 2 O 3   NPs ) shows a substantial increase in surface area, modified electronic structure, and changes in magnetic behavior due to finite-size effects and spin disorder at the particle surface [8]. While bulk α-Fe2O3 is antiferromagnetic below the Morin transition temperature (~260 K) [9] and weakly ferromagnetic above this point due to spin canting, α Fe 2 O 3   NPs often displays superparamagnetic or weak ferromagnetic characteristics at room temperature (RT) [10]. These size-dependent features broaden the potential applications of nanohematite [2,10,11]. In other words, the increased surface area and modified electronic structure enhance its catalytic activity [10], while the tunable magnetic behavior underpins its use in targeted drug delivery [2] and magnetic hyperthermia [11]. In addition, it should be mentioned that such applications are particularly effective when the particles are uniform and highly dispersed.
Various synthetic strategies have been employed to produce α Fe 2 O 3   NPs , including sol–gel processing, hydrothermal and solvothermal methods, precipitation, and thermal decomposition [12,13,14,15]. Recently, biosynthetic approaches have attracted considerable attention as sustainable and environmentally benign alternatives. Such methods exploit plant extracts, microorganisms, or biopolymers as reducing and stabilizing agents, minimizing the use of hazardous chemicals [16]. However, obtaining phase-pure α Fe 2 O 3   NPs , with controlled size, morphology, and magnetic properties, remains a challenging. Frequently, the initial product consists of intermediate iron-oxide phases, such as maghemite (γ-Fe2O3) or magnetite (Fe3O4), which must be transformed into α-Fe2O3 through thermal treatments at temperatures above 873 K [4].
Thermogravimetric analysis (TGA) is widely used to monitor the γ α transformation [17], as it provides insights into the weight loss associated with dehydration, oxidation, and crystallization steps during the heating process of samples. The conversion of biosynthesized nanomaghemite to nanohematite ( γ α Fe 2 O 3   NPs ), via controlled thermal treatments, is of particular interest, as it allows phase engineering while preserving nanometric features. Nonetheless, key challenges remain, including particle growth during calcination, aggregation, and the precise control of magnetic properties through size and morphology regulation.
In a previous work [18], Marcos-Carrillo et al. developed an eco-friendly synthesis route for iron-oxide nanoparticles (IONPs) using Chenopodium quinoa extract as a reducing and stabilizing agent. By varying extract concentrations from 5 to 50% (w/v), they obtained nanoparticles with mean crystallite sizes of ~7–8 nm, where the phase composition shifted from mixed γ-Fe2O3–goethite to predominantly γ-Fe2O3 at higher loadings. Thermogravimetric analysis confirmed increasing organic content with extract concentration, while FTIR spectra evidenced surface functionalization with carboxyl and amide groups originating from flavonoids and proteins in the extract. The particles exhibited hard ferrimagnetic behavior, with saturation magnetizations of ~42 emu/g and ~11 emu/g depending on extract content. Zeta potential measurements showed stable dispersions above neutral pH, with the point of zero charge decreasing from ~6.3 to ~3.8 as the extract concentration increased, reflecting enhanced surface hydroxylation. Thus, these observed structural, magnetic, and colloidal properties underline the potential of quinoa-derived IONPs for environmental applications, particularly in remediation processes requiring magnetic recovery and surface-mediated interactions.
In this work, we report the synthesis of α Fe 2 O 3   NPs from biosynthesized γ-Fe2O3 precursors, followed by a thermal transformation under controlled conditions, using thermogravimetric equipment. The structural and magnetic properties of the resulting α Fe 2 O 3   NPs were systematically characterized to elucidate the impact of thermal treatment parameters on phase purity, crystallite size, and magnetic behavior. This study provides valuable insights into the optimization of sustainable routes for producing nanohematite with tailored properties for advanced applications in catalysis, energy conversion, and magnetic-based technologies.

2. Materials and Methods

2.1. α-Fe2O3 Preparation Using the Shimadzu Thermogravimetry Equipment

The γ α Fe 2 O 3 transformation was conducted through a controlled calcination process using a thermogravimetric analyzer (Shimadzu TGA-50, Shimadzu, Kyoto, Japan). Prior to this, preliminary TGA was performed to evaluate the thermal stability and decomposition profile of the samples, guiding the selection of the final calcination temperature, see Scheme 1. An amount of 16 mg of γ-Fe2O3 was placed in the alumina sample-holder and subjected to heating in a synthetic air atmosphere, starting from 300 K and increasing at a rate of 10 °C/min until reaching a maximum temperature of 1173 K. This procedure was repeated as many times as necessary to obtain a sufficient amount of material for comprehensive characterization and confirmation of the α-phase through complementary techniques. This maximum temperature was selected as indicated in the literature, which reports that the thermal transition from γ-Fe2O3 to α-Fe2O3 typically begins above 873 K and becomes predominant around 1073–1173 K [4,19]. Two types of α-Fe2O3 samples were processed. The first (H1) consisted of calcined 13.8 nm γ-Fe2O3 NPs (control sample). The second sample (H2) consisted of 7.0 nm γ-Fe2O3 NPs, previously functionalized with quinoa organic elements (QE10 sample) [18], aiming to investigate how the organic covering layer (shell) influences the thermal stability behavior and phase transformation pathway.
For the H1 sample, the total initial mass was 104.63 mg, and the final mass after calcination was 101.50 mg, corresponding to an average mass loss of approximately 2.75%.
In contrast, the H2 sample had an initial mass of 94.21 mg and a final mass of 68.45 mg, reflecting a significantly higher mass loss of about 27%, suggesting a high weight loss related to the quinoa organic covering layer.

2.2. Characterization

Structural properties of the iron-oxide nanopowder samples were analyzed using a RIGAKU Ultima IV diffractometer (Rigaku, Tokyo, Japan), equipped with conventional CuKα radiation (λ = 1.5418 Å), and operated in Bragg–Brentano geometry. The X-ray diffraction (XRD) measurements were carried out over a 2θ range of 20° to 80°, with a step size of 0.02° and a counting time of 2 s per step. These experimental conditions were applied to both H1 and H2 samples.
The morphological characteristics of the samples were acquired using a JEOL 2100F transmission electron microscope (JEOL, Tokyo, Japan), operating at 200 kV in transmission (TEM) mode. TEM samples were prepared by dispersing the solid powder in an organic solvent. Approximately 20 mg of the material was placed in a 1.5 mL Eppendorf tube and suspended in 1 mL of acetone. The suspension was sonicated in an ultrasonic bath for 5 min to break up agglomerates and obtain a stable NP`s dispersion. After sonication, 5 µL of the supernatant was carefully withdrawn using a micropipette and deposited onto a TEM grid (Lacey carbon film, 300 mesh copper support, grid hole size ~63 µm, Ted Pella, Inc., Redding, CA, USA). The grids were then dried under ambient conditions prior to imaging. The particle size distribution (PSD) histograms were determined by counting between 800 and 1000 particles from 30 to 35 photographs utilizing Image J software version 1.54g. The histograms were modeled using a log-normal distribution [20]. Polydispersity values were ascertained by calculating the standard deviation of the log-normal distribution.
Fourier Transform Infrared (FTIR) spectra were recorded using an Agilent Cary 630 spectrometer (Agilent Technologies, Santa Clara, CA, USA) equipped with an ATR module. The spectra were acquired in the 4000–650 cm−1 range, with a spectral resolution of 4 cm−1 and a total of 16 scans per sample, expressed in transmittance mode. Although ATR does not measure true transmission spectra, the data are presented in pseudo-transmittance coordinates (%T vs. wavenumber), as provided by the instrument software, in order to maintain consistency with previous studies and facilitate spectral comparison.
X-ray photoelectron spectroscopy (XPS) measurements were obtained in an ultra-high vacuum system (SPECS GmbH, Berlin, Germany) equipped with a PHOIBOS 150-MCD electron analyzer and an Al-Kα X-ray source (1486.7 eV, 15 kV, 300 W), using a pass energy of 50 eV and a step size of 0.5 eV for the wide spectra, and 20 eV/0.1 eV for the high-resolution XPS spectra. Charge compensation was obtained by using a flood gun (20 µA emission/2 eV energy). The high-resolution XPS spectra were fitted with Gaussian-Lorentzian mixed functions for Fe 2p, O 1s, and C 1s peaks. The Fe 2p doublets were fitted constraining the integrated area ratios of the two components to the expected values (2p3/2/2p1/2 = 2) [21]. The data processing and the fittings were performed using the CasaXPS software 2.3.26, and all XPS spectra were plotted using OriginPro software v.19. The residual standard deviation (STD) was kept below 1.5 over the background residual STD to ensure a good fit of experimental data.
The 57Fe Mössbauer spectra of the samples were acquired in transmission mode using a Lake Shore CCS-800-205 closed-cycle helium cryostat (Lake Shore Cryotronics, Westerville, OH, USA), allowing measurements at 300 K and 16 K. A 57Co(Rh) source (25 mCi) maintained at 300 K was employed, while the absorbers were measured either at room temperature or under cryogenic conditions. The Doppler velocity (Doppler shifting) was generated by moving the 57Co(Rh) source in a sinusoidal mode in ten of mm/s range (512 channels, unfolded). The calibration of the velocity scale (energy scale) was performed with an α-Fe reference foil (12.7 μm thick) at 300 K. The absorbers (powdered samples) were mounted in nylon sample holders with effective thicknesses corresponding to ~0.1 mg of 57Fe per cm2. To minimize external disturbances, both the spectrometer and the sample holder were mounted on an anti-vibration platform.
Magnetization versus field, M(H), measurements were carried out in a Physical Property Measurement System (PPMS, Evercool II, Quantum Design Inc., San Diego, CA, USA) equipped with the Vibrating Sample Magnetometer (VSM) option. The experiments were conducted under applied magnetic fields up to ±50 kOe, with data collected at both room temperature (300 K) and low temperature (5 K).

3. Results and Discussions

3.1. TGA and α-Fe2O3 Crystallization

TGA and derivative thermogravimetric (DTG) analyses of the M (H1 at the end) and QE10 (H2 at the end) samples reveal distinct thermal decomposition behaviors, as seen in Figure 1a–d. For the M control, three regions are identified: Region-I (300–450 K), a minor mass loss (~1.55%) is associated with the release of volatile species intrinsic to γ-Fe2O3; Region-II (450–700 K), a smaller loss (~1.25%) corresponds to the removal of more thermally resistant molecules; Region-III (700–1173 K), a slight mass gain is observed, attributed to oxygen incorporation during the γ-Fe2O3-to- α-Fe2O3 transformation [4]. The QE10 (H2) sample also exhibits three regions, but now with greater mass losses due to its organic functionalization with quinoa. Thus, the regions can be identified as: Region-I (300–400 K), the evaporation of liquids and volatile compounds results in a ~9.5% loss; Region-II (400–700 K), a pronounced loss (~15.8%) occurs, corresponding to the decomposition of organic groups; and Region-III (700–1173 K), a mass stabilization is observed, indicating the formation of α-Fe2O3 without additional oxygen uptake. More important, the mass gain observed for the resulting H1 sample is absent in the H2 sample, which could reflect the structural rearrangement and oxygen accommodation, characteristic of α-Fe2O3 crystallization [22,23].

3.2. X-Ray Diffraction and Rietveld Analysis

Figure 2a,b shows the refined X-ray diffractograms for the H1 and H2 samples. The main peaks assigned to the trigonal α-Fe2O3 phase were observed. No additional Bragg peaks, which could be related to spurious/secondary phases, were detected in both X-ray diffractograms. The mean crystallite sizes were found to be ca. 54 nm and 56 nm for the H1 and H2 samples, respectively. These values for the crystallites indicate that the final samples (H1 and H2) are still in nanometric scale, as also found for the precursor samples (before the heating). Table 1 shows the refined crystallographic parameters for both H1 and H2 samples.
The interplanar distances were calculated using the Equation (1), considering a trigonal crystal symmetry (hexagonal axes), and the results for characteristic Miller planes are summarized in Table 2.
1 d 2 = 4 3 h 2 + h k + k 2 a 2 + l 2 c 2

3.3. TEM Analysis

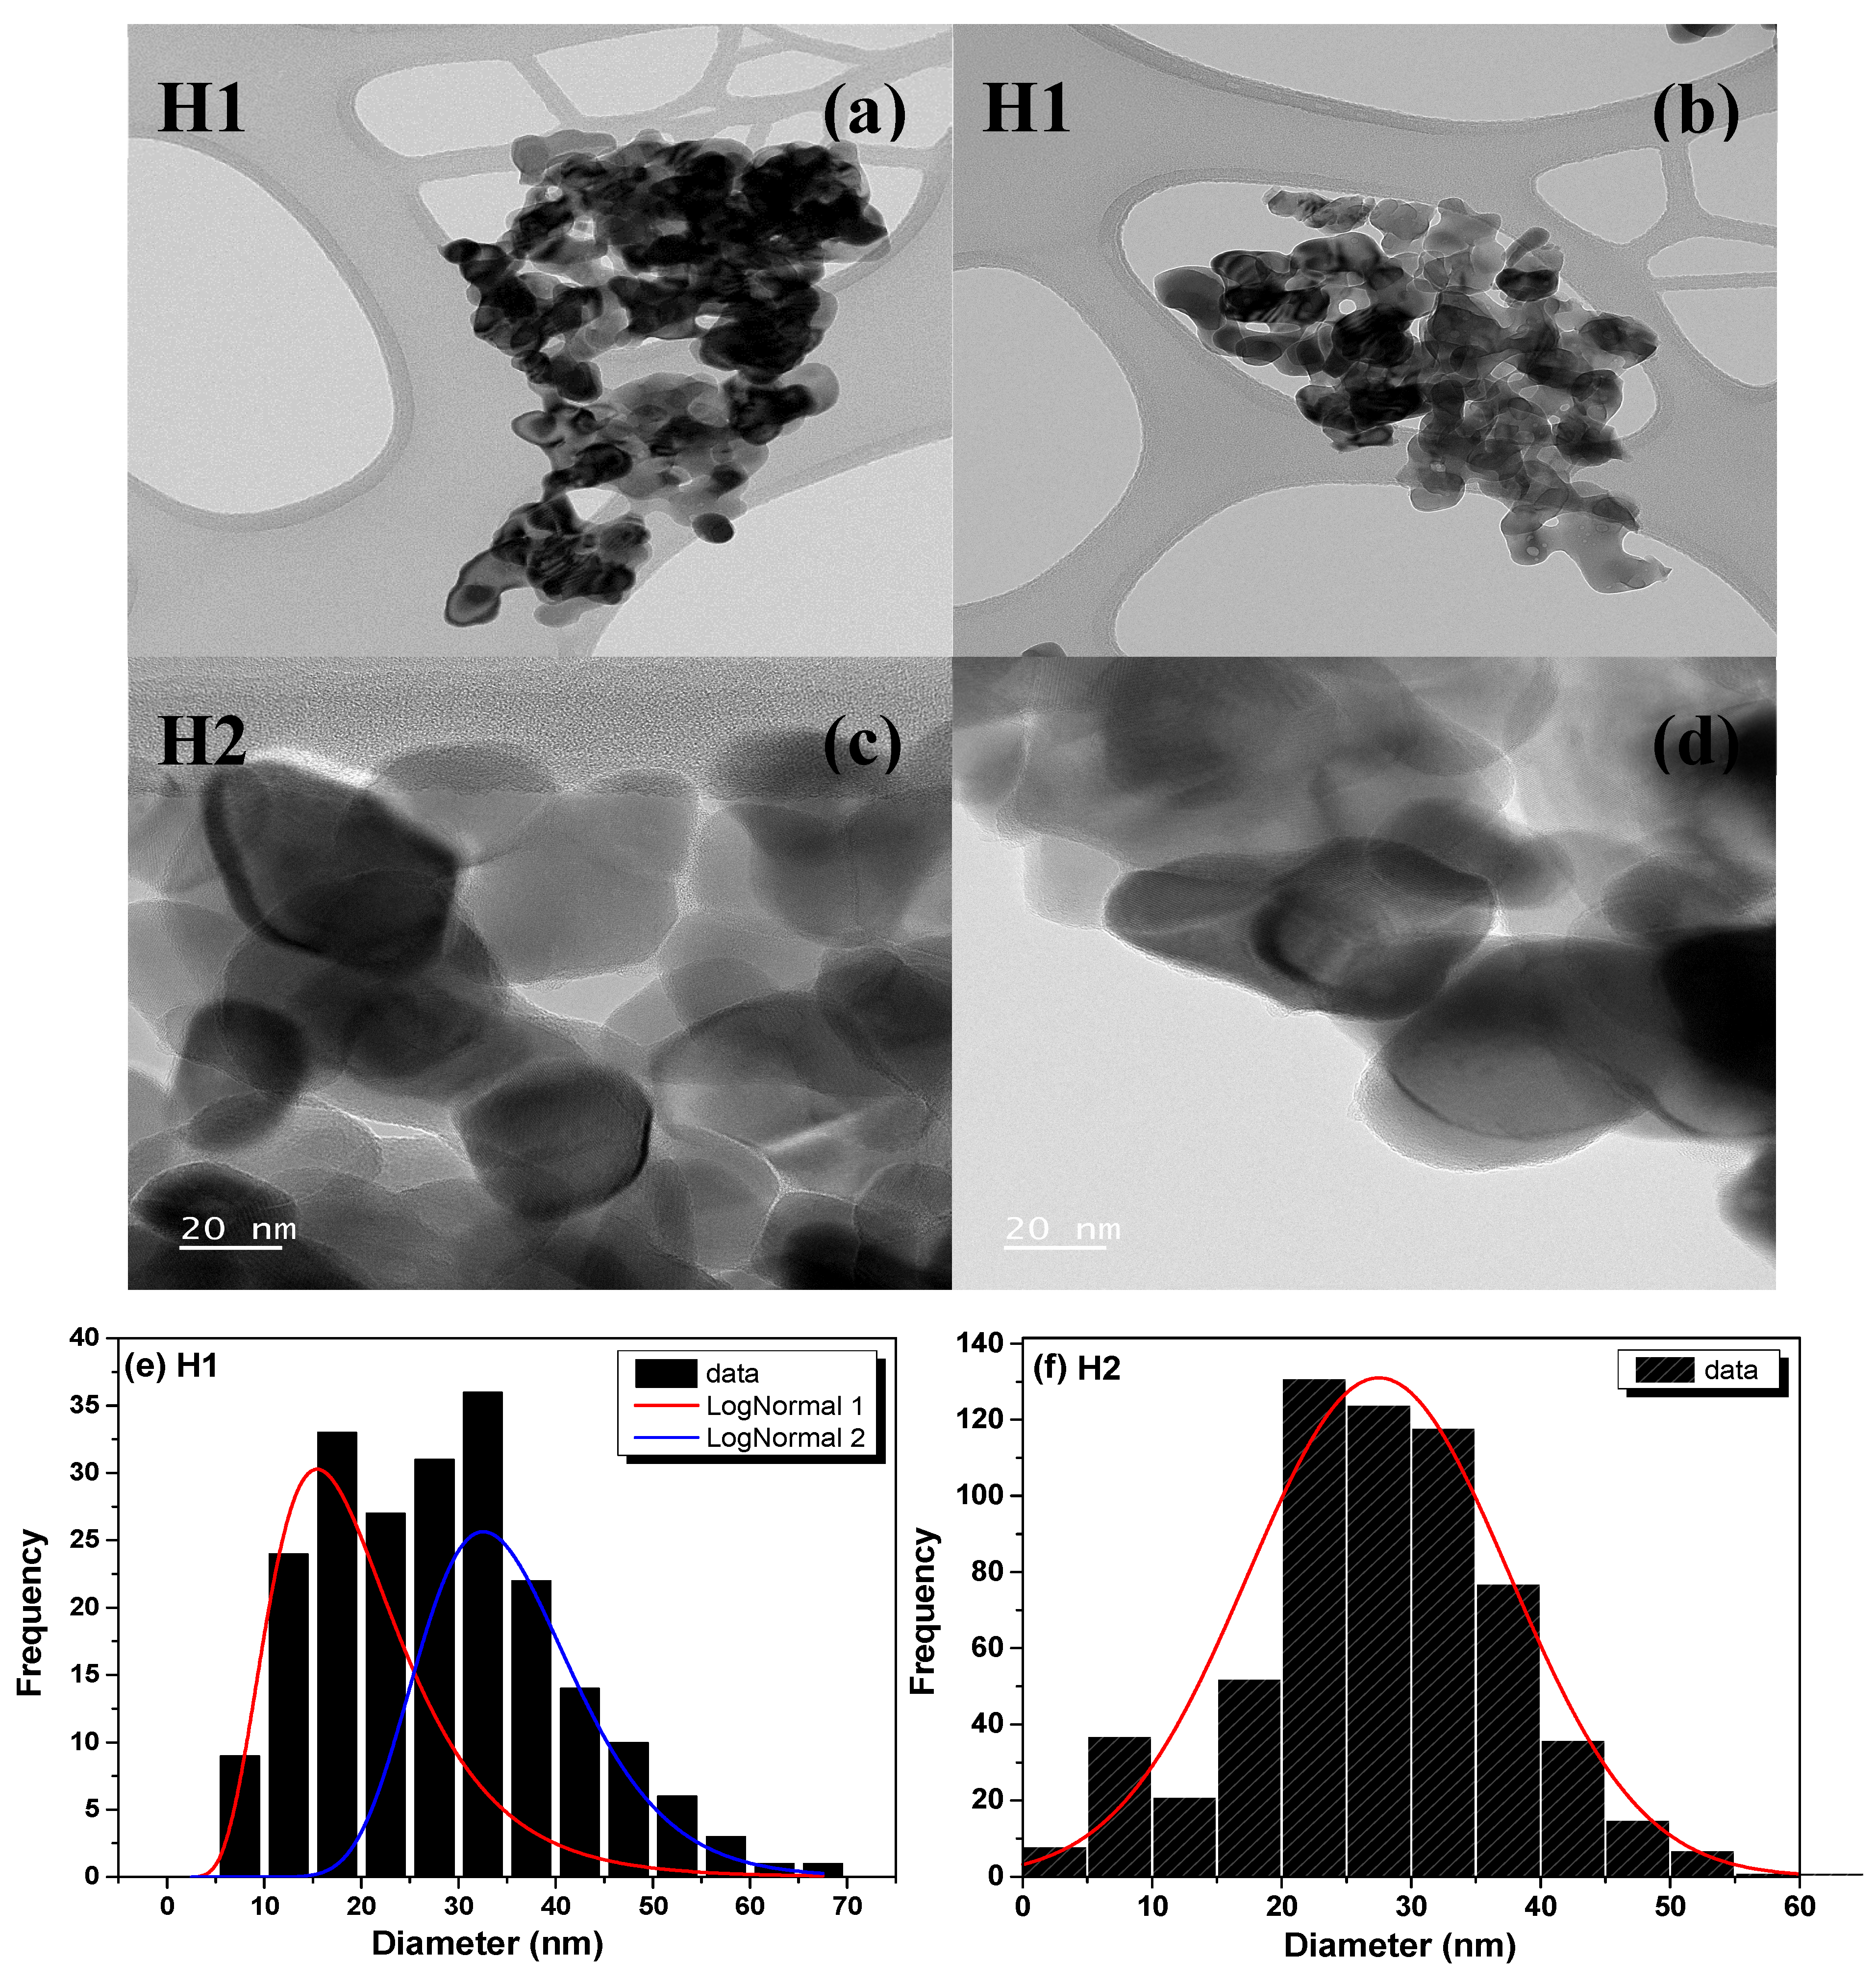
Figure 3a–d displays the representative images for the H1 and H2 samples. In Figure 3e, the PSD histogram reveals mean particle sizes of 18.5(1) nm and 34.5(1) nm for the H1 sample. Therefore, a bimodal distribution was observed for this sample, probably associated with residual γ-Fe2O3 NPs either coated by α-Fe2O3 NPs (core–shell feature) or in between α-Fe2O3 NPs (the apparent absence of the γ-Fe2O3 signal in the XRD can be explained considering their small sizes and quantity compared to the well-crystallized α-Fe2O3 NPs that have larger sizes). In contrast, a single distribution with an average size of 28(1) nm was found for the H2 sample, as illustrated in Figure 3f.
The crystallite sizes of the α-Fe2O3 NPs, estimated from X-ray diffraction using the Scherrer equation, were 54 nm for the H1 sample and 56 nm for the H2 sample. These values are consistently larger than the particle sizes obtained from TEM analysis, which yielded mean diameters of 18.5 nm and 34.5 nm for H1 (showing a bimodal distribution), and 28 nm for H2. This discrepancy is frequently reported in the literature and arises because X-ray diffraction and TEM probe different physical quantities. X-ray diffraction, through the Scherrer equation, provides the mean size of coherent diffracting domains, while TEM directly images the external morphology of individual NPs [24,25]. Consequently, X-ray diffraction can yield larger values when particles contain multiple crystallites or extended crystalline domains, whereas TEM reflects the particle size observed in a limited field of view.
For the H1 sample, the coexistence of two particle populations (18.5 and 34.5 nm) suggests heterogeneous growth. The smaller particles observed by TEM images may still be part of larger coherent domains detected by X-ray diffraction, explaining the higher Scherrer’s sizes. In contrast, for the H2 sample, the TEM mean value of 28 nm is closer to twice the value obtained from the X-ray experiment (56 nm), consistent with a narrower PSD and fewer subunits per crystallite. Similar differences between TEM and X-ray diffraction derived sizes have been reported for hematite and other oxides, where instrumental broadening corrections, strain effects, and the choice of Scherrer constant strongly influence the calculated values [24,26,27]. Additionally, the limited sampling in TEM experiments compared to the bulk-averaging nature of X-ray diffraction can further accentuate these discrepancies [25]. Overall, the combined TEM and X-ray analyses indicate that the α-Fe2O3 NPs are nanocrystalline, with coherent domains of 50–60 nm, but consisting of smaller morphological units, consistent with partial aggregation and polycrystalline organization.
The TEM findings (H1 bimodal, H2 unimodal) are central to explaining apparent divergent magnetic and Mössbauer behaviors in this ensemble of α-Fe2O3 NPs, as will be shown in the next sections. However, at this stage, we would like to point out that, for example, Tadić et al. [28] have shown that α-Fe2O3 NPs with dual-size populations generate mixed magnetic dynamics: smaller particles are dominated by spin relaxation and/or superparamagnetic behavior, while larger particles usually retain coercivity and are found in magnetically blocked state. Similarly, size-dependent structural defect studies (7–120 nm) has also shown that smaller α-Fe2O3 NPs retain higher γ-Fe2O3-like surface defects and lattice disorder [29], which produce residual ferrimagnetic signatures. In general, it can be said that these results are consistent with those found in our structural and morphological studies and will also be supported by Mössbauer and magnetic data to be discussed ahead.

3.4. ATR-FTIR Analysis

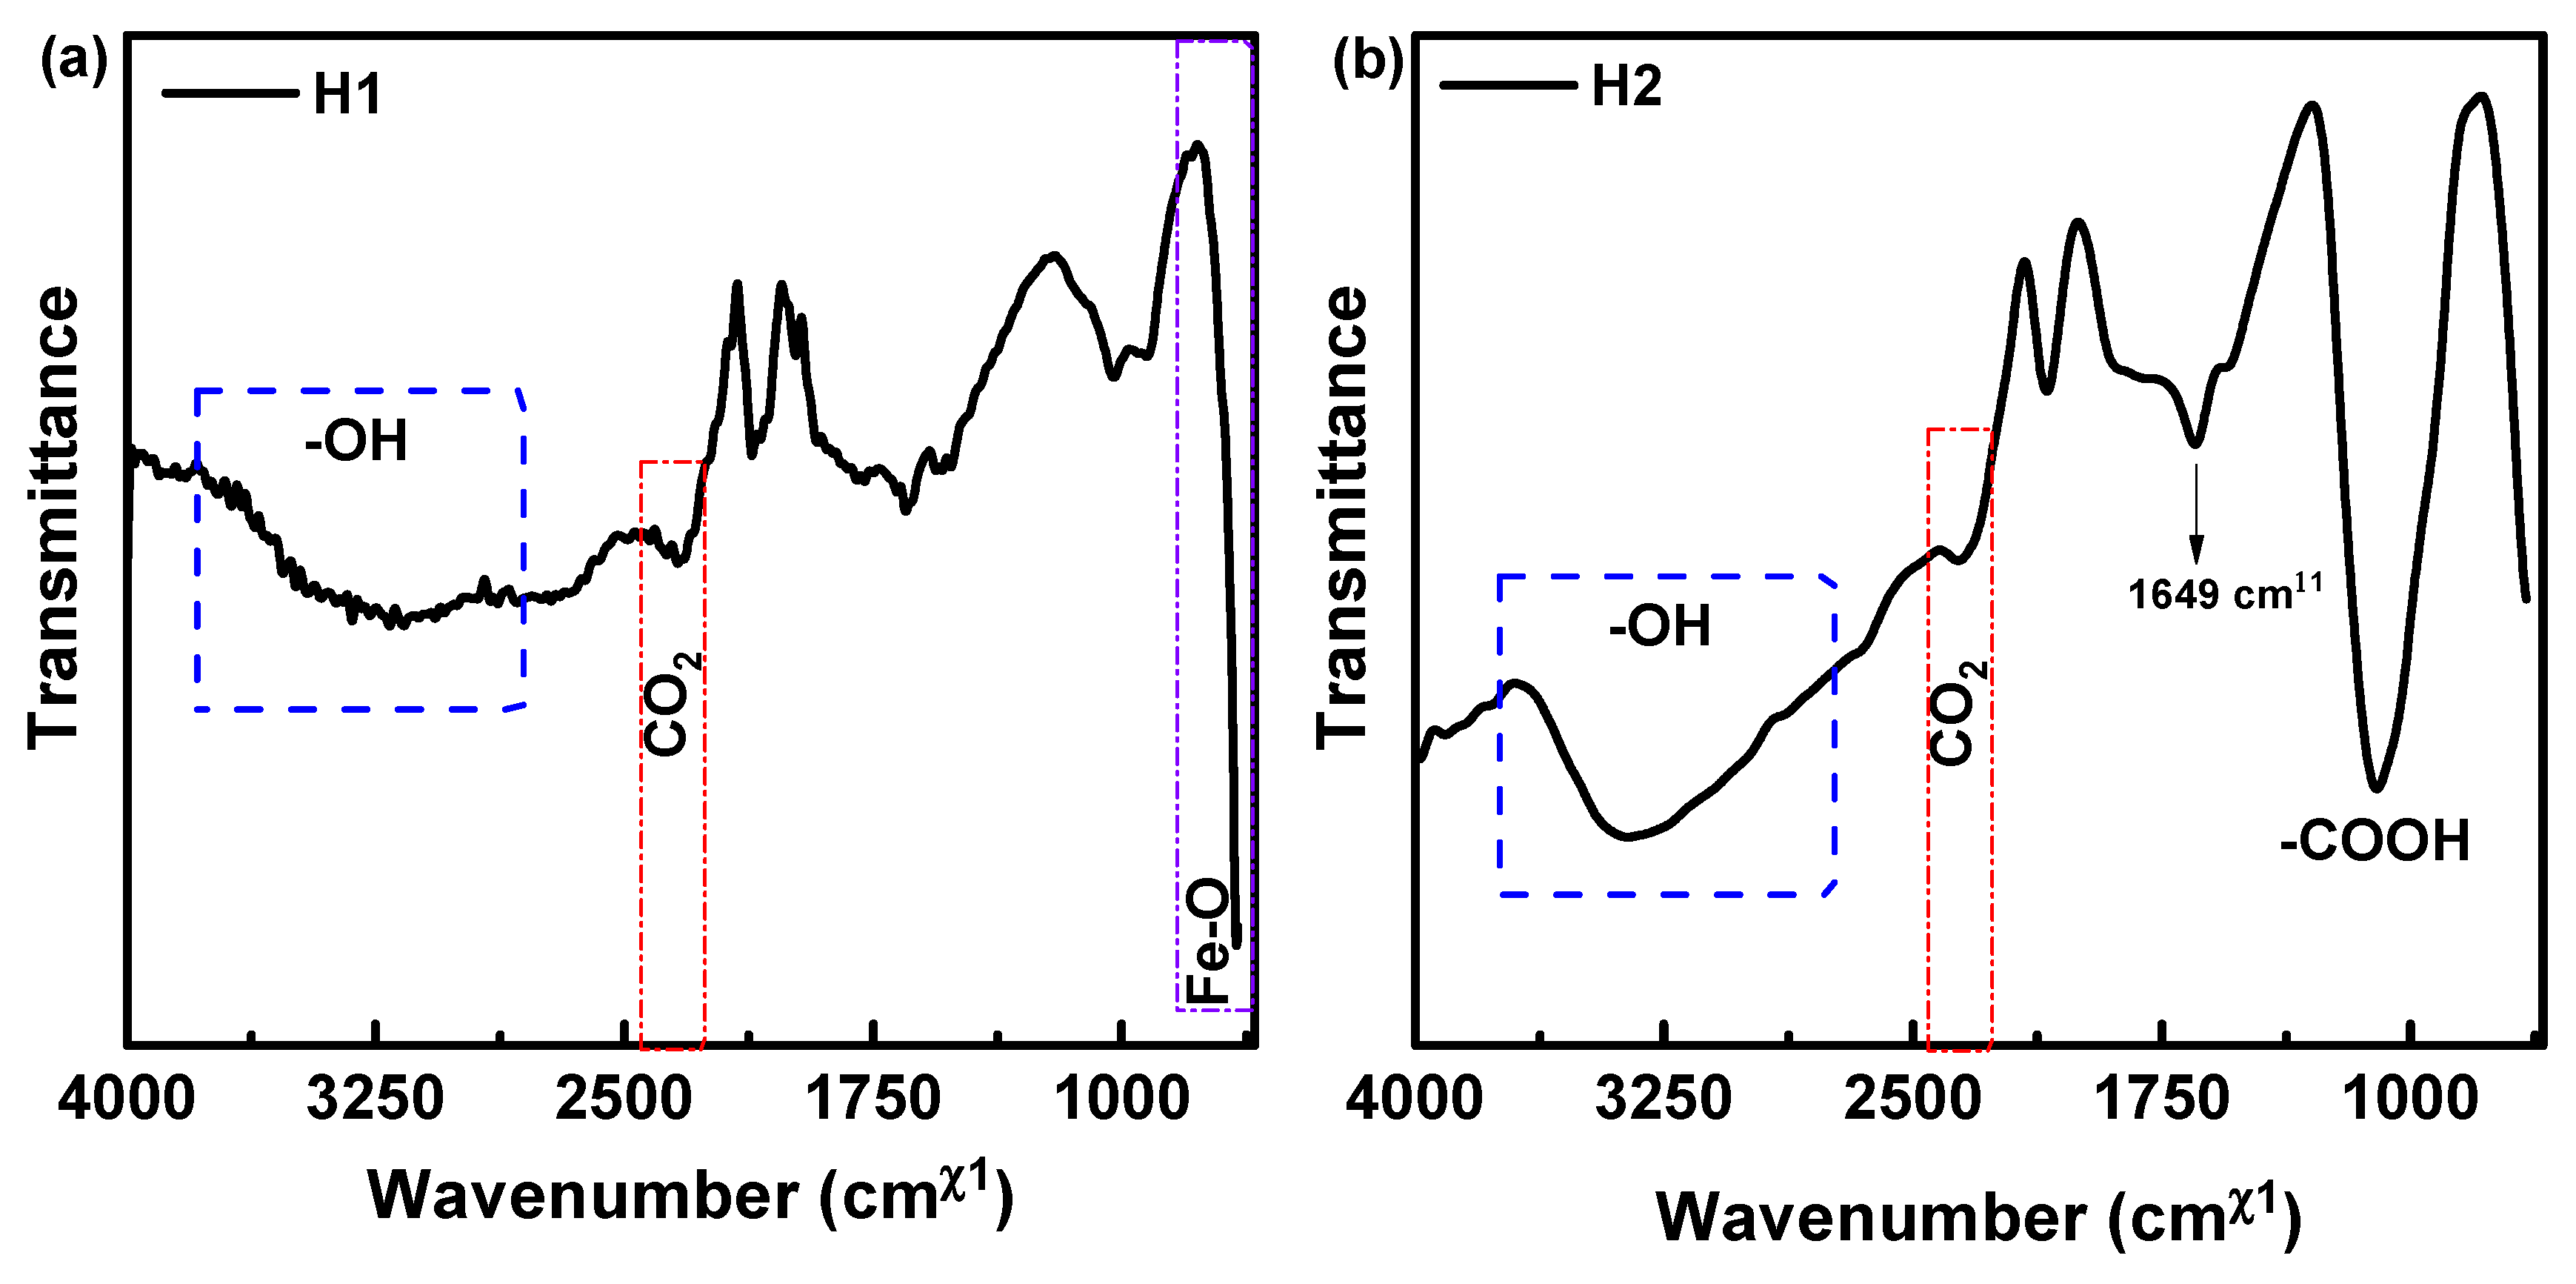
The system of iron-oxide NPs functionalized with quinoa extract was thermally treated to surpass the γ → α phase transition temperature (up 1173 K). At first glance, both spectra exhibit a similar overall profile, as depicted in Figure 4a,b. However, the most notable difference appears in Figure 4b around 1000 cm−1. A more detailed analysis reveals that the broad bands observed for both H1 (pure α-Fe2O3) and H2 (α-Fe2O3 functionalized with quinoa extract) at ~3300 cm−1 are associated with the -OH functional groups. Nevertheless, H2 displays narrower vibrational features, which result in an enhanced signal around ~2900 cm−1, likely attributable to phenolic compounds present in the quinoa extract [18,30]. The band near 2350 cm−1 corresponds to atmospheric CO2 [22].
For H1, the peak at 1650 cm−1 [31] may still be ascribed to the bending vibration of residual water molecules, whereas in the H2 ATR-FTIR spectrum, the Amide I group characteristic of quinoa proteins becomes more evident [32]. Finally, the most intense peak in H2, located at ~1000 cm−1, appears to originate from the contribution of C–N stretching vibrations [33] together with polymeric -COOH groups [18]. The results indicate that organic species from quinoa are still protecting the α-Fe2O3 NPs.

3.5. XPS Analysis

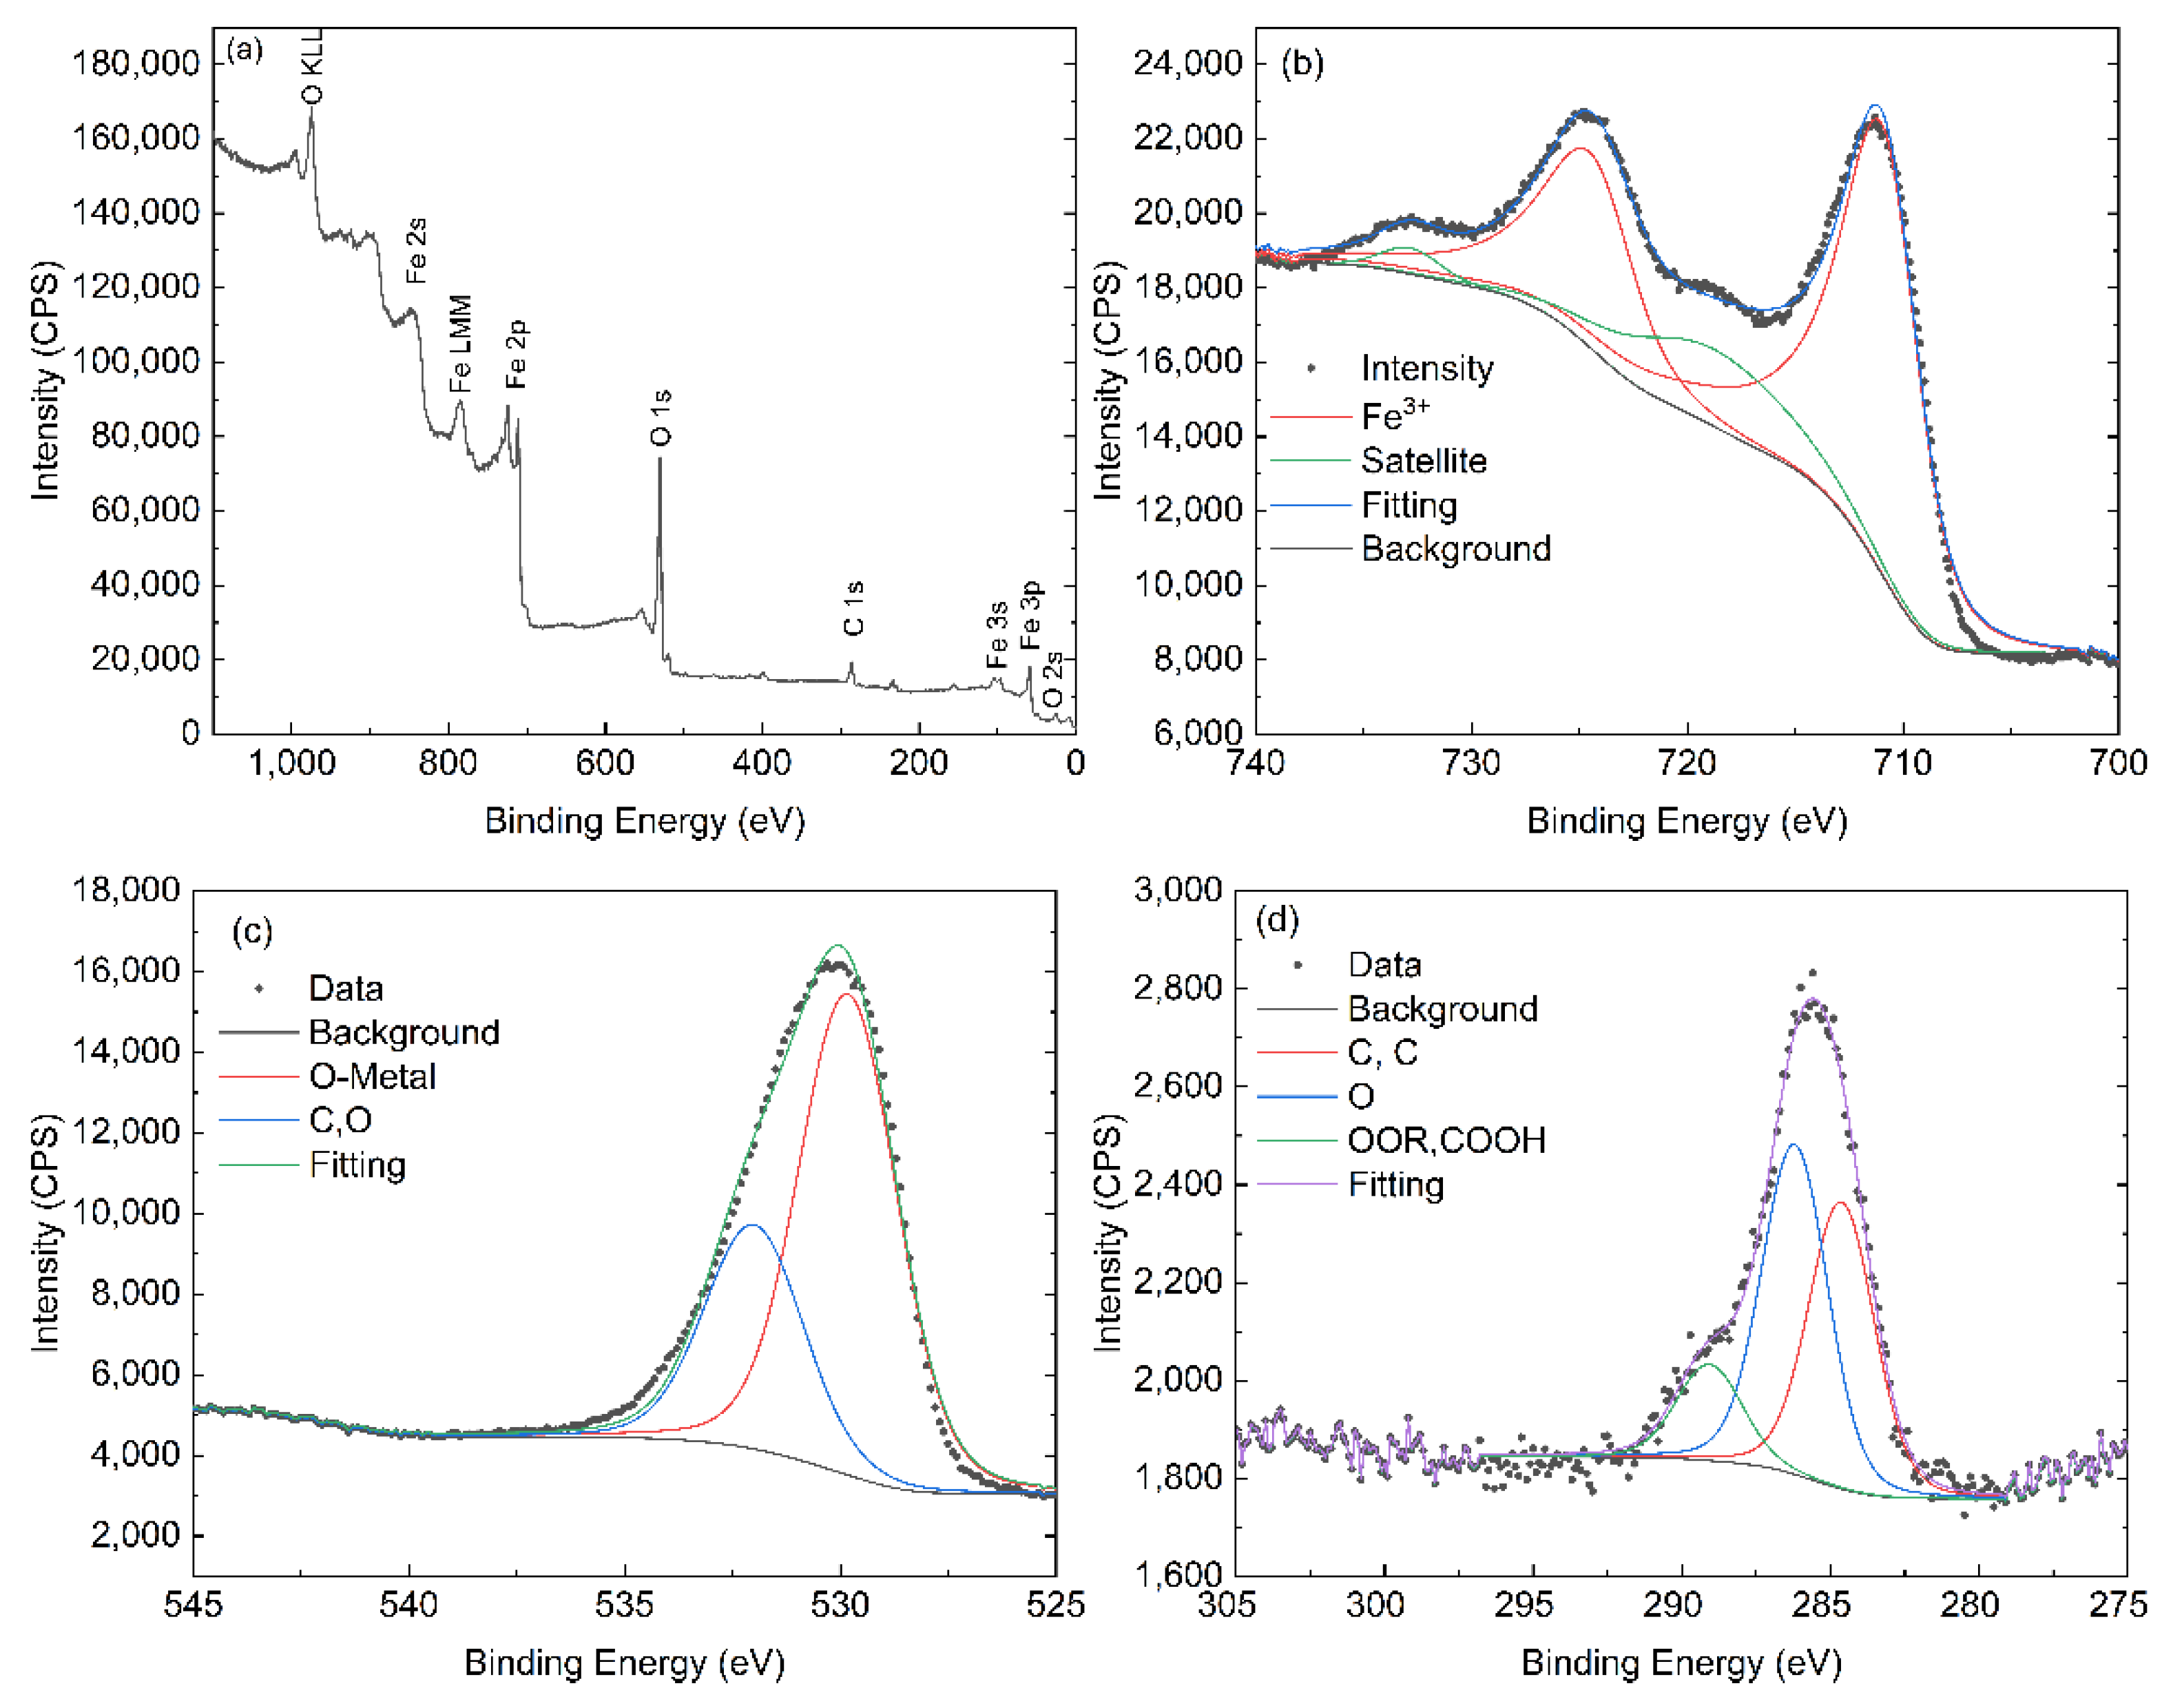
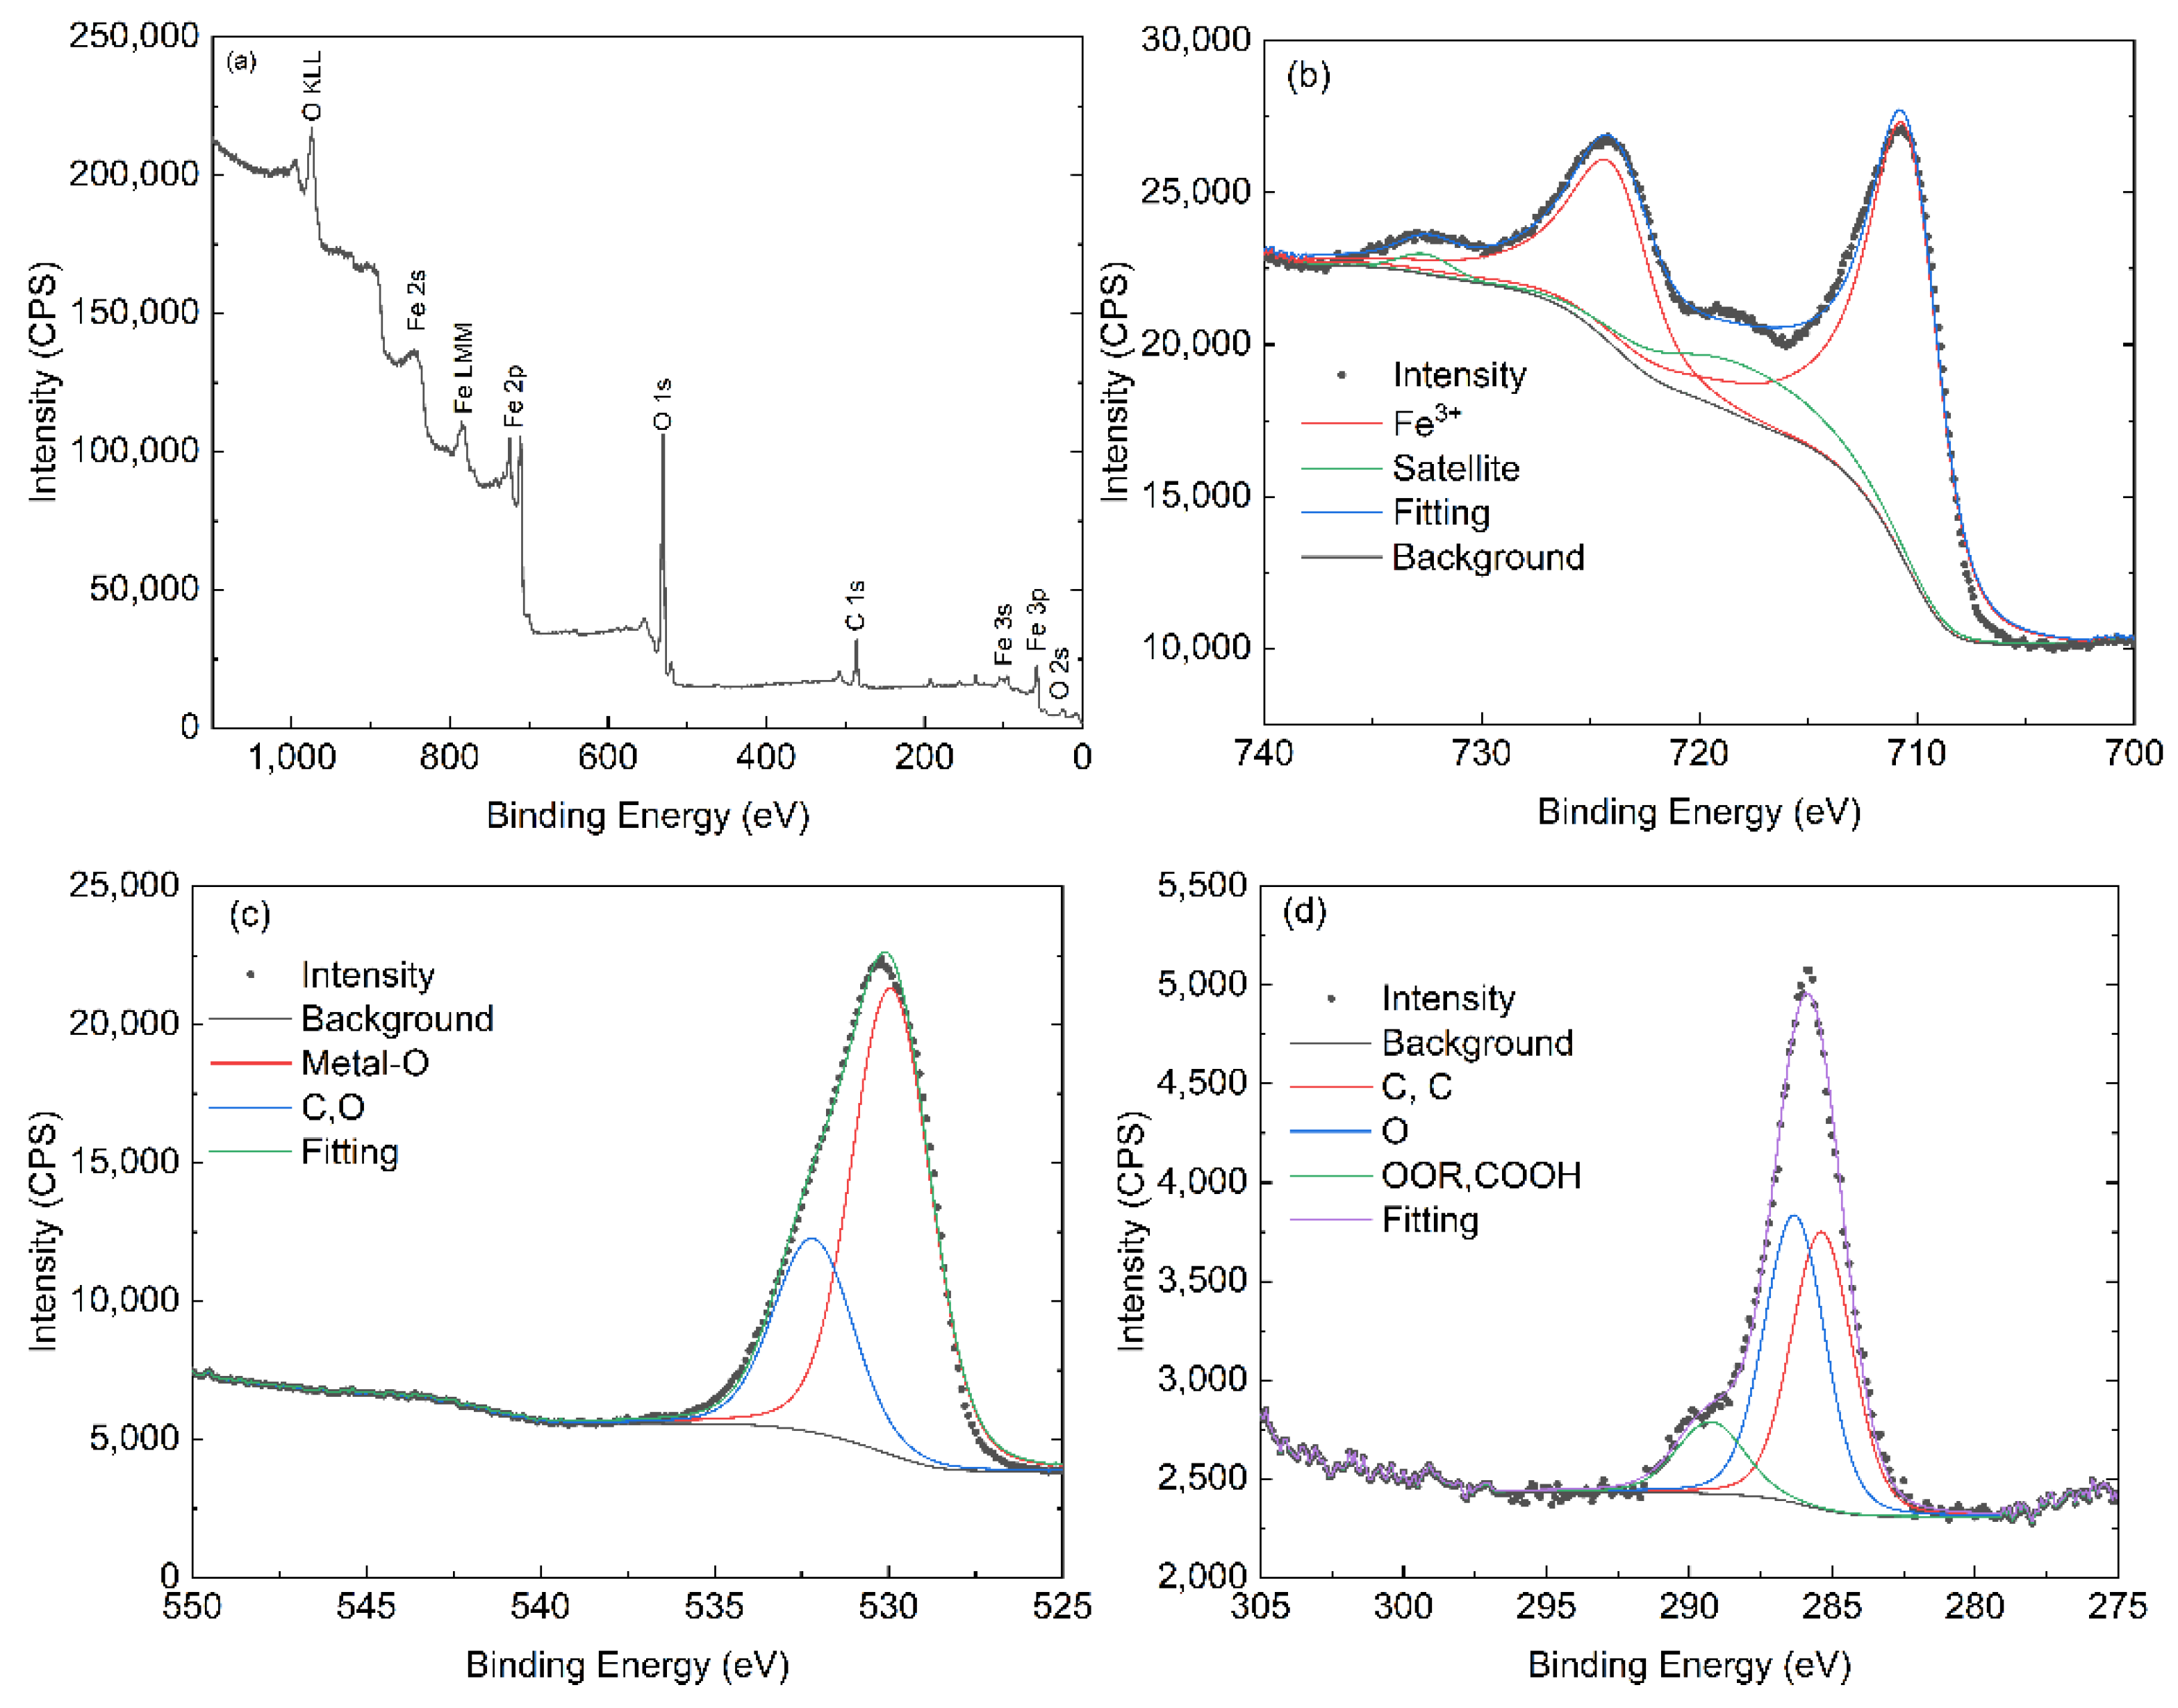
XPS is a widely employed technique to probe the electronic structure and oxidation states of iron-oxide NPs, providing surface-sensitive insights that complement bulk analyses such as X-ray diffraction analysis. For instance, it should be pointed out that for an α-Fe2O3 crystal, the Fe 2p spectrum is dominated by (i) the Fe3+ oxidation state, typically characterized by a doublet (an Fe 2p3/2 main peak in the range of 709.9–711.0 eV binding energy (B.E.), and an Fe 2p1/2 feature at ~724.2–724.4 eV) and (ii) a distinct satellite peak near 718.9 eV, both are considered a fingerprint of Fe3+ [34,35,36]. The O 1s core level generally consists of two contributions: lattice oxygen (Fe–O) at 529.2–530.0 eV, and surface hydroxyl/adsorbed species at 530.9–531.4 eV [37,38,39]. Reported studies have also highlighted that slight shifts in binding energies or satellite positions can arise from particle size effects, surface hydroxylation, or crystallinity variations [40,41,42]. The XPS spectra for both samples are shown in Figure 5 and Figure 6, respectively.
The Fe 2p region was analyzed for both samples (Figure 5b and Figure 6b). It corroborates the presence of only the Fe3+ state in both samples. The Fe 2p3/2 peak located at ~710 eV B.E. agrees with the reported value for α-Fe2O3 or mixed overlapped α-Fe2O3 plus γ-Fe2O3 NPs [43]. But this differs from bulk α-Fe2O3 reported at 711 eV [4]. In addition, the H1 sample exhibits the Fe 2p3/2 peak at 710.4 eV, accompanied by a satellite feature at 718.7 eV, and an O 1s signal centered at 529.8 eV. These values are in excellent agreement with reported Fe3+ states in α-Fe2O3, and indicate that the surface of the NPs is dominated by lattice oxygen. Thus, the relatively high binding energy for Fe 2p3/2 and the strong satellite feature suggest a well-defined Fe3+ environment, consistent with a stoichiometric α-Fe2O3 phase.
The H2 sample, in contrast, displays the Fe 2p3/2 peak at 710.0 eV, and the satellite at 717.7 eV, with the O 1s peak at 529.9 eV. While the main Fe3+ feature is still within the expected range for α-Fe2O3, the ~0.4 eV downshift in binding energy and the ~1.0 eV downshift of the satellite peak relative to H1 are notable. These variations may be linked to subtle differences in the local chemical environment, such as enhanced electronic screening, surface hydroxylation, or a higher density of structural defects. Similar shifts have been reported for α-Fe2O3 NPs with reduced crystallinity or altered particle size, reflecting modifications in final-state relaxation processes [40,43].
The O 1s region for both samples depicted the presence of O-metal B.E. at 529.9 eV, likely associated with α-Fe2O3 or residual γ-Fe2O3 NPs still present in the H1 sample. In addition, the green shadow area corresponds to the organic content related to the atmospheric air commonly present after oxygen exposition of the samples. This is supported by the C 1s region, where the total organic content was 19% for H1 and 29% for H2, respectively. This last observation indicates that the H2 sample is more susceptible to physiosorb molecules from the air. This increment in the residual organic content can also be related to quinoa residues adsorbed on the α-Fe2O3 surface.
The XPS results for both samples are summarized in Table 3, where the binding energies of Fe 2p and O 1s are compared with literature values for α-Fe2O3. As shown, H1 closely matches the classical XPS signature of α-Fe2O3, with an Fe-2p3/2 peak at 710.4 eV, a satellite at 718.7 eV, and lattice oxygen at 529.8 eV. In contrast, H2 exhibits a lower Fe 2p3/2 binding energy (710.0 eV) and a satellite shifted to 717.7 eV, deviating slightly from the typical ~718.9 eV reported for Fe3+. This systematic downshift suggests subtle modifications in the electronic structure, which may originate from particle size effects, surface defects, or variations in crystallinity. Nevertheless, the O 1s peaks for both samples remain consistent with lattice oxygen, confirming the dominance of Fe–O bonds at the surface. Specifically, for both H1 and H2 samples, the O 1s signal is dominated by the lattice oxygen component at ~529.8–529.9 eV, with no significant indication of higher-binding-energy hydroxyl contributions. This suggests that the nanoparticle surfaces are relatively clean, although a more detailed deconvolution could reveal minor contributions from hydroxyl groups.
Moreover, the XPS survey spectra further corroborate the Fe–O stoichiometry of the samples. For H1, the relative atomic percentages were Fe = 15.2% and O = 54.9%, which approaches the ideal Fe:O ratio of 2:3 expected for stoichiometric α-Fe2O3. In contrast, H2 exhibited similar Fe content (20.5%) and higher oxygen contribution (60.6%), indicating a relative enrichment of oxygen due to organic environment at the surface in agreement with TGA. This oxygen excess, together with the slight downshift of the Fe 2p3/2 binding energy (710.0 eV vs. 710.4 eV in H1) and its satellite feature (717.7 eV vs. 718.7 eV), suggests subtle electronic modifications likely associated with surface hydroxylation, lattice defects, or structural disorder. Such differences in Fe/O ratio have been reported to strongly affect the surface chemistry and catalytic activity of α-Fe2O3 NPs, since oxygen-rich surfaces can stabilize additional –OH groups and modify the Fe3+ coordination environment. Therefore, the combined evidence from both peak positions and elemental ratios confirms that while both H1 and H2 are α-Fe2O3, H1 represents a closer-to-stoichiometric surface, whereas H2 is characterized by a more oxygen-rich and defect-sensitive surface chemistry.
Overall, H1 aligns closely with classical α-Fe2O3 XPS signatures, whereas H2 exhibits binding energy shifts, which are an indicative of subtle differences in surface or electronic structure. Thus, the comparative analysis reinforces that while both H1 and H2 samples are unequivocally α-Fe2O3, H2 presents surface or structural differences that distinguish it from the more stoichiometric H1. These findings emphasize the sensitivity of XPS to nanoscale variations and highlight the importance of correlating spectroscopic data with complementary structural and magnetic characterizations.

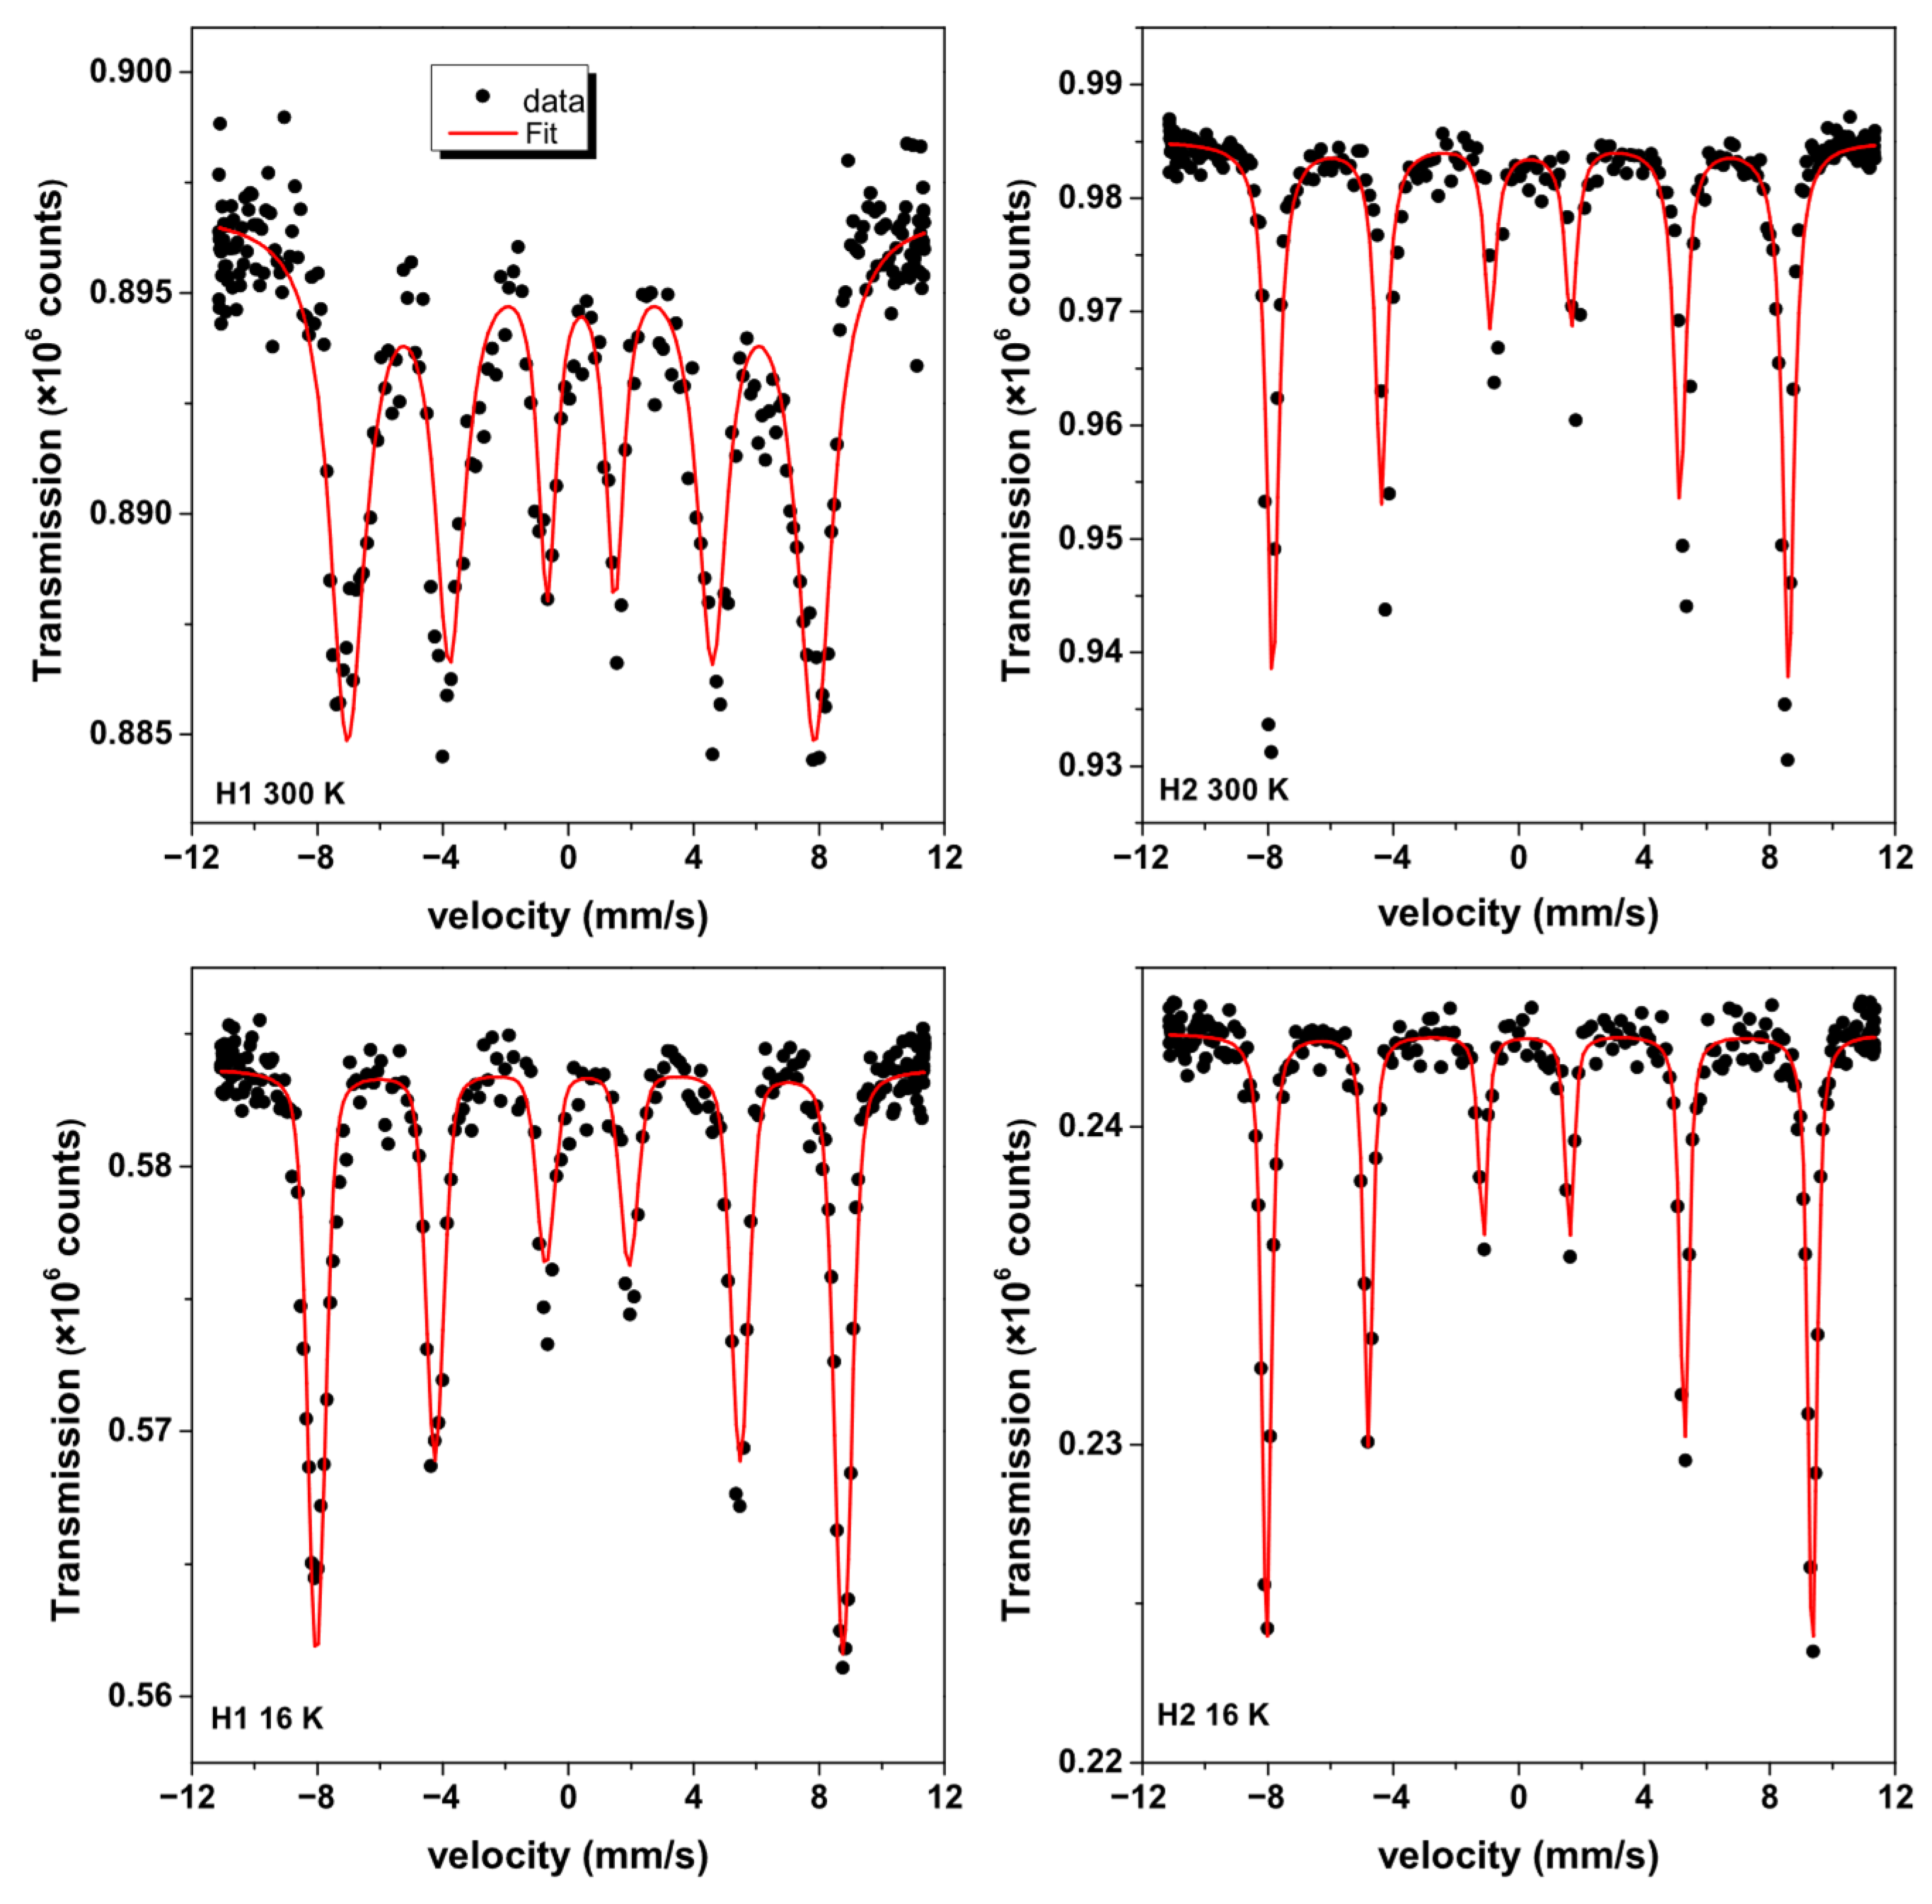
3.6. 57Fe Mössbauer Analysis of Nanohematites

Figure 7 depicts the 300 and 16 K 57Fe Mössbauer spectra for the H1 and H2 samples. At 300 K, the H1 sample has greater spin relaxation effect (broader absorption lines) than the H2 one, despite having close crystallites and mean particle nanosizes. Thus, Blume-Tjon relaxation patterns [44] were used to fit the H1 and H2 spectra. Table 4 summarizes the fitting hyperfine parameters. First, it must be noticed that the line width (LW) is almost double in the H1. The following explanations are given for the observed LW broadening. The H1 sample has a much broader distribution than the H2 sample and crystallites with smaller sizes, which is why these Fe3+ spin relaxation effects are observed. It also reinforces the presence of residual nanocrystallized γ-Fe2O3 NPs, with sizes < 10 nm in the H1 sample as also supported by TEM data. Thus, the existence of two magnetic phases also supports relaxation broadening effect of the H1 sample. On the other hand, the quinoa organic content in H2 helps to have a better crystallize α-Fe2O3 phase, as reinforced by the hyperfine parameter values at 16 K that are in good agreement with those found for bulk α-Fe2O3 [4]. However, the quadrupolar shifting ε of −0.24 mm/s for α-Fe2O3 NPs differs from the bulk value of 0.41 mm/s at 4.2 K [4], but goes in the same direction of the value reported by Bødker (−0.10 mm/s at 5 K) for weakly ferromagnetic 17 nm α-Fe2O3 NPs [8]. It is important to mention that the precedents of samples with magnetic nanometric coating (magnetic layers), undetected by X-ray diffraction, have been reported previously [45]. These magnetic layers cause surface magnetic disorder and interface coupling exchange phenomena.

3.7. VSM Analysis

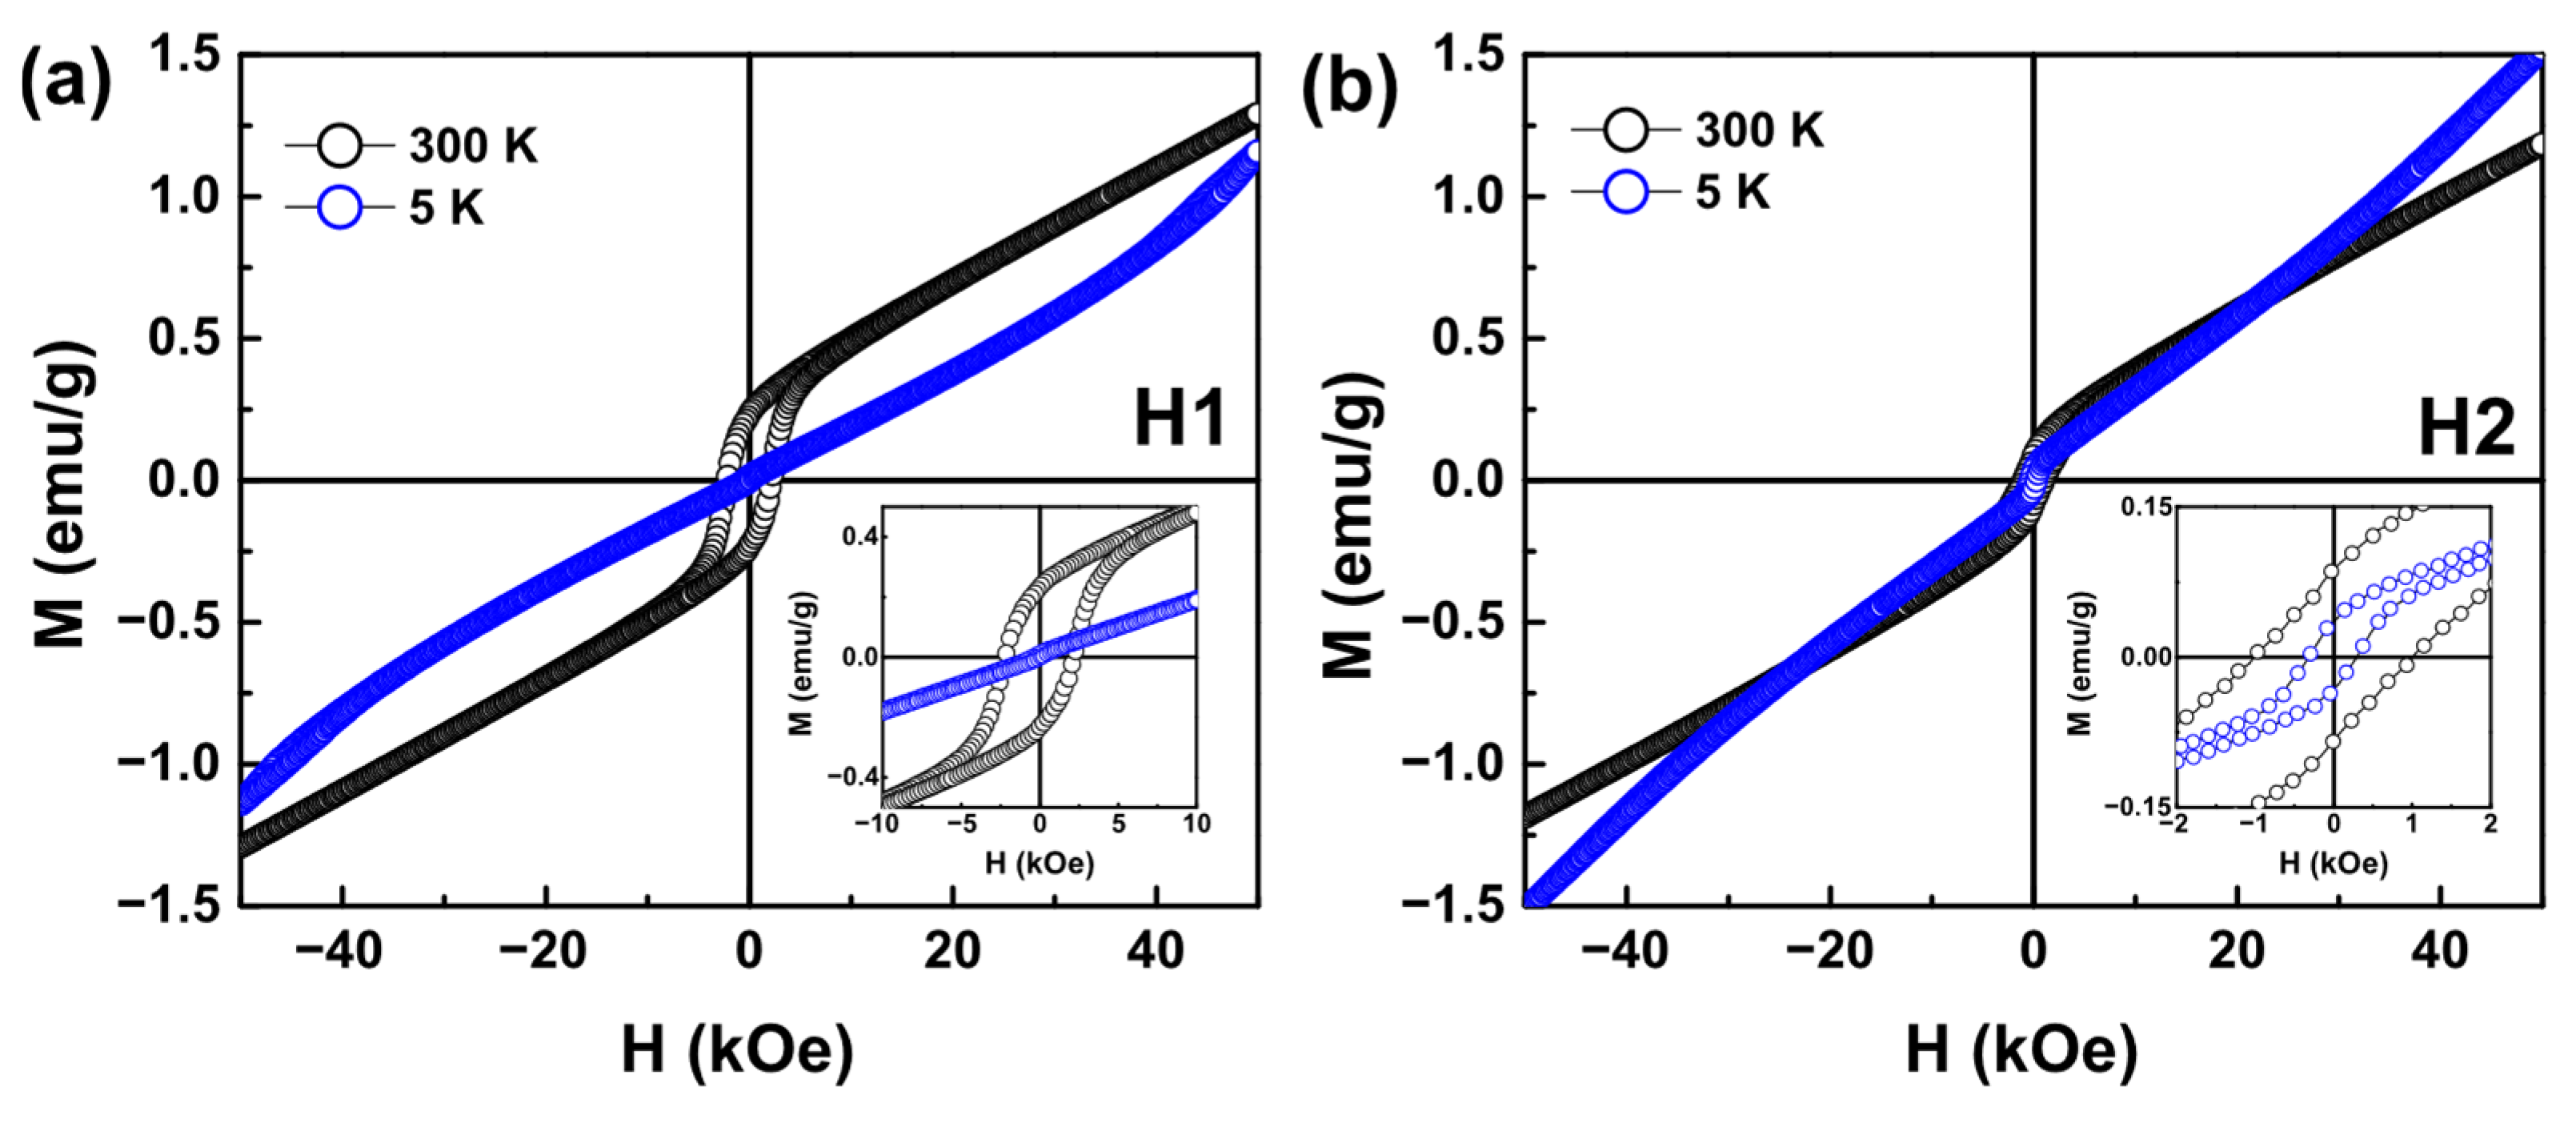
The 300 and 5 K M(H) curves are shown in Figure 8a,b for the H1 and H2 samples, respectively, and their main magnetic parameters are summarized in Table 5.
The magnetic characterization of the α-Fe2O3-based samples (H1 and H2) reveals a strong dependence on the thermal history and precursor nature. At 300 K, H1 exhibits a significantly higher coercivity (2.2 kOe) and remanence (0.23 emu/g) compared to those corresponding values for the H2 sample (1.0 kOe and 0.08 emu/g, respectively). On the other hand, it should be mentioned that the values of these parameters are unusually large for bulk-like α-Fe2O3, which behaves typically as weakly ferromagnet above the Morin transition due to the spin canting [4,46]. The enhancement in coercivity and remanence found in the H1 sample suggests the presence of residual nanoscale γ-Fe2O3 regions, where features like a higher Ms value (0.32 emu/g for H1 vs. 0.23 emu/g for H2) are a strong signature of a ferrimagnetic-like contribution probably due to the unconverted γ-Fe2O3 NPs (this result agrees with that obtained by Mössbauer spectroscopy). At 5 K, both samples exhibit a pronounced reduction in coercivity (0.3 kOe), a feature consistent with the freezing of surface spin dynamics and the weakening of anisotropy barriers at the nanoscale [47]. However, the much larger remanence retained in H1 at 5 K relative to H2 further indicates the persistence of a ferrimagnetic component (a secondary phase attributed to the γ-Fe2O3 NPs). All these magnetic results are supported by 57Mössbauer results. For example, at 300 K, the H1 sample displays a broad Mössbauer spectrum with marked spin relaxation effects, in sharp contrast with the narrow LW broadening observed for the H2 sample at the same temperature. The persistence of Mössbauer spectral broadening in the H1 sample, even at 16 K, suggests incomplete transformation of γ-Fe2O3 to α-Fe2O3 and the coexistence of small ferrimagnetic domains whose hyperfine fields are still distributed. By contrast, H2 evolves toward a spectrum characteristic of bulk α-Fe2O3 at 16 K, with well-defined sextets and a minimal spin relaxation effect. This distinction aligns with the magnetometry data, where H1 displays enhanced coercivity and remanence at 300 K, whereas H2 behaves more closely to single-phase α-Fe2O3.
Structural data further clarifies the origin of these differences. Both X-ray diffractograms indicated phase-pure α-Fe2O3 with average crystallite sizes of ~54–56 nm, yet TEM analysis of H1 revealed a bimodal particle size distribution (18.5 nm and 35.5 nm), while H2 showed a narrow distribution centered at ~28 nm. The bimodality in H1 likely reflects incomplete grain coarsening during the γ α-Fe2O3 transformation, allowing for residual nanoscale ferrimagnetic domains. This scenario is consistent with the higher coercivity and Mössbauer spin relaxation observed. In contrast, the homogeneous size distribution of H2 facilitates a more complete structural and magnetic transformation into α-Fe2O3.
The differences are further explained by the nature of the precursors. H1 was derived from a 14 nm synthetic γ-Fe2O3 control subjected to thermal treatment under TG conditions, whereas H2 originated from the biosynthesized 7 nm γ-Fe2O3 NPs, produced with quinoa extract. The biosynthetic route not only generated smaller primary NPs, but may have promoted a more uniform thermal conversion to α-Fe2O3, resulting in fewer residual ferrimagnetic regions. Considering the magnetization of the parent phases (Ms = 69 emu/g for 14 nm control γ-Fe2O3 and Ms = 11 emu/g for the biosynthesized γ-Fe2O3), the amount of residual ferrimagnetic fraction required to explain the magnetic response of H1 is within the sub-percent range by mass. This explains why X-ray diffraction fails to detect the γ-Fe2O3 secondary phase, while Mössbauer relaxation and magnetometry remain sensitive probes of nanoscale heterogeneity.
In summary, the combined evidence demonstrates that the H1 sample retains a minor fraction of residual γ-Fe2O3, which significantly enhances its coercivity and remanence, whereas H2 represents a nearly complete conversion to α-Fe2O3. The contrasting behavior emphasizes the critical role of precursor type, particle size distribution, and thermal pathway in determining the final magnetic properties of α-Fe2O3 NPs. These results highlight the necessity of combining structural and morphological (X-ray diffraction, TEM) and local probes (57Mössbauer spectroscopy) with magnetometry to unravel subtle phase coexistence in iron-oxide phases.

4. Conclusions

This work demonstrates that hematite NPs, obtained from heating under controlled conditions nanomaghemite precursors, exhibit distinct structural and magnetic behaviors, features that are strongly influenced by the history of precursors. Although X-ray diffraction confirmed phase-pure α-Fe2O3 for both H1 (obtained from heating the synthetic precursor, 14 nm γ-Fe2O3) and H2 (obtained from heating the biosynthesized precursor, 7 nm γ-Fe2O3 with quinoa extract), complementary probes revealed critical differences. For H1, TEM revealed a bimodal size distribution, 57Mössbauer spectra showed persistent spin relaxation effects even at low temperatures (16 K), and magnetometry indicated enhanced coercivity and remanence. Importantly, XPS detected Fe3+ as the dominant state but also revealed subtle satellite features, consistent with residual γ-Fe2O3 or surface disorder. These findings indicate incomplete transformation and the retention of magnetically active ferrimagnetic fractions. On the other hand, the H2 samples showed the following features: TEM indicated uniform particles (~28 nm), 57Mössbauer spectra (of course, hyperfine parameters) closely matched with those values found in bulk α-Fe2O3, and magnetometry showed lower coercivity and remanence. XPS confirmed Fe3+ without additional features, supporting a more complete γ to α-Fe2O3 transformation. Together, the applied multi-technique approach demonstrates that while both samples crystallized as α-Fe2O3, only H2 achieved a homogeneous phase, whereas H1 retained nanoscale ferrimagnetic residues detectable by XPS and 57Mössbauer. These results emphasize that biosynthetic functionalization enables more complete γ α-Fe2O3 phase transformation, consequently, leading to α-Fe2O3 NPs with tailored and reproducible magnetic behavior for environmental and technological applications.

Author Contributions

Conceptualization, J.A.R.-G., M.d.P.M.-C. and R.R.-V.; methodology, J.A.R.-G., M.d.P.M.-C., R.R.-V. and B.L.D.S.; software, J.A.R.-G., M.d.P.M.-C., R.R.-V. and B.L.D.S.; validation, J.A.R.-G., M.d.P.M.-C., R.R.-V. and B.L.D.S.; formal analysis, J.A.R.-G., M.d.P.M.-C., R.R.-V. and B.L.D.S.; investigation, J.A.R.-G., M.d.P.M.-C., R.R.-V., E.V.M.-C., N.-R.C.-H., B.L.D.S. and E.C.P.; resources, J.A.R.-G., W.A.A.M., N.-R.C.-H. and E.C.P.; data curation, J.A.R.-G., M.d.P.M.-C., R.R.-V. and B.L.D.S.; writing—original draft preparation, J.A.R.-G., M.d.P.M.-C., R.R.-V. and B.L.D.S.; writing—review and editing, J.A.R.-G., M.d.P.M.-C., R.R.-V., E.V.M.-C., N.-R.C.-H., B.L.D.S., W.A.A.M. and E.C.P.; visualization, J.A.R.-G., M.d.P.M.-C., R.R.-V. and B.L.D.S.; supervision, J.A.R.-G.; project administration, E.V.M.-C. and J.A.R.-G.; funding acquisition, J.A.R.-G. All authors have read and agreed to the published version of the manuscript.

Funding

We thank the Vicerrectorado de Investigación y Posgrado (VRIP) de la Universidad Nacional Mayor de San Marcos (UNMSM)—R.R. N° 006081-R-23 and project number B23131591 for financially supporting this work.

Institutional Review Board Statement

Not applicable.

Informed Consent Statement

Not applicable.

Data Availability Statement

The original contributions presented in this study are included in the article. Further inquiries can be directed to the corresponding author.

Acknowledgments

The authors would like to thank Laboratório Multiusuário de Instrumentação-LabMInst (LabPetro-UFES, Brazil) for performing FTIR, Fluorescence, TG-DTG, DSC, Raman, and AFM measurements (Technical Cooperation Agreements 0050.0022844.06.4, No. 5900.0112399.19.9, FAPES No. 975/2022 and No. 08/2021, CNPq No. 310167/2021-3, and PRPPG-Ufes). WAAM acknowledges the CNPq (Grant No. 310795/2022-2).

Conflicts of Interest

The authors declare no conflict of interest.

References

  1. Bhateria, R.; Singh, R. A Review on Nanotechnological Application of Magnetic Iron Oxides for Heavy Metal Removal. J. Water Process Eng. 2019, 31, 100845. [Google Scholar] [CrossRef]
  2. Meng, Y.Q.; Shi, Y.N.; Zhu, Y.P.; Liu, Y.Q.; Gu, L.W.; Liu, D.D.; Ma, A.; Xia, F.; Guo, Q.Y.; Xu, C.C.; et al. Recent Trends in Preparation and Biomedical Applications of Iron Oxide Nanoparticles. J. Nanobiotech. 2024, 22, 24. [Google Scholar] [CrossRef]
  3. Meijer, J.M.; Rossi, L. Preparation, Properties, and Applications of Magnetic Hematite Microparticles. Soft Matter 2021, 17, 2354–2368. [Google Scholar] [CrossRef]
  4. Cornell, R.M.; Schwertmann, U. The Iron Oxides: Structures, Properties, Reactions, Occurences and Uses, 2nd ed.; WILEY-VCH GmbH & Co. KGaA: Weinheim, Germany, 2003. [Google Scholar]
  5. Chen, W.; She, A.-S.; Ji, M.-H.; Shi, H.-Y.; Yang, Y.; Pu, Y.-H.; Chen, R.; Yang, W.-H.; Chen, Y.-X.; Lu, C.-Z. Optimizing Charge Separation and Transport: Enhanced Photoelectrochemical Water Splitting in α-Fe2O3/CZTS Nanorod Arrays. Catalysts 2024, 14, 812. [Google Scholar] [CrossRef]
  6. Mandal, B.K.; Chauhan, P.S.; Das, R. Photocatalytic Activity of Green Synthesized Canted Ferromagnetic Hematite Iron Oxide Nanoparticles for Methyl Orange Removal in Wastewater Remediation. J. Magn. Magn. Mater. 2025, 628, 173182. [Google Scholar] [CrossRef]
  7. Ashraf, M.; Khan, I.; Usman, M.; Khan, A.; Shah, S.S.; Khan, A.Z.; Saeed, K.; Yaseen, M.; Ehsan, M.F.; Tahir, M.N.; et al. Hematite and Magnetite Nanostructures for Green and Sustainable Energy Harnessing and Environmental Pollution Control: A Review. Chem. Res. Toxicol. 2020, 33, 1292–1311. [Google Scholar] [CrossRef]
  8. Bødker, F.; Hansen, M.F.; Koch, C.B.; Lefmann, K.; Mørup, S. Magnetic Properties of Hematite Nanoparticles. Phys. Rev. B 2000, 61, 6826–6838. [Google Scholar] [CrossRef]
  9. Özdemir, Ö.; Dunlop, D.J.; Berquó, T.S. Morin Transition in Hematite: Size Dependence and Thermal Hysteresis. Geochem. Geophys. Geosyst. 2008, 9, 10. [Google Scholar] [CrossRef]
  10. Vinayagam, R.; Patnaik, Y.; Brijesh, P.; Prabhu, D.; Quadras, M.; Pai, S.; Narasimhan, M.K.; Kaviyarasu, K.; Varadavenkatesan, T.; Selvaraj, R. Superparamagnetic Hematite Spheroids Synthesis, Characterization, and Catalytic Activity. Chemosphere 2022, 294, 133730. [Google Scholar] [CrossRef] [PubMed]
  11. Lemine, O.M.; Madkhali, N.; Hjiri, M.; All, N.A.; Aida, M.S. Comparative Heating Efficiency of Hematite (α-Fe2O3) and Nickel Ferrite Nanoparticles for Magnetic Hyperthermia Application. Ceram. Int. 2020, 46, 28821–28827. [Google Scholar] [CrossRef]
  12. Paulson, E.; Jothibas, M. Significance of Thermal Interfacing in Hematite (α-Fe2O3) Nanoparticles Synthesized by Sol-Gel Method and Its Characteristics Properties. Surf. Interfaces 2021, 26, 101432. [Google Scholar] [CrossRef]
  13. Colombo, C.; Palumbo, G.; Di Iorio, E.; Song, X.; Jiang, Z.; Liu, Q.; Angelico, R. Influence of Hydrothermal Synthesis Conditions on Size, Morphology and Colloidal Properties of Hematite Nanoparticles. Nano-Struct. Nano-Objects 2015, 2, 19–27. [Google Scholar] [CrossRef]
  14. Tahir, M.; Fakhar-e-Alam, M.; Atif, M.; Mustafa, G.; Ali, Z. Investigation of Optical, Electrical and Magnetic Properties of Hematite α-Fe2O3 Nanoparticles via Sol-Gel and Co-Precipitation Method. J. King Saud. Univ. Sci. 2023, 35, 102695. [Google Scholar] [CrossRef]
  15. Darezereshki, E.; Bakhtiari, F.; Alizadeh, M.; Vakylabad, A.B.; Ranjbar, M. Direct Thermal Decomposition Synthesis and Characterization of Hematite (α-Fe2O3) Nanoparticles. Mater. Sci. Semicond. Process. 2012, 15, 91–97. [Google Scholar] [CrossRef]
  16. Miri, A.; Khatami, M.; Sarani, M. Biosynthesis, Magnetic and Cytotoxic Studies of Hematite Nanoparticles. J. Inorg. Organomet. Polym. Mater. 2020, 30, 767–774. [Google Scholar] [CrossRef]
  17. Chen, Y.H. Thermal Properties of Nanocrystalline Goethite, Magnetite, and Maghemite. J. Alloys Compd. 2013, 553, 194–198. [Google Scholar] [CrossRef]
  18. Marcos-Carrillo, M.d.P.; Checca-Huaman, N.-R.; Passamani, E.C.; Ramos-Guivar, J.A. Biosynthesis and Characterization of Iron Oxide Nanoparticles Using Chenopodium quinoa Extract. Nanomaterials 2024, 14, 1607. [Google Scholar] [CrossRef]
  19. Chakraborty, A.R.; Zohora Toma, F.T.; Alam, K.; Yousuf, S.B.; Hossain, K.S. Influence of Annealing Temperature on Fe2O3 Nanoparticles: Synthesis Optimization and Structural, Optical, Morphological, and Magnetic Properties Characterization for Advanced Technological Applications. Heliyon 2024, 10, e40000. [Google Scholar] [CrossRef]
  20. Rueda-Vellasmin, R.; Checca-Huaman, N.-R.; Passamani, E.C.; Litterst, F.J.; Ramos-Guivar, J.A. Mössbauer Studies of Core-Single-Shell and Core-Double-Shell Polymer Functionalized Magnetic Nanoparticles. Hyperfine Interact. 2022, 243, 27. [Google Scholar] [CrossRef]
  21. Greczynski, G.; Hultman, L. X-ray photoelectron spectroscopy: Towards reliable binding energy referencing. Prog. Mater. Sci. 2020, 107, 100591. [Google Scholar] [CrossRef]
  22. Pielichowska, K.; Nowicka, K. Analysis of Nanomaterials and Nanocomposites by Thermoanalytical Methods. Thermochim. Acta 2019, 675, 140–163. [Google Scholar] [CrossRef]
  23. N, S.; Mahalakshmi, S. A Study on the Oxidative Property Using Thermogravimetric Analysis of NiO Nanoparticles Prepared by a Simple Wet Chemical Method. Chem. Phys. Impact 2024, 8, 100613. [Google Scholar] [CrossRef]
  24. Borchert, H.; Shevchenko, E.V.; Robert, A.; Mekis, I.; Kornowski, A.; Grübel, G.; Weller, H. Determination of Nanocrystal Sizes: A Comparison of TEM, SAXS, and XRD Studies of Highly Monodisperse CoPt3 Particles. Langmuir 2005, 21, 1931–1936. [Google Scholar] [CrossRef]
  25. Weidenthaler, C. Pitfalls in the Characterization of Nanoporous and Nanosized Materials. Nanoscale 2011, 3, 792–810. [Google Scholar] [CrossRef]
  26. Nasiri, S.; Rabiei, M.; Palevicius, A.; Janusas, G.; Vilkauskas, A.; Nutalapati, V.; Monshi, A. Modified Scherrer Equation to Calculate Crystal Size by XRD with High Accuracy, Examples Fe2O3, TiO2 and V2O5. Nano Trends 2023, 3, 100015. [Google Scholar] [CrossRef]
  27. Khanam, J.; Hasan, M.R.; Biswas, B.; Ahmed, M.F.; Mostofa, S.; Akhtar, U.S.; Hossain, M.K.; Quddus, M.S.; Ahmed, S.; Sharmin, N.; et al. Effect of low temperature calcination on micro structure of hematite nanoparticles synthesized from waste iron source. Heliyon 2024, 10, e41030. [Google Scholar] [CrossRef] [PubMed]
  28. Tadic, M.; Panjan, M.; Tadic, B.V.; Lazovic, J.; Damnjanovic, V.; Kopani, M.; Kopanja, L. Magnetic Properties of Hematite (α-Fe2O3) Nanoparticles Synthesized by Sol-Gel Synthesis Method: The Influence of Particle Size and Particle Size Distribution. J. Electr. Eng. 2019, 70, 71–76. [Google Scholar] [CrossRef]
  29. Chernyshova, I.V.; Hochella, M.F., Jr.; Madden, A.S. Size-Dependent Structural Transformations of Hematite Nanoparticles. 1. Phase Transition. Phys. Chem. Chem. Phys. 2007, 9, 1736–1750. [Google Scholar] [CrossRef]
  30. Segura, R.; Vásquez, G.; Colson, E.; Gerbaux, P.; Frischmon, C.; Nesic, A.; García, D.E.; Cabrera-Barjas, G. Phytostimulant Properties of Highly Stable Silver Nanoparticles Obtained with Saponin Extract from Chenopodium Quinoa. J. Sci. Food Agric. 2020, 100, 4987–4994. [Google Scholar] [CrossRef]
  31. Tohry, A.; Dehghan, R.; Hatefi, P.; Chelgani, S.C. A Comparative Study between the Adsorption Mechanisms of Sodium Co-Silicate and Conventional Depressants for the Reverse Anionic Hematite Flotation. Sep. Sci. Technol. 2022, 57, 141–158. [Google Scholar] [CrossRef]
  32. Ramos-Pacheco, B.S.; Choque-Quispe, D.; Ligarda-Samanez, C.A.; Solano-Reynoso, A.M.; Palomino-Rincón, H.; Choque-Quispe, Y.; Peralta-Guevara, D.E.; Moscoso-Moscoso, E.; Aiquipa-Pillaca, Á.S. Effect of Germination on the Physicochemical Properties, Functional Groups, Content of Bioactive Compounds, and Antioxidant Capacity of Different Varieties of Quinoa (Chenopodium quinoa Willd.) Grown in the High Andean Zone of Peru. Foods 2024, 13, 417. [Google Scholar] [CrossRef]
  33. Torres Vargas, O.L.; García Salcedo, A.J.; Ariza Calderón, H. Physical-Chemical Characterization of Quinoa (Chenopodium quinoa Willd.), Amaranth (Amaranthus caudatus L.), and Chia (Salvia hispanica L.) Flours and Seeds. Acta Agron. 2018, 67, 215–222. [Google Scholar] [CrossRef]
  34. Bagus, P.S.; Nelin, C.J.; Brundle, C.R.; Crist, B.V.; Lahiri, N.; Rosso, K.M. Origin of the Complex Main and Satellite Features in Fe 2p XPS of Fe2O3. Phys. Chem. Chem. Phys. 2022, 24, 4562–4575. [Google Scholar] [CrossRef]
  35. Yamashita, T.; Hayes, P. Analysis of XPS Spectra of Fe2+ and Fe3+ Ions in Oxide Materials. Appl. Surf. Sci. 2008, 254, 2441–2449. [Google Scholar] [CrossRef]
  36. Flak, D.; Chen, Q.; Mun, B.S.; Liu, Z.; Rękas, M.; Braun, A. In Situ Ambient Pressure XPS Observation of Surface Chemistry and Electronic Structure of α-Fe2O3 and γ-Fe2O3 Nanoparticles. Appl. Surf. Sci. 2018, 455, 1019–1028. [Google Scholar] [CrossRef]
  37. Radu, T.; Iacovita, C.; Benea, D.; Turcu, R. X-Ray Photoelectron Spectroscopic Characterization of Iron Oxide Nanoparticles. Appl. Surf. Sci. 2017, 405, 337–343. [Google Scholar] [CrossRef]
  38. Ren, G.; Deng, Y.; Yang, X. A Novel Fabrication of Hematite Nanoparticles via Recycling of Titanium Slag by Pyrite Reduction Technology. Nanomaterials 2024, 14, 1330. [Google Scholar] [CrossRef] [PubMed]
  39. Kirik, N.; Krylov, A.; Boronin, A.; Koshcheev, S.; Solovyov, L.; Rabchevskii, E.; Shishkina, N.; Anshits, A. The Relationship between the Structural Characteristics of α-Fe2O3 Catalysts and Their Lattice Oxygen Reactivity Regarding Hydrogen. Materials 2023, 16, 4466. [Google Scholar] [CrossRef]
  40. Baabu, P.R.S.; Kumar, H.K.; Gumpu, M.B.; Babu, K.J.; Kulandaisamy, A.J.; Rayappan, J.B.B. Iron Oxide Nanoparticles: A Review on the Province of Its Compounds, Properties and Biological Applications. Materials 2022, 16, 59. [Google Scholar] [CrossRef]
  41. Ahmad, S.; Ni, H.; Al-Mubaddel, F.S.; Rizk, M.A.; Ben Ammar, M.; Khan, A.U.; Almarhoon, Z.M.; Alanazi, A.A.; Zaki, M.E.A. Magnetic Properties of Different Phases Iron Oxide Nanoparticles Prepared by Micro Emulsion-Hydrothermal Method. Sci. Rep. 2025, 15, 878. [Google Scholar] [CrossRef]
  42. Krishna, D.N.G.; Philip, J. Review on Surface-Characterization Applications of X-Ray Photoelectron Spectroscopy (XPS): Recent Developments and Challenges. Appl. Surf. Sci. Adv. 2022, 12, 100332. [Google Scholar] [CrossRef]
  43. Bagus, P.S.; Nelin, C.J.; Brundle, C.R.; Lahiri, N.; Ilton, E.S.; Rosso, K.M. Analysis of the Fe 2p XPS for Hematite α Fe2O3: Consequences of Covalent Bonding and Orbital Splittings on Multiplet Splittings. J. Chem. Phys. 2020, 152, 014704. [Google Scholar] [CrossRef] [PubMed]
  44. Blume, M.; Tjon, J.A. Mössbauer Spectra in a Fluctuating Environment. Phys. Rev. 1968, 165, 446–456. [Google Scholar] [CrossRef]
  45. Ramos-Guivar, J.A.; López, E.O.; Greneche, J.-M.; Jochen Litterst, F.; Passamani, E.C. Effect of EDTA Organic Coating on the Spin Canting Behavior of Maghemite Nanoparticles for Lead (II) Adsorption. Appl. Surf. Sci. 2021, 538, 148021. [Google Scholar] [CrossRef]
  46. Morrish, A.H. Canted Antiferromagnetism: Hematite; World Scientific: Singapore, 1995; ISBN 978-981-02-2007-5. [Google Scholar]
  47. Goya, G.F.; Berquó, T.S.; Fonseca, F.C.; Morales, M.P. Static and Dynamic Magnetic Properties of Spherical Magnetite Nanoparticles. J. Appl. Phys. 2003, 94, 3520–3528. [Google Scholar] [CrossRef]
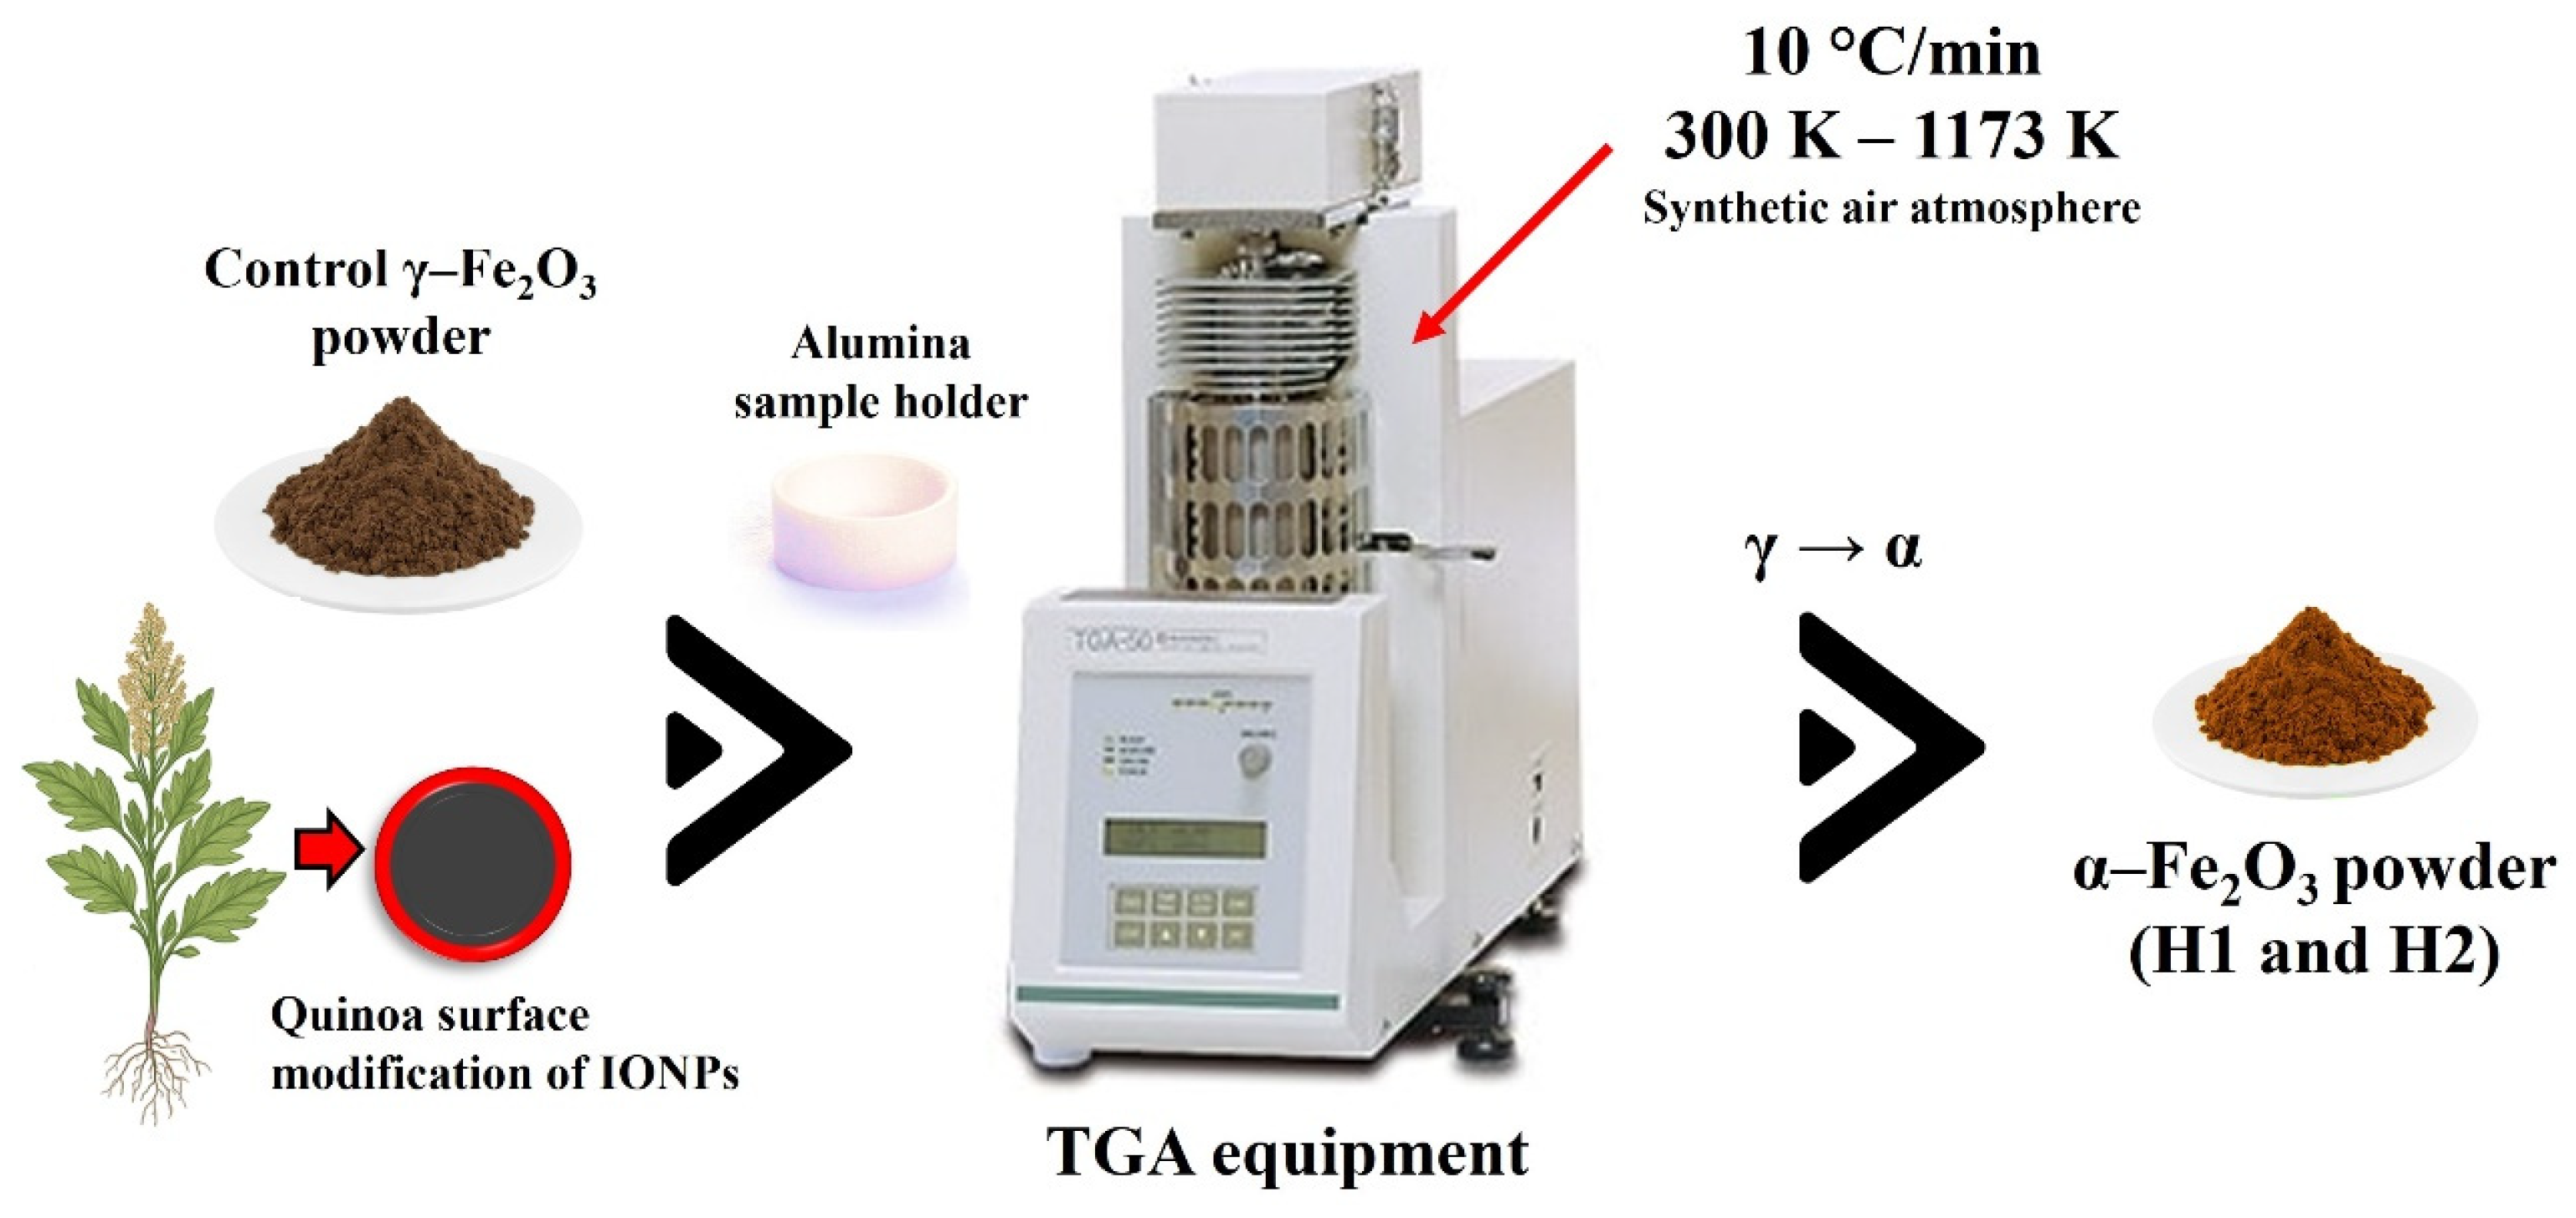
Scheme 1. Thermal transformation of γ–Fe2O3 → α–Fe2O3 using TGA equipment.
Materials 18 04677 sch001
Figure 1. TG profiles showing the thermal decomposition of the M control (H1) and QE10 (H2) samples. (a,b) Thermal behavior to form H1, showing volatile release, molecule desorption, and phase transformation to α-Fe2O3. (c,d) Thermal decomposition to form H2, highlighting mass losses associated with volatile compounds and organic decomposition, and subsequent α-Fe2O3 stabilization. Shaded regions indicate different thermal events.
Materials 18 04677 g001
Figure 2. Refined X-ray diffractograms of the (a) H1 and (b) H2 samples. The black lines indicate the observed diffractograms, the red lines the calculated patterns, and the horizontal blue line refers to the residual profiles; the green vertical lines are related to the Bragg peaks. The Miller planes are indexed at the top of each diffraction peak in (a).
Materials 18 04677 g002
Figure 3. Representative TEM images for the H1 and H2 samples (ad) and their corresponding PSD histograms (e,f). In (a,b) the bar scale is 100 nm.
Materials 18 04677 g003
Figure 4. ATR-FTIR spectra for the (a) H1 and (b) H2 samples. The data were acquired in ATR mode but are presented in pseudo-transmittance coordinates (%T vs. wavenumber) for consistency with prior reports.
Materials 18 04677 g004
Figure 5. Survey (a), and high-resolution XPS spectra, and their respective fits for Fe 2p (b), O 1s (c), and C 1s (d) regions for the H1 sample.
Materials 18 04677 g005
Figure 6. Survey (a), and high-resolution XPS spectra, and their respective fits for Fe 2p (b), O 1s (c), and C 1s (d) regions for the H2 sample.
Materials 18 04677 g006
Figure 7. 300 K (left-hand panel) and 16 K (right-hand panel) 57Fe Mössbauer spectra for the H1 and H2 samples.
Materials 18 04677 g007
Figure 8. M(H) curves for the H1 (a) and H2 (b) samples measured at 300 K and 5 K. Insets display magnified views of the low-field region to highlight specific hysteresis features.
Materials 18 04677 g008
Table 1. Rietveld refinement parameters, statistical parameters, and crystallite sizes of the H1 and H2 samples. Rp (%), Rwp (%), and Rexp (%) are the profile residual, the weighted profile residual, and the expected profile residual, respectively, while χ2 is the goodness of the refinement.
SamplePhaseCaglioti ParametersLattice Parameters
(Å)
DRietveld (nm)Weight Fraction (%)Statistical Parameters
UVW
H1α-Fe2O30.011−0.0550.058a = 5.034(1)
b = 5.034(1)
c = 13.745(1)
α = β = 90°
γ = 120°
54(1)100Rp = 74.2%
Rwp = 34.1%
Rexp = 19.9%
χ2 = 2.94
H2α-Fe2O30.021−0.0620.057a = 5.031(1)
b = 5.031(1)
c = 13.737(1)
α = β = 90°
γ = 120°
56(1)100Rp = 73.8%
Rwp = 34.0%
Rexp = 19.9%
χ2 = 2.91
Table 2. Representative Miller planes and interplanar distances for the H1 and H2 samples.
H1
Miller Plane2θ (°)d(nm)dref. (nm)
(104)33.170.27000.2703
(110)35.680.25170.2519
H2
Miller Plane2θ (°)d(nm)dref. (nm)
(104)33.190.27020.2703
(110)35.670.25160.2519
Table 3. Binding energies (eV) for Fe 2p3/2, Satellite, and O 1s components found in the literature and in the H1 and H2 samples.
Sample/ReferenceFe 2p3/2 (eV)Satellite (eV)O 1s (eV)Notes
Literature (α-Fe2O3, Fe3+) [34,35,36]709.9–711.0~718.9529.2–530.0 (lattice O); 530.9–531.4 (–OH)Classical α-Fe2O3 XPS signature
H1 (this work)710.4718.7529.8Very close to classical α-Fe2O3; Fe3+ well defined; lattice oxygen dominant
H2 (this work)710.0717.7529.9Fe3+ state preserved, but satellite shifted ~1 eV lower; suggests subtle changes in surface/electronic environment
Table 4. 57Fe Mössbauer hyperfine parameters obtained from the fittings of the H1 and H2 spectra at 300 and 16 K: IS is the isomer shift (mm/s), Bhf corresponds to the hyperfine magnetic field (T), ε is the quadrupole shifting (mm/s), LW indicates the linewidth (mm/s), and R.A.A. corresponds to the relative absorption area of each component (%).
SampleIS (mm/s) ±0.01Bhf (T)
±0.5
ε (mm/s) ±0.01LW (mm/s) ±0.01R.A.A. (%)
±1
H1-300 K0.4147.50.000.63100
H1-16 K0.4952.2−0.240.54100
H2-300 K0.3851.1−0.190.35100
H2-16 K0.4654.10.420.18100
Table 5. Magnetic parameters (coercivity Hc, saturation magnetization Ms, and remanent magnetization Mr) of the H1 and H2 samples were measured at 300 K and 5 K using VSM.
SampleTHcMsMr
(K)±0.1 (kOe)±0.01 (emu/g)±0.01 (emu/g)
H13002.20.320.23
50.3--
H23001.00.230.08
50.3-0.03
Disclaimer/Publisher’s Note: The statements, opinions and data contained in all publications are solely those of the individual author(s) and contributor(s) and not of MDPI and/or the editor(s). MDPI and/or the editor(s) disclaim responsibility for any injury to people or property resulting from any ideas, methods, instructions or products referred to in the content.