The analysis of the cracking mechanism indicates that reducing the difference in thermal expansion coefficients between the coating and substrate materials can directly decrease thermal stress during the deposition process, thereby inhibiting cracking. To achieve this, a suppression scheme involving a transition layer of Ni elements between the substrate and the fusion cladding layer is proposed. On one hand, the thermal expansion coefficient of Ni is 12.8 × 10⁻⁶ K−1, which falls between that of Ni60B and 38CrMoAl steel. By incorporating a transition layer containing Ni, the difference in thermal expansion coefficients between the substrate and the Ni60B coating can be effectively minimized. On the other hand, during the cladding of Ni60B coatings, the laser remelting effect facilitates the diffusion of Ni from the transition layer into the cladding layer, enhancing the toughness of the coating. Therefore, the addition of a nickel powder transition layer between the substrate and the Ni60B coating is expected to significantly aid in crack suppression.
3.2.2. Mechanism of Cracking Inhibition of Coatings by Ni-Doped Transition Layers
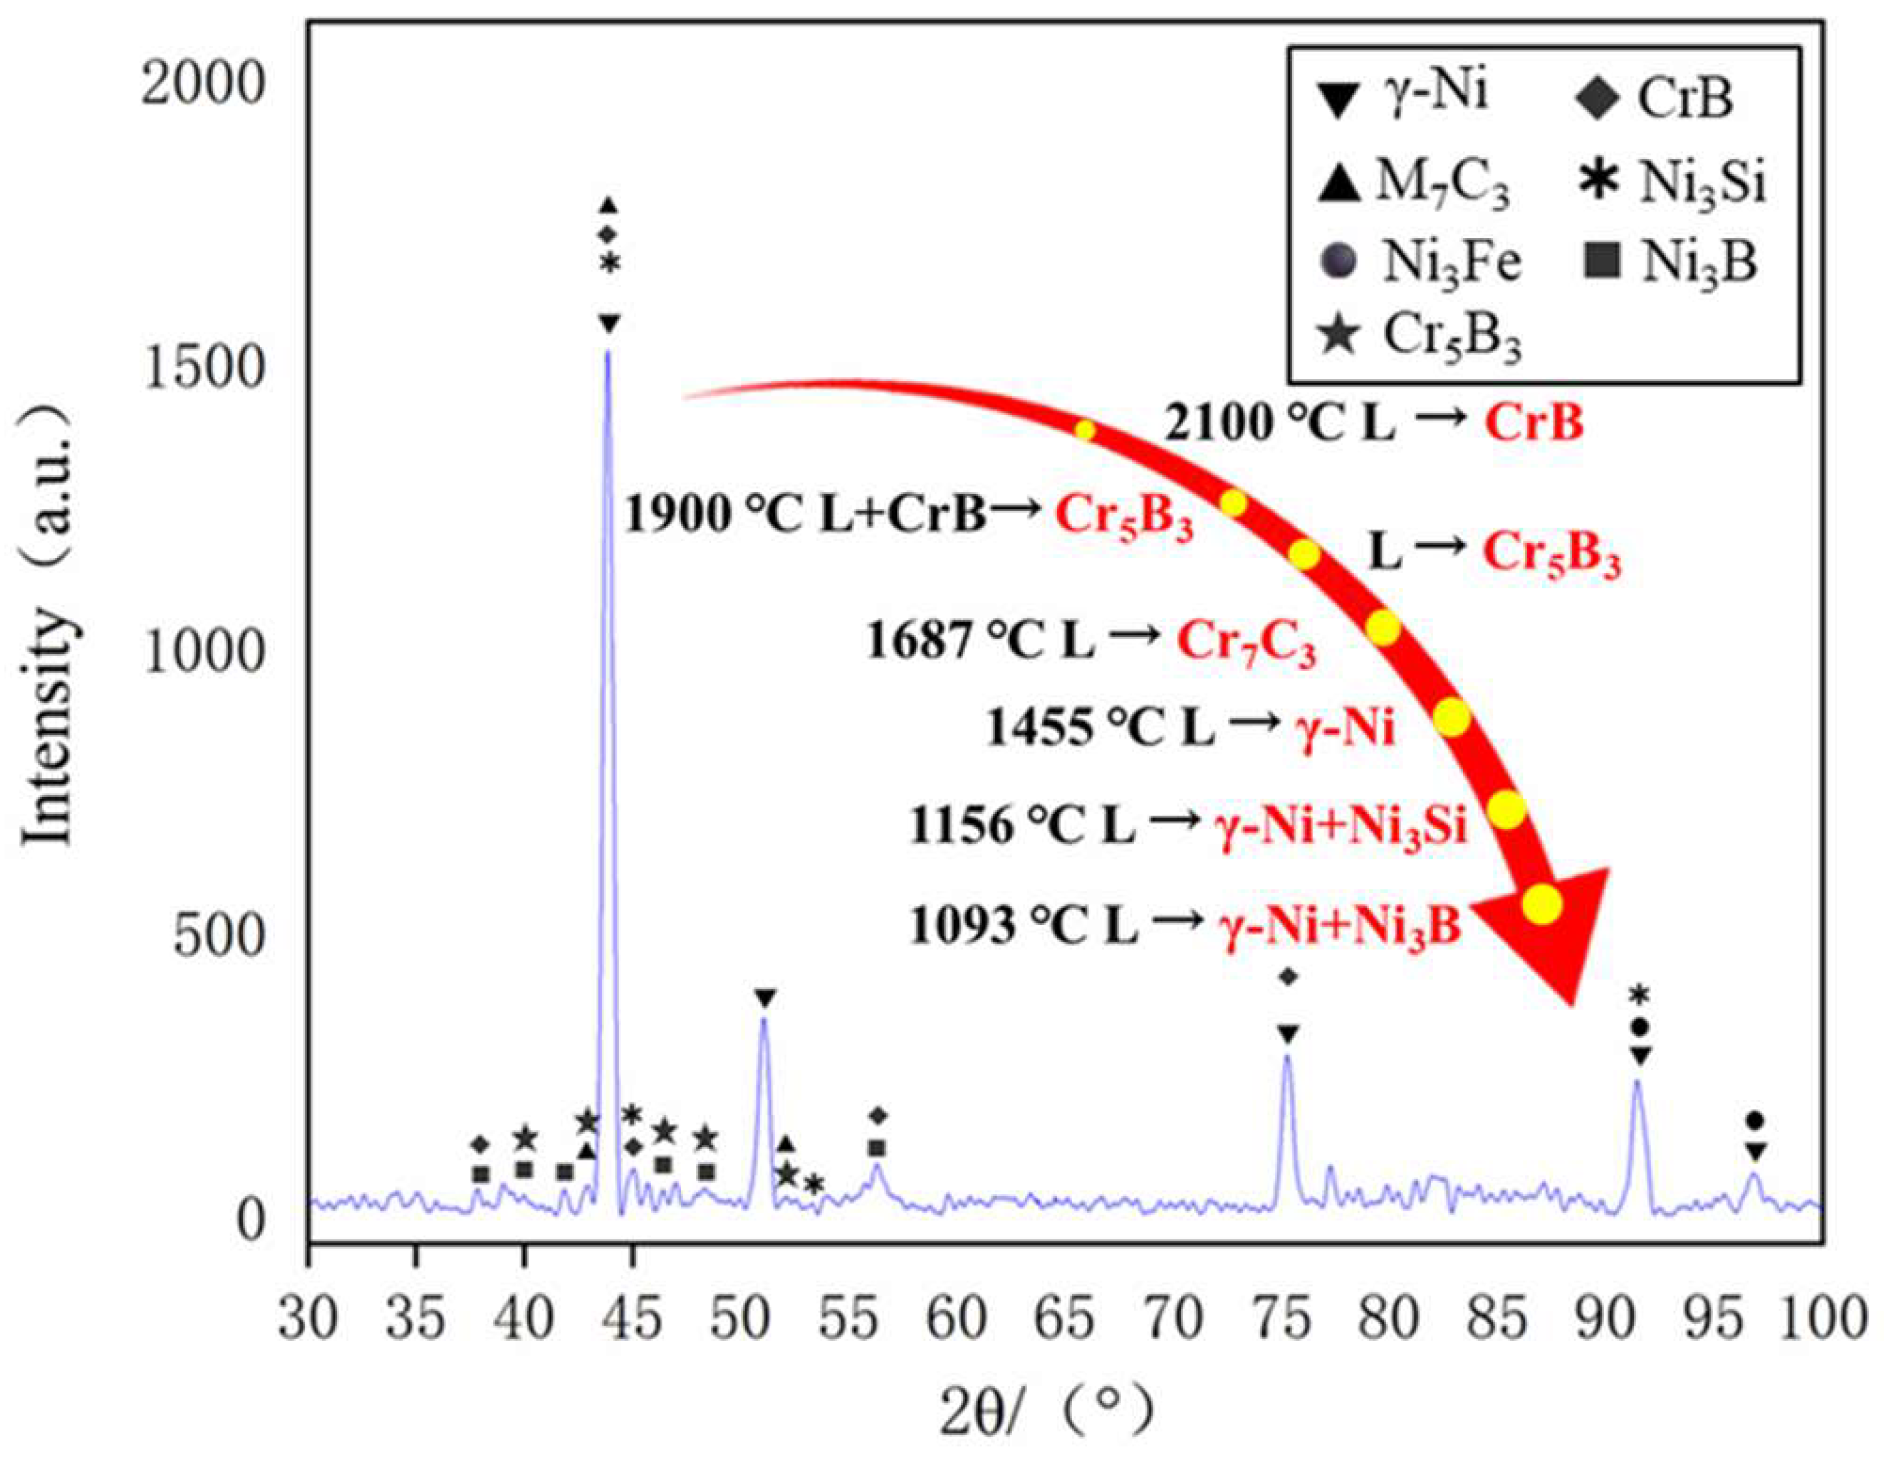
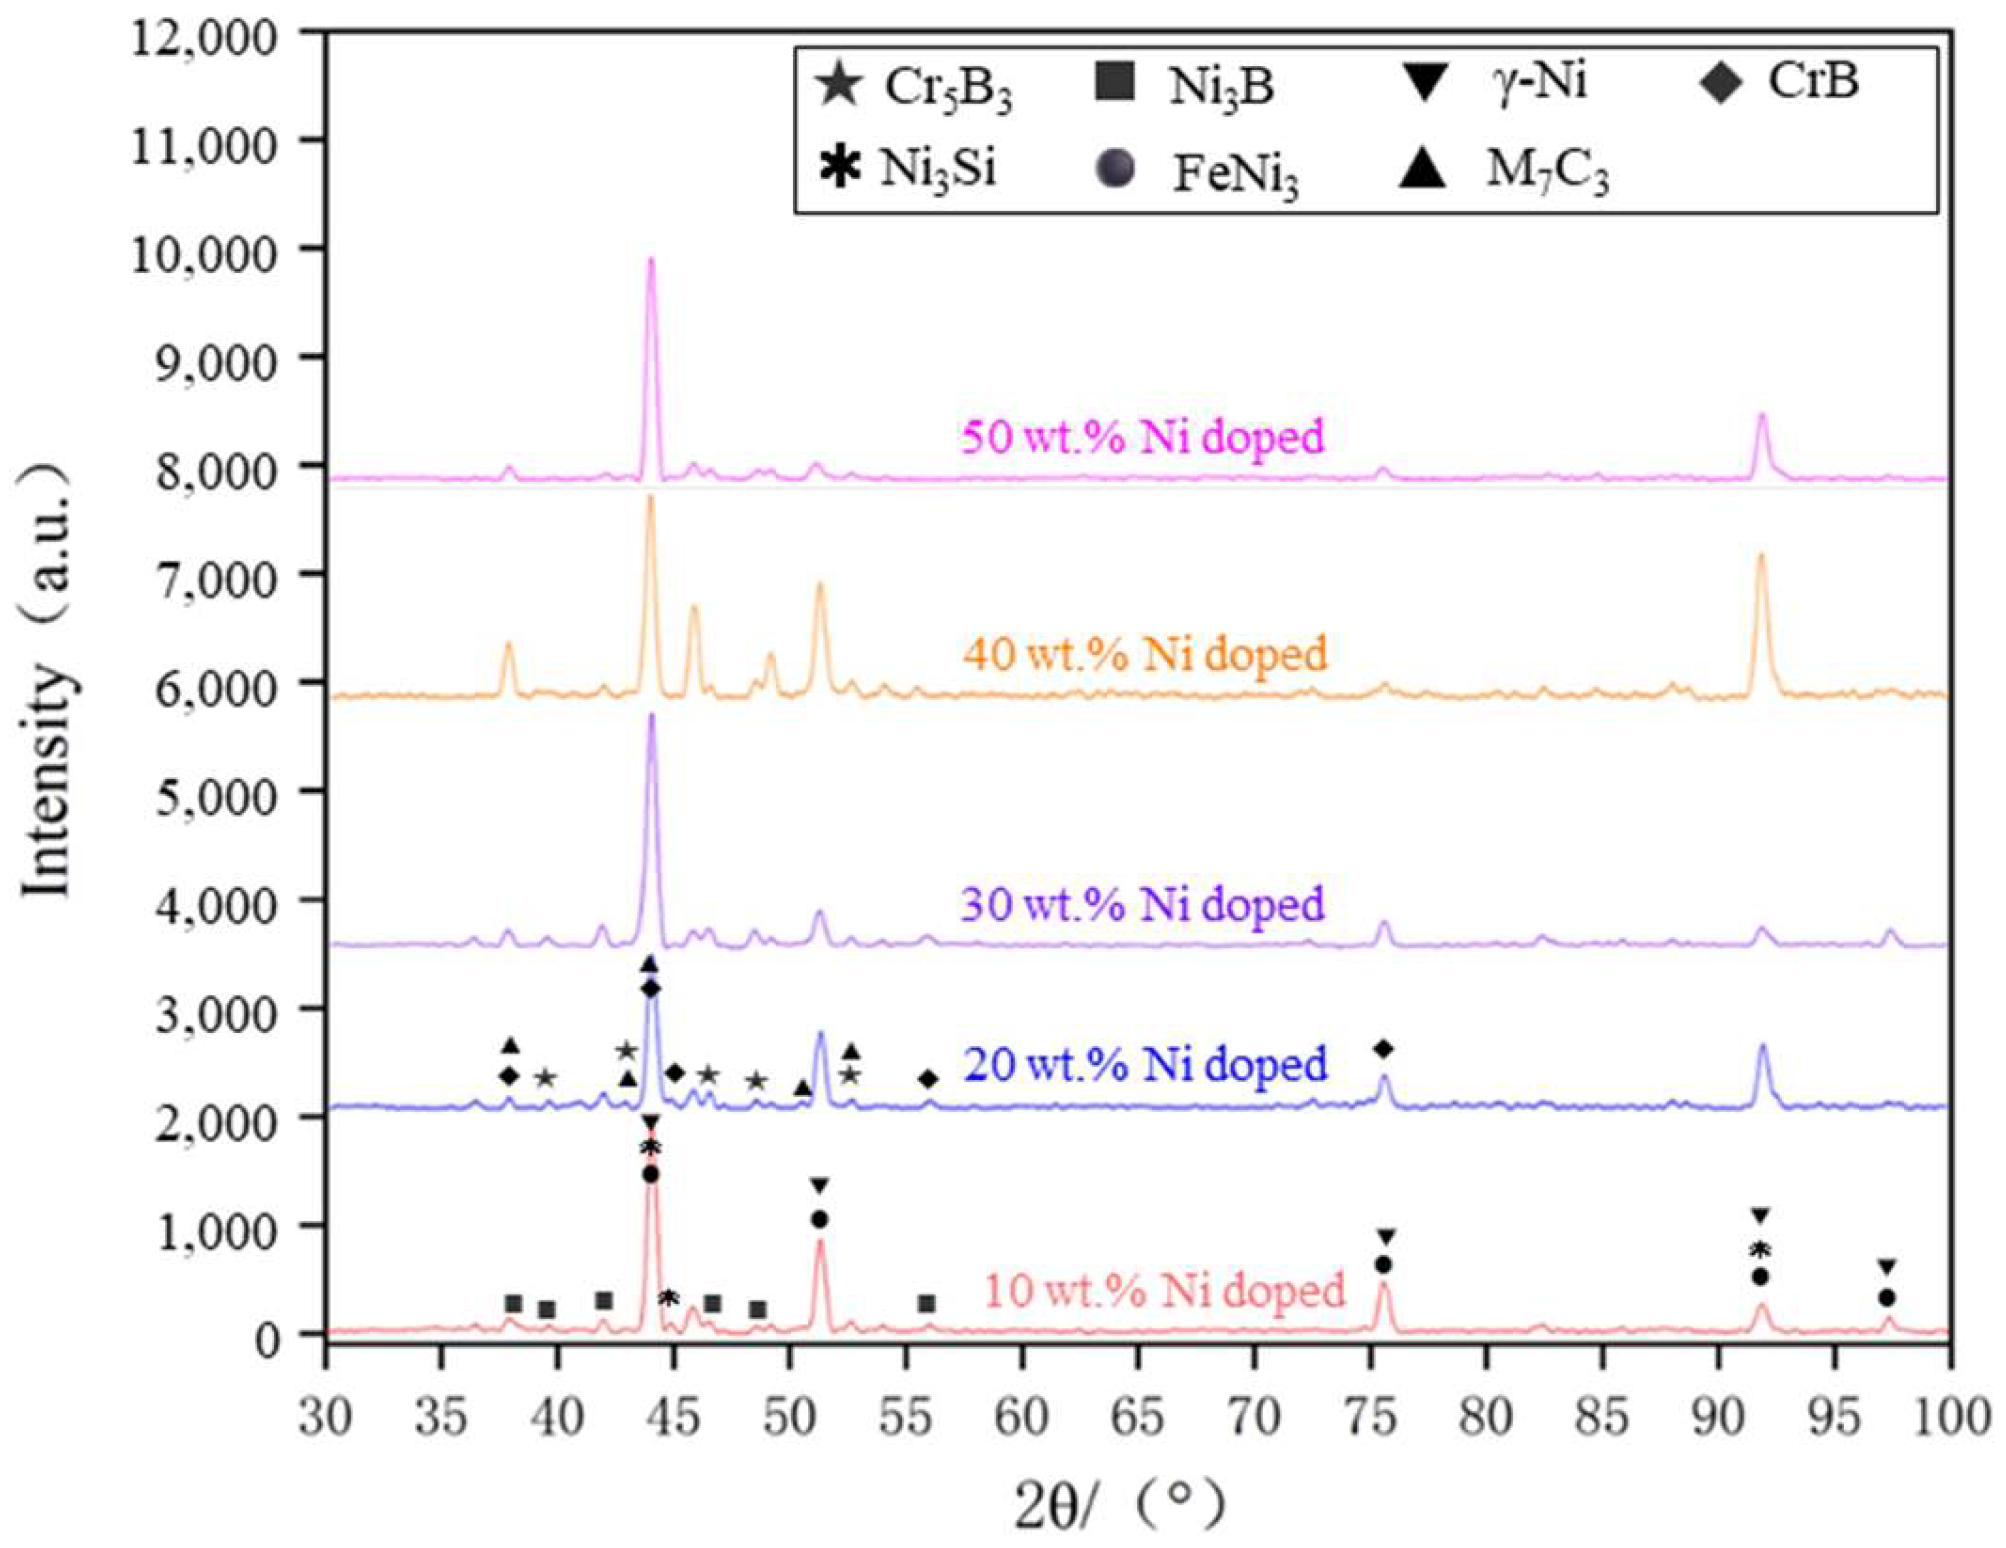
Figure 12 presents the XRD spectra of the coatings with varying levels of Ni doping. By analyzing the X-ray diffraction (XRD) spectra under different conditions of Ni doping, it is evident that the main phases of the coating consist of γ-Ni, M
7C
3 (M=Cr, Fe, Ni), Ni
3B, Ni
3Fe, Ni
3Si, CrB, and Cr
5B
3. The positions of the diffraction peaks for the coating phases under various transition conditions remain largely consistent, with differences observed only in the intensity of some peaks. An analysis of the XRD spectra suggests that the main phase composition of the cladding layer is similar across different transition schemes, indicating that the transition method effectively preserves the material’s inherent phase properties.
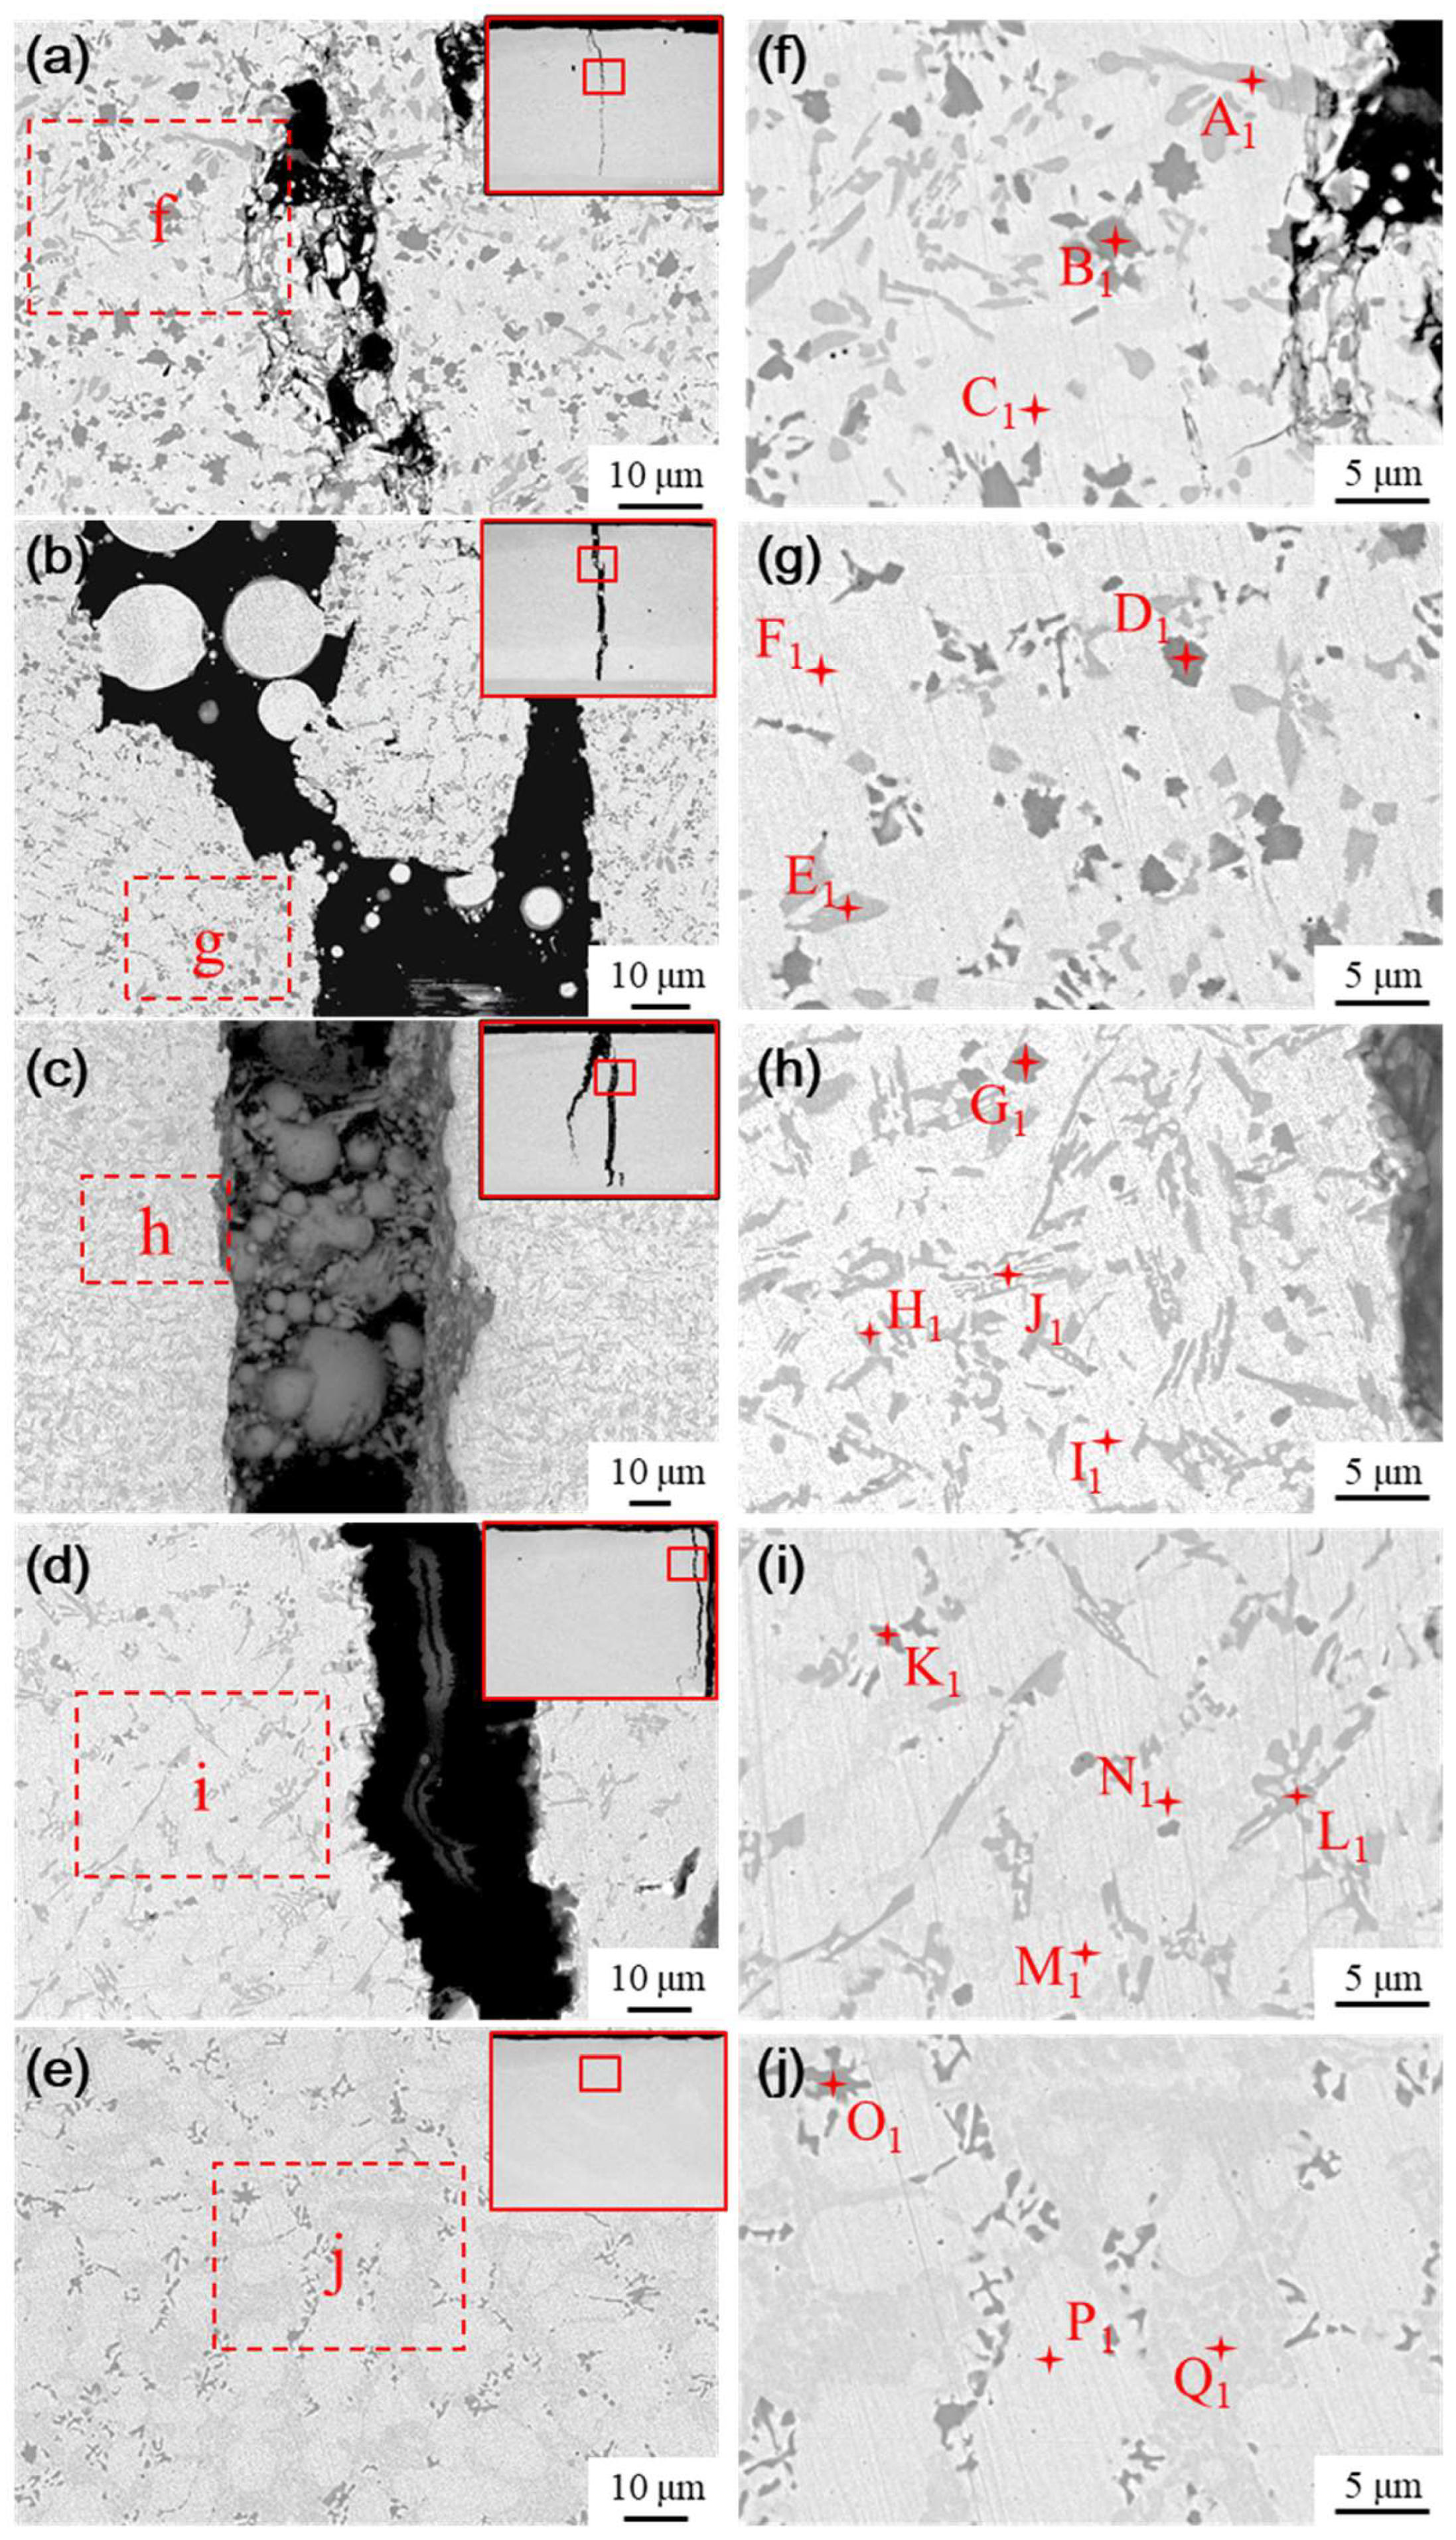
The microstructure of the fused cladding layer with different transition schemes was examined using SEM, as shown in
Figure 13. As a result of laser remelting, some Ni elements from the transition layer diffuse into the cladding layer, thereby influencing its physical phases. As the Ni content infiltrating the molten cladding increases, both the quantity and size of the black and gray precipitated phases decrease, while the proportion of ductile phases in the substrate increases. The microstructure evolves from a single white basal phase to a coexistence of white and gray phases, along with the emergence of a new phase in
Figure 13b, characterized by clusters of gray precipitated phases interspersed within the white basal phase.
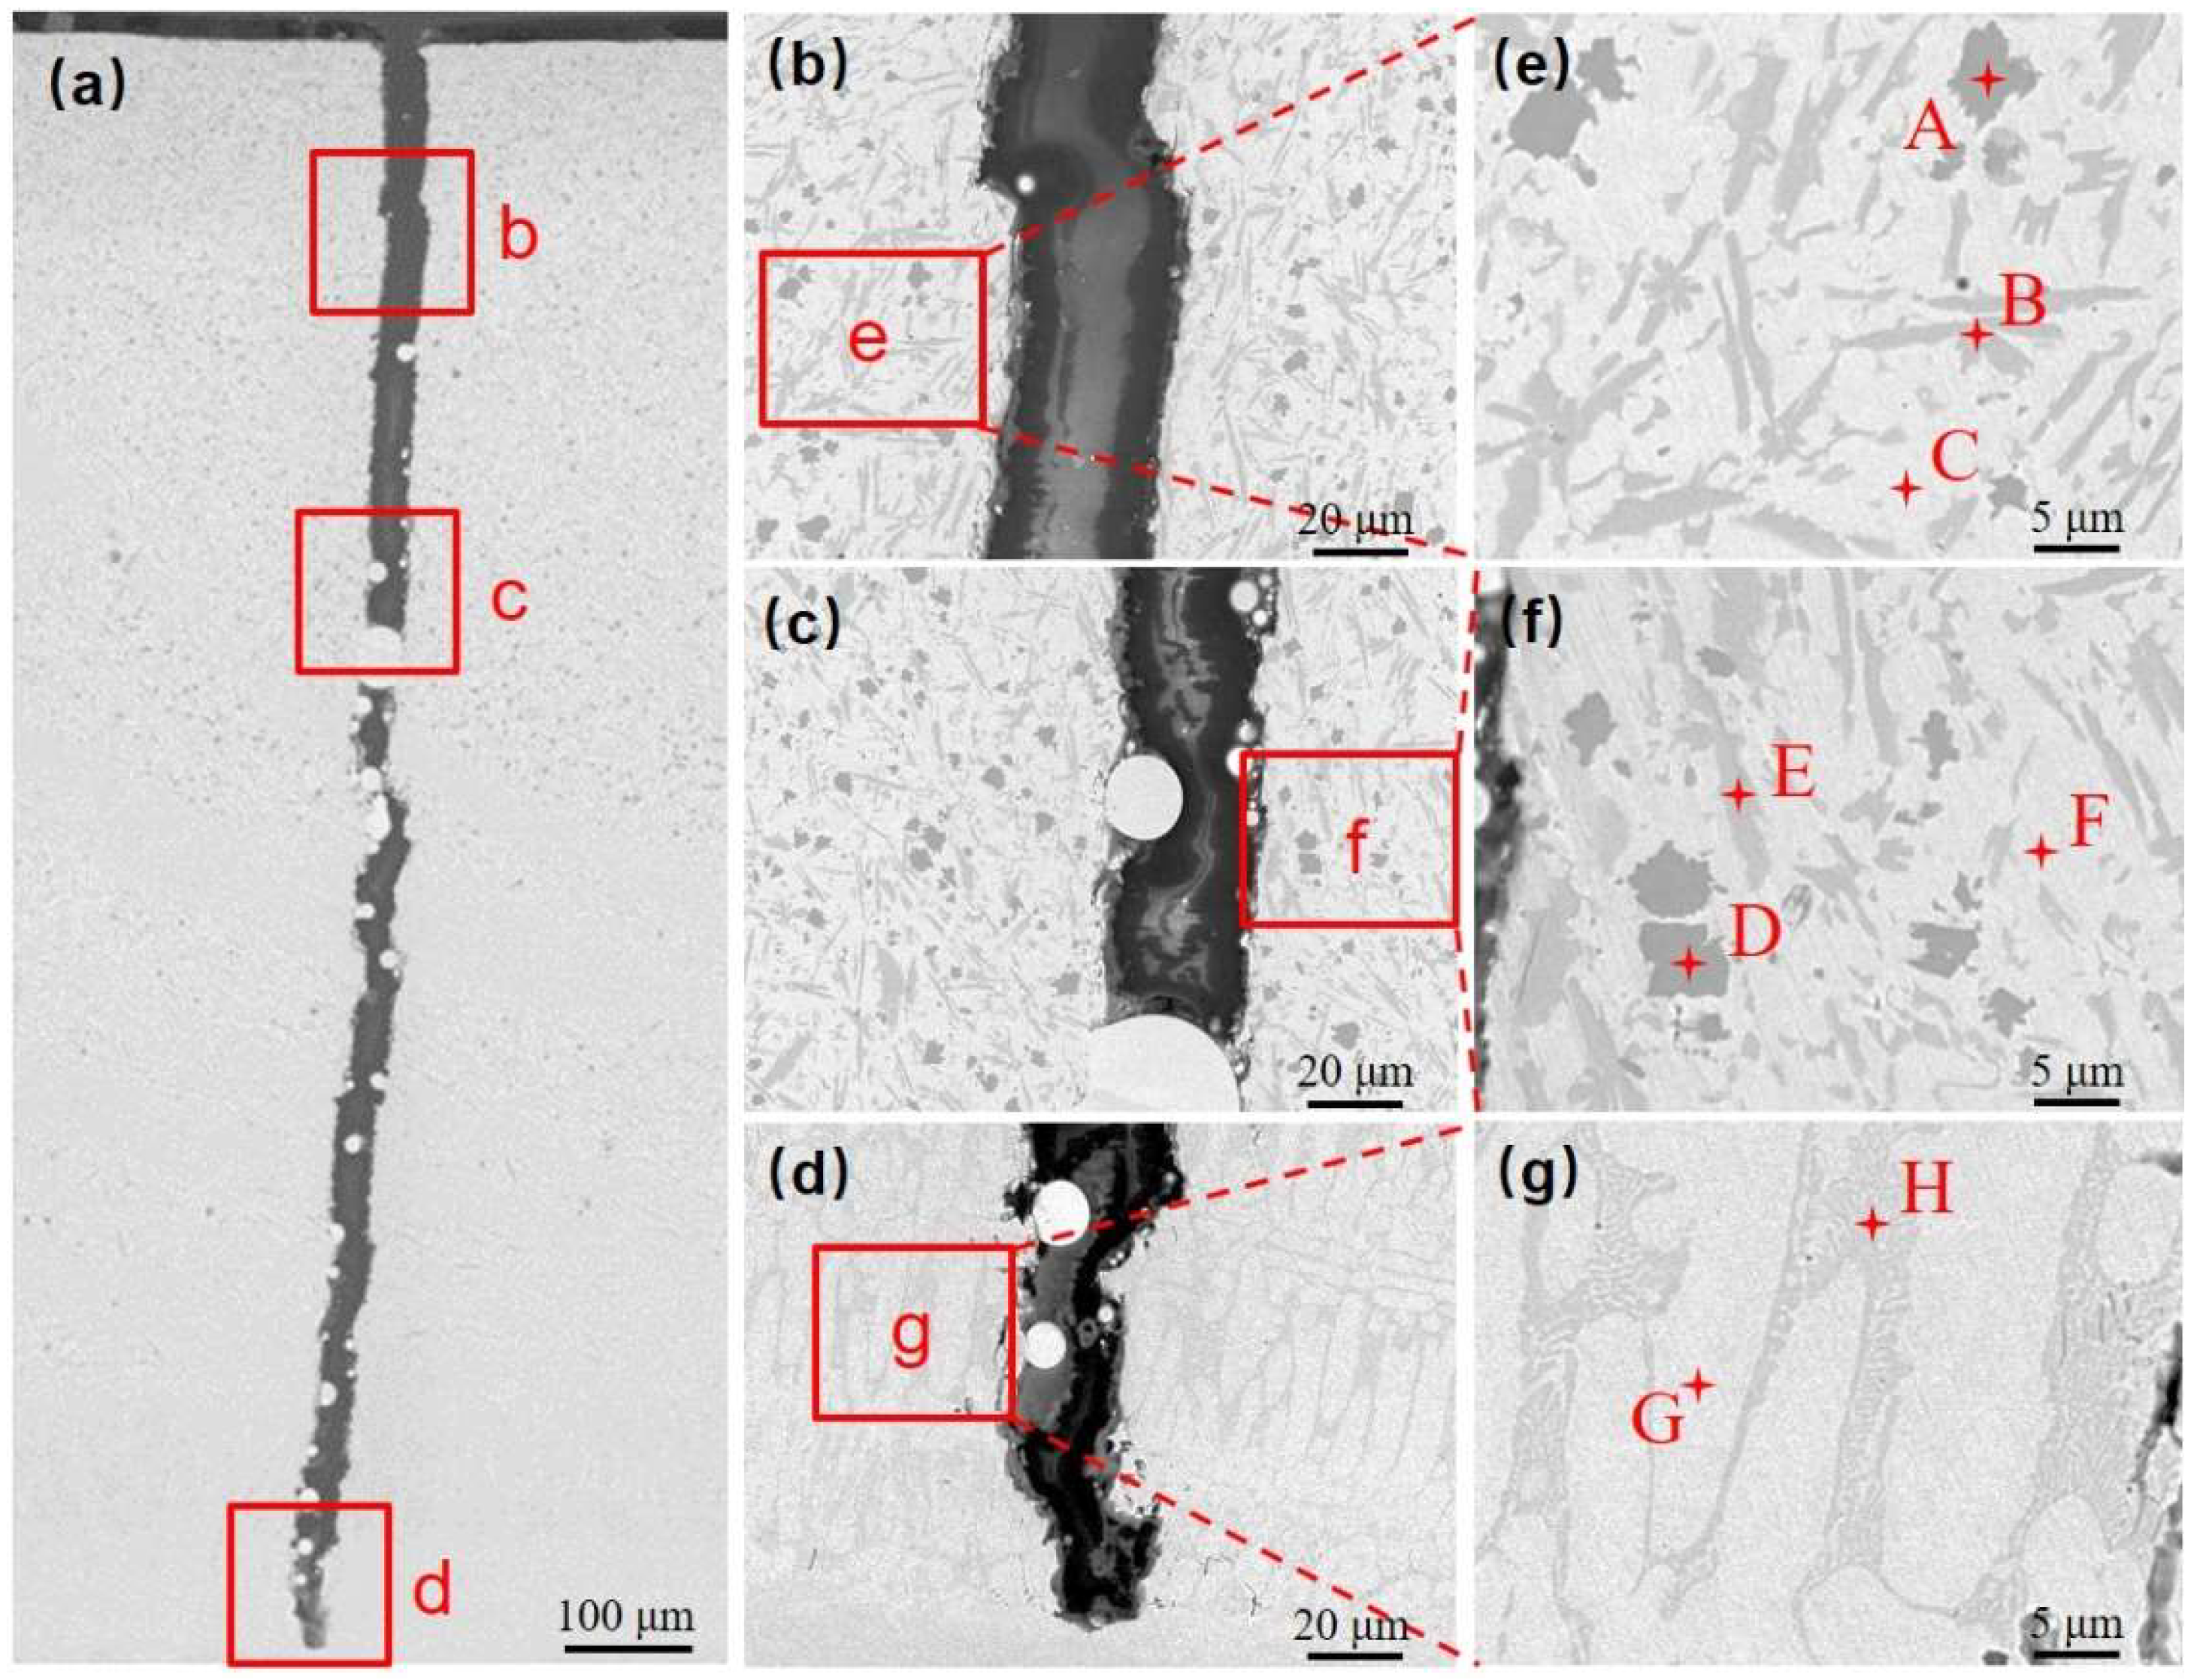
Energy Dispersive Spectroscopy (EDS) was conducted to analyze the elemental composition of the typical physical phases in the medium fusion cladding layer, with the results presented in
Table 6. The physical phases of the fused cladding layers prepared under transition schemes a and b are similar to the microstructure of the pure Ni60B coating. This similarity arises from the lower content of Ni elements infiltrating the fused cladding layer, which helps preserve the physical phase characteristics of the original Ni60B coating. The main constituent elements of the massive black phase (point B
1 and point D
1) are Cr and B, and the atomic ratio is close to 1:1, so the black precipitation phase is CrB. The primary constituent elements of the irregular strip phase (points A
1 and E
1) are mainly Cr and C, along with higher concentrations of Ni and Fe. This analysis is significant because the atomic radii of Ni (0.352 nm), Cr (0.288 nm), and Fe (0.287 nm) are extremely similar, facilitating their interchangeability [
31]. The combined atomic ratios of these three main metal elements, along with carbon, approximate to 7:2, indicating that the gray phase is M
7C
3 (where M=Cr, Fe, and Ni). The borides and carbides of Cr have a larger ΔGf than the corresponding compounds of Fe and Ni, so Ni60B coatings will preferentially form borides and carbides of Cr. During solidification, chromium borides precipitate first, followed by the nucleation of chromium carbides that attach to the initially precipitated borides. As the chromium carbide grows, it ultimately forms irregular radial structures [
29]. The white basal ductile phase (points C
1 and F
1) consists of a γ-Ni solid solution rich in Fe and a small amount of Si. The combined Fe and Ni elements exhibit good mutual solubility [
31]. The white basal phase is a γ-Ni solid solution, while the gray basal phase comprises a Ni-B-Si eutectic structure formed from Ni
3Fe, Ni
3B, and Ni
3Si.
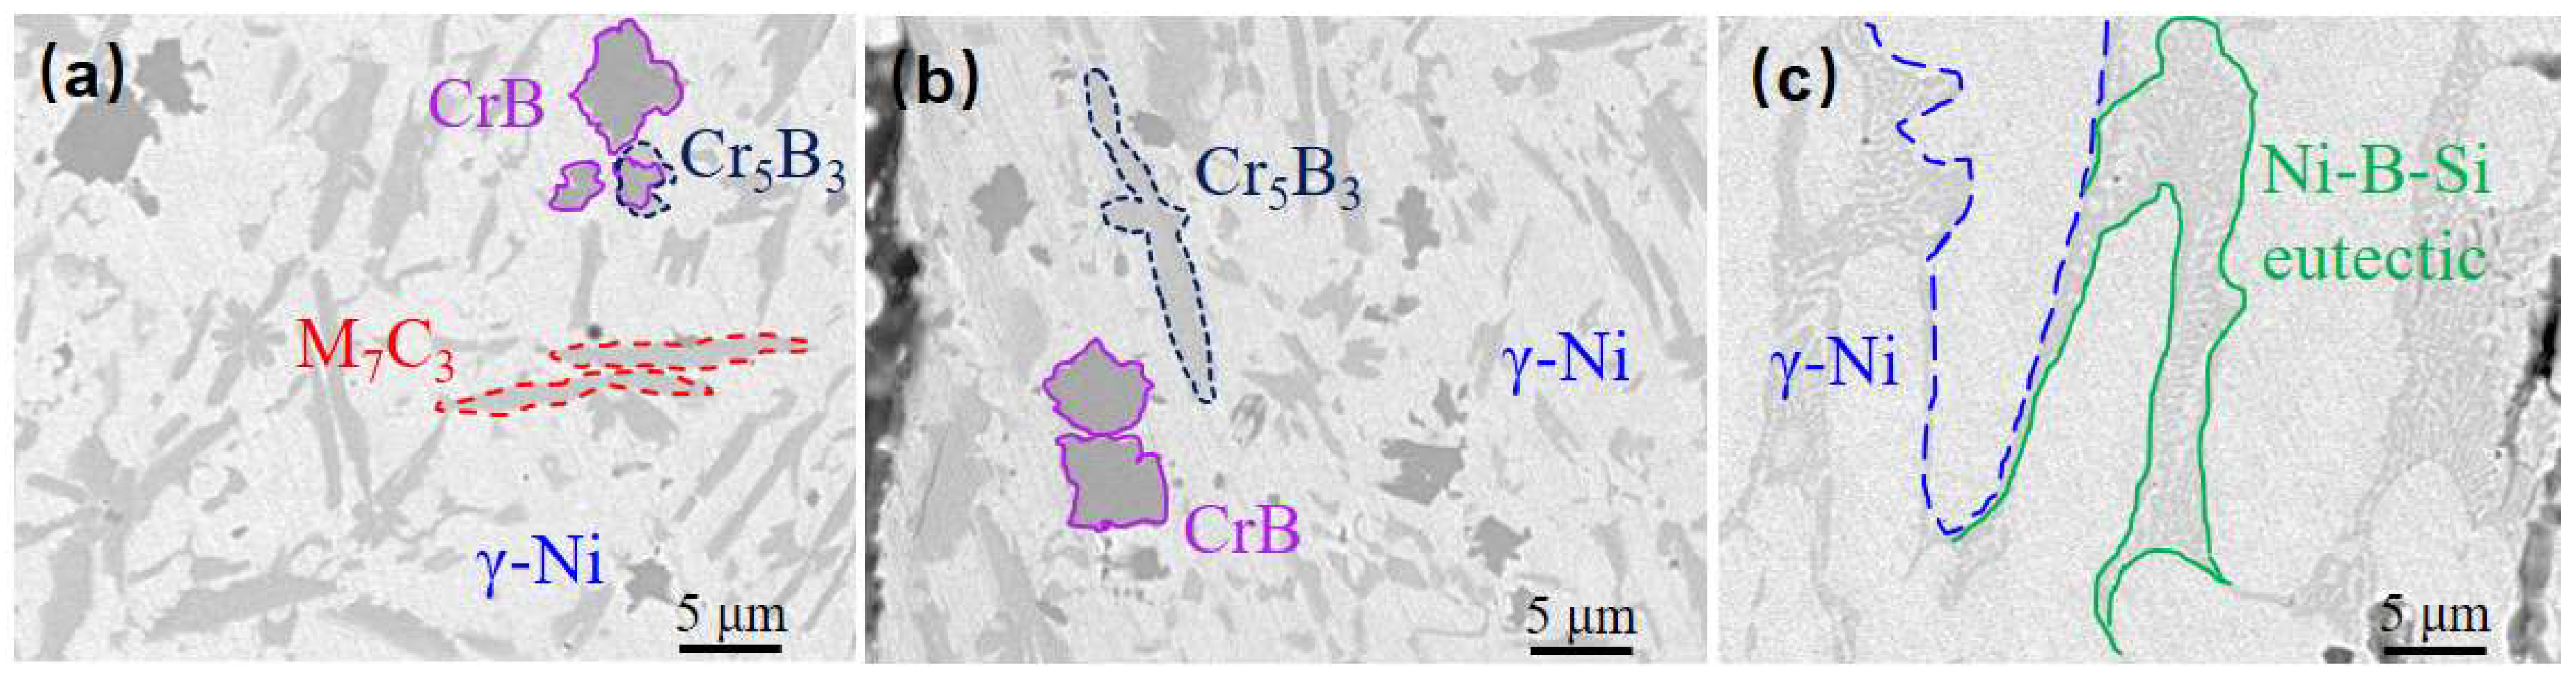
As shown in
Figure 13c, when the mass fraction of nickel doping in the transition layer reaches 60% (scheme c), the physical phase of the coating produces more obvious changes compared with the physical phase characteristics of the pure Ni60B coating. The black massive hard phase (point G
1), the gray irregularly striated phase (point J
1), and the white basal phase (point I
1) are consistent with previous observations, identified as CrB, M
7C
3, and a γ-Ni solid solution, respectively. Additionally, a gray precipitated phase interspersed with the white basal phase appears as a flower cluster phase (point H
1), primarily composed of B, Cr, Fe, and Ni. This physical phase is presumed to be a eutectic microstructure consisting of Cr
2B + γ-Ni, based on the existing literature [
30,
35]. This assumption is supported by the fact that after the precipitation of hard phases like CrB and M
7C
3, the remaining Ni content is insufficient to form a substantial number of eutectic crystals comprising Ni
3B, Ni
3Si, and Ni
3Fe. The symmetric equivalence transition occurs at 1222 °C, allowing the eutectic microstructure to precipitate directly from the liquid phase. The main physical phases of transition scheme c include M
7C
3, a γ-Ni solid solution, a eutectic composed of Cr
2B and Ni, and a small amount of fine CrB.
With the further enhancement of nickel doping in the transition layer, as shown in
Figure 13d and
Figure 14e, the percentages of the lumpy black phase and the gray irregularly striped phase decreased significantly. The basal phase transitioned from a purely white phase to a coexistence of both white phase (dots M
1 and P
1) and gray phase (dots N
1 and Q
1). Notably, the gray basal phase contains a higher concentration of B elements compared to the white basal phase. This change can be attributed to the infiltration of a substantial amount of nickel into the cladding layer, resulting in significant alterations in the elemental composition during the solidification process. Consequently, a large quantity of Ni interacts with B, Si, and Fe elements to form a eutectic structure composed of Ni
3B, Ni
3Si, and Ni
3Fe, among others. Therefore, the main physical phases under the aforementioned transition schemes consist of a γ-Ni solid solution, Ni-B-Si eutectic, and a small amount of boride and carbide hard phases. In summary, as the content of Ni elements infiltrating the transition layer increases, both the number and size of the hard phases in the fusion-coated layer decrease, while the size and proportion of the γ-Ni tough phase increases, which enhances the toughness of the coating to some extent.
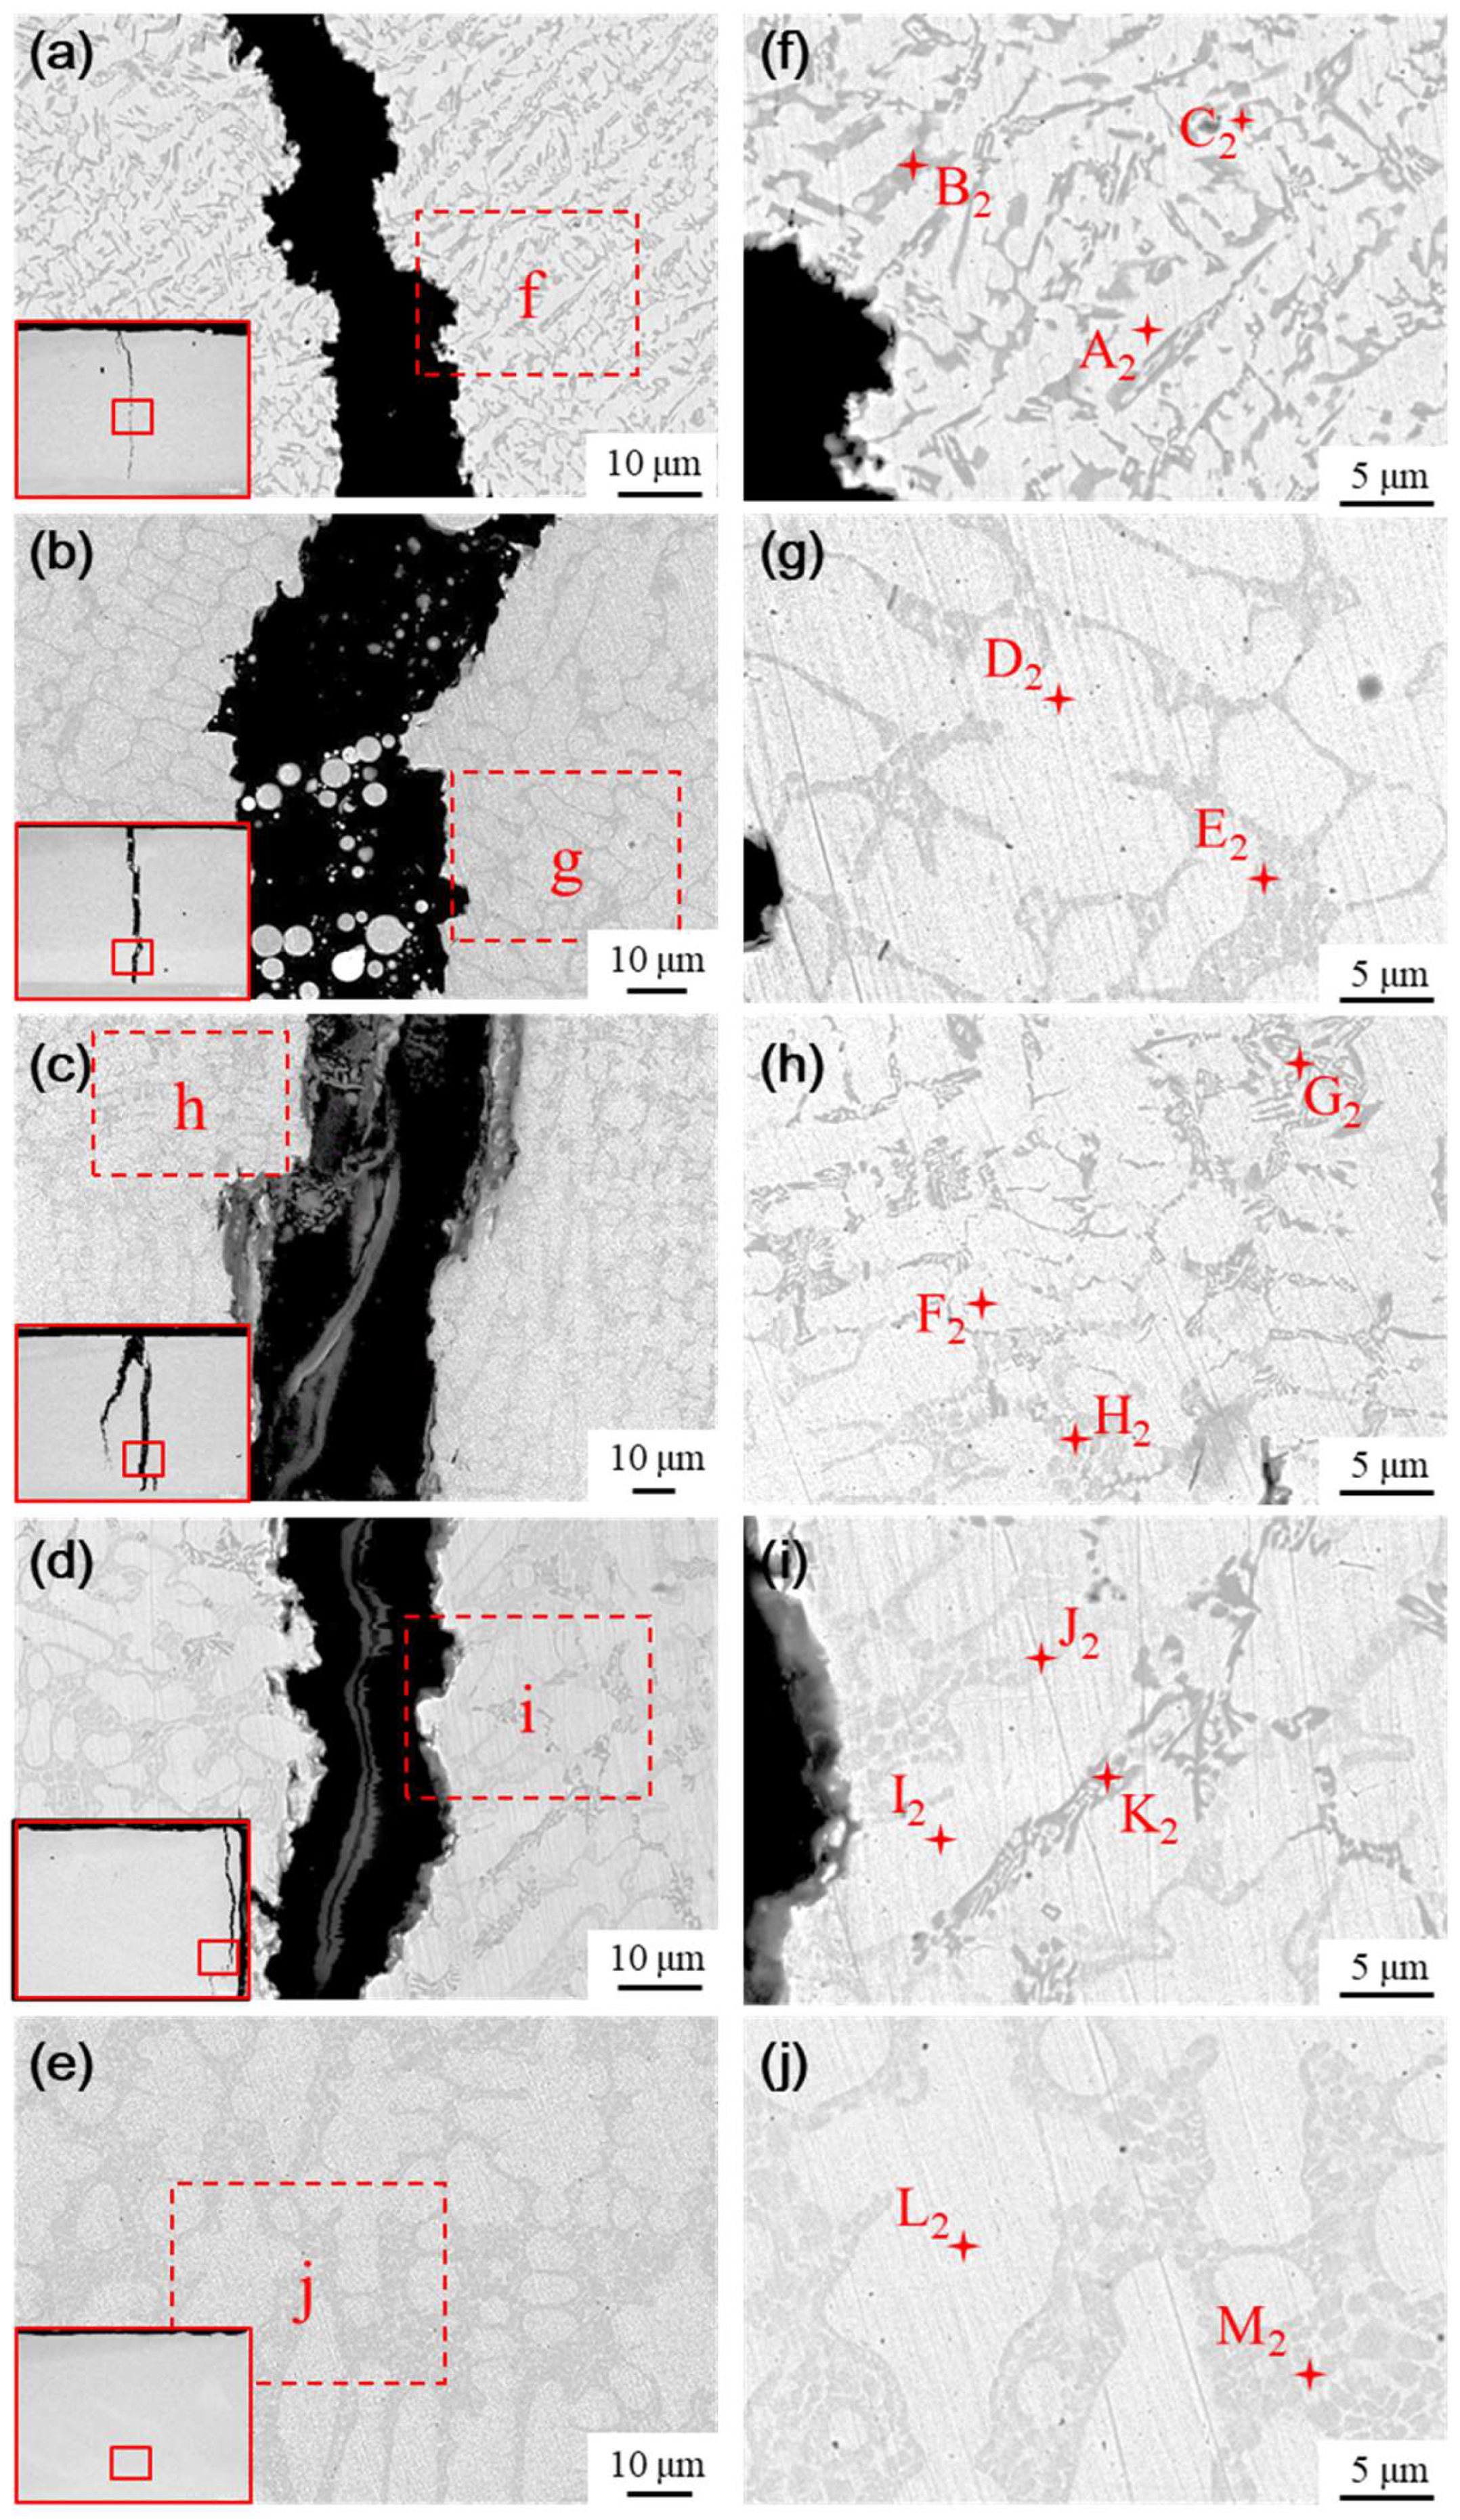
The microstructure of the transition layer is illustrated in
Figure 14. The physical phase characteristics in the transition layer significantly differ from those of the fused cladding layer; specifically, the black and gray precipitated hard phases nearly disappear as the content of the Ni element increases. The predominant phases in the transition layer are primarily white and gray basal phases, accompanied by a small number of gray precipitated phases and flower cluster-like phases interspersed among the white basal phases. The elemental composition of the typical phases in the transition layer was analyzed using EDS, with the results presented in
Table 7. The phases formed in the transition layer under various transition schemes are similar, primarily consisting of Cr
2B + γ-Ni eutectic structures (points B
2, E
2, and J
2), with flower cluster-like phases situated between the gray precipitated phases and the white basal phases, as well as gray basal phases formed by Ni-B-Si eutectic structures (points D
2, F
2, I
2, and L
2), and γ-Ni solid solutions with white basal phases (points A
2, C
2, G
2, H
2, and K
2).
As nickel doping in the transition layer increases, the number of hard phases decreases or even vanishes, while the size and proportion of the base toughness phase increase, enhancing the toughness of the transition layer. The high concentration of Ni elements in the transition layer inhibits the precipitation of hard phases to some extent, leading to the formation of γ-Ni solid solutions and Ni-B-Si eutectic structures, along with a small amount of Cr2B + γ-Ni eutectic phases.
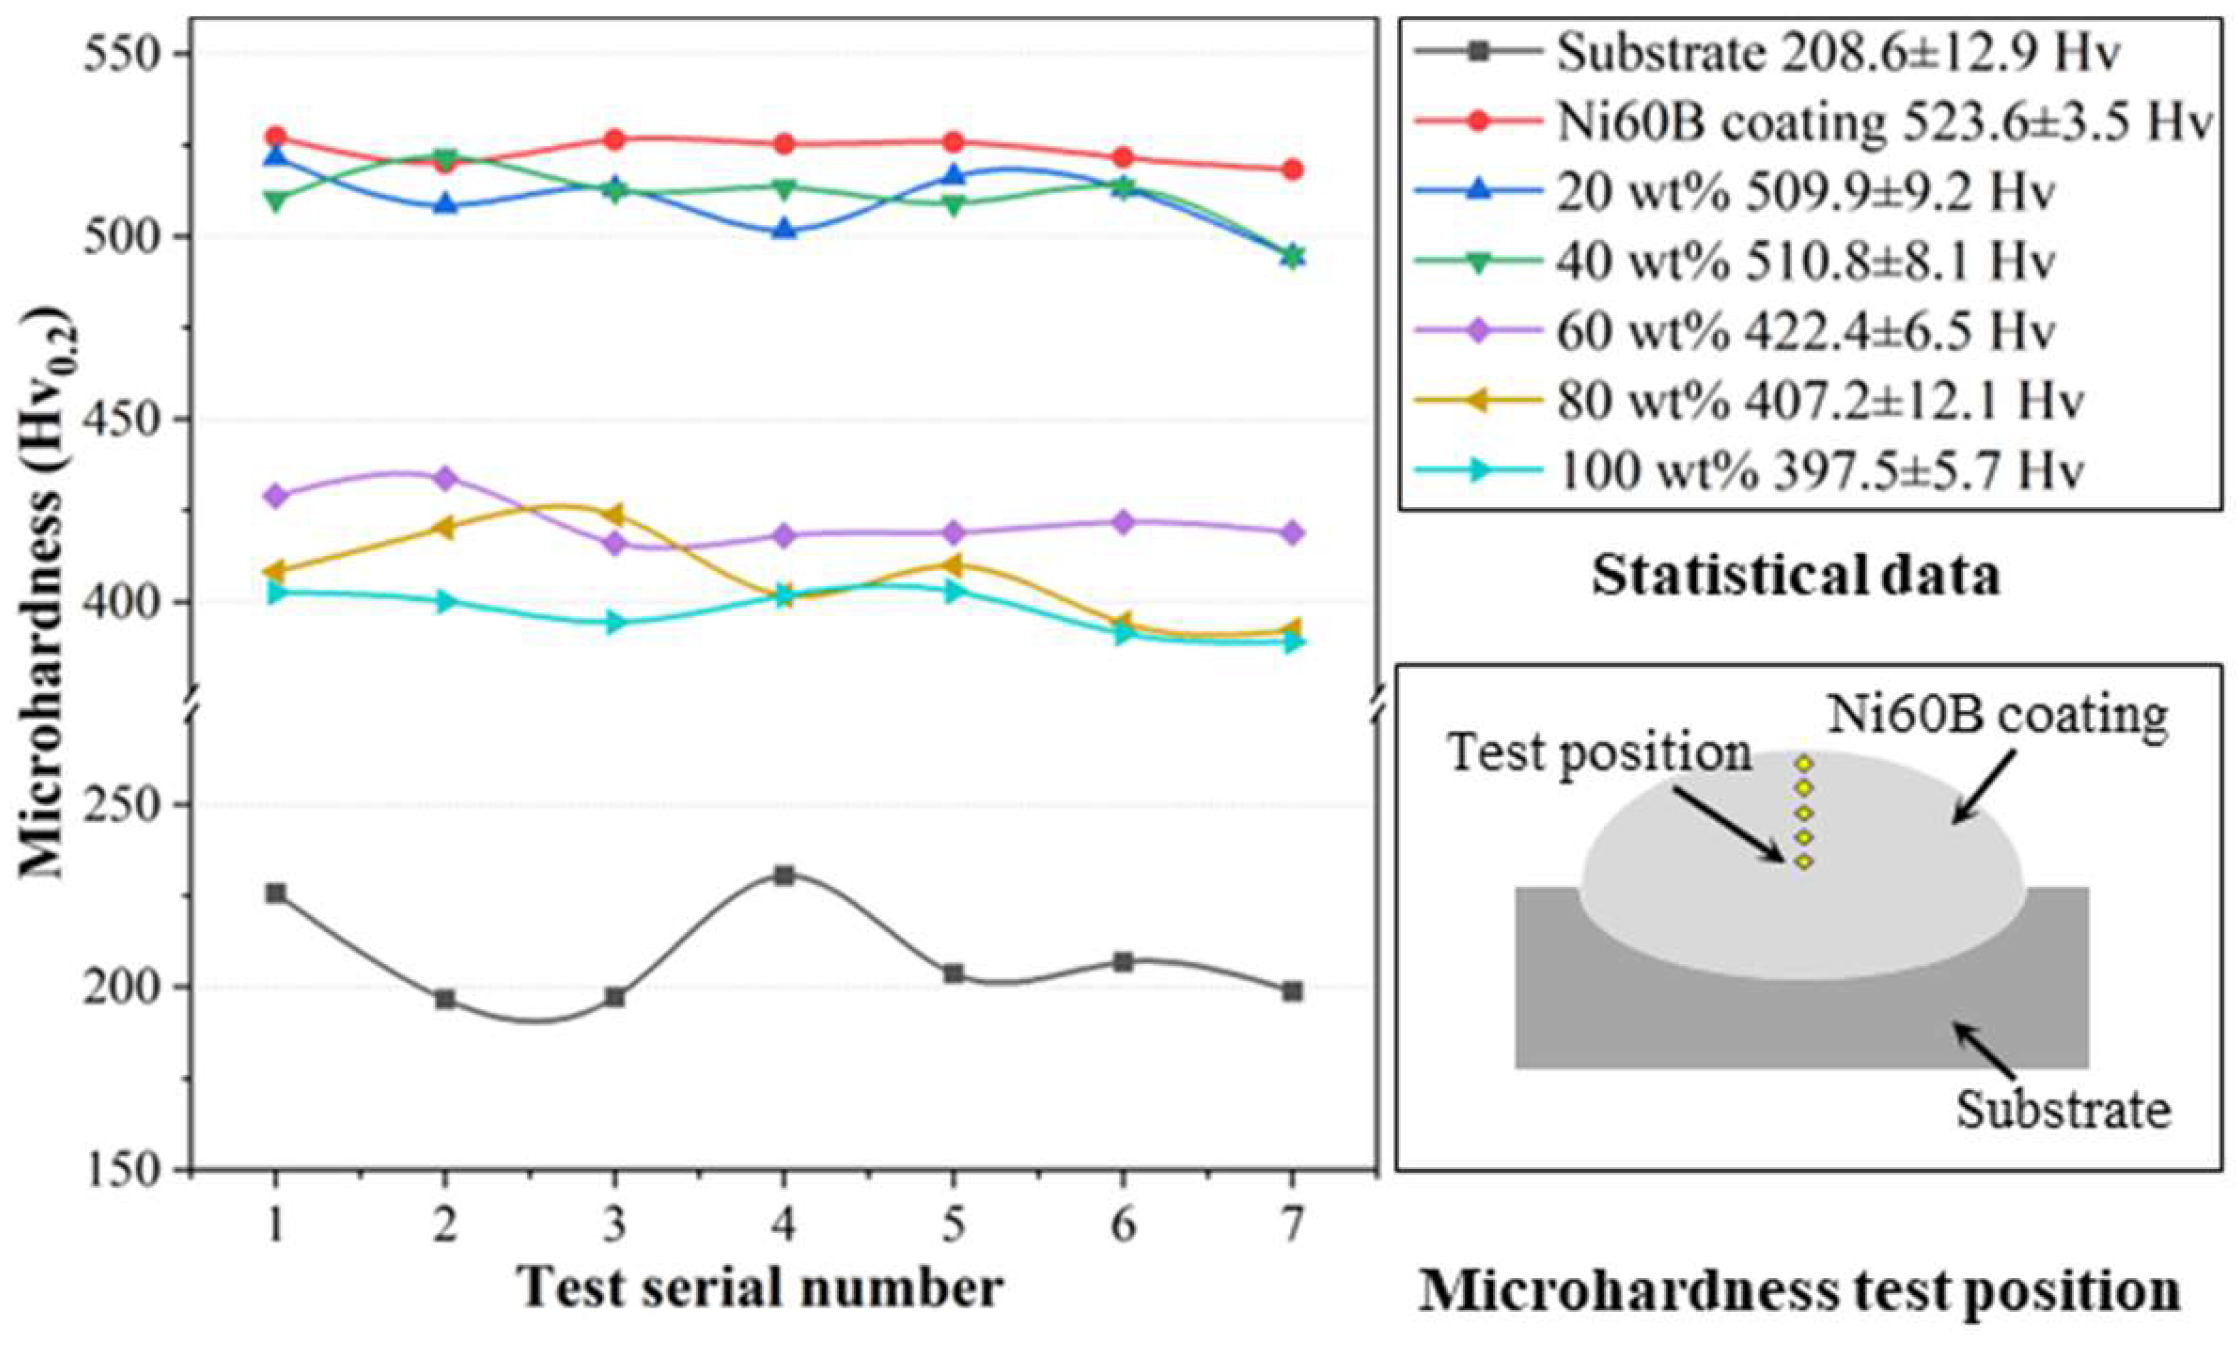
3.2.3. Effect of Different Transition Schemes on the Microhardness of Coatings
The microhardness curves are illustrated in
Figure 15, demonstrating that the microhardness values of the fused cladding layer under each transition scheme are relatively consistent, indicating good uniformity in the fused cladding layer. The average microhardness of the Ni60B coating fabricated directly on the substrate reached 523.6 ± 3.5 HV
0.2, which is a 2.52-fold increase compared to the 208.6 ± 12.9 HV
0.2 of the substrate.
The microhardness of the fused cladding layer gradually decreases with the increasing of Ni element doping, which weakens the diffuse strengthening effect of the low-microhardness phases in the coating [
36,
37]. However, a higher concentration of Cr atoms is solidly dissolved in the γ-Ni solid solution, enhancing its microhardness properties, while the Ni-B-Si eutectic also maintains good microhardness characteristics [
28]. These two factors contribute to the coatings with higher Ni doping still exhibiting commendable microhardness. Based on the differences in microhardness values, the coatings can be categorized into two groups corresponding to different transition schemes. The first group includes transition schemes a and b, with microhardness values similar to the original Ni60B coatings. The second group comprises transition schemes c, d, and e, which exhibit significantly lower microhardness than the original coatings. In the first group, the microhardness values reached 509.9 ± 3.5 HV
0.2, primarily due to the presence of borides and carbides in the fusion cladding, which enhance microhardness through a diffuse strengthening effect. In the second group, as the Ni content increased from 60 wt.% to 100 wt.%, the microhardness decreased from 422.4 ± 6.5 HV
0.2 to 397.5 ± 5.7 HV
0.2. Excessive Ni doping leads to this reduction. However, the microhardness remains significantly higher than that of the substrate (208.6 HV
0.2). Although the amount and size of hard phases in the coating are reduced, the solid solution strengthening effect is enhanced by the increased Cr elements in the γ-Ni solid solution. Furthermore, the eutectic structures comprising Cr
2B + γ-Ni and Ni-B-Si also contribute to higher microhardness [
28].
In summary, while introducing a transition layer with varying Ni content suppresses cracking in the coating, excessive Ni from the transition layer impacts the microhardness of the fusion cladding layer. Nevertheless, experiments indicate that within a certain range of Ni content in the transition layer, the effect on coating microhardness properties is minimal.


