3.2. Chemical Composition of Hemp Stalks
3.2.1. Extractive Content
The analyses provided crucial data on how HWE modifies the chemical profile of hemp shives, helping to evaluate the material potential for bioethanol applications. The effect of the HWE cycles on hemp extractive content was assessed using a chloroform and ethanol solvent mixture in a Soxhlet apparatus. The extractive content in the native hemp and hemp treated with V and XV cycles of HWE is shown in
Table 1.
The extractive content in hemp decreases after the HWE treatment. After V cycles, there is a noticeable decrease in the extractive content. In the first V cycles, extractives rapidly decreased, confirming the effectiveness of HWE in removing soluble, non-structural components. HWE can be an integral step in a biorefinery because these compounds inhibit downstream processes, such as enzymatic hydrolysis and fermentation. Extractive content values for hemp treated with HWE for V and XV cycles show no statistically significant differences. The values remain relatively stable between these two treatment cycles, indicating a plateau in extractive removal. Consistency among replicates was suggested by all measurements having standard deviations within ±0.3%. Between V and XV cycles, this stabilization most likely reflects the readily water-soluble, low-molecular-weight fraction depletion and diffuse mass transfer from the particle interior. The remaining extractives are less accessible or soluble under the applied conditions as extraction proceeds.
The study assessed the differences in extractive content between native and HWE-treated material caused by modifications. Statistical analysis of the collected data revealed significant differences in the parameters measured between native and pre-treated hemp biomass. According to the empirical statistics,
F(2, 9) = 28.191,
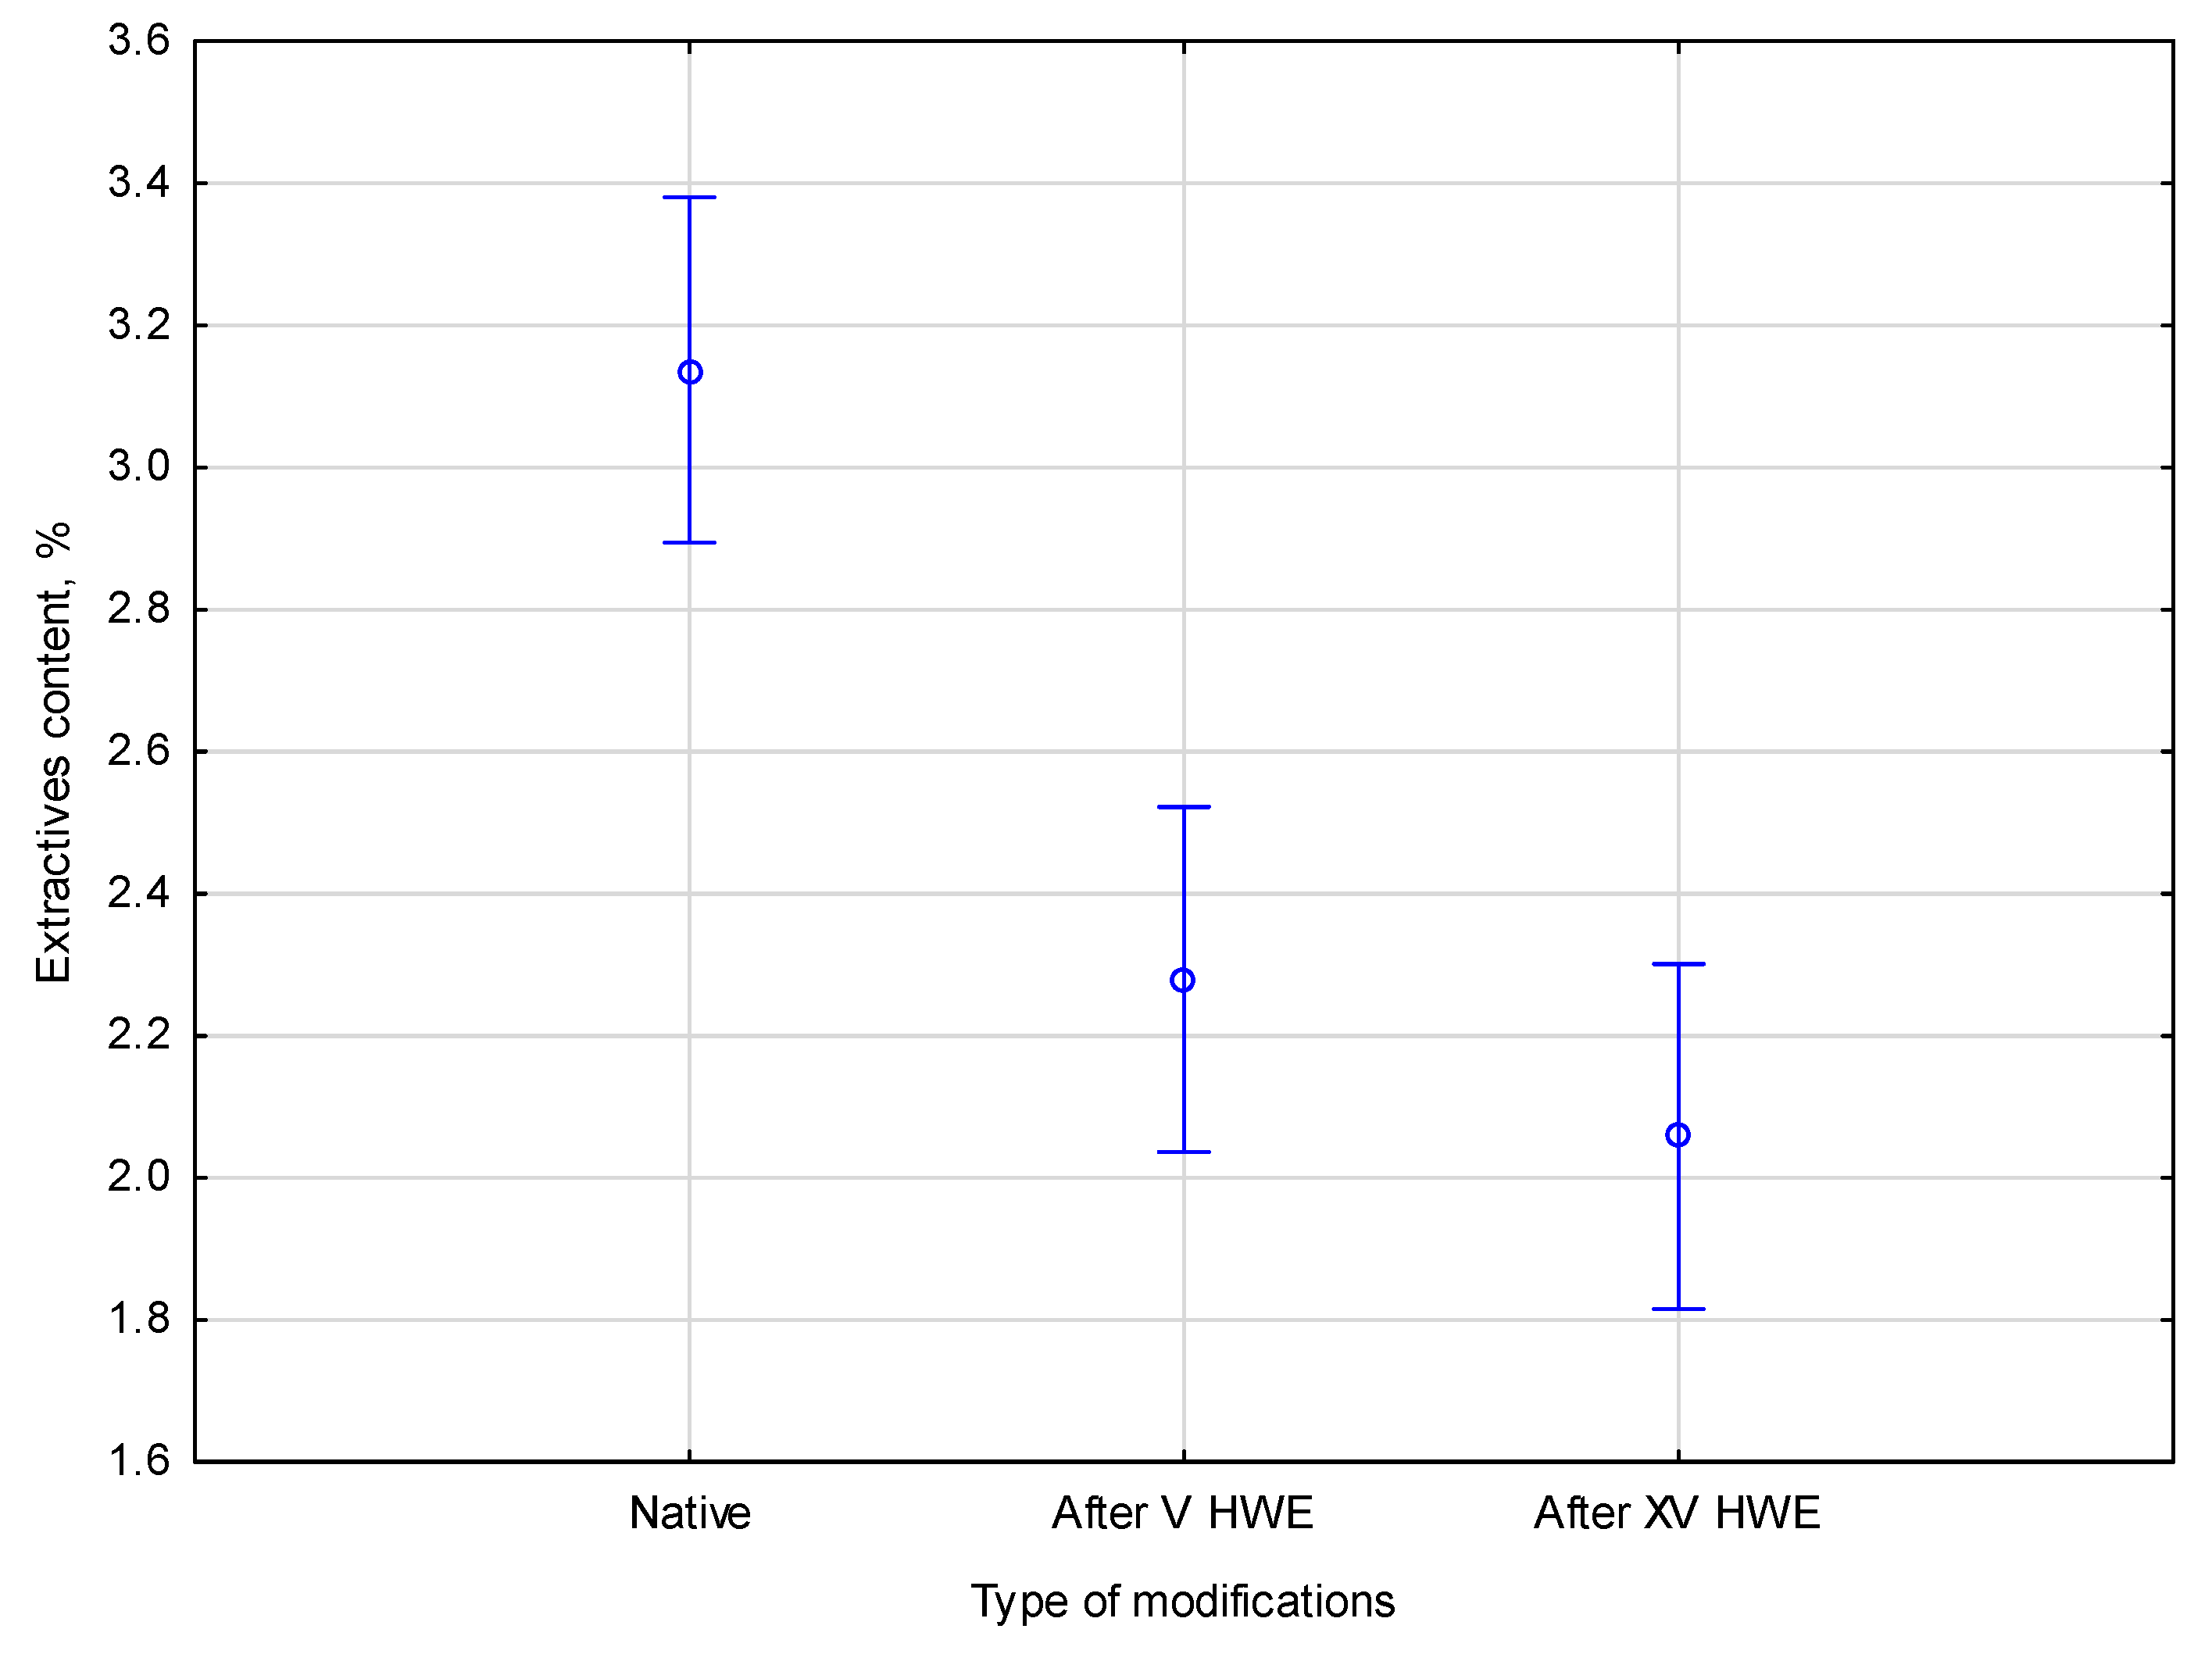
p = 0.00013. The relationship between extractive content in the native and HWE-treated material is presented in
Figure 1.
Based on the extractive content comparison shown in the Figure, it is found that the extractive content progressively decreases after the first V HWE cycles, dropping from 3.2 ± 0.2% in native hemp to 2.2 ± 0.3%, before stabilizing at 2.0 ± 0.1% after XV cycles. Therefore, most easily soluble extractives are removed in the early stages of treatment. According to Duncan’s post hoc test, the native material and the HWE-treated samples showed a significant difference (p < 0.05) between the two homogeneous groups. This confirms that the figure values do not result from substantial differences between the V cycle and XV cycle groups.
3.2.2. Cellulose Content
To assess the impact of multi-stage HWE on the main polysaccharide component, cellulose, detailed analyses were conducted. The percentage of cellulose in native hemp and hemp treated with V and XV cycles of HWE is presented in
Table 2.
The cellulose content in hemp increases with the number of HWE cycles applied. After V cycles, the extractive content already increased noticeably. The change is approximately 4.2% for the cellulose content of native hemp. With each additional HWE cycle, hemp’s cellulose content increases. Extractive content values for hemp treated with HWE for V and XV cycles also show statistically significant differences. The change is approximately 7.7% for the cellulose content of native hemp and 3.4% for the cellulose content of hemp after V HWE cycles. Consistency among replicates was suggested by all measurements having standard deviations within ±0.8%.
The samples were studied in their raw form and after being treated with HWE. To understand the effects of these treatments, the cellulose content was compared after V and XV cycles of HWE. The study assessed differences in cellulose content between the native and HWE processes, with a
p-value of 0.00025. Statistical analysis of the collected data showed significant differences in the parameters measured. The empirical statistics were equal (
F(2, 7) = 34.050). The cellulose content in the native and HWE-treated material is presented in
Figure 2.
An additional post hoc analysis was performed to confirm the trends shown in the figures. In native hemp, the cellulose content increased from 42.9% to 44.7% after V HWE cycles and to 46.2% after XV cycles. During treatment, hemicelluloses and extractives are removed, leading to the gradual enrichment of cellulose. Each of the parameters belonged to one of the three different homogeneous groups. As determined by the alpha significance level, p was below the significance threshold 0.05. Accordingly, the native, V cycle, and XV cycle groups all show statistically significant differences in cellulose content, and Duncan’s test confirms their homogeneity.
3.2.3. Lignin Content
The effect of the number of HWE cycles on acid-insoluble lignin (AIL) and acid-soluble lignin (ASL) content was compared. The AIL content was determined by removing polysaccharides by sulfuric acid hydrolysis. The ASL content was determined in post-hydrolysis liquid with UV–VIS spectrophotometry. The content of lignin in native hemp and hemp treated with V and XV cycles of HWE is presented in
Table 3.
HWE pre-treatment causes a decrease in the ASL content in hemp. There is already an apparent decrease in the ASL content after V cycles. There are no diametric variations between the ASL content values of hemp treated with HWE for V and XV cycles. Between these two treatment cycles, the results stay comparatively constant. The homogeneous group with HWE cycles statistically differed from the native-material homogeneous group. All measurements had standard deviations within ±0.4%, indicating consistency between multiple measurements.
Due to material loss during the HWE treatment, hemp’s AIL content slightly increases because of the HWE pre-treatment. Following the V and XV cycles, the AIL content is like that of the natural hemp material. The ASL content values of hemp treated with HWE for V cycles do not differ in a statistically significant way. Similarly, this is the case between V and XV HWE cycles. The above statistical situation created two homogeneous groups in this test. The outcomes remain relatively consistent between the two treatment cycles. Standard deviations for every measurement were within ±0.6%, suggesting that measurements were consistent.
Even though total lignin content remained statistically constant during HWE, the composition of its fractions shifted significantly. After V cycles, the acid-soluble lignin (ASL) content decreased, while the acid-insoluble lignin (AIL) content showed no statistically significant change. The percentage content refers to the weight of the material after pretreatments, where the material loss has occurred. Statistical analysis was conducted to determine how the number of HWE cycles affects the content of acid-insoluble lignin (AIL) and acid-soluble lignin (ASL). To analyze the impact of these treatments, the lignin content was compared after V and XV cycles of HWE.
ASL decrease suggests that loosely bound lignin fragments have been solubilized and removed. At the same time, relative increases in AIL indicate a concentration of the more resistant structural lignin in the solid residue. By selectively modifying the lignin matrix, HWE can enhance the accessibility of polysaccharides for enzymatic degradation. Based on a
p-value of 0.10081, no significant differences were found between types measured in percent content. The empirical statistic,
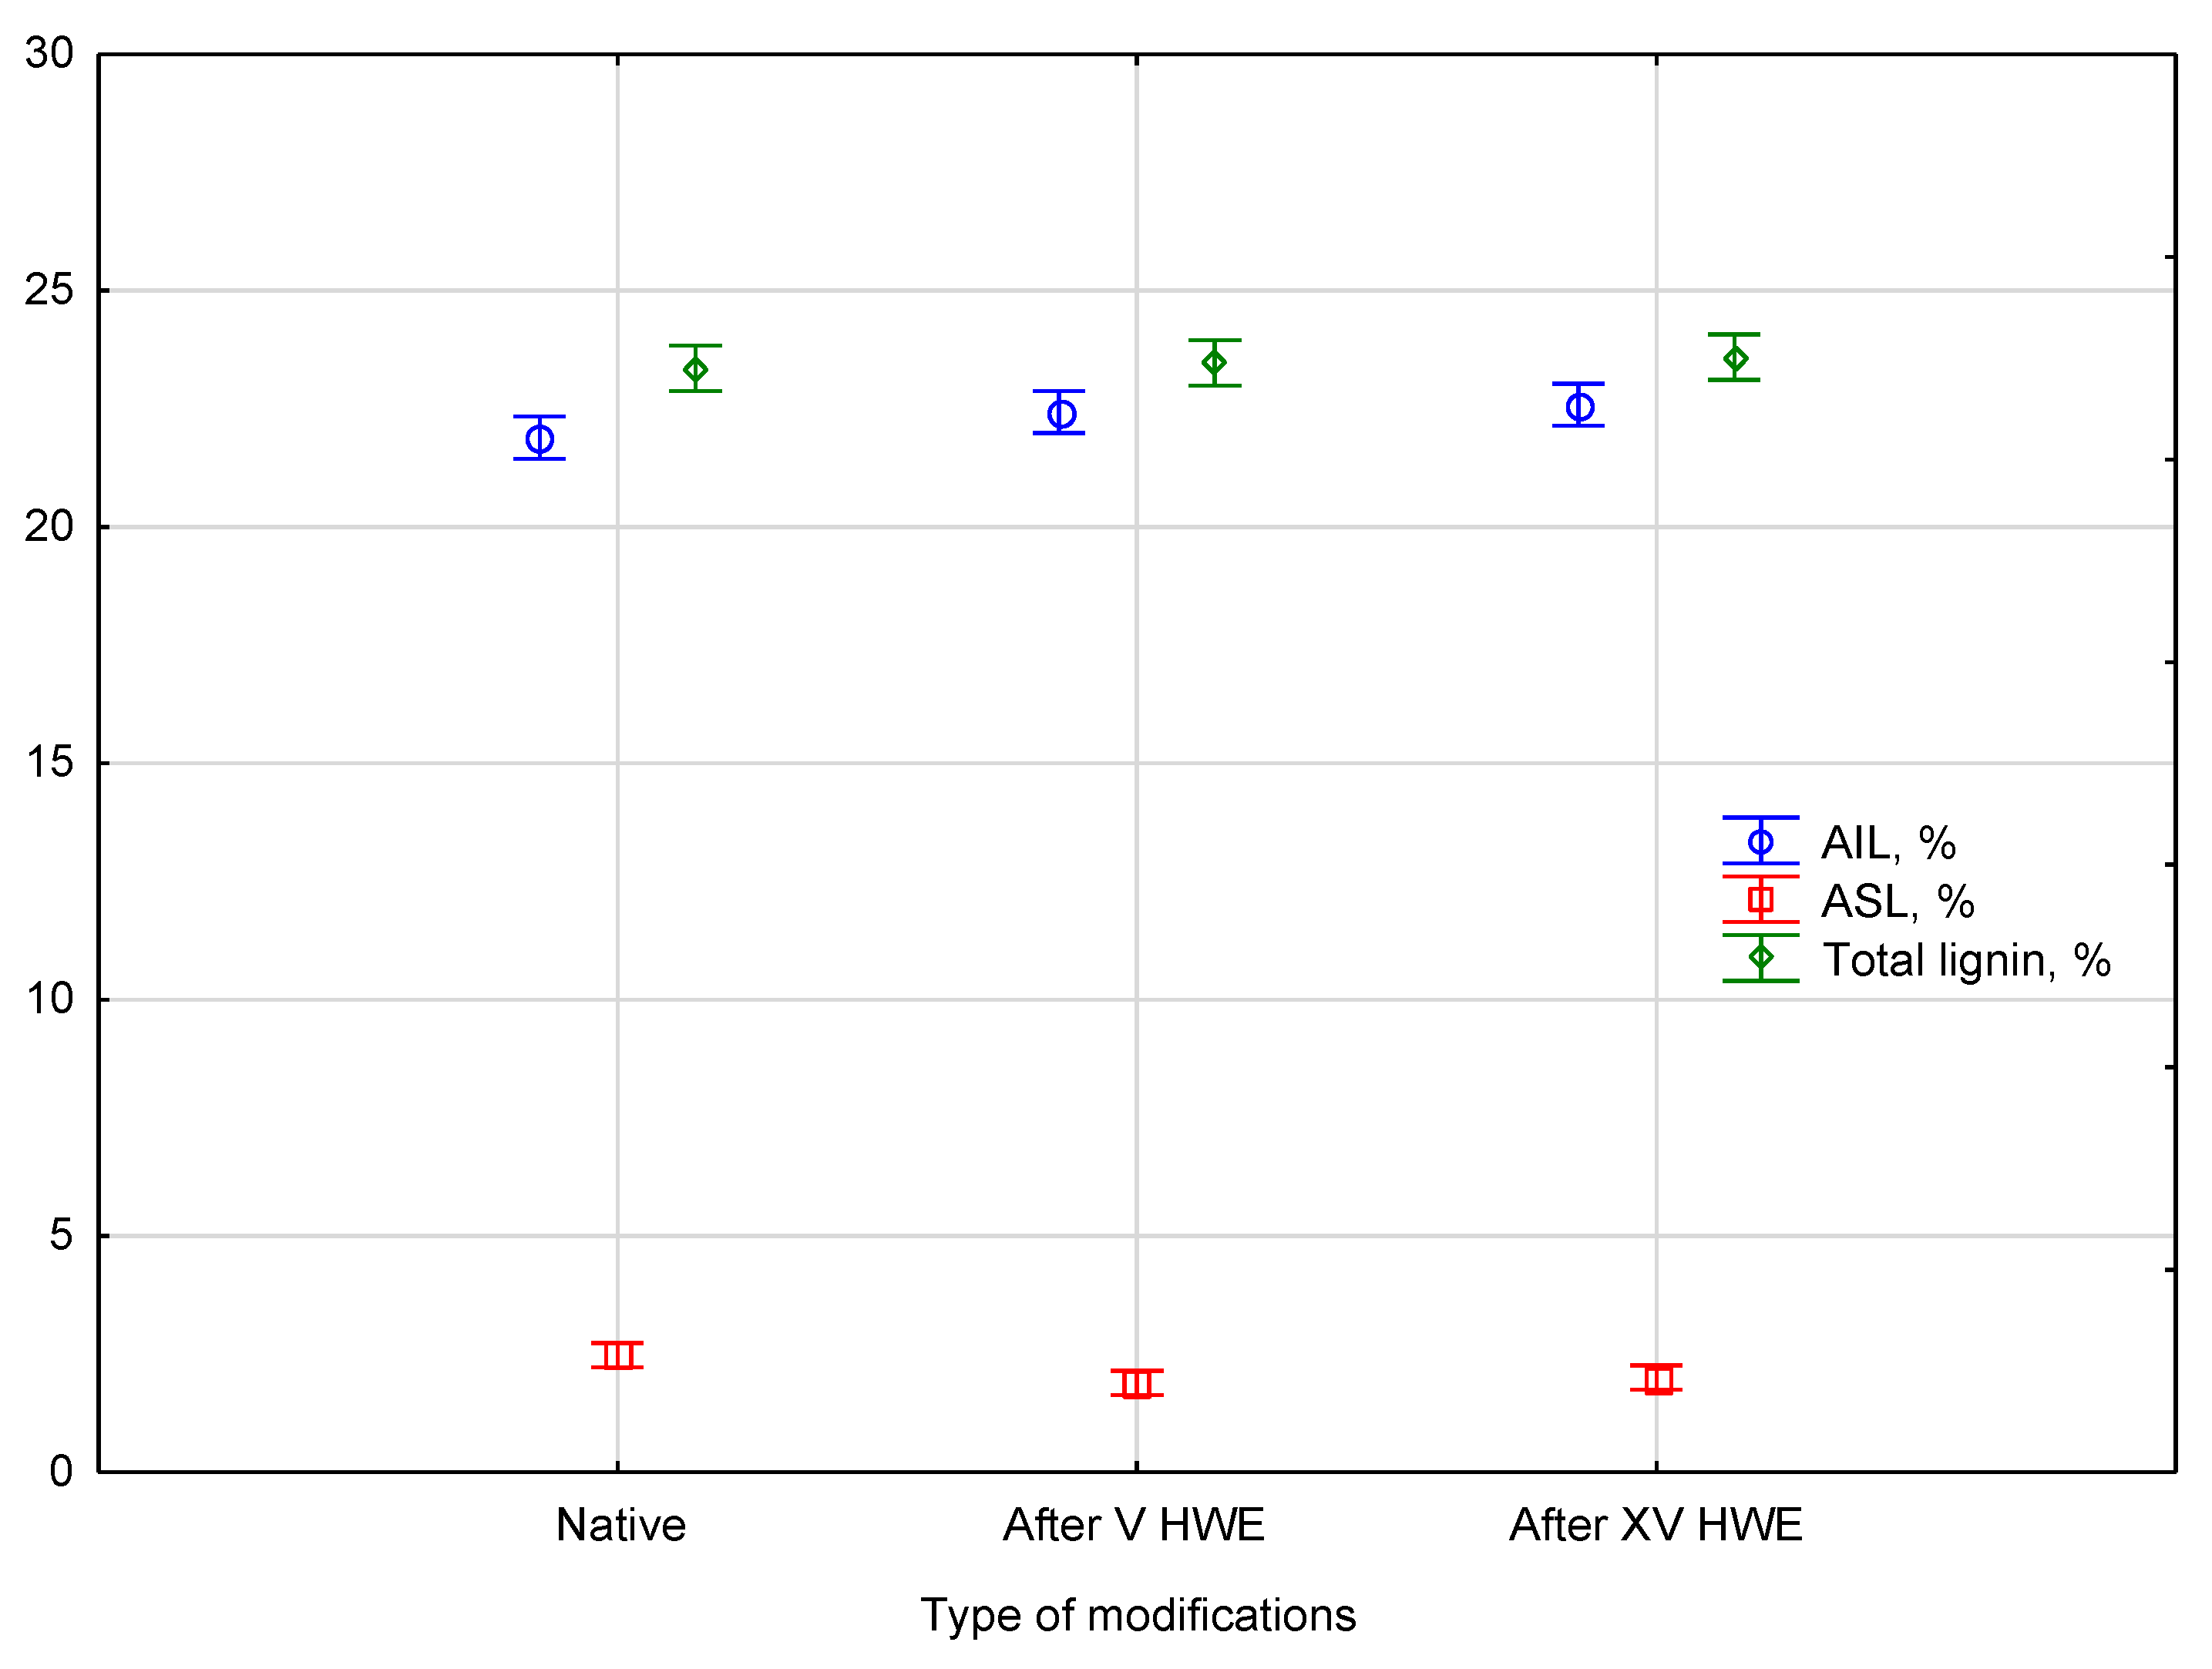
F(6, 14) = 2.2357. The comparison of lignin percent content between the native and HWE-treated material is presented in
Figure 3.
Statistical analysis using a post hoc test, such as Duncan’s test, confirmed that there were no statistically significant differences in total lignin content between native and HWE-treated samples. The total lignin parameters consistently belonged to a single homogeneous group, indicating the content remained stable throughout the process. In numerical terms, total lignin content was 23.4 ± 0.4% in native hemp, 23.5 ± 0.5% after V cycles, and 23.6 ± 0.3% after XV cycles, confirming the statistical stability of this parameter. The analysis also revealed a shift in the composition of lignin fractions within this group: the content of acid-soluble lignin (ASL) decreased from 2.6 ± 0.4% in native hemp to 1.9 ± 0.2% after V cycles and 2.0 ± 0.1% after XV cycles, while the content of acid-insoluble lignin (AIL) increased slightly from 21.9 ± 0.2% in the native material to 22.4 ± 0.6% and 22.6 ± 0.3% after V and XV cycles, respectively. These changes were observed as early as the V cycle of HWE. The redistribution between ASL and AIL fractions, while not affecting the overall lignin content, is indicative of the solubilization of less stable lignin fragments during hot water extraction.
3.2.4. Glucose and Xylose Content
Hemp biomass underwent HWE pre-treatment to enhance the accessibility of structural carbohydrates. Following the HWE process, the remaining solid fraction was subjected to acid hydrolysis using sulfuric acid to break down polysaccharides (cellulose and hemicelluloses) into their monomeric sugars. Subsequently, the hydrolysate was analyzed using HPLC to quantify the glucose and xylose concentrations, representing cellulose and hemicellulose content. For comparative purposes, untreated (native) hemp was also subjected to the same acid hydrolysis, allowing evaluation of the effect of HWE pre-treatment on sugar yield and biomass composition. The content of glucose and xylose in native hemp and hemp treated with V and XV cycles of HWE is presented in
Table 4.
The glucose content in the samples, expressed as a percentage of dry biomass, showed consistent values across replicates. The measured glucose contents were 47.6%, 47.9%, and 46.9%, corresponding to native hemp and samples subjected to V and XV cycles of HWE, respectively. These results show relatively small differences in glucose content between untreated and HWE-treated hemp biomass, suggesting that the HWE treatment had a minimal impact on the cellulose. The glucose content remained statistically unchanged across all samples, indicating that the HWE process effectively preserved the cellulose structure. The low standard deviation in the native material (0.4%) reflects high sample homogeneity, whereas the increased variability observed after V (1.1%) and XV (1.2%) HWE cycles may point to a gradual reduction in sample uniformity because of the extraction process.
The low standard deviation observed in the native (untreated) material was only 0.4% and it indicates a high degree of homogeneity within the sample. The composition was very consistent across different portions of the sample before any treatment was applied. However, after 5 and 15 cycles of HWE, the standard deviation increases to 1.1% and 1.2%, respectively. This increase suggests that the extraction process is gradually introducing more variability into the sample. The uniformity that was initially present was reduced, probably because different components were removed from the biomass at slightly different rates or in uneven ways across the sample. This can result in regions that are chemically or structurally altered to different extents, depending on how each part of the material responds to repeated extraction cycles. However, given that the cellulose content increases while the glucose content remains stable, it can be concluded that some glucose originally present in hemicelluloses has been removed. This suggests a decrease in the overall hemicellulose content.
Pretreatment aims at removing hemicelluloses, opening the biomass structure, and increasing accessibility of cellulose during enzymatic hydrolysis. The xylose content in the samples, expressed as a percentage of dry biomass, also showed relatively consistent values across replicates. The measured xylose contents were 17.9%, 19.4%, and 18.8%, corresponding to native hemp and samples subjected to V and XV cycles of HWE, respectively. These results suggest a slight increase in xylose content following V and XV cycles of the HWE process. The low standard deviations across all samples, particularly after V (0.2%) and XV (0.3%) cycles of HWE, indicate that the treatment did not significantly affect the overall uniformity of the xylose distribution in the biomass. The xylose content of the dry biomass increased from 17.9% to 19.4% after V cycles due to the removal of other compounds, resulting in a higher concentration of the remaining components. A reduction in xylose was observed during the HWE process with XV cycles compared to treatment with V cycles, indicating hemicellulose breakdown.
Statistical analysis revealed that the HWE treatment had a varied impact on the glucose and xylose content of the material. The glucose content across all samples—native, after V cycles, and after XV cycles of HWE—was found to be consistent, as it was classified into a single homogeneous group. This finding indicates that the HWE process did not introduce any statistically significant differences in glucose content. In contrast, a prominent effect of the treatment was observed for xylose, where the analysis divided the samples into three distinct homogeneous groups. This result confirms that the xylose content changed in a statistically significant manner depending on the number of HWE cycles, highlighting its sensitivity to the extraction process. A detailed comparison of the glucose and xylose content between the native and HWE-treated material is presented in
Figure 4.
Based on the ANOVA analysis, the influence of HWE treatment on the monosaccharide content was evaluated. Results indicated that glucose content remained stable in all groups, with values of 47.6 ± 0.4% in native hemp, 47.9 ± 1.1% after V cycles, and 46.9 ± 1.2% after XV cycles, indicating that cellulose structure remained intact even after multiple extraction cycles. All these samples were classified into a single homogeneous group. By contrast, xylose content showed statistically significant differences depending on the number of extraction cycles. The content increased from 17.9 ± 0.4% in native material to 19.4 ± 0.2% after V cycles, followed by a slight decrease to 18.8 ± 0.3% after XV cycles. As a result of the post hoc test, three distinct homogeneous groups were identified, confirming the strong effect of HWE on hemicelluloses. The Wilks’ Lambda statistic of 0.12879, with an F(4, 16) value of 7.1458 and a p-value of 0.00169, confirmed the statistical significance of these differences. The observed changes indicate that while cellulose remained undisturbed during HWE, the hemicellulosic fraction was progressively removed and redistributed, resulting in measurable modifications of the chemical profile and processing efficiency of hemp biomass. These findings highlight the selective nature of hot water extraction, which enhances cellulose enrichment while altering hemicellulose distribution, an effect of importance for future biorefinery applications.
3.2.5. Ash Content
The solid fraction obtained after the HWE process was analyzed for ash content, representing the total mineral content remaining in the biomass after combustion. For comparison, native (untreated) hemp was also included in the analysis. The objective of this procedure was to assess the effect of HWE on the inorganic fraction of the biomass, which can influence further processing, such as combustion, or inhibit enzymatic hydrolysis efficiency in biochemical conversion processes. The percentage of ash in native hemp and hemp treated with V and XV cycles of HWE is presented in
Table 5.
The ash content in the samples, expressed as a percentage of dry biomass, showed a decreasing trend after V and XV cycles of HWE. After V cycles, the ash content has already decreased noticeably. The measured ash contents were 3.9%, 3.1%, and 2.7%, corresponding to native hemp and samples subjected to V and XV cycles of HWE, respectively. These results indicate a progressive reduction in mineral content with increasing cycles of HWE, likely due to the leaching of soluble inorganic compounds during the treatment.
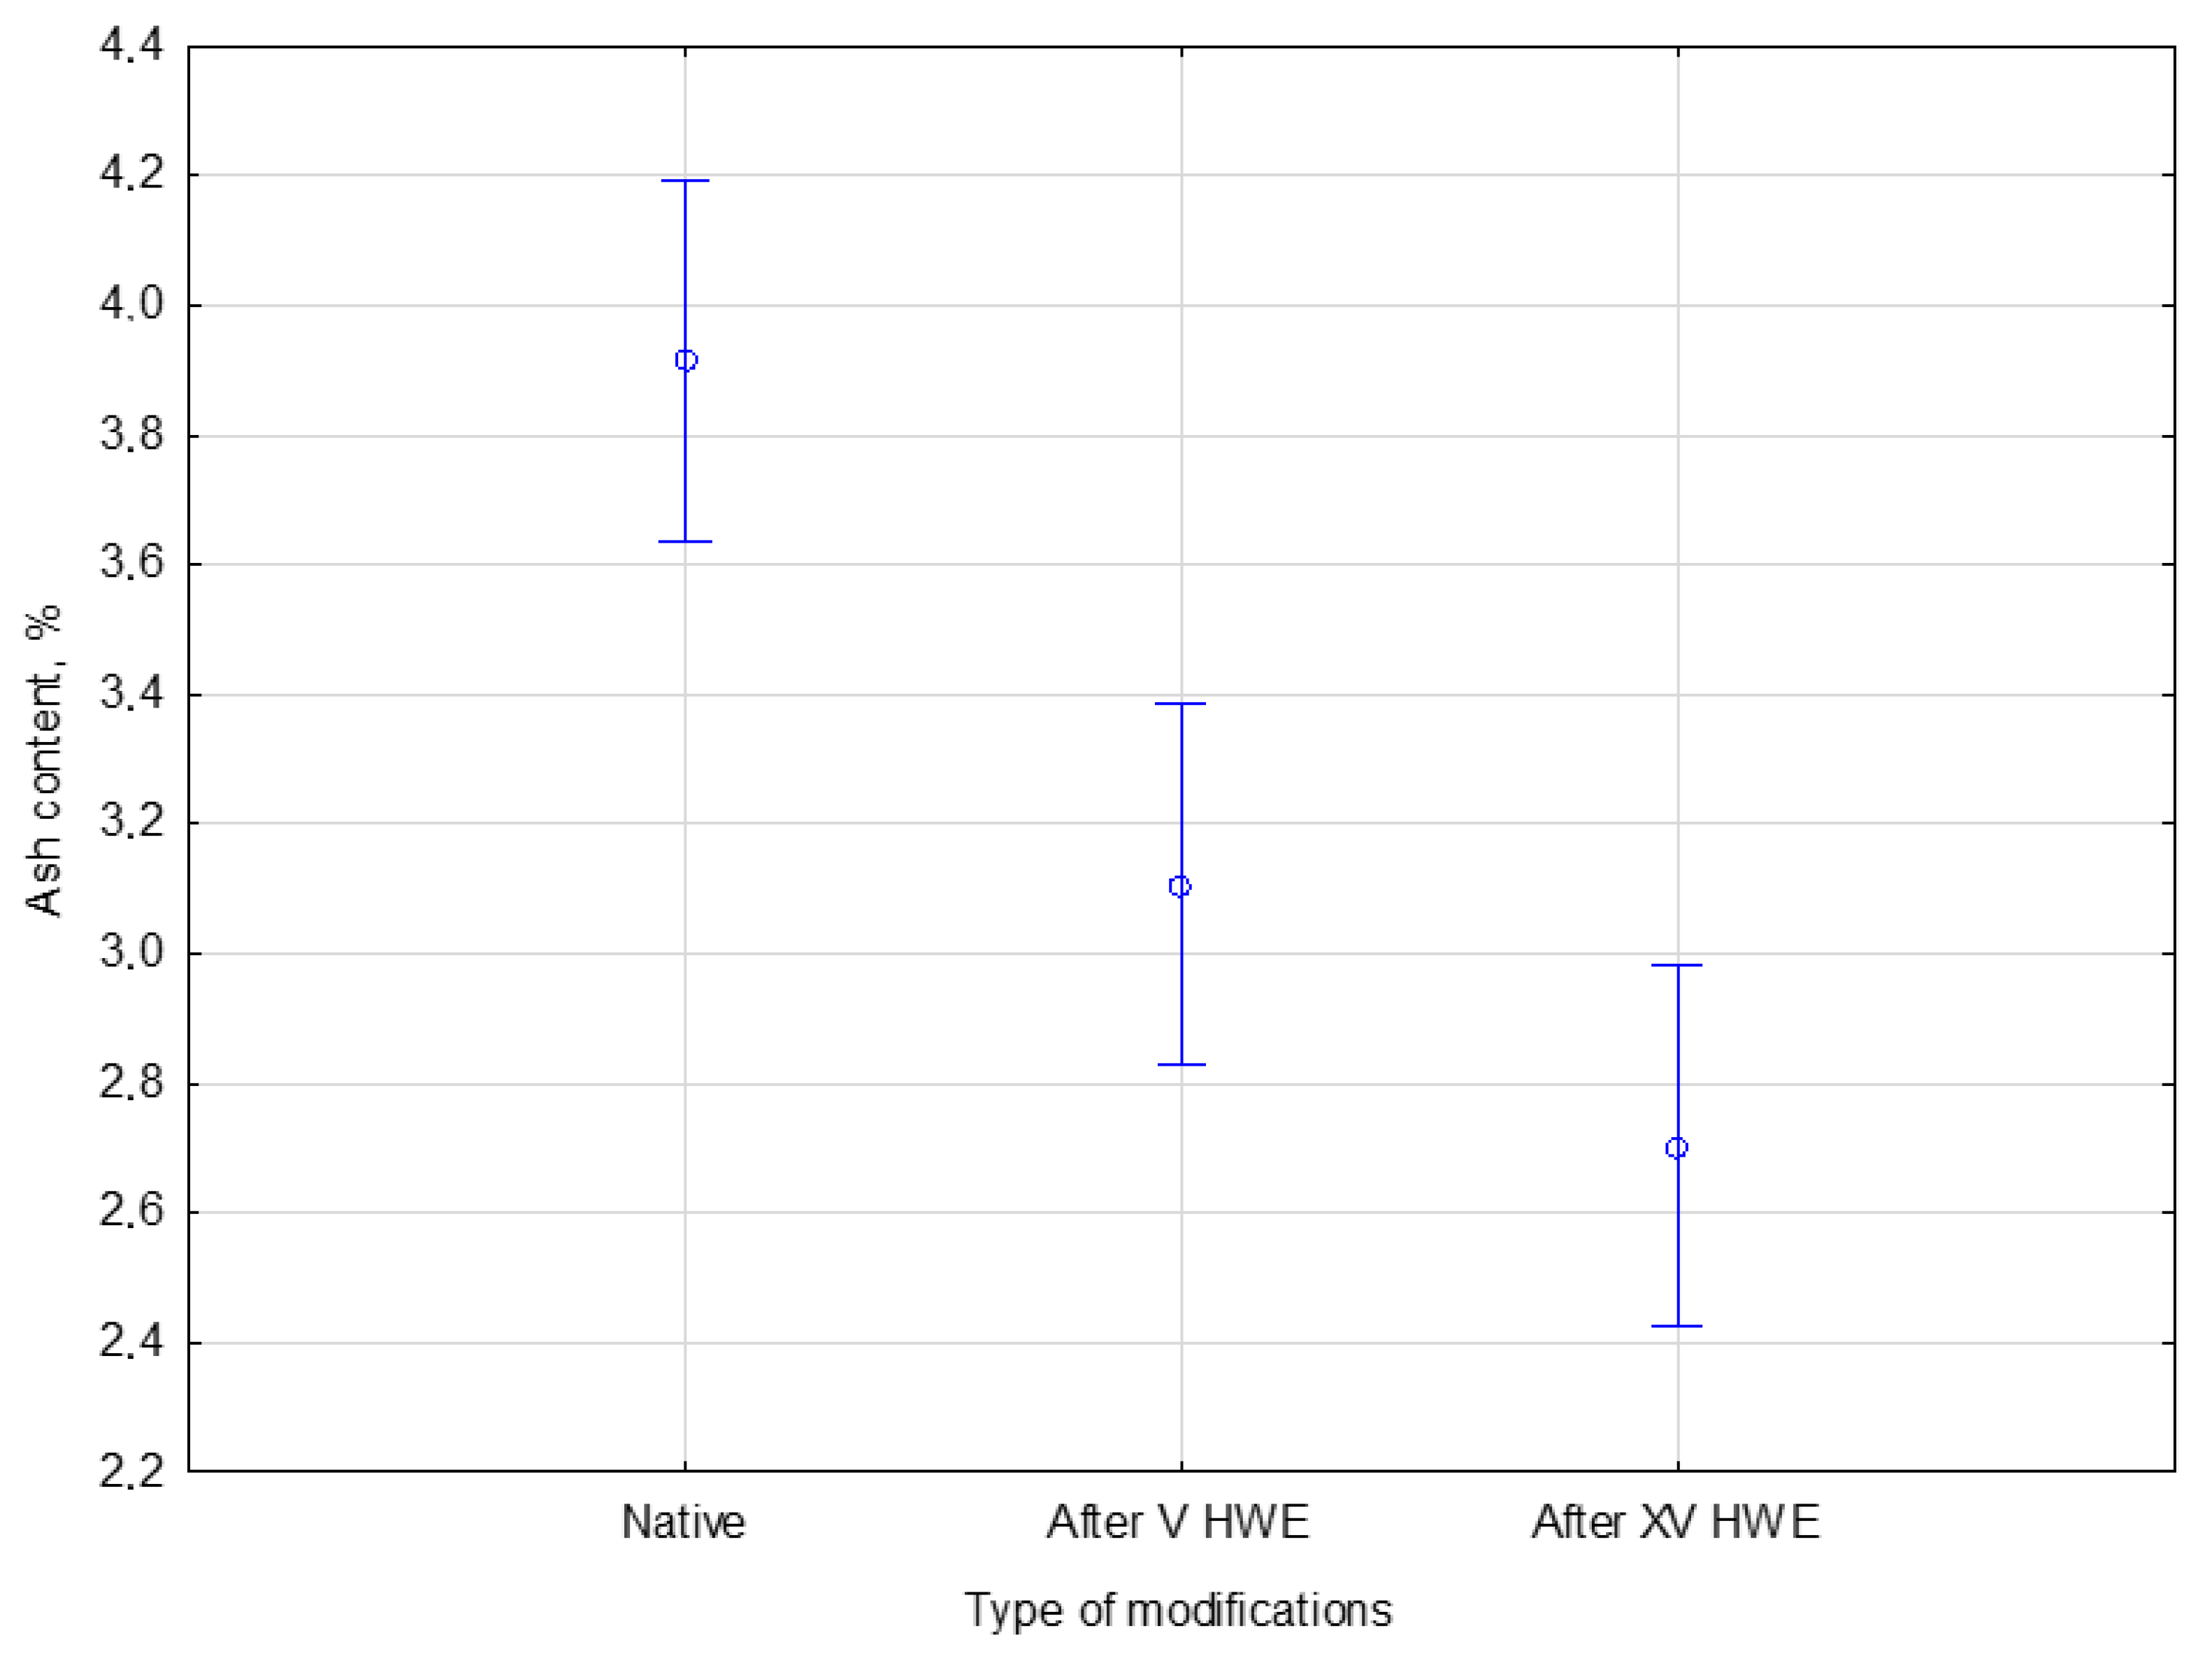
Analysis of the ash content in the solid fraction of biomass, including native hemp, was conducted to determine the total mineral content remaining after combustion. This content is a crucial parameter for assessing the material’s purity and suitability for various applications. To precisely evaluate the impact of HWE treatment on the inorganic fraction of the biomass, a statistical analysis was performed. This study specifically compared the ash content in native hemp with that of samples subjected to both V and XV HWE cycles, with the objective of understanding how the treatment duration influences the mineral composition. The ash content in the native and HWE-treated material is presented in
Figure 5.
The Duncan post hoc test indicated that HWE treatment significantly affected the mineral (ash) content of hemp biomass. Native hemp contained 3.9 ± 0.2% ash, which decreased to 3.1 ± 0.1% after V cycles and further to 2.7 ± 0.3% after XV cycles. According to the test statistics, this effect was significant with F(2, 6) = 29.288 and p = 0.00080. The post hoc analysis confirmed that each treatment level—native, V, and XV cycles—belonged to a different homogeneous group. The results demonstrate that the decline in ash was not random but statistically significant. The above figure shows a clear downward trend in the mineral fraction of hemp biomass with each HWE cycle, indicating increased leaching of soluble inorganic compounds.
3.3. Post-HWE Liquid Analysis
3.3.1. Glucose, Xylose, and Other Degradation Products in Post-HWE Liquid
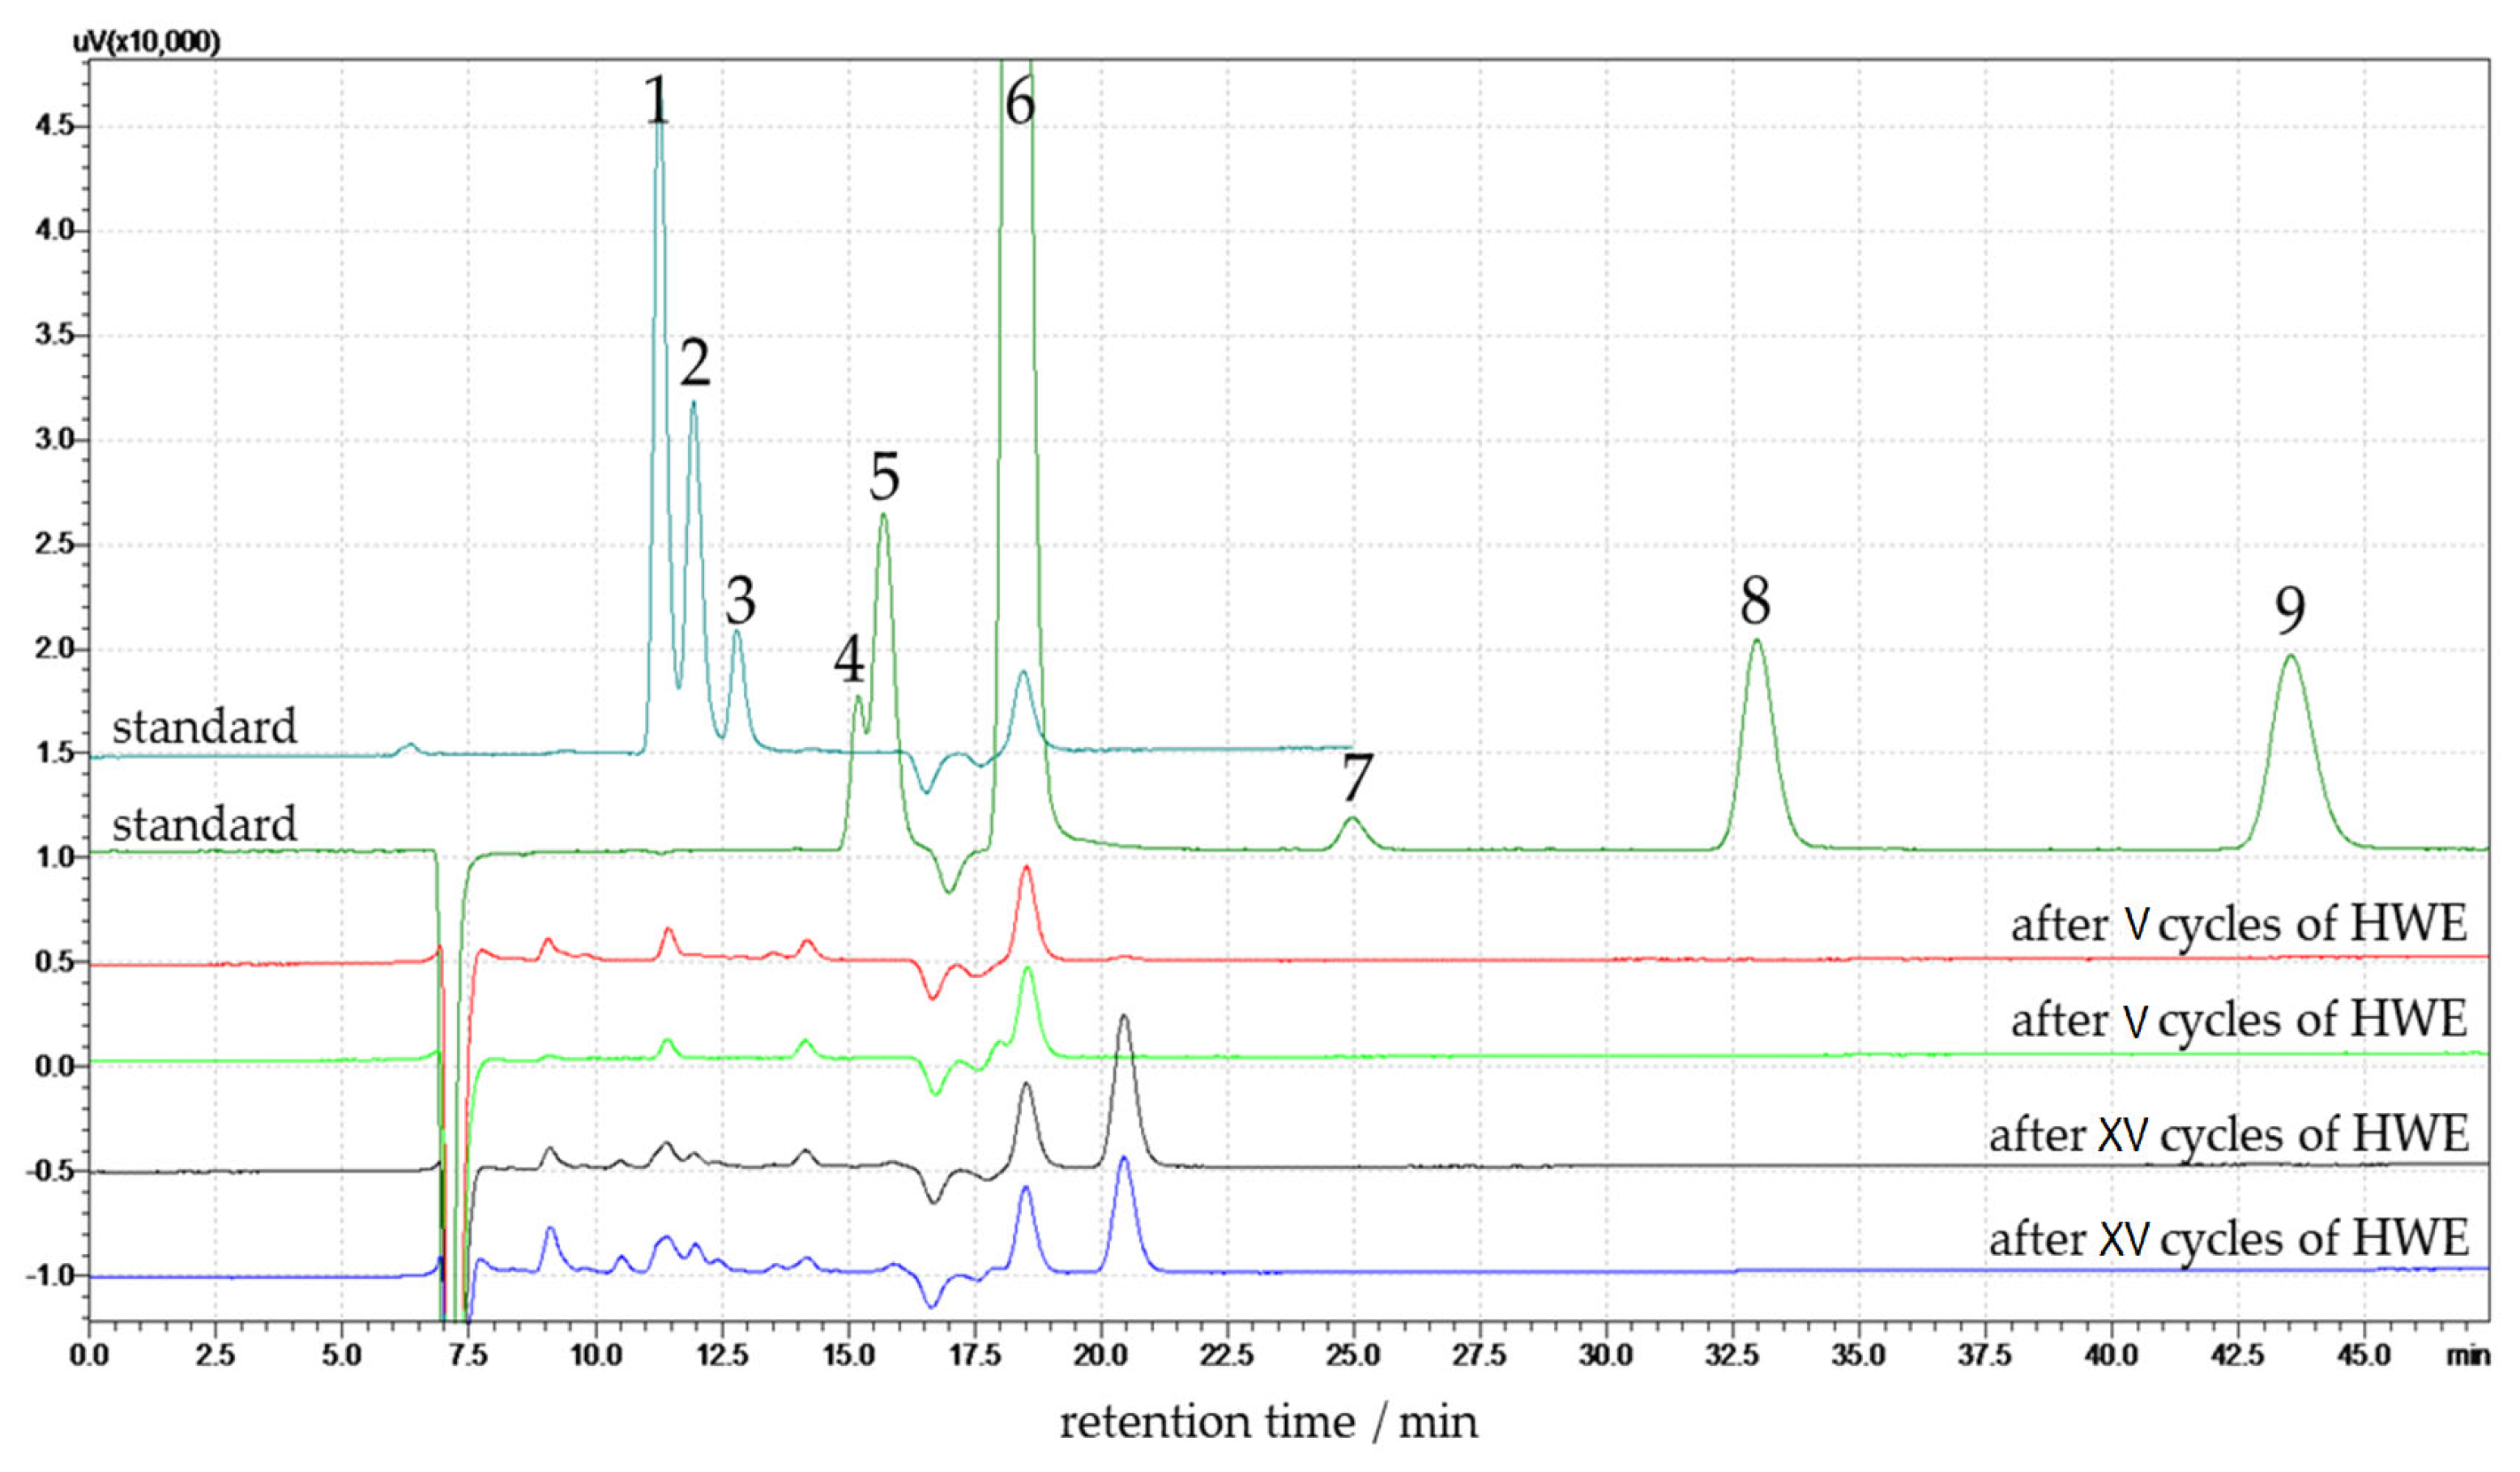
Hemp biomass was subjected to HWE pre-treatment to solubilize some of the less water-resistant hemicellulosic sugars and other compounds, such as acetic acid, formic acid, levulinic acid, ethanol, furfural, and 5-(hydroxymethyl)furfural (HMF). Therefore, these compounds were also investigated. Monitoring these compounds is essential, as they can act as enzymatic hydrolysis or fermentation inhibitors in downstream biochemical processing. The comprehensive HPLC analysis of the liquid fraction thus provides valuable insight into the HWE treatment of hemp. The HPLC chromatograms comparing standard compounds with post-HWE liquids obtained after V and XV treatment cycles on hemp biomass are presented in
Figure 6.
The analysis identifies key monosaccharides and degradation products formed during the HWE process. The standard chromatogram includes all identified compounds with clearly defined peaks for retention time reference. The chromatograms of hemp extracts after V HWE cycles (red and light green lines in the Figure) show very low signal intensities across all analytes. Minor peaks suggest limited hydrolysis of the lignocellulosic matrix at this early stage. Low signals of glucose and xylose, and no degradation products (HMF and furfural) are observed.
Peaks corresponding to glucose and xylose appear between 10 and 13 min, with higher intensity in the XV cycle samples compared to the V cycle samples. Peaks 4, 5, and 6 in the chromatogram correspond to formic acid, acetic acid, and levulinic acid, respectively. They elute at approximately 14.5, 15.5, and 17 min, respectively. These compounds play a crucial role as they are commonly formed as by-products during the thermal degradation of carbohydrates under hydrothermal processes. Their presence in the post-HWE liquid, particularly after XV cycles, indicates increased hemicellulose and partial cellulose breakdown with low polymerization degree and crystallinity index into organic acids. These peaks have a higher area in the samples after XV cycles than in the V cycle samples, reflecting the progressive formation of these degradation products with repeated extraction cycles.
Peak 7, attributed to ethanol, is observed at 25 min in the standard, but no signal is observed in the V and XV cycle samples. Peaks corresponding to 5-(hydroxymethyl)furfural and furfural are detected at approximately 33 and 43 min, respectively. These peaks are not present in any post-HWE samples. The V cycle samples show lower overall peak intensities across all detected compounds than the XV cycle samples. The standard chromatogram includes all identified compounds with clearly defined peaks for retention time reference. The glucose and xylose content in the liquid phase was quantified using an HPLC calibration curve, and the results are expressed as a percentage relative to the dry mass of the native (untreated) hemp. The results are presented in
Table 6.
The table presents the percentage content of the two most abundant biomass monosaccharides, i.e., glucose and xylose, determined in the post-HWE liquid phase after V and XV cycles performed on hemp biomass. The mean percentage content and the corresponding standard deviation are provided for each sugar. After V cycles of hydrothermal extraction, the glucose content was 2.3%, and the xylose content was 0.7%. The glucose content increased to 6.8% after XV cycles of HWE. Similarly, the xylose content increased from 0.7% to 2.3% after extending the HWE cycles. The results show an apparent increase in sugar content with the number of HWE cycles.
Statistical analysis showed that HWE treatment resulted in variable glucose and xylose content in the liquid phase. It was noticed that glucose and xylose samples each were classified into two homogeneous groups, indicating that the HWE process significantly affected dissolution. Despite varying treatment durations, the sample content remained sensitive to HWE cycles—the comparison of glucose and xylose content of the liquid after HWE treatment is presented in
Figure 7.
The liquid phase glucose and xylose content were significantly influenced by HWE treatment. After V extraction cycles, glucose concentration in the liquid phase reached 2.3 ± 0.1%, while xylose concentration reached 0.7 ± 0.1%. After XV cycles, these values increased to 6.8 ± 0.8% and 2.3 ± 0.1%, respectively, showing progressive sugar release. This effect was confirmed by the statistical value of F(2, 1) = 1092. The p-value of 0.02139 confirms that the differences between the groups were highly significant. After classifying the samples into two homogeneous groups, a post hoc analysis highlighted a clear impact on glucose and xylose content, confirming that the observed increases were statistically robust.
3.3.2. Lignin in Post-HWE Liquid
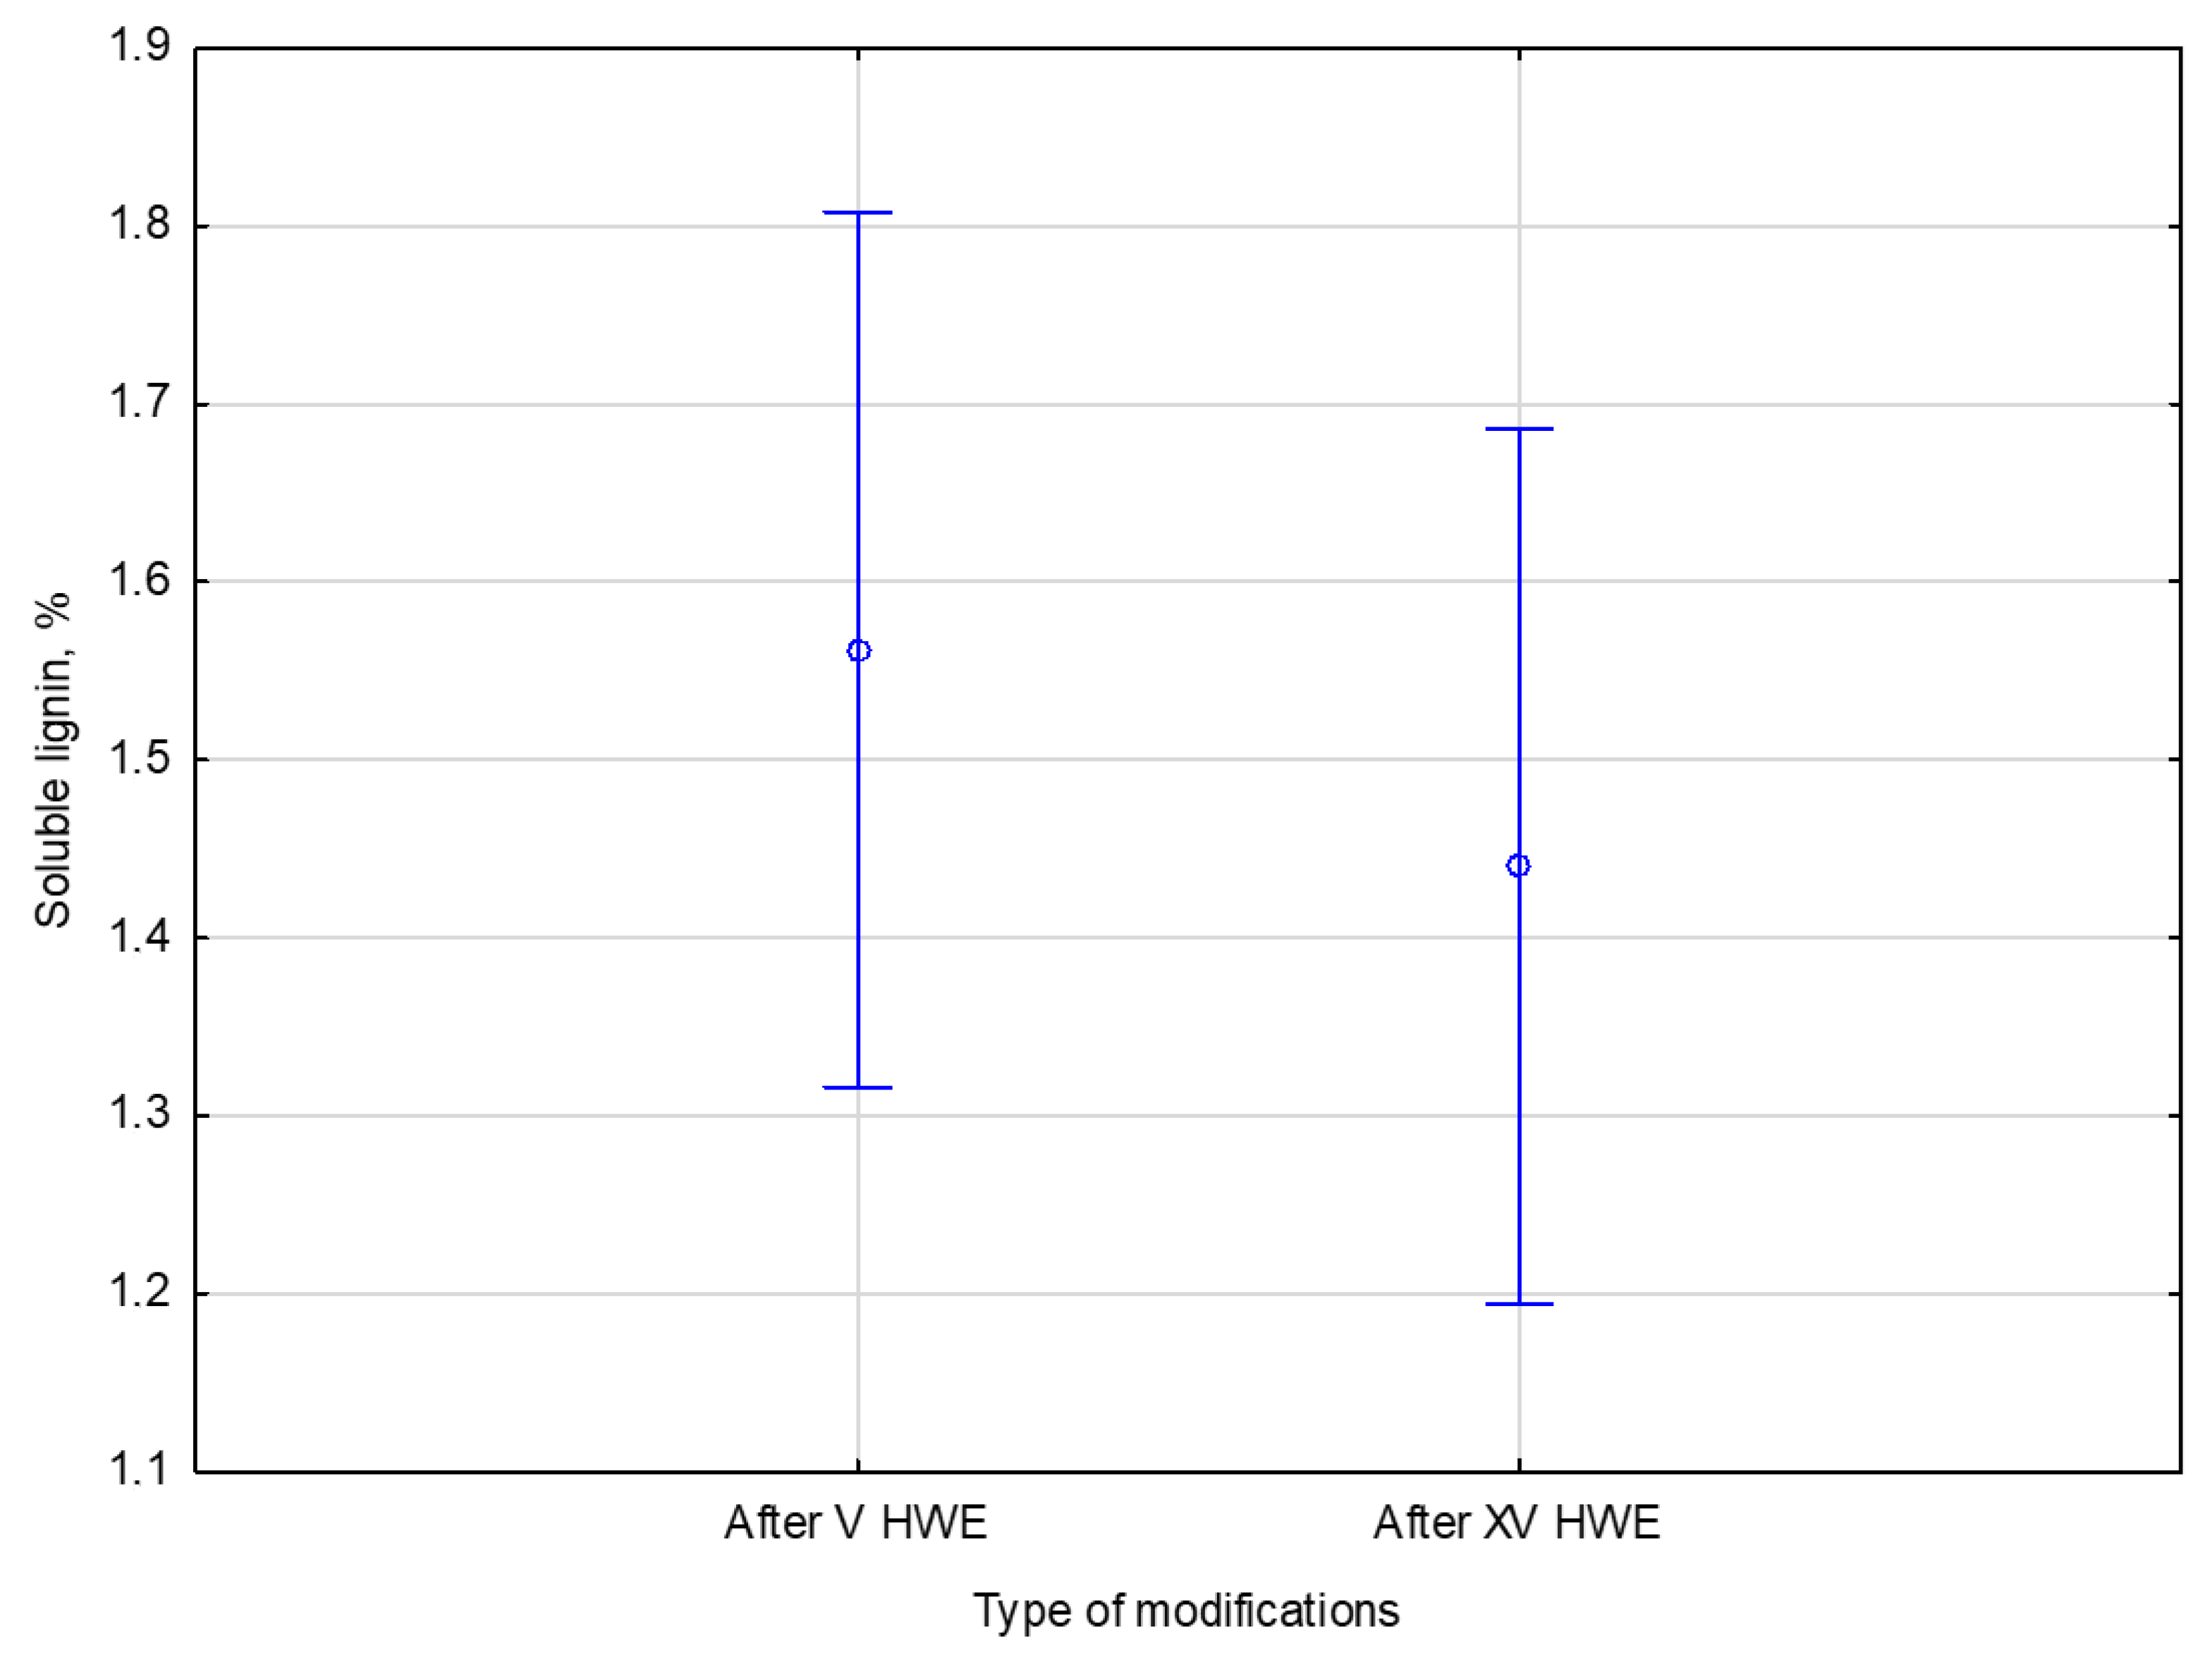
In addition to HPLC analysis, the liquid fraction obtained after V and XV cycles of HWE was also analyzed using a UV–VIS spectrophotometric method to determine the concentration of soluble lignin. Solubilized lignin, primarily low-molecular-weight aromatic compounds, is released during HWE. Investigating the soluble lignin provides information about the lignin removal during the pre-treatment. It helps assess the potential of the extract for further valorization or its impact on downstream processing. It also helps to provide a deeper understanding of the phenomena occurring during the process. The results are summarized in
Table 7.
After V cycles of HWE, the soluble lignin content in the liquid phase was 1.6% of the native dry biomass. Increasing the treatment to XV cycles resulted in a slightly lower lignin content of 1.4%. These results suggest that most easily extractable soluble lignin is released within the first few cycles, with similar results observed upon extended treatment. Additional cycles do not significantly increase lignin solubilization.
The statistical analysis sought to determine if extending HWE treatment from V to XV cycles significantly affected the liquid lignin content. No significant differences were found between the two conditions. There was a F statistic of 0.94140 with degrees of freedom 1 and 4, and a
p-value of 0.38686, well above 0.05, which is generally considered significant. It can be concluded that additional treatment cycles do not increase lignin solubility statistically significantly. The comparison of the number of cycles and the soluble lignin content is presented in
Figure 8.
The lignin leaching process appears to reach a state of saturation or equilibrium early. Following V HWE cycles, the soluble lignin content in the liquid phase was 1.6 ± 0.2% of the dry biomass. Extending the treatment to XV cycles resulted in a slightly lower value of 1.4 ± 0.1%. This is supported by the statistical analysis, which showed no significant differences between the two variants. The results suggest that most readily extractable lignin is removed during the initial HWE stage, with subsequent treatment cycles failing to increase its solubility significantly. The equilibrium trend in the Figure illustrates that additional extraction does not enhance lignin removal efficiency.
