1. Introduction
Calcareous sand is a deposit of biological sediments and the remains of marine organisms, primarily composed of calcium carbonate and having a lower hardness than quartz. It is widely distributed in shallow seas, warm seas, and continental shelves. Calcareous sand is characterized by high fragmentation, complex particle shapes, low individual particle strength, large internal voids, and a complex microstructure. Calcareous sand layers are prone to excessive deformation under high loads due to particle fragmentation and sliding [
1]. In marine engineering, calcareous sands are commonly used as foundation materials for structures and breakwaters and backfill materials for road embankments or airport runways [
2]. The particle structure of calcareous sand has a high porosity (typically between 0.7 and 2.5) due to the presence of a primary bioskeleton, which makes it highly compressible. Engineering data indicates that there is a larger risk of engineering mishaps when the amount of calcium carbonate is greater than 50% [
3,
4]. Since calcareous sand has special mechanical properties and is the main material for land reclamation, many scholars have taken calcareous sand as an important research object for island engineering. Coop and others [
5] showed that particle fragmentation plays a key role in the compressive properties of calcareous sands when the applied pressure exceeds a certain critical value. Salem et al. [
6] investigated the effect of the magnitude of perimeter pressure on the mechanical properties of calcareous sands under static loading and cyclic loading by studying two samples with different densities. Zhu et al. [
7] revealed the structural characteristics of the internal porosity of calcareous sand particles through microscopic experiments, using MATLAB software for processing and analysis. The distribution of porosity indicates that there are fewer macroscopic pores in the sand and more microscopic pores. Valdes [
8] used a single shear instrument to conduct tests on a mixture of calcareous sand and quartz sand, finding that the factors affecting its mechanical properties change with high or low confining pressure.
Currently, numerous researchers have conducted in-depth studies on the issue of modifying and reinforcing calcareous sands. Research by Liu et al. [
9] shows that by activating and enriching urease-producing bacteria through biostimulation technology, the precipitation of calcium carbonate in calcareous sands can be promoted, thereby enhancing its mechanical properties. Research by Shen et al. [
10] found that MICP (Microbially Induced Carbonate Precipitation) treatment effectively treated individual calcareous sand particles by producing a calcium carbonate coating around the sand particles and improved the particles’ fracture strength, reducing the variability of the particles in calcareous sand. At the same time, the DEM (Digital Elevation Model) modeling technique proposed by them was able to establish an accurate DEM with a real microstructure, particle shape, internal porosity, and the calcium carbonate cement pattern caused by MICP treatment. Liu et al. [
11] used a scanning electron microscope (SEM) to discover that microbial bonding treatment can encapsulate calcareous sand particles, improving their bonding and shear strength. Zhang et al. [
12] conducted a series of shake table tests to evaluate the seismic performance of calcareous sand foundations treated with MICP. During the vibration process, the excess pore water pressures and surface settlements of the MICP-treated models were significantly reduced. The test results showed that using the MICP method can significantly improve the strength, stiffness, and liquefaction resistance of calcareous sand.
Academics both domestically and internationally have focused on research into the stabilization and modification of materials, with a particular emphasis on microbial reinforcement techniques. However, cement-based composite materials and nanomaterial reinforcement are also commonly used methods. Wang et al. [
3] used nano-clay and cement to improve calcareous sand, and the improvement using nano-clay and cement can significantly enhance the strength, stiffness, and liquefaction resistance of calcareous sand. Chai et al. [
13] adopted the cement stabilization method to reinforce calcareous sand foundations and studied the basic engineering characteristics, bearing capacity, and deformation behavior of cement-stabilized calcareous sands through a series of experiments. The conclusion drawn was that the cement stabilization method can significantly improve the bearing capacity of calcareous sand foundations. Gao et al. [
14] explored the addition of nano-magnesium oxide in soft soils, with research indicating that NM can increase soil particle bonding, fill pores, and enhance water absorption, which significantly enhances the stabilization effect. The autogenous shrinkage of cementitious materials is a difficult problem to solve. Chen et al. [
15] studied the effects of nano-magnesium oxide content on the permeability, crack resistance, sulfate corrosion resistance, and freeze–thaw resistance of cement mortar through experiments. The results showed that nano-magnesium oxide has a positive effect on improving the durability of mortar. At the same time, Chen [
16] demonstrated through Fourier transform infrared spectroscopy and scanning electron microscopy that the expansion effect of nano-magnesium oxide makes the microstructure of cement-based materials denser and more uniform. Zhang et al. [
17] showed that nanometer titanium dioxide enhances the compressive strength of cement mortar by accelerating the hydration of cement and refining the pore structure. Meanwhile, numerous researchers have conducted experimental studies to develop higher-performance cementitious materials. Miao et al. [
18] investigated the effects of two industrial byproducts—fly ash (FA) and quartz powder (QZ)—as supplementary cementitious materials (SCMs) on both the macro-properties and microstructure of cement-based materials. The results demonstrated that using these SCMs could significantly reduce CO
2 emissions and energy consumption. Golewski [
19] proposed combining the most commonly used mineral additive (fly ash, FA) with nano-silica (NS) as partial substitutes for ordinary Portland cement (OPC) binder. This approach not only enhanced the concrete’s strength but also reduced OPC demand, consequently lowering CO
2 emissions.
Graphene oxide is a derivative of graphene, which has a similar structure. Due to its strong van der Waals forces, graphene has hydrophobic properties and is prone to aggregation, which limits its wide application. The emergence of graphene oxide has precisely solved the aforementioned issues [
20]. Tong et al. [
21] found that the addition of small amounts of graphene nanoparticles (GNPs) and graphene oxide nanoparticles (GONPs) can significantly increase the compressive strength of cementitious materials. The size and functional groups of the nanoparticles have a significant effect on the strength enhancement. The corrosion resistance of cementitious materials can also be improved. Wang et al. [
22] found that adding 0.05% graphene oxide to Portland cement paste can reduce the fluidity, increase the viscosity, and shorten the setting time.
As can be seen from the above research, studying the modifications of calcareous sand using volcanic ash cement combined with graphene oxide has a very high degree of feasibility, but there are relatively few related studies. This study uses a graphene oxide composite volcanic ash silicate cement (referred to as volcanic ash cement) as a modifier to solidify and modify calcareous sand. By combining systematic triaxial shear tests and numerical simulations, it deeply explores the influence patterns and mechanisms of graphene oxide and volcanic ash cement composites on the triaxial compression characteristics of modified calcareous sand. The focus is on revealing the evolution characteristics of stress–strain behavior, changes in strength parameters, and shear failure modes of calcareous sand specimens under the synergistic effect of graphene oxide and volcanic ash cement, and clarifying the mechanism by which the composite material system enhances the shear resistance of calcareous sand.
3. Triaxial Test
The incorporation of graphene oxide can improve the compressive properties of calcareous sand volcanic ash cement mortar, and correspondingly has a positive effect on the shear strength, but the mechanism and effect are not clear [
24]. This paper conducts unconsolidated undrained shear (UU) triaxial tests on the specimens to investigate the influence of various factors, such as the amount of modified materials, confining pressure, and curing age, on the shear performance of calcareous sand after modification with volcanic ash cement and graphene. The test was conducted under four different confining pressures. To avoid the influence of accidental factors on the test results, five sets of parallel tests were conducted for each condition.
3.1. Specimen Preparation
The amount of volcanic ash cement added was 5%, 10%, and 15%, while the amount of oxidized graphene added was 0%, 0.02%, 0.04%, 0.06%, and 0.1%. The mixture is shown in
Table 1.
According to the designed mix proportions, the corresponding masses of calcareous sand, volcanic ash cement, graphene oxide, and water were precisely weighed. The volcanic ash cement and graphene oxide were first added to the mixing pot containing calcareous sand and dry-mixed thoroughly. Subsequently, mechanical mixing was performed using the mixing pot.
After complete mixing, the mortar was transferred into pre-prepared molds in three layers, with each layer compacted using a drop hammer. The specimens were demolded after achieving initial strength and then placed in a standard curing room for the specified curing period.
3.2. Laboratory Instruments
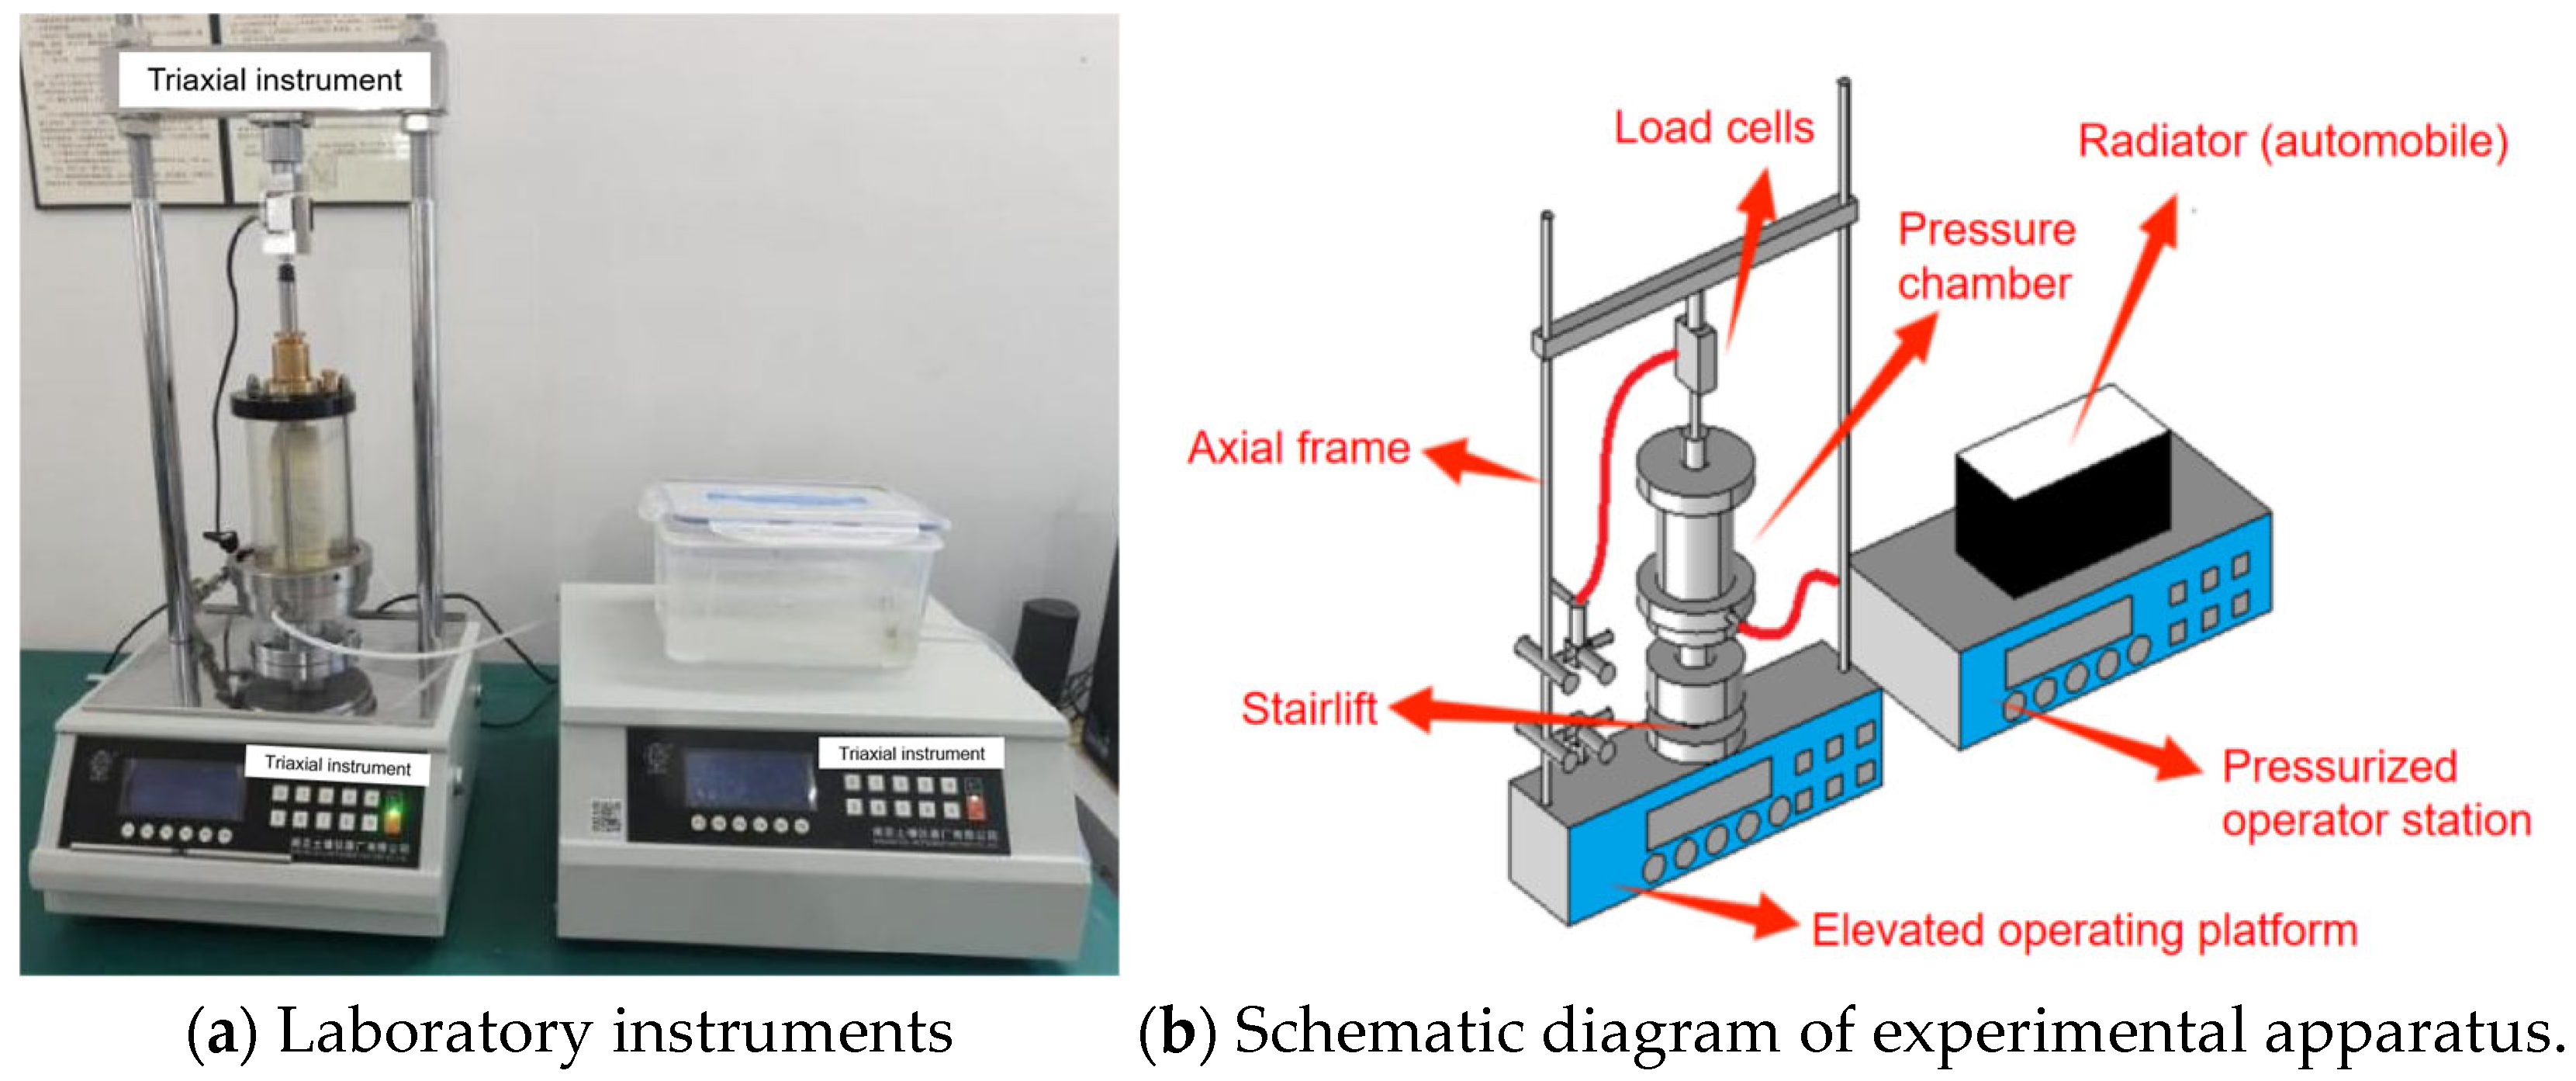
As shown in
Figure 5, the triaxial test equipment used in the experiment is a fully automatic triaxial instrument produced by Soil Instrument Factory Co., Ltd. in Nanjing, China, namely the TSZ-2 triaxial instrument. The confining pressure applied during the test ranges from 0 to 5 MPa. The maximum axial load it can withstand is 60 KN, and the shear rate is 0.0001 mm/min to 2.4 mm/min.
3.3. The Deviatoric Stress–Strain Curve
A data acquisition system was employed to monitor and record five specimens under each working condition. Using Origin 2024 software, polynomial fitting was applied to process the data from the five specimens under each condition. The fitting yielded a coefficient of determination R
2 = 0.977, indicating a reasonable fit [
24]. They were fitted to obtain the stress–strain curves under the influence of different amounts of modified materials, different confining pressures, and different curing ages. Partial deviatoric stress–strain curves are shown in
Figure 6.
The shear performance of the modified specimens was analyzed through the deviatoric stress–strain curves. During the loading process, the specimens gradually began to fail. The deviatoric stress–strain curve mainly shows two stages: (1) During the online elastic deformation stage (axial strain less than 2.8%), there is a significant positive correlation between deviatoric stress and axial strain. In this stage, the cementitious products and the sand grain skeleton jointly bear the load, with no significant relative slippage occurring between particles, and no visible cracks appearing on the specimen surface. (2) When the axial strain reaches the critical range of 2.8–3.2%, a significant peak in deviatoric stress is observed, indicating that the specimen has entered the ultimate bearing state. On the deviatoric stress–strain diagram, this is represented by a curve that suddenly drops and then gradually becomes flat. As the pressure continues to increase, the interaction forces between the particles increase, and large displacements occur between the particles. The specimen begins to fail and cracks appear, and as the number of cracks increases, the specimen gradually loses its bearing capacity.
The peak deviatoric stress is determined by the highest peak point, and the strain corresponding to the peak deviatoric stress is the peak strain. The peak deviatoric stress of the same specimen under high confining pressure is higher than that under low confining pressure. As the confining pressure increases, so does the peak deviatoric stress, and the residual strength also increases. The strain corresponding to the peak deviatoric stress when the specimen reaches the peak deviatoric stress under low confining pressure is less than the strain corresponding to the peak deviatoric stress when it reaches the peak deviatoric stress under high confining pressure. This is because as the confining pressure increases, the specimen enters a high confining pressure state, and the calcareous sand particles break, leading to secondary phase changes during the shear process. At this time, the deviatoric stress–strain curve gradually transitions to a strain-hardening type, and the failure form of the specimen is characterized by shear swelling failure.
When the deviatoric stress is small, the specimen does not produce a significant strain, but as the deviatoric stress increases to a critical state, the material gradually begins to crack and eventually breaks. This is reflected in a sudden drop in deviatoric stress on the deviatoric stress–strain diagram. Finally, as the deviatoric stress gradually increases, the strain slowly decreases. The slope of the deviatoric stress–strain curve and the peak strain vary with different amounts of oxidized graphene, indicating that oxidized graphene has a certain effect on improving the shear performance of calcareous sand, and the improvement ratio also varies. Relevant studies have shown that volcanic ash as a substitute for Portland cement leads to a reduction in the ultimate compressive strength of mortar [
25], whereas the addition of an appropriate amount of graphene oxide can greatly increase the compressive strength of calcareous sand specimens.
3.4. Mohr’s Circles
To better understand the modification effect of volcanic ash cement and oxidized graphene on the shear strength of calcareous sand, a strength envelope line is drawn based on the Mohr–Coulomb theory and the shear strength parameters C and
are determined. The strength curve expression is derived and the shear strength expression is given as follows:
where
is shear strength;
is cohesion;
is normal stress acting on the shear plane;
is internal friction angle.
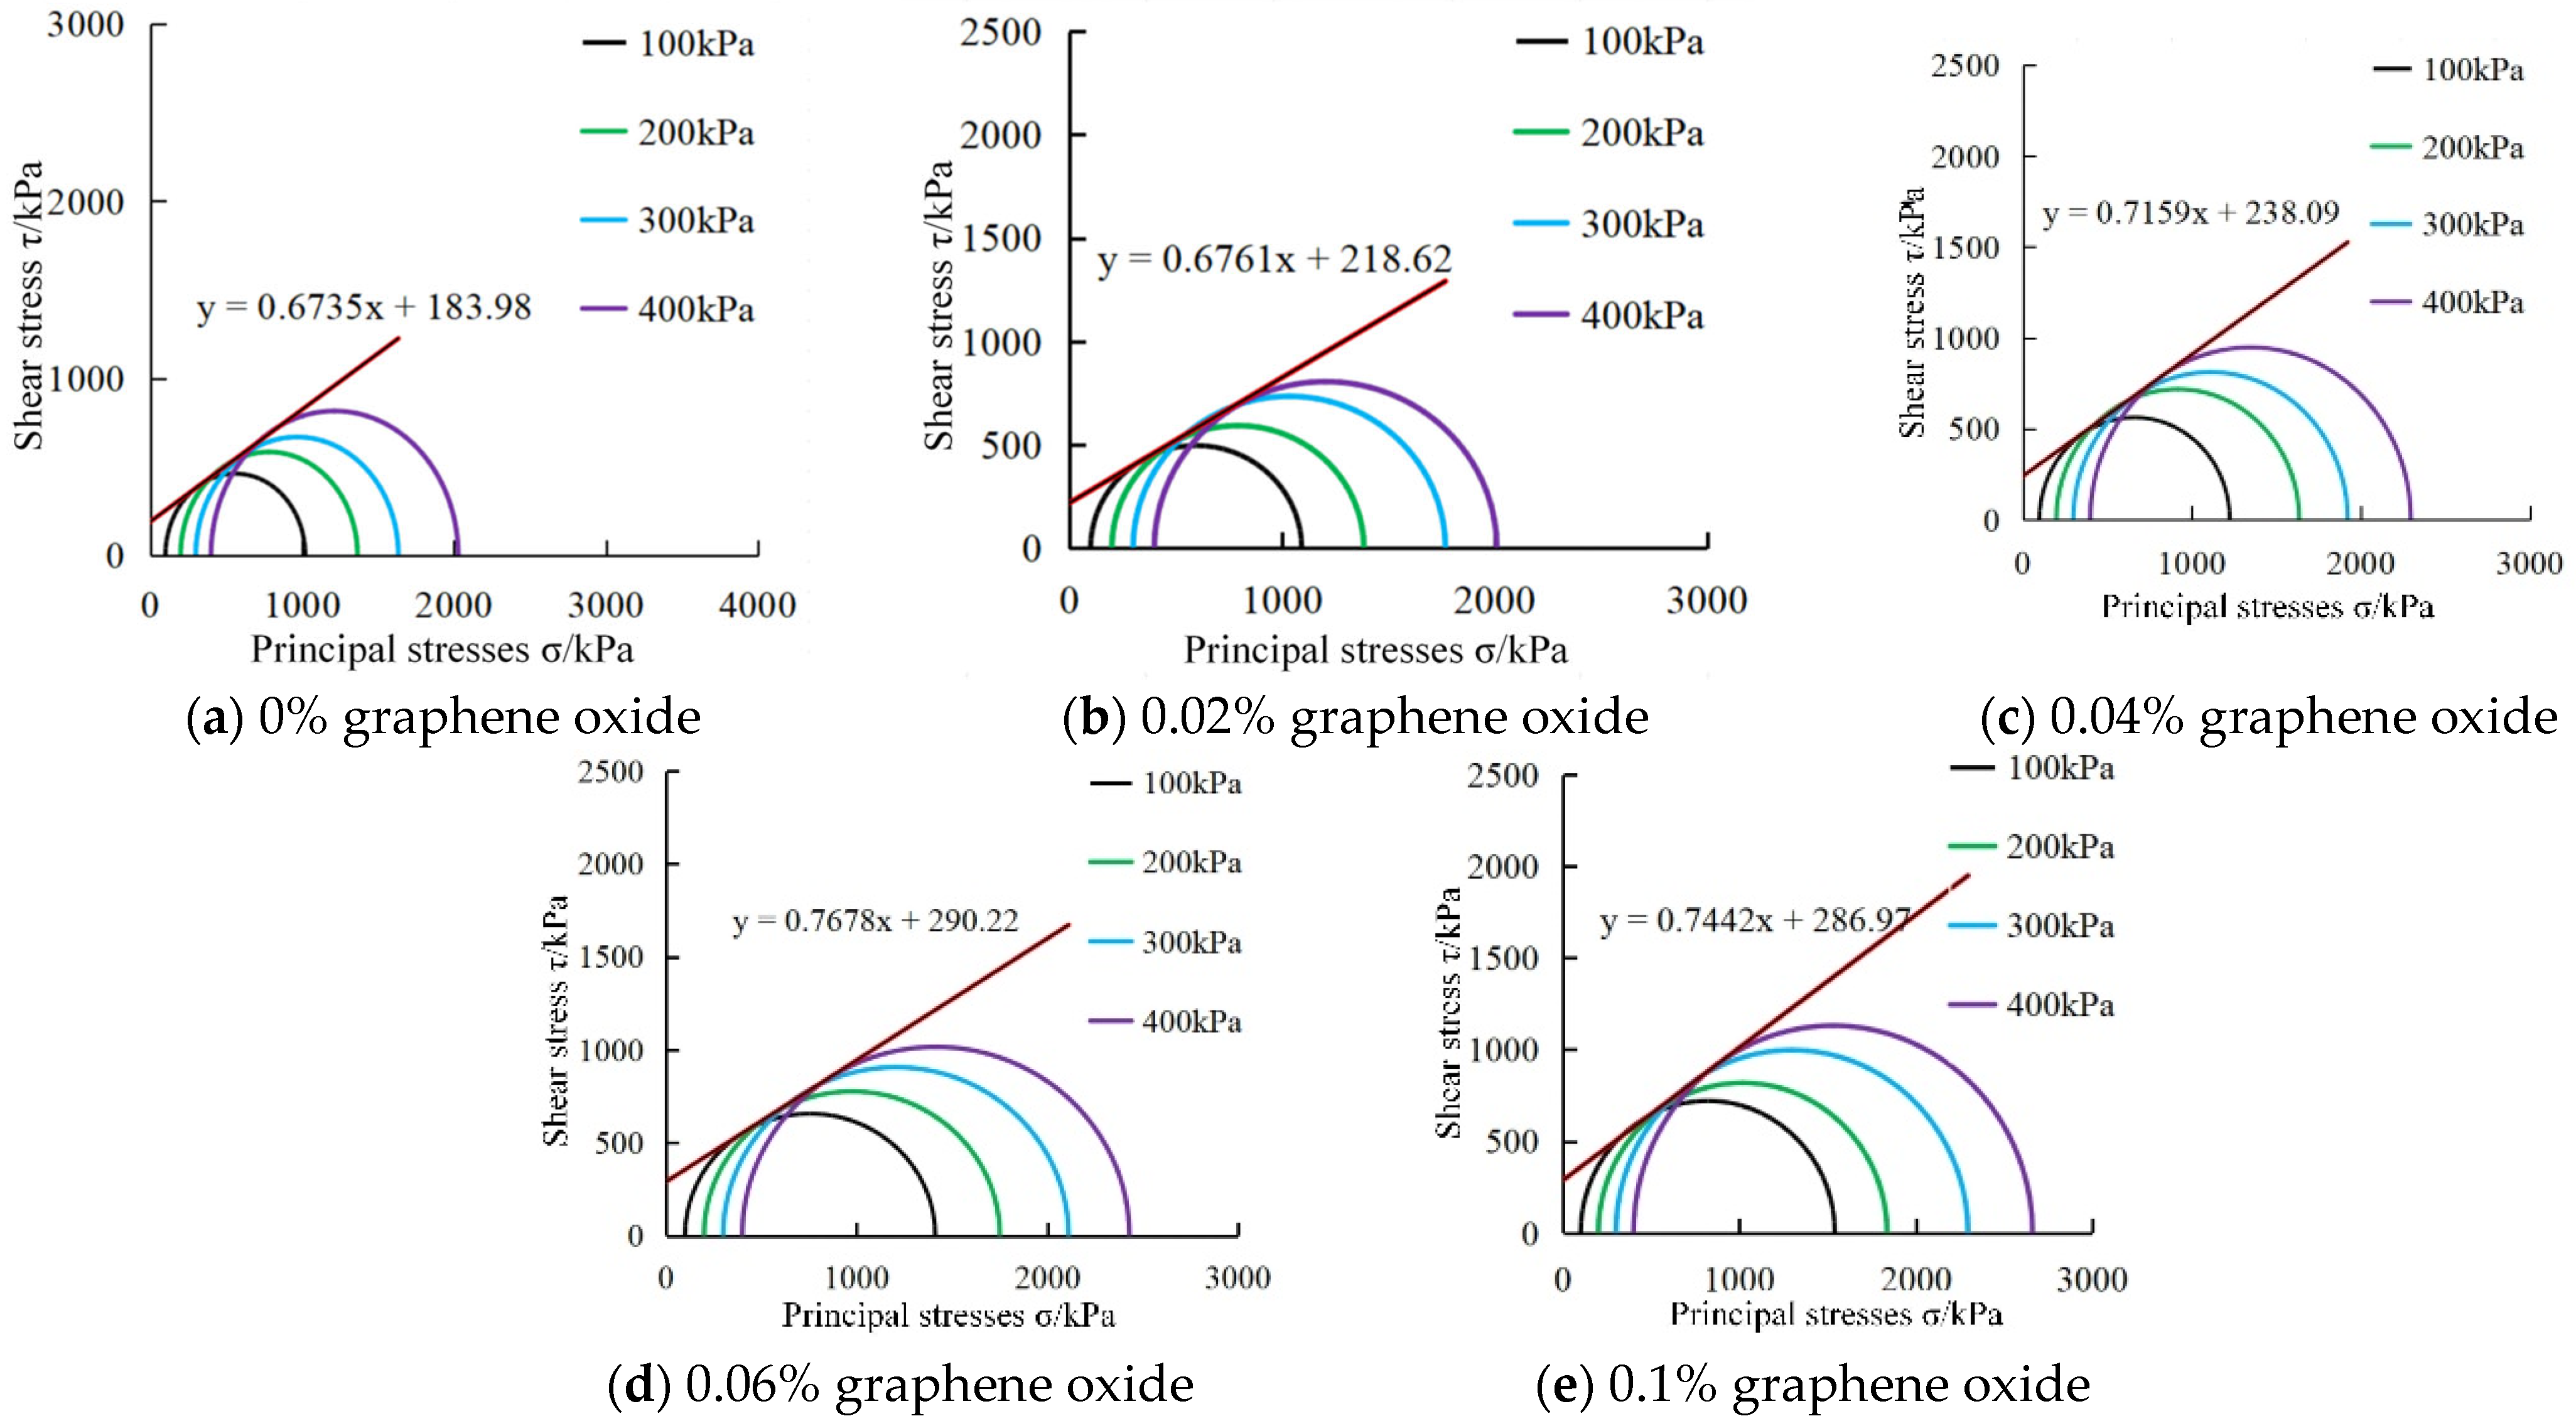
The processing results of some Mohr stress circles are shown in
Figure 7. According to the analysis of the Mohr stress circles, as the confining pressure increases, the diameter of the Mohr stress circles also increases, and the strength envelope line is tangential to the Mohr stress circles. The angle of internal friction and cohesion reached a maximum at 0.06% graphene oxide doping. Studies have shown that in undrained triaxial tests, the low saturation state of the specimens leads to a linear increase in strength and confining pressure. It can be seen that the amount of oxidized graphene and the curing age will make the expression of the strength envelope line different. To further explore the impact of the above factors, the content of the analysis is provided in
Section 3.5 and
Section 3.6.
3.5. Analysis of Shear Strength Indicators
3.5.1. The Effect of Volcanic Ash Cement on Shear Strength
The analysis of
Figure 7a shows that the numerical value of the cohesion is positively correlated with the amount of volcanic ash cement added and the curing age. When the amount of volcanic ash cement added is 15% and the curing age is 28 days, the numerical value of the cohesion is the highest: 2.55 times that of the cohesion when the amount of volcanic ash cement added is 5% and the curing age is 28 days, and 1.43 times that of the cohesion when the amount of volcanic ash cement added is 15% and the curing age is 7 days. This indicates that the proportion of the increase in cohesion due to the addition of volcanic ash cement is higher than that due to the extension of the curing age. This is because adding more volcanic ash cement fills the pores between calcareous sand particles more compactly and makes the adjacent particles more closely bonded. Extending the curing age enhances the connection strength between adjacent calcareous sand particles, but it does not change the porosity.
The analysis of
Figure 7b shows that the height difference in the column chart varies within a small range under different conditions, and the internal friction angle is the largest at a curing age of 28 days. For example, when the amount of volcanic ash cement added is 15% and the curing age is 28 days, the internal friction angle is 1.08 times that of the internal friction angle when the amount of volcanic ash cement added is 5% and the curing age is 28 days, and 1.04 times that of the internal friction angle when the amount of volcanic ash cement added is 10% and the curing age is 28 days.
It can be seen that the amount of volcanic ash cement added and the curing age have an enhancing effect on the internal friction angle and cohesion, with a more significant effect on the cohesion.
3.5.2. The Effect of Graphene Oxide on Shear Strength
As shown in
Figure 8a, when 15% of the volcanic ash cement is used as a binder, the maximum cohesion is achieved when the amount of oxidized graphene added is 0.06% and the curing age is 28 days, with an improvement of 34.45% compared with the case with only 15% of the volcanic ash cement. Similarly, when the amount of oxidized graphene added is 0.02% and the curing age is 28 days, the improvement ratio is 2.85%; when the amount of oxidized graphene added is 0.04% and the curing age is 28 days, the improvement ratio is 7.95%; and when the amount of oxidized graphene added is 0.1% and the curing age is 28 days, the improvement ratio is 24.82%.
As shown in
Figure 8b, when 15% of the volcanic ash cement is used as a binder, the maximum internal friction angle is achieved when the amount of oxidized graphene added is 0.06% and the curing age is 28 days, with an improvement of 10.72% compared with the case with only 15% of the volcanic ash cement. Similarly, when the amount of oxidized graphene added is 0.02% and the curing age is 28 days, the improvement ratio is 10.36%; when the amount of oxidized graphene added is 0.04% and the curing age is 28 days, the improvement ratio is 5.36%; and when the amount of oxidized graphene added is 0.1% and the curing age is 28 days, the improvement ratio is 8.02%.
From the above analysis, it can be seen that under the same conditions, the improvement ratio of cohesion is the highest when the amount of oxidized graphene added is 0.06%, and the modification effect is the best. When the amount of oxidized graphene added is increased to 0.1%, the improvement ratio of cohesion shows a decreasing trend.
3.6. Analysis of the Peak Shear Stress Indicator
3.6.1. The Effect of Volcanic Ash Cement on Peak Shear Stress
As shown in
Figure 9, the content of graphene oxide is 0%. For the same confining pressure, at a confining pressure of 100 kPa, the highest increase in peak stress is 4.17 times; at a confining pressure of 200 kPa, the highest increase in peak stress is 3.55 times; at a confining pressure of 300 kPa, the highest increase in peak stress is 4.00 times; and at a confining pressure of 400 kPa, the highest increase in peak stress is 3.31 times. For the same curing age, at a curing age of 7 days, the highest increase in peak stress is 5.84 times at a curing age of 14 days, the highest increase in peak stress is 5.10 times; and at a curing age of 28 days, the highest increase in peak stress is 4.97 times. For the same amount of volcanic ash cement added, the highest increase in peak stress with 5% of the volcanic ash cement added is 3.09 times; with 10% of the volcanic ash cement added, the highest increase in peak stress is 2.80 times; and with 15% of the volcanic ash cement added, the highest increase in peak stress is 2.48 times.
In summary, the curing age, confining pressure, and amount of volcanic ash cement added all have a positive effect on the peak deviatoric stress of the specimens, but the underlying mechanisms are different. As the curing age increases, the degree of hydration reaction in the specimens gradually becomes more complete, and the peak deviatoric stress of the specimens increases to varying degrees. As the confining pressure increases, the hydration reaction consumes the water in the specimens, causing the specimens in a low saturation state to exhibit isotropic compression and a decrease in porosity, and the strength and stiffness of the modified calcareous sand specimens also increase accordingly. Increasing the amount of volcanic ash cement added can ensure that the volcanic ash cement is fully bonded with the calcareous sand, filling the pores between the calcareous sand particles.
3.6.2. The Effect of Graphene Oxide on Peak Shear Stress
As shown in
Figure 9, under the same confining pressure, the maximum enhancement ratio after modification can reach 31.24%. This increase in enhancement ratio is not linear. In some cases, such as under a confining pressure of 400 kPa, the enhancement ratio with 0.04% graphene oxide content is 2.62%, and with 0.1% graphene oxide content is 5.66%, which are both significantly lower than the enhancement ratio of 15.46% with 0.06% content. The same situation exists under other confining pressure conditions, which indicates that there is a threshold value for the content of graphene oxide at which the enhancement effect is most pronounced.
From the analysis above, it is known that the modification effect is best when the content of graphene oxide is 0.06%, and the peak stress enhancement ratio shows a decreasing trend when the content of graphene oxide is 0.1%. However, when the content of graphene oxide is 0.1%, the effect on improving the compressive strength of the volcanic ash cement calcareous sand mortar decreases.
3.7. Damage Form
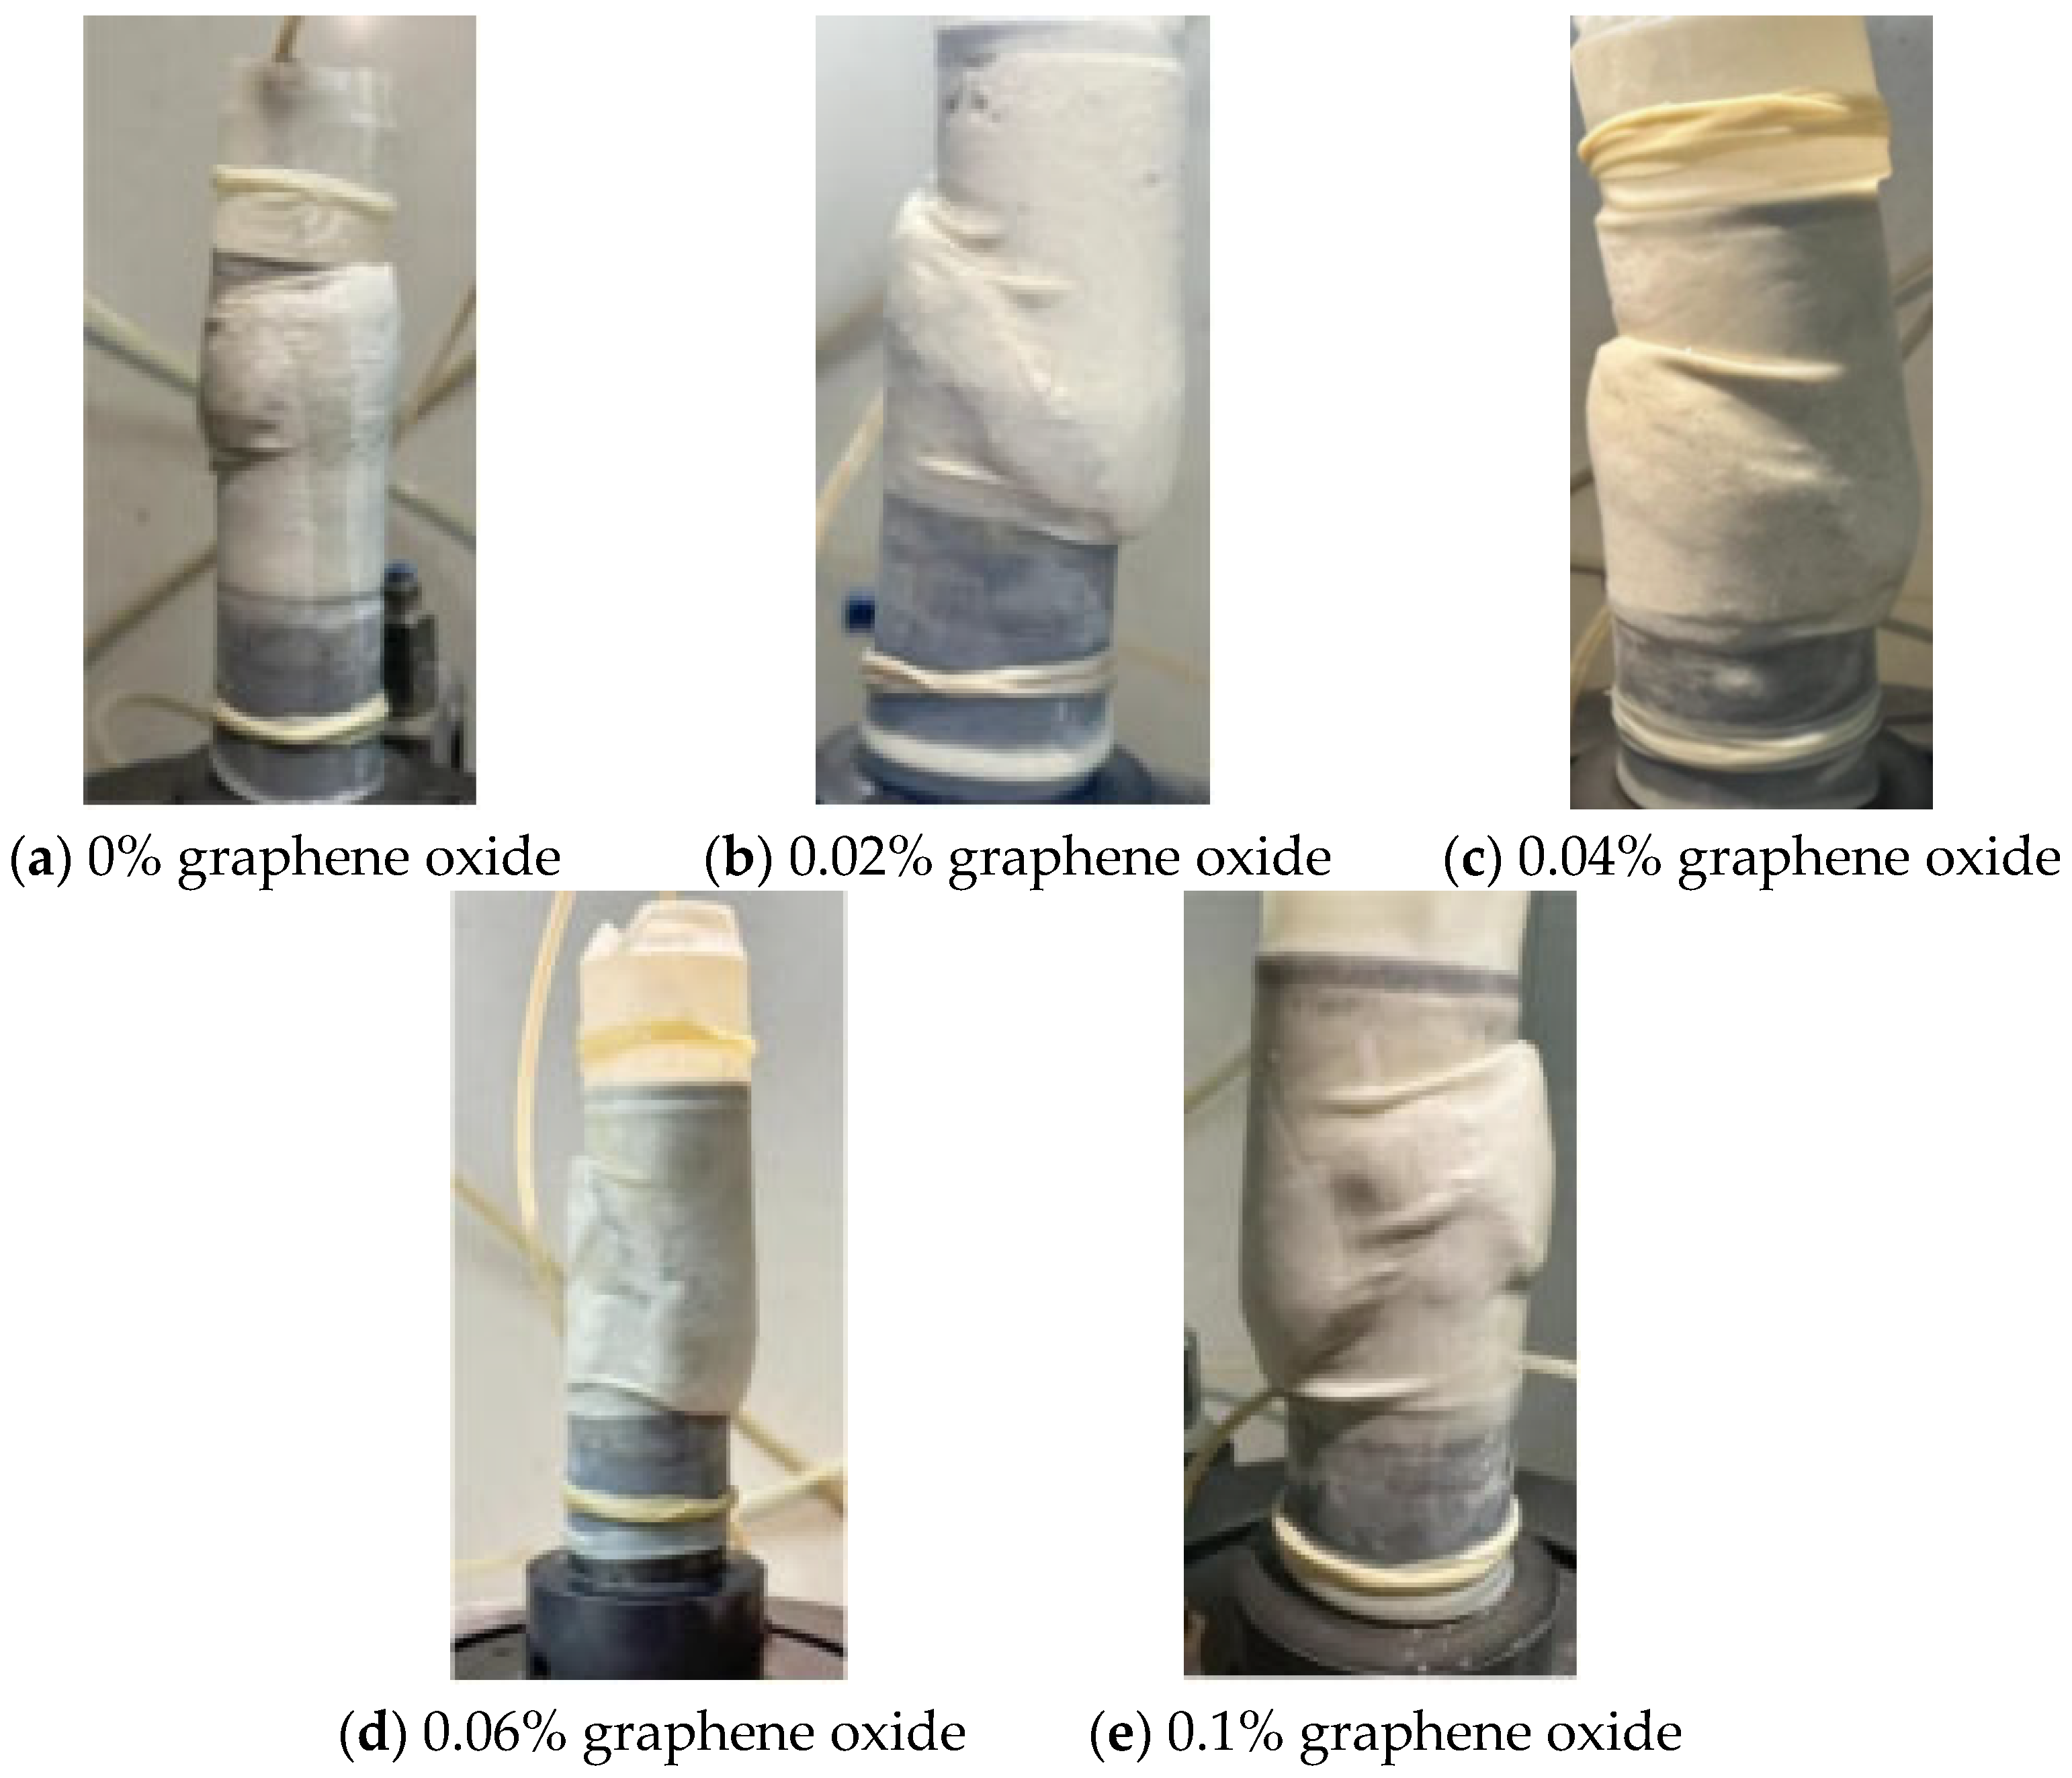
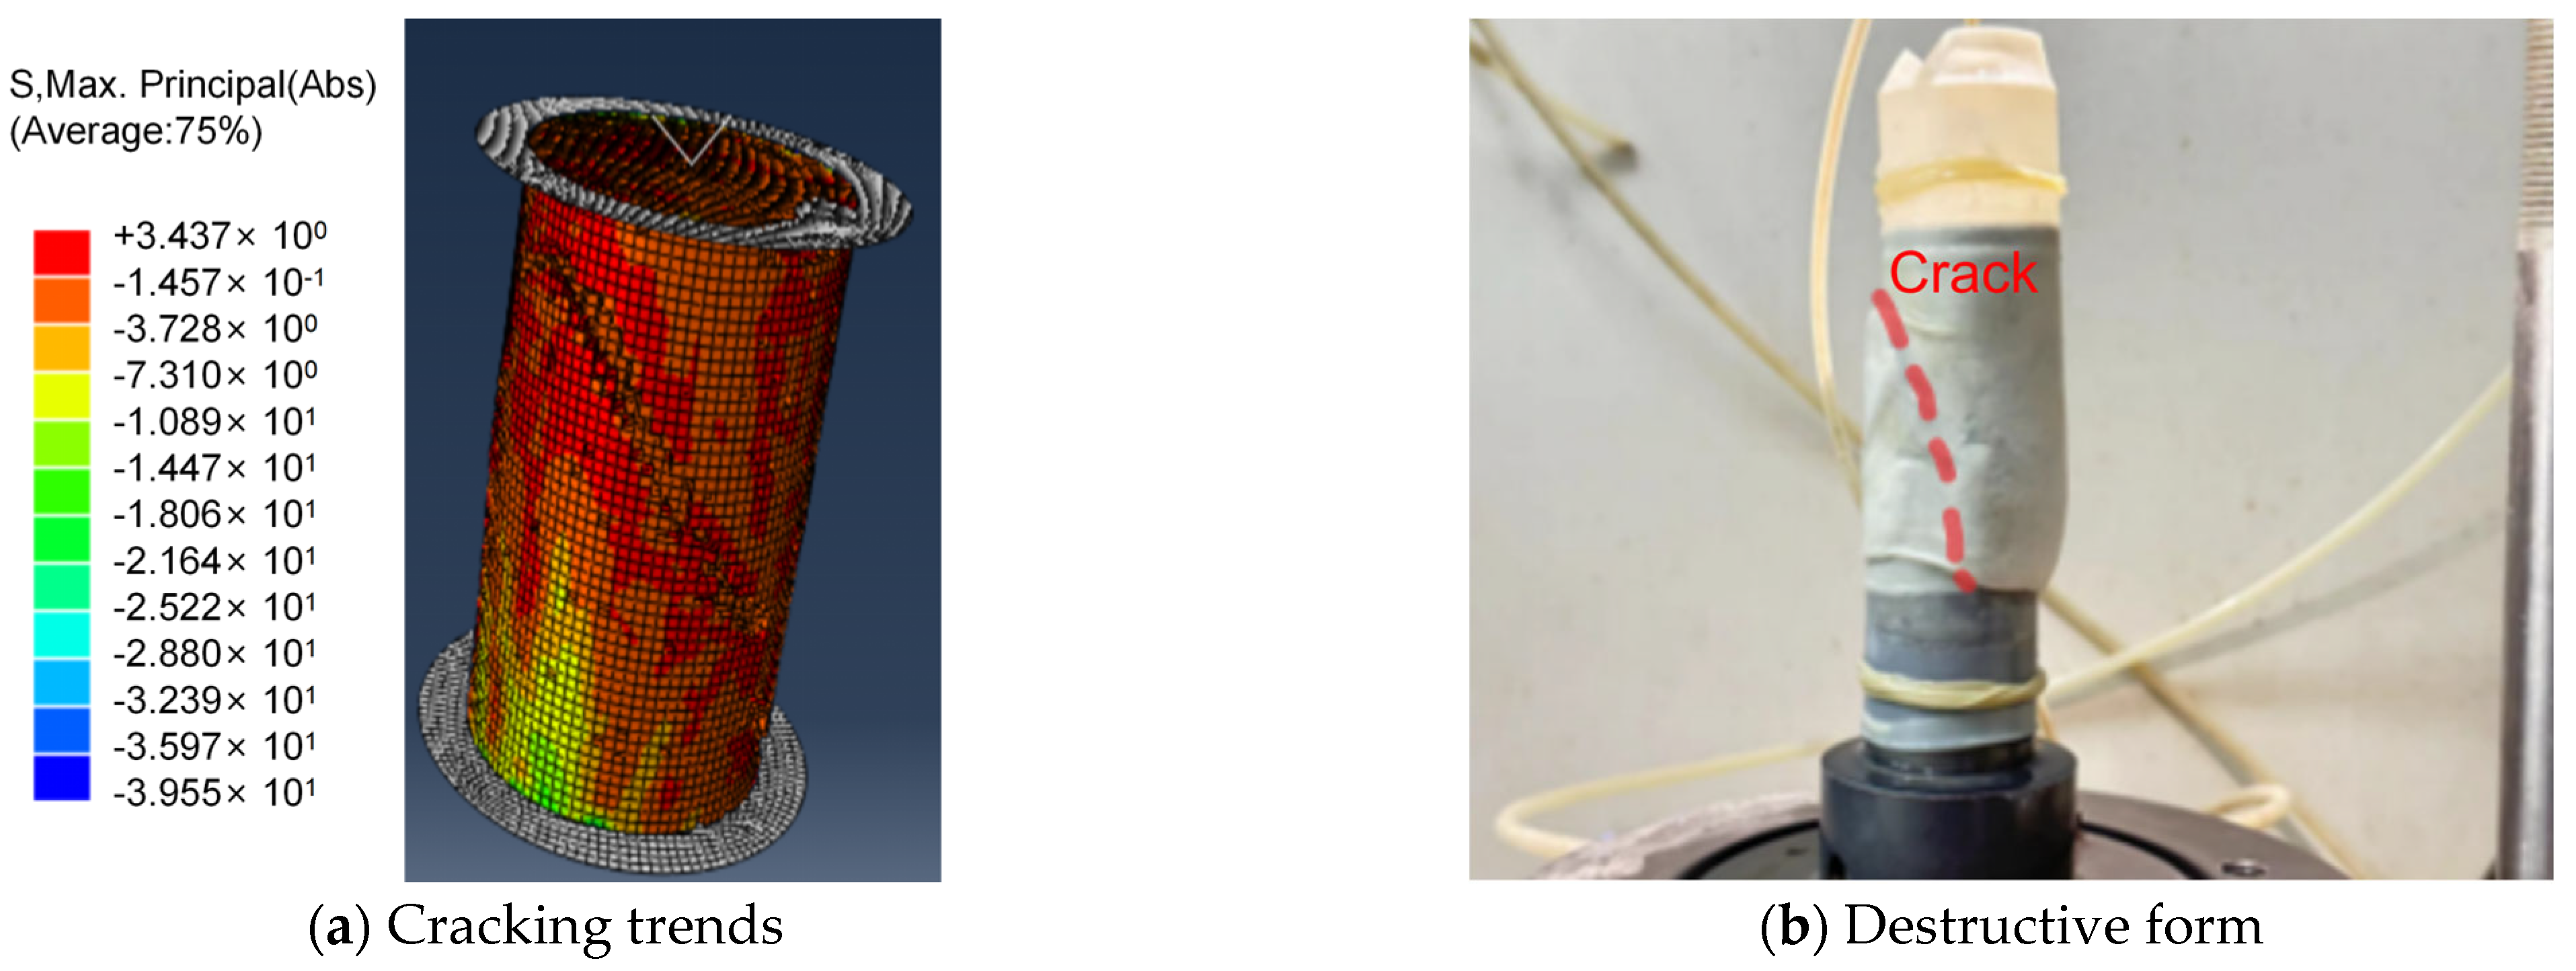
The analysis of the failure morphology of calcium sand specimens with different additions of graphene oxide under load, when the addition of volcanic ash cement and the curing time are the same, is shown in
Figure 10. Initially, cracks appear at the top of the cylindrical specimen and then extend to the surrounding area. The outer part of the specimen bulges continuously, and its volume increases. When it reaches a certain “critical state,” the specimen completely loses its load-bearing capacity.
Figure 10 shows the failure morphology of the specimen. The cracks start from the outside of the specimen and develop towards the bottom. At this time, the specimen exhibits a clear single-slope fracture. Comparing the failure morphologies of the four specimens with different additions of graphene oxide, it can be seen that the length of the cracks in
Figure 10c is greater than those in
Figure 10a,b,d. This indicates that under the same load, the path of force transmission in the specimen in
Figure 10c is more complete than in
Figure 10a,b,d, and its ability to resist the load is stronger. This is because the addition of graphene oxide promotes the hydration reaction between volcanic ash cement and water, enhancing the bonding between calcareous sand particles and volcanic ash cement, thereby reducing internal porosity and allowing the load to be transmitted more limitedly within the specimen.
3.8. Mechanism Analysis
In previous studies [
24], we observed that tricalcium silicate (Ca
3SiO
5) in pozzolanic cement reacts with water to form early hydration products, specifically white Ca(OH)
2 precipitates. For incompletely reacted pozzolanic cement particles, they tend to adsorb onto the surface of calcareous sand particles. However, as the reaction proceeds more thoroughly, C-S-H gel (3CaO·2SiO
2·4H
2O) gradually forms. The chemical reactions are represented by Equations (4) and (5) as follows:
Without the incorporation of graphene oxide, the hydration reaction of pozzolanic cement remains incomplete. Furthermore, due to the inherently porous structure of calcareous sand, the resulting specimens exhibit excessive porosity, which consequently compromises their overall strength.
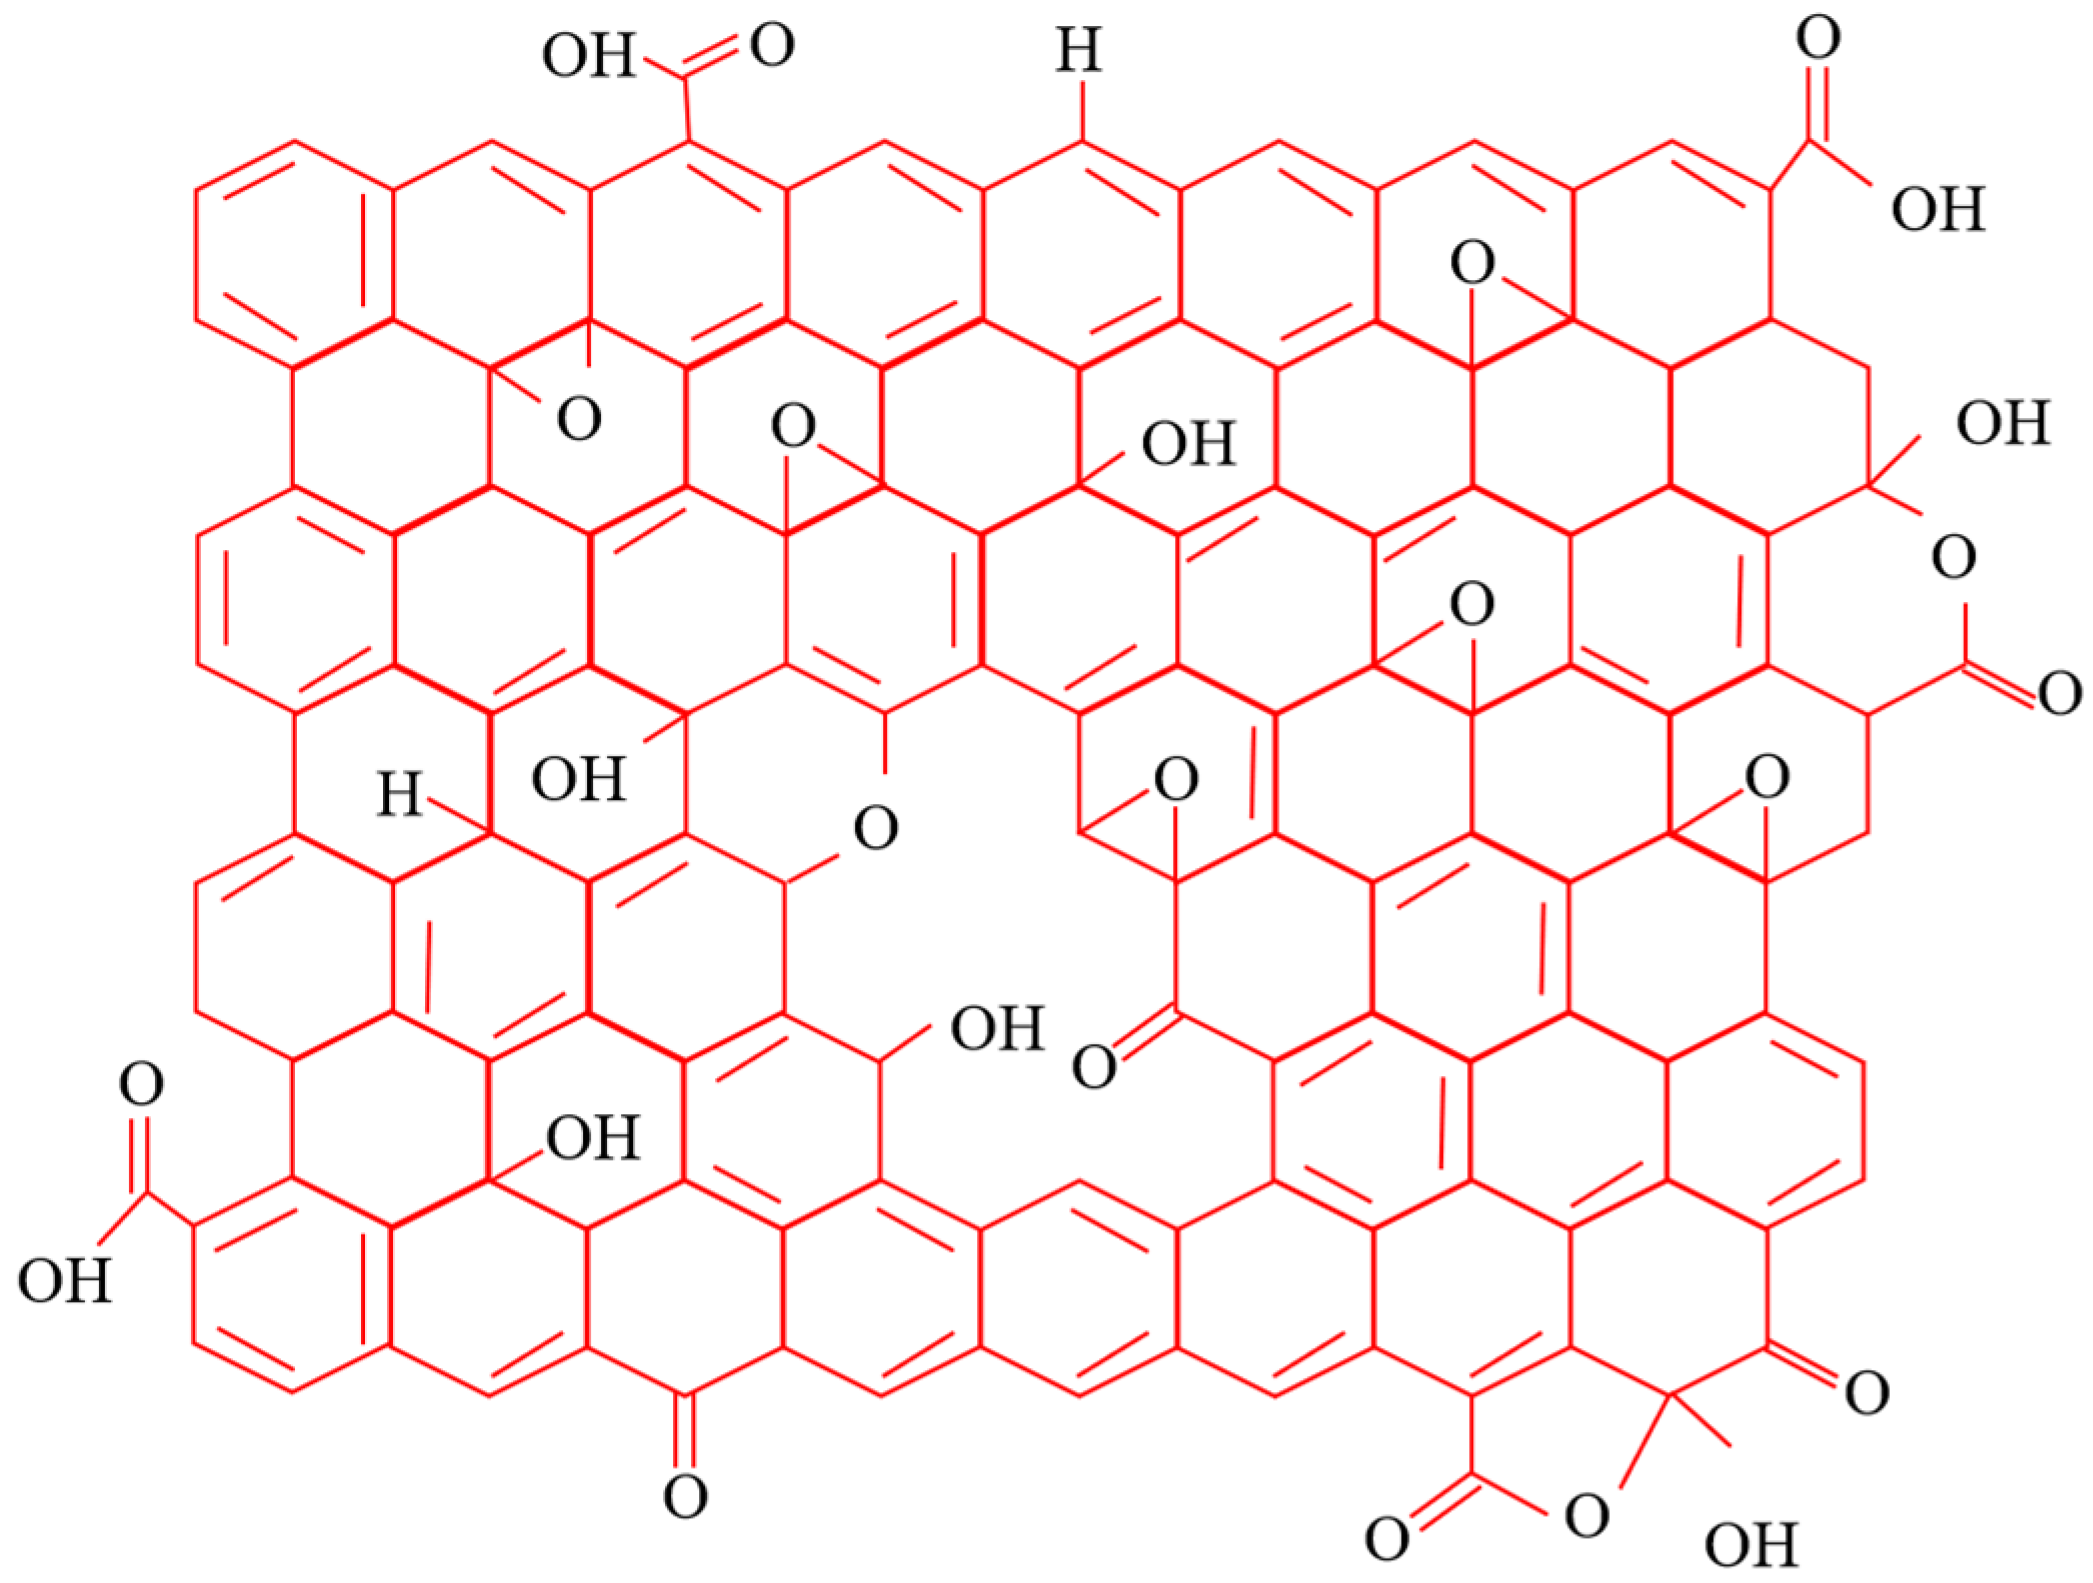
The large specific surface area of graphene oxide provides attachment sites for free Ca2+ ions, while its oxygen-containing functional groups (-COOH) interact with the C-S-H gel (3CaO·2SiO2·4H2O) to form a more compact network structure. This enhanced microstructure effectively addresses the porosity issue and improves the mechanical properties of the cementitious composite.
The experimental results demonstrate that graphene oxide exerts a positive effect on the specimen strength, with the maximum strength enhancement achieved at an incorporation content of 0.06%.This is because the hydroxyl (-OH) and carboxyl (-COOH) groups in the added graphene oxide promote the hydration reaction of the volcanic ash cement calcareous sand mortar, thereby making the internal structure more compact. However, when the graphene oxide incorporation content was increased to 0.1%, all strength parameters showed varying degrees of reduction compared with the 0.06% dosage. The main reason is that too many graphene oxide particles cannot be fully unfolded, which in turn weakens the hydration reaction of the volcanic ash cement calcareous sand mortar.
As illustrated in
Figure 11, owing to the inherently porous nature of calcareous sand, cement gel particles effectively fill the voids between adjacent calcareous sand particles. The dosage of pozzolanic cement directly determines the quantity of cementitious particles participating in the hydration reaction. Notably, a higher pozzolanic cement content results in stronger interparticle bonding, thereby leading to the further enhancement of the specimen’s mechanical strength.


