Article

Comparative Evaluation of Stress Distribution and Permeability Characteristics in Bentonite Cutoff Walls Using CPTU and ABAQUS Methods

1
School of Civil Engineering, Guangdong Construction Polytechnic, Qingyuan 511500, China
2
Anhui Institute of Intelligent Underground Detection Technology, Anhui Jianzhu University, Hefei 230601, China
3
School of Mechanics and Civil Engineering, China University of Mining and Technology, Xuzhou 221116, China
*
Author to whom correspondence should be addressed.
Materials 2025, 18(16), 3919; https://doi.org/10.3390/ma18163919
Submission received: 24 July 2025 / Revised: 17 August 2025 / Accepted: 19 August 2025 / Published: 21 August 2025

Abstract

Bentonite materials are extensively used in cutoff walls at landfill sites. This study calculates the stress and permeability characteristics of bentonite materials using the piezocone penetration test (CPTU) and ABAQUS simulations. The lateral effective stress of bentonite materials is evaluated using arching models, lateral squeezing models, and a modified lateral squeezing model. Pore pressure dissipation types are categorized into standard and non-standard, with the coefficient of consolidation obtained using the half dissipation time of excess pore pressure (t50) method. In the standard dissipation type, the excess pore pressure gradually dissipates over time after the cone stops penetrating. In contrast, the non-standard dissipation type is characterized by an initial increase in pore pressure until it reaches a maximum value, followed by a decrease to hydrostatic pressure. Additionally, the pore pressure dissipation process in bentonite cutoff walls is recorded and analyzed over various time intervals. Finally, the relationship between hydraulic conductivity and t50 at landfill sites is established based on standard and non-standard dissipation types using CPTU and ABAQUS methods. The t50 method is used for the standard dissipation type, while a modified t50m method is used for the non-standard dissipation type from CPTU and a t50m method is used in the non-standard dissipation type from CPTU. The t50m is the modified value derived from t50. Cutoff walls made from bentonite materials offer the advantage of enhancing the isolation effects and meeting the design requirement of permeability (1.0 × 10⁻⁷ cm/s).

1. Introduction

The most commonly used isolation and anti-seepage systems in landfills are horizontal anti-seepage systems and vertical cutoff walls, which can be constructed using curtain grouting around the landfill [1]. Techniques such as bentonite and curtain grouting for establishing vertical cutoff walls around landfills are noted for their effective anti-seepage effect, low cost, and ease of repair, indicating a broad range of application possibilities [2].
The materials for cutoff walls primarily consist of a mixture of dry bentonite, soil, and bentonite slurry [3]. Soil–bentonite cutoff walls offer lower permeability and better uniformity compared to those made from topsoil or cement-bentonite. From the in situ studies, the bentonite content in cutoff wall material ranges from 4% to 8%, with a solid content of approximately 70% [4]. D’Appolonia [5] suggested that the thickness of the cutoff wall should be between 0.6 m and 1.5 m, considering the size of the slotting machine.
The piezocone penetration test (CPTU) is a newly developed in situ testing method for evaluating the coefficient of consolidation and hydraulic conductivity during the dissipation process [6,7,8]. Bentonite-based cutoff walls are widely used in polluted site remediation due to their simple construction and robust anti-seepage properties [9,10,11]. CPTU technology combines traditional static cone penetration testing with pore pressure element testing [12]. Lunne et al. [13] summarized most current piezocone penetration test methods for predicting permeability, highlighting the importance of the coefficient of consolidation. Sully et al. [14] applied CPTU technology to overconsolidated soil and proposed the t50m method for evaluating the parameters of overconsolidated soil. Elsworth and Lee [15] introduced a technique for assessing soil permeability using CPTU technology. Chai et al. [16] developed a new method for calculating consolidation permeability through numerical simulations. Jiang et al. [17] optimized the sodium hexametaphosphate content in the cutoff wall to 2% for improved workability.
Dong et al. [18] conducted a geotechnical centrifuge model test to illustrate the cumulative impact, which increased with depth and reached its maximum value. To investigate the uncertainty of the stress state, Evans et al. [19] were the first to study it and concluded that the sidewall frictional resistance of the cutoff wall caused a stress distribution within the cutoff wall material. The effective vertical stress can be expressed by Equation (1).
σ v = B 2 γ b 2 c b B k b t a n ϕ b 1 e x p 2 k b z B t a n ϕ b
where B is the thickness of the cutoff wall, γ b is the effective density, kb is the coefficient of Earth pressure at rest, cb is the internal cohesion, δ is the internal friction angle, kb is the cohesion, ϕ b is the effective internal friction angle, and z is the calculated depth.
Xu et al. [20] utilized ABAQUS software to further develop the Duncan–Chang constitutive model. Shi et al. [21] employed Fast Lagrangian Analysis of Continua in 3 Dimensions (FLAC3D) for soil consolidation and simulated engineering cases, with the simulation values showing agreement with the measured values. Sun and Gao [22] used ABAQUS analysis to simulate the soil consolidation process. Chai et al. [23] simulated the penetration process of a CPTU probe with ABAQUS and provided a cloud map to depict the spatial distribution of induced pore pressure over time.
The CPTU empirical formula is primarily applicable to cohesive soil, and relatively little research has focused on soil–bentonite materials. These formulas may not be suitable for soil–bentonite. Further efforts are needed to increase the application of CPTU technology in soil–bentonite cutoff walls, providing reference value for evaluating the physical and mechanical characteristics of bentonite cutoff walls using CPTU technology.
The purpose of this experiment is to study the effective stress distribution of a bentonite cutoff wall, as derived from three theoretical models. Additionally, it aims to establish the relationship between the ch and the modified t50, as determined by CPTU for two different pore pressure dissipation types. Considering that ABAQUS can provide a cloud map to depict the distribution of induced pore pressure over time, this paper also uses ABAQUS to investigate the pore pressure of bentonite cutoff walls at various times.

2. Materials and Methods

2.1. Test Materials

A test project for this study was conducted at a landfill site in China. The bentonite used for the cutoff wall was hydrogel from the Wyo-Ben, Inc., Greybull, WY, USA, while the base soil was sourced from the topsoil between 0 and 1 m below the surface. The materials consisted of 5% bentonite and 95% backfill soil by weight.
The liquid limit of the bentonite was 281.2%, the plastic limit was 64.1%, and the plasticity index was 217.1%. According to the ASTM D2487 [24] classification, bentonite is classified as high plastic clay (CH), positioned above line A and to the right of line B on the plasticity chart. In contrast, the liquid limit of the backfill soil is 30.1%, the plastic limit is 19.6%, and the plasticity index is 10.5%. This classifies the backfill soil as low plastic clay (CL), positioned above line A and to the left of line B on the plasticity chart.
Figure 1 presents the XRD results of the bentonite used in the experiment. The XRD analysis indicates that the clay minerals present include montmorillonite (S) and kaolinite (K), along with non-clay minerals such as quartz (Q), calcite (C), goethite (G), and rutile (An). The figure shows that bentonite comprises 84% clay minerals and 16% non-clay minerals. Montmorillonite constitutes 46% and kaolinite 38% of the clay mineral composition. Among the non-clay minerals, quartz accounts for 3.1%, rutile 0.9%, calcite 3.6%, and goethite 8.4%

2.2. CPTU

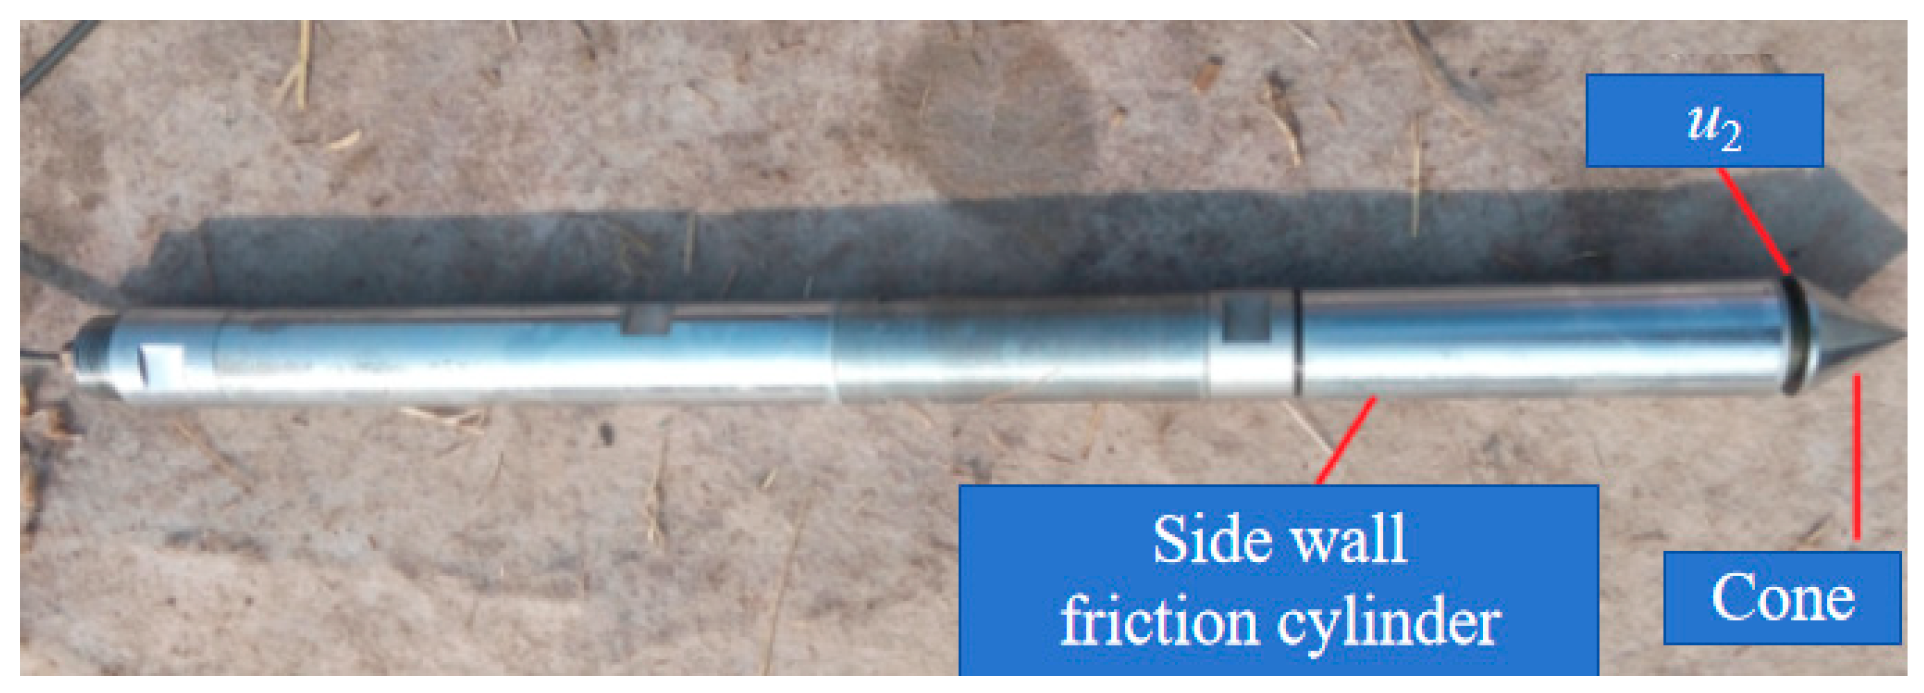
The test was conducted by the piezocone penetration test system imported from Hogentogler, Columbia, MD, USA, equipped with the latest multifunctional digital probe. The system comprises two main components: a drilling vehicle and a static probe system, both of which are equipped with four functional digital hole pressure probes. The system includes several conventional functions, as well as a coneplot and cleanup data processing software 2.0. The CPTU technology not only measures pore pressure but also monitors the dissipation process of excess pore pressure caused by penetration below the groundwater level (Figure 2).

2.3. ABAQUS

To simulate the penetration process of soil–bentonite cutoff walls using ABAQUS 6.14, the model has a thickness of 10 m and a width of 4.6 m. The soil–bentonite cutoff wall is positioned in the center of the model and has a width of 0.6 m. The bottom of the soil layer is undrained, while the top surface is drained. Prior to loading, the soil has consolidated under its own weight stress. Subsequently, a CPTU penetration test is conducted in the soil layer, with the probe reaching a depth of 5 m. The groundwater level is located at a depth of 1 m below the soil–bentonite cutoff wall. This calculation example utilizes the Modified Cambridge Model [25], with the following model parameters: slope K is 0.01, slope λ is 0.1, slope M is 1.2, Poisson’s ratio ν is 0.33, static side pressure coefficient k is 0.56, the soil saturation bulk density is 17.7 kN/m3, the water bulk density is 10 kN/m3, and the permeability coefficient is 4.1 × 10⁻⁸ cm/s. The model parameters are detailed in Table 1 [26,27,28,29].
Equation (2) represents the yield equation of the Modified Cambridge Model [25]. Since the yield trajectory resembles an elliptical curve, it more accurately reflects the characteristics of soil deformation compared to the Cambridge model.
1 + q 2 M 2 p 2 p = p 0
where p is the ball stress, also known as the average normal stress, q is the deviatoric stress, pa is the initial stress, and M is the slope of the critical state line.
ABAQUS is employed to simulate the penetration and consolidation process. The initial conditions of the model must be established in accordance with the actual conditions of the cutoff wall (Table 2). To achieve the most accurate calculation results, it is essential to utilize the most precise initial conditions. Specifically, the initial effective stress at the top surface of the soil layer (y = 10 m) is σx′ = 0 kPa and σy′ = 0 kPa, while that at the bottom surface (y = 0 m) is σx′ = 38.5 kPa and σy′ = −77 kPa. The initial pore pressure u at the top surface of the soil layer is 0 kPa, whereas at the bottom of the soil layer, it is u = 90 kPa.
For the soil–bentonite mixture, the initial porosity ratio (e0) at the top of the soil layer (y = 10 m) is 0.96, compared to 0.54 at the bottom (y = 0 m). In the outer foundation soil of the soil–bentonite wall, the e0 value at the top (y = 10 m) is 0.79, and at the bottom (y = 0 m), it is 0.51. The initial dry density at the upper section of the soil layer (y = 10 m) is 1.28 g/cm3, while at the lower section (y = 0 m), it is 1.42 g/cm3. The initial yield surface size at the top of the soil layer (y = 10 m) is p′ = 0 kPa, q = 0 kPa, and p0′ = 0 kPa, and at the bottom (y = 0 m), the values are p′ = 51 kPa, q = 38.5 kPa, and p0′ = 80 kPa.

3. Results and Analysis

3.1. Lateral Effective Stress

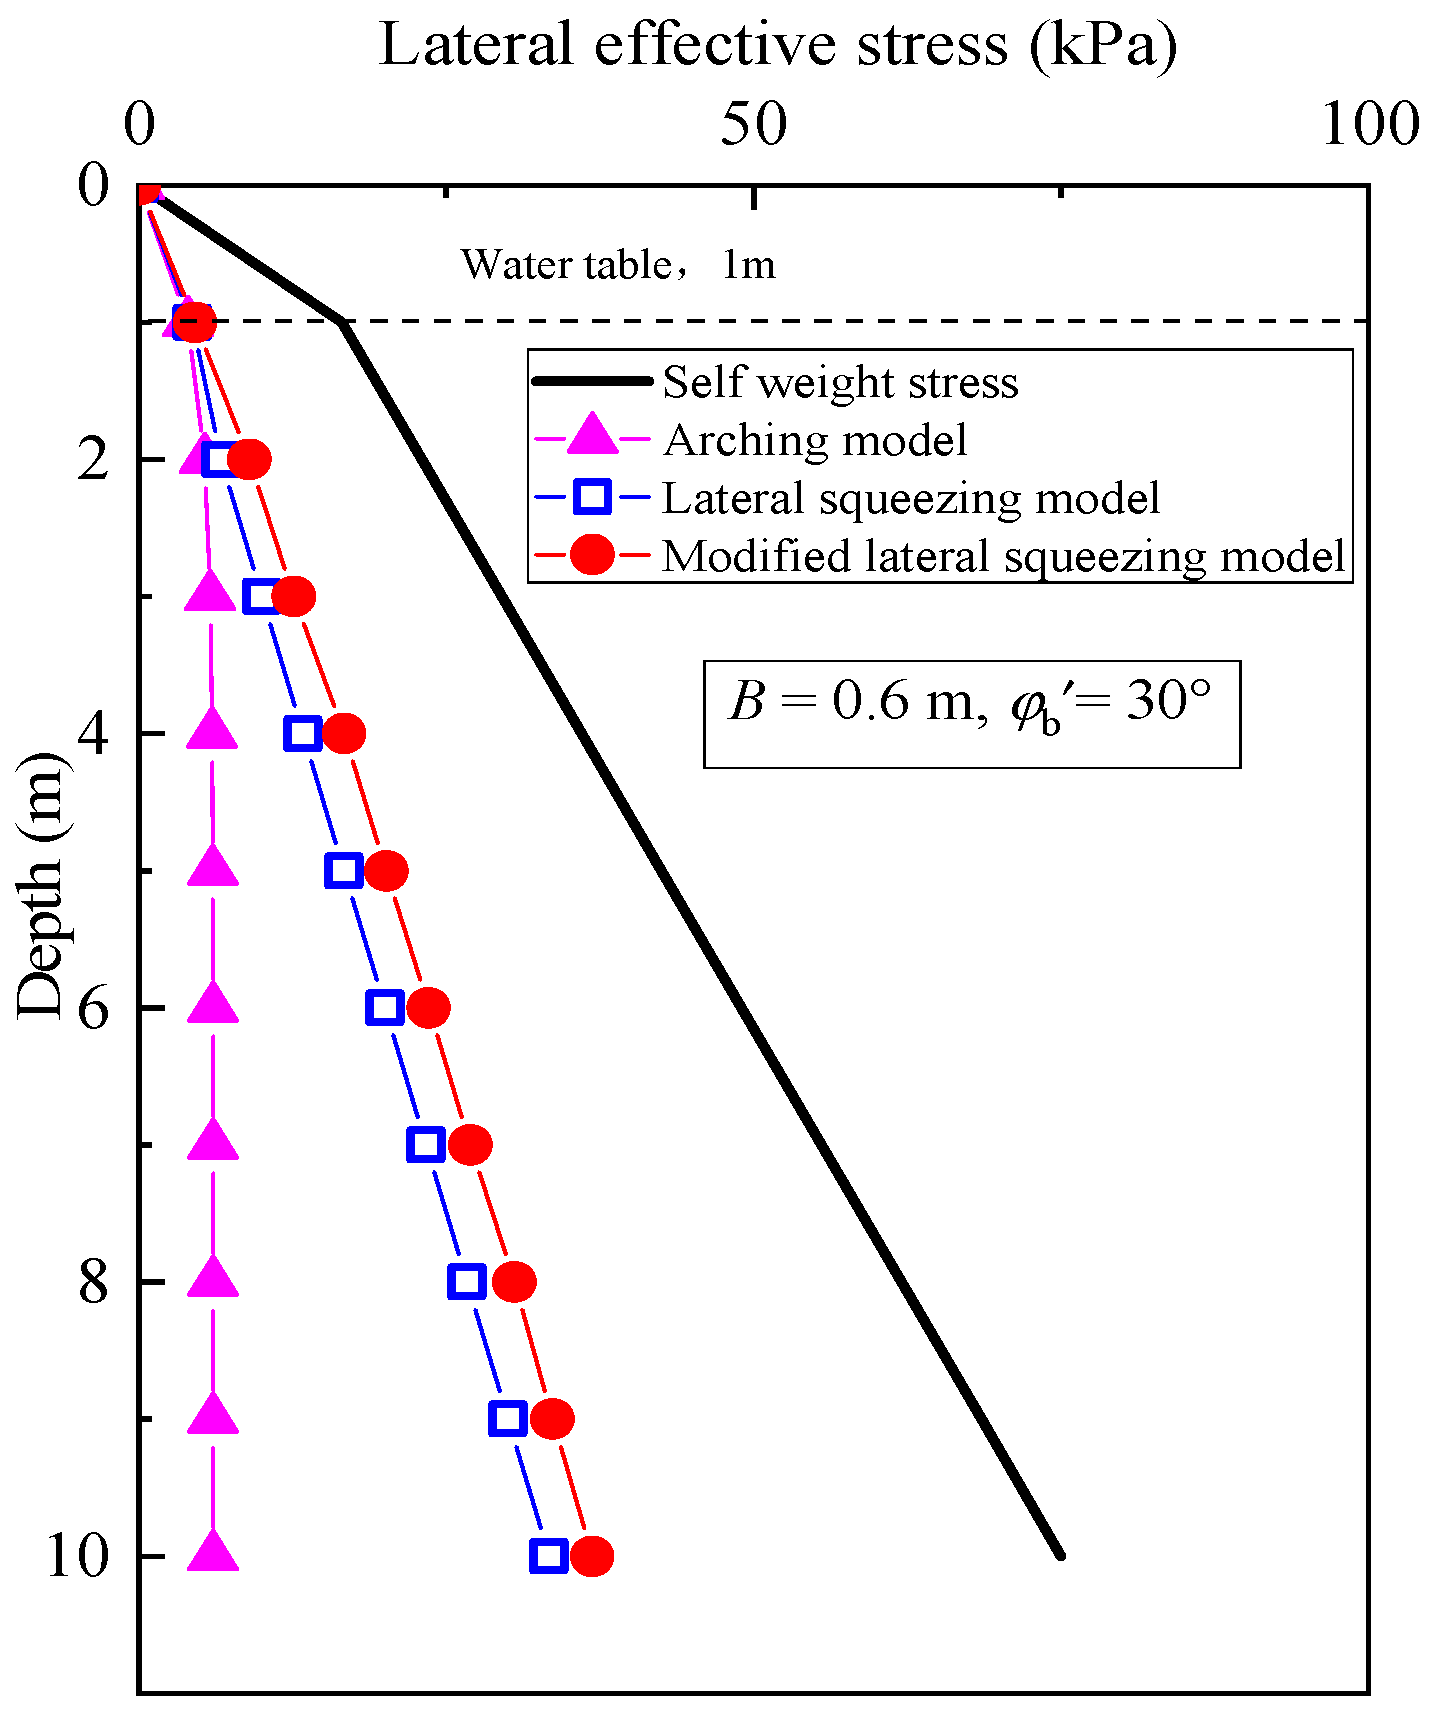
The evaluation of lateral effective stress of the cutoff wall at the landfill site using various theoretical models is presented in Figure 3. The cutoff wall has a width of 1.2 m, a cohesion of 0 kPa, and an effective internal friction angle 30°. The assessment of lateral effective stress is based on the arching model, the lateral squeezing model [29], and the modified lateral squeezing model [30]. The lateral effective stress can be expressed as
σ h = 2 Δ D b B
where σ h is lateral effective stresses of the wall, k a m is the coefficient of lateral pressure of soil, Δ is the lateral deformation of the wall, and D b is the lateral modulus [29].
σ h = 10 2 Δ B C 1 B C c ε
where C1 is the strain value under unit stress of the wall and C is the modified compression index of the wall [30].
This study reveals that the lateral effective stress values obtained from all three models are lower than those resulting from self-weight stress, particularly at greater depths. Moreover, the results generated by the arching model are lower than those produced by the other two models. However, when a rigid cutoff wall is considered, the arching model may underestimate the actual stress distribution.

3.2. CPTU Results

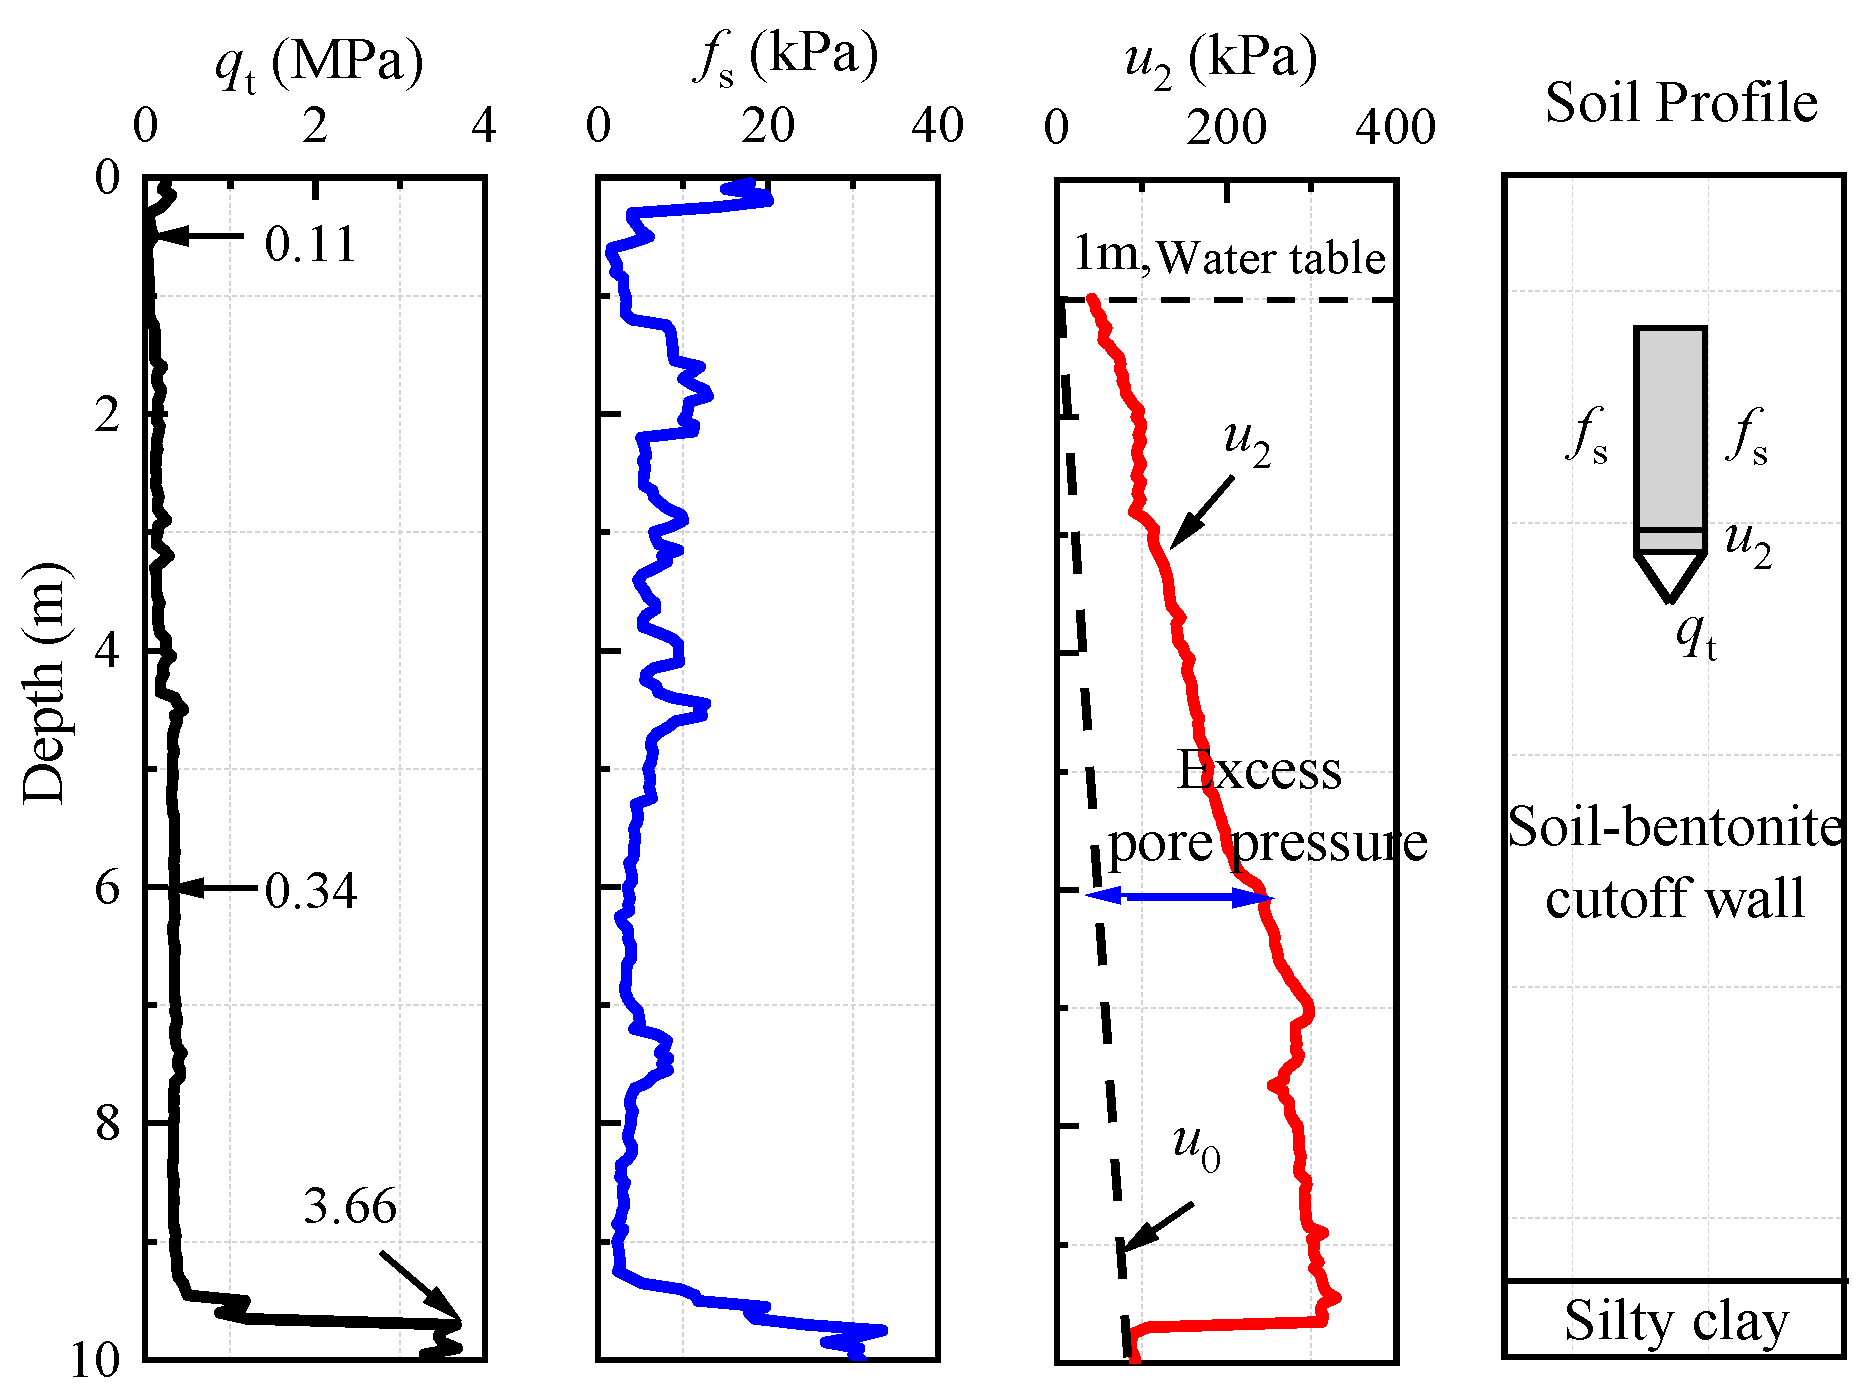
Figure 4 presents the typical test results and soil layer distribution as determined by CPTU. The figure indicates that the cone tip resistance (qt) is 0.11 MPa at 0.5 m and increases to 0.34 MPa at 6 m. The pore pressure exceeds static pore pressure (u0), with this excess attributed to penetration of the probe. The classification of the soil layers reveals that the soil is relatively soft and exhibits high pore pressure, thus categorizing it as a soil–bentonite layer. At approximately 9.3 m of depth, the cone tip resistance shows a significant increase, peaking at around 3.66 MPa. Correspondingly, the pore water pressure (u2) significantly decreases to a level comparable to static pore pressure. The soil at this depth is relatively hard with minimal or no pore pressure, indicating that the probe has penetrated into the original soil layer, which can be classified as a silty clay layer.

3.3. Pore Pressure Dissipation Types

The types of pore pressure dissipation are categorized into standard and non-standard pore pressure dissipation types, as illustrated in Table 3. Excess pore pressure dissipates over time, ultimately reaching 0 kPa, a process referred to as the standard dissipation type. In contrast, in the non-standard dissipation type, the excess pore pressure resulting from probe penetration initially rises to a maximum before starting to decrease. To evaluate the ch for the standard dissipation type, the t50 method is applicable. However, for the non-standard dissipation type, the t50 values must be adjusted. This study employs a modified t50m method instead of t50 to obtain calculation results that align more closely with engineering realities.
The primary factors contributing to the observed variations in dissipation on-site are as follows: Initially, the pore pressure sensor lacks full saturation. As water permeates the sensor, pore pressure steadily increases until complete saturation is achieved. Another crucial factor is the inconsistent mixing of the soil–bentonite material, which can cause shear dilation in specific regions, leading to pore pressure redistribution. The pattern resulting from shear dilation differs across various locations on the cone. For instance, the pore pressure at the cone shoulder and other conical surfaces is lower than that in the surrounding soil. During the consolidation phase, the elevated excess pore pressure in the adjacent soil is redistributed, leading to an increase in excess pore pressure on the cone surface [31,32].
When evaluating the consolidation coefficient, determining the time t50 corresponding to 50% dissipation of excess pore pressure is crucial. A standard dissipation type of pore pressure is observed at 5.35 m, while a non-standard dissipation type occurs at 7.10 m for the soil–bentonite cutoff wall, as shown in Table 3. Half of the excess pore pressure, Δui/2, is 9.05 kPa, corresponding to a t50 of 810 s. The maximum values resulting from probe penetration at 7.10 m are 16.4 kPa, with a dissipation time t50 of 305 s.

3.4. Coefficient of Consolidation and Permeability

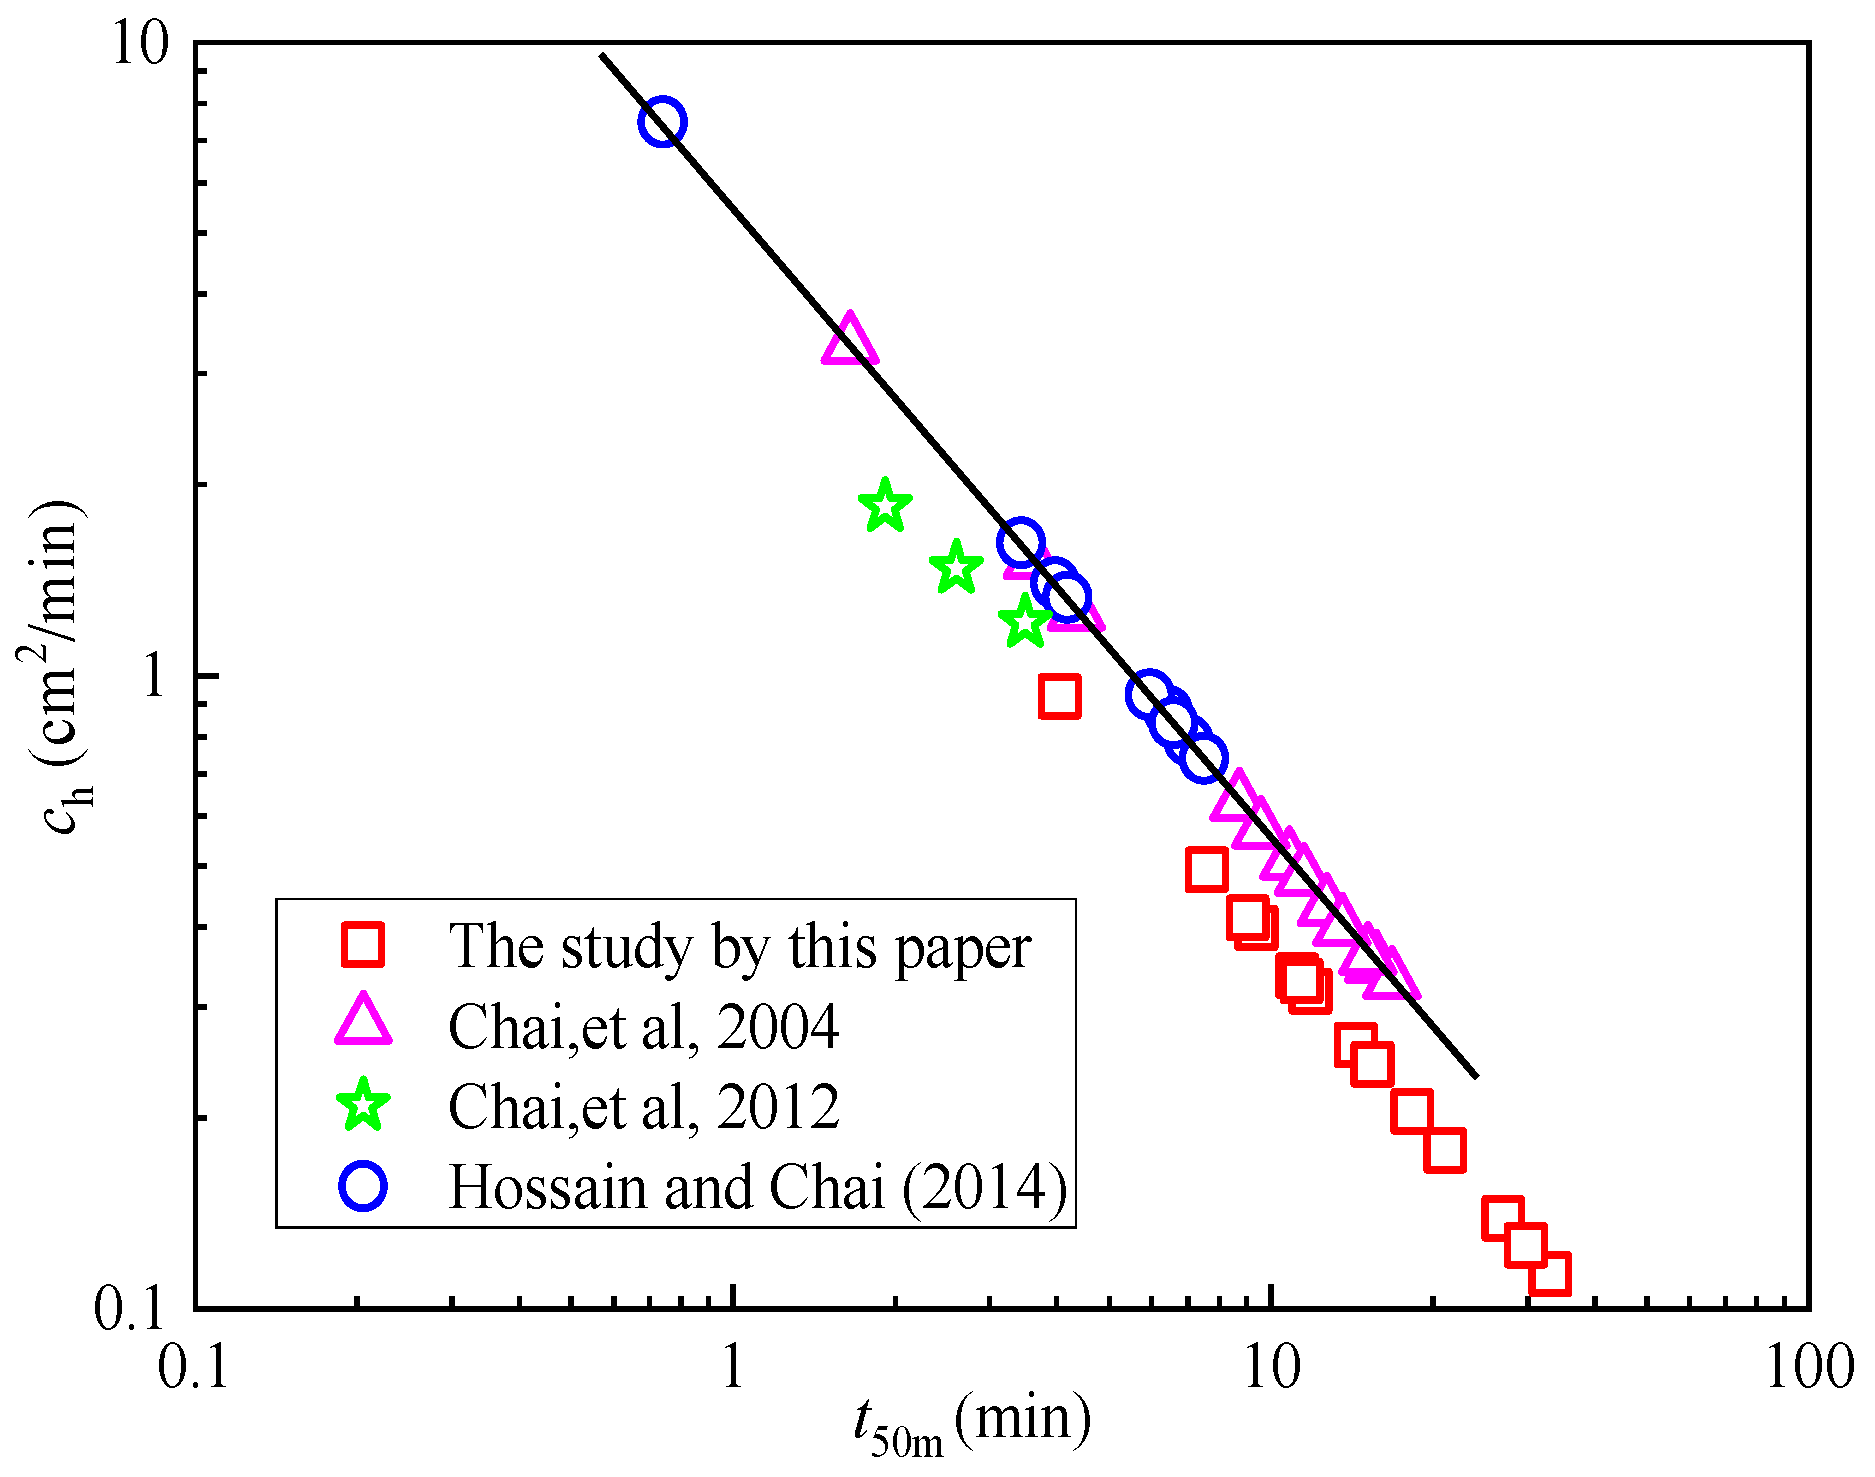
The relationships between the ch values and t50m is illustrated in Figure 5. The t50m values range from 9.4 to 33.1 min, while the ch values vary between 0.11 and 0.96 cm2/min. Additionally, Figure 5 presents the results of the numerical analysis conducted by Chai et al. [23,33], which report t50m values ranging from 1.65 to 16.78 min and the ch values ranging from 0.33 to 3.33 cm2/min. Chai et al. [23,33] focused their research on overconsolidated clay, whereas the materials examined in this paper are in an underconsolidated or normally consolidated state. The variation in ch and logarithmic time investigated in this paper is relatively similar to those observed in previous experiments [34].
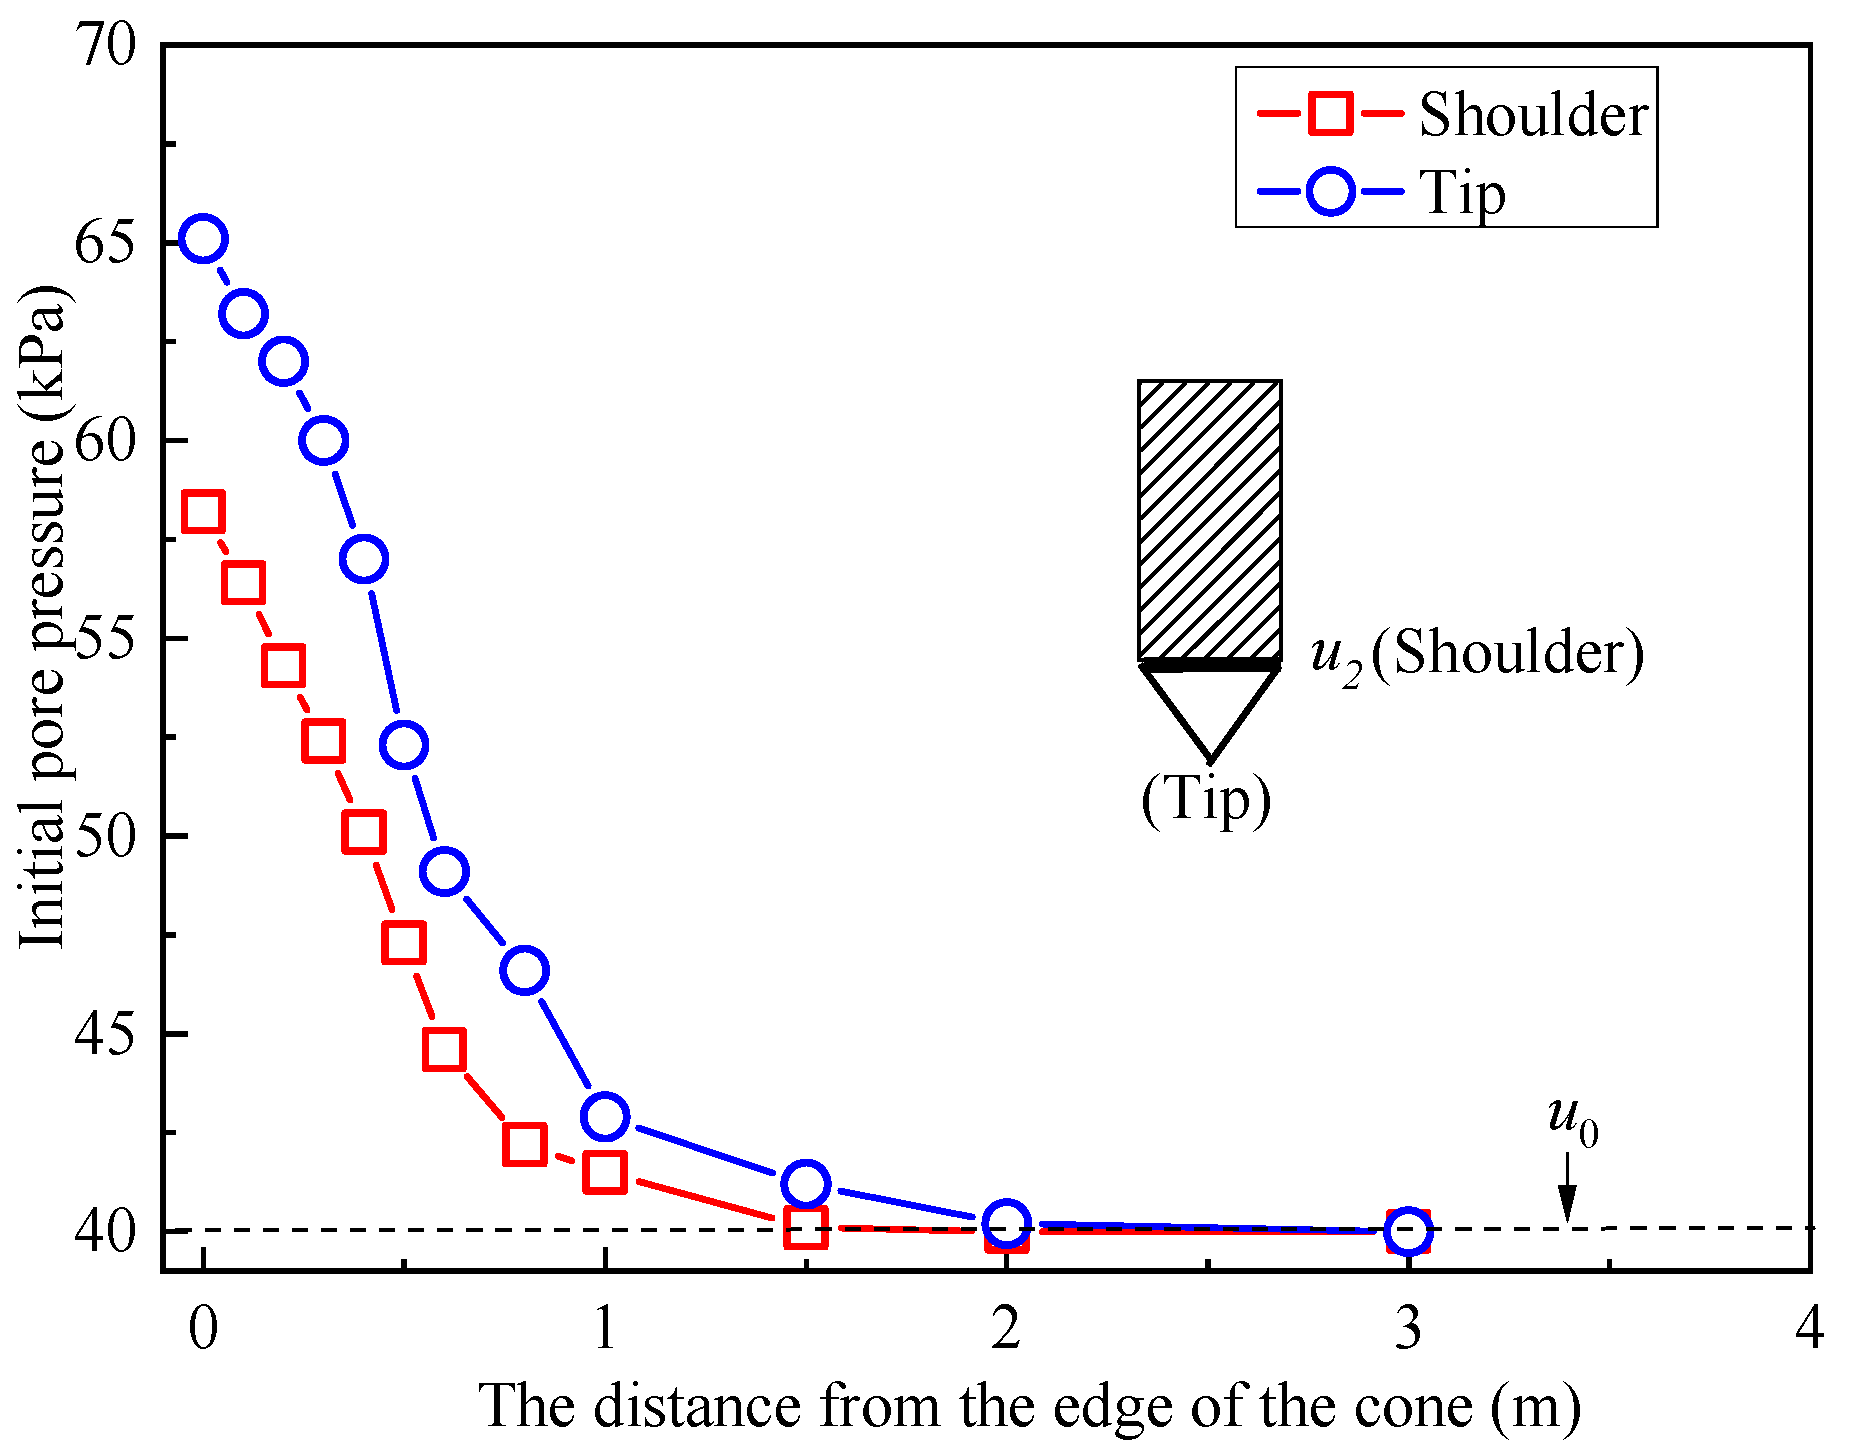
Figure 6 demonstrates the pore pressure distribution surrounding the CPTU cone, emphasizing the pressures at the cone’s shoulder and tip. The figure reveals that, at an equal horizontal distance from the cone’s edge, the pore pressure at the tip exceeds that at the shoulder. Furthermore, the initial pore pressure distribution can be categorized into two stages [35]. Near the cone’s edge, as the distance increases, the initial pore pressure experiences a sharp decline. In contrast, at a greater distance from the probe, the initial pore pressure decreases more gradually, eventually approaching hydrostatic pressure.
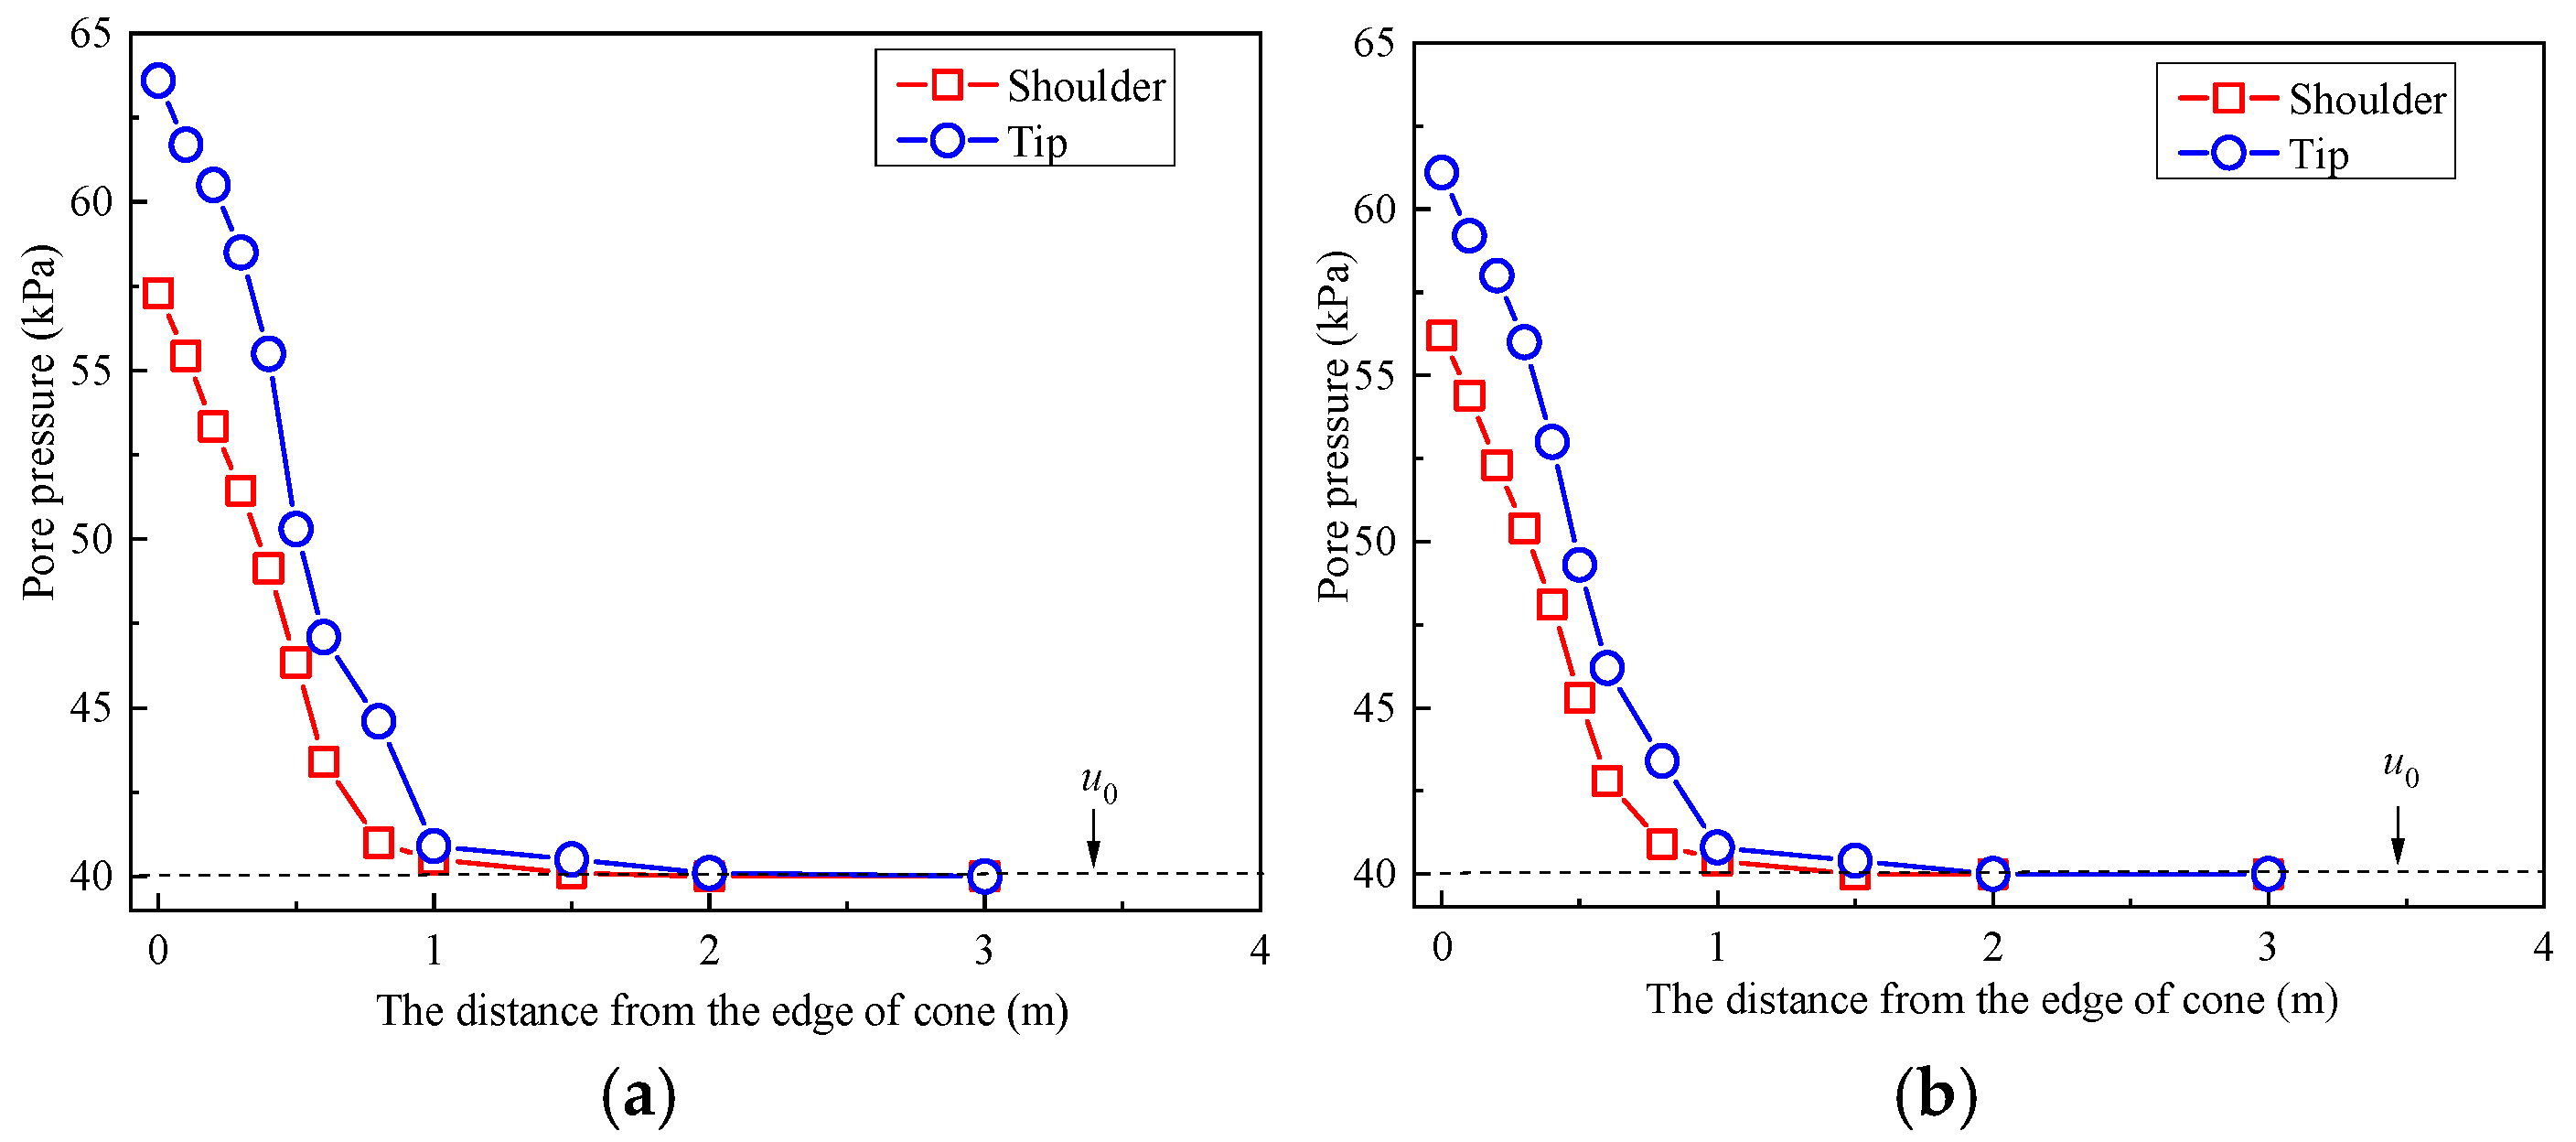
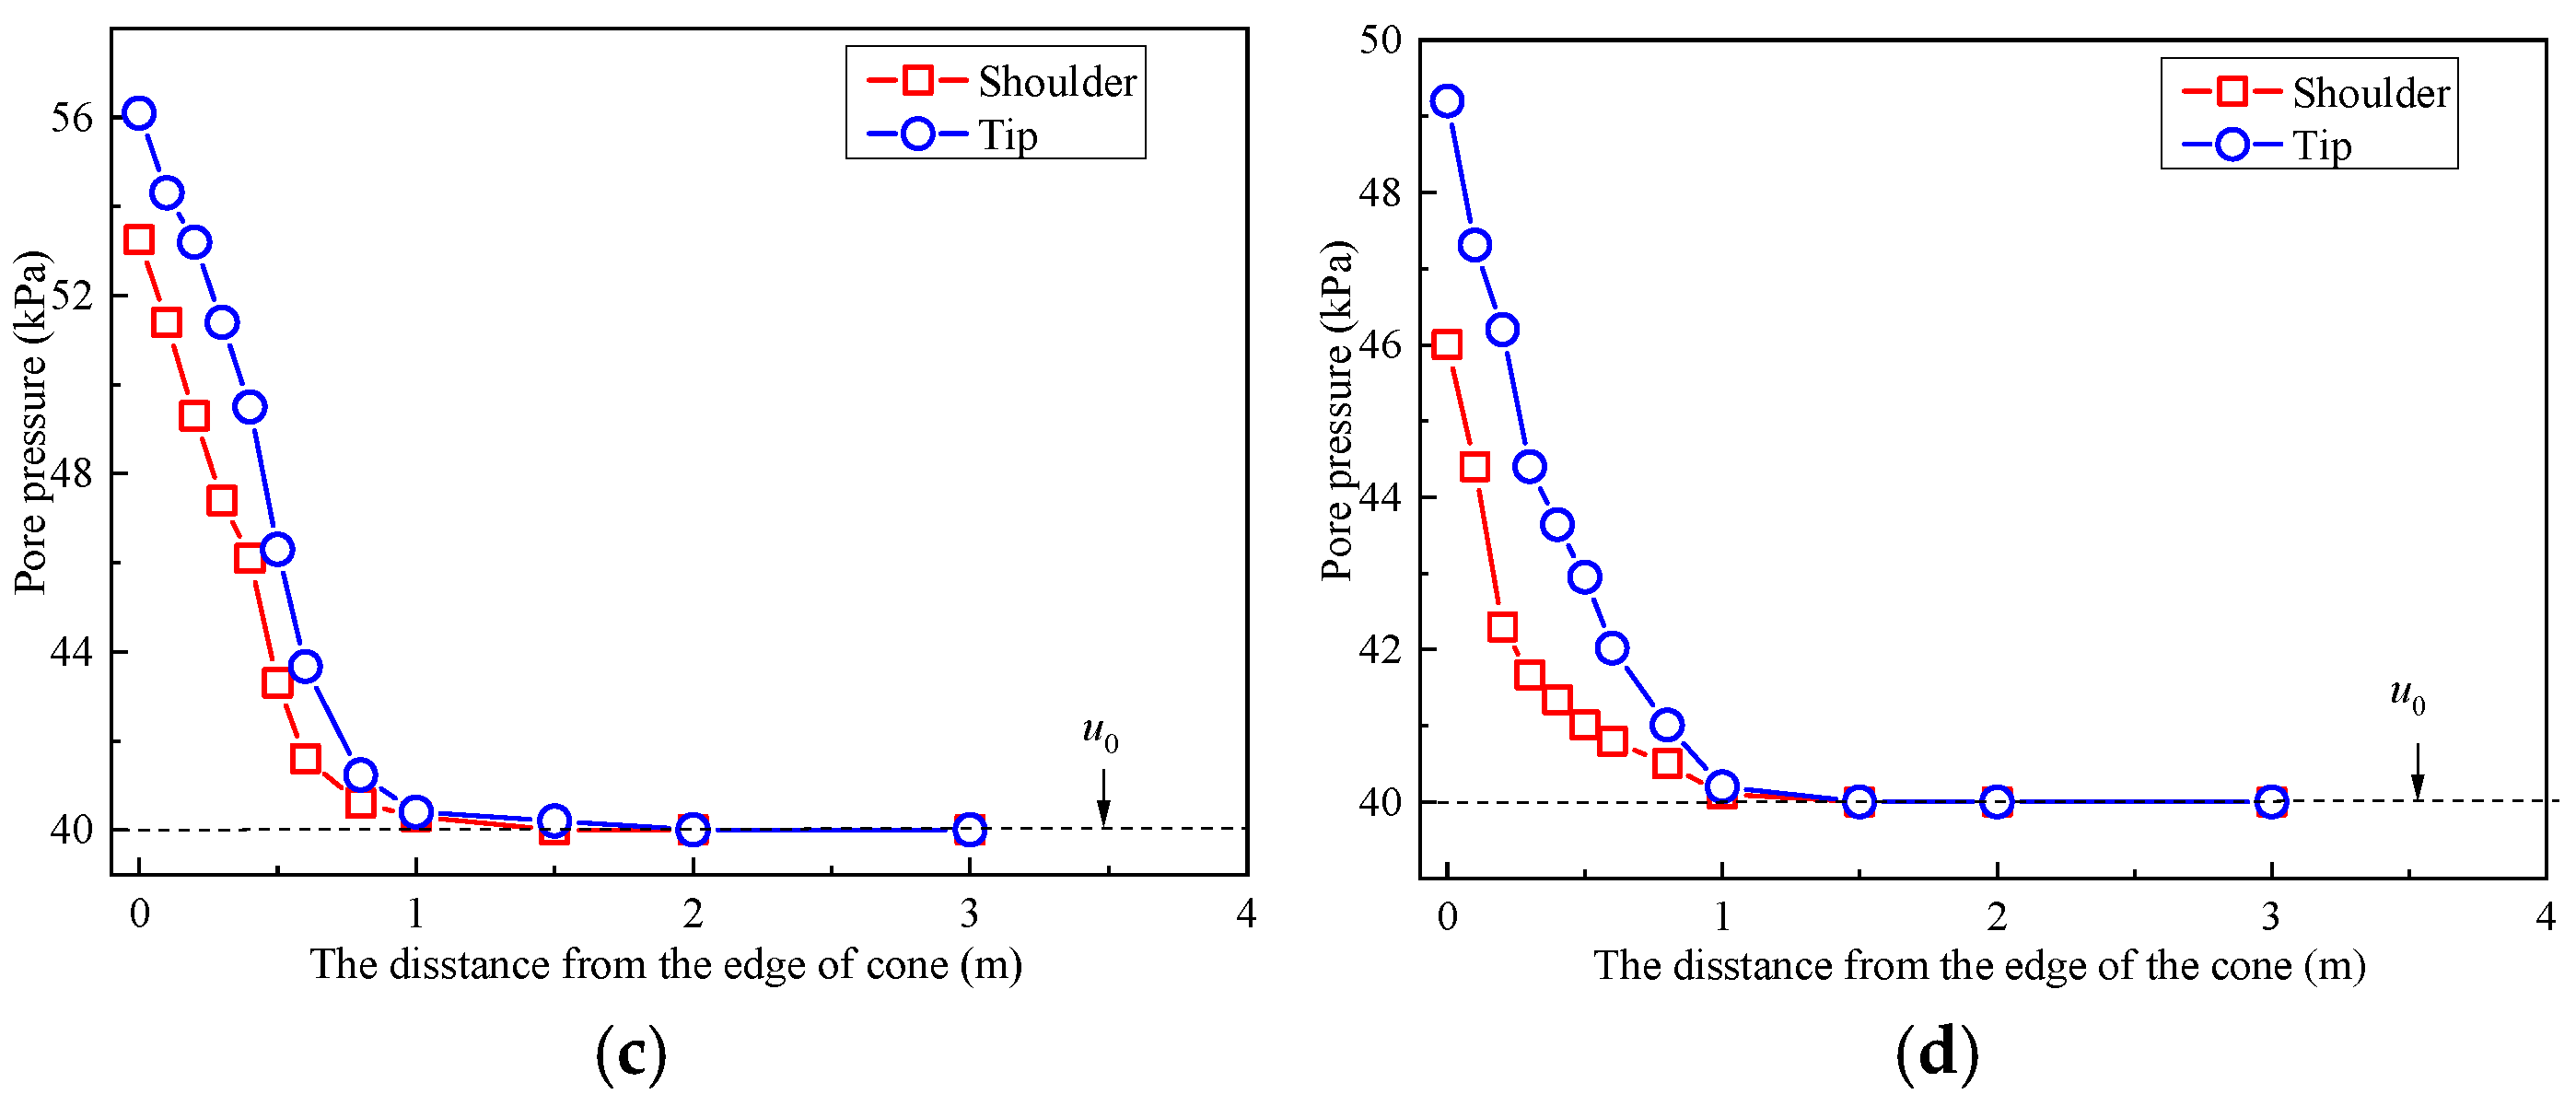
The dissipation rate of the cutoff wall is related to the permeability coefficient. Figure 7 displays the pore pressure of the soil–bentonite mixtures at various times, measured at 5 m below the surface. The figure is divided into four smaller graphs, each corresponding to different dissipation times: 5 s, 30 s, 180 s, and 1800 s. Figure 7 indicates that the pore pressure values are inversely proportional to the distance from the cone’s edge. As the radial distance increases to a certain extent, the pore pressure gradually approaches or equals to u0. Additionally, at the same radial distance, the pore pressure at the cone tip is slightly higher than that at the cone shoulder. Notably, when the radial distance is approximately 1 m, the pore pressure during all four time intervals is essentially equal to the hydrostatic pressure [36].
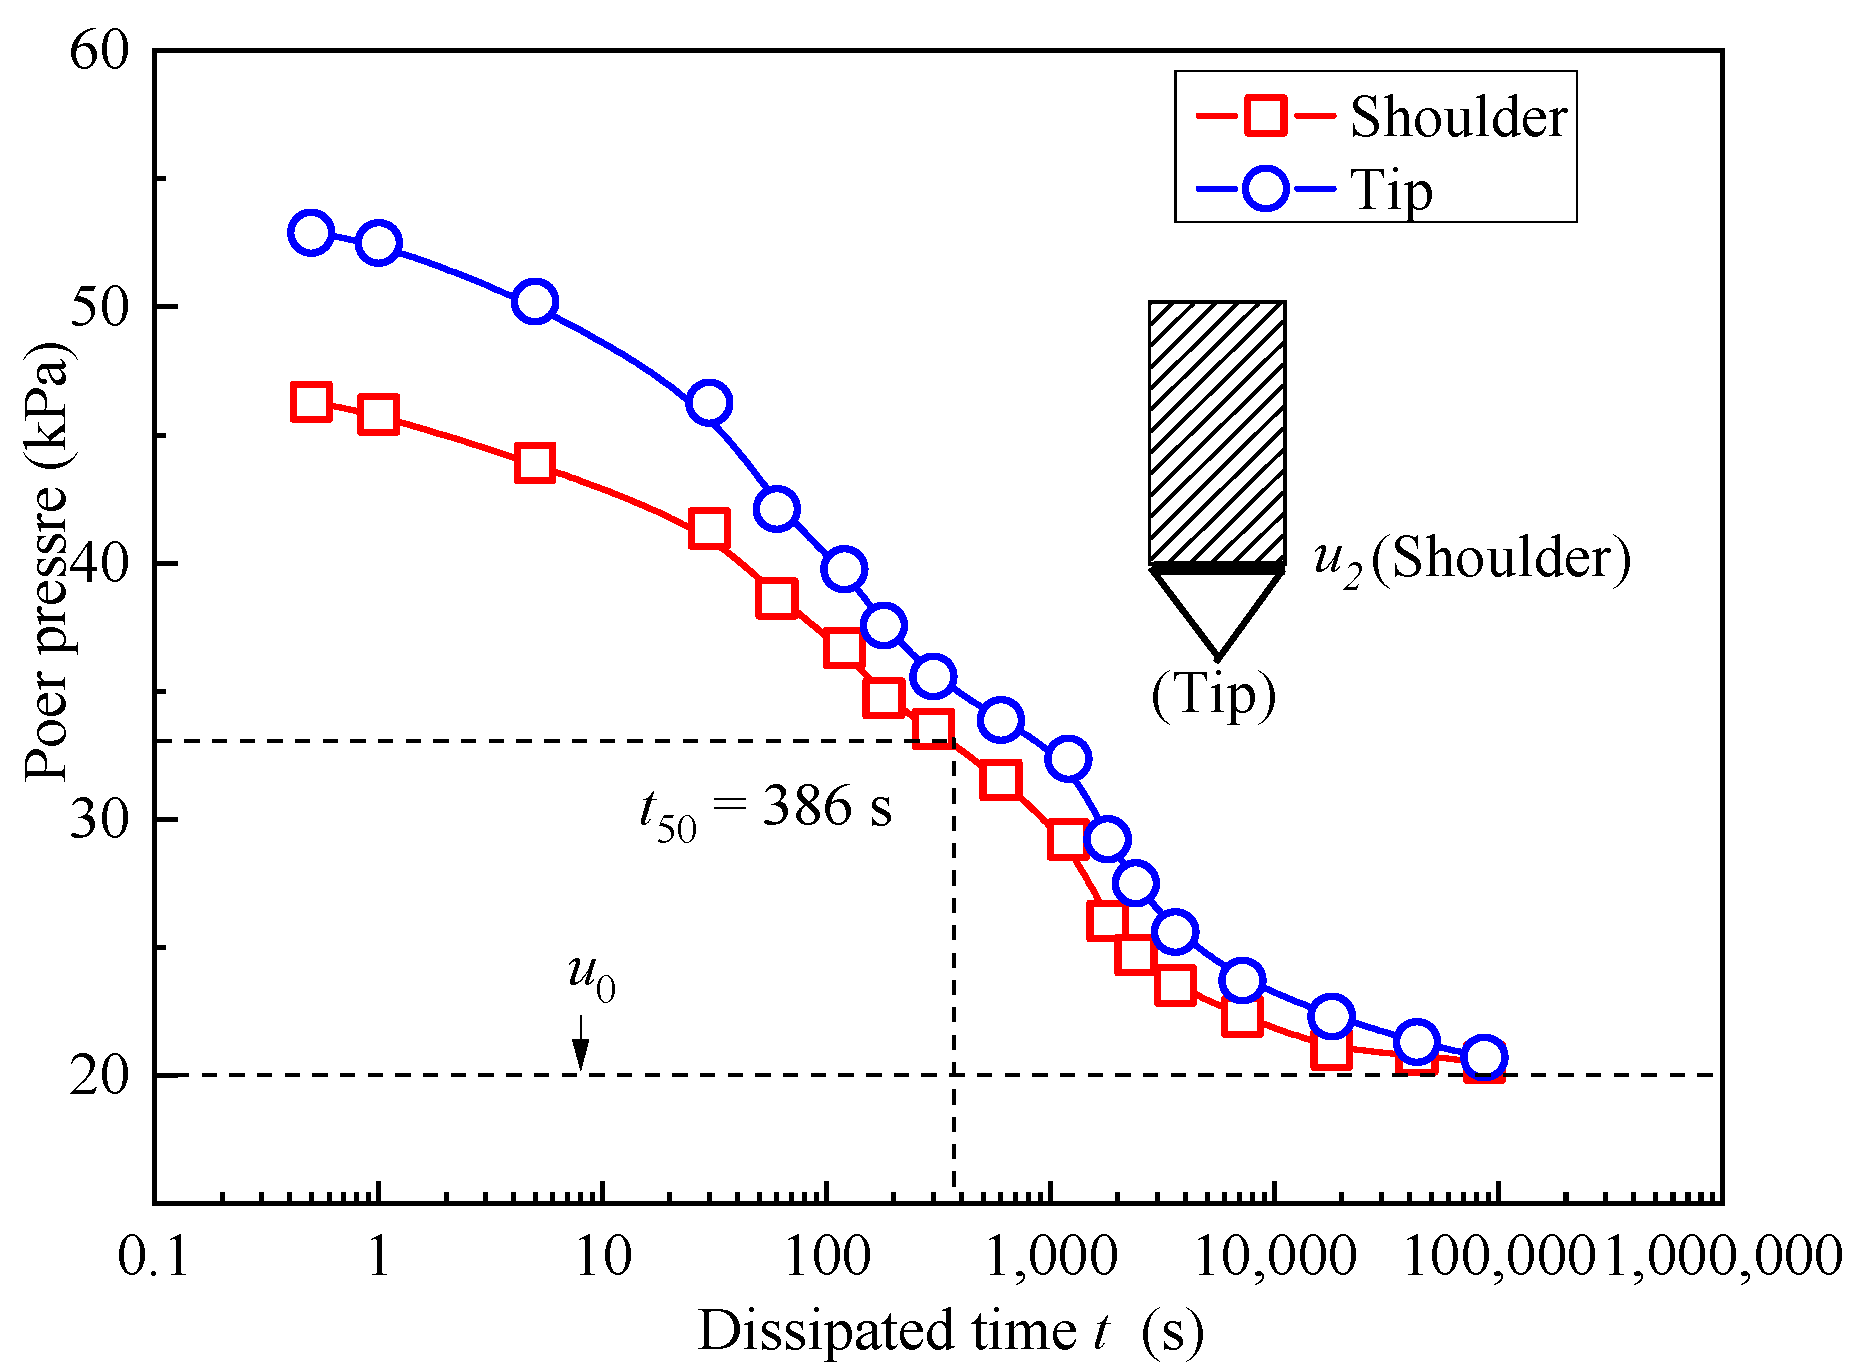
Figure 8 illustrates significant variations in pore pressure curves for soil–bentonite mixtures at different locations, as simulated by ABAQUS at a depth of 3 m. The figure indicates that the initial pore pressures at the cone’s shoulder and tip are 46.5 kPa and 53.5 kPa, respectively, at this depth. Over time, the pore pressure dissipates gradually [37]. At the onset of dissipation, the pore pressure drops sharply and as dissipation time increases, the rate of decrease in pore pressure slows down. The time required for half of the excess pore pressure to dissipate at the cone’s shoulder is 13.25 kPa. At this point, the pore pressure is 33.25 kPa, with the corresponding t50 being 386 s. In the CPTU test, the t50 value at 3 m was determined to be 405 s based on pore pressure dissipation.
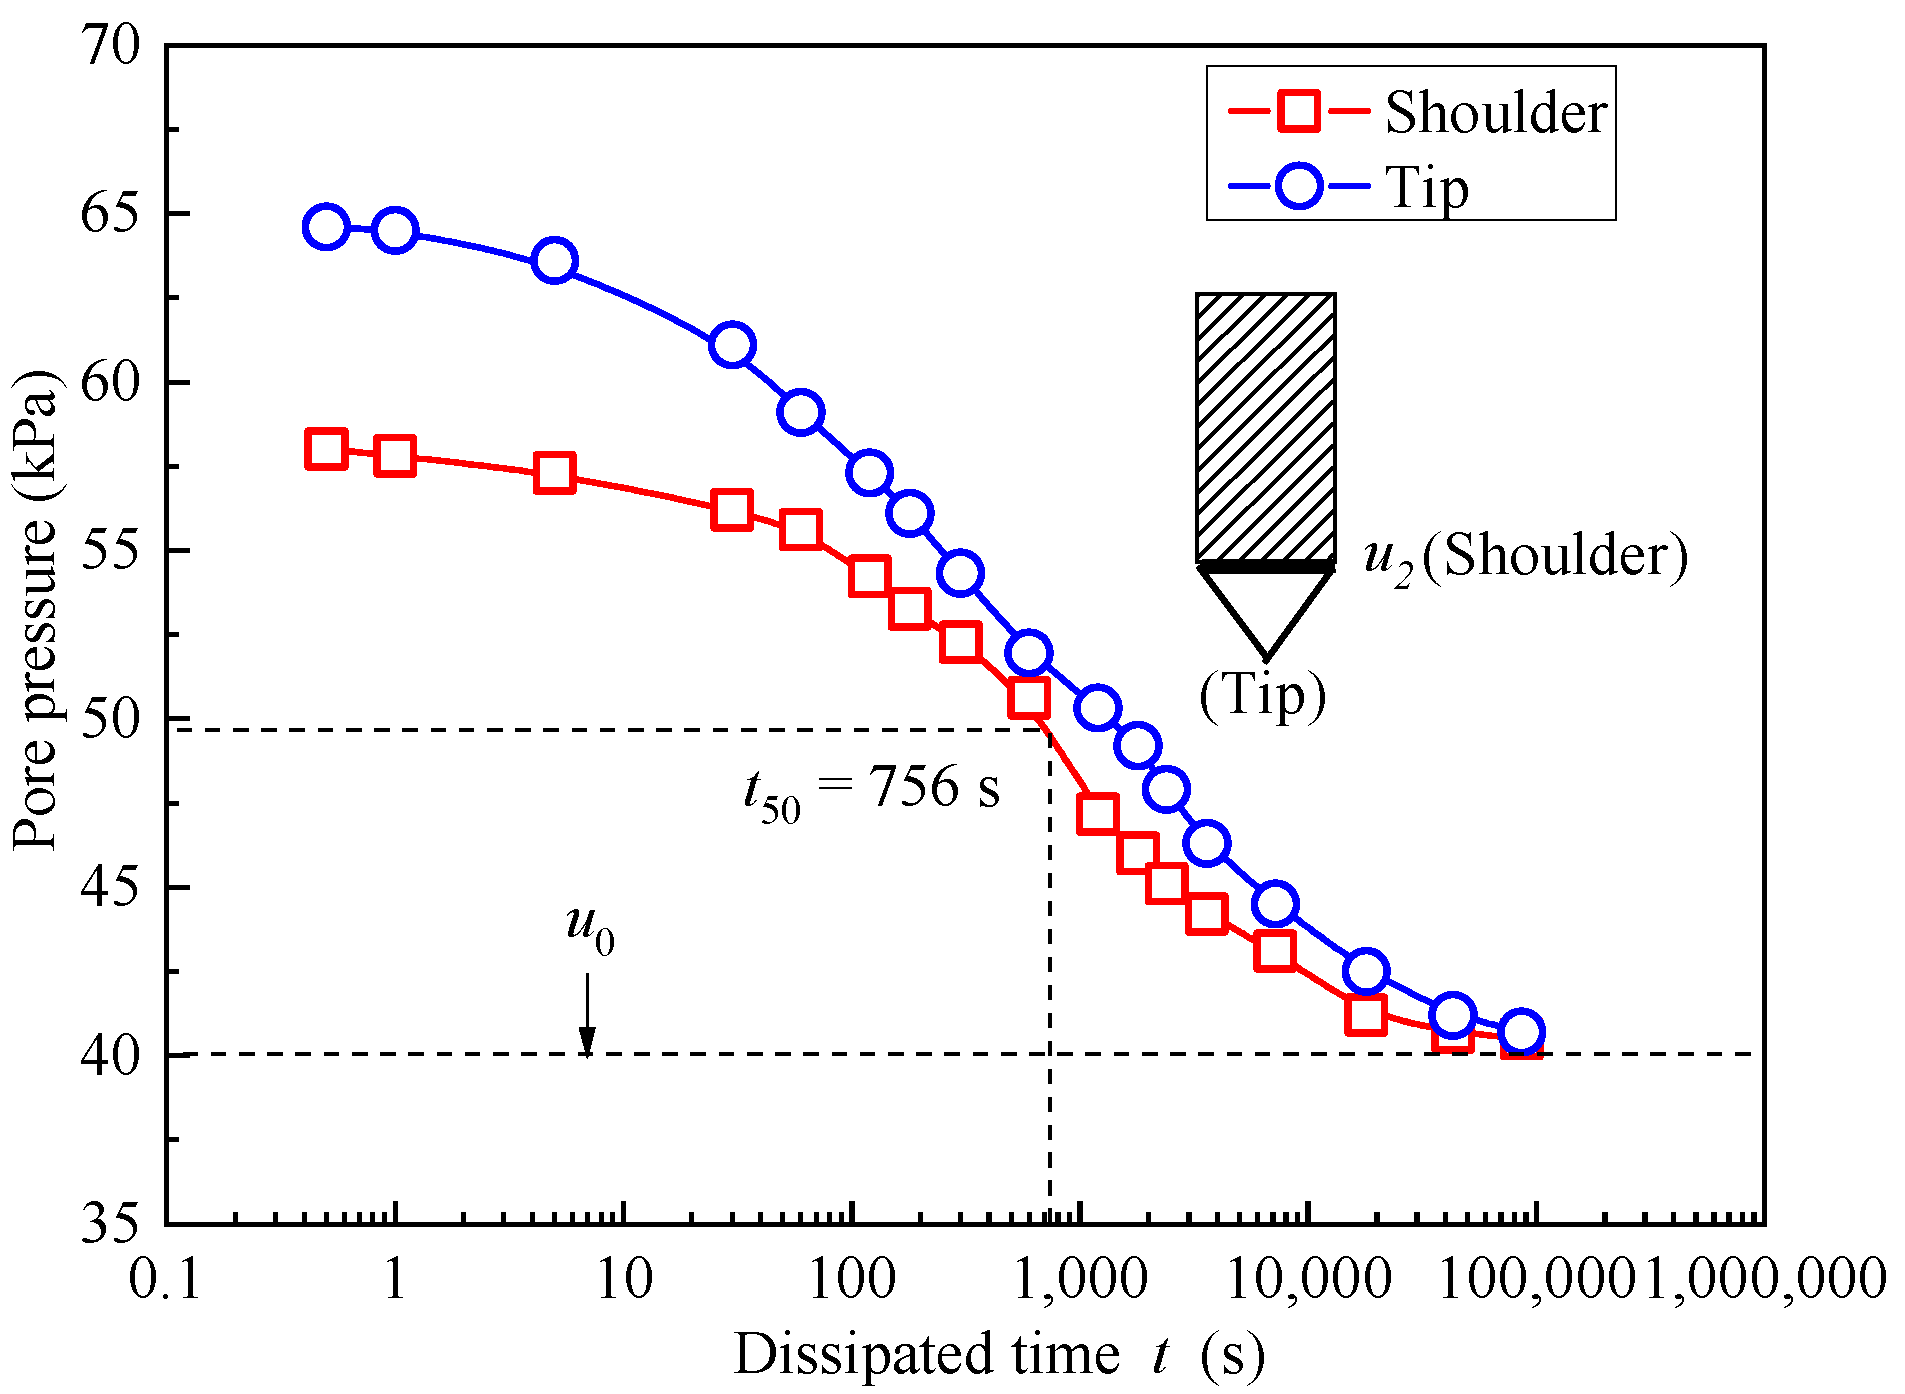
The relationship between pore pressure values and dissipation time (Figure 9) shows significant variations at a depth of 5 m. It is evident that the initial pore water pressures at the cone’s shoulder and tip are 58.1 kPa and 65.1 kPa, respectively, at a depth of 3 m. At the cone’s shoulder, the time required for half of the excess pore pressure to dissipate is 9.05 kPa. At this point, the pore pressure value is 49.05 kPa, with a corresponding t50 of 756 s. During the CPTU field test, the t50 value at 5 m was found to be 810 s, determined by pore pressure dissipation. Therefore, when comparing the t50 values obtained from the CPTU field testing results and numerical simulations at both 3 m and 5 m, it is clear that the values from the two distinct methods are quite similar.
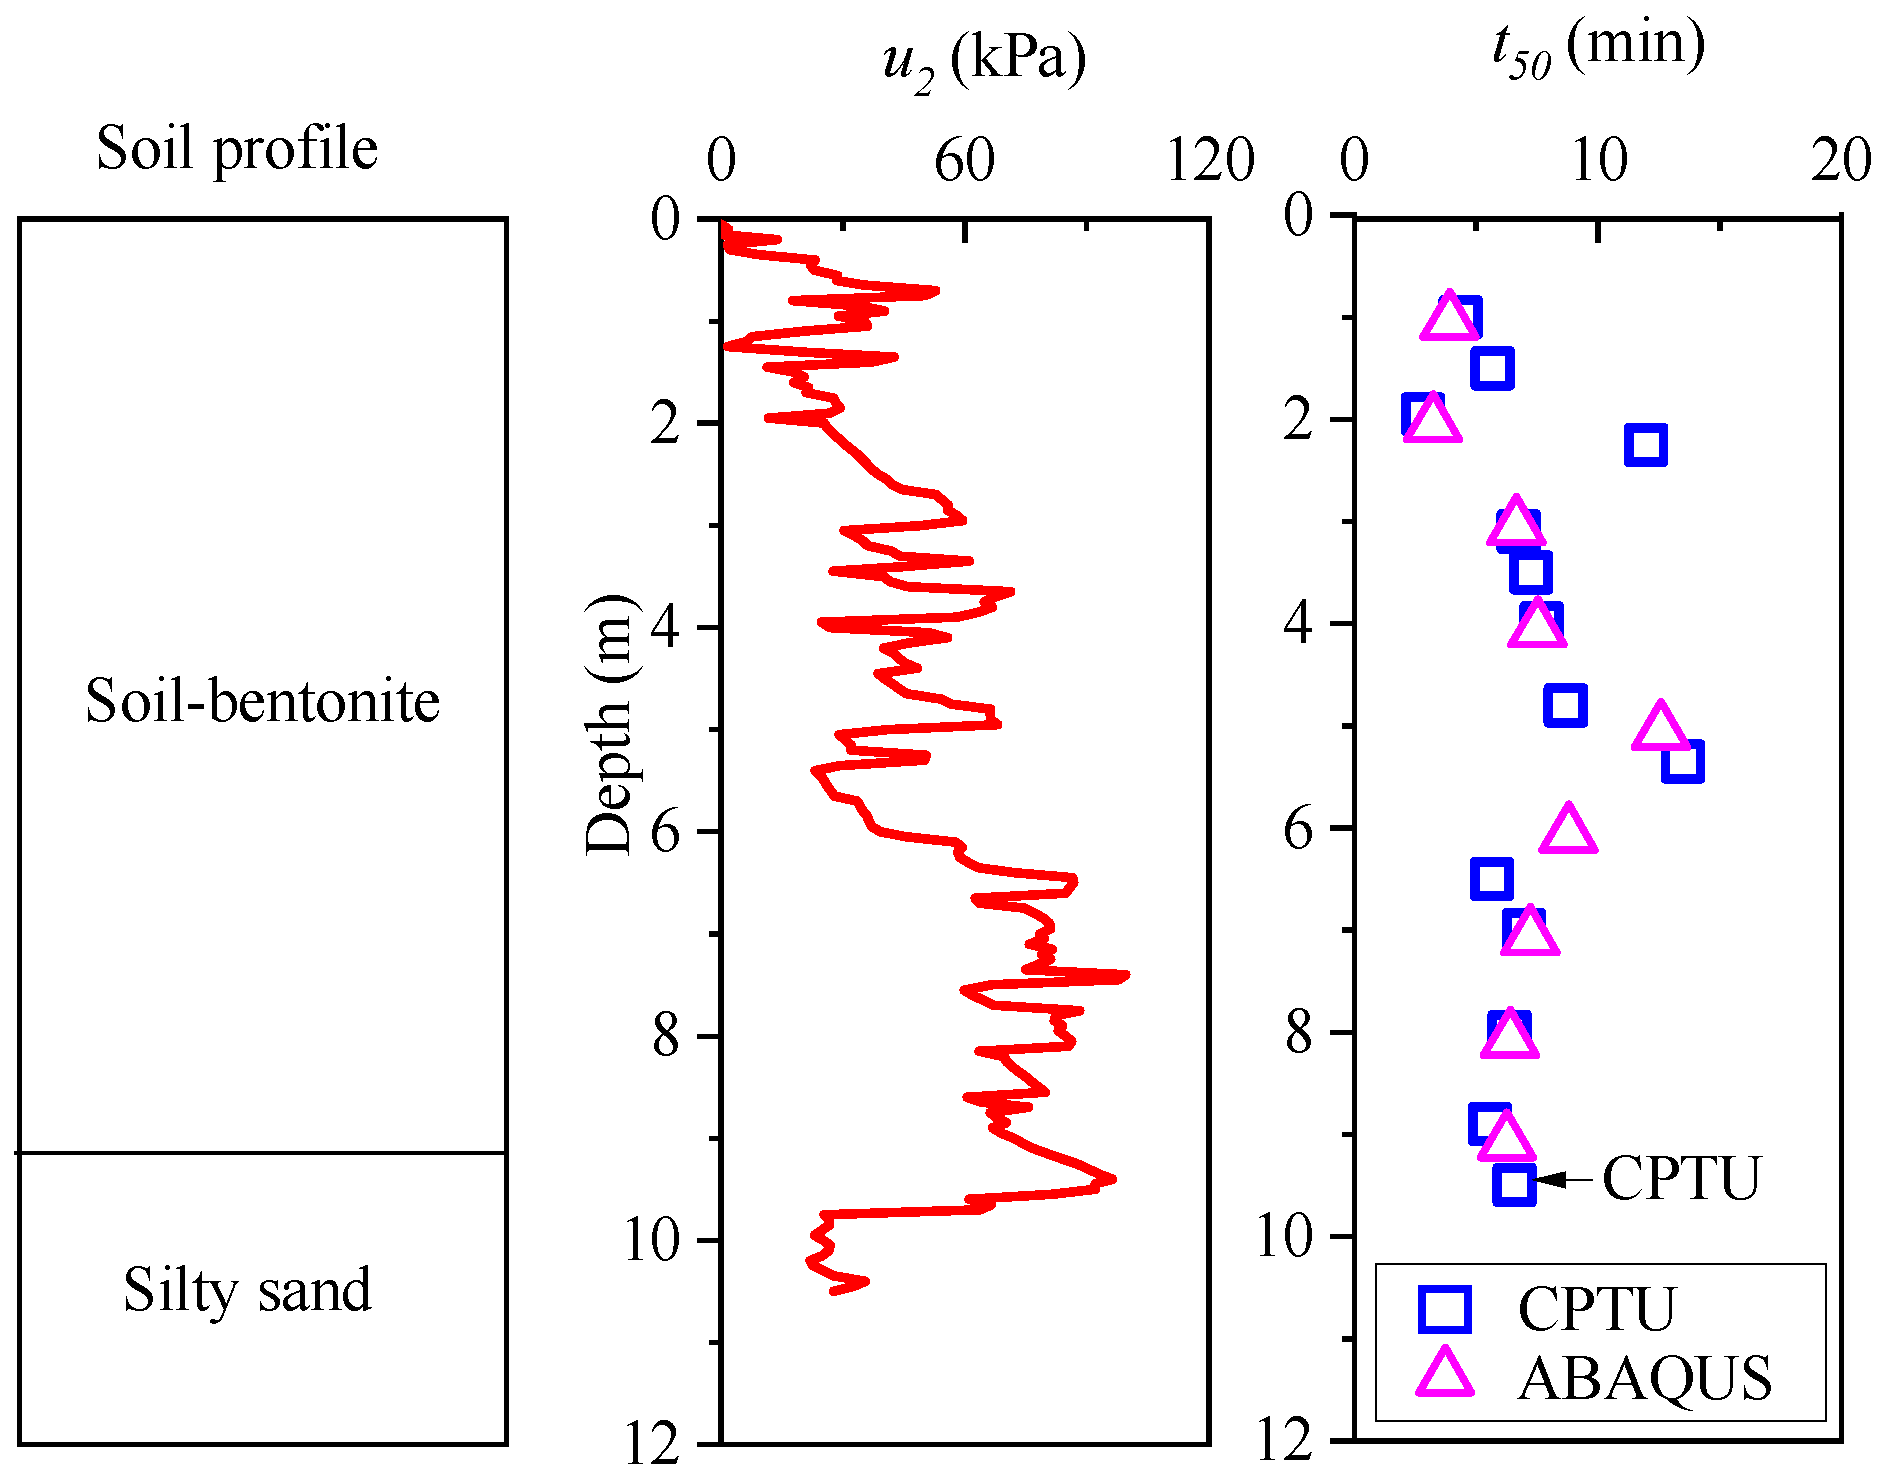
Using the aforementioned method, pore pressure dissipation curves and t50 values at various depths can be derived. Figure 10 illustrates the measured u2 and t50 values along the depth of the wall. The u2 values decrease sharply when the cone penetrates into the silty sand layer. Additionally, a comparison between the CPTU data and the ABAQUS simulation results reveals a strong correlation between the t50 values obtained from CPTU and those simulated by ABAQUS. This suggests that the numerical model employed in ABAQUS effectively captures the soil response under CPTU conditions.
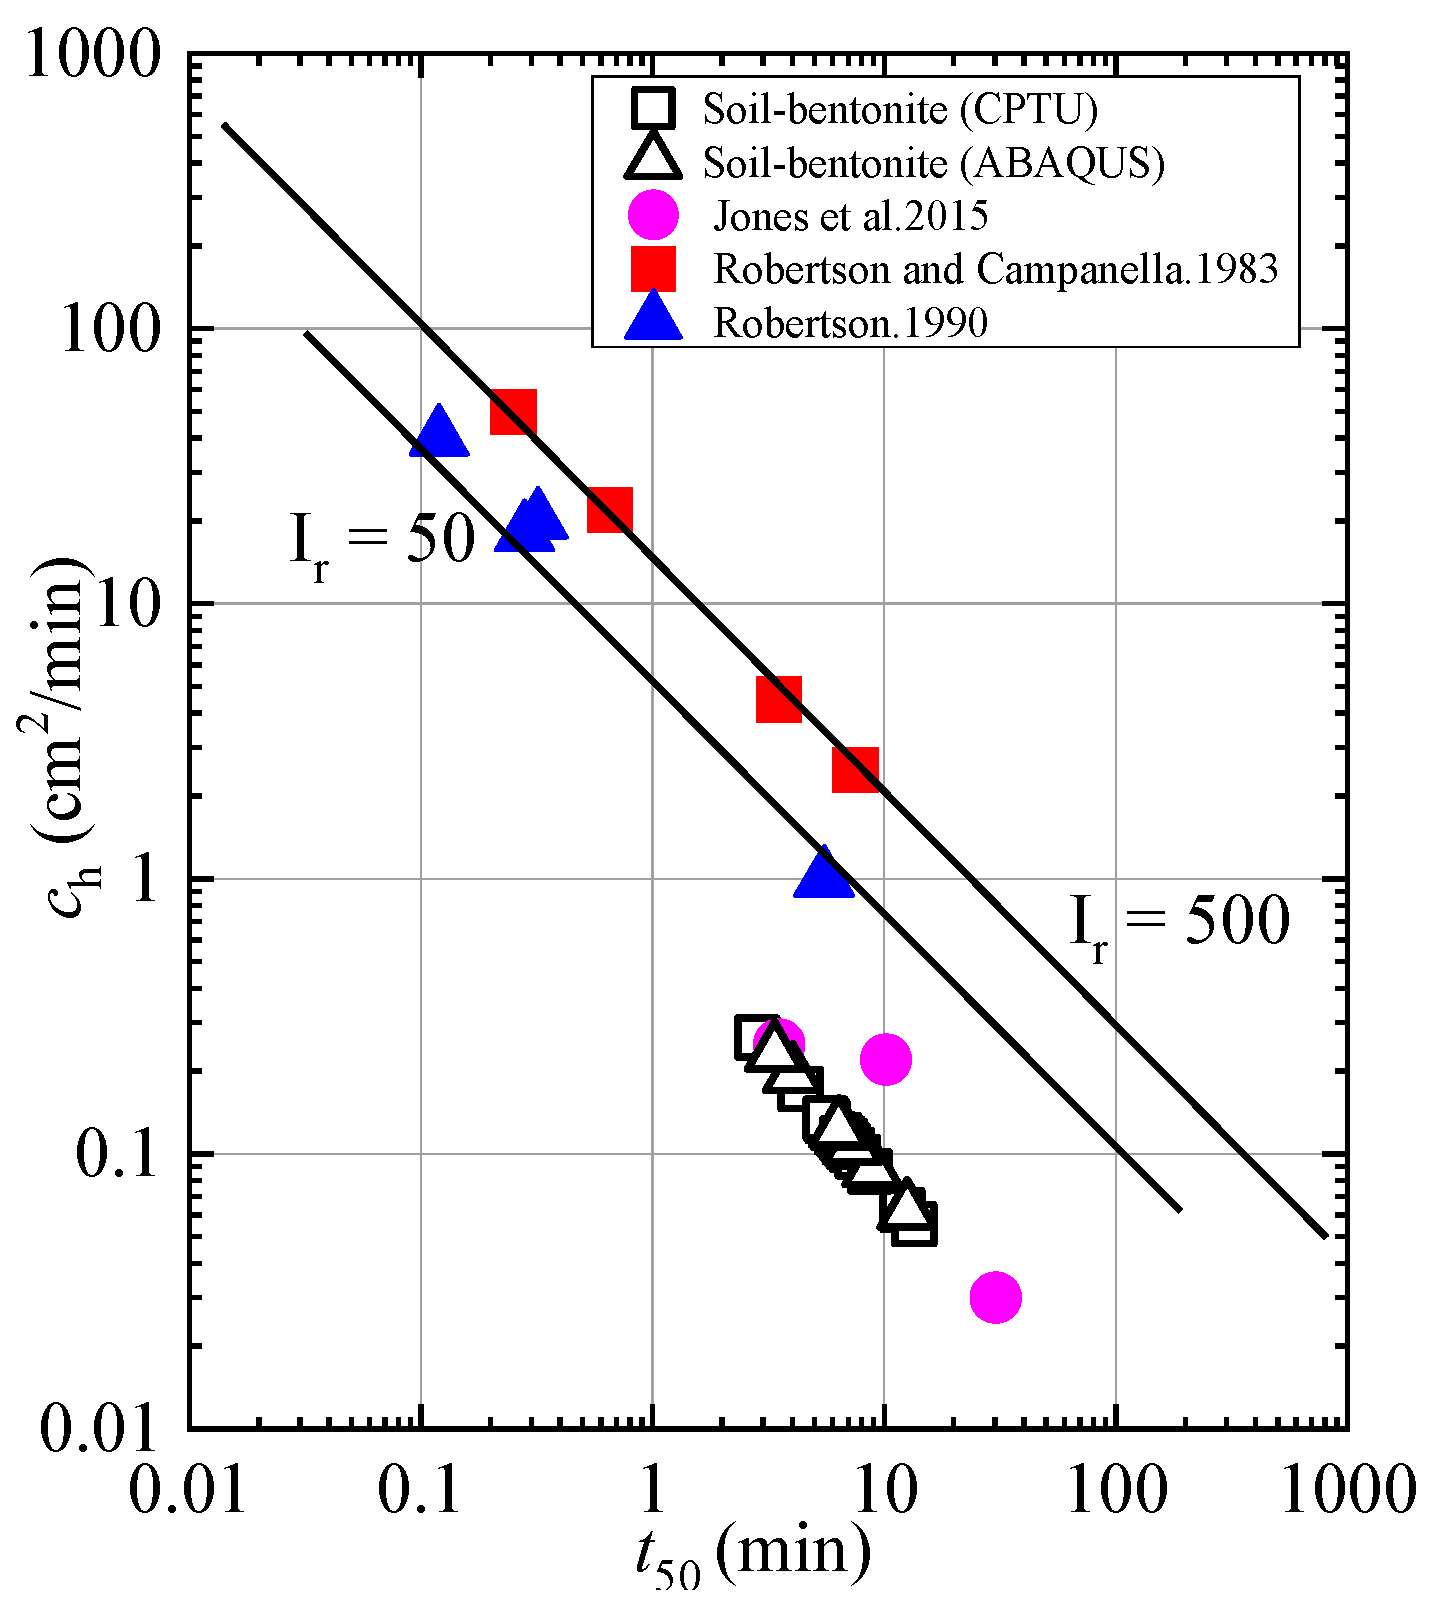
Figure 11 presents a comparative analysis of the ch values derived from various methods and other studies [38,39,40]. The figure illustrates the relationship between ch values and t50 values. Given the similarity between ABAQUS simulations and CPTU results, the t50 values obtained from both methods are quite comparable, and consequently, the coefficient of consolidation values are also similar. It is evident that the ch values for the soil–bentonite cutoff wall range from 0.06 to 0.23 cm2/min based on numerical simulations, whereas the value according to CPTU range from 0.056 to 0.265 cm2/min. The relationship between the coefficient of consolidation and t50 studied in this paper differs slightly from that in the cited literature [38,39,40], primarily because the materials in the cited literature consist of cohesive soil, while this paper focuses on a soil–bentonite mixture. The results are quite similar to those reported by Jones et al. (2015) [38].
The link between the permeability coefficient kh and t50 using various methods is demonstrated in Table 4. The table presents the results of both non-standard and standard dissipation based on CPTU testing at the same depth, alongside the results from Robertson et al. [41] for the permeability and t50. Multiple methods indicate that the permeability is lower than the design standard (1.0 × 10⁻⁷ cm/s), thereby meeting the isolation requirement.

4. Conclusions

In this study, a cutoff wall composed of soil-mixed bentonite was analyzed for a landfill site using CPTU and ABAQUS methods. The aim of this paper is to evaluate the lateral effective stress and permeability of the bentonite material cutoff wall. Stress is assessed using three models. The relationship between hydraulic conductivity and t50 at a landfill site is derived from both standard and non-standard dissipation types. The main conclusions of this paper are as follows:
  • The lateral effective stress of the soil–bentonite mixtures, determined by the arching model, is lower than that calculated using the lateral squeezing model and the modified lateral squeezing model.
  • The t50 parameter is crucial for evaluating ch and kh. This paper provides the t50 values at various depths using the CPTU method. The t50 value is 810 s at 5.35 m for the standard dissipation type and 305 s at 7.10 m for the non-dissipation type. The t50 values obtained from CPTU are relatively close to those simulated by ABAQUS.
  • The kh values (<1.0 × 10⁻⁷ cm/s) of the materials used, obtained through various methods, indicate that they meet the isolation requirements when compared with previous research results.

Author Contributions

Conceptualization, Y.L. and C.Y.; methodology, F.W. and X.L. (Xuepeng Li); software, X.L. (Xuepeng Li) and Y.L.; investigation, Y.L.; resources, X.L. (Xiaoyan Liu). and F.W.; data curation, X.L. (Xiaoyan Liu); writing—original draft preparation, X.L. (Xuepeng Li); and F.W.; writing—review and editing, C.Y. and F.W. All authors have read and agreed to the published version of the manuscript.

Funding

This study was funded by Anhui Institute of Intelligent Underground Detection Technology (AHZT2023KF04), Special Projects in Key Fields of Normal Universities in Guangdong Province (Grant No. 2024ZDZX4148), High level Talent Research Fund of Guangdong Construction Polytechnic (GCC2024-03), and Scientific Research Special Project of Guangdong Construction Polytechnic (KY2024-21).

Institutional Review Board Statement

Not applicable.

Informed Consent Statement

Informed consent was obtained from all subjects involved in the study.

Data Availability Statement

The original contributions presented in this study are included in the article. Further inquiries can be directed to the corresponding author.

Conflicts of Interest

The authors declare no conflicts of interest.

References

  1. Liu, L.; Liu, T.; Liu, X.; Li, Z.; Cai, G. Key influencing factors and prediction model for the tensile strength of compacted clayey loess. Bull. Eng. Geol. Environ. 2025, 84, 404. [Google Scholar] [CrossRef]
  2. Liu, L.; Li, Z.; Guo, J.; Lv, S.; Liu, X.; Cai, G.; Fan, G. Compression characteristics and microscopic mechanism of high-temperature sintered loess. Constr. Build. Mater. 2025, 490, 142456. [Google Scholar] [CrossRef]
  3. Li, Z.; Ma, J.; Liu, X.; Liu, L.; Cai, G.; Peng, L.; Xiong, H. Exploring the temperature, humidity, and deformation characteristics of gravel replacement foundations in seasonally frozen zones: A model testing study. Bull. Eng. Geol. Environ. 2025, 84, 141. [Google Scholar] [CrossRef]
  4. Garvin, S.L.; Hayles, C.S. The chemical compatibility of cement–bentonite cut-off wall material. Constr. Build. Mater. 1999, 13, 329–341. [Google Scholar] [CrossRef]
  5. D’appolonia, D.J. Soil-bentonite slurry trench cutoffs. J. Geotech. Eng. Div. 1980, 106, 399–417. [Google Scholar] [CrossRef]
  6. Cai, G.; Liu, S.; Puppala, A.J. Reliability assessment of CPTU-based pile capacity predictions in soft clay deposits. Eng. Geol. 2012, 141, 84–91. [Google Scholar] [CrossRef]
  7. Nartowska, E.; Podlasek, A.; Vaverková, M.D.; Koda, E.; Jakimiuk, A.; Kowalik, R.; Kozłowski, T. Mobility of Zn and Cu in Bentonites: Implications for Environmental Remediation. Materials 2024, 17, 2957. [Google Scholar] [CrossRef]
  8. Wang, H.; Chen, D.; Guo, R.; Tian, J.; Li, B. A Preliminary Study on the Improvement of Gangue/Tailing Cemented Fill by Bentonite: Flow Properties, Mechanical Properties and Permeability. Materials 2023, 16, 6802. [Google Scholar] [CrossRef]
  9. Luo, X.; Chen, Q.; Deng, C.; Luo, W.; He, Y. Low-Cyclic Reversed Loading Tests on Full-Scale Precast Concrete Composite Wall Connected by Tooth Groove and Grouted Sleeve. Materials 2024, 17, 476. [Google Scholar] [CrossRef]
  10. Nagaraj, T.S.; Murthy, B.R.S. A critical reappraisal of compression index equations. Geotechnique 1986, 36, 27–32. [Google Scholar] [CrossRef]
  11. Li, X.; Cai, G.; Puppala, A.J.; Liu, S. Compression behavior of reconstituted soils mixed with bentonite for a cutoff wall in a landfill site. Environ. Earth Sci. 2018, 77, 390. [Google Scholar] [CrossRef]
  12. Baligh, M.M.; Vivatrat, V.; Ladd, C.C. Cone penetration in soil profiling. J. Geotech. Eng. Div. 1980, 106, 20–32. [Google Scholar] [CrossRef]
  13. Lunne, T.; Robertson, P.K.; Powell, J.J.M. Cone-penetration testing in geotechnical practice. Soil. Mech. Found. Eng. 2009, 46, 237. [Google Scholar] [CrossRef]
  14. Sully, J.P.; Robertson, P.K.; Campanella, R.G. An approach to evaluation of field CPTU dissipation data in overconsolidated fine-grained soils. Can. Geotech. J. 1999, 36, 369–381. [Google Scholar] [CrossRef]
  15. Elsworth, D.; Lee, D.S. Permeability determination from on-the-fly piezocone sounding. J. Geotech. Geoenvironmental Eng. 2005, 131, 643–653. [Google Scholar] [CrossRef]
  16. Chai, J.C.; Agung, P.M.A.; Hino, T. Estimating hydraulic conductivity from piezocone soundings. Géotechnique 2011, 61, 699–708. [Google Scholar] [CrossRef]
  17. Jiang, Z.Y.; Zhang, R.; Li, Z.Y. Hydraulic conductivity and microscopic properties of sodium hexametaphosphate-amended sand-sodium-activated calcium bentonite backfill in vertical cutoff walls exposed to lead-contaminated groundwater. Acta Geotech. 2025, 20, 1235–1250. [Google Scholar] [CrossRef]
  18. Dong, H.H.; Wang, Z.K.; Yan, Z.Z. Centrifuge modeling of backfill consolidation in soil-bentonite cutoff walls. Can. Geotech. J. 2025, 62, 1–15. [Google Scholar] [CrossRef]
  19. Evans, J.C.; Fang, H.Y.; Kugelman, I.J. Containment of hazardous materials with soil-bentonite slurry walls. In Proceedings of the 6th National Conference on Management of Uncontrolled Hazardous Waste Sites, Washington, DC, USA, 4–6 November 1985; pp. 369–373. [Google Scholar]
  20. Xu, Y.J.; Wang, G.Q.; Li, J. Develop and implement Duncan Chang constitutive model in ABAQUS. Geotech. Mech. 2004, 25, 1032–1036. [Google Scholar]
  21. Shi, Y.; Guo, F.Y.; Mao, C.; Wang, X. Application of FLAC3D in Soil Consolidation Simulation. J. Tianjin Urban Constr. Univ. 2006, 12, 18–22. [Google Scholar]
  22. Sun, J.Z.; Gao, H. Application of ABAQUS in the Analysis of Soft Foundation Consolidation Process. In Proceedings of the National Symposium on Numerical Analysis and Analytical Methods of Geotechnical Mechanics, Beijing, China, 12–13 March 2007; pp. 11–14. [Google Scholar]
  23. Chai, J.C.; Sheng, D.; Carter, J.P. Coefficient of consolidation from non-standard piezocone dissipation curves. Comput. Geotech. 2012, 41, 13–22. [Google Scholar] [CrossRef]
  24. ASTM D2487; Standard Practice for Classification of Soils for Engineering Purposes (Unified Soil Classification System). ASTM International: West Conshohocken, PA, USA, 2017.
  25. Fan, Q.L.; Luan, M.T.; Yang, Q. Numerical implementation of Implicit integration algorithm for modified Cam-clay model in ABAQUS. Rock Soil Mech. 2008, 29, 269–273. [Google Scholar]
  26. Tong, X. Mechanical and Hydraulic Properties of Soil-Bentonite and Consolidation Behavior of Cutoff Wall. Ph.D. Thesis, Zhejiang University, Hangzhou, China, 2017. [Google Scholar]
  27. Li, Y.C.; Cleall, P.J.; Ma, X.F. Gas Pressure model for layered municipal solid waste landfills. J. Environ. Eng. 2012, 138, 752–760. [Google Scholar] [CrossRef]
  28. Malusis, M.A.; Yeo, S.; Evans, J.C. Hydraulic conductivity of model soil–bentonite backfills subjected to. Can. Geotech. J. 2011, 48, 1198–1211. [Google Scholar] [CrossRef]
  29. Pan, Q.; Wen, Y.D.; Chen, Y.M. Stresses in soil–bentonite slurry trench cut-off walls. Géotechnique 2015, 65, 843–850. [Google Scholar]
  30. Filz, G.M. Consolidation stresses in soil-bentonite backfilled trenches. In Proceedings of the 2nd International Congress on Environmental Geotechnics, Osaka, Japan, 5–8 November 1996; pp. 497–502. [Google Scholar]
  31. Ruffing, D.G.; Evans, J.C.; Malusis, M.A. Prediction of earth pressures in soil-bentonite cutoff walls. In GeoFlorida 2010: Advances in Analysis, Modeling & Design; ASCE Library: Reston, VA, USA, 2010; pp. 2416–2425. [Google Scholar]
  32. Coop, M.R.; Wroth, C.P. Field studies of an instrumented model pile in clay. Geotechnique 1989, 39, 679–696. [Google Scholar] [CrossRef]
  33. Chai, J.C.; Carter, J.P.; Miura, N. Coefficient of consolidation from piezocone dissipation tests. In Proceedings of the International Symposium on Lowland Technology, Bangkok, Thailand, 1–3 September 2004; pp. 1–6. [Google Scholar]
  34. Hossain, M.J.; Chai, J.C. Advances in soil dynamics and foundation engineering-interpreting chp value from non-standard piezocone dissipation curves. In Proceedings of the American society of civil engineers geo-shanghai, Shanghai, China, 26–28 May 2014. [Google Scholar]
  35. Cai, G.J.; Liu, S.Y.; Puppala, A.J. Predictions of coefficient of consolidation from CPTU dissipation tests in Quaternary clays. Bull. Eng. Geol. Environ. 2011, 30, 337–350. [Google Scholar] [CrossRef]
  36. Chai, J.C.; Hossain, M.J.; Yuan, D. Pore pressures induced by piezocone penetration. Can. Geotech. J. 2016, 53, 540–550. [Google Scholar] [CrossRef]
  37. Krage, C.P.; Dejong, J.T.; Schnaid, F. Estimation of the Coefficient of Consolidation from Incomplete Cone Penetration Test Dissipation Tests. J. Geotech. Geoenvironmental Eng. 2014, 141, 06014016. [Google Scholar] [CrossRef]
  38. Jones, G.A.; Van, Z.D.; Rust, E. Mine tailings characterization by piezometer cone. In Cone Penetration Testing and Experience; American Society of Civil Engineers: New York, NY, USA, 2015; pp. 303–324. [Google Scholar]
  39. Robertson, P.K.; Campanella, R.G. Interpretation of cone penetration tests. Part I: Sand. Can. Geotech. J. 1983, 20, 718–733. [Google Scholar] [CrossRef]
  40. Robertson, P.K. Soil classification using the cone penetration test. J. Geotech. Geoenvironmental Eng. 1990, 27, 984–986. [Google Scholar] [CrossRef]
  41. Robertson, P.K.; Sully, J.P.; Woeller, D.J. Estimating coefficient of consolidation from piezocone tests. Can. Geotech. J. 1993, 29, 539–550. [Google Scholar] [CrossRef]
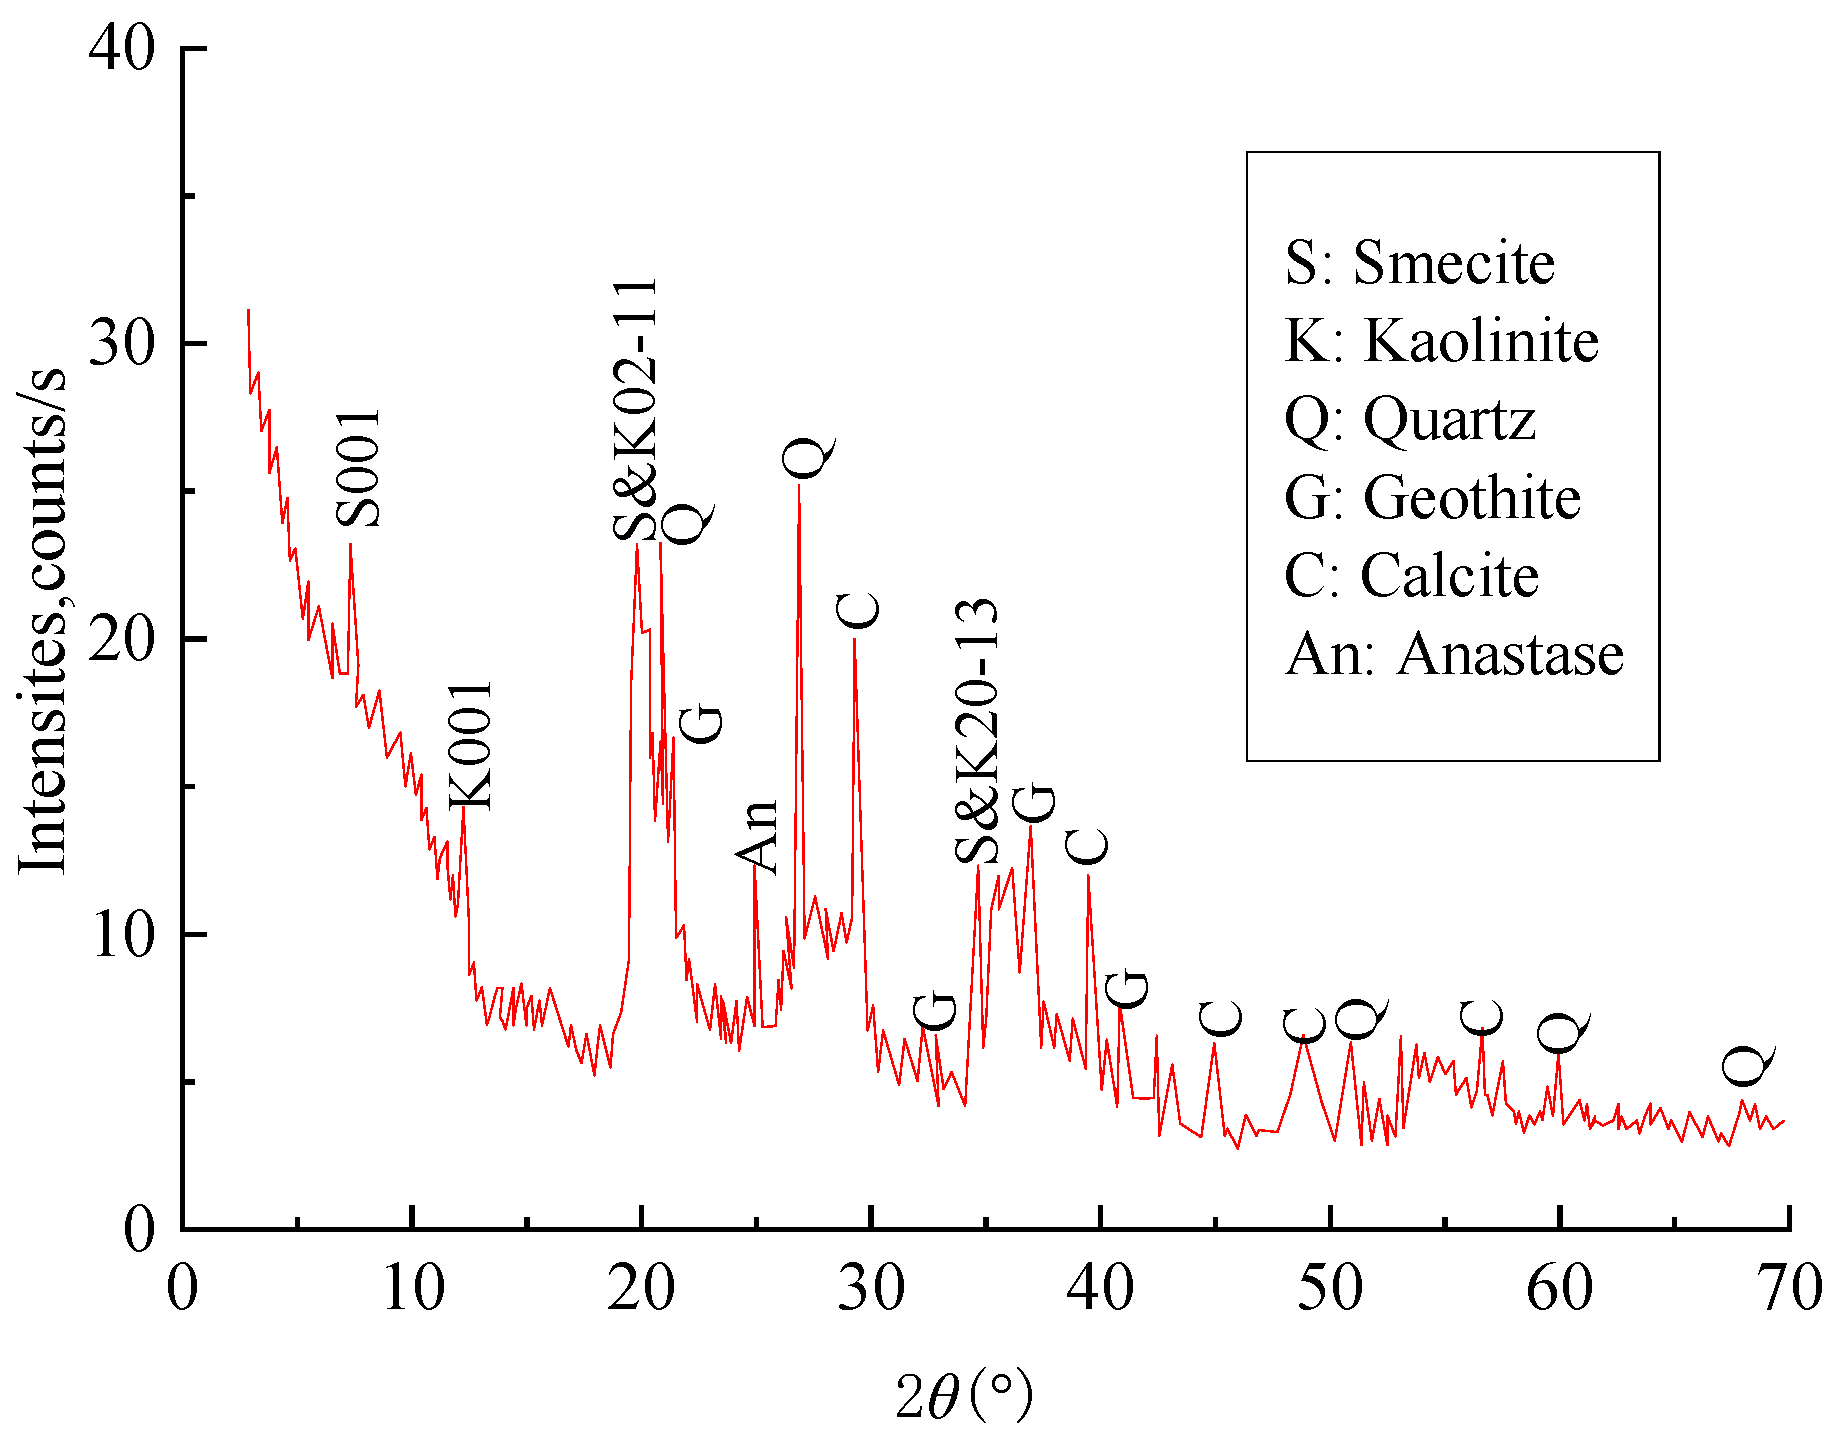
Figure 1. The XRD of bentonite.
Materials 18 03919 g001
Figure 2. The piezocone used in this study.
Materials 18 03919 g002
Figure 3. Lateral effective stress distribution based on different theoretical models.
Materials 18 03919 g003
Figure 4. The typical test curve of the soil–bentonite cutoff wall.
Materials 18 03919 g004
Figure 5. The ch values based on the modified t50m method by CPTU [23,33,34].
Materials 18 03919 g005
Figure 6. The initial pore pressure of soil–bentonite from CPTU cone (5 m).
Materials 18 03919 g006
Figure 7. The pore pressure of mixtures from the CPTU cone (5 m). (a) Dissipated time: 5 s; (b) dissipated time: 30 s; (c) dissipated time: 180 s; (d) dissipated time: 1800 s.
Materials 18 03919 g007aMaterials 18 03919 g007b
Figure 8. The pore pressure dissipation curves for soil–bentonite mixtures at various locations at a depth of 3 m.
Materials 18 03919 g008
Figure 9. The dissipation curves of soil–bentonite materials based on ABAQUS with a depth of 5 m underground.
Materials 18 03919 g009
Figure 10. The t50 values at different depths by CPTU and ABAQUS.
Materials 18 03919 g010
Figure 11. Comparative analysis of coefficient of consolidation based on different methods [38,39,40].
Materials 18 03919 g011
Table 1. The parameters of the Modified Cambridge Model [25].
ParameterSizeUnitsReference
K0.01/[26]
λ0.1/[26]
M1.2/[26]
ν0.33/[27]
k00.56/[26]
γrat17.7kN/m3[27]
γw10kN/m3[28]
kh4.1 × 10−8cm/s[28,29]
Table 2. The initial conditions of the Modified Cambridge Model [25].
ParameterValueUnit
Initial effective stressy = 10 m: σx′ = 0, σy′ = 0
y = 0 m: σx′ = 38.5, σy′ = −77
kPa
Initial pore pressurey = 10 m: u = 0
y = 0 m: u = 90
kPa
Initial pore pressurey = 10 m: e0 = 0.96
y = 0 m: e0 = 0.54
/
Initial dry densityy = 10 m: ρd = 1.28
y = 0 m: ρd = 1.42
g/cm3
Initial yield surfacey = 10 m: p′ = 0, q = 0, p0′ = 0
y = 0 m: p′ = 51, q = 38.5, p0′ = 80
kPa
Table 3. The caused pore pressure and dissipation time of two different types.
CPTU TypesΔui (kPa)Δui/2 (kPa)Δumax (kPa)t50 (s)
Standard dissipation18.19.05/810
Non-Standard dissipation5.49/16.4305
Table 4. The kh and t50 values based on different methods.
ParameterStandard DissipationNon-Standard DissipationABAQUSRobertson et al., 1993 [41]
t50 (min)12.011.212.112.6
kh (cm/s)9.3 × 10−92.7 × 10−88.5 × 10−81.2 × 10−8
Disclaimer/Publisher’s Note: The statements, opinions and data contained in all publications are solely those of the individual author(s) and contributor(s) and not of MDPI and/or the editor(s). MDPI and/or the editor(s) disclaim responsibility for any injury to people or property resulting from any ideas, methods, instructions or products referred to in the content.