Article

Investigation of the Effects of Laser Welding Process Parameters on Weld Forming Quality Based on Orthogonal Experimental Design and Image Processing

by
Yuewei Ai
1,2,*,
Ning Sun
1,2,
Shibo Han
1,2,
Yang Zhang
1,2 and
Chang Lei
1,2
1
School of Traffic and Transportation Engineering, Central South University, Changsha 410075, China
2
Key Laboratory of Traffic Safety on Track of Ministry of Education, Central South University, Changsha 410075, China
*
Author to whom correspondence should be addressed.
Materials 2025, 18(15), 3627; https://doi.org/10.3390/ma18153627
Submission received: 27 August 2024 / Revised: 27 June 2025 / Accepted: 8 July 2025 / Published: 1 August 2025
(This article belongs to the Special Issue Advanced Computational Methods in Manufacturing Processes)

Abstract

Image processing has been widely adopted as an effective technology for analyzing weld forming quality which is greatly affected by the welding process parameters. In this paper, an L25(53) orthogonal experiment is designed to investigate the effects of welding process parameters on the weld forming quality in laser welding of aluminum alloy. The weld characteristics including the weld width (WW), weld penetration (PD), weld area (WA) and weld porosity (WP) under the conditions of the different welding process parameters consisting of the laser power (LP), welding speed (WS) and defocus distance (DD) are extracted from the laser welding experiment based on image processing. The effectiveness of the weld characteristics extraction method is verified by comparing the extracted results with the measured results. It is found that the WW, PD and WA are all significantly influenced by the LP among the three welding process parameters while the influences of the three process parameters on the WP are insignificant. The DD has a significant influence on the PD and the WS has a significant influence on the WA. The corresponding significance of influence is lower than the significance of influence of LP. The analysis results are conducive to the optimization of laser welding process parameters and improvement of welding quality.

1. Introduction

Laser welding is as an ideal method to achieve the joining of aluminum alloy [1]. The weld porosity (WP) is a typical defect generated in aluminum alloy laser welding and the weld morphology characteristics are usually treated as the evaluation indices for welding quality [2,3,4]. The welding process parameters are the main factors affecting the welding quality. Therefore, investigating the effects of welding process parameters on the weld morphology characteristics and porosity is of great importance for optimizing the welding process parameters and improving the welding quality during laser welding of aluminum alloy.
With the development in computer technology, image processing has been widely applied to the field of laser welding for analyzing the welding process. Gao et al. [5] constructed a coaxial visual sensing system for laser welding process of stainless steel. Images of the molten pool and keyhole during the welding process were captured and denoised by Gaussian filter. The edges of the molten pool and keyhole under the conditions of the different welding process parameters were obtained. Lei et al. [6] collected the molten pool images in laser welding process of Ti6Al4V alloy. Grayscale processing and binary processing were used to acquire the contour of the keyhole and then obtain the mean diameter of the keyhole. Liu et al. [7] extracted the top keyhole area based on the keyhole image from the top view and acquired the keyhole depth based on the keyhole image from the lateral view. The keyhole boundary profile was extracted using morphological gradient techniques. Huang et al. [8] examined the influence of magnesium content on the keyhole behavior during laser welding of 5083, 5754 and 5A06 Al-Mg alloys. Characteristics of the keyhole area were extracted from the high-speed image. The small noise was removed from the images by the Gaussian filter and the redundant parts were removed by the erosion and dilation operations to obtain a smooth keyhole shape. Nguyen and Lee [9] developed a laser-vision-based weld quality inspection system. The laser stripe produced by the intersection of the laser plane and the weld surface was captured by the camera. Based on the feature points on the extracted laser stripe of the weld profile image, the weld dimensions were measured.
To meet the service requirement of components with aluminum alloy welded joints, the optimization of laser welding process parameters has been widely investigated. Adisa et al. [10] analyzed laser welding process of aluminum alloy under the conditions of the different welding process parameters. It was found that the welding speed (WS) and peak power had great influences on the aluminum alloy weldability. The largest weld depth-width ratio was obtained under the condition of the WS 1 mm/s and peak power 0.91 kW. Liu et al. [11] investigated the effect of oscillation amplitude on the WP in circular oscillation laser welding of medium-thick high-magnesium aluminum alloy by the control variate method. They found that the WP could be reduced from 11.2% to 5.2% as the oscillation amplitude increasing from 0 mm to 1 mm. Casalino et al. [12] proposed an artificial neural network to investigate the effects of welding process parameters on welding quality of AA5754 aluminum alloy. The weld morphology characteristics obtained by the artificial neural network were compared with the experimental results and they found that the mean absolute percentage error was less than 4%. Wang et al. [13] acquired the weld geometric morphology data in laser-TIG welding experiments of 6061 aluminum alloy. In their research, the back propagation neural network optimized by the genetic algorithm was adopted to predict the weld geometric morphology data. The results showed that the average accuracy of the prediction model could reach 97%. Wu et al. [14] established the relation model between the welding process parameters and weld morphologies. The non-dominated sorting genetic algorithm-II was used to explore the Pareto optimal solutions of the welding process parameters and the obtained optimal results agreed well with the experimental results. Zhang et al. [15] introduced a circular oscillating laser to guide the regular flow of molten pool. An optimal laser oscillating welding was developed to effectively control porosity within the acceptable range using response surface methodology.
From the above analysis, image processing is a powerful technology to analyze the weld morphology and porosity which are mainly affected by the welding process parameters in laser welding of aluminum alloy. Therefore, the effects of the laser power (LP), WS and defocus distance (DD) on the weld width (WW), weld penetration (PD), weld area (WA) and WP are investigated in this paper based on the orthogonal experimental design and image processing. The results can provide the theoretical guidance for optimizing welding process parameters in laser welding of aluminum alloy, which is helpful for improving the weld morphology.

2. Experimental Procedure

2.1. Material

The 6061 aluminum alloy is selected as the base material in this research. The dimension of the welding specimens is 220 mm × 100 mm × 2 mm. Since the aluminum alloy is easily oxidized, the surfaces of the welding specimens are covered with oxide film which promotes the formation of weld defects during laser welding process. The surfaces of the welding specimens are polished by the sandpaper and cleaned by the ethanol solution to remove the oxide film and impurities before the welding experiment.

2.2. Orthogonal Experimental Design
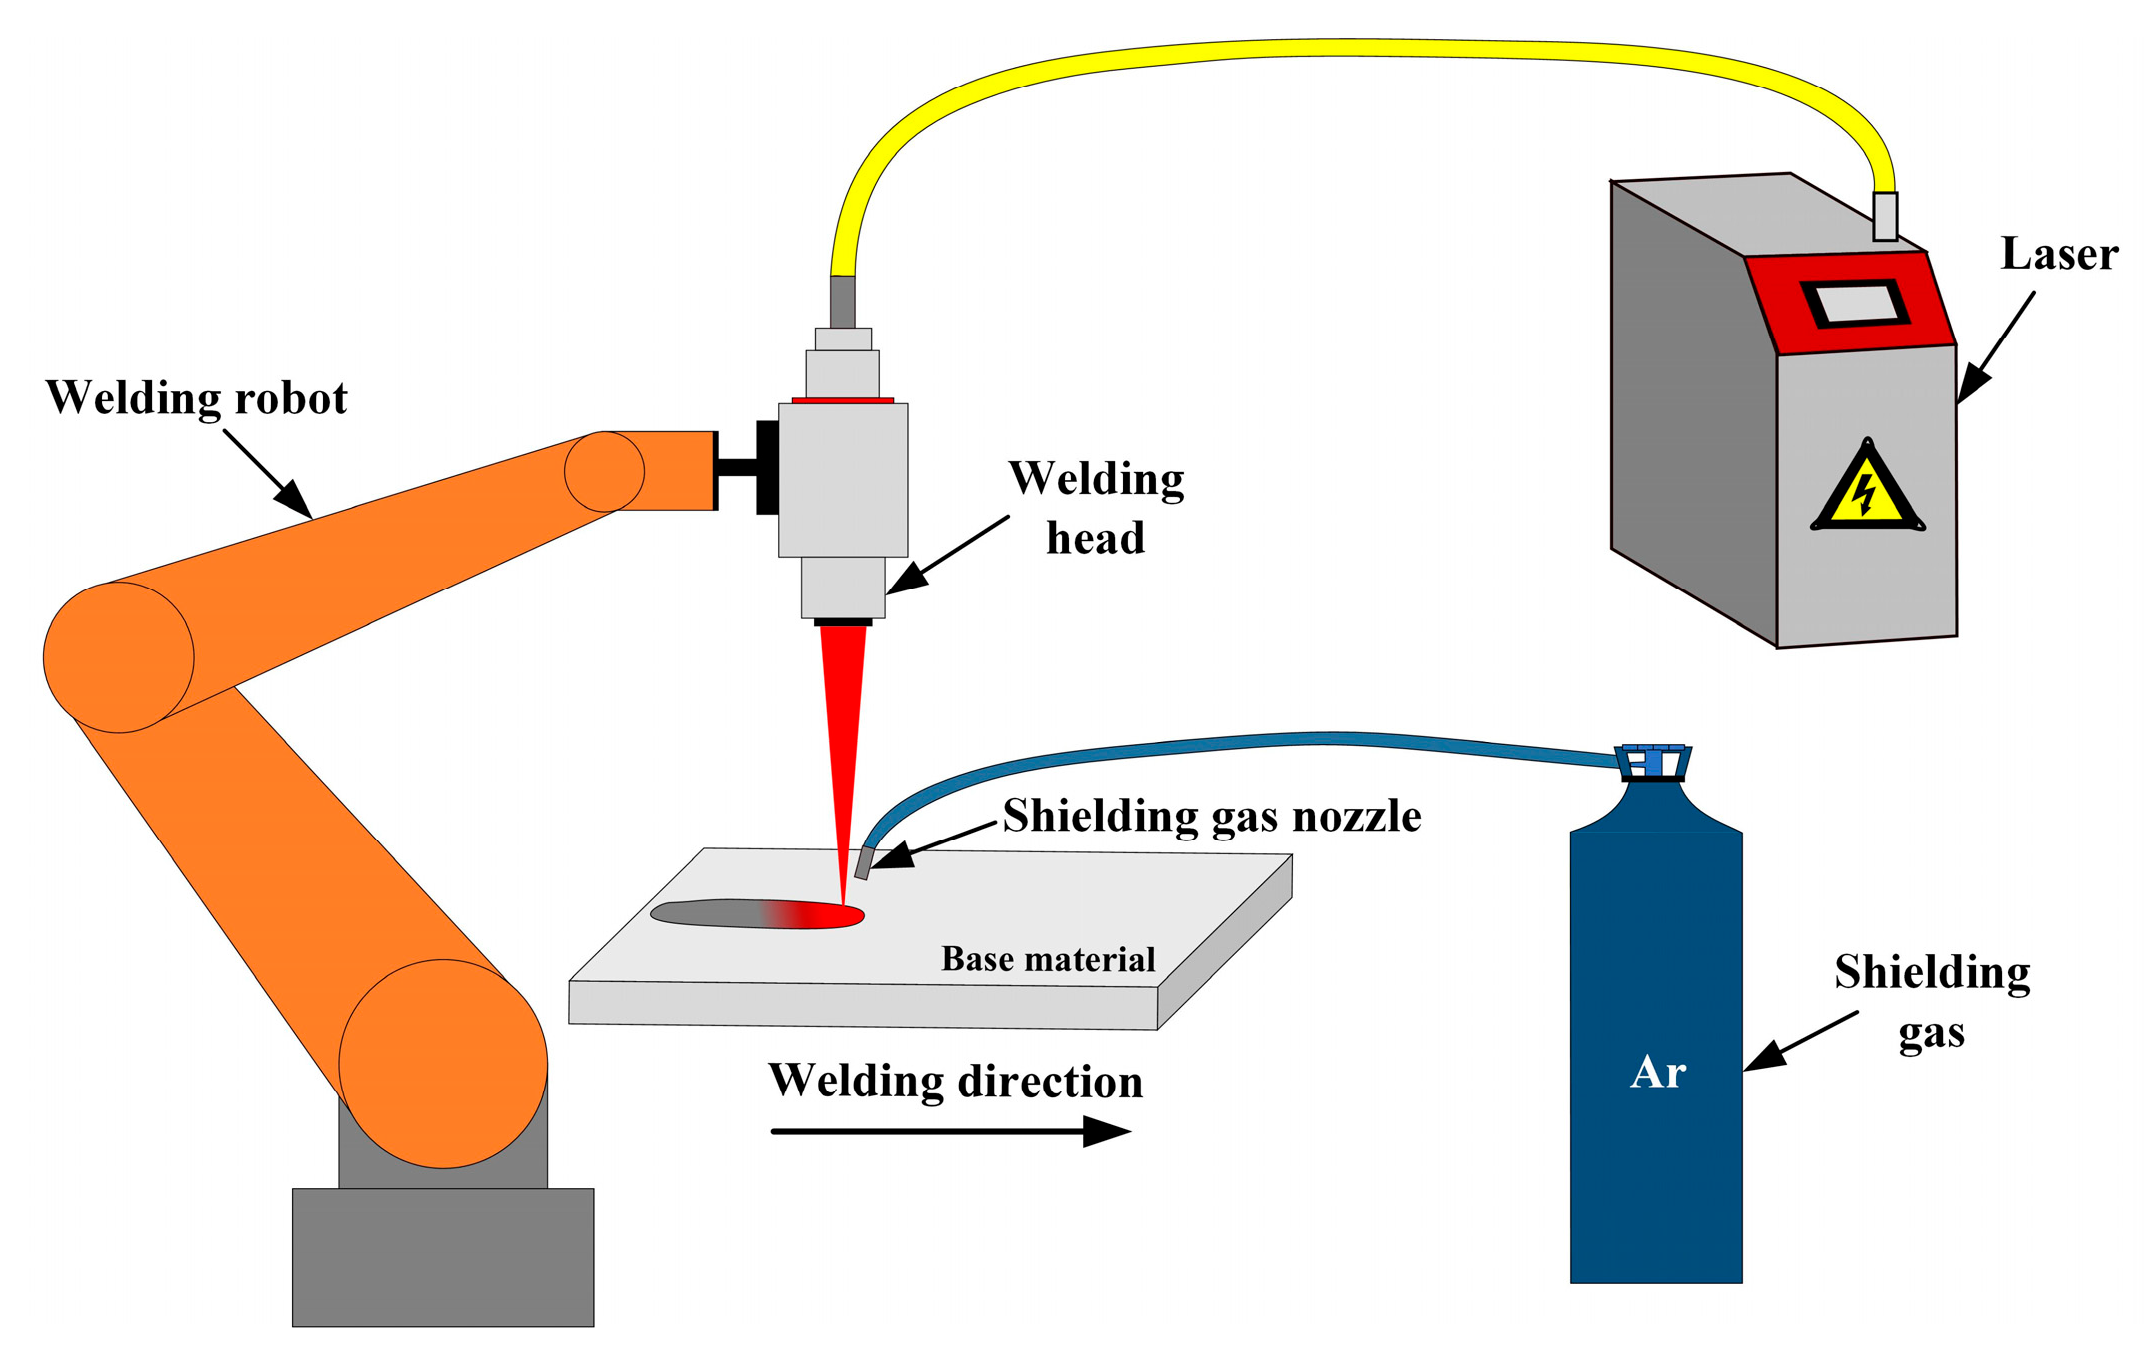
To investigate the effects of laser welding process parameters on weld forming quality, the experiment is designed based on an L25(53) orthogonal table [16]. The three factors are LP, WS and DD. The factors and corresponding levels in the orthogonal experiment are tabulated in Table 1. The orthogonal table used in this research is as shown in Table 2.

2.3. Welding System

The laser welding processes of aluminum alloy under the conditions of the different welding process parameters are achieved by the welding system. The welding system is composed of the laser, welding head, welding robot, shielding gas nozzle and so on. The wavelength of the laser is 1064 nm and the welding head is fixed on the welding robot. During laser welding process, the argon gas with the flow rate of 20 L/min is used as the shielding gas to protect the welding zone. The schematic diagram of the welding system is shown in Figure 1.
Weld samples are cut from the zones close to the weld centerline and then placed inside the metallographic sample inlay equipment. The metallographic samples are polished with sandpaper and polishing agent after inlaying. Then, the metallographic samples are etched to improve the weld zones contrast. The metallographic images of weld are obtained by the optical microscope.

3. Weld Characteristics Extraction

3.1. Weld Morphology Characteristics Extraction

In this paper, the WW, PD and WA are selected as the weld morphology characteristics which are extracted from the metallographic images of weld. The schematic diagram of weld morphology characteristics is shown in Figure 2.
Based on the traditional extraction method, the weld morphology characteristics including the WW and PD are obtained by importing the metallographic image of the weld into the measurement software and measuring. This method is inefficient when processing a large number of metallographic images. Additionally, it is difficult to obtain the WA directly for the weld with irregular shape. Therefore, image processing is adopted in the current research to extract the weld morphology characteristics.
The flow chart of weld morphology characteristics extraction is shown in Figure 3. The metallographic image of the weld is preprocessed through region of interest (ROI) definition, grayscale image conversion and denoising by filter. Then, the automatic seed selection is performed and the seeded region growing (SRG) algorithm [17] is applied for segmentation. Based on the processed image, the weld morphology characteristics including the WW, PD and WA are calculated.
To reduce computational load and noise interference, the region close to the weld is designated as the ROI as follows [18]:
x A = x D = x 0 z A = z B = z 0 x C = x B = x 0 + w z C = z D = z 0 + h
where points A, B, C and D are the bottom-left point, bottom-right point, top-right point and top-left point of the ROI, respectively. x A , x B , x C and x D are the x coordinates of points A, B, C and D, respectively. z A , z B , z C and z D are the z coordinates of points A, B, C and D, respectively. x 0 and z 0 are set according to the metallographic image of weld sample. w is the width of the ROI and h is the height of the ROI.
The ROI is a rectangular region defined by these four points as shown in Figure 4, which allows for precise segmentation and analysis of specific area within the metallographic image of the weld.
During the grayscale image conversion, the colorful metallographic image of the weld in RGB system is converted to grayscale image. The gray level g ( i , j ) of point ( i , j ) in the grayscale image is the weighted sum of the red, green and blue channel values of the original image, which can be defined as [19]:
g ( i , j ) = 0.299 × R ( i , j ) + 0.587 × G ( i , j ) + 0.114 × B ( i , j )
where R ( i , j ) , G ( i , j ) and B ( i , j ) are the red, green and blue channel values of point ( i , j ) , respectively. The value ranges of the red, green and blue channel values are 0–255.
The noise points in the image have great effect on the segmentation result. In the current research, the mean filter is used to denoise the grayscale image. The filtering process is to convert the gray level of a pixel into the mean value of the gray level of the pixel matrix where the pixel is located in the center. The filtering process is described as [20]:
g m ( i , j ) = 1 n × n ( i , j ) C m g ( i , j )
where g m ( i , j ) is gray level of point ( i , j ) after filtering process. C m is a n × n pixel matrix where the point ( i , j ) is located in the center.
The image segmentation process including the automatic selection of the initial seed and the SRG algorithm can be referenced from Ref. [17]. Based on the image segmentation result, the weld morphology characteristics including the WW, PD and WA are calculated as follows [21]:
W W = x m a x x m i n × r c o n
P D = z m a x z m i n × r c o n
W A = P w × r c o n 2
where x m i n , x m a x , z m i n and z m a x are the minimum x coordinate, maximum x coordinate, minimum z coordinate and maximum z coordinate of the image segmentation result, respectively. P w is the number of pixels located in the weld zone. r c o n is the actual length of one pixel in the metallographic image of weld.

3.2. WP Extraction

The weld pore defect is a typical defect in laser welding of aluminum alloy. Based on the preprocessed image, the binary processing is carried out according to the gray level range of the pore region as follows [22]:
g b ( i , j ) = 255 g ( i , j ) R p 0 g ( i , j ) R p
where g b ( i , j ) is the gray level of point ( i , j ) after binary processing. R p is the gray level range of pore region.
The WP is calculated as [23]:
W P = P p P w × 100 %
where P p is the number of pixels located in the pore region.

4. Results and Discussion

4.1. Weld Morphology Characteristics Extraction Results

Based on the weld morphology characteristics extraction process, the weld morphology characteristics of twenty-five metallographic images of weld samples are extracted. Taking the cross-section metallographic image of the weld sample from the No. 4 group of the experiment (LP 700 W, WS 4.0 m/min and DD +1.0 mm) as an example, the corresponding metallographic image of the weld is shown in Figure 5. The corresponding r c o n in Figure 5 is 0.0033 mm.
For the selected metallographic image, the preprocessing is conducted. The weld is selected as the center region of ROI and both of the w and h are set as 400. The obtained ROI image is shown in Figure 6a. After the grayscale image conversion, the corresponding grayscale image is shown in Figure 6b. From Figure 7a, it is clearly observed that the gray levels of weld zone are mainly distributed in the range of 160–220, and the gray levels of base material zone are mainly distributed in the range of 220–250. From Figure 7b, most of the gray levels of pixels are concentrated in the ranges of 50–100 and 150–250. According to Figure 7, the gray levels range of 50–100 correspond to the inlay material zone and the gray levels range of 150–250 correspond to the weld and base material zone. The grayscale image after filtering process is shown in Figure 8.
After the preprocessing of the metallographic image of weld, the SRG algorithm with the automatic initial seed selection is applied to segment the grayscale image after filtering process. The image segmentation result is shown in Figure 9.
The extracted weld morphology is compared with the experimental weld morphology, as shown in Figure 10. It can be found that the extracted weld morphology agree well with the experimental weld morphology. The extracted weld morphology characteristics of the twenty-five weld samples are shown in Table 3.
As shown in Table 3, five weld samples are randomly selected to validate the effectiveness of the proposed method for extracting weld morphology characteristics. After manually annotating the weld areas to be measured, the marked images are imported into the measurement software for measuring. The corresponding extracted weld morphology characteristics are compared with the measured weld morphology characteristics by the measurement software, as shown in Table 4. It can be clearly seen that all relative errors are less than 5%, which demonstrates the effectiveness of the proposed method for extracting weld morphology characteristics.

4.2. WP Extraction Results

Based on the WP extraction process, the WPs of twenty-five metallographic images of weld samples are extracted. Taking the cross-section metallographic image of the weld sample from the No. 9 group of the experiment (LP 900 W, WS 4.0 m/min and DD +2.0 mm) as an example, the corresponding metallographic image of the weld is shown in Figure 11. The image after preprocessing is shown in Figure 12a. According to the gray level range of the image after preprocessing, the binary processing is carried out and the obtained pore profile extraction result is shown in Figure 12b. The extracted WPs of the twenty-five weld samples are shown in Table 5.

4.3. Effects of Welding Process Parameters on Weld Morphology

Based on the extracted weld morphology characteristics of twenty-five weld samples, the weld morphology characteristics under the conditions of the different welding process parameters are analyzed. For the WW, the standard residuals are calculated when the dependent variable is WW, as shown in Figure 13. From Figure 13, the standard residuals are relatively uniformly distributed on both sides of 0, which indicates that the data meet the homogeneity of variance and can be used for multivariate analysis of variance. By setting the WW as the dependent variable and the LP, WS and DD as the impact factors, the test of intersubjective effects is conducted and the corresponding results are as shown in Table 6. From Table 6, the p value of LP is less than 0.05, which indicates that the LP has a significant influence on the WW. The relationship between the average WW and the levels of LP is shown in Figure 14. The average WW is the average value of the WWs of a factor with a certain level. From Figure 14, it can be seen that the average WW generally increases with the increase in LP.
For the PD, the standard residuals are calculated when the dependent variable is PD, as shown in Figure 15. From Figure 15, the standard residuals are relatively uniformly distributed on both sides of 0, which indicates that the data meet the homogeneity of variance and can be used for multivariate analysis of variance. By setting the PD as the dependent variable and the LP, WS and DD as the impact factors, the test of intersubjective effects is conducted and the corresponding results are as shown in Table 7. From Table 7, the p values of LP and DD are less than 0.05, which indicates that the LP and DD have significant influences on the PD. Therefore, only the correlation analyses of LP and DD on the PD are conducted. The relationships between the average PD and the levels of factors are shown in Figure 16. From Figure 16, the average PD generally increases with the increase in LP and increases with the increase in DD. The difference between the maximum and minimum values in Figure 16a is larger than that in Figure 16b, which indicates that the significance of the influence of LP on the PD is higher than the significance of the influence of DD on the PD.
For the WA, the standard residuals are calculated when the dependent variable is WA, as shown in Figure 17. From Figure 17, the standard residuals are relatively uniformly distributed on both sides of 0, which indicates that the data meet the homogeneity of variance and can be used for multivariate analysis of variance. By setting the WA as the dependent variable and the LP, WS and DD as the impact factors, the test of intersubjective effects is conducted and the corresponding results are shown in Table 8. From Table 8, the p values of LP and WS are less than 0.05, which indicates that the LP and WS have significant influences on the WA. The relationships between the average WA and the levels of factors are as shown in Figure 18. From Figure 18, the average WA generally increases with the increase in LP and decreases with the increase in WS. The difference between the maximum and minimum values in Figure 18a is larger than that in Figure 18b, which indicates that the significance of the influence of LP on the WA is higher than the significance of the influence of WS on the WA.

4.4. Effects of Welding Process Parameters on the WP

Based on the extracted WPs of twenty-five weld samples, the WPs under the conditions of the different welding process parameters are analyzed. The standard residuals are calculated when the dependent variable is WP, as shown in Figure 19. From Figure 19, the maximum standard residual is 2.021 and the distribution of standard residuals is relatively concentrated, which indicates that the data of WPs have relatively strong randomness and may not meet the homogeneity of variance. By setting the WP as the dependent variable and the LP, WS and DD as the impact factors, the factor correlation analysis is conducted and the corresponding results are as shown in Table 9. From Table 9, the p values of LP, WS and DD are greater than 0.05, which indicates that the influences of LP, WS and DD on the WP are insignificant.

5. Conclusions

The influences of welding process parameters in aluminum alloy laser welding are explored in this study based on orthogonal experimental design and image processing. An L25(53) orthogonal experiment is designed and the metallographic images of twenty-five weld samples are obtained from the experiment. The weld characteristics including the WW, PD, WA and WP under the conditions of the different welding process parameters considering the LP, WS and DD are extracted from the metallographic images by image processing. The extracted weld characteristics are selected randomly to compare with the measured weld characteristics and the effectiveness of the proposed method is validated. The results show that the LP has a significant influence on the WW. Both the LP and DD have significant influences on the PD and the influence significance of LP is higher. For the WA, the influences of the LP and WS are significant and the influence significance of LP is higher. Additionally, the data of WPs have relatively strong randomness and the influences of LP, WS and DD on the WP are insignificant. The proposed method is benefit for extracting the weld characteristics and the analysis results can provide the theoretical support for optimizing the laser welding parameters and improving the weld quality.

Author Contributions

Conceptualization, Y.A. and N.S.; Validation, Y.A., N.S., S.H., Y.Z. and C.L.; Formal analysis, Y.A. and N.S.; Investigation, Y.A. and S.H.; Data curation, N.S. and Y.Z.; Supervision, Y.A.; Writing—original draft, Y.A., N.S. and S.H.; Writing—review & editing, Y.A., N.S., S.H., Y.Z. and C.L. All authors have read and agreed to the published version of the manuscript.

Funding

This research has been supported by the National Natural Science Foundation of China under Grant No. 52175372, the Central South University Innovation-Driven Research Programme under Grant No. 2023CXQD027, and the Province Project of Innovative Zones for Demonstrating National Sustainable Development Agenda in Chenzhou under Grant No. 2022sfq01.

Institutional Review Board Statement

Not applicable.

Informed Consent Statement

Not applicable.

Data Availability Statement

The original contributions presented in this study are included in the article. Further inquiries can be directed to the corresponding author.

Acknowledgments

The authors also would like to thank the anonymous referees for their valuable comments.

Conflicts of Interest

The authors declare no conflict of interest.

References

  1. Cai, J.; Wei, Y.; Ouyang, Z.; Liu, X.; Jin, H.; Chen, J. Investigation on clockwise circular oscillating laser welding for the 5A06-H112 aluminum alloy: Energy distribution, seam appearance, microstructure, and mechanical properties. Opt. Laser Technol. 2024, 176, 111026. [Google Scholar] [CrossRef]
  2. Xu, G.; Li, P.; Li, L.; Hu, Q.; Zhu, J.; Gu, X.; Du, B. Influence of Arc Power on Keyhole-Induced Porosity in Laser plus GMAW Hybrid Welding of Aluminum Alloy: Numerical and Experimental Studies. Materials 2019, 12, 1328. [Google Scholar] [CrossRef]
  3. Wang, L.; Yao, M.; Gao, X.; Kong, F.; Tang, J.; Kim, M.J. Keyhole stability and surface quality during novel adjustable-ring mode laser (ARM) welding of aluminum alloy. Opt. Laser Technol. 2023, 161, 109202. [Google Scholar] [CrossRef]
  4. Kang, S.; Shin, J. Laser beam oscillation welding of aluminum alloy using the spatially modulated beam by diffractive optical element (DOE). J. Manuf. Process. 2021, 66, 387–396. [Google Scholar] [CrossRef]
  5. Gao, J.-Q.; Qin, G.-L.; Yang, J.-L.; He, J.-G.; Zhang, T.; Wu, C.-S. Image processing of weld pool and keyhole in Nd:YAG laser welding of stainless steel based on visual sensing. Trans. Nonferrous Met. Soc. China 2011, 21, 423–428. [Google Scholar] [CrossRef]
  6. Lei, Z.; Shen, J.; Wang, Q.; Chen, Y. Real-time weld geometry prediction based on multi-information using neural network optimized by PCA and GA during thin-plate laser welding. J. Manuf. Process. 2019, 43, 207–217. [Google Scholar] [CrossRef]
  7. Liu, S.; Wu, D.; Luo, Z.; Zhang, P.; Ye, X.; Yu, Z. Measurement of pulsed laser welding penetration based on keyhole dynamics and deep learning approach. Measurement 2022, 199, 111579. [Google Scholar] [CrossRef]
  8. Huang, Y.; Shen, C.; Ji, X.; Li, F.; Zhang, Y.; Hua, X. Effects of Mg content on keyhole behaviour during deep penetration laser welding of Al-Mg alloys. Opt. Laser Technol. 2020, 125, 106056. [Google Scholar] [CrossRef]
  9. Nguyen, H.-C.; Lee, B.-R. Laser-Vision-based Quality Inspection System for Small-Bead Laser Welding. Int. J. Precis. Eng. Manuf. 2014, 15, 415–423. [Google Scholar] [CrossRef]
  10. Adisa, S.B.; Loginova, I.; Khalil, A.; Solonin, A. Effect of Laser Welding Process Parameters and Filler Metals on the Weldability and the Mechanical Properties of AA7020 Aluminium Alloy. J. Manuf. Mater. Process. 2018, 2, 33. [Google Scholar] [CrossRef]
  11. Liu, M.; Shao, C.; Zheng, Z.; Lu, F. The effect of laser oscillation welding on porosity suppression for medium-thick Al alloy with high Mg content. Opt. Laser Technol. 2024, 175, 110795. [Google Scholar] [CrossRef]
  12. Casalino, G.; Facchini, F.; Mortello, M.; Mummolo, G. ANN modelling to optimize manufacturing processes: The case of laser welding. IFAC-PapersOnLine 2016, 49, 378–383. [Google Scholar] [CrossRef]
  13. Wang, H.; Zhang, Z.; Liu, L. Prediction and fitting of weld morphology of Al alloy-CFRP welding-rivet hybrid bonding joint based on GA-BP neural network. J. Manuf. Process. 2021, 63, 109–120. [Google Scholar] [CrossRef]
  14. Wu, J.; Zhang, S.; Sun, J.; Zhang, C. Data-driven multi-objective optimization of laser welding parameters of 6061-T6 aluminum alloy. J. Phys. Conf. Ser. 2021, 1885, 42007. [Google Scholar] [CrossRef]
  15. Zhang, B.; Chen, H.; Liu, Y.; Meng, Y.; Deng, A.; Wu, X. Study on the influence of Al-Si welding wire on porosity sensitivity in laser welding and process optimization. Opt. Laser Technol. 2024, 170, 110261. [Google Scholar] [CrossRef]
  16. Cui, W.; Li, X.; Zhou, S.; Weng, J. Investigation on process parameters of electrospinning system through orthogonal experimental design. J. Appl. Polym. Sci. 2007, 103, 3105–3112. [Google Scholar] [CrossRef]
  17. Ai, Y.; Han, S.; Lei, C.; Cheng, J. The characteristics extraction of weld seam in the laser welding of dissimilar materials by different image segmentation methods. Opt. Laser Technol. 2023, 167, 109740. [Google Scholar] [CrossRef]
  18. Ai, Y.; Lei, C.; Cheng, J.; Mei, J. Prediction of weld area based on image recognition and machine learning in laser oscillation welding of aluminum alloy. Opt. Lasers Eng. 2023, 160, 107258. [Google Scholar] [CrossRef]
  19. Hou, D.; Zhang, W.; Chen, K.; Lin, S.-J.; Yu, N. Reversible Data Hiding in Color Image with Grayscale Invariance. IEEE Trans. Circuits Syst. Video Technol. 2019, 29, 363–374. [Google Scholar] [CrossRef]
  20. Rakshit, S.; Ghosh, A.; Shankar, B.U. Fast mean filtering technique (FMFT). Pattern Recognit. 2007, 40, 890–897. [Google Scholar] [CrossRef]
  21. Mostafa, M.; Laifi, J.; Ashari, M.; Alrowaili, Z.; Criado, M. MATLAB Image Treatment of Copper-Steel Laser Welding. Adv. Mater. Sci. Eng. 2020, 2020, 8914841. [Google Scholar] [CrossRef]
  22. Yang, Y.; Miao, C.; Li, X.; Mei, X. On-line conveyor belts inspection based on machine vision. Optik 2014, 125, 5803–5807. [Google Scholar] [CrossRef]
  23. Song, C.; Dong, S.; He, P.; Yan, S.; Zhao, X. Correlation of Process Parameters and Porosity in Laser Welding of 7A52 Aluminum Alloy using Response Surface Methodology. Procedia Manuf. 2019, 37, 294–298. [Google Scholar] [CrossRef]
Figure 1. Schematic diagram of the welding system.
Materials 18 03627 g001
Figure 2. Schematic diagram of weld morphology characteristics.
Materials 18 03627 g002
Figure 3. Flow chart of weld morphology characteristics extraction.
Materials 18 03627 g003
Figure 4. Schematic diagram of ROI extraction.
Materials 18 03627 g004
Figure 5. Cross-section metallographic image of the weld sample from the No. 4 group of the experiment.
Materials 18 03627 g005
Figure 6. ROI image and grayscale image: (a) ROI image; (b) grayscale image.
Materials 18 03627 g006
Figure 7. Gray levels distribution and gray histogram: (a) gray levels distribution; (b) gray histogram.
Materials 18 03627 g007
Figure 8. Grayscale image after filtering process.
Materials 18 03627 g008
Figure 9. Image segmentation result.
Materials 18 03627 g009
Figure 10. Comparison between the extracted weld morphology and the experimental weld morphology.
Materials 18 03627 g010
Figure 11. Cross-section metallographic image of the weld sample from the No. 9 group of the experiment.
Materials 18 03627 g011
Figure 12. Image after preprocessing and pore profile extraction result: (a) image after preprocessing; (b) pore profile extraction result.
Materials 18 03627 g012
Figure 13. Standard residuals for WW.
Materials 18 03627 g013
Figure 14. Relationship between the average WW and the levels of LP.
Materials 18 03627 g014
Figure 15. Standard residuals for PD.
Materials 18 03627 g015
Figure 16. Relationships between the average PD and the levels of factors: (a) LP; (b) DD.
Materials 18 03627 g016
Figure 17. Standard residuals for WA.
Materials 18 03627 g017
Figure 18. Relationships between the average WA and the levels of factors: (a) LP; (b) WS.
Materials 18 03627 g018
Figure 19. Standard residuals for WP.
Materials 18 03627 g019
Table 1. Factors and corresponding levels in orthogonal experiment.
FactorLevel 1Level 2Level 3Level 4Level 5
LP (W)700900110013001500
WS (m/min)1.02.03.04.05.0
DD (mm)−2.0−1.00.0+1.0+2.0
Table 2. The orthogonal table.
No.LP (W)WS (m/min)DD (mm)No.LP (W)WS (m/min)DD (mm)
17001.0−2.01411004.0−2.0
27002.0−1.01511005.0−1.0
37003.00.01613001.0+1.0
47004.0+1.01713002.0+2.0
57005.0+2.01813003.0−2.0
69001.0−1.01913004.0−1.0
79002.00.02013005.00.0
89003.0+1.02115001.0+2.0
99004.0+2.02215002.0−2.0
109005.0−2.02315003.0−1.0
1111001.00.02415004.00.0
1211002.0+1.02515005.0+1.0
1311003.0+2.0
Table 3. Extracted weld morphology characteristics of the twenty-five weld samples.
No.WW
(mm)
PD
(mm)
WA
(mm2)
No.WW
(mm)
PD
(mm)
WA
(mm2)
10.4170.1360.036140.5170.1790.063
20.3840.1460.032151.3971.1920.744
30.3710.1220.029162.7682.3774.528
40.9340.8740.493171.7652.3712.528
50.8910.8540.440180.6190.2480.097
60.4470.1790.048191.7681.7091.643
71.7351.5661.317201.3841.9871.512
81.5631.7751.409212.7782.4604.511
91.4071.7121.106222.4802.3443.282
100.3480.1420.034231.8812.9743.127
112.9442.7094.485241.4742.7151.840
122.1662.6002.912251.2382.0761.575
131.3512.4472.216
Table 4. Comparison between the extracted weld morphology characteristics and the measured weld morphology characteristics of the five weld samples.
No.Extracted Weld Morphology CharacteristicsMeasured Weld Morphology CharacteristicsRelative Errors
WW
(mm)
PD
(mm)
WA
(mm2)
WW
(mm)
PD
(mm)
WA
(mm2)
WW
(%)
PD
(%)
WA
(%)
131.3512.4472.2161.3332.4592.1711.3500.4882.073
140.5170.1790.0630.5330.1770.0613.0021.1303.279
180.6190.2480.0970.6460.2370.0934.1804.6414.301
222.4802.3443.2822.3822.3623.1874.1140.7622.981
231.8812.9743.1271.8063.0243.1194.1531.6530.256
Table 5. Extracted WPs of the twenty-five weld samples.
No.WP (%)No.WP (%)No.WP (%)No.WP (%)No.WP (%)
10.00060.000110.675160.000210.000
20.00070.000120.000170.000220.000
30.00081.097130.000180.000230.000
40.07390.102140.000190.000240.000
59.500100.000150.0002017.256250.000
Table 6. Factor correlation analysis of WW.
SourceSum of SquaresDegree of FreedomMean SquareF Valuep Value
Correction model11.269120.9392.6520.052
Intercept49.076149.076138.5860.000
LP5.99941.5004.2350.023
WS2.64140.6601.8640.182
DD2.63040.6581.8570.183
Error4.249120.354
Total64.59425
Total of corrections15.51924
Table 7. Factor correlation analysis of PD.
SourceSum of SquaresDegree of FreedomMean SquareF Valuep Value
Correction model20.306121.6924.8310.005
Intercept57.438157.438163.9900.000
LP12.61343.1539.0030.001
WS0.81840.2050.5840.680
DD6.87441.7194.9060.014
Error4.203120.350
Total81.94725
Total of corrections24.50924
Table 8. Factor correlation analysis of WA.
SourceSum of SquaresDegree of FreedomMean SquareF Valuep Value
Correction model43.816123.6514.2680.009
Intercept64.022164.02274.8440.000
LP23.31845.8306.8150.004
WS11.76042.9403.4370.043
DD8.73742.1842.5530.093
Error10.265120.855
Total118.10325
Total of corrections54.08124
Table 9. Factor correlation analysis of WP.
SourceSum of SquaresDegree of FreedomMean SquareF Valuep Value
Correction model205.9301217.1611.3650.299
Intercept32.954132.9542.6220.131
LP45.307411.3270.9010.493
WS110.560427.6402.1990.131
DD50.063412.5160.9960.447
Error150.8101212.568
Total389.69425
Total of corrections356.74024
Disclaimer/Publisher’s Note: The statements, opinions and data contained in all publications are solely those of the individual author(s) and contributor(s) and not of MDPI and/or the editor(s). MDPI and/or the editor(s) disclaim responsibility for any injury to people or property resulting from any ideas, methods, instructions or products referred to in the content.

