3.1. The Flow Stress Curve of 14Cr1Mo Steel
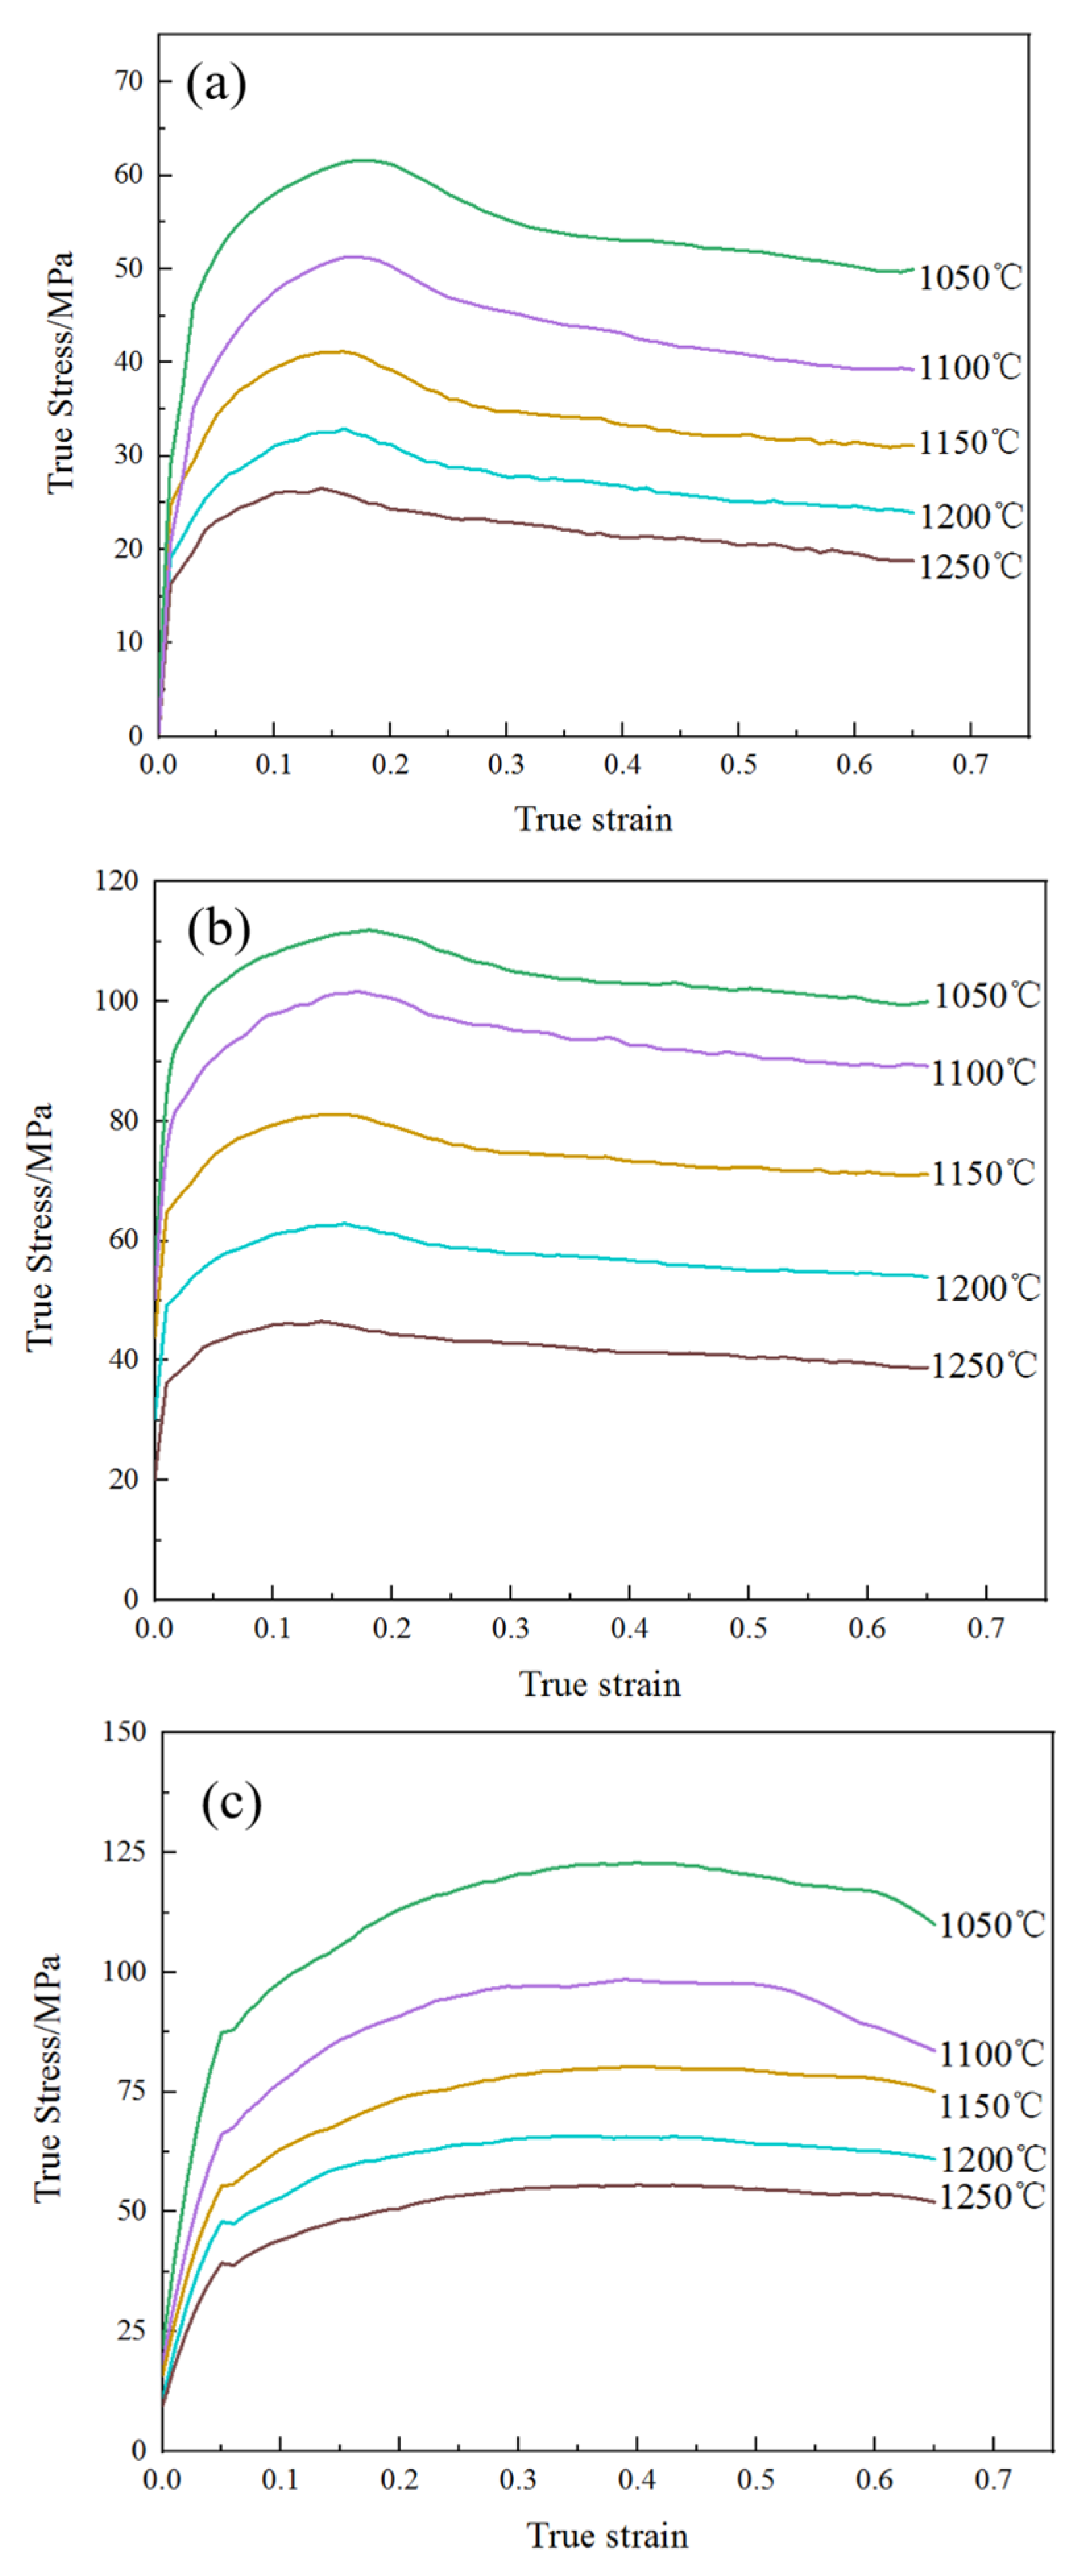
The true stress–strain curves of 14Cr1Mo steel are presented in
Figure 4. As illustrated, the flow stress curves exhibited typical dynamic recrystallization (DRX) characteristics. During the initial compression stage, the stress rapidly increased due to dislocation accumulation [
14,
15,
16]. Upon reaching the critical stress, new grains began to form through DRX, causing the stress growth rate to decelerate. In this phase, work hardening dominated, driving the stress to its peak value. Subsequently, during dynamic softening, dynamic recovery (DRV) and DRX became predominant as new grains nucleated and grew [
17,
18,
19,
20]. Finally, in the steady-state stage, the stress gradually decreased with increasing strain until equilibrium was achieved between DRV, DRX, and work hardening [
21].
As shown in
Figure 4, when the strain rate was constant, the decrease in deformation temperature gradually increased the peak strain of 14Cr1Mo steel. For instance, at a strain rate of 0.1 s
−1, the temperature dropped from 1250 °C to 1050 °C, and the peak strain increased from 0.139 to 0.187 (
Table 2). This was because the dynamic recrystallization of the material required sufficient activation energy. The decrease in deformation temperature made the material need a greater degree of strain, increasing the dislocation density to enhance the driving force it requires.
When the deformation temperature was constant, at low strain rates (0.01 s−1 and 0.1 s−1), the true stress of 14Cr1Mo steel tended to level off when the strain reached 0.65, indicating that the internal dynamic recrystallization of its microstructure was sufficient. At high strain rates (1 s−1), after the deformation of the material ends, the true stress still showed a clear tendency to decrease and did not tend to level off. Among them, this was most evident under the condition of 1050 °C/1 s−1. This was because the strain rate was too fast, the deformation time was too short, and the dynamic recrystallization could not occur completely in time. The degree of internal recrystallization was lower compared to the strain rates of 0.01 s−1 and 0.1 s−1.
Under the condition of 1050 °C/0.01 s
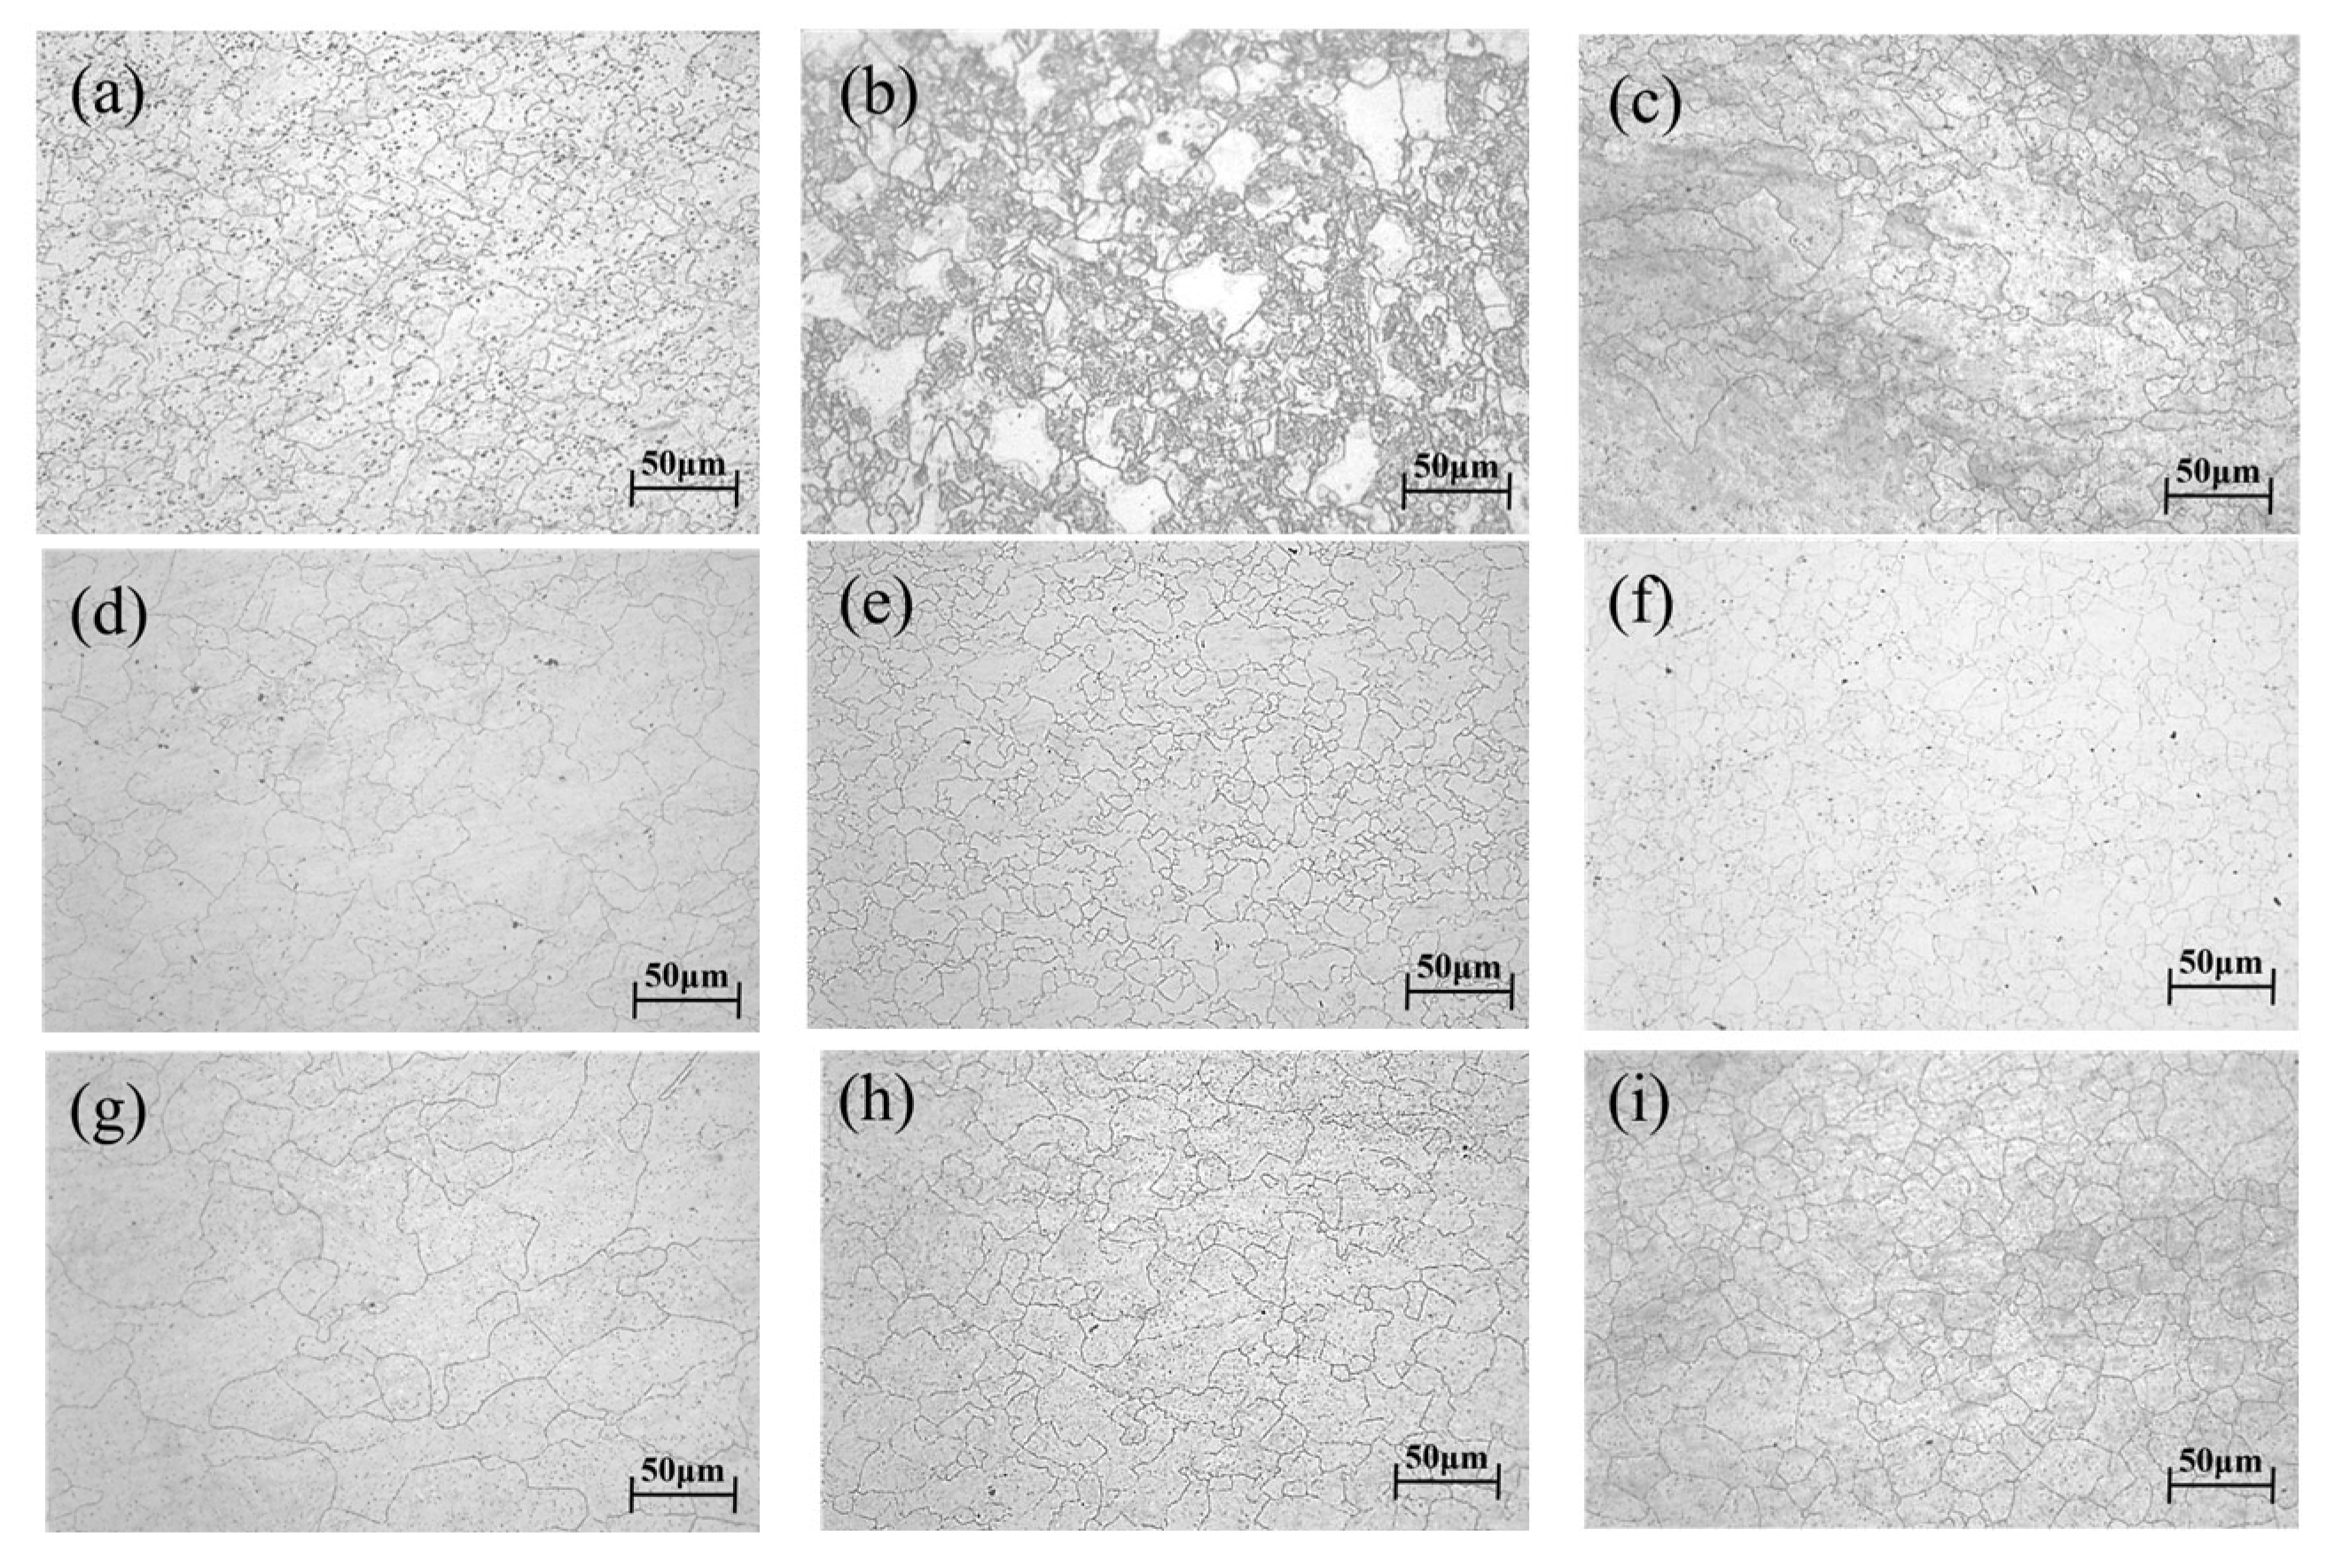
−1, the material reached its peak stress of 61.79 MPa at a strain of 0.175(
Table 2). With further deformation, DRV and DRX continuously occurred, leading to stress reduction until a steady-state stress of 49.63 MPa was attained. The corresponding microstructure (
Figure 5a) demonstrated complete DRX, featuring fine and uniform grains with an average size of approximately 34.75 μm, along with minor dispersed precipitates. However, when the strain rate remains constant and the temperature is raised to 1250 °C, although dynamic recrystallization has already occurred, the already refined grains grow again, as shown in
Figure 5d, with a grain size of 136.57 μm.
When the strain rate was increased to 0.1 s
−1, the material reached the peak stress of 114.27 MPa at a strain of 0.187 (
Table 2). With the increase of strain, the stress decreased and reached a steady state of 103.79 MPa. The corresponding microstructure (
Figure 5b) showed a large number of dynamic recrystallized nucleated grains and some relatively coarse grains, with an average grain size of approximately 13.32 μm.
When the strain rate was increased to 1 s
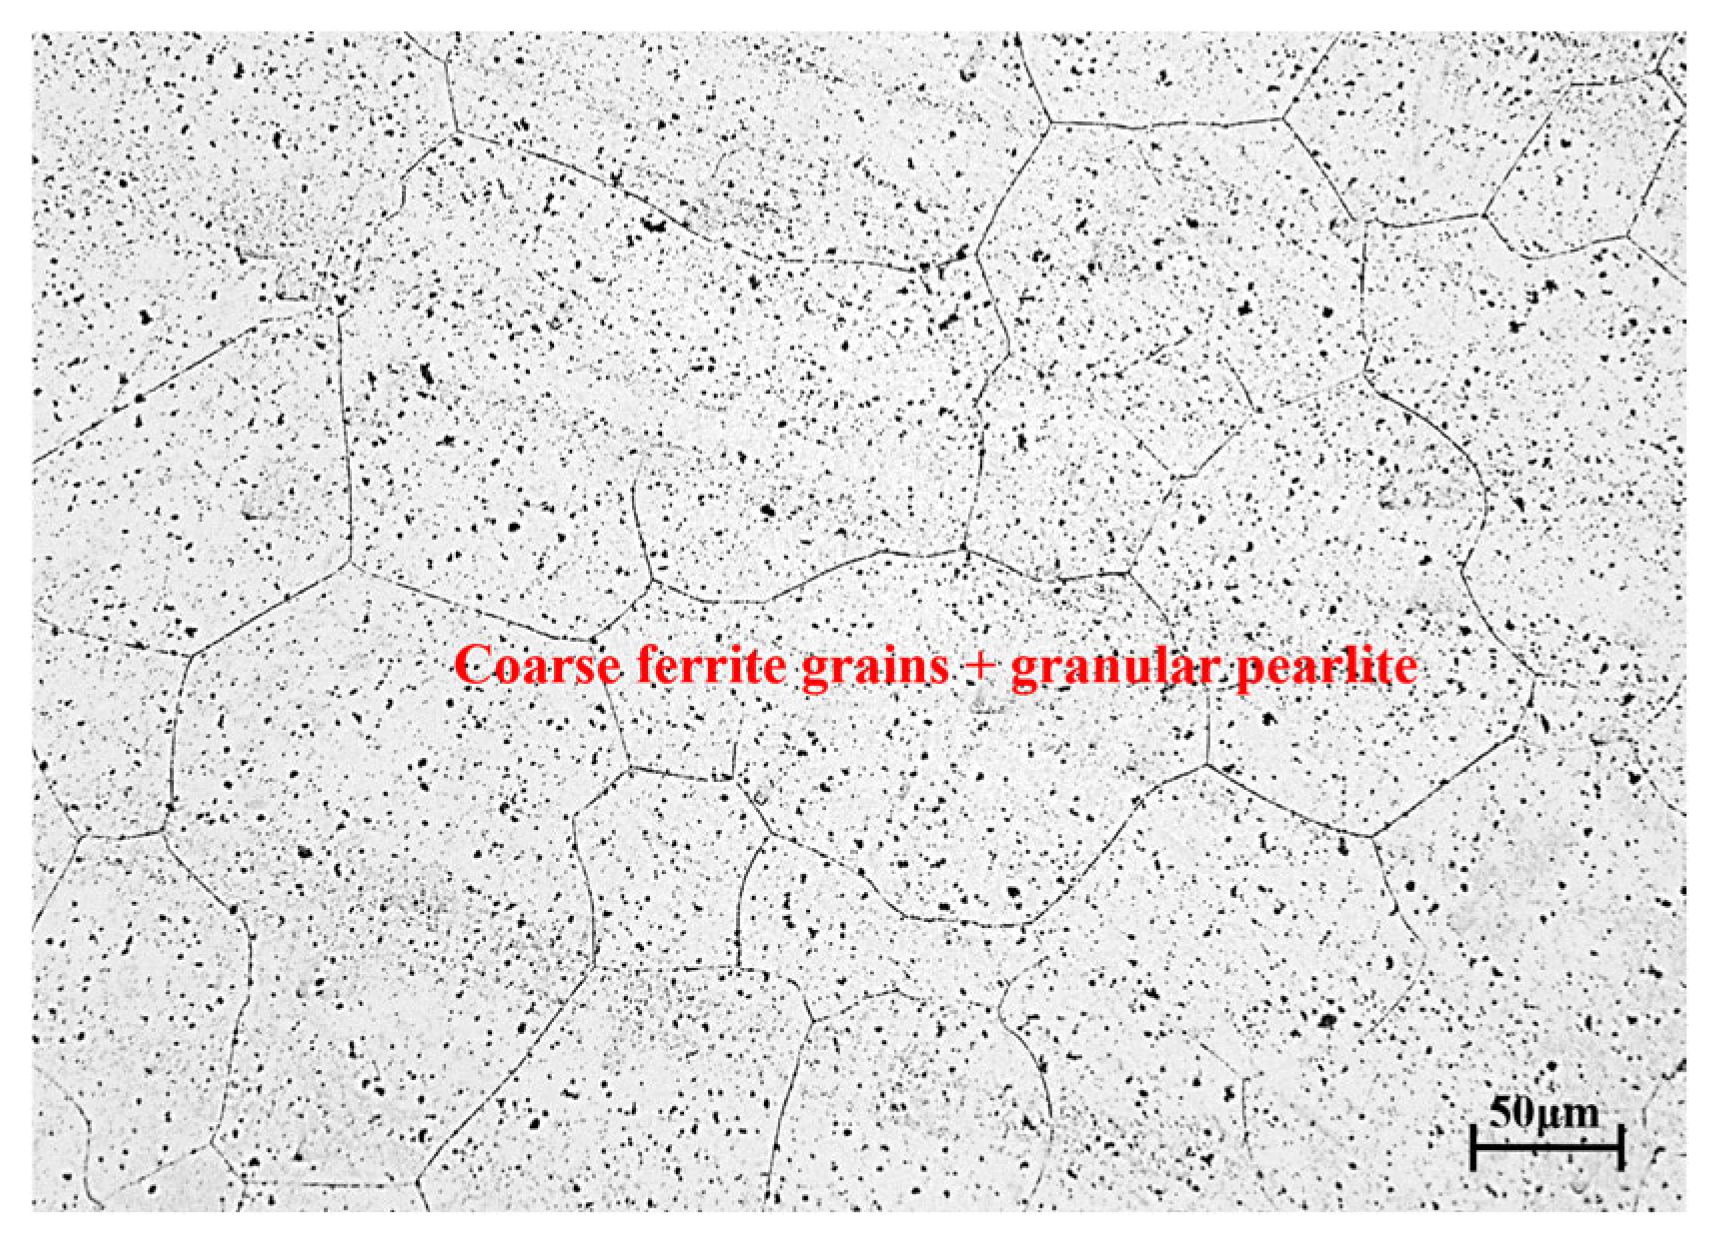
−1, the stress initially rose sharply with increasing strain before slowing due to DRV-induced softening. The peak stress of 122.69 MPa occurred at a strain of 0.32, followed by a gradual decline to 111.80 MPa at a strain of 0.65. The absence of stress stabilization indicated incomplete DRX. The corresponding microstructure (
Figure 5c) showed that the material simultaneously presented fine ferrite grains and relatively coarse ferrite grains, with poor uniformity and no obvious granular pearlite (carbides) [
22]. The refined grain size measured approximately 8.16 μm.
3.2. Establishment of the Recrystallization Model of 14Cr1Mo Steel
3.2.1. Identification Parameters of the Critical Strain Model of 14Cr1Mo Steel
Dynamic recrystallization of 14Cr1Mo steel was the process of forming new equiaxed crystals within the material. When the critical strain was reached, dynamic recrystallization could occur [
23]. When the material underwent recrystallization, there was an inflection point for the work hardening rate [
24]. The value was obtained through Equation (1) [
25]:
Among them, is stress, is work hardening rate, and is strain.
Therefore, the following equation was derived:
The critical strain value was determined by identifying the extremum point of curve
. The correlation between parameters
and
was effectively characterized by a third-order polynomial regression model, as expressed below:
Furthermore, the critical strain was obtained through Equation (4):
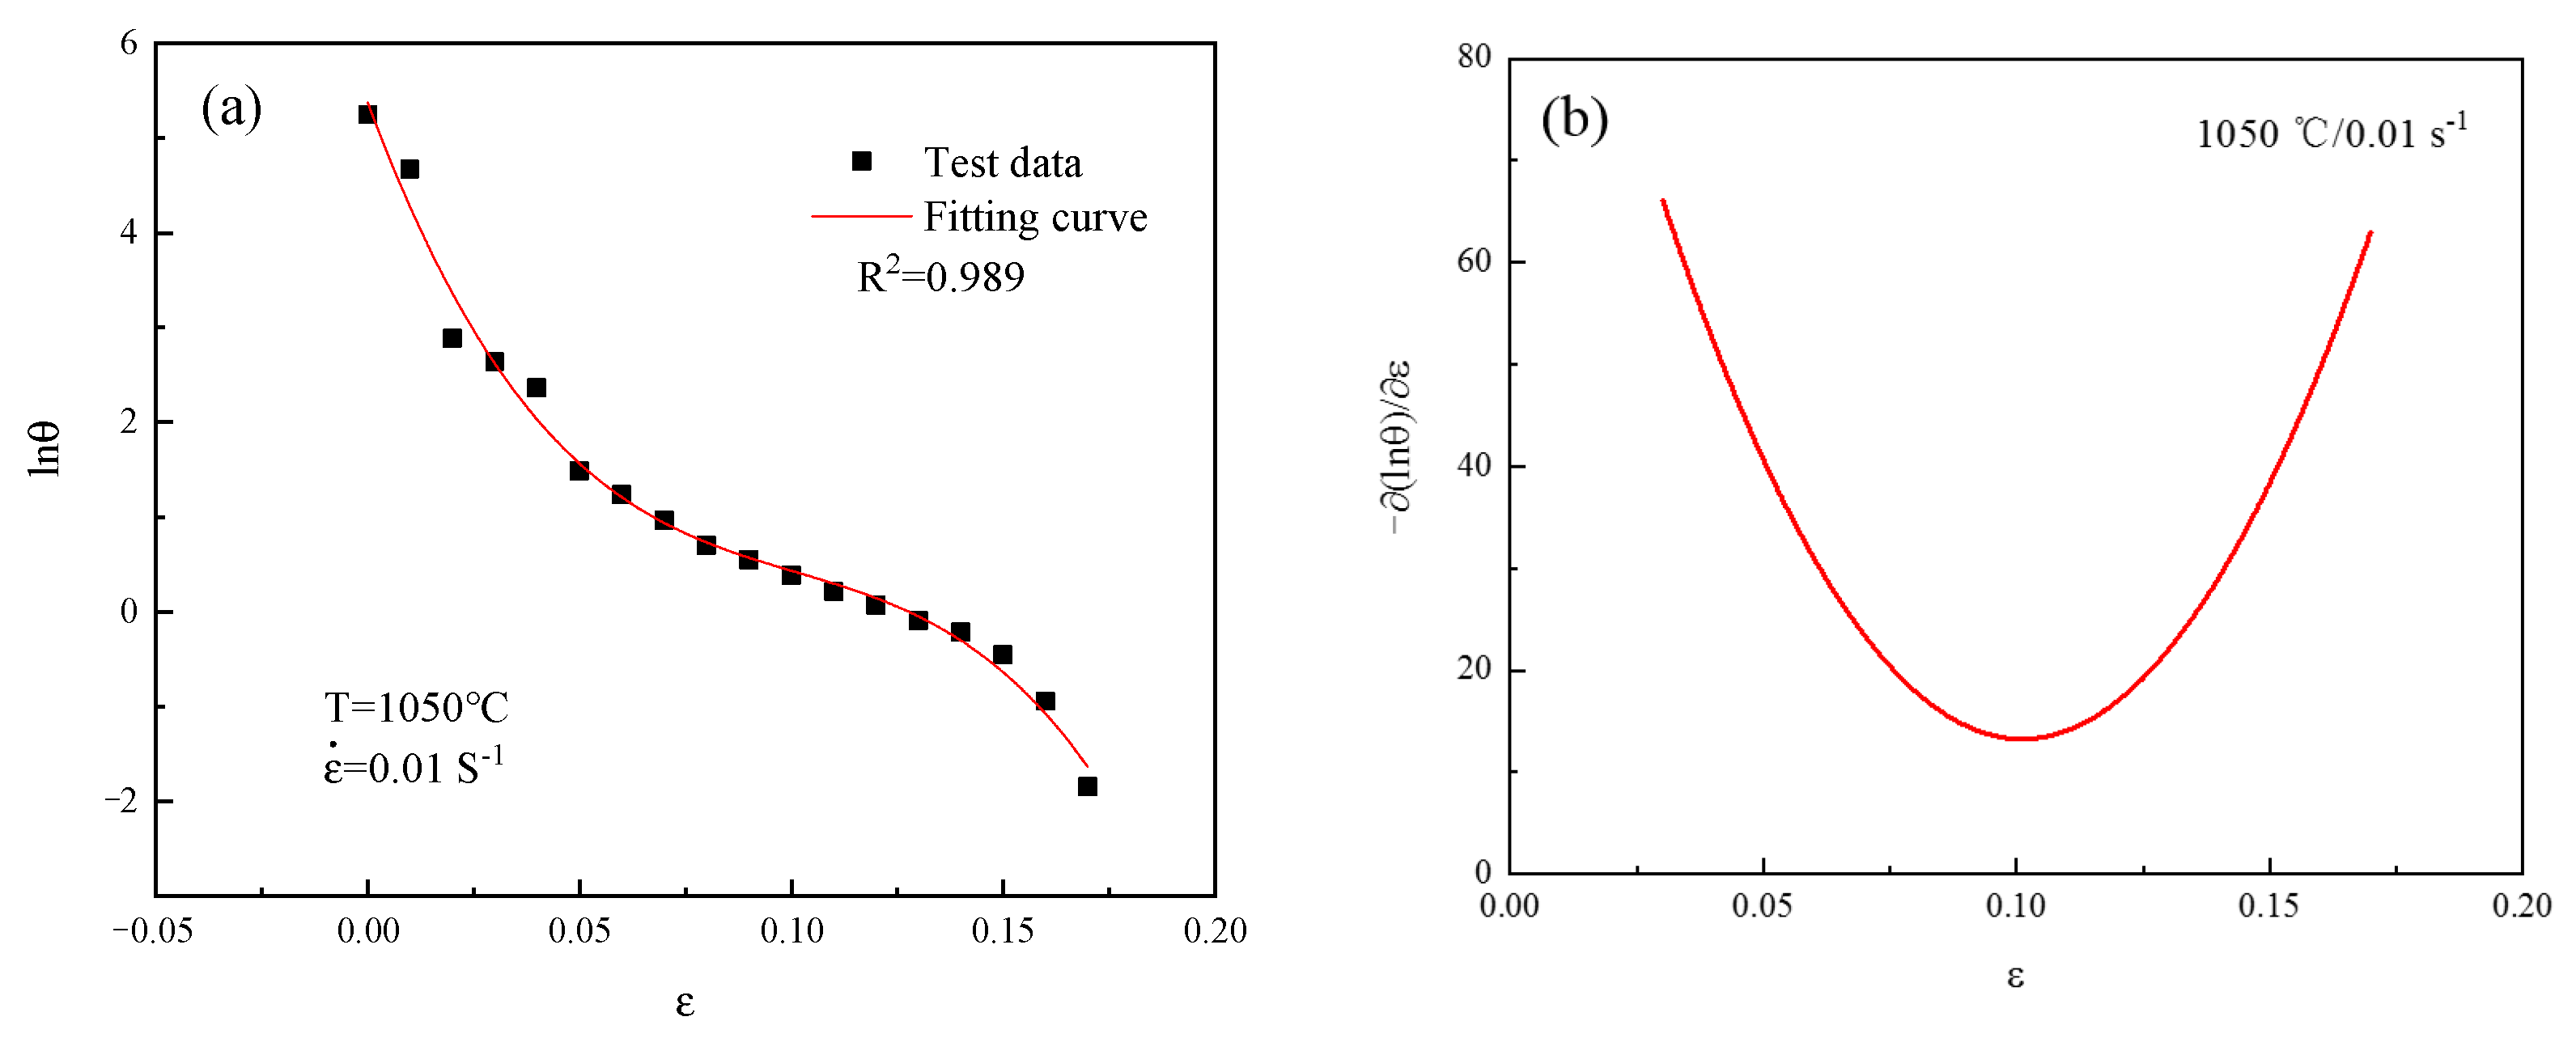
The test data of 14Cr1Mo steel were fitted. Among them, at 1050 °C/0.01 s
−1,
curve is shown in
Figure 6a. This behavior was mathematically described by the following fitted curve:
Figure 6b shows the curve of
fitting under the condition of 1050 °C/0.01 s
−1. The minimum point of this curve corresponded to the critical strain for 14Cr1Mo steel, with the quantitative values being summarized in
Table 3.
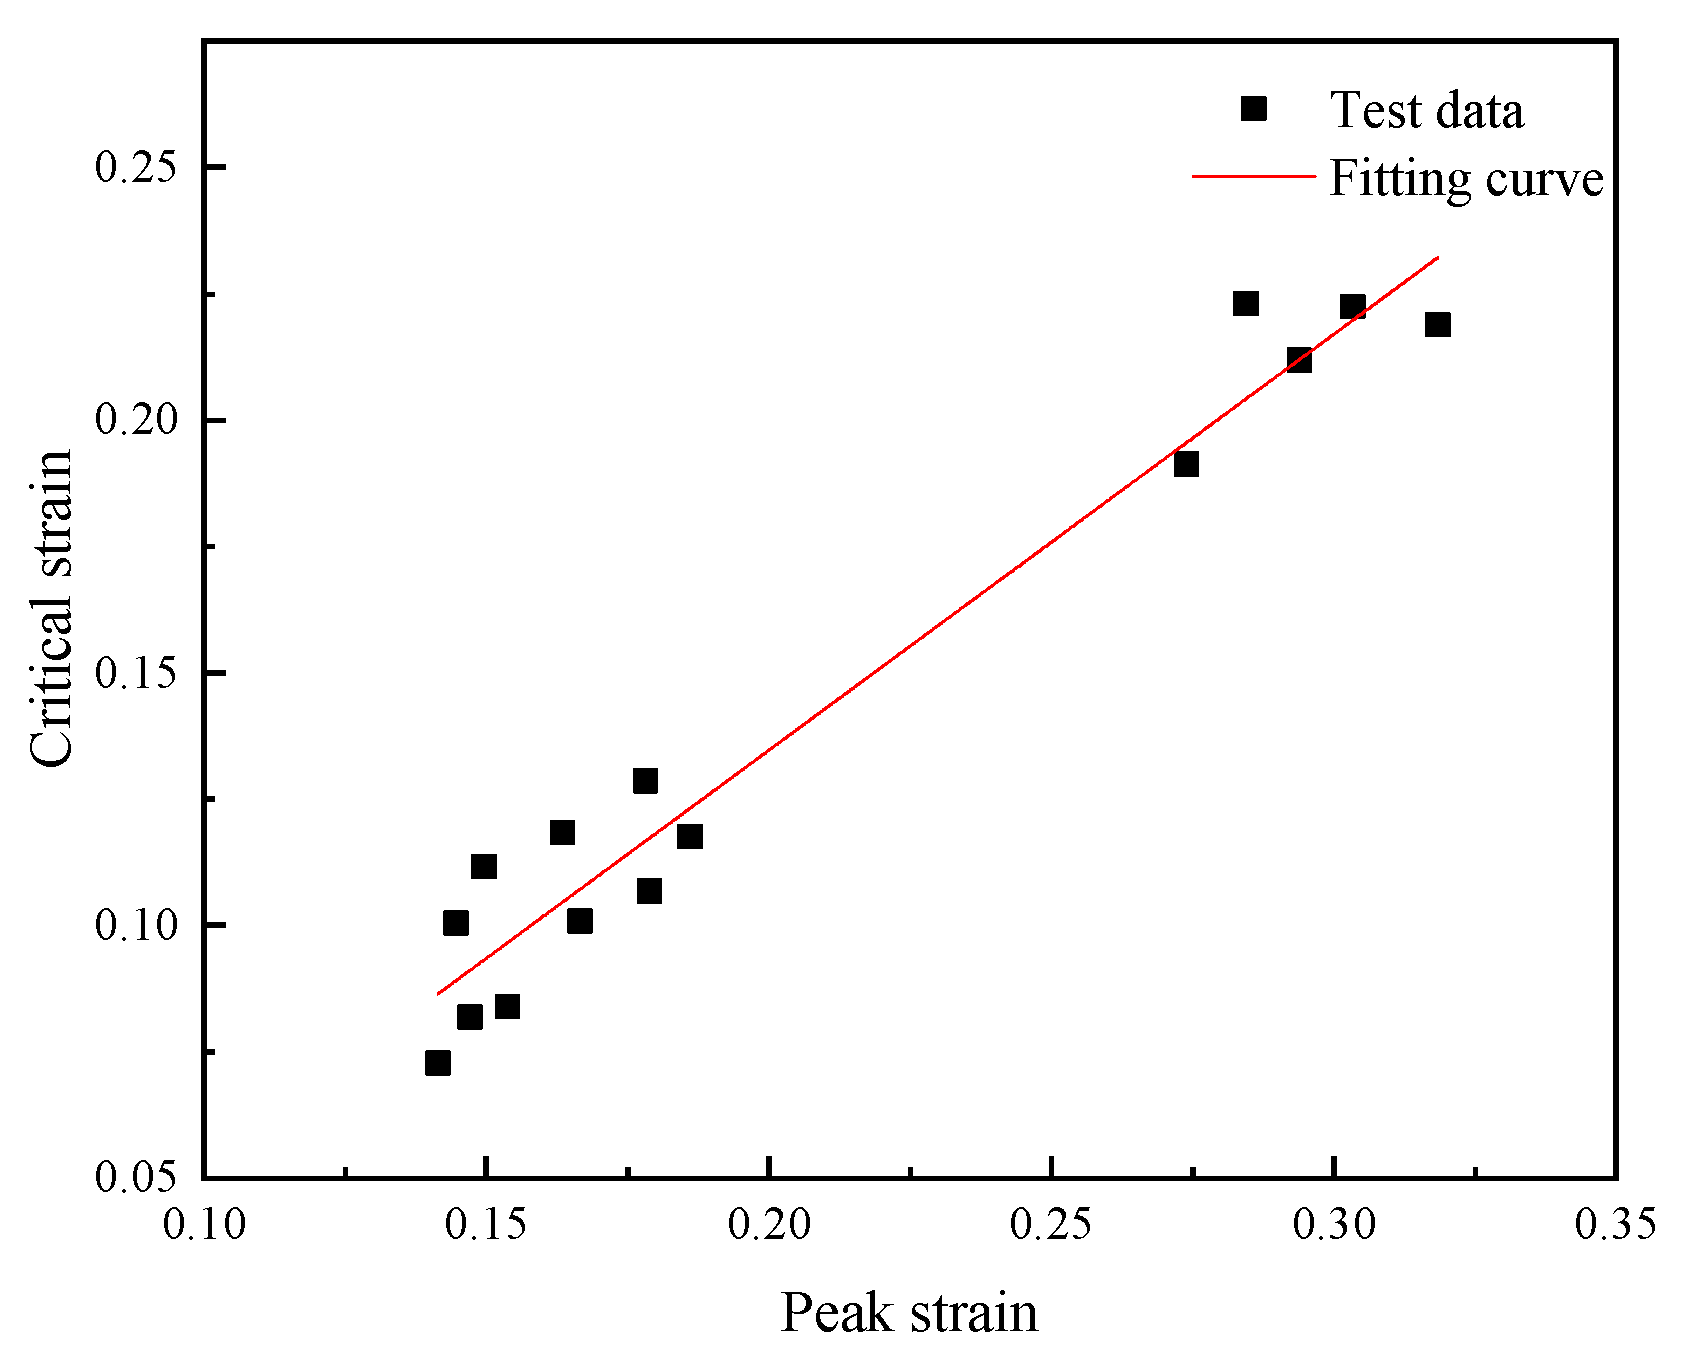
The relationship between critical strain and peak strain was expressed as
The peak strain model of 14Cr1Mo steel was expressed as follows [
26]:
In the formula, is the peak strain, is the strain rate, is the activation energy, is the temperature, and the rest are constants.
As shown in
Figure 7, the peak strain and critical strain of 14Cr1Mo steel under various deformation conditions were linearly fitted to obtain slope of
, and the correlation coefficient was
.
A linear analysis of
was performed, as illustrated in
Figure 8a, where the slope corresponded to parameter
. The average value of
at different temperatures was determined to be 0.135.
The slope of
was found to be
through linear analysis, as shown in
Figure 8b. The average value of
across different temperatures was determined to be 1338.790 J/mol, so
J/mol.
By substituting and into Equation (8), the value of under each deformation condition was calculated, and the arithmetic mean value was determined to be 1.423.
Then, the critical strain calculation formula was expressed as follows:
3.2.2. Determination of Parameters of Dynamic Recrystallization Model of 14Cr1Mo Steel
The commonly used methods for determining the volume fraction of dynamic recrystallization (DRX) in materials included metallographic analysis, the energy method, and true stress–strain curve analysis [
27]. However, the metallographic approach imposed stringent requirements on specimen preparation and etching results, while the energy method proved inconvenient for measuring deformation energy storage. Consequently, the true stress–strain curve method was selected to quantify the DRX volume fraction in 14Cr1Mo steel.
The relationship between the percentage of dynamic recrystallization and stress was expressed as follows [
28]:
Among them,
represents the flow stress value considering only dynamic recovery (DRV), the stress value obtained from the dynamic recovery curve of the material;
represents the saturation stress of the DRV curve; and
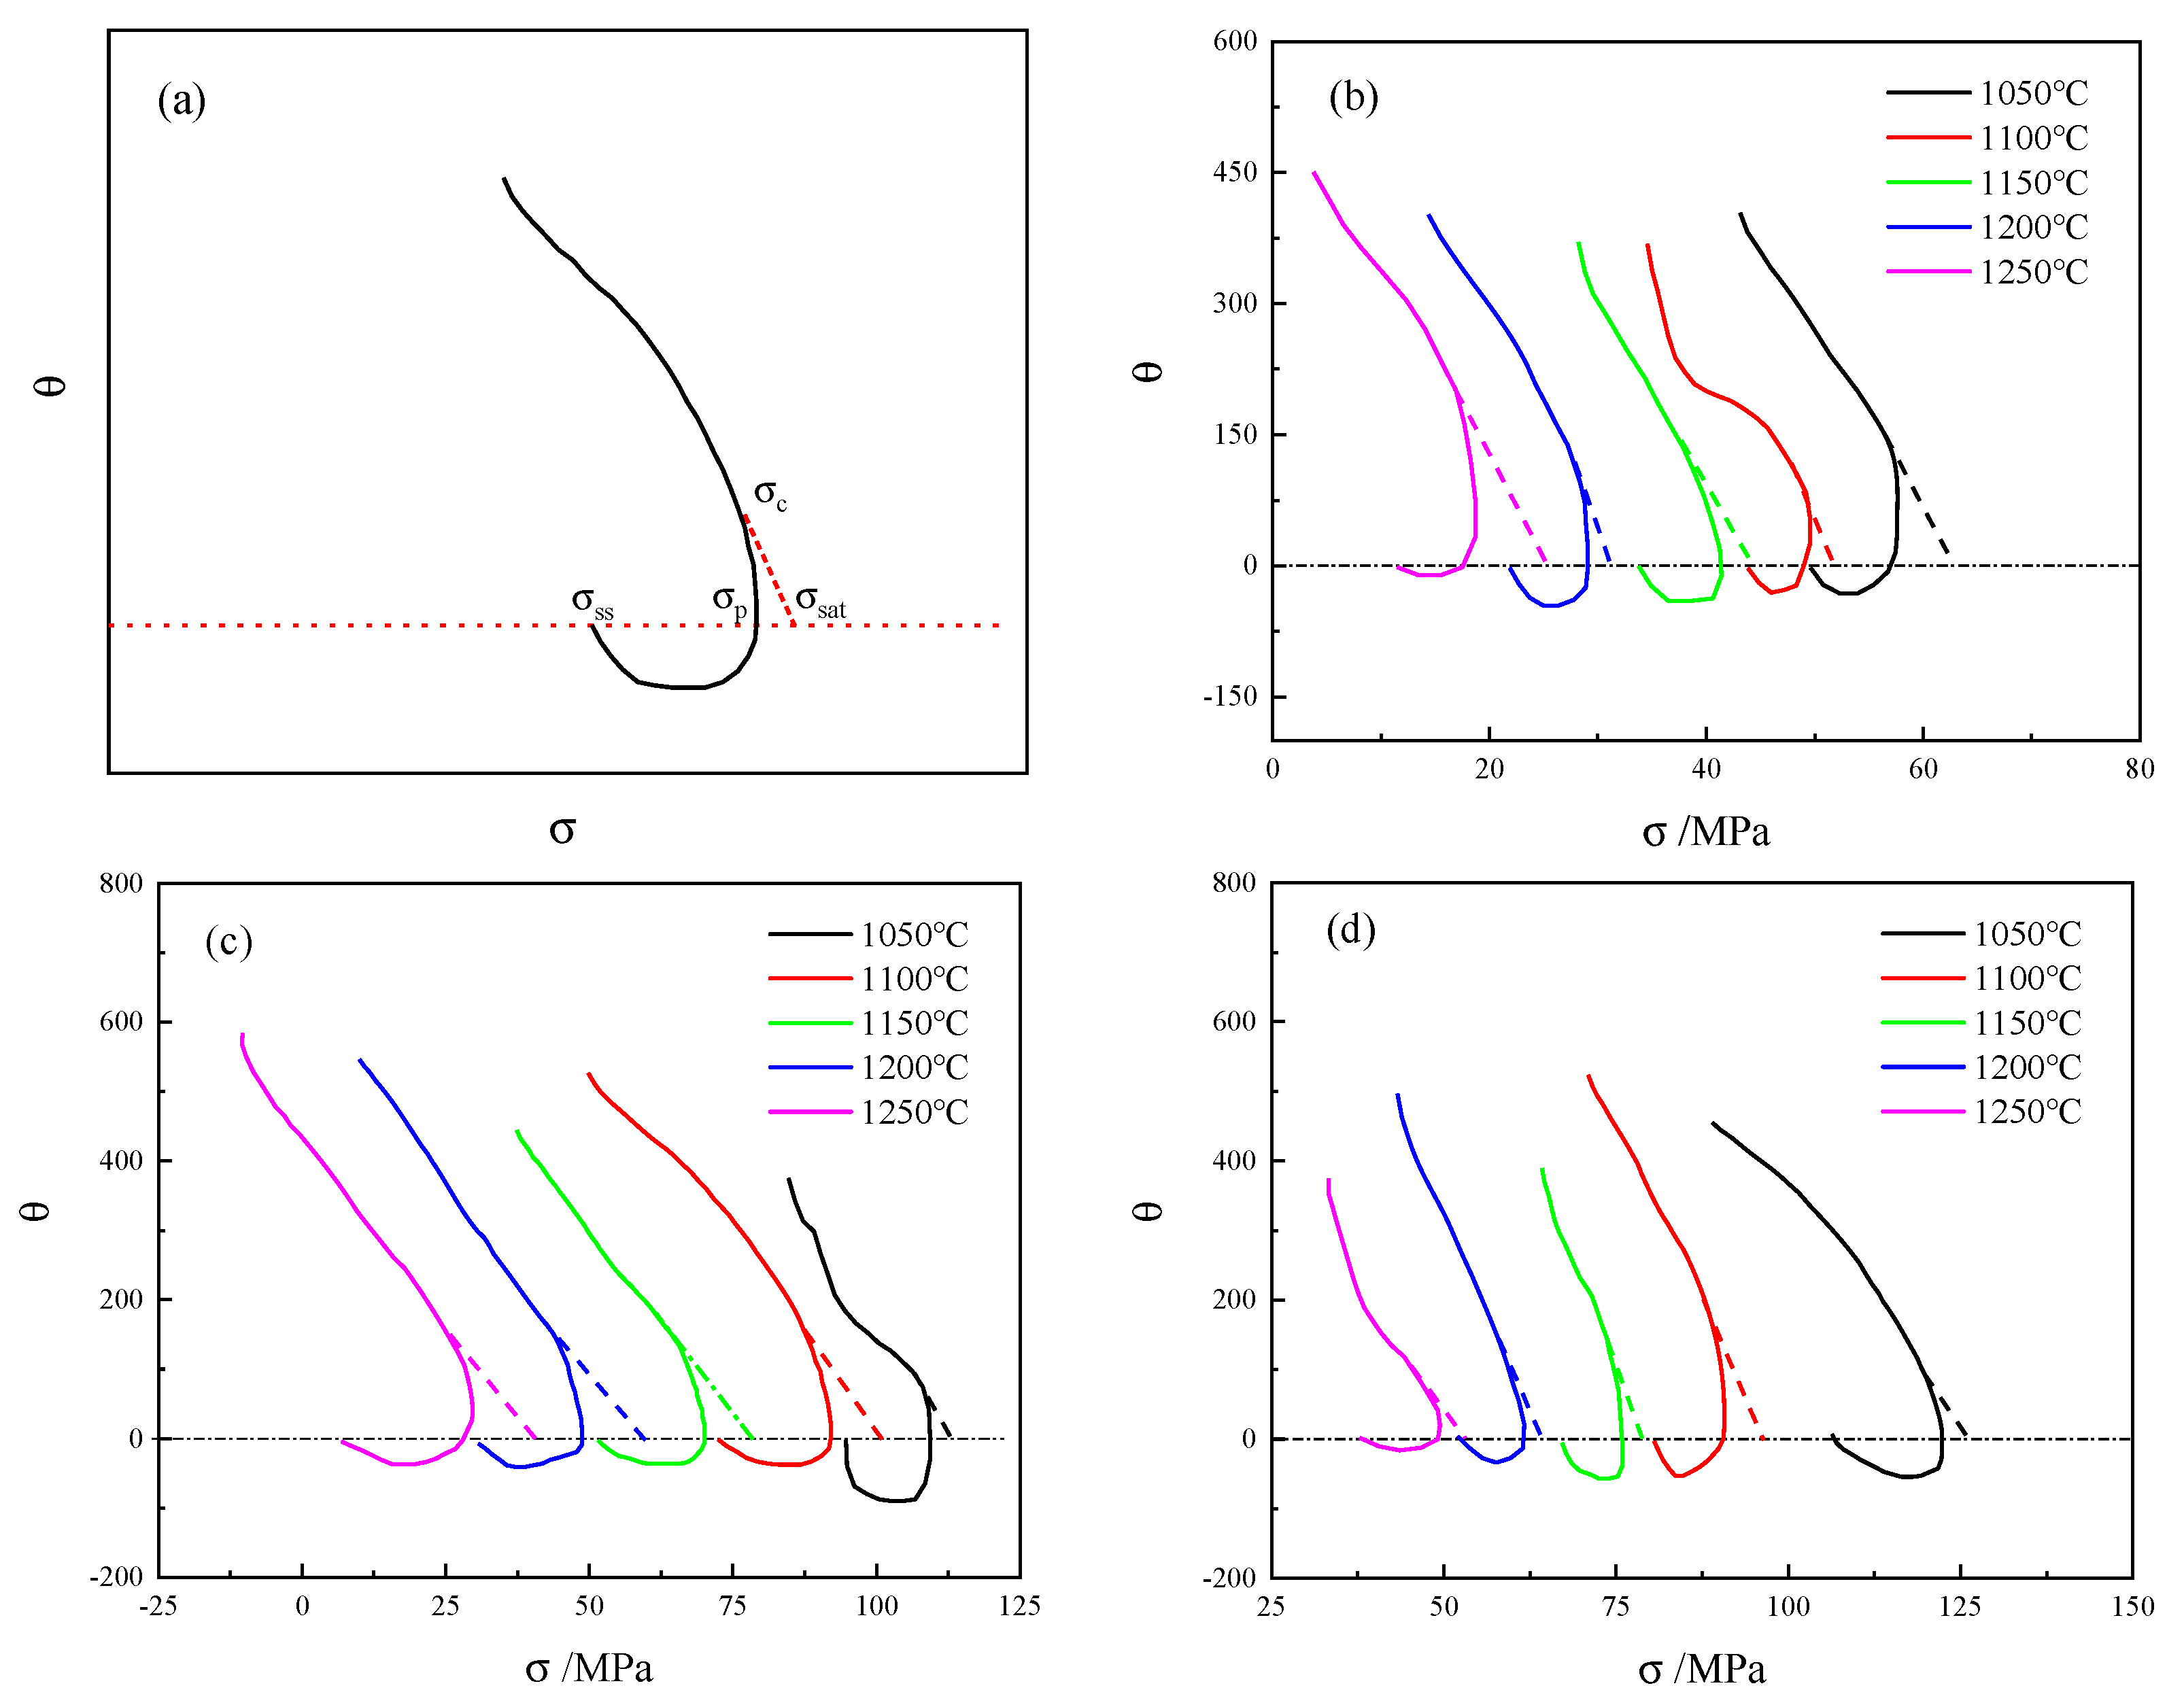
represents steady-state stress. Poliak [
29] discovered that
can be obtained through the
curve, as shown in
Figure 8a, and its inflection point was the critical stress point. Furthermore,
was obtained by solving Equation (13):
The curves of 14Cr1Mo steel under the conditions of 0.01 to 1 s
−1 are shown in
Figure 9b–d, and the obtained
data are presented in
Table 4.
According to Formula (13), the saturated stress curves of 14Cr1Mo steel under different conditions were drawn as shown in
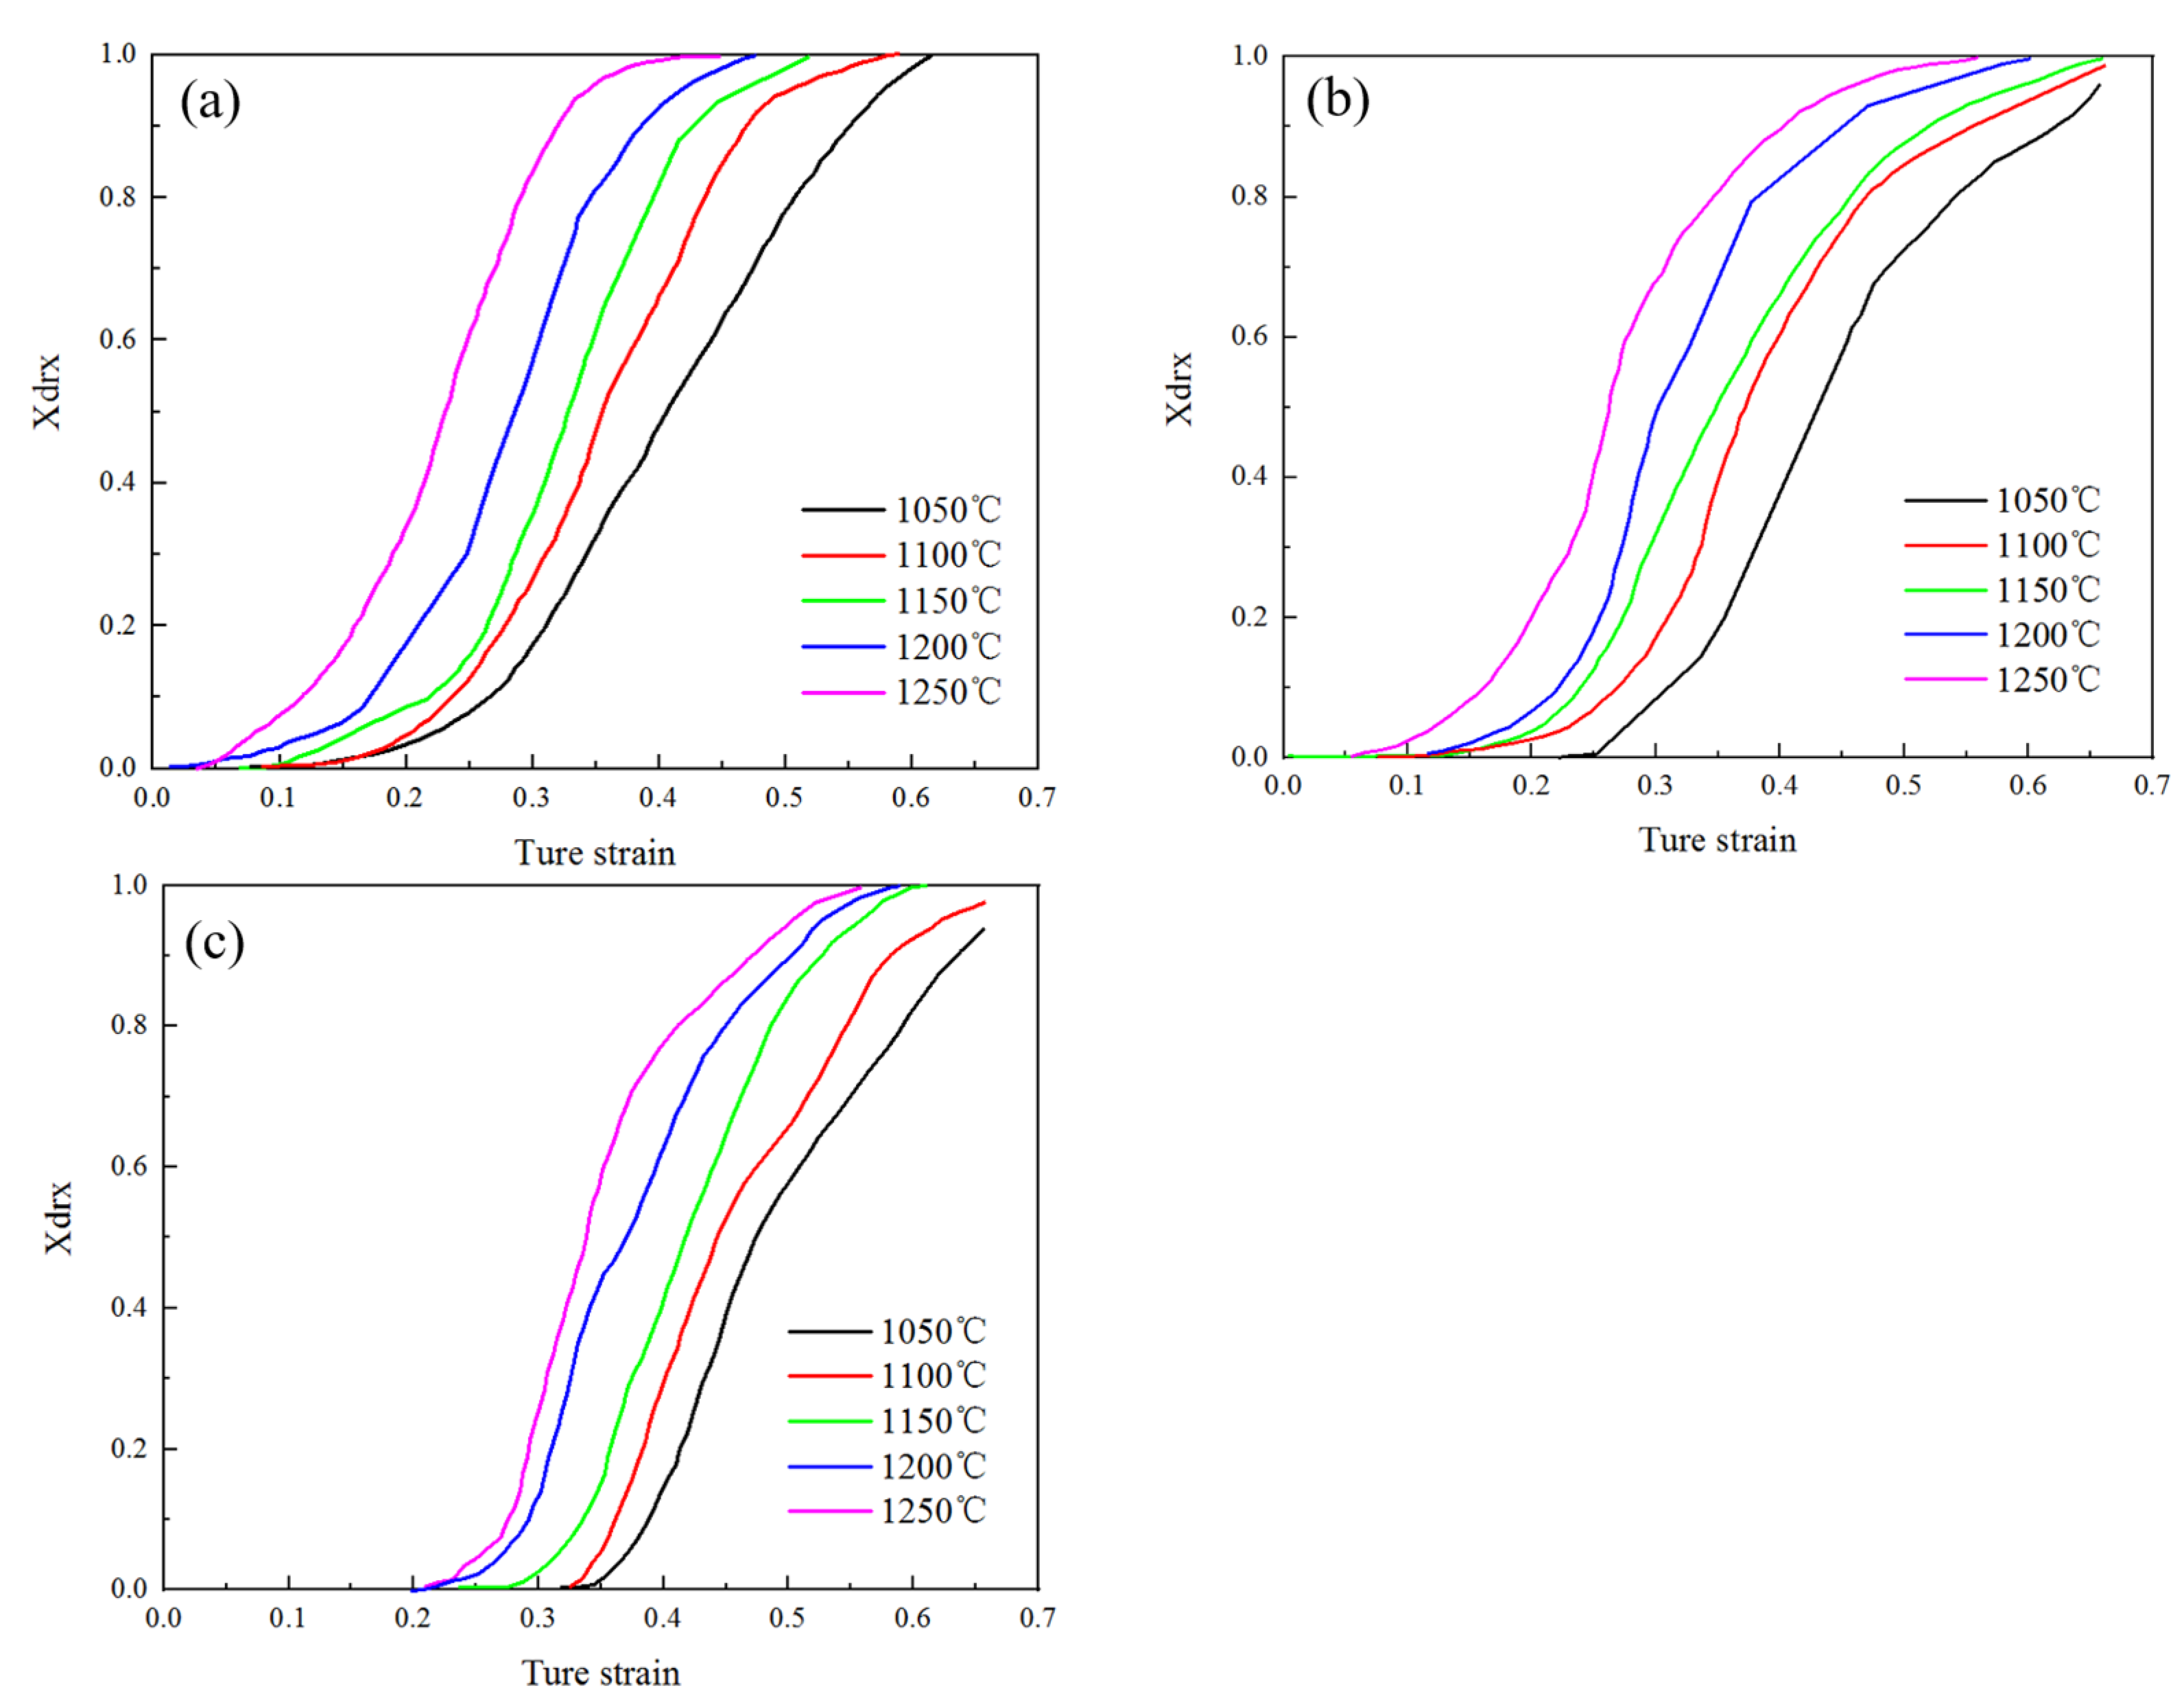
Figure 10.
According to Formula (12), the dynamic recrystallization percentage of 14Cr1Mo steel under different conditions was calculated, and the relationship between strain and dynamic recrystallization percentage and dynamic recrystallization characteristic strain
were obtained, as shown in
Figure 11 and
Table 5.
The dynamic recrystallization kinetic equation proposed by Kopp et al. was expressed by the following formula [
9]:
Among them, Xdrx represents the volume fraction of dynamic recrystallization, ε0.5 represents the characteristic strain of 14Cr1Mo steel under different conditions, εc represents the strain of critical 14Cr1Mo steel under different conditions, and kd, ndrx, , , and are constants.
The expression of characteristic strain was similar to that of peak strain Formula (8). So,
m0.5 = 0.0612;
Q0.5 = 24,466.663 J/mol; and
A0.5 = 0.0478 were calculated by the same method. Then, the characteristic strain model of 14Cr1Mo steel was obtained:
where ε = ε
0.5;
Xdrx = 0.5; and
kd = ln2 = 0.693.
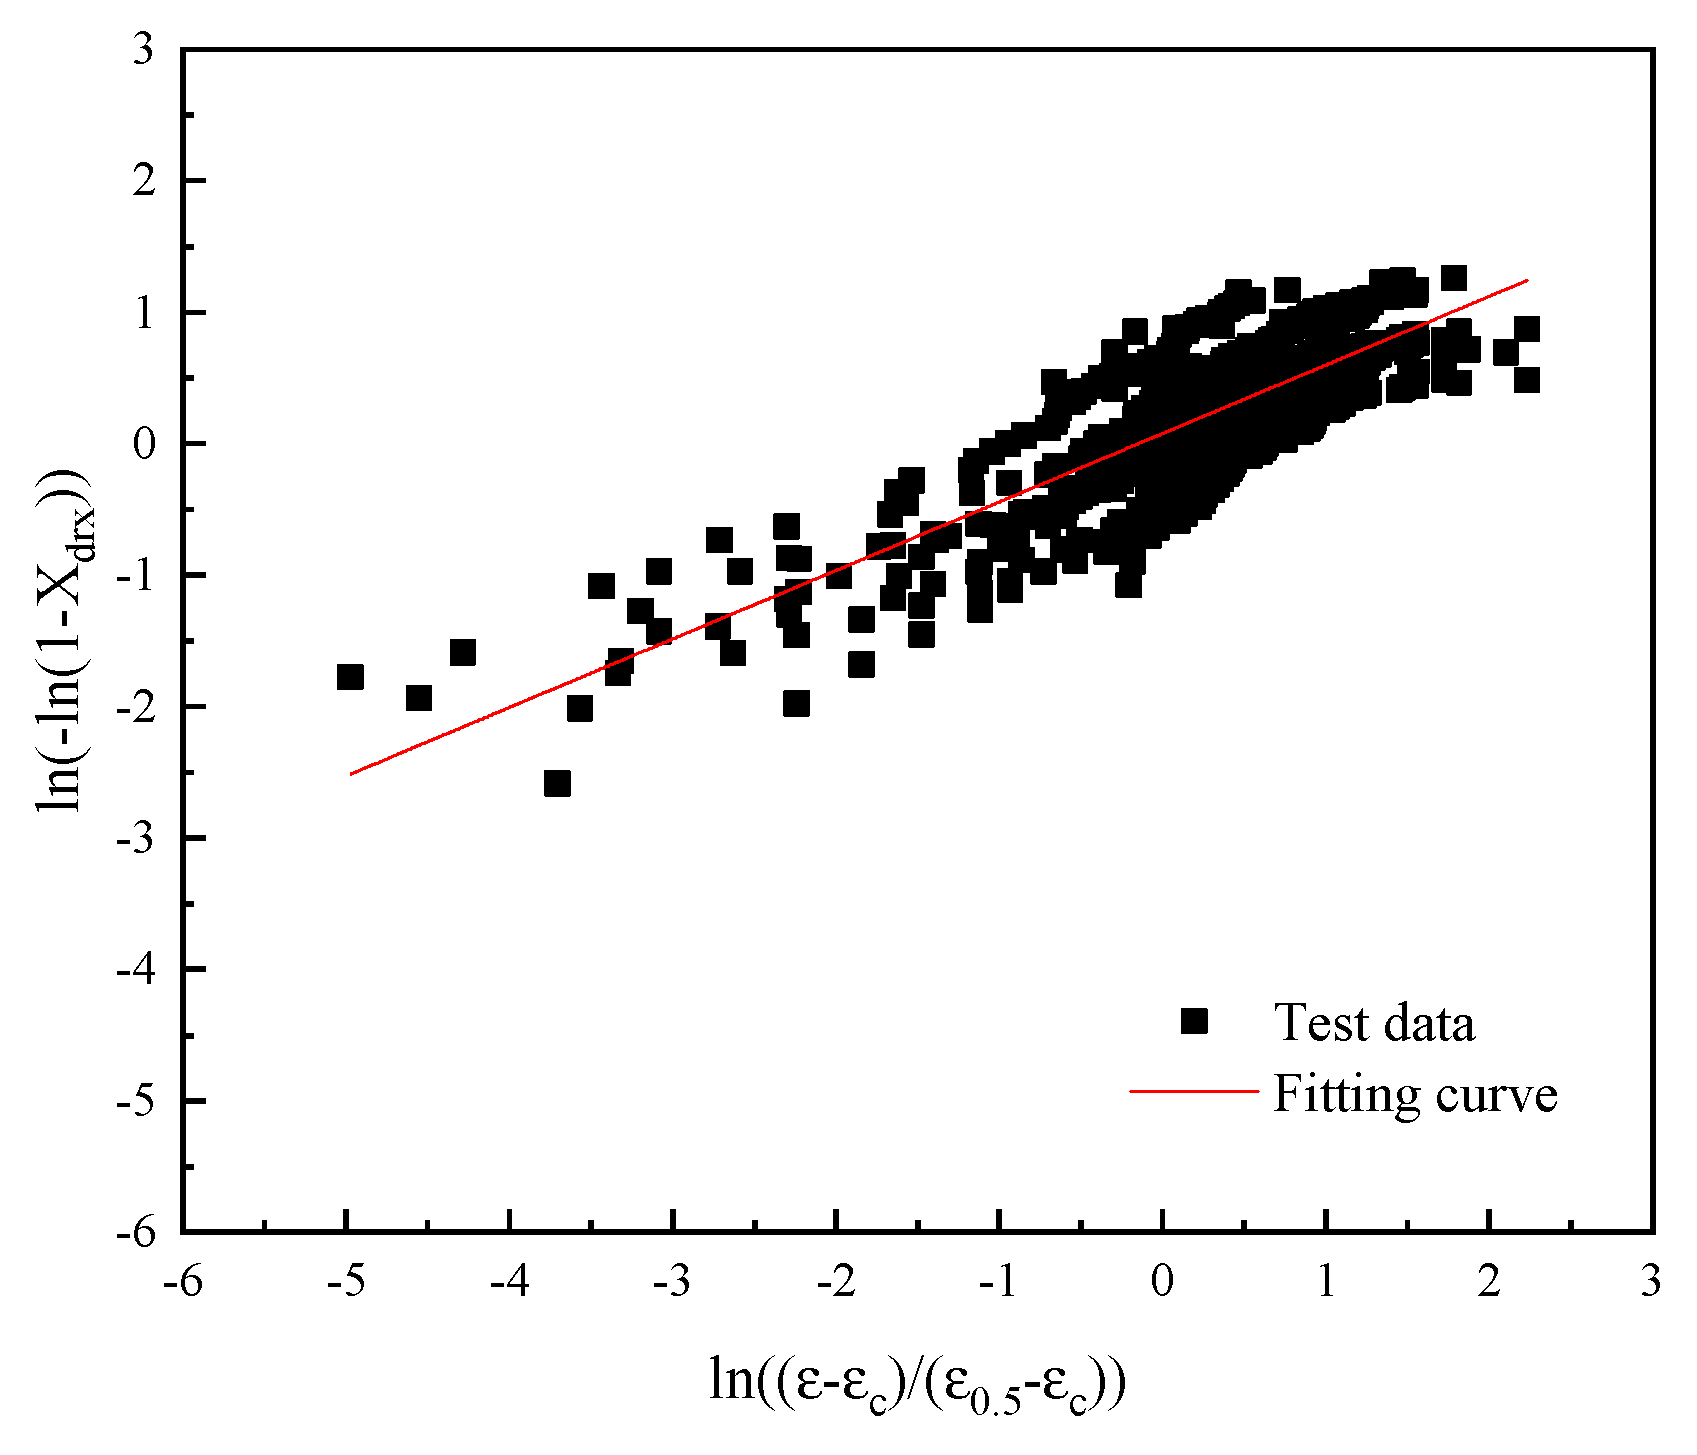
A linear fitting was performed on
and
, and its slope was the value of
, so
, as shown in
Figure 12.
Then the dynamic recrystallization percentage model of 14Cr1Mo steel was
3.2.3. Establishment of the Dynamic Recrystallization Grain Size Model
The hot compression specimens of 14Cr1Mo steel were sectioned axially, mounted, etched with an aqueous solution of ferric chloride and hydrochloric acid, and subsequently examined for metallographic characterization. The resulting grain sizes measured under various deformation conditions are presented in
Table 6.
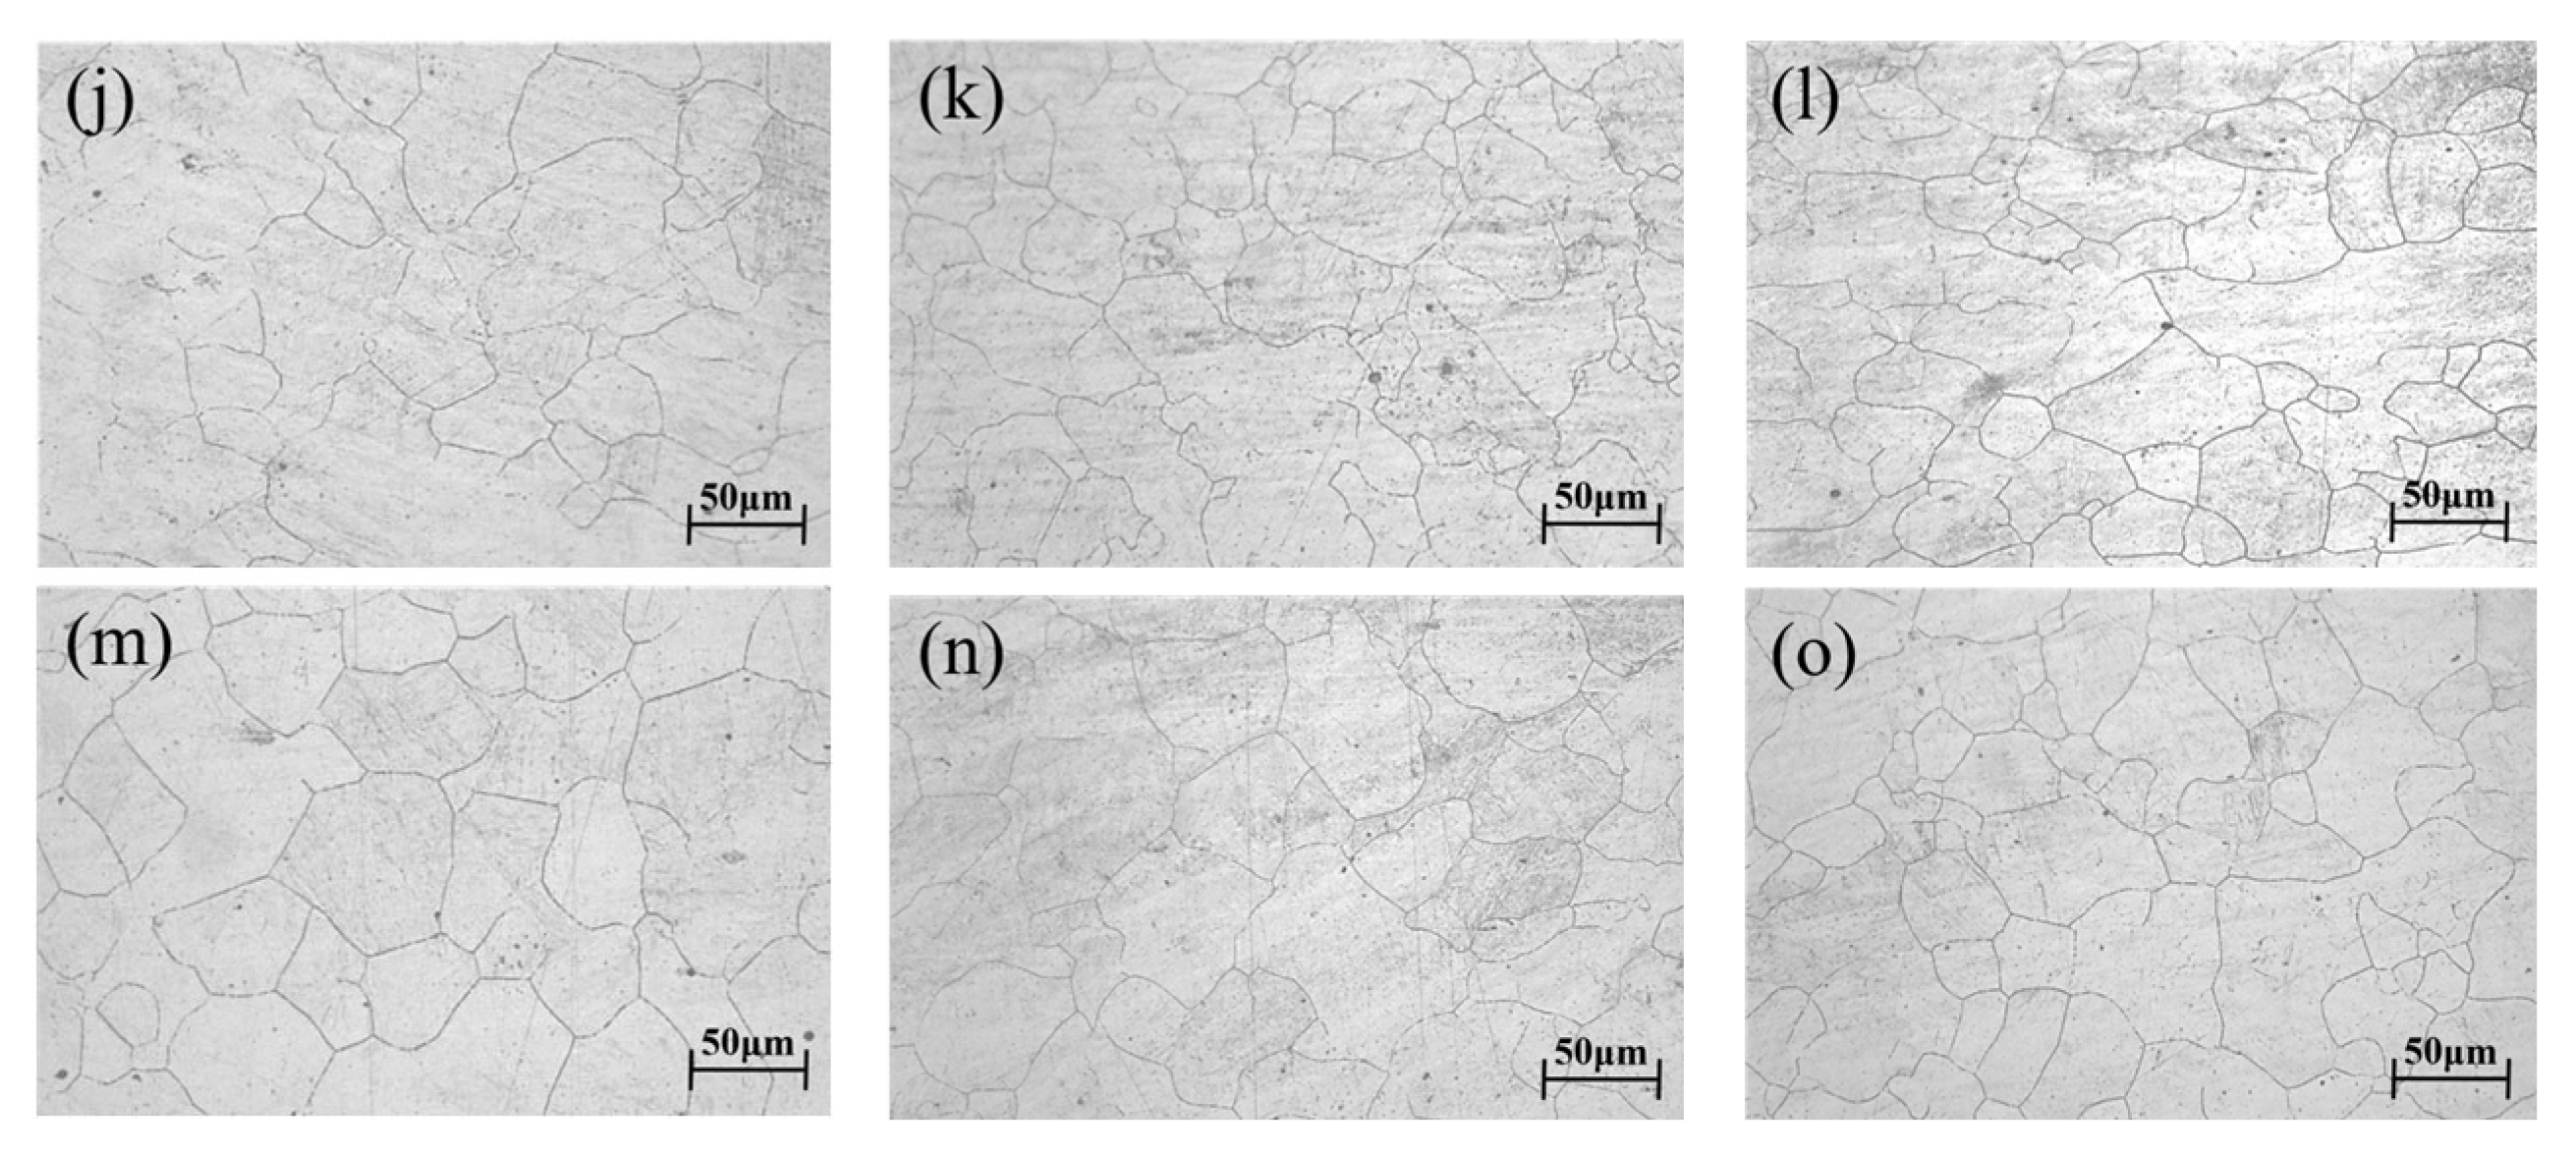
Analysis of
Figure 13 revealed that at lower temperatures (1050 °C) with strain rates exceeding 0.1 s
−1, dynamic recrystallization (DRX) did not reach completion (<100%). Incomplete DRX manifested as fine recrystallized grains along grain boundaries coexisting with relatively coarse original grains. As temperature increased, even at high strain rates, DRX progression became more substantial, resulting in significantly improved grain uniformity [
30].
The classic formula of the dynamic recrystallization grain size model was as follows:
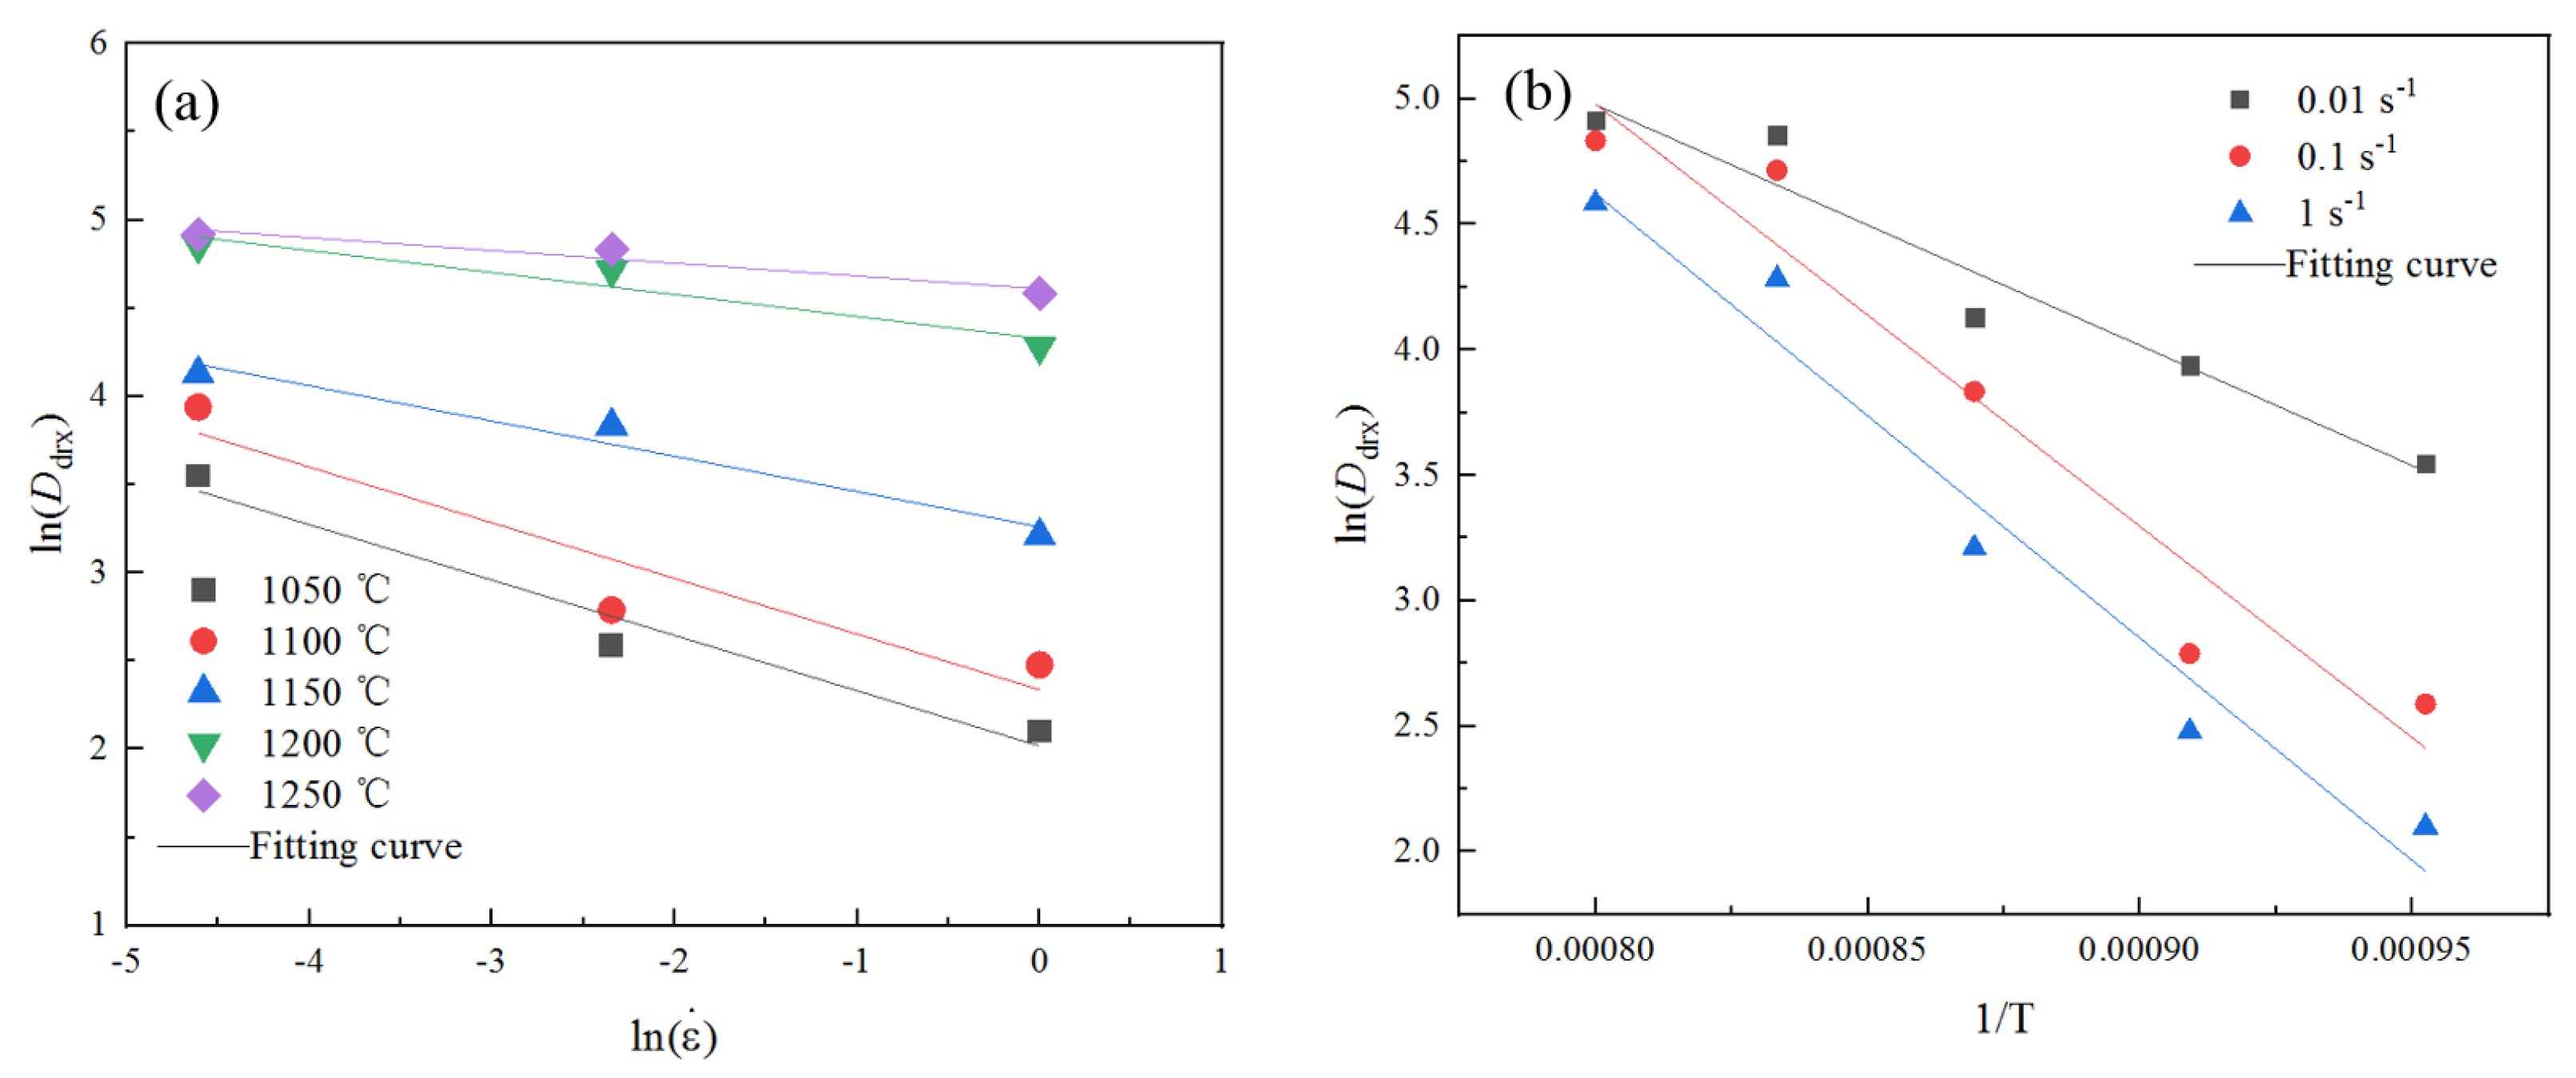
A linear analysis of
was performed, as illustrated in
Figure 14a, where the slope corresponded to parameter
. The average value of
at different temperatures was determined to be −0.205.
The slope of
was
through linear analysis, as shown in
Figure 14b. The average value of
at different temperatures was calculated, which was −14,719.637 J/mol. Then,
J/mol.
Parameters and were substituted into Equation (15), and the values were calculated for each deformation condition. The arithmetic mean of was determined to be 81,957.928.
Therefore, the expression for the grain size of dynamic recrystallization of 14Cr1Mo steel was
3.2.4. Verification of the Dynamic Recrystallization Kinetic Model of 14Cr1Mo Based on Finite Element Simulation
Reliable finite element simulation results depended on an accurate recrystallization kinetics model [
31,
32,
33]. To validate the recrystallization kinetics model for 14Cr1Mo steel, the established dynamic recrystallization models (Equations (10), (11), (18), and (20)) were implemented in the finite element software Forge
® NxT 3.2.
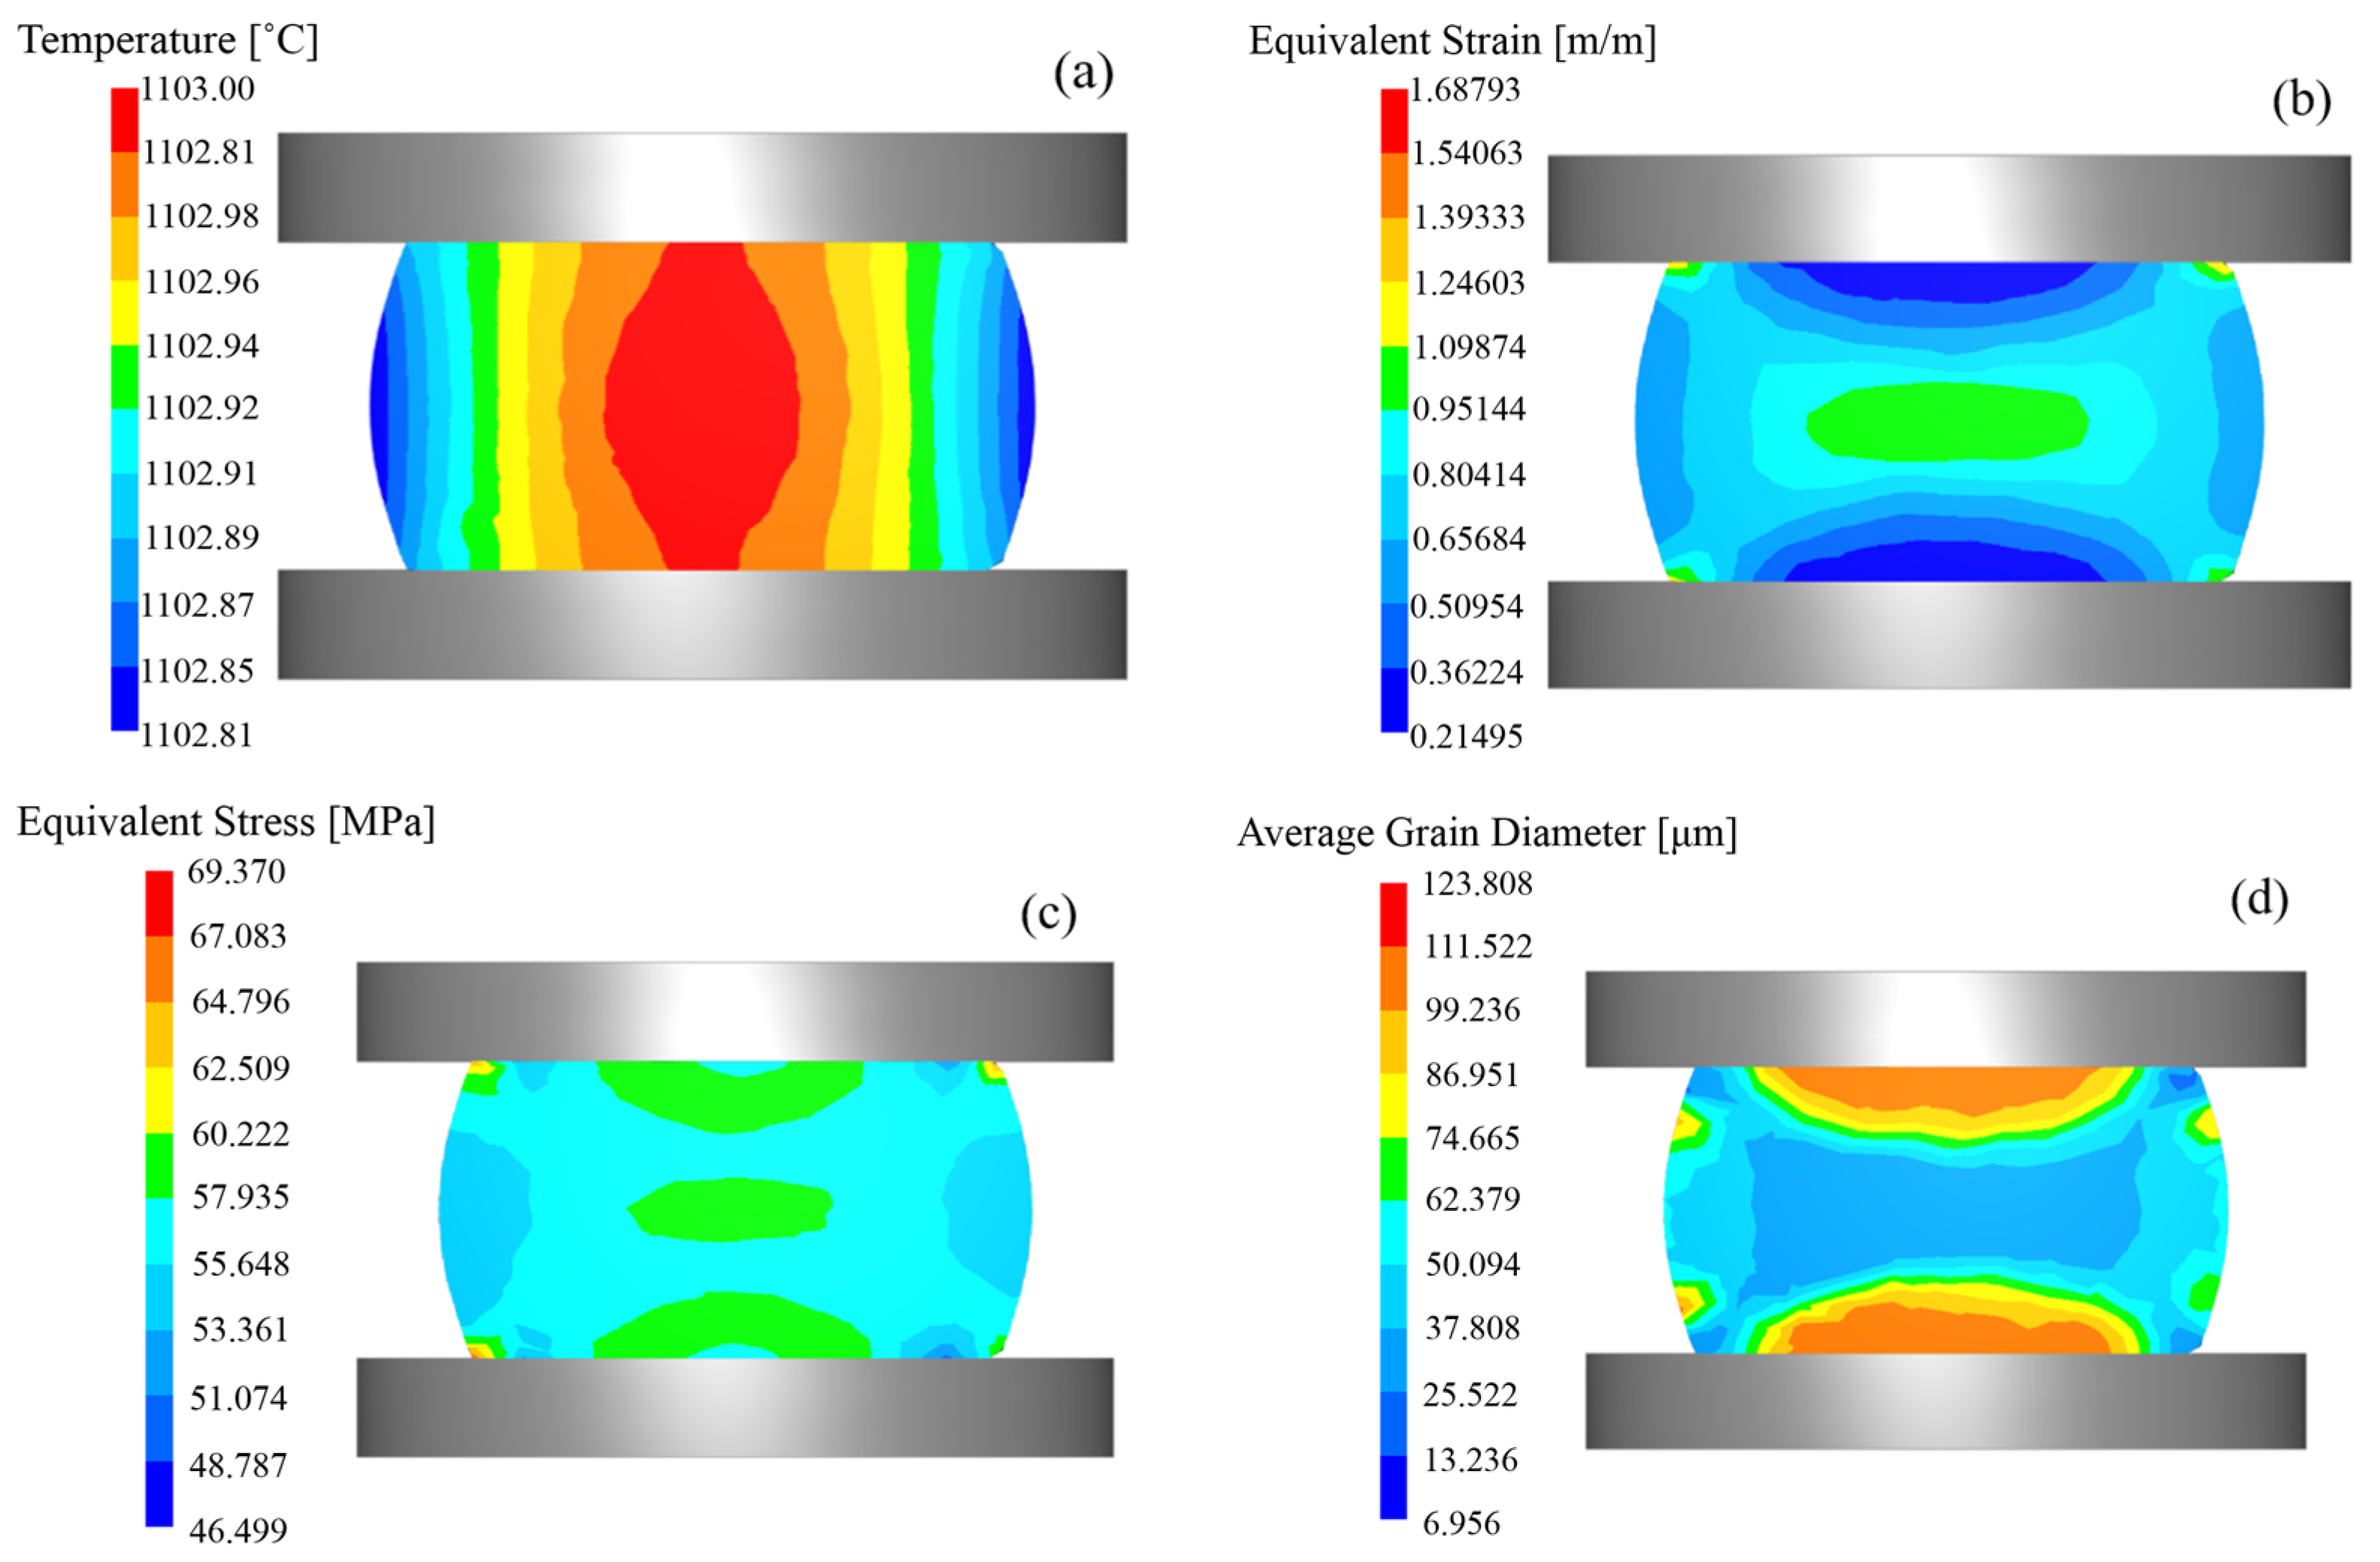
Figure 15 presents the finite element simulation results of thermomechanical compression under the deformation condition of 1100 °C/0.01 s
−1. The results revealed that specimen deformation generated significant deformation heat, causing the specimen temperature to exceed the set temperature by 2–3 °C upon completion of compression. The central region exhibited strain values exceeding 0.95 and stress levels above 57.93 MPa, with a corresponding grain size of 50.09 μm.
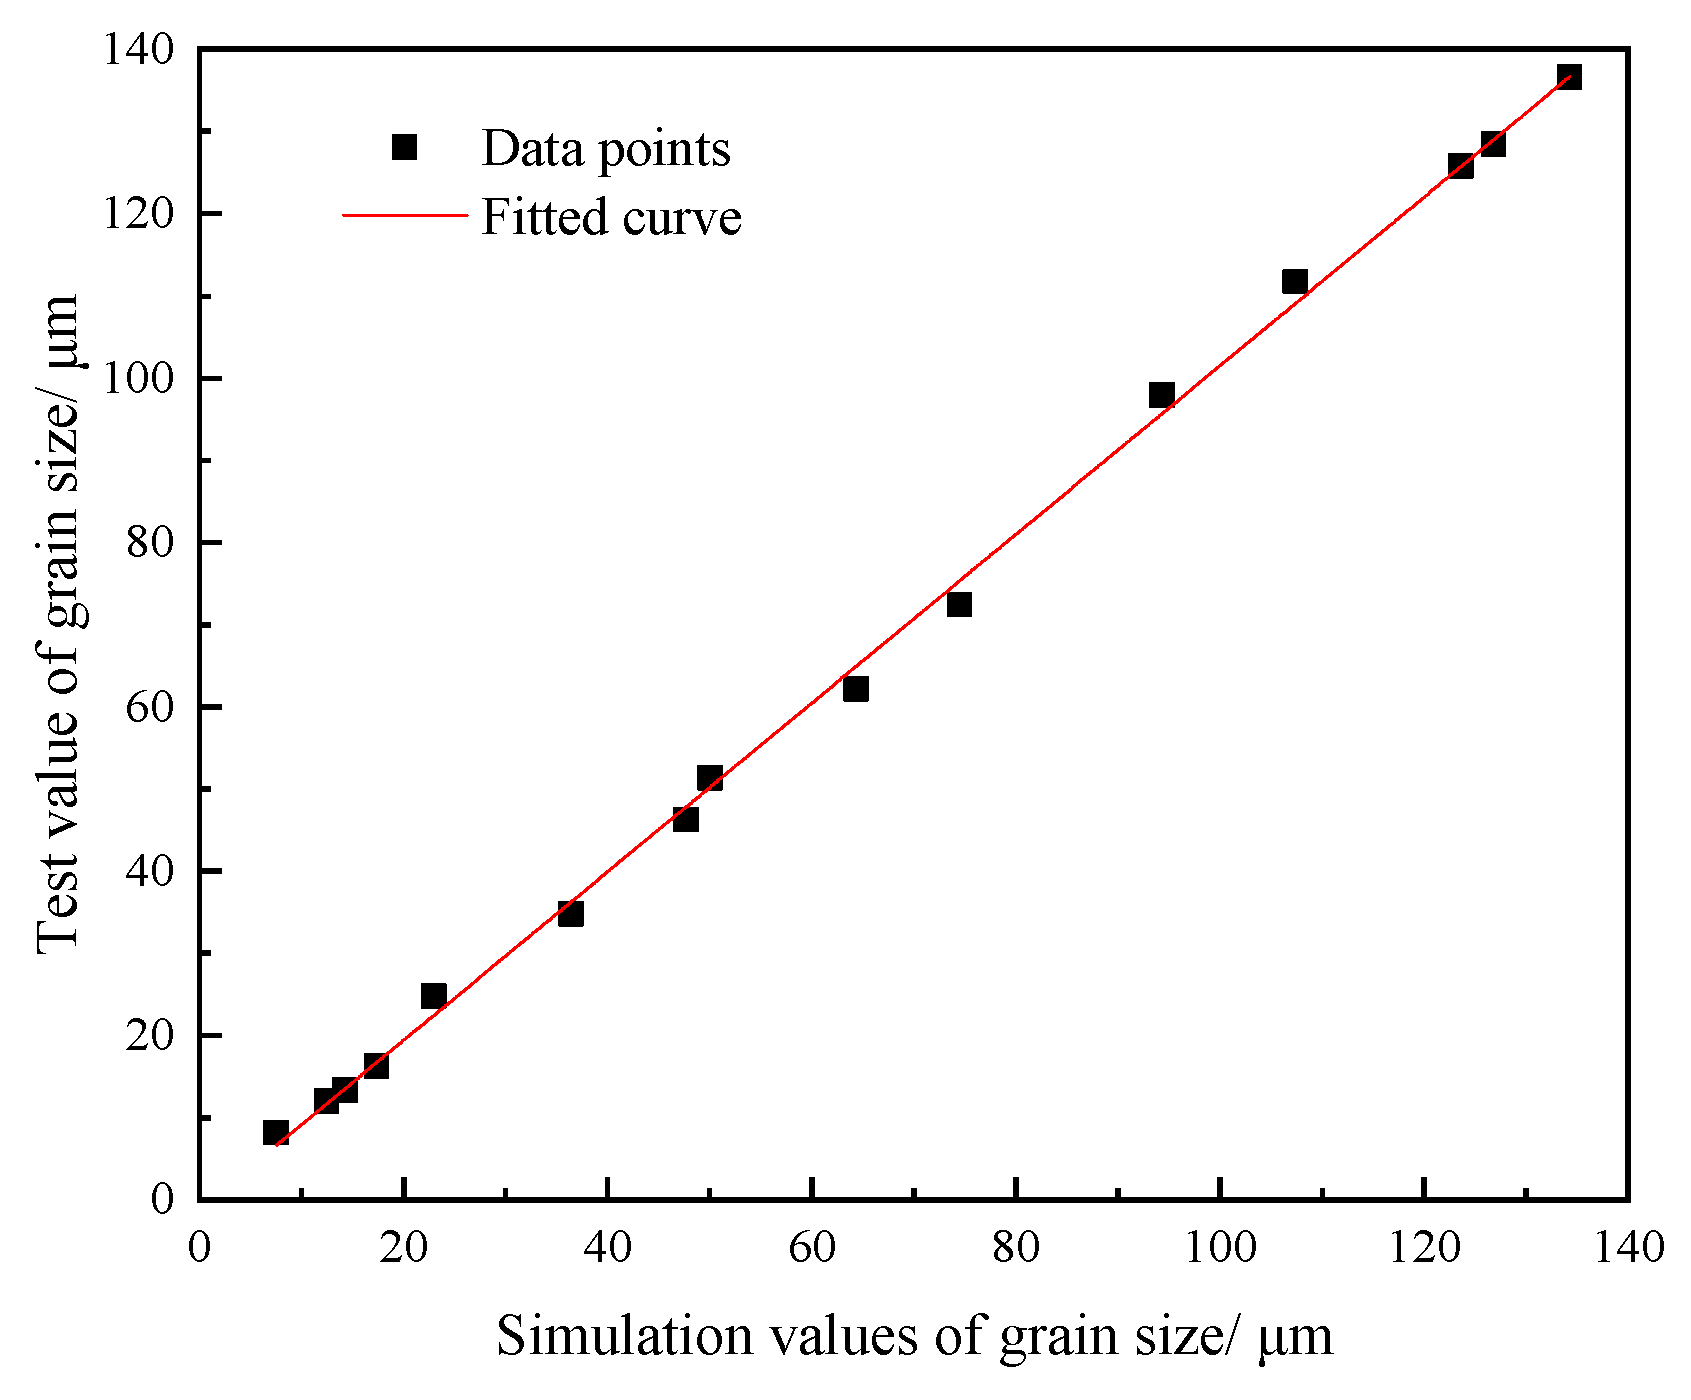
Finite element simulations were performed on fifteen sets of thermomechanically compressed specimens. The simulated dynamically recrystallized grain sizes are presented in
Table 7. Deviation analysis was conducted by comparing simulated results with experimentally measured grain sizes. The maximum deviation (7.59%) occurred under the 1050 °C/1 s
−1 deformation condition, while the minimum deviation (1.26%) was observed at 1200 °C/0.01 s
−1.
Figure 16 showed the comparison of the grain size of 14Cr1Mo in the finite element simulation with that test data. The correlation coefficient R was 0.998, indicating a high degree of agreement between the two. These results demonstrated the accuracy of the 14Cr1Mo recrystallization kinetics model.


