


Influence of Zn Content on the Corrosion and Mechanical Properties of Cast and Friction Stir-Welded Al-Si-Mg-Fe-Zn Alloys
 , , , ,
  , and
, and
Abstract

1. Introduction
2. Materials and Methods
2.1. Materials
2.2. Different Scanning Calorimetry (DSC)
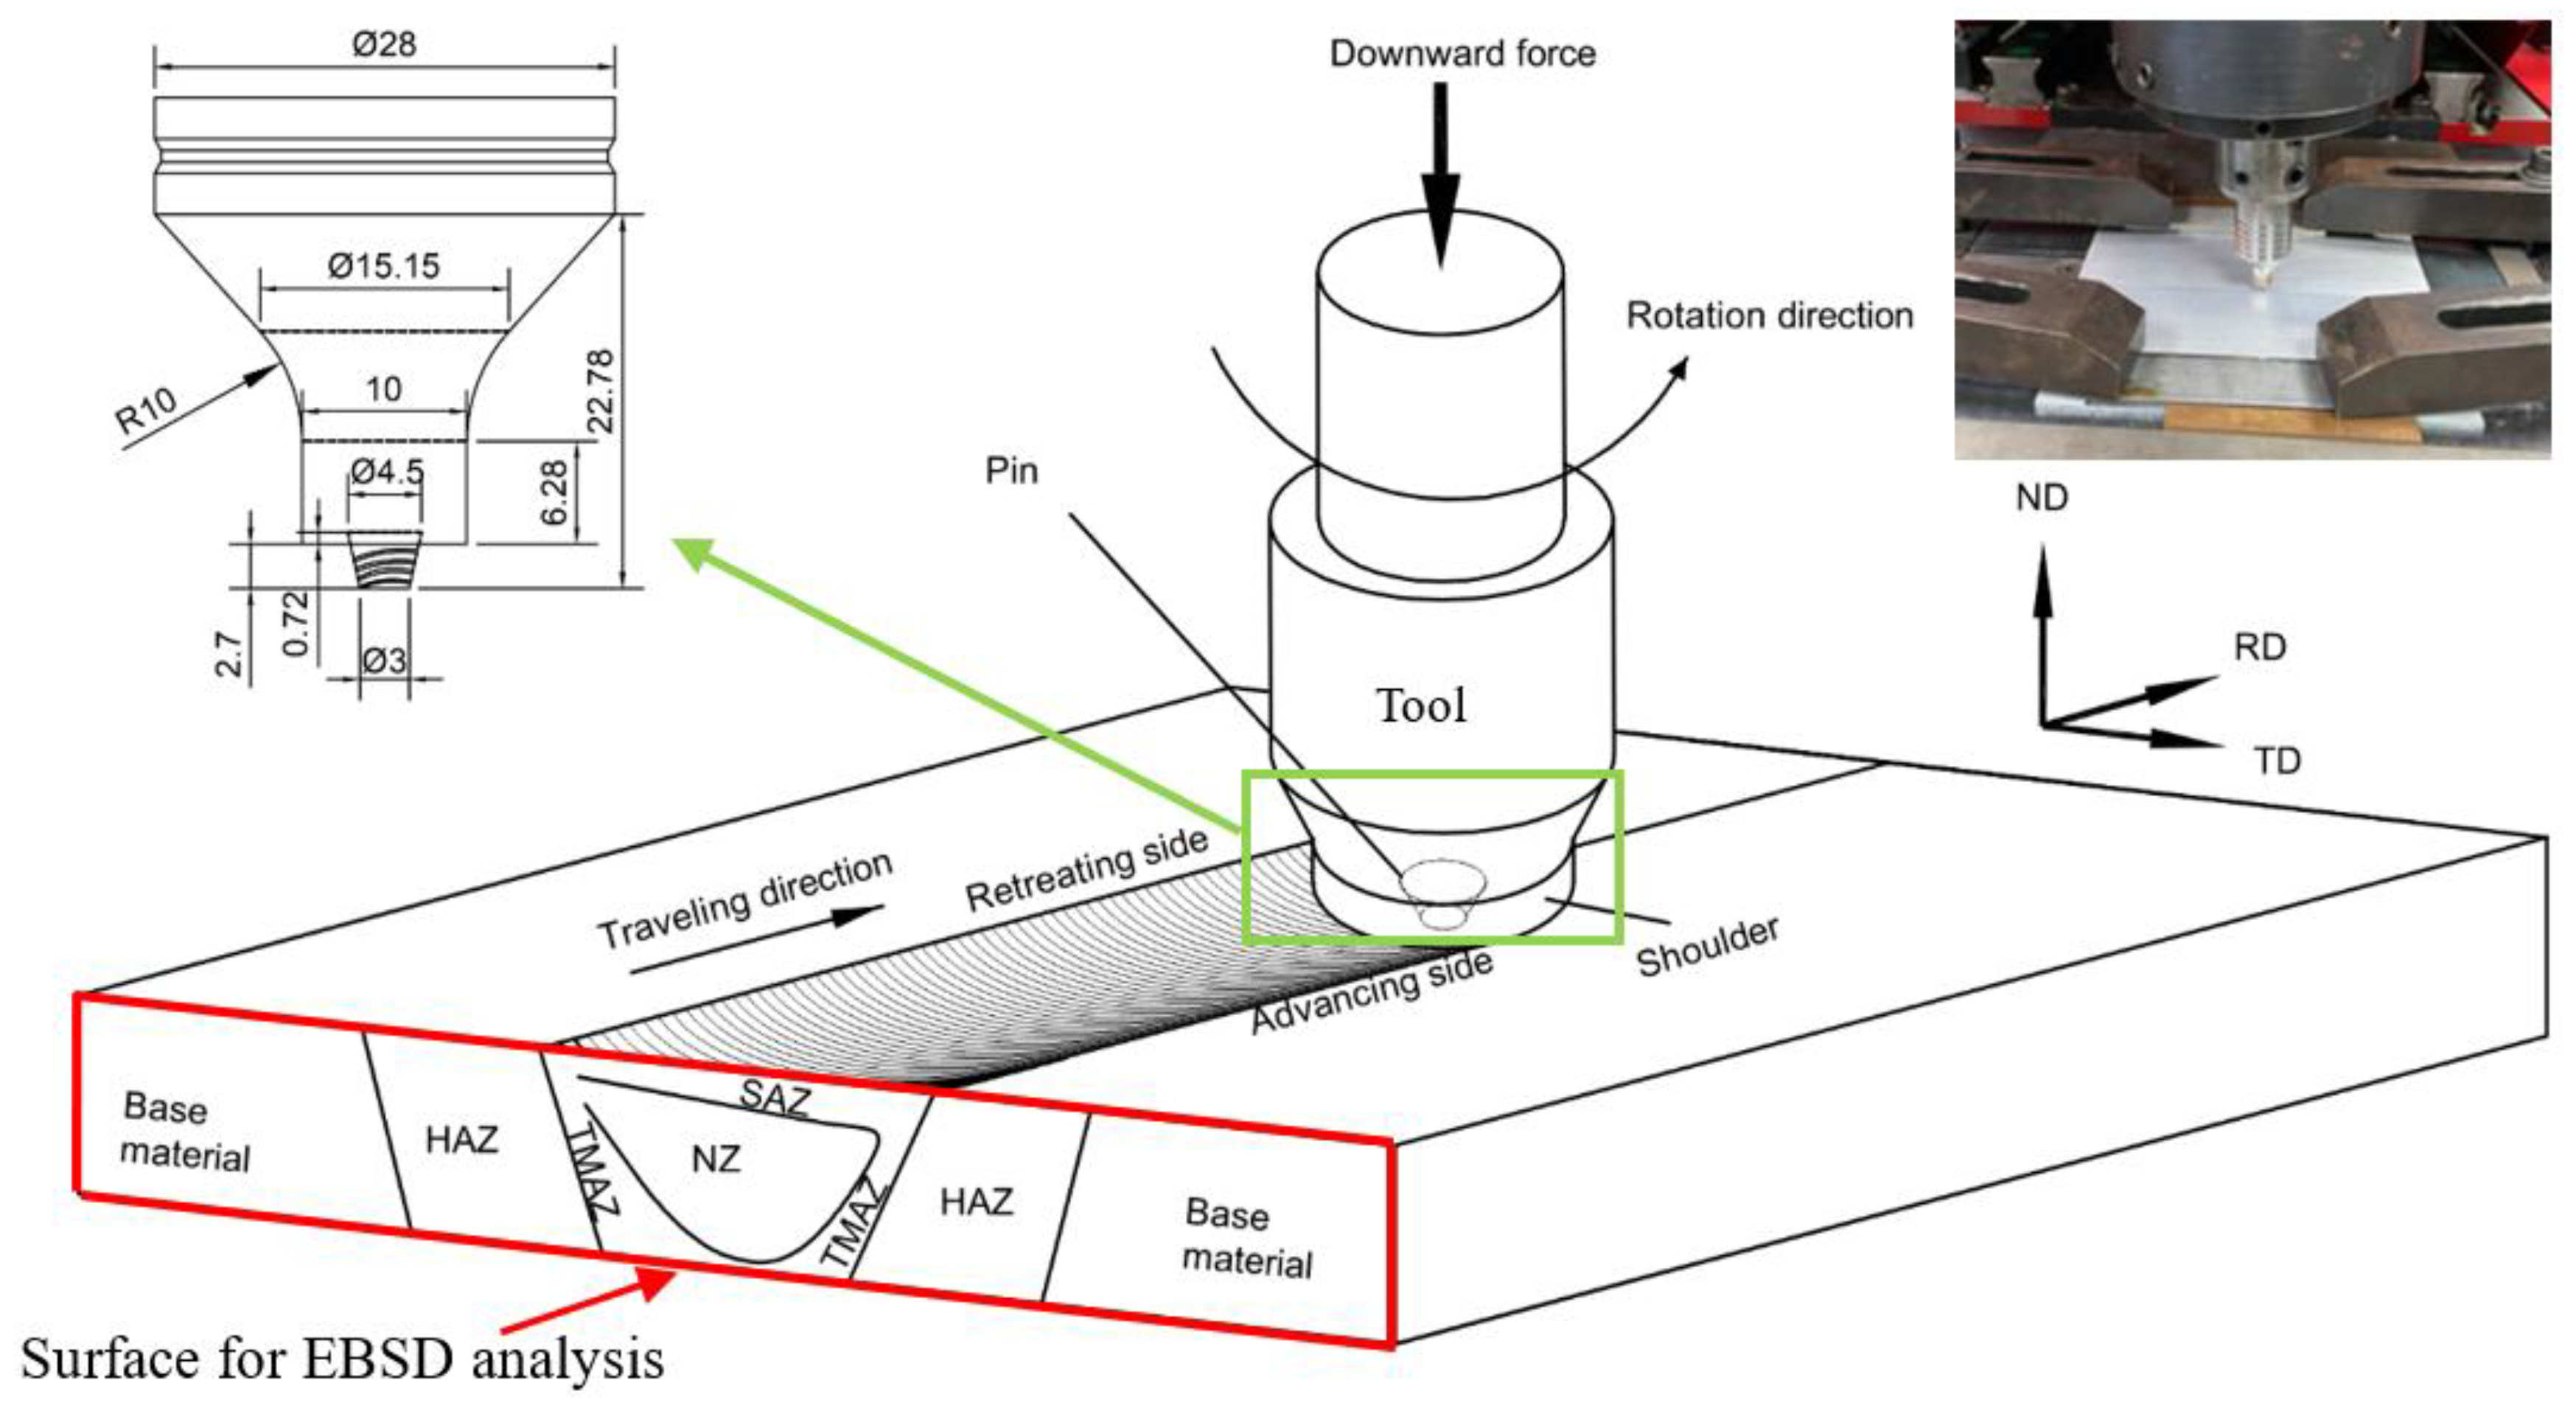
2.3. Friction Stir Welding
2.4. Analysis of Microstructure
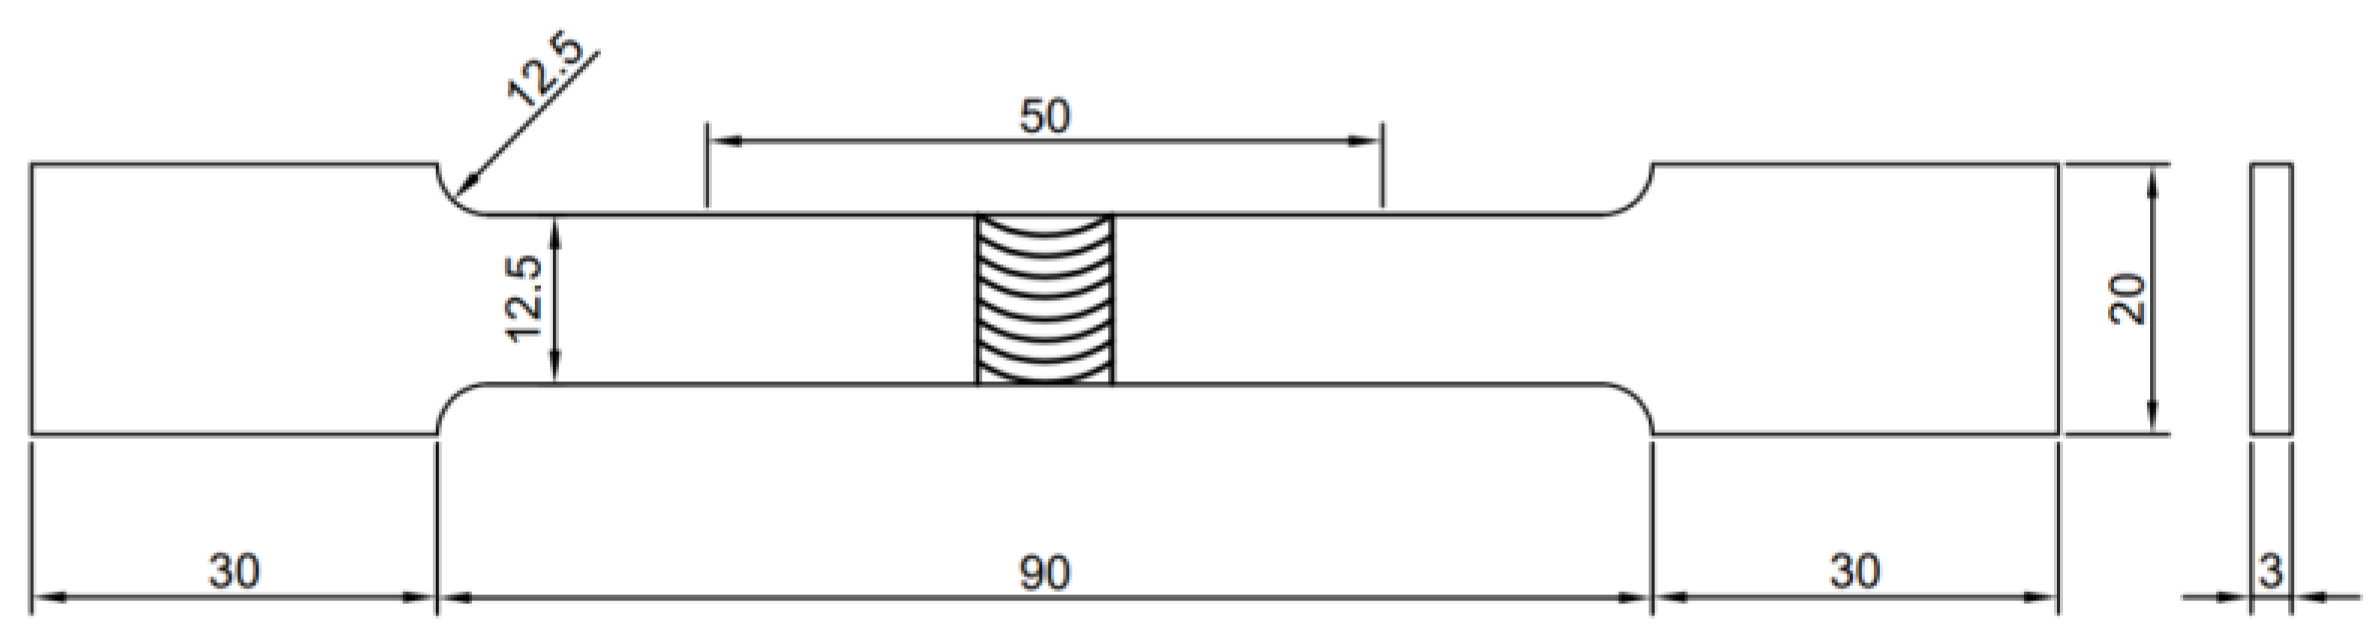
2.5. Hardness and Tensile Tests
2.6. Electrochemical Measurements
3. Results and Discussion
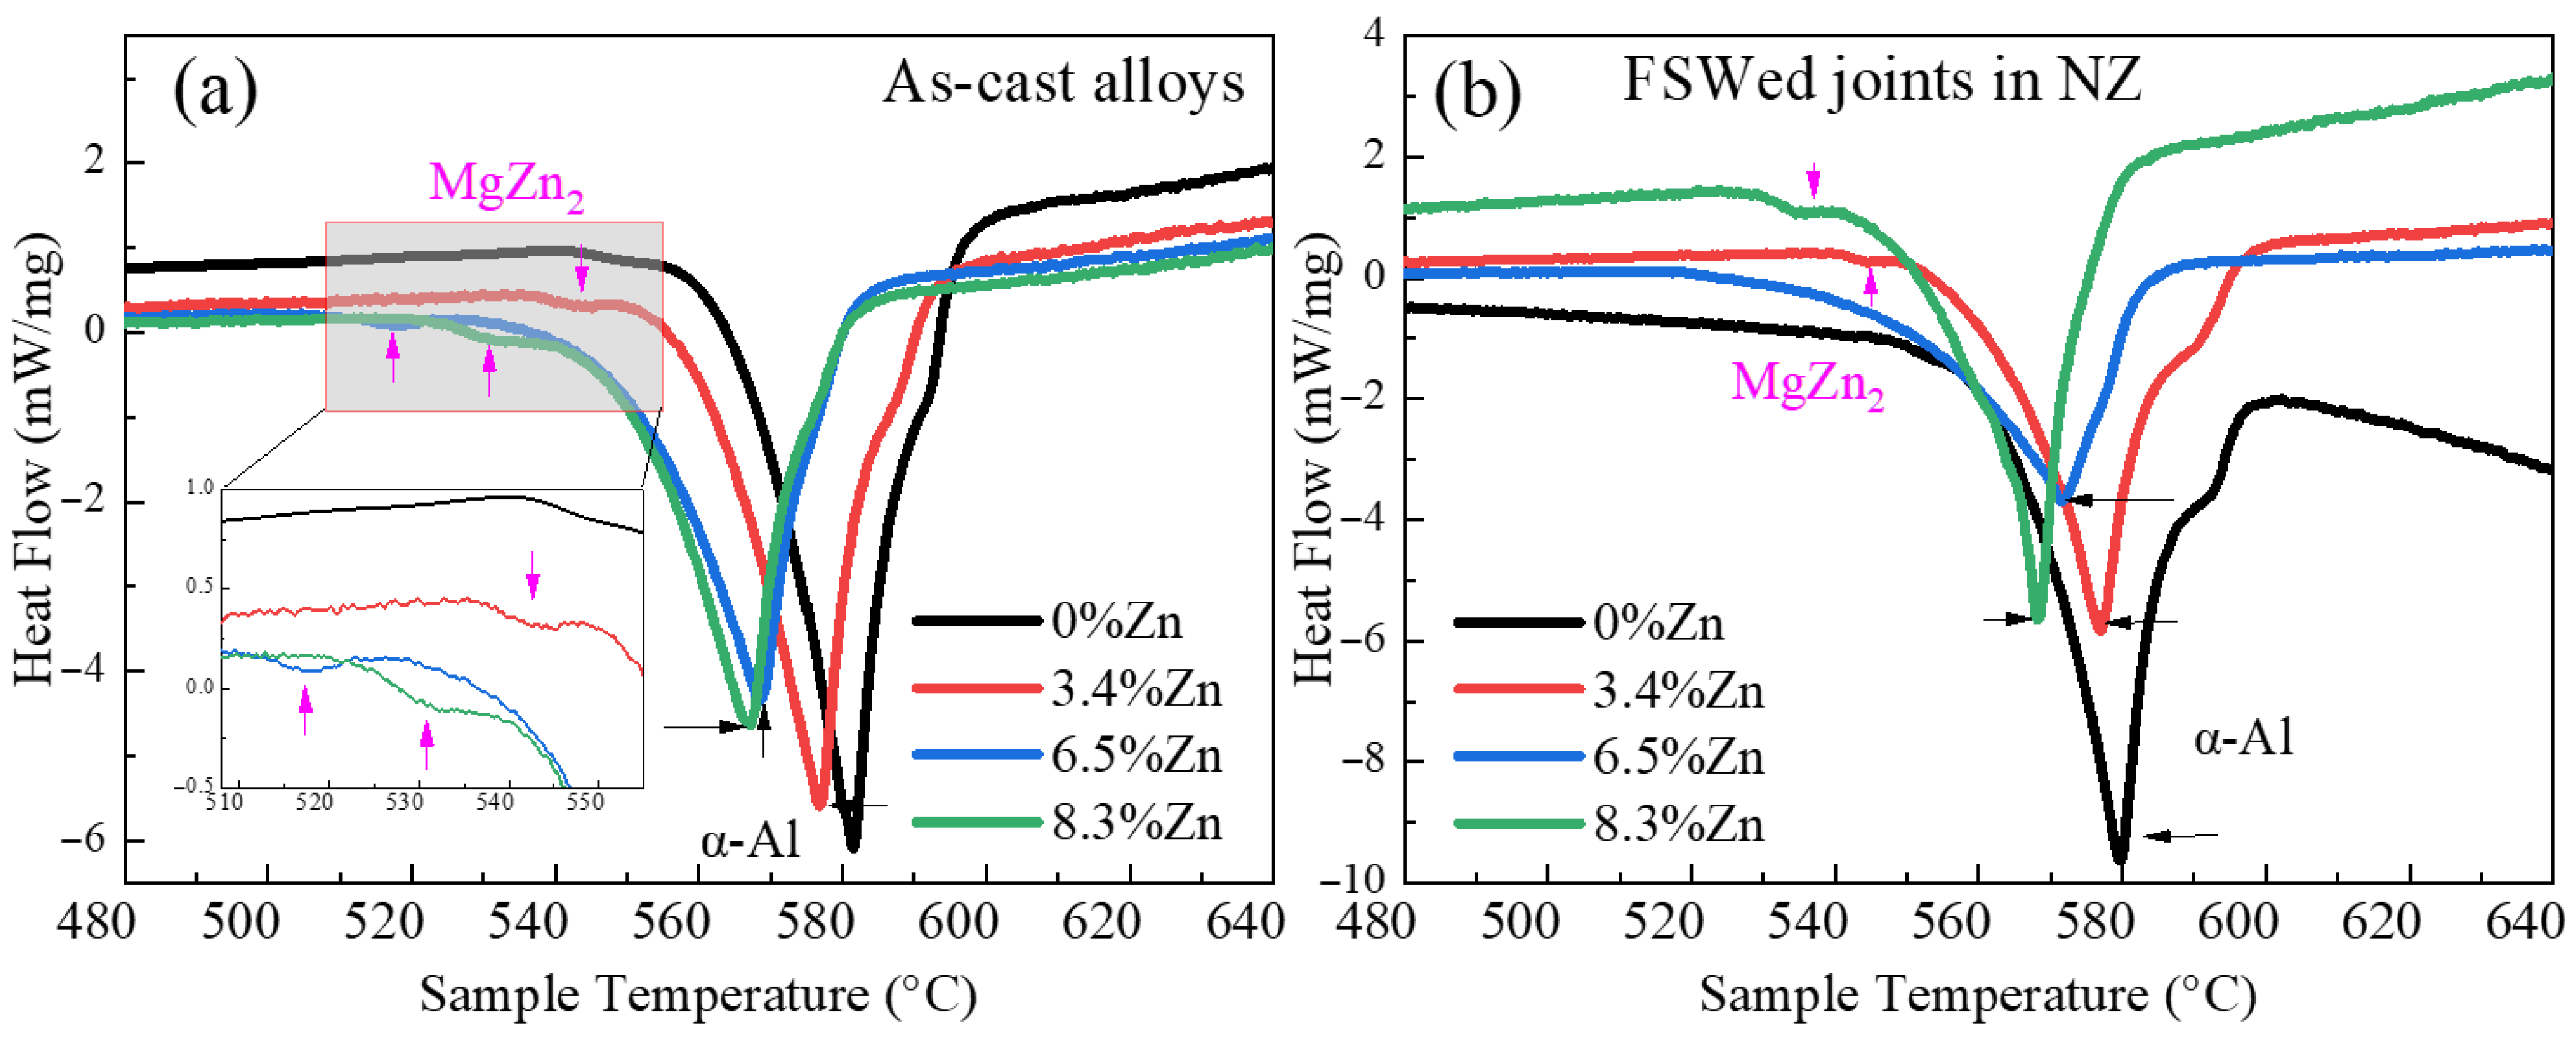
3.1. DSC
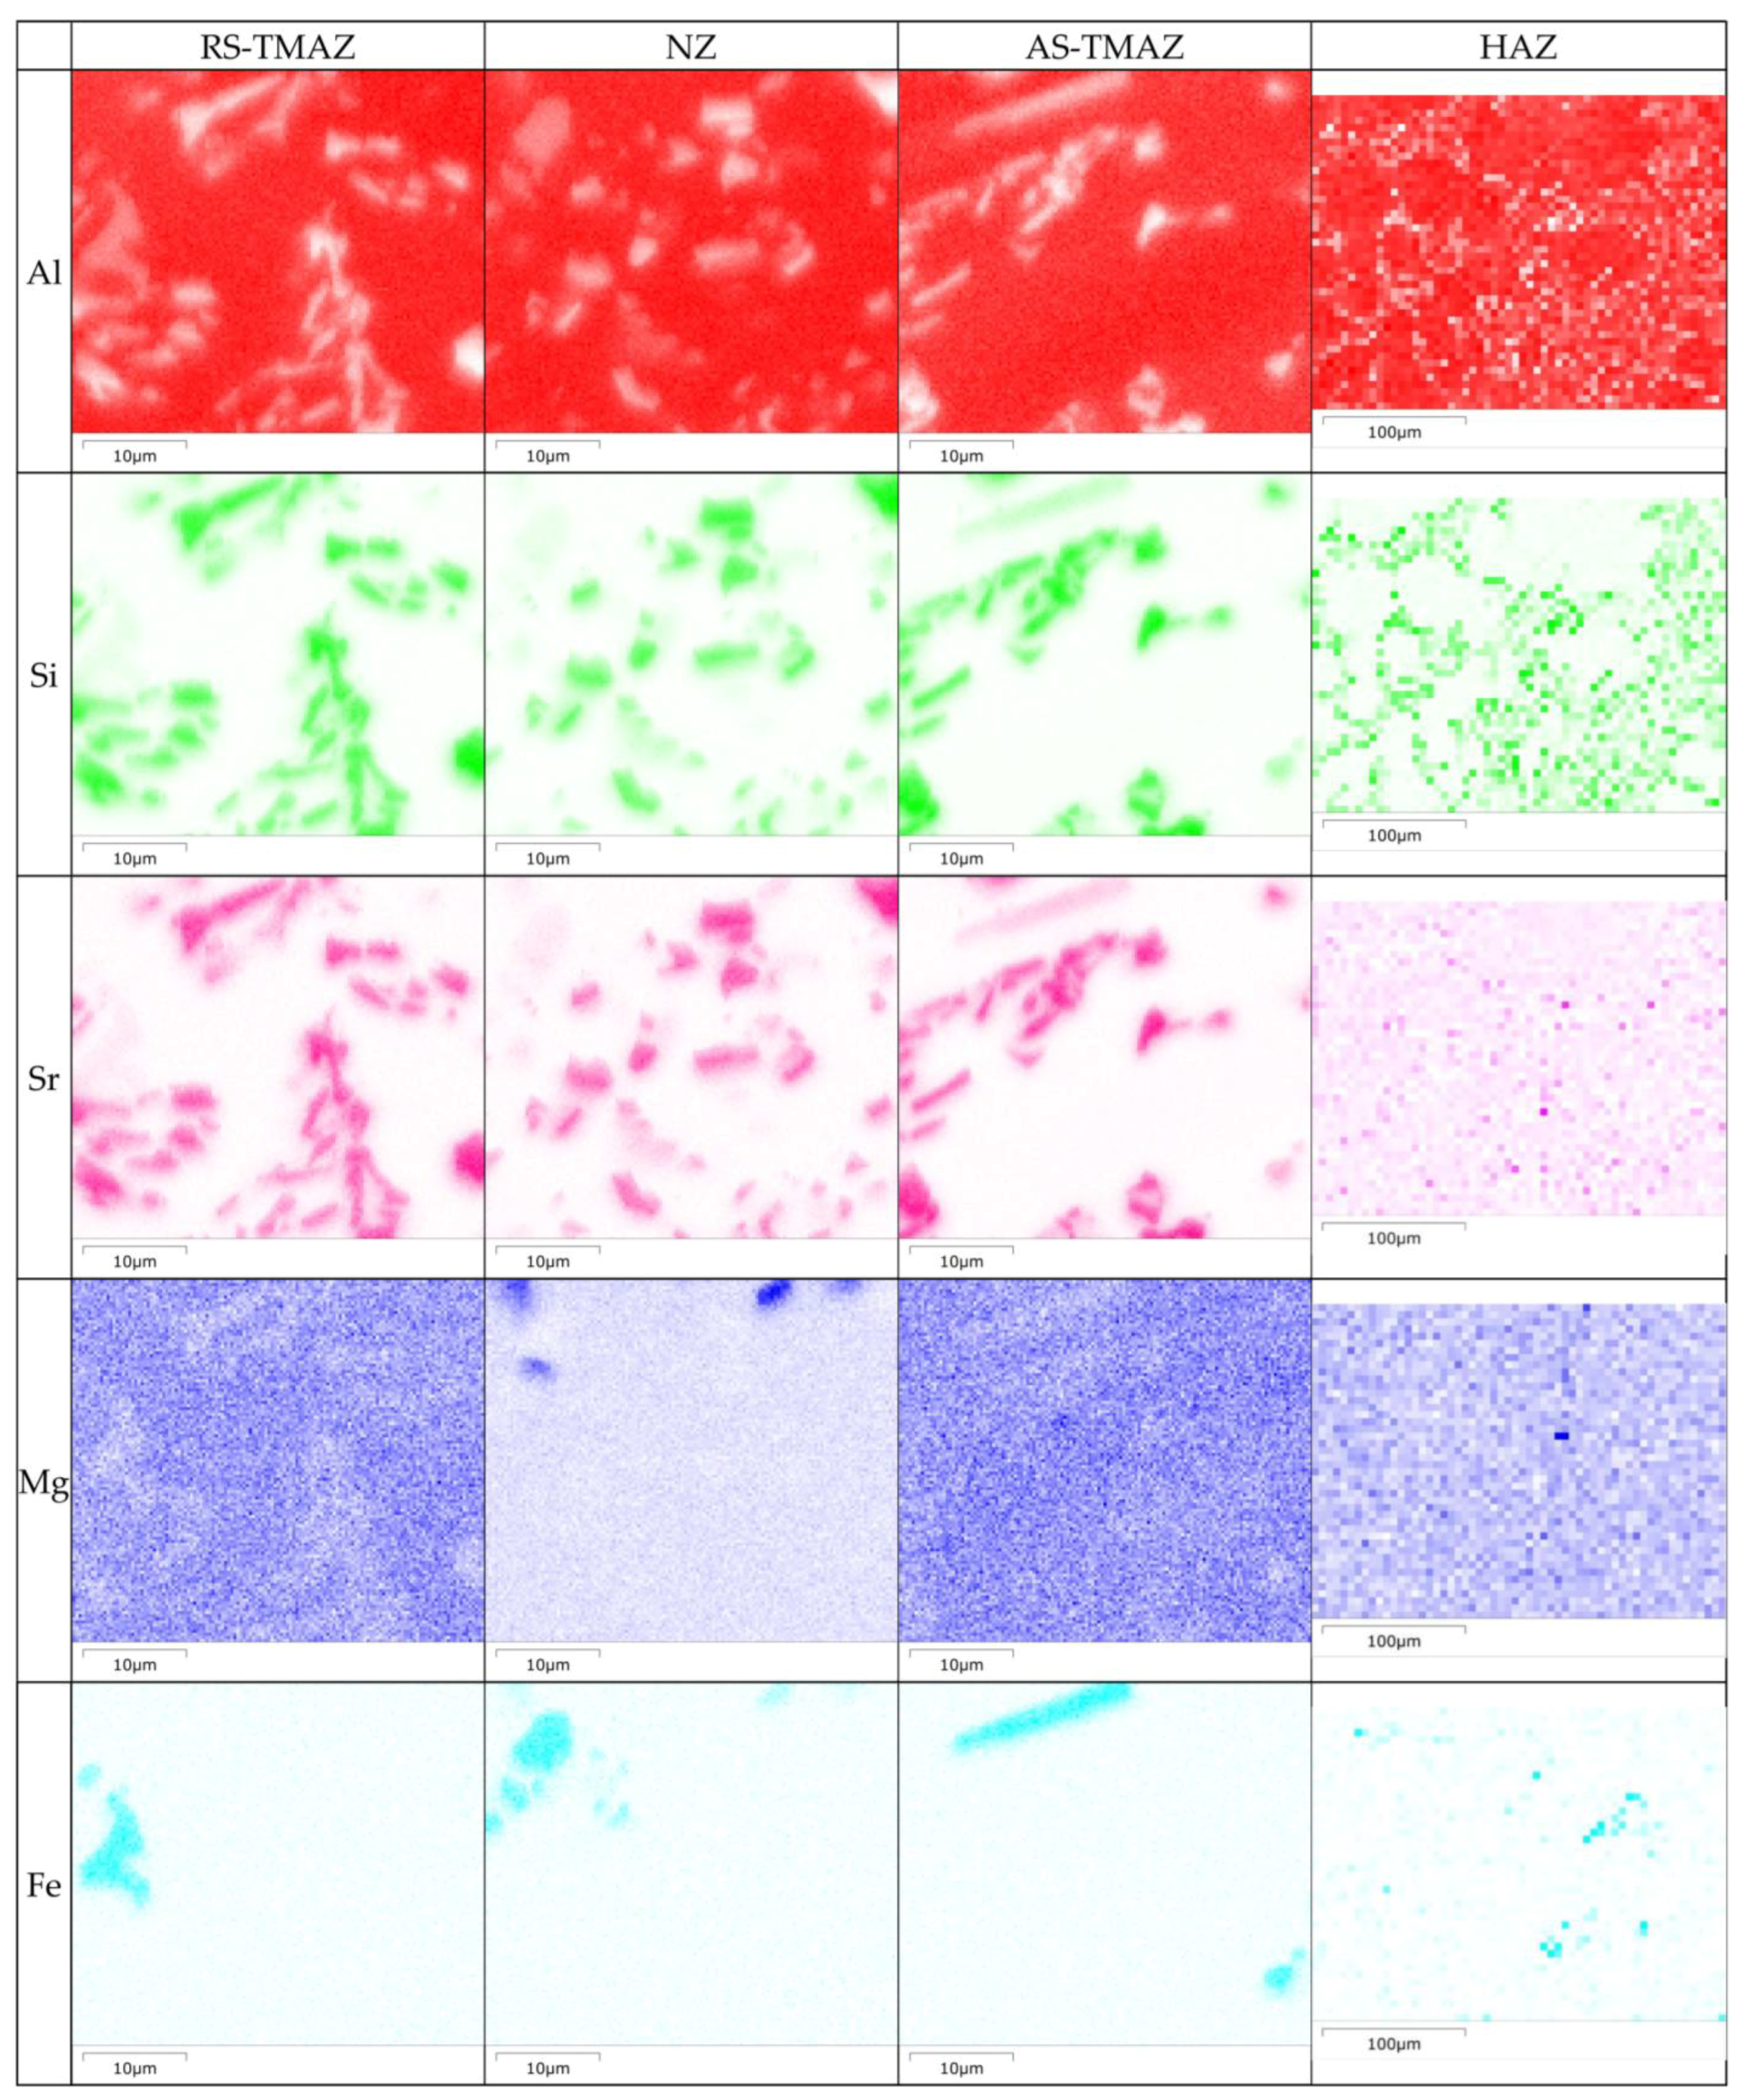
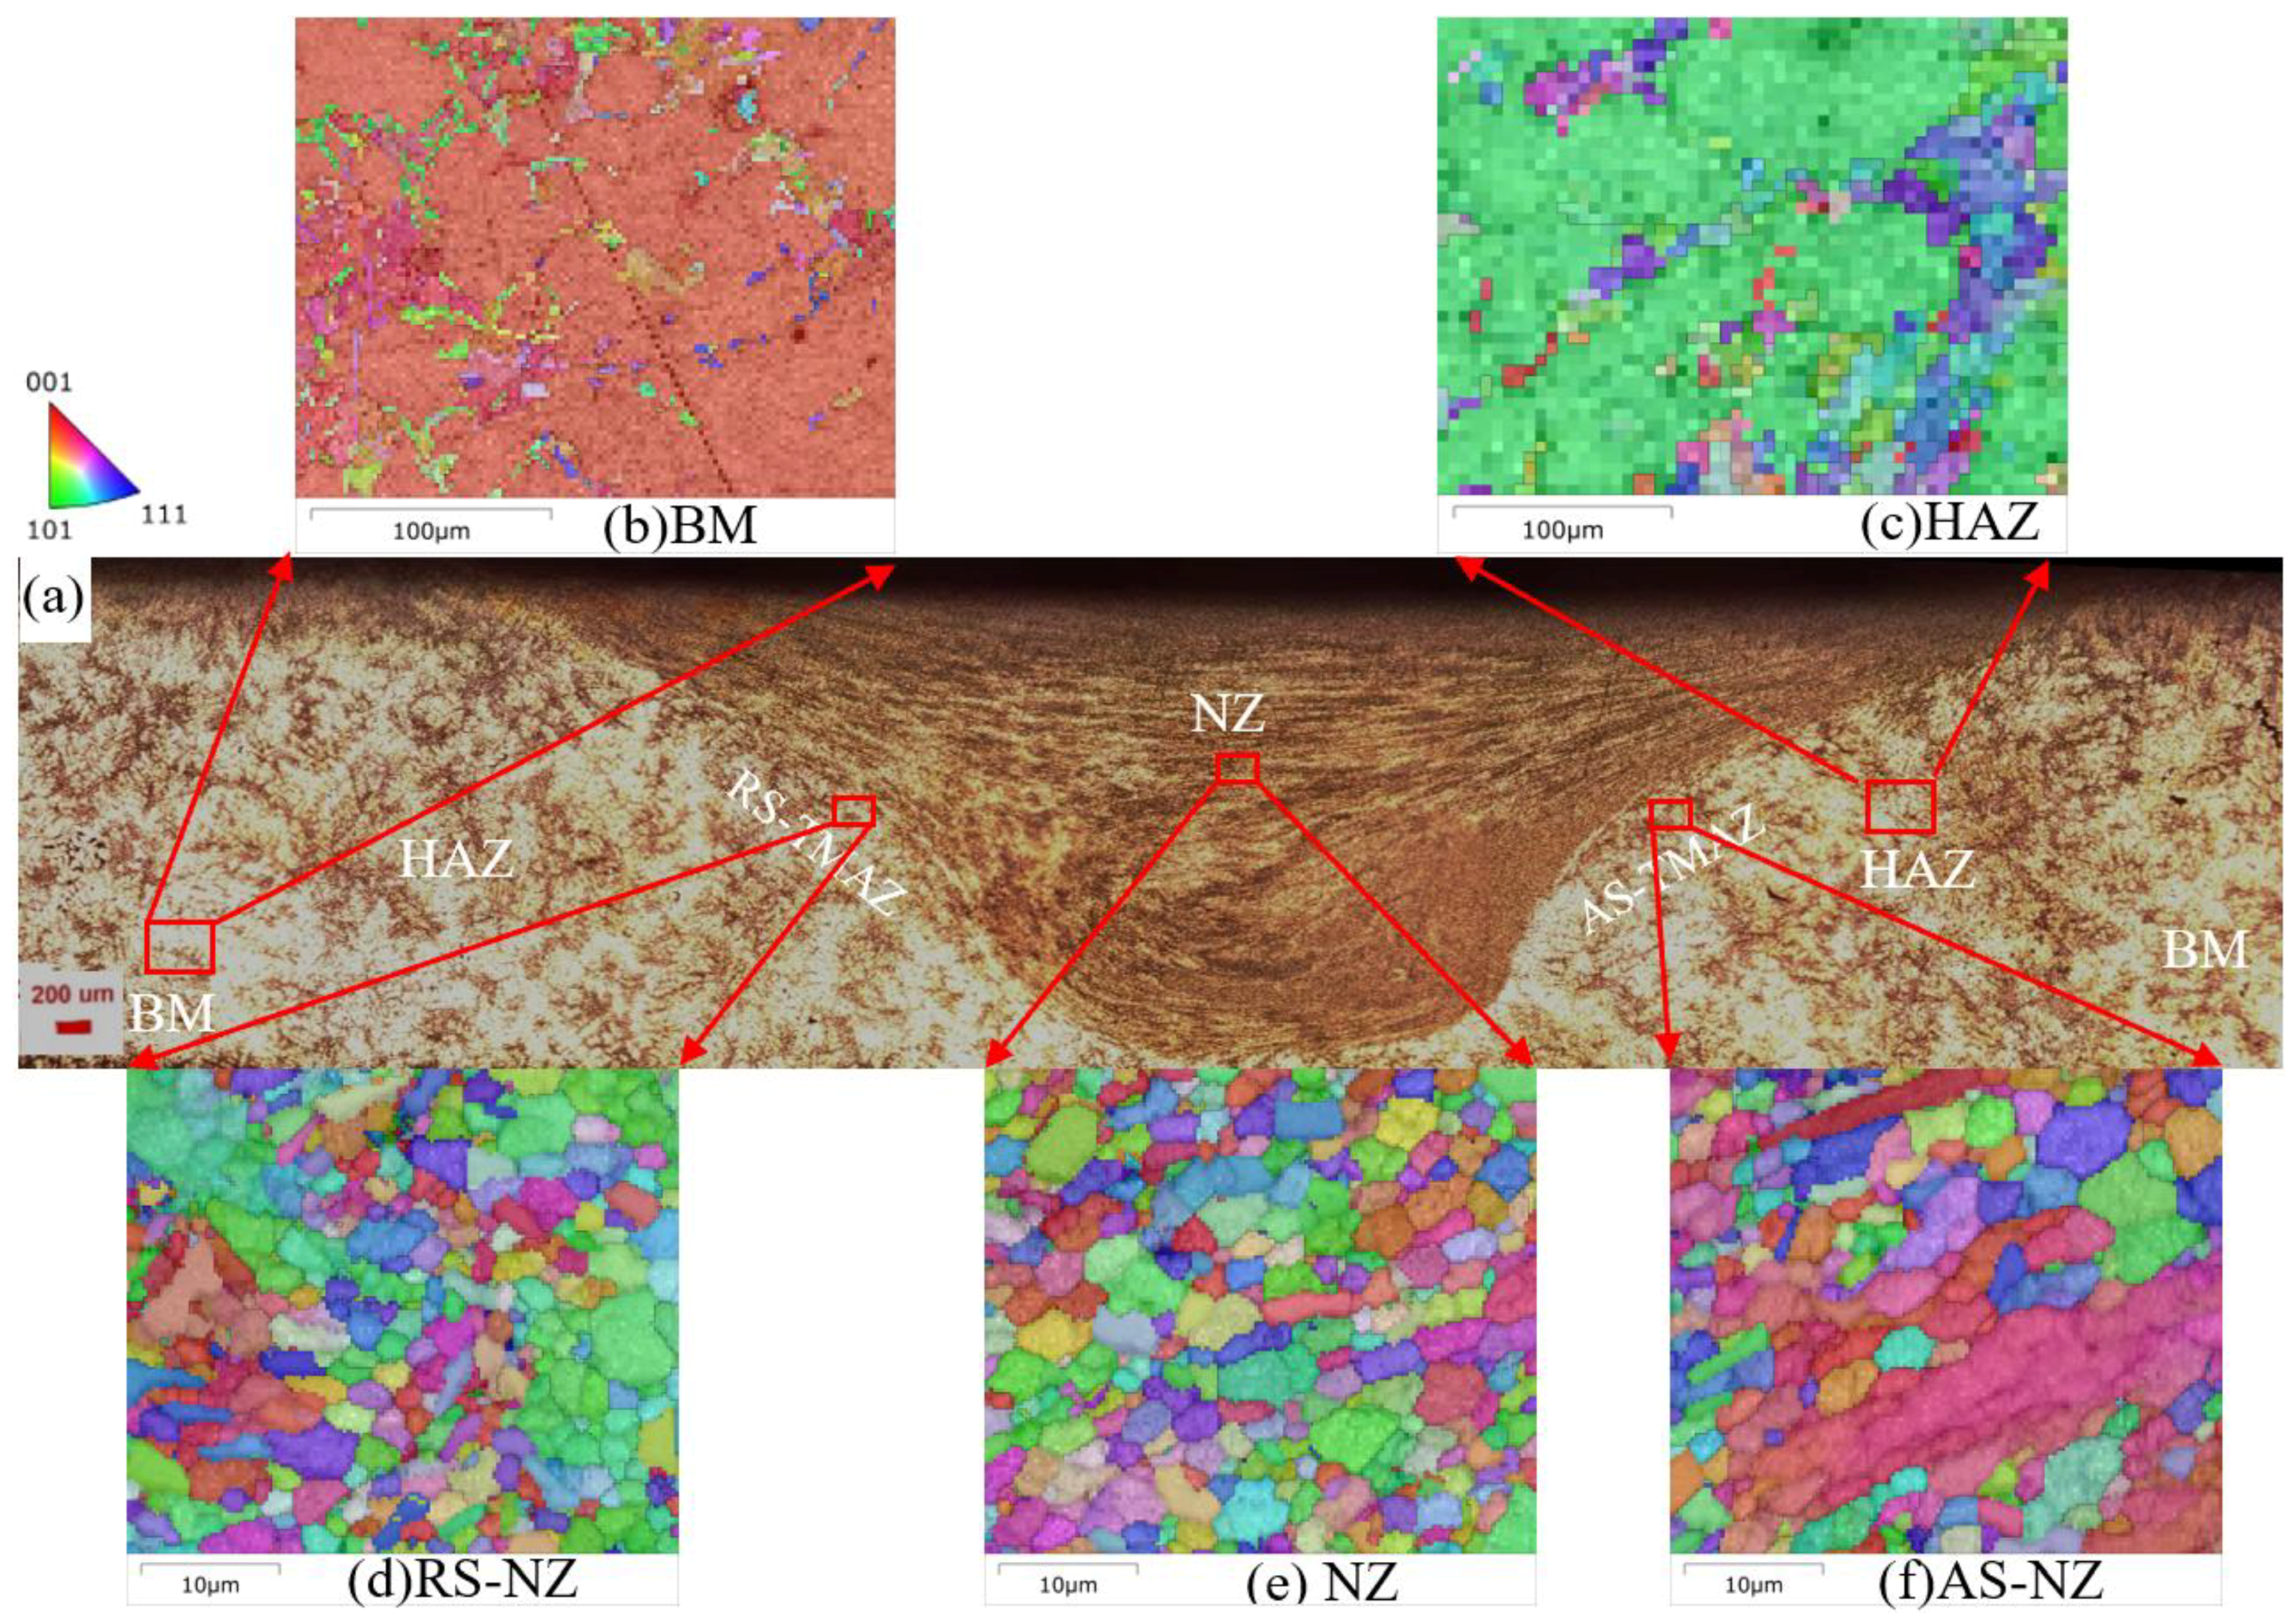
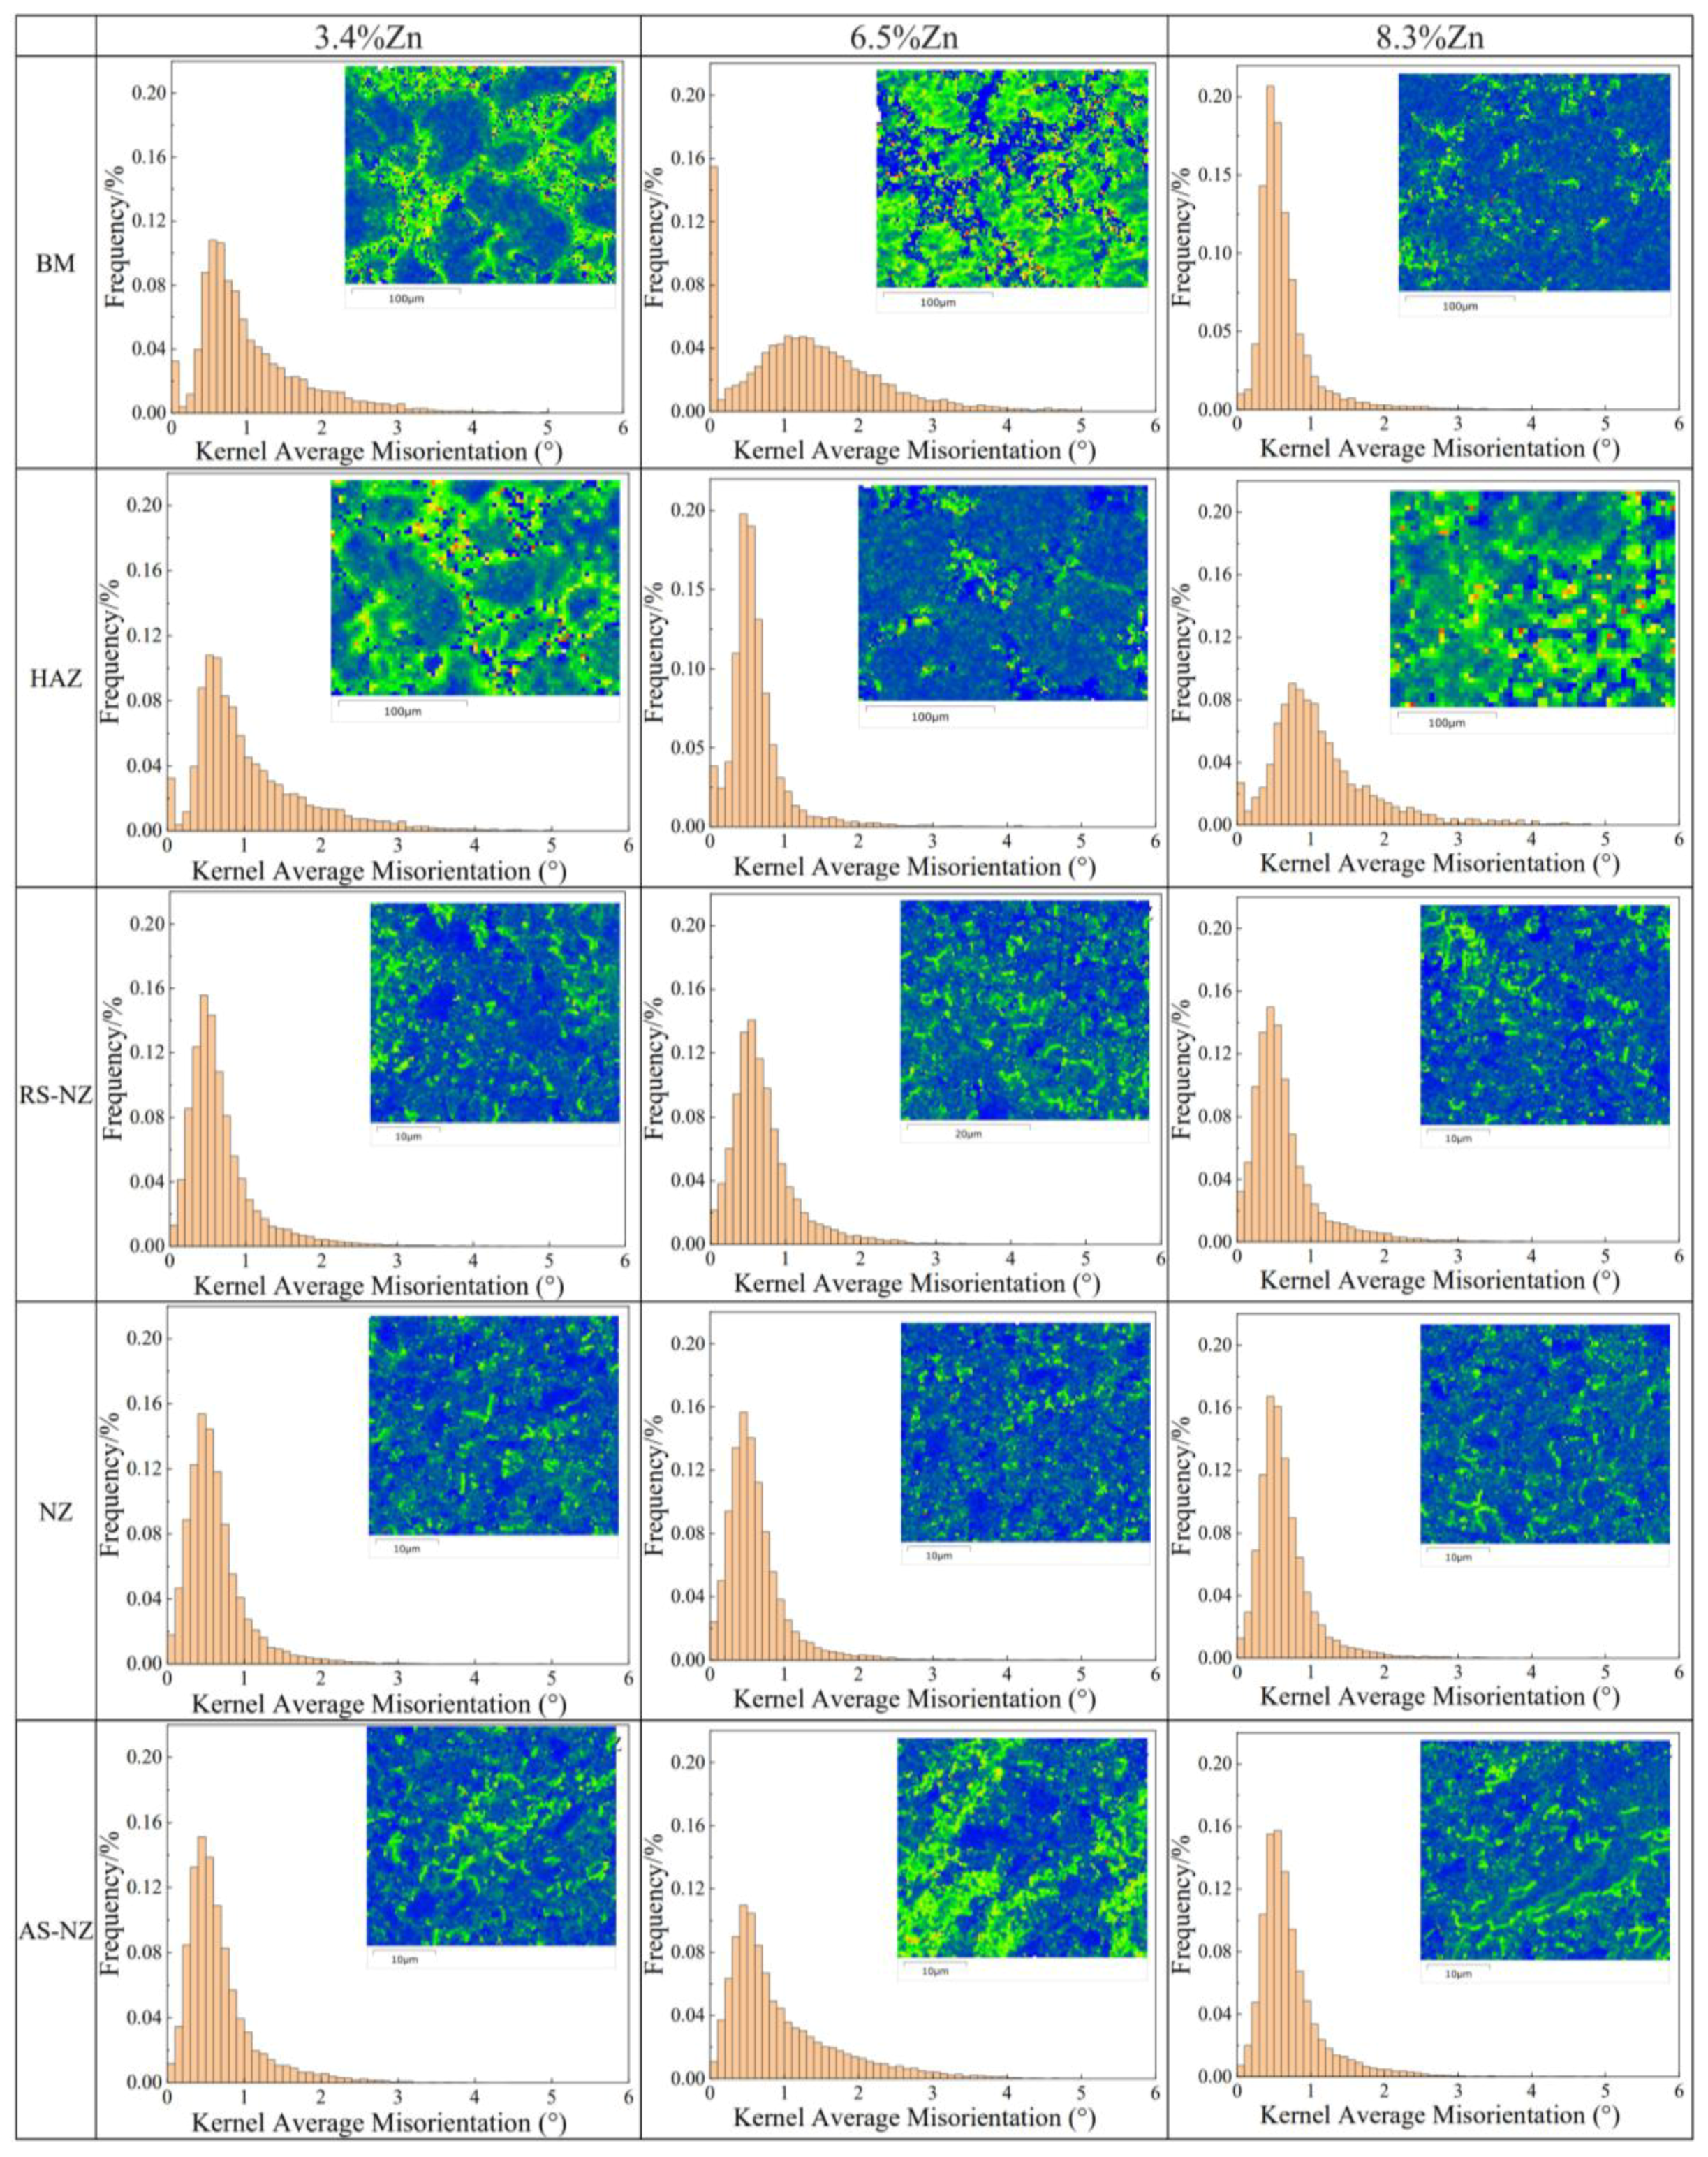
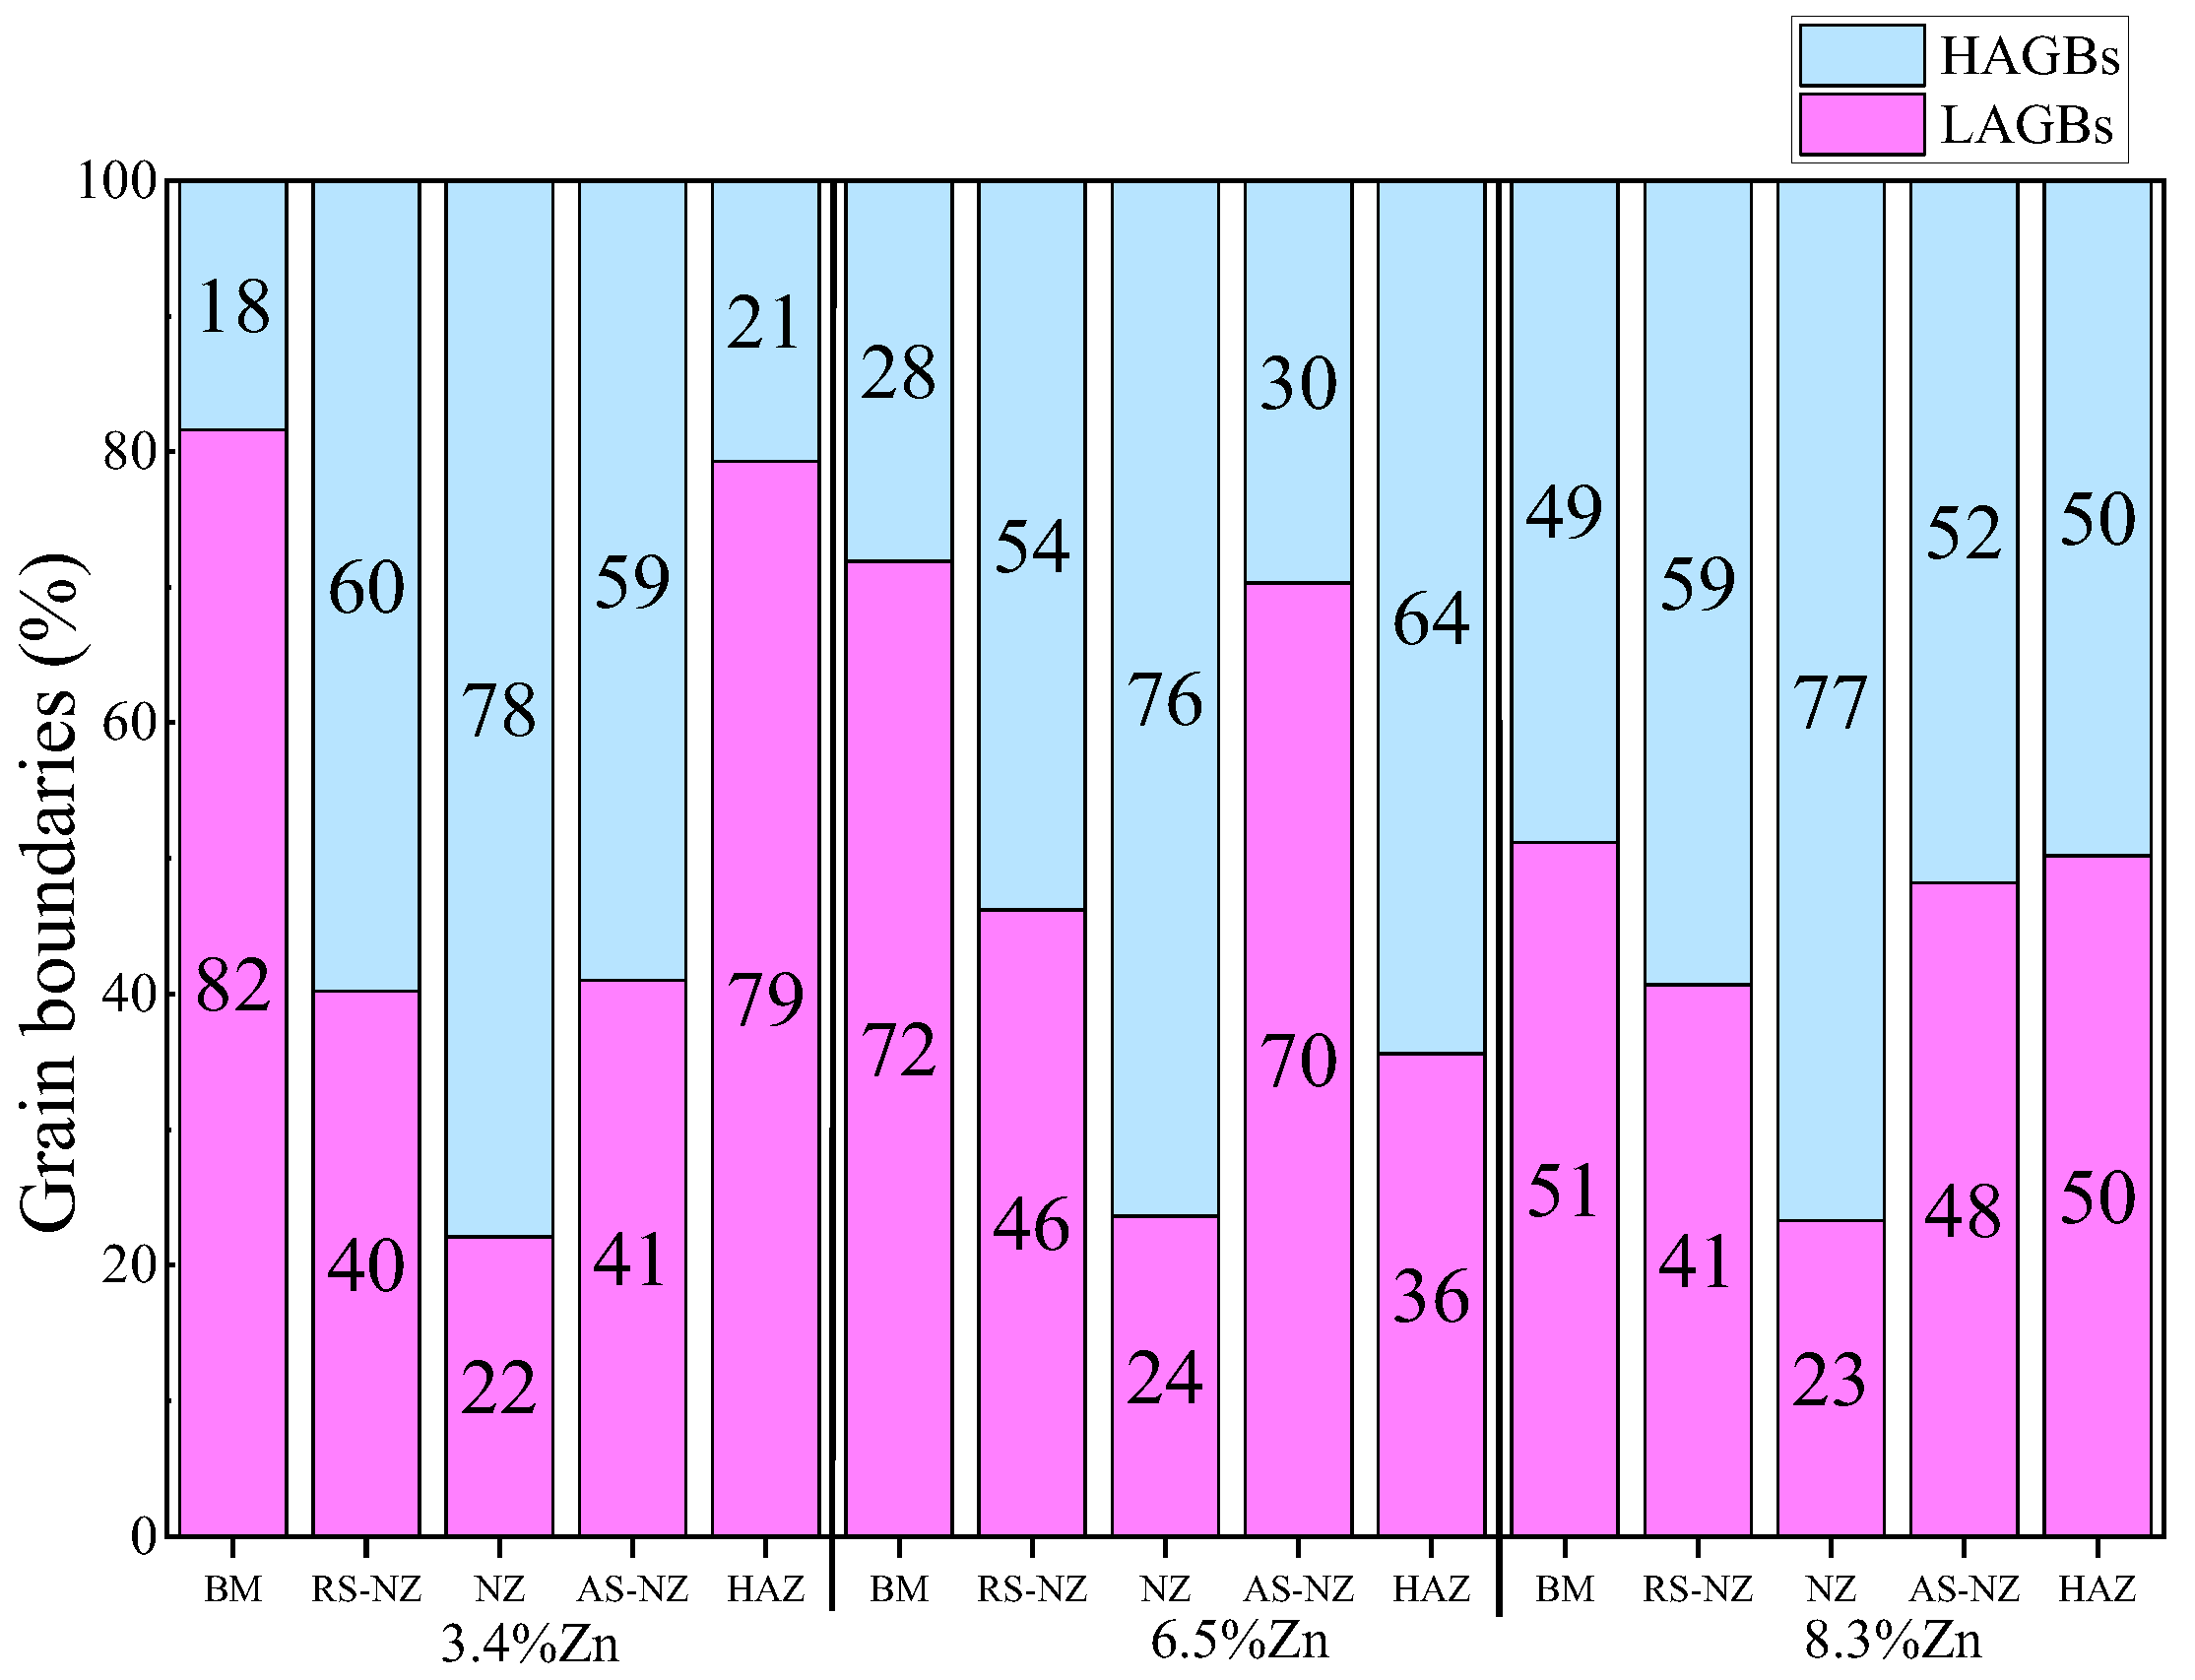
3.2. Microstructure Analysis of FSWed Joints
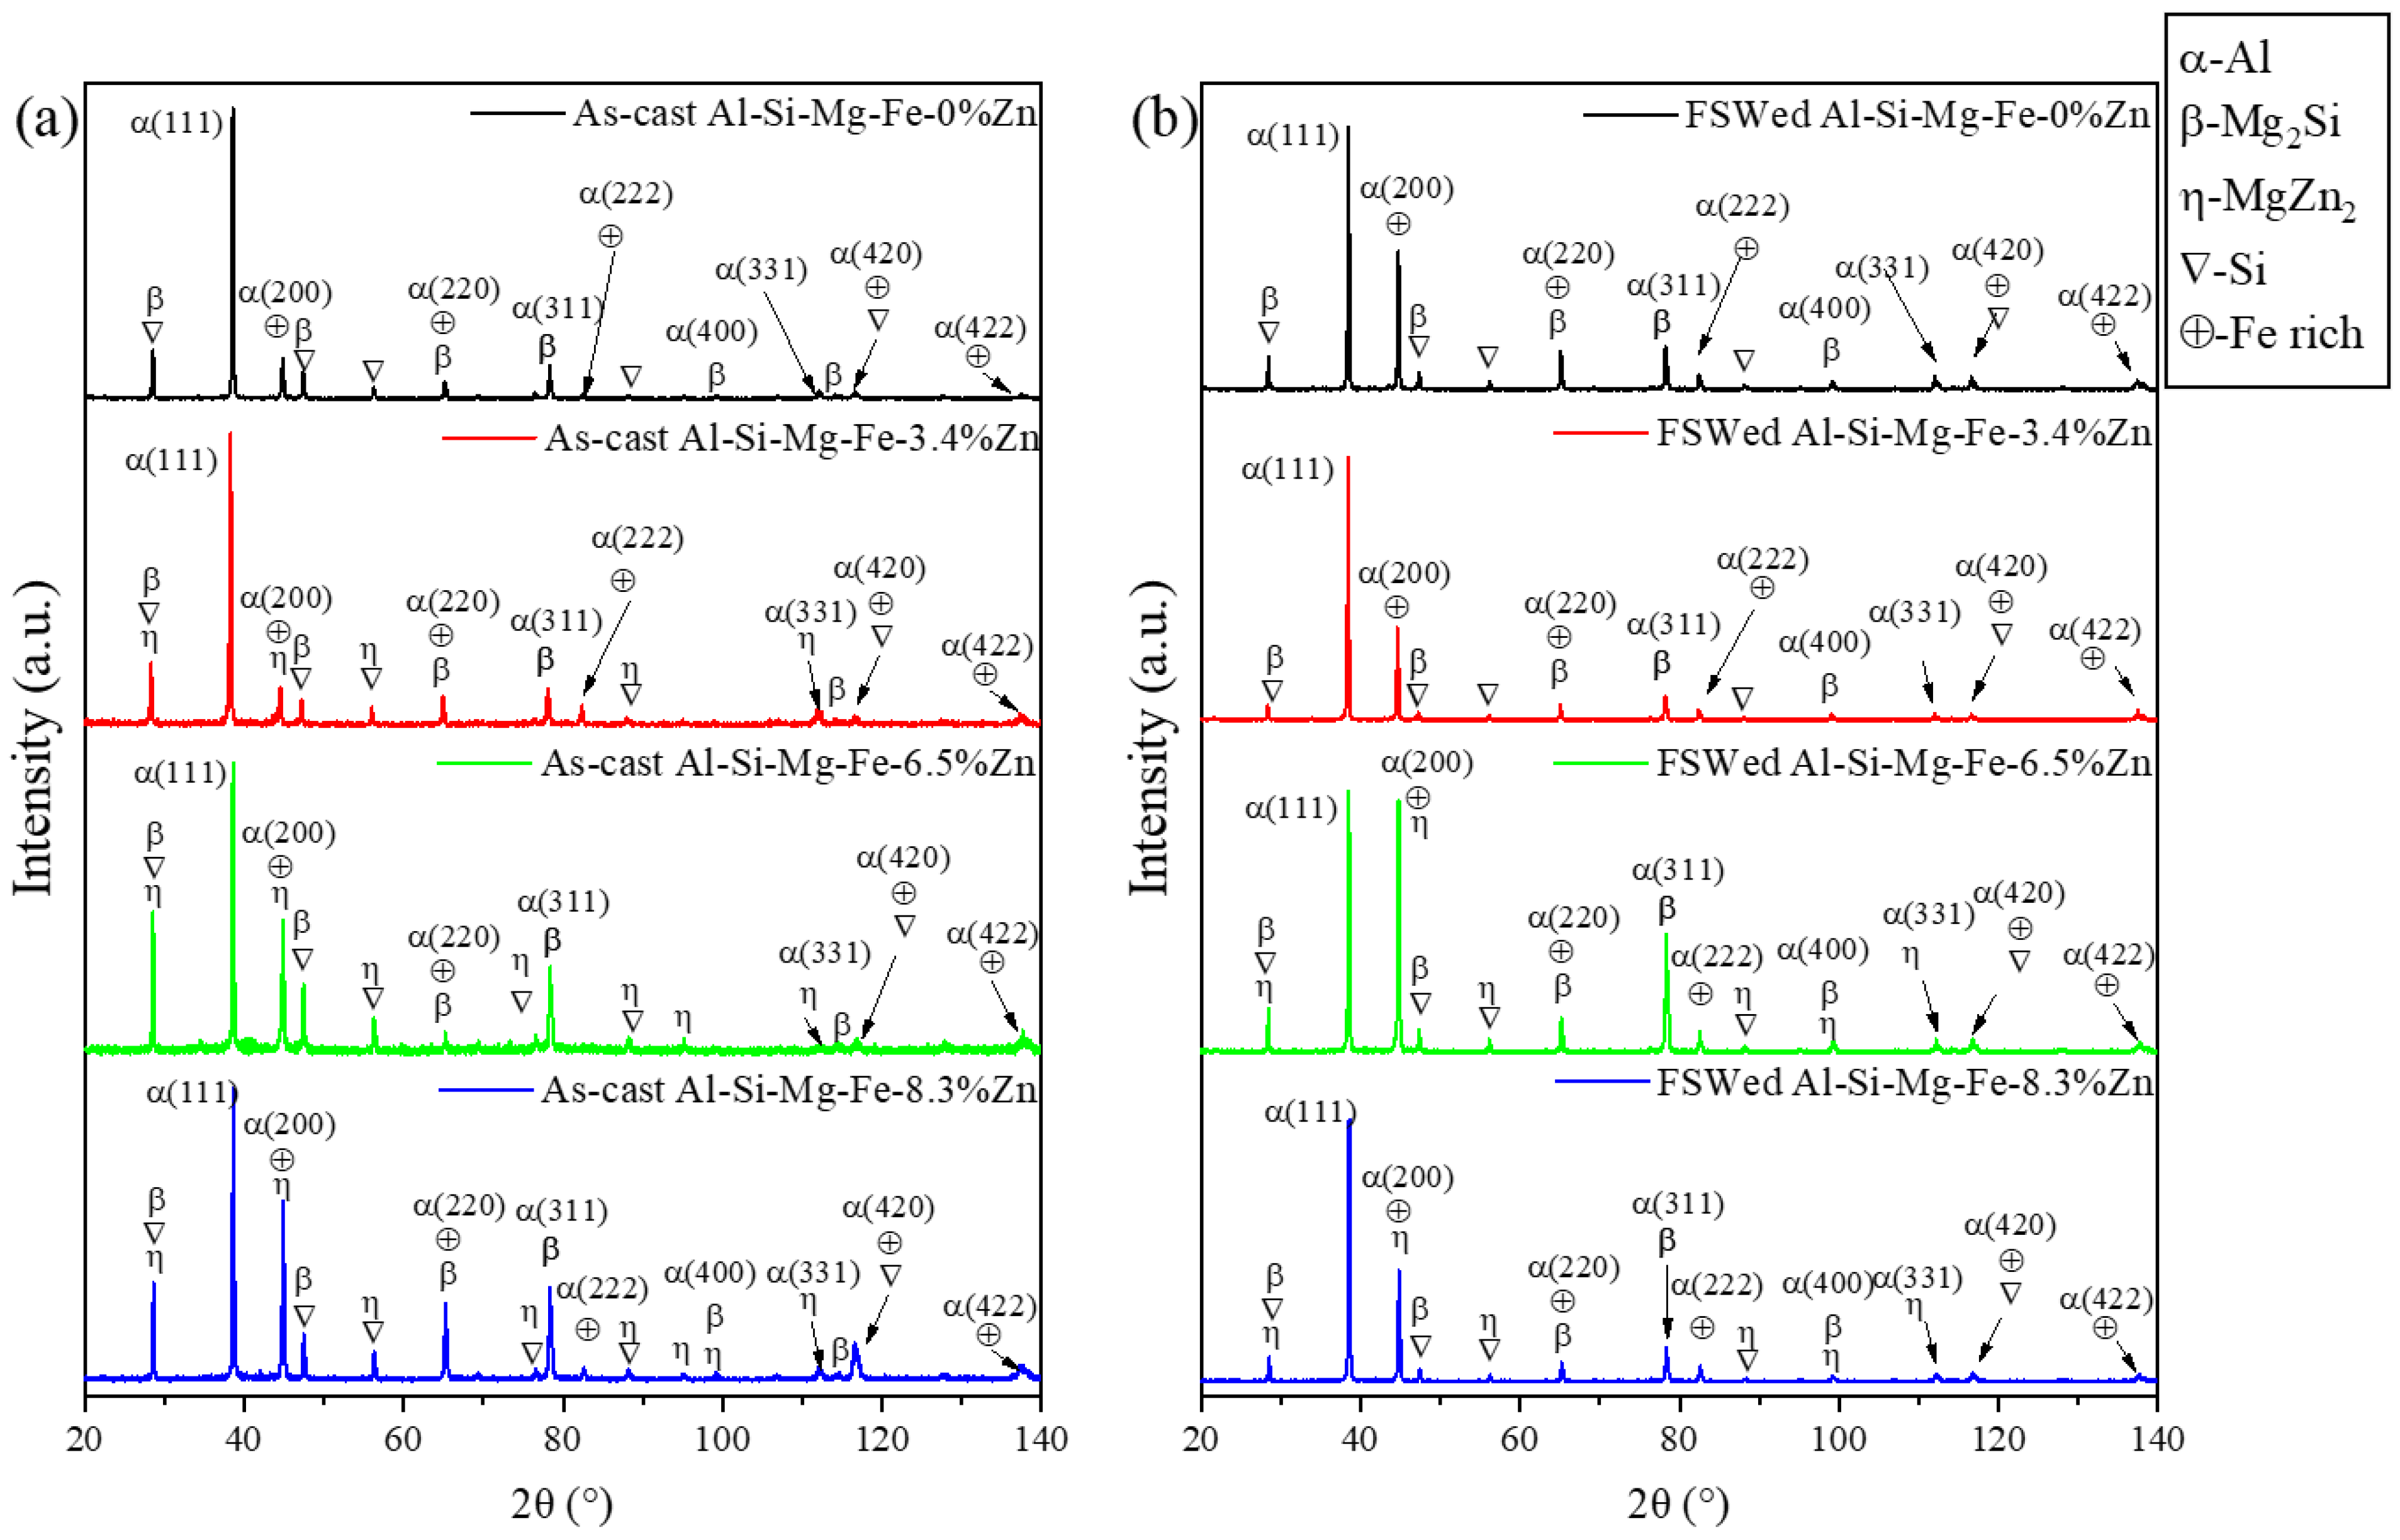
3.3. XRD Study
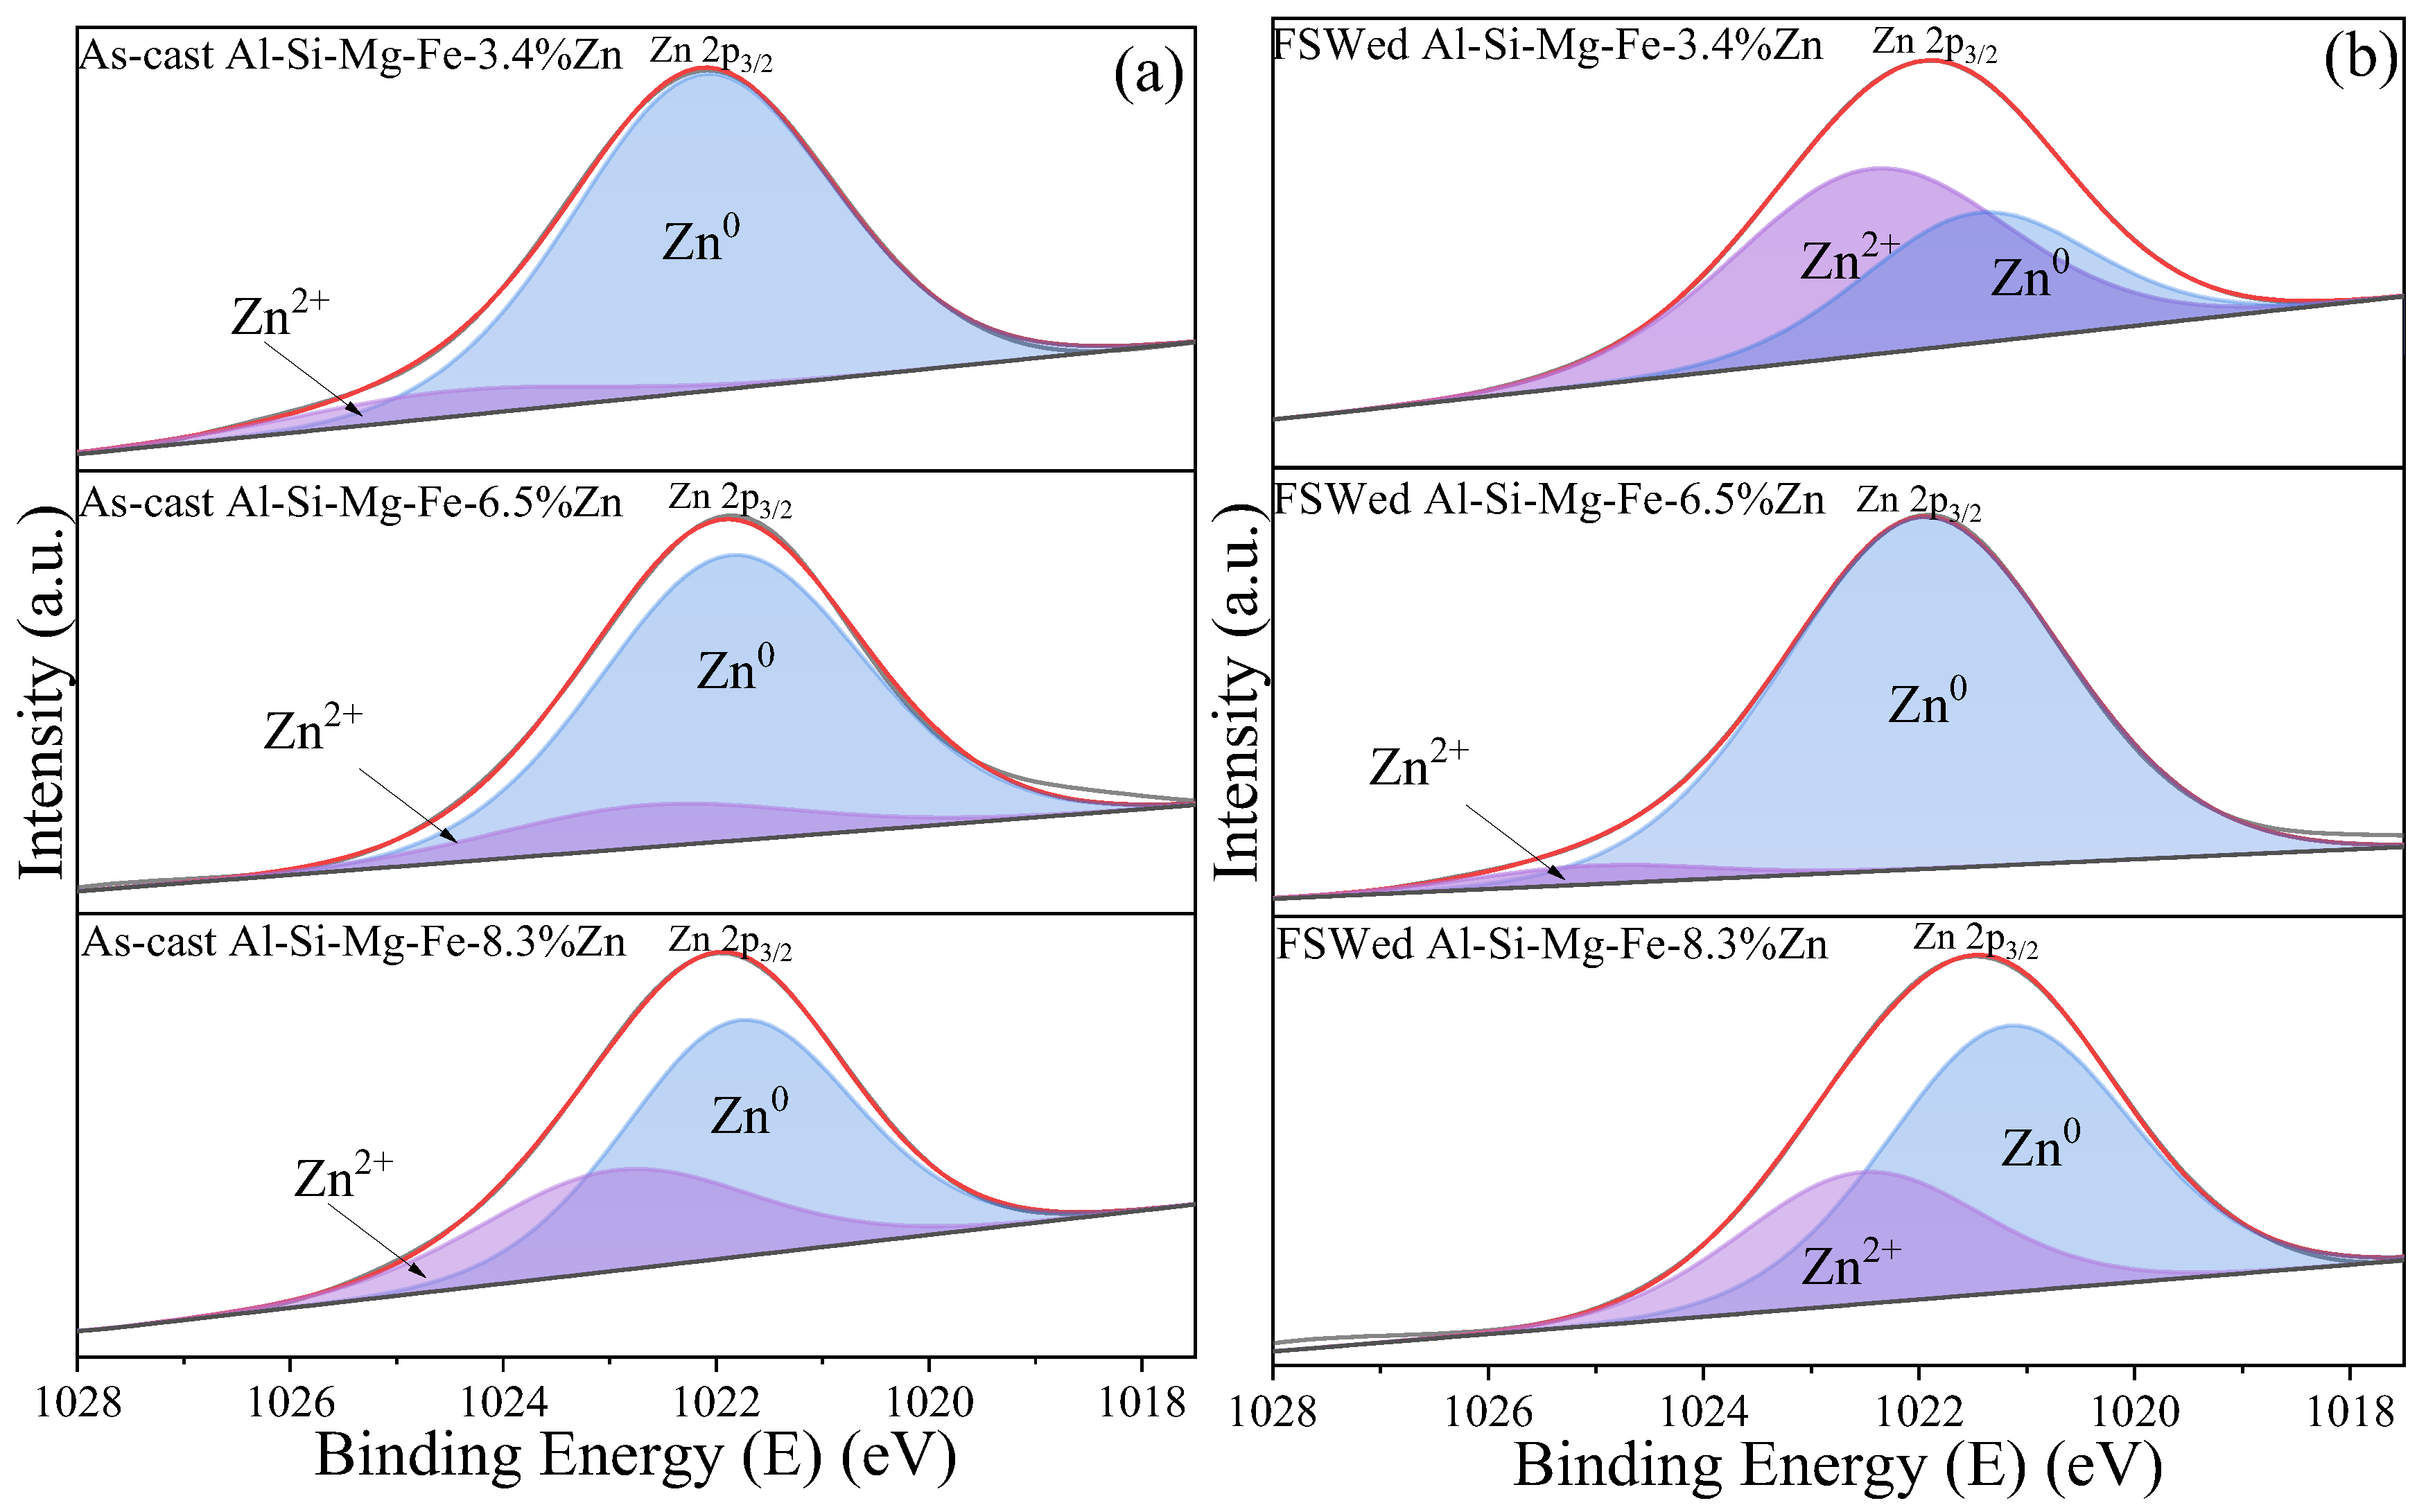
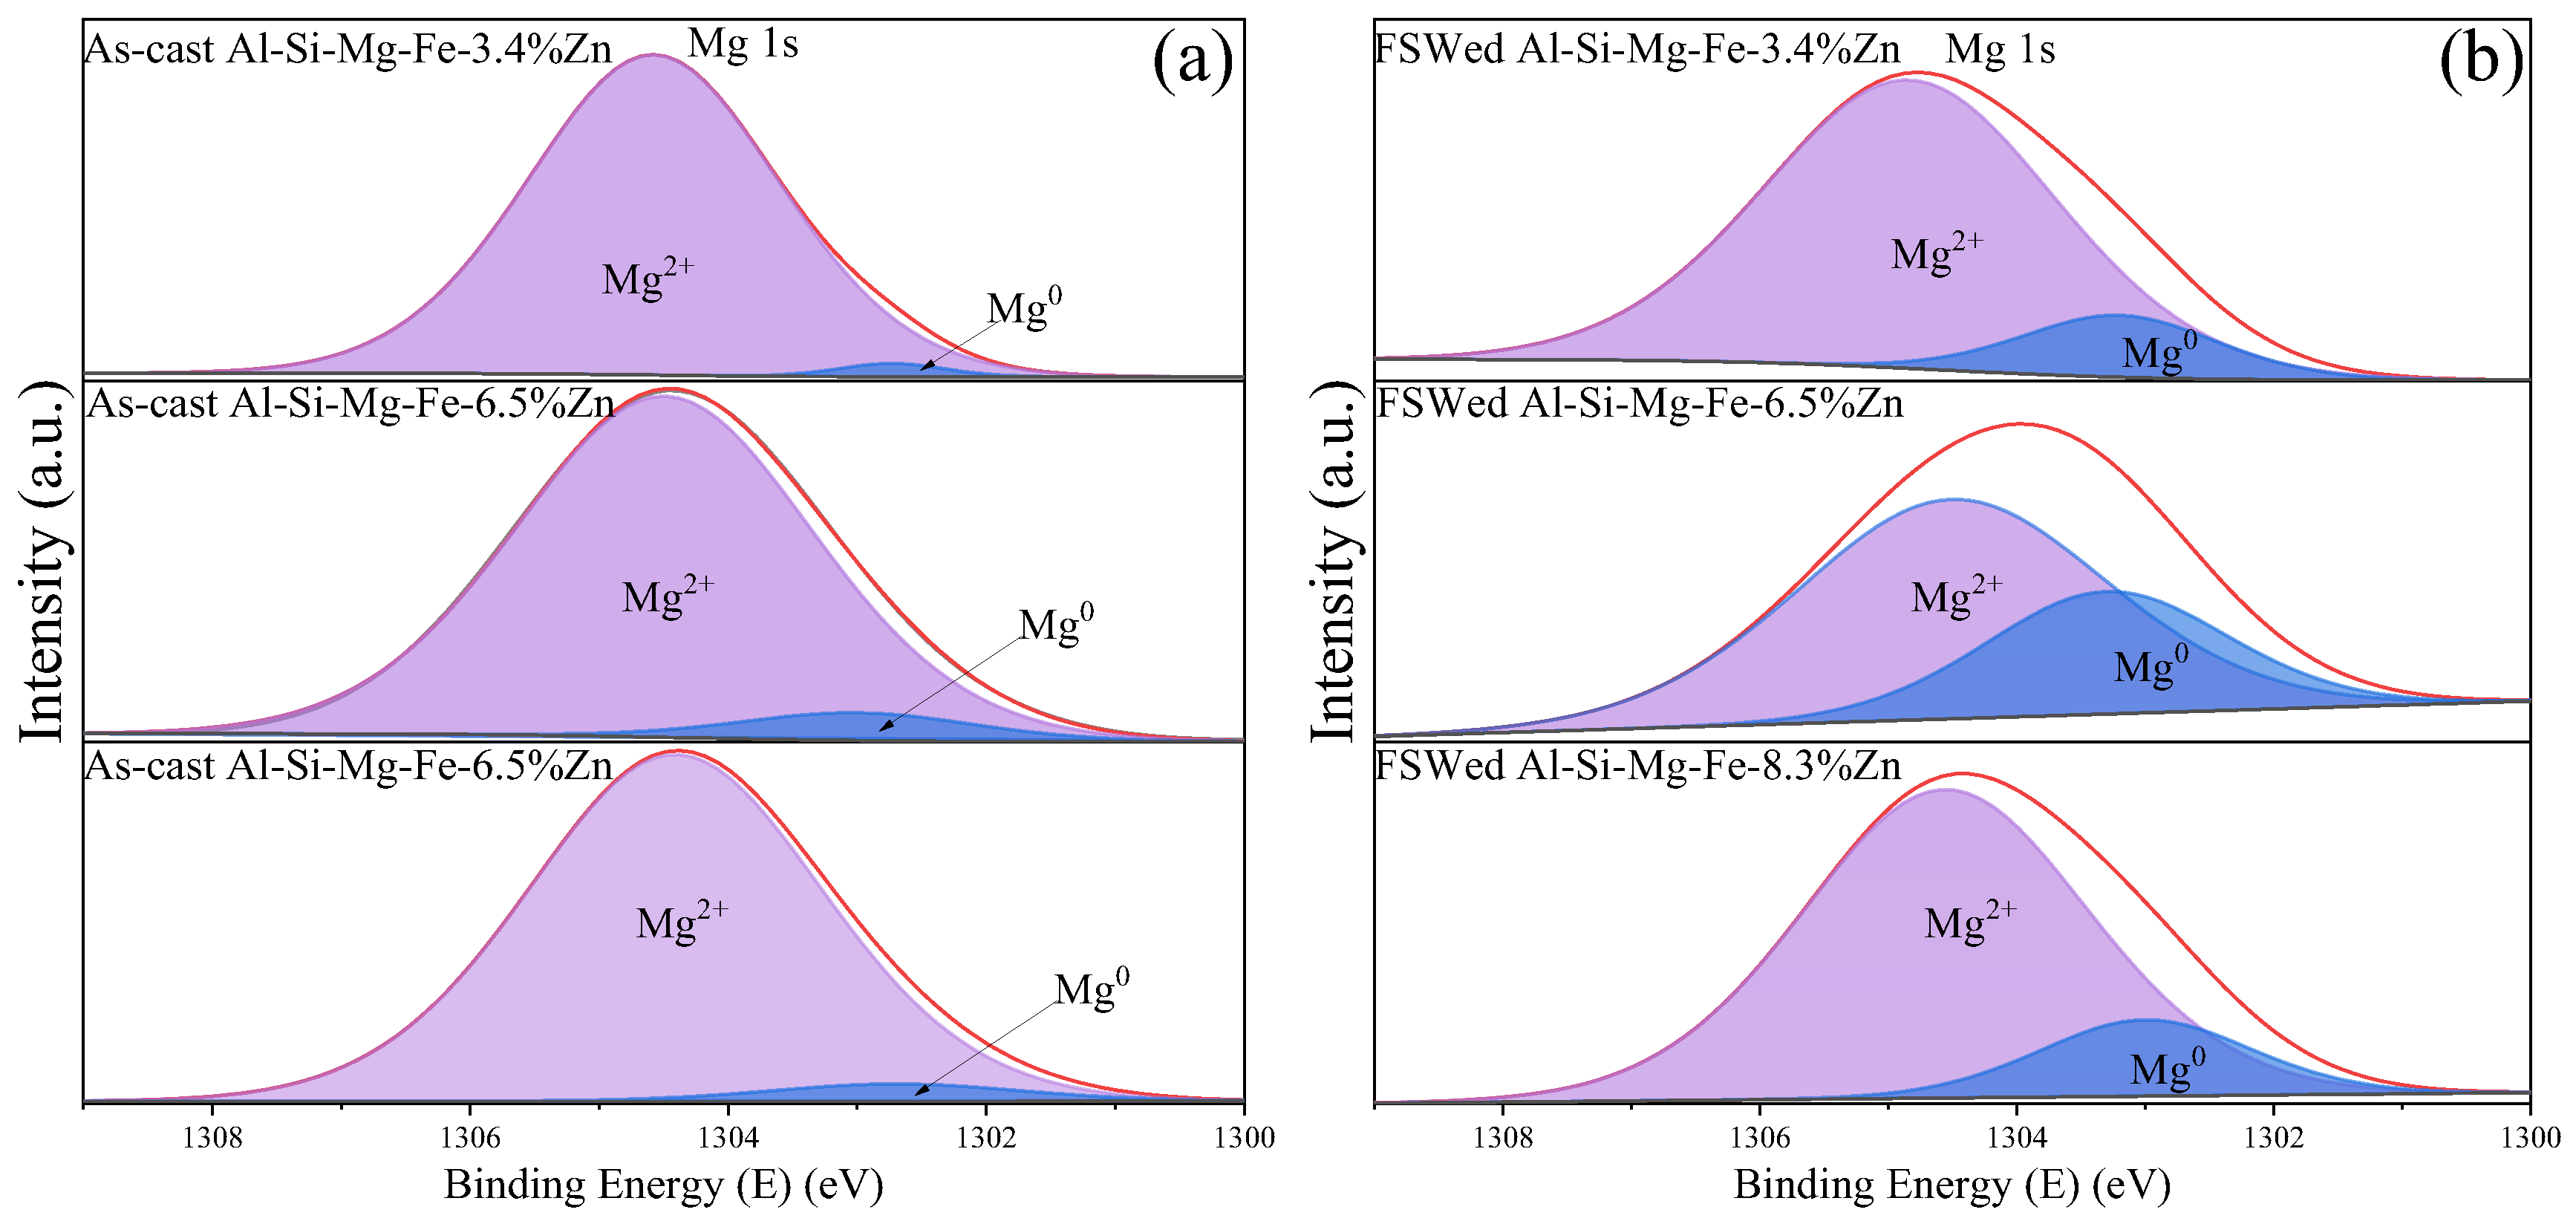
3.4. XPS Study
3.5. Mechanical Properties
3.6. Corrosion Behavior
4. Conclusions
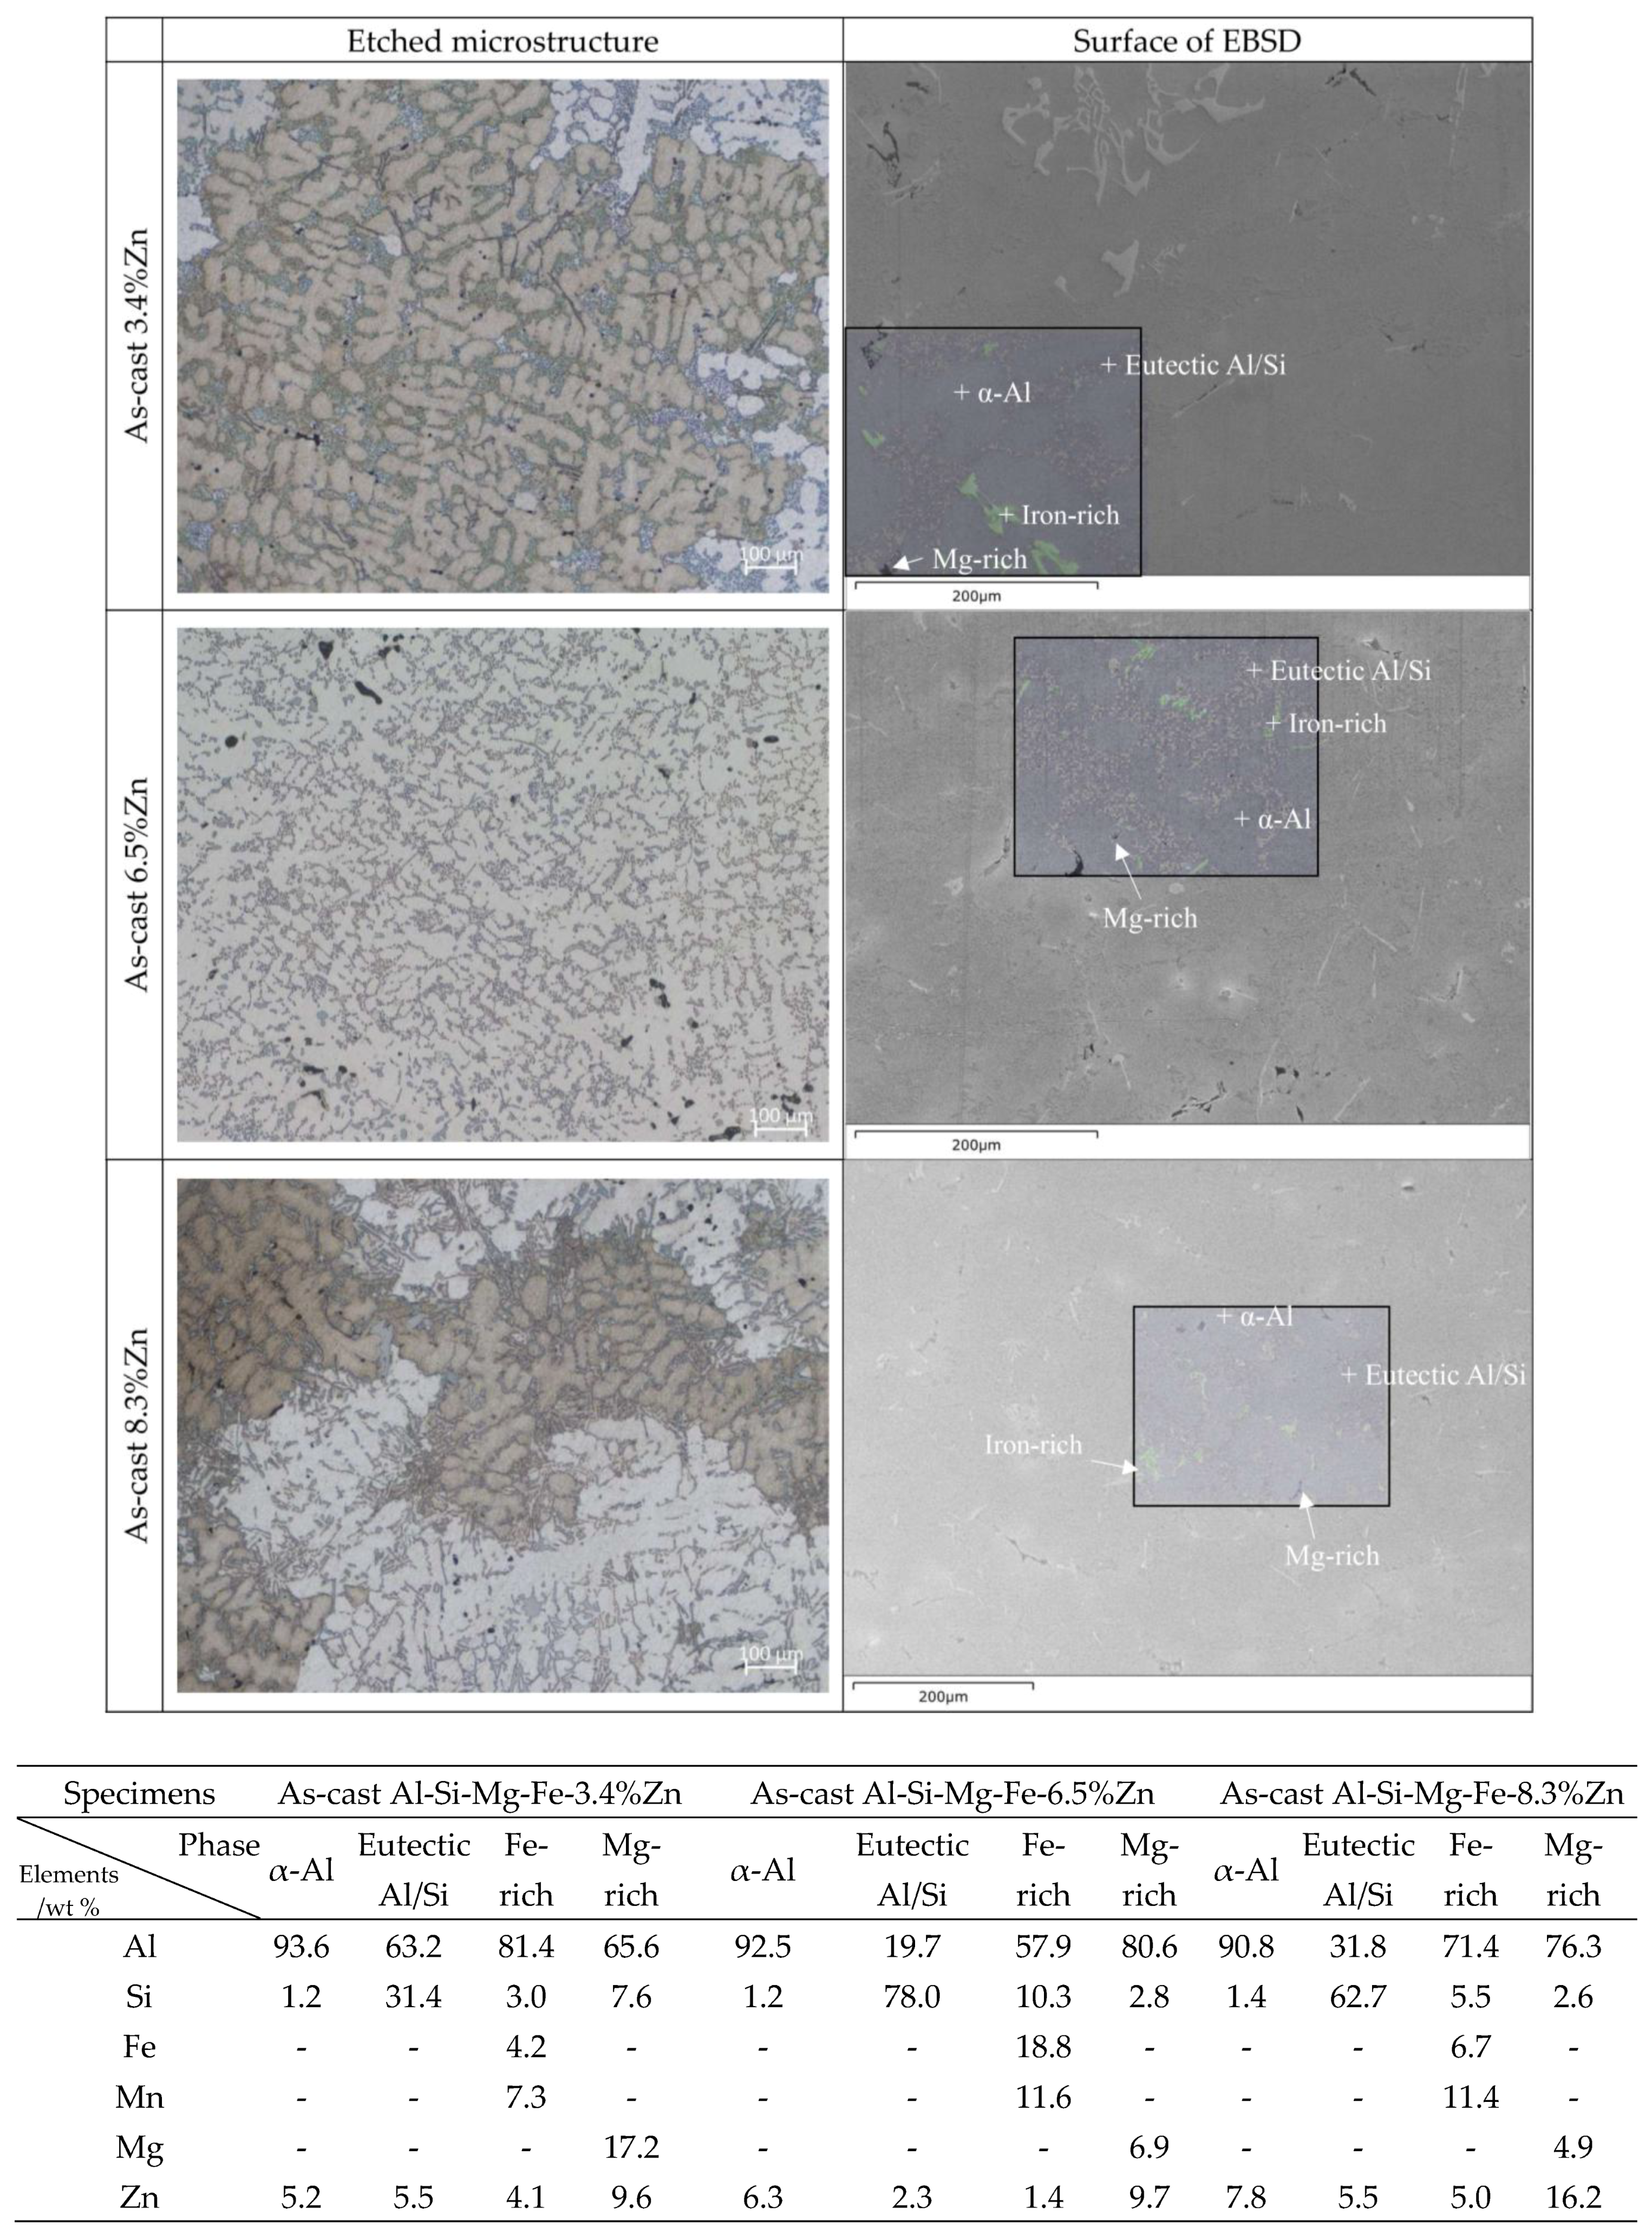
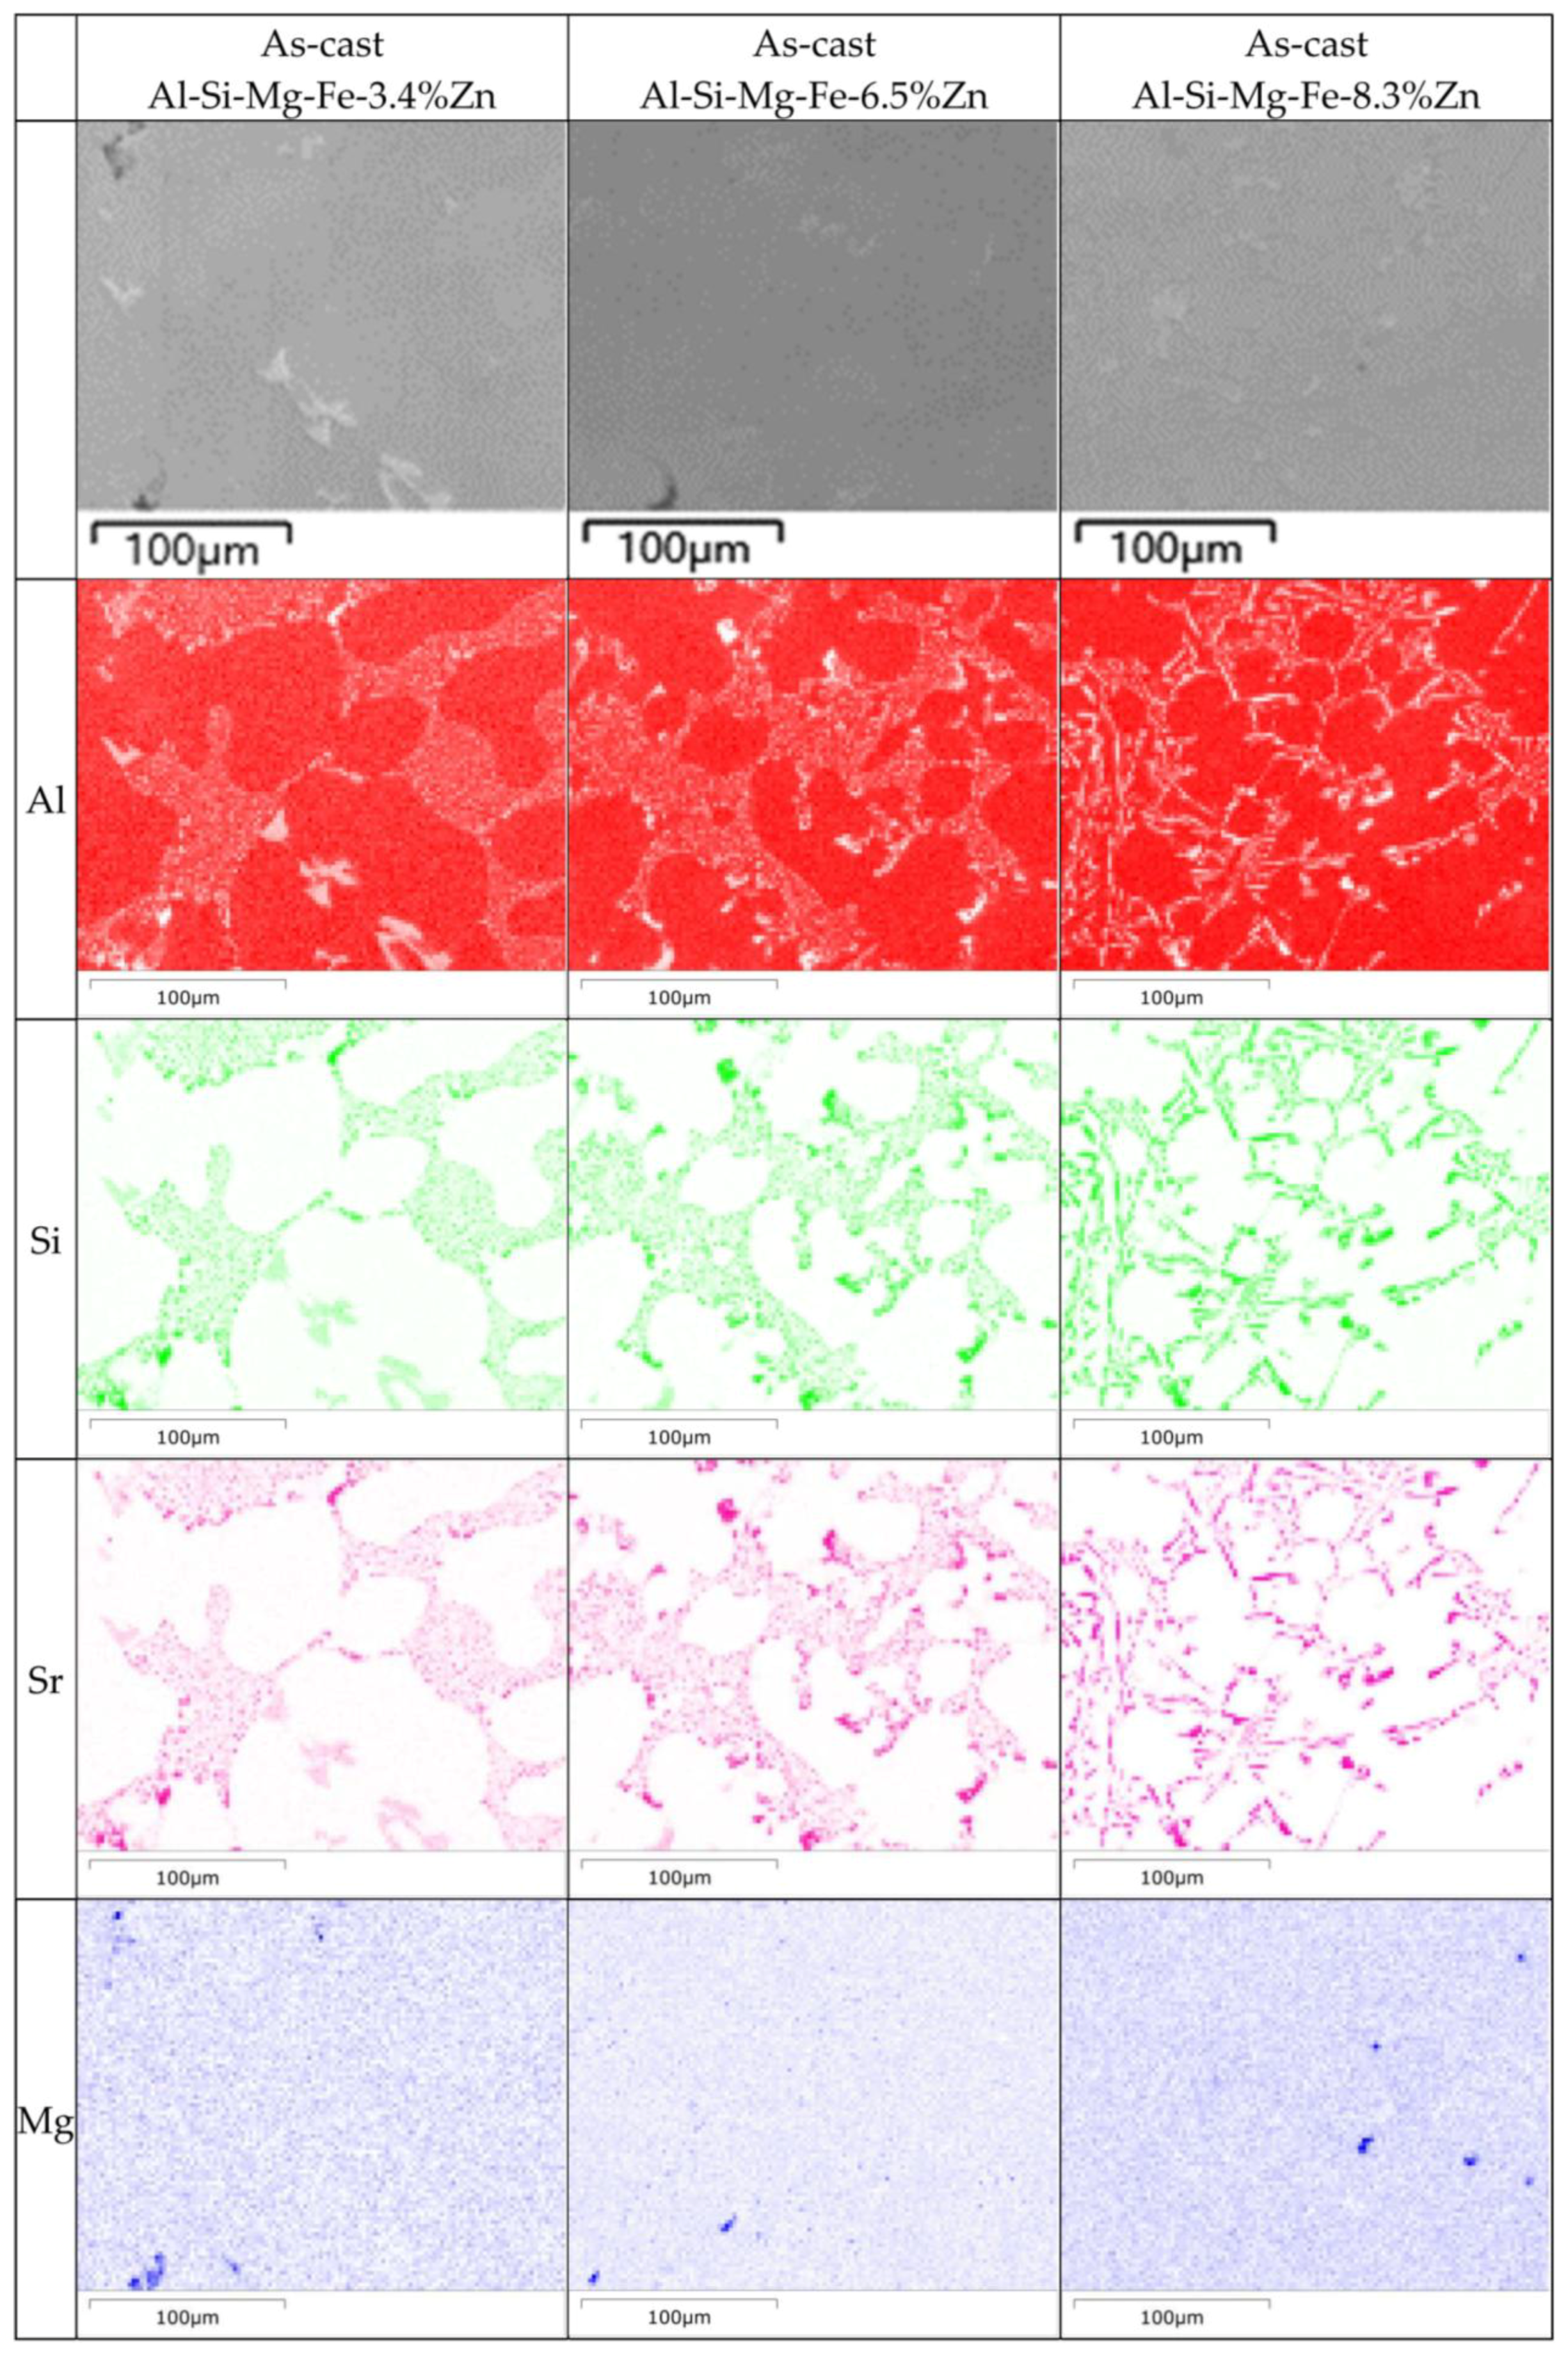
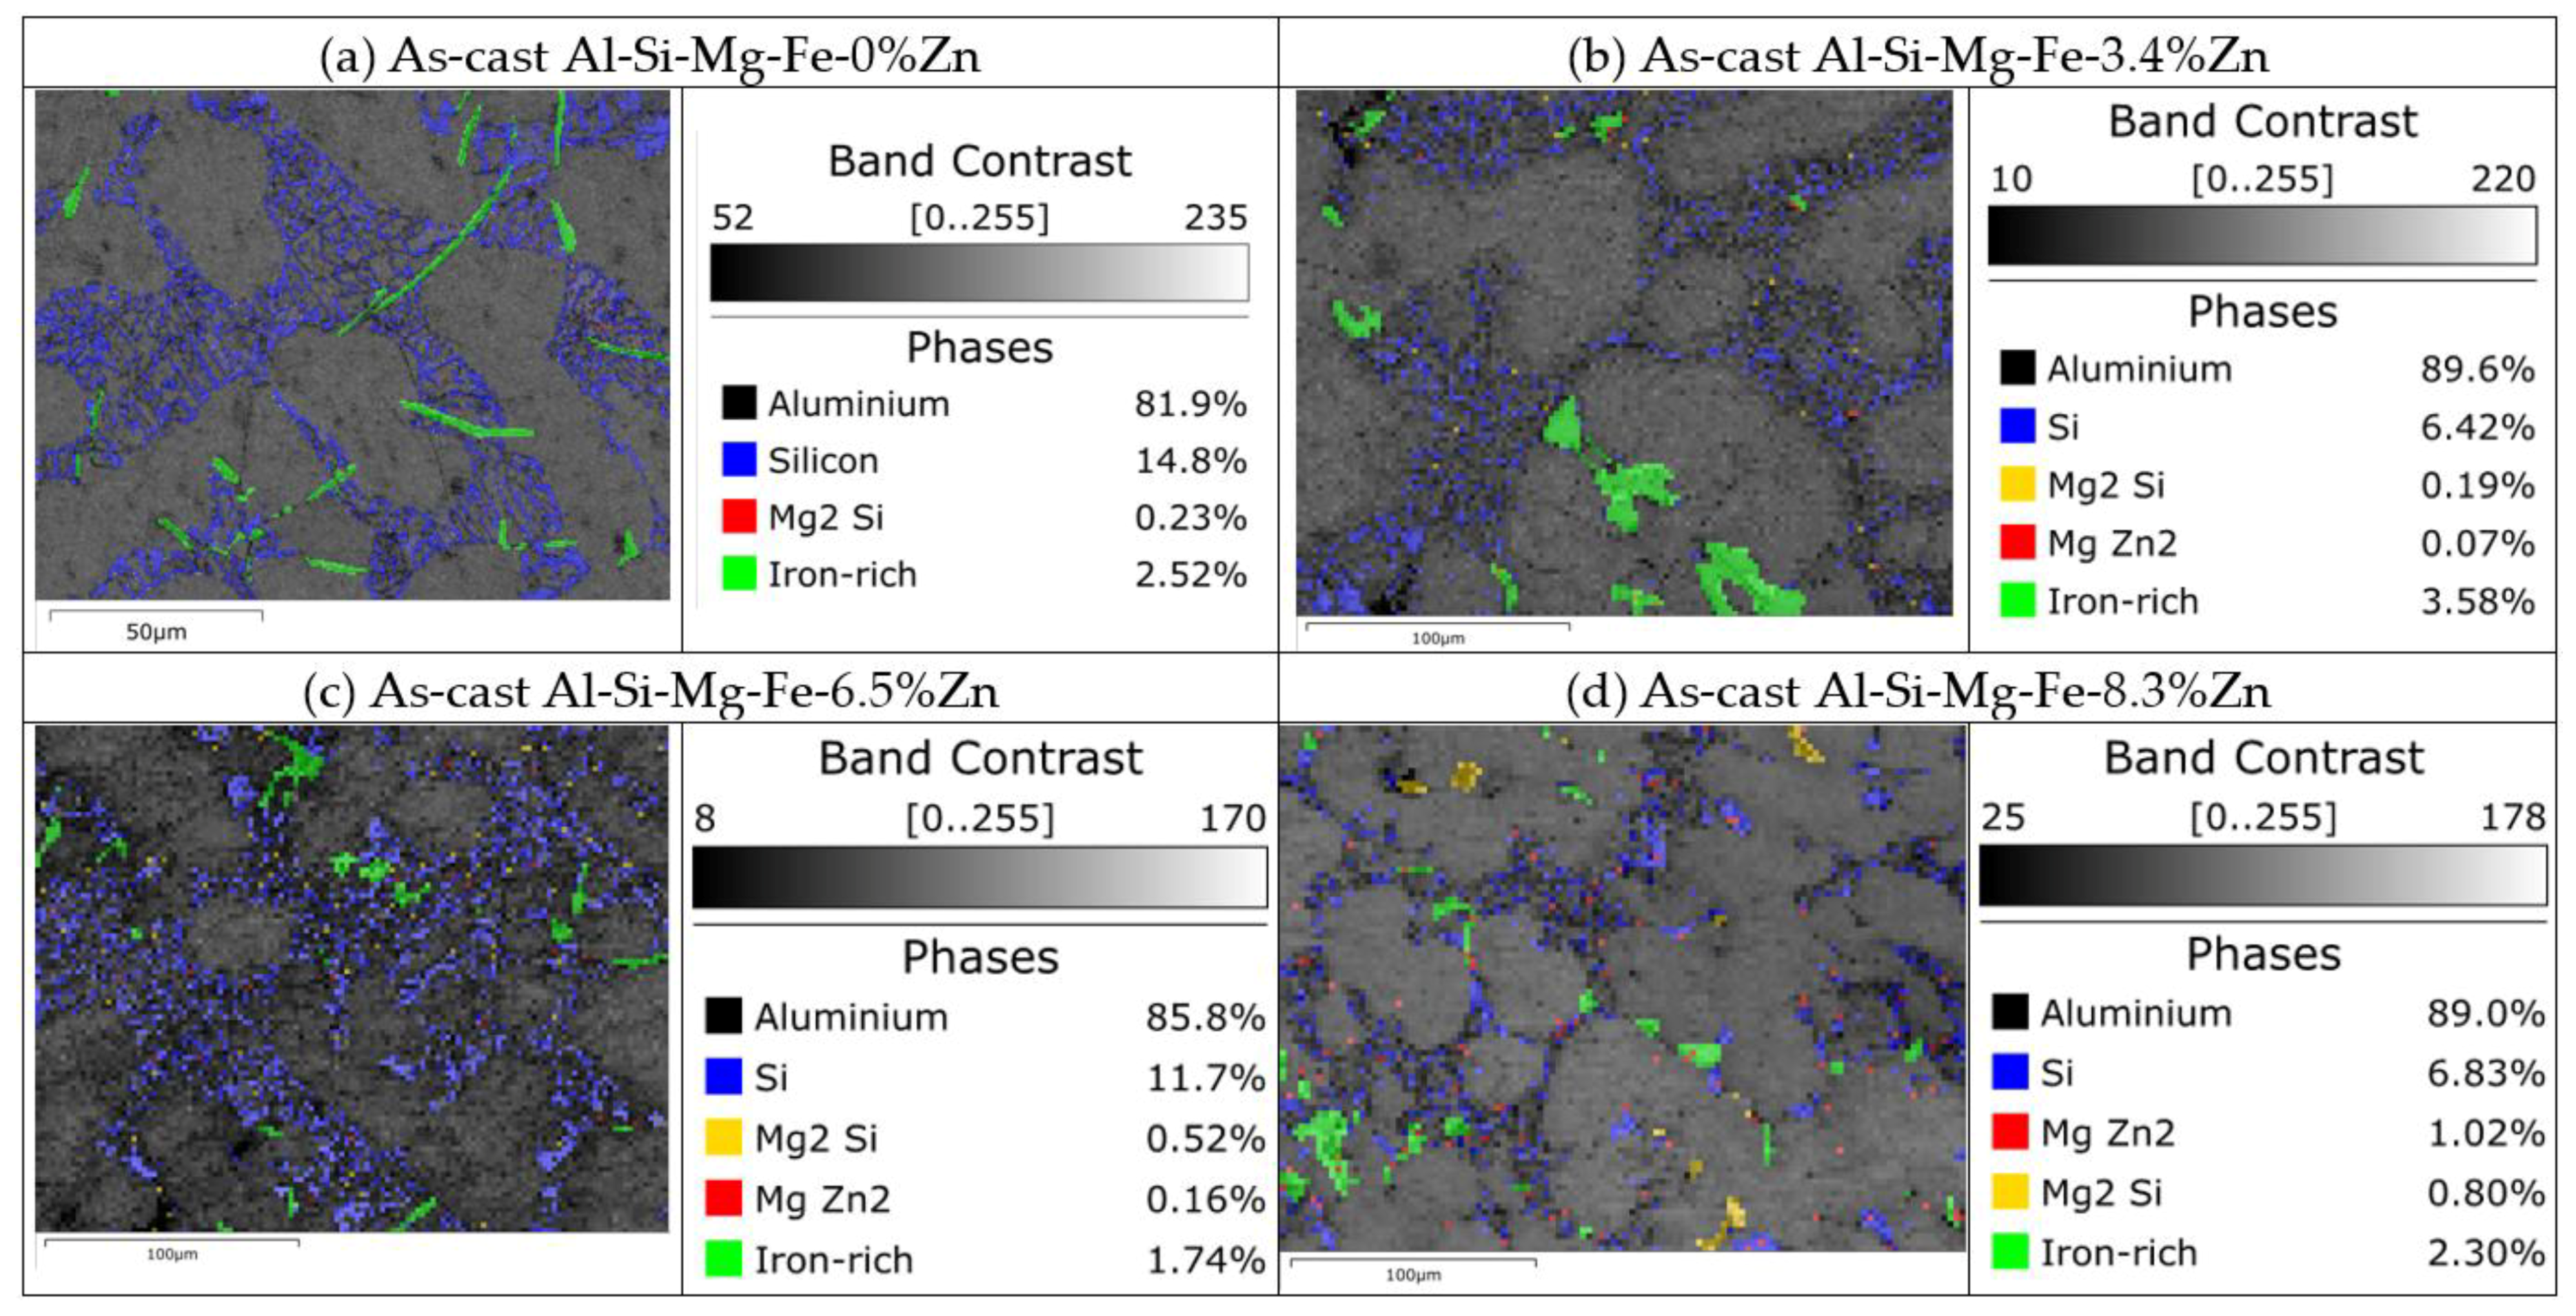
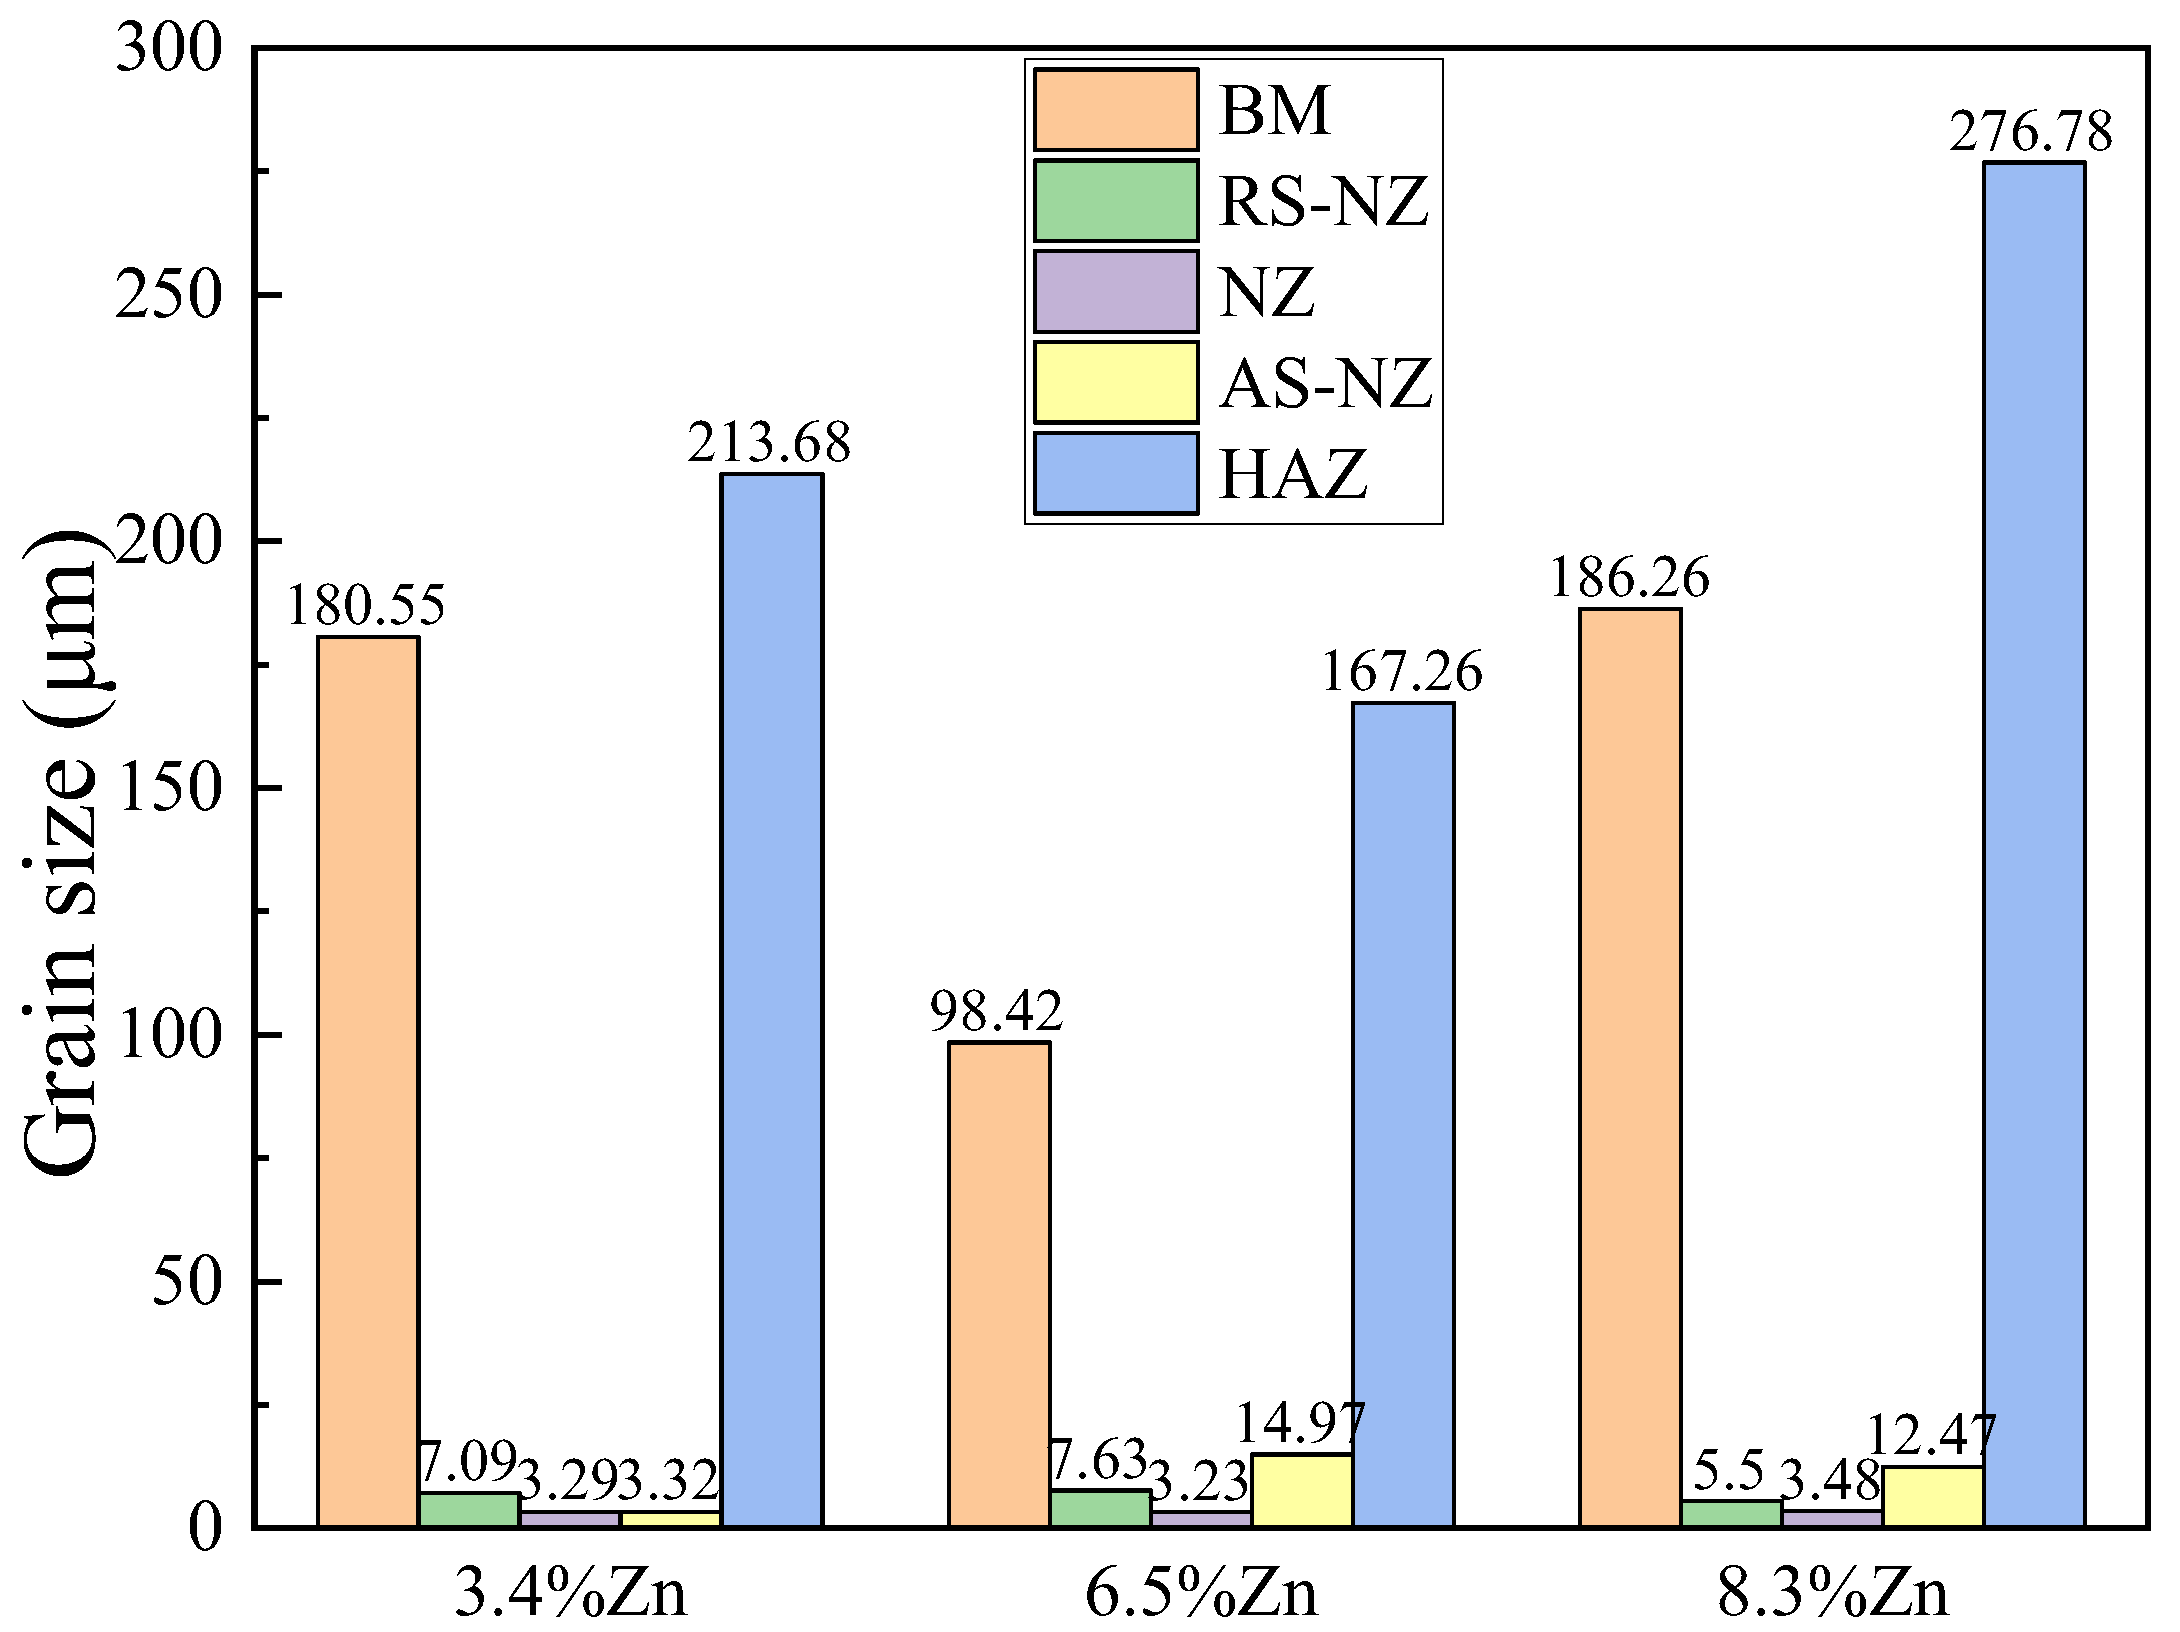
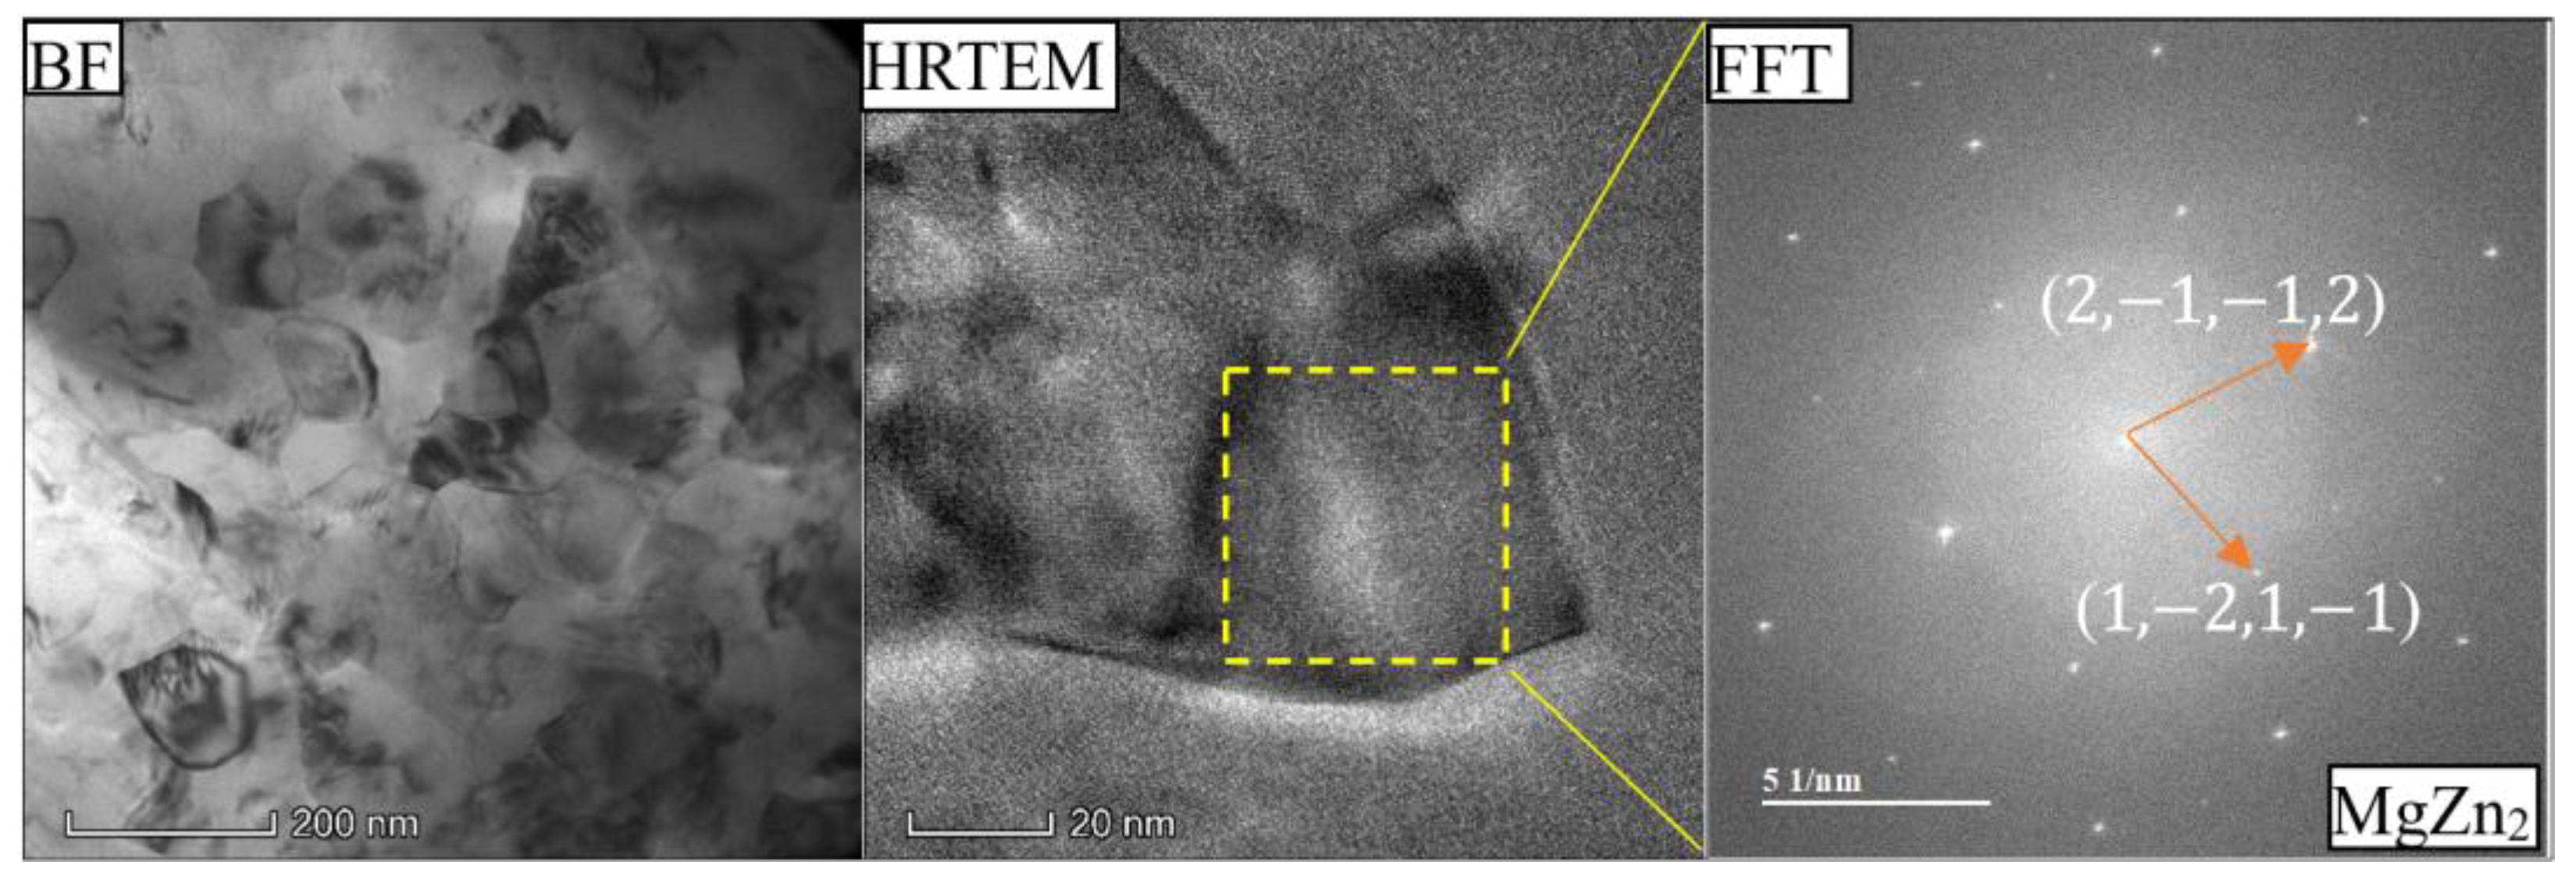
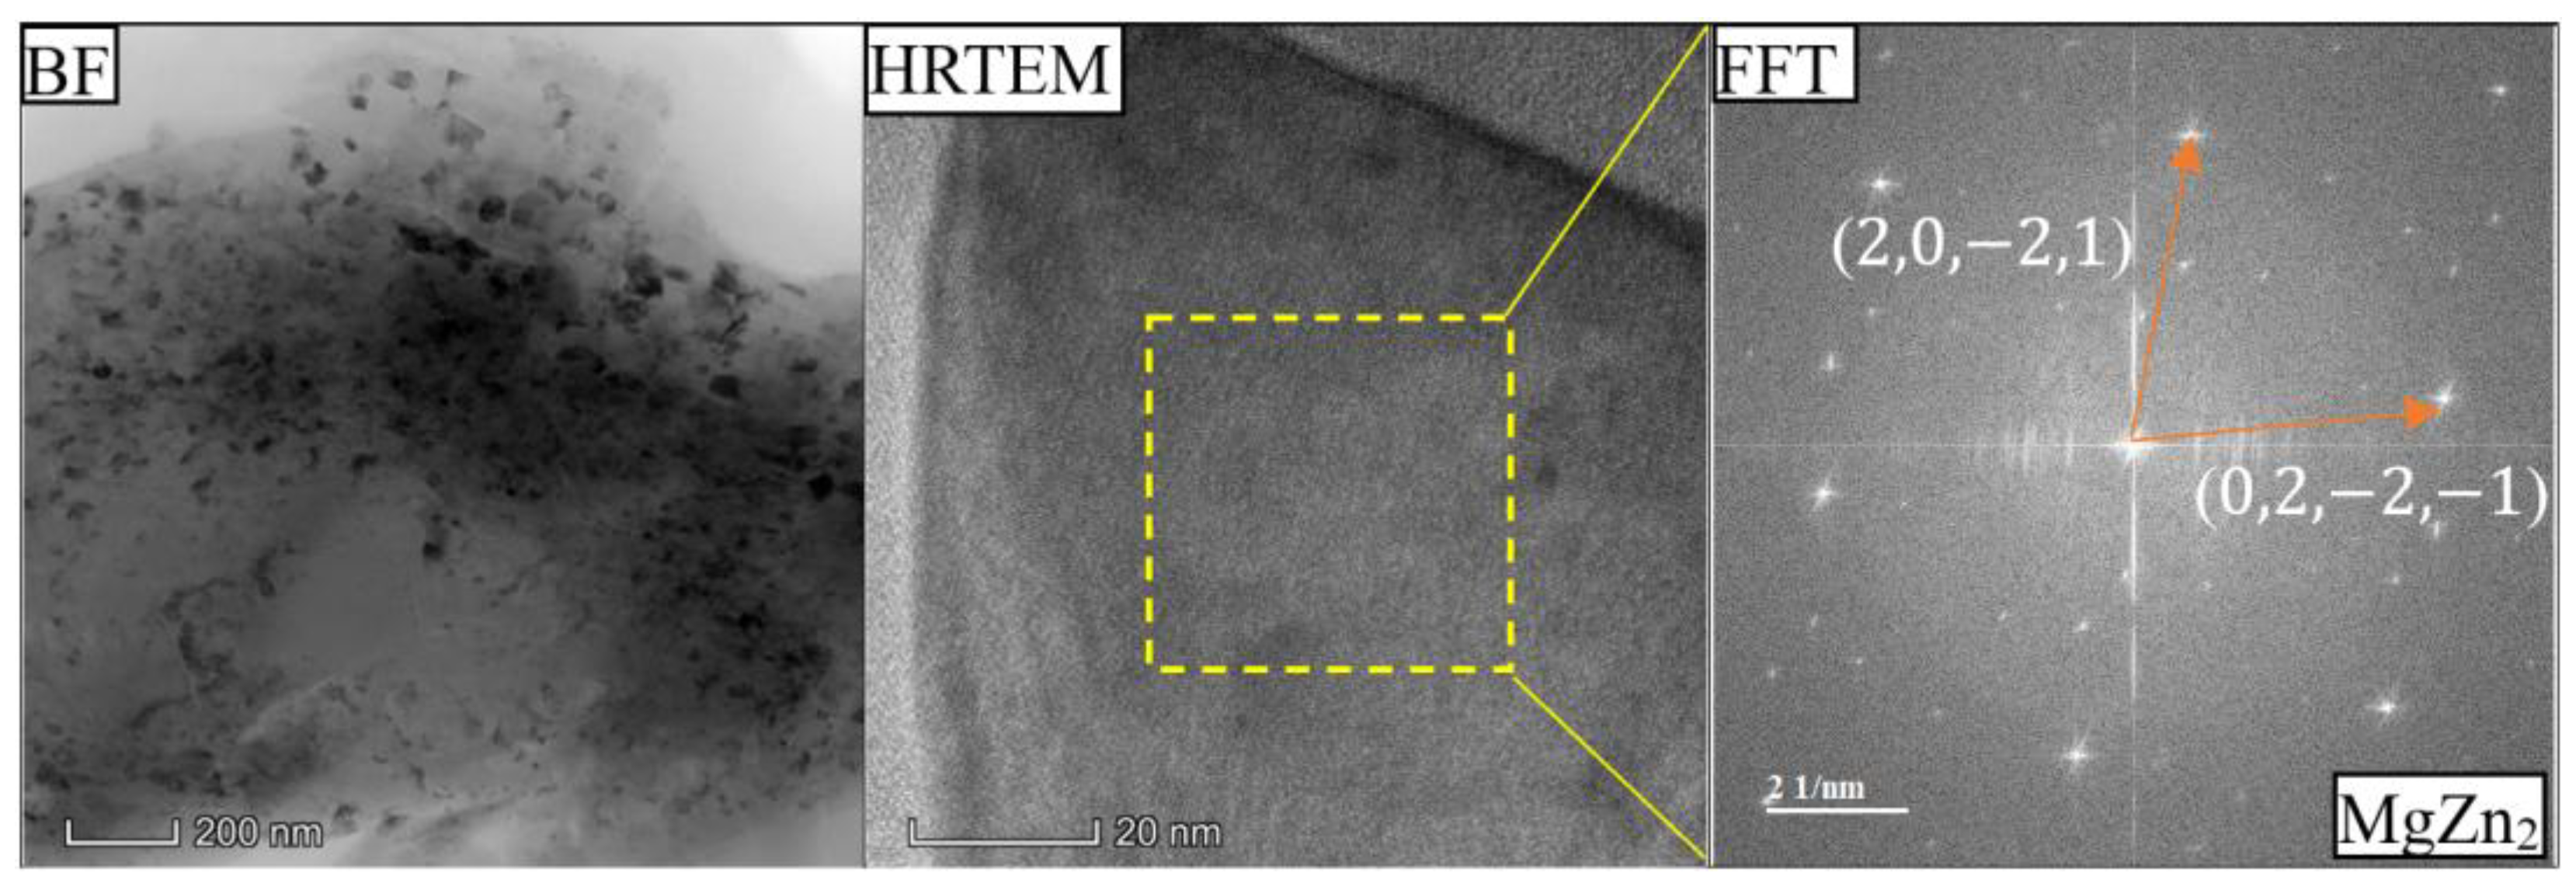
- As the Zn content increases, the melting temperature of Al-Si-Mg-Fe-Zn alloys decreases and the contents of Mg2Si and Mg2Zn increase since Zn induces their aggregation. Moreover, Fe-rich phases are finer, more evenly distributed since the addition of Zn can promote the transformation of Al6(Fe, Mn) to finer, more dispersed, and more evenly distributed α-Al12(Fe, Mn)3Si. After FSW, the MgZn2 easily dissolved in Al-Si-Mg-Fe-6.5%Zn due to its lowest melting temperature.
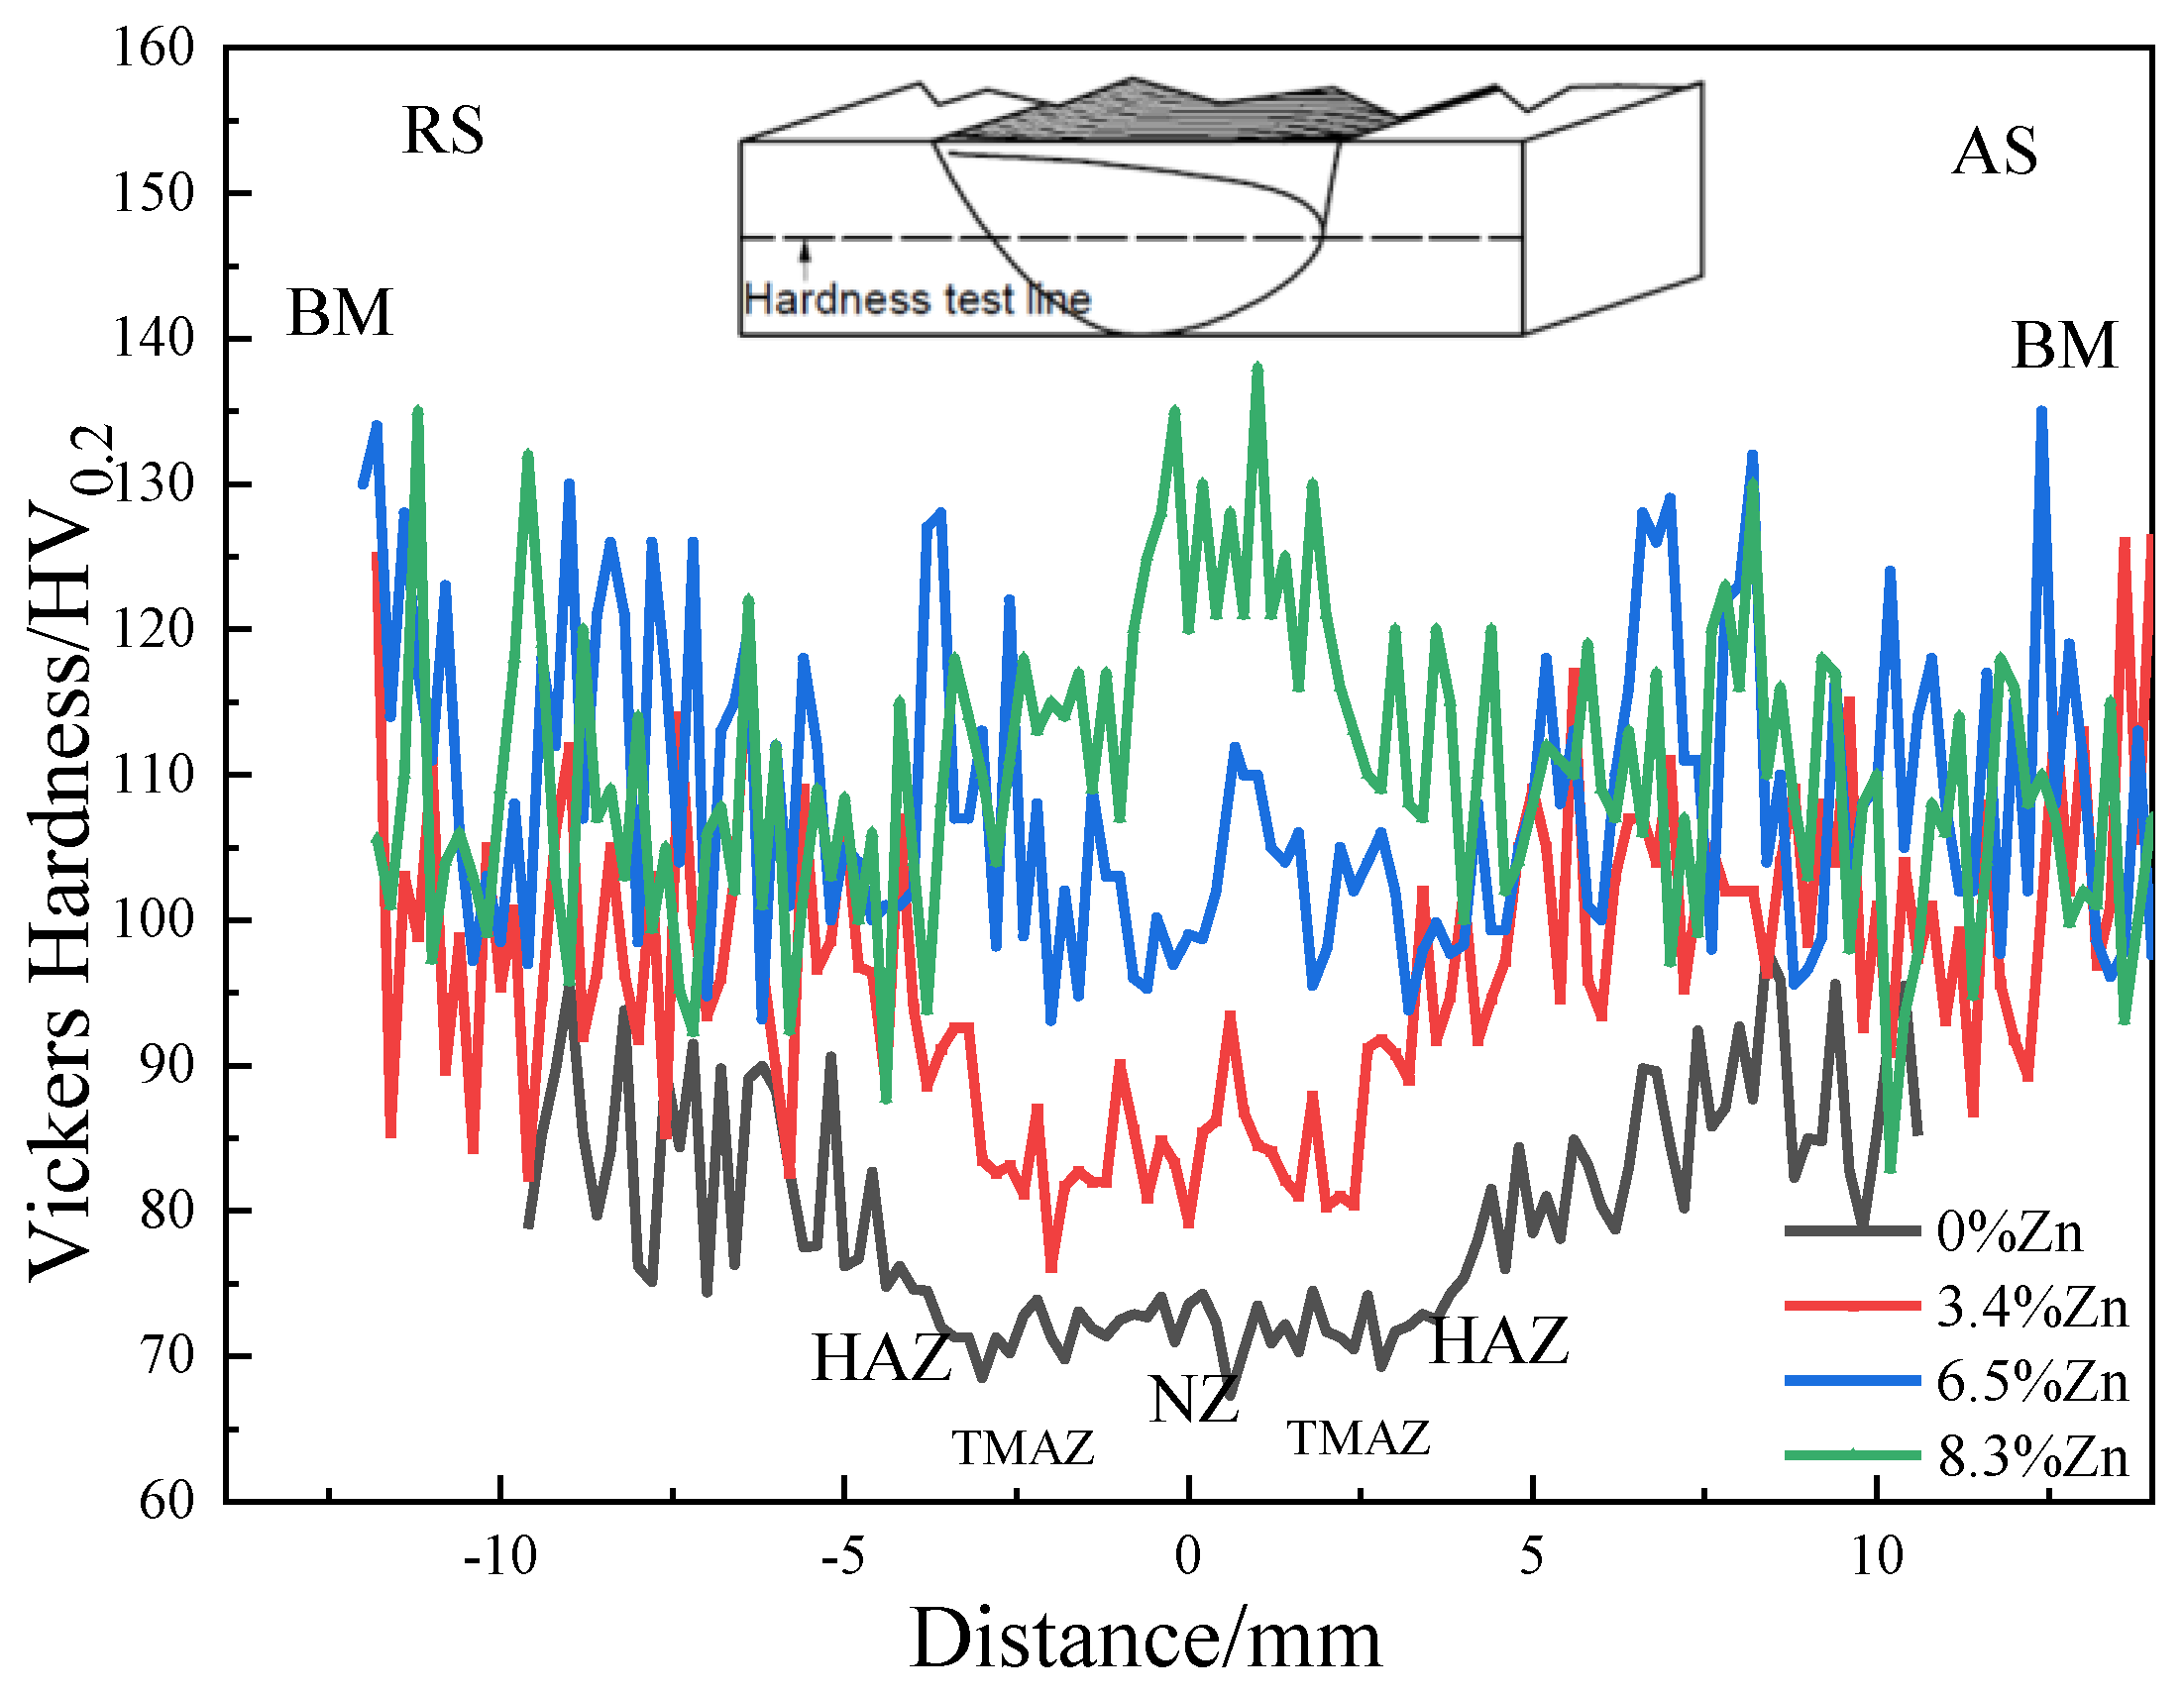
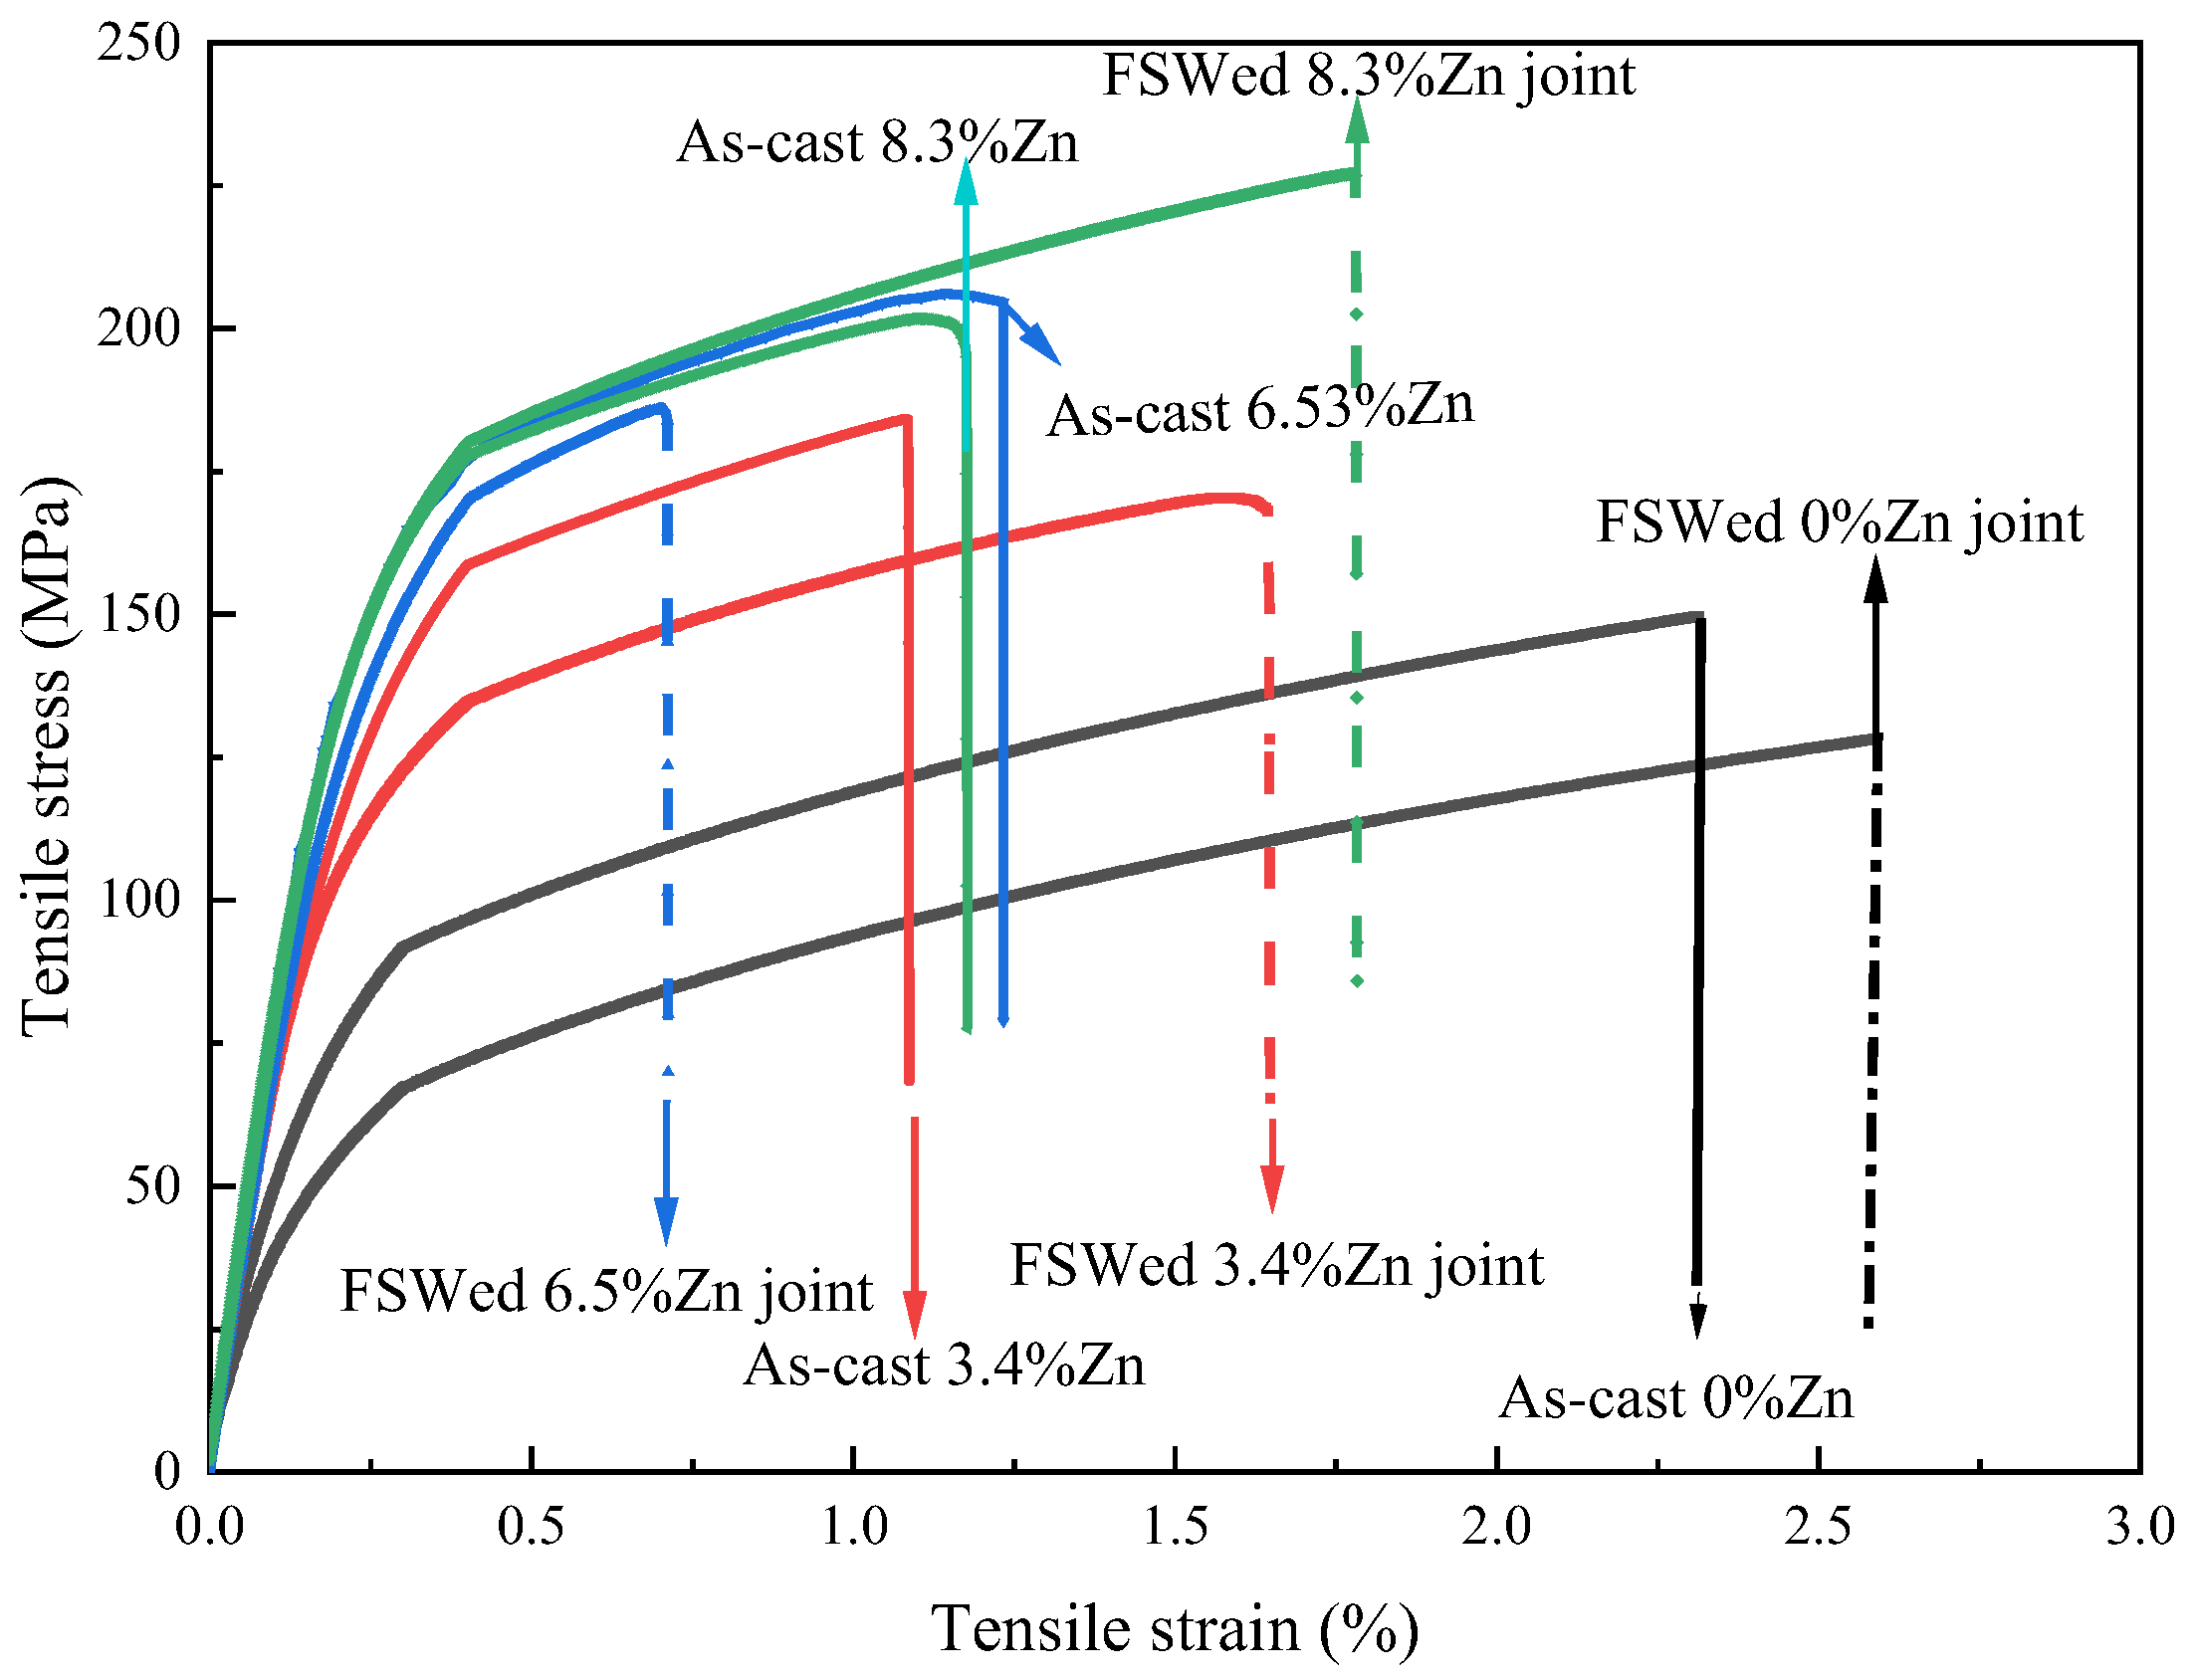
- The hardness, YS and UTS of the as-cast alloys increase a lot first then slightly decrease with the Zn content. The largest hardness (110.3 HV0.2), YS (181.1 MPa) and UTS (206.1 MPa) in the as-cast Al-Si-Mg-Fe-6.5%Zn mainly results from the smallest grain size, the largest KAM (dislocation density), the highest content of eutectic Al/Si phase, and many Mg2Si and MgZn2. While the hardness (105.8 HV0.2), YS (180.45 MPa) and UTS (201.65 MPa) in as-cast Al-Si-Mg-Fe-8.3%Zn is slightly lower.
- The softening phenomenon in the weld zone of the alloys with 3.4%Zn and 6.5%Zn is mainly due to the reduction in KAM and fewer secondary phases (Si and MgZn2). The weld zone of 8.3%Zn is harder than the base material, and its mechanical properties with hardness (116.31 HV0.2), YS (184.37 MPa) and UTS (226.93 MPa) are the highest, mainly due to refined grains and the more diffused strengthening secondary phase like MgZn2, and largest EL% (1.78%), and strength coefficient over 100% indicating that the joint can maintain the strength of the as-cast alloy.
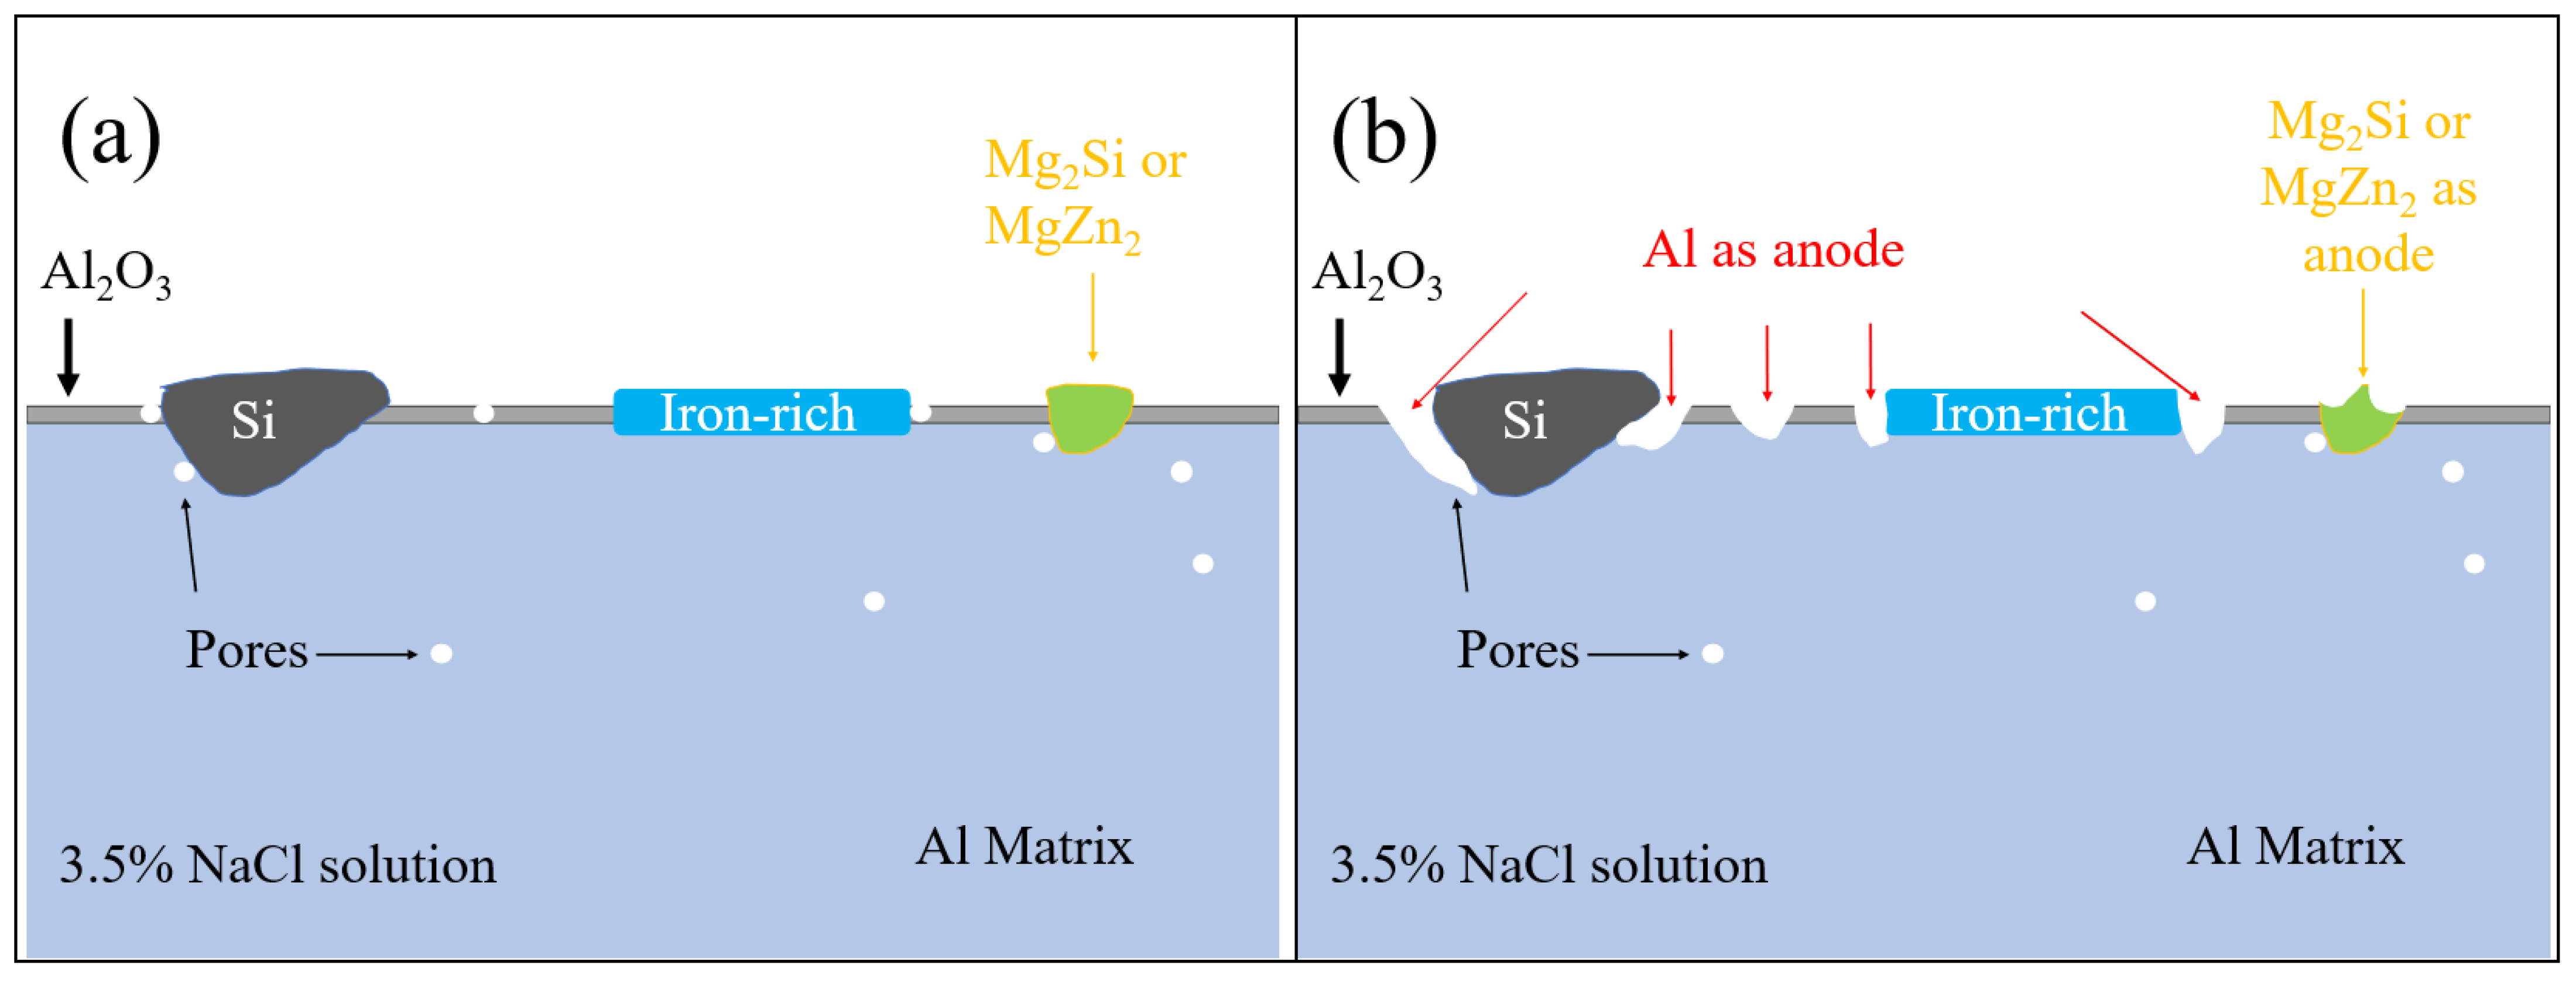
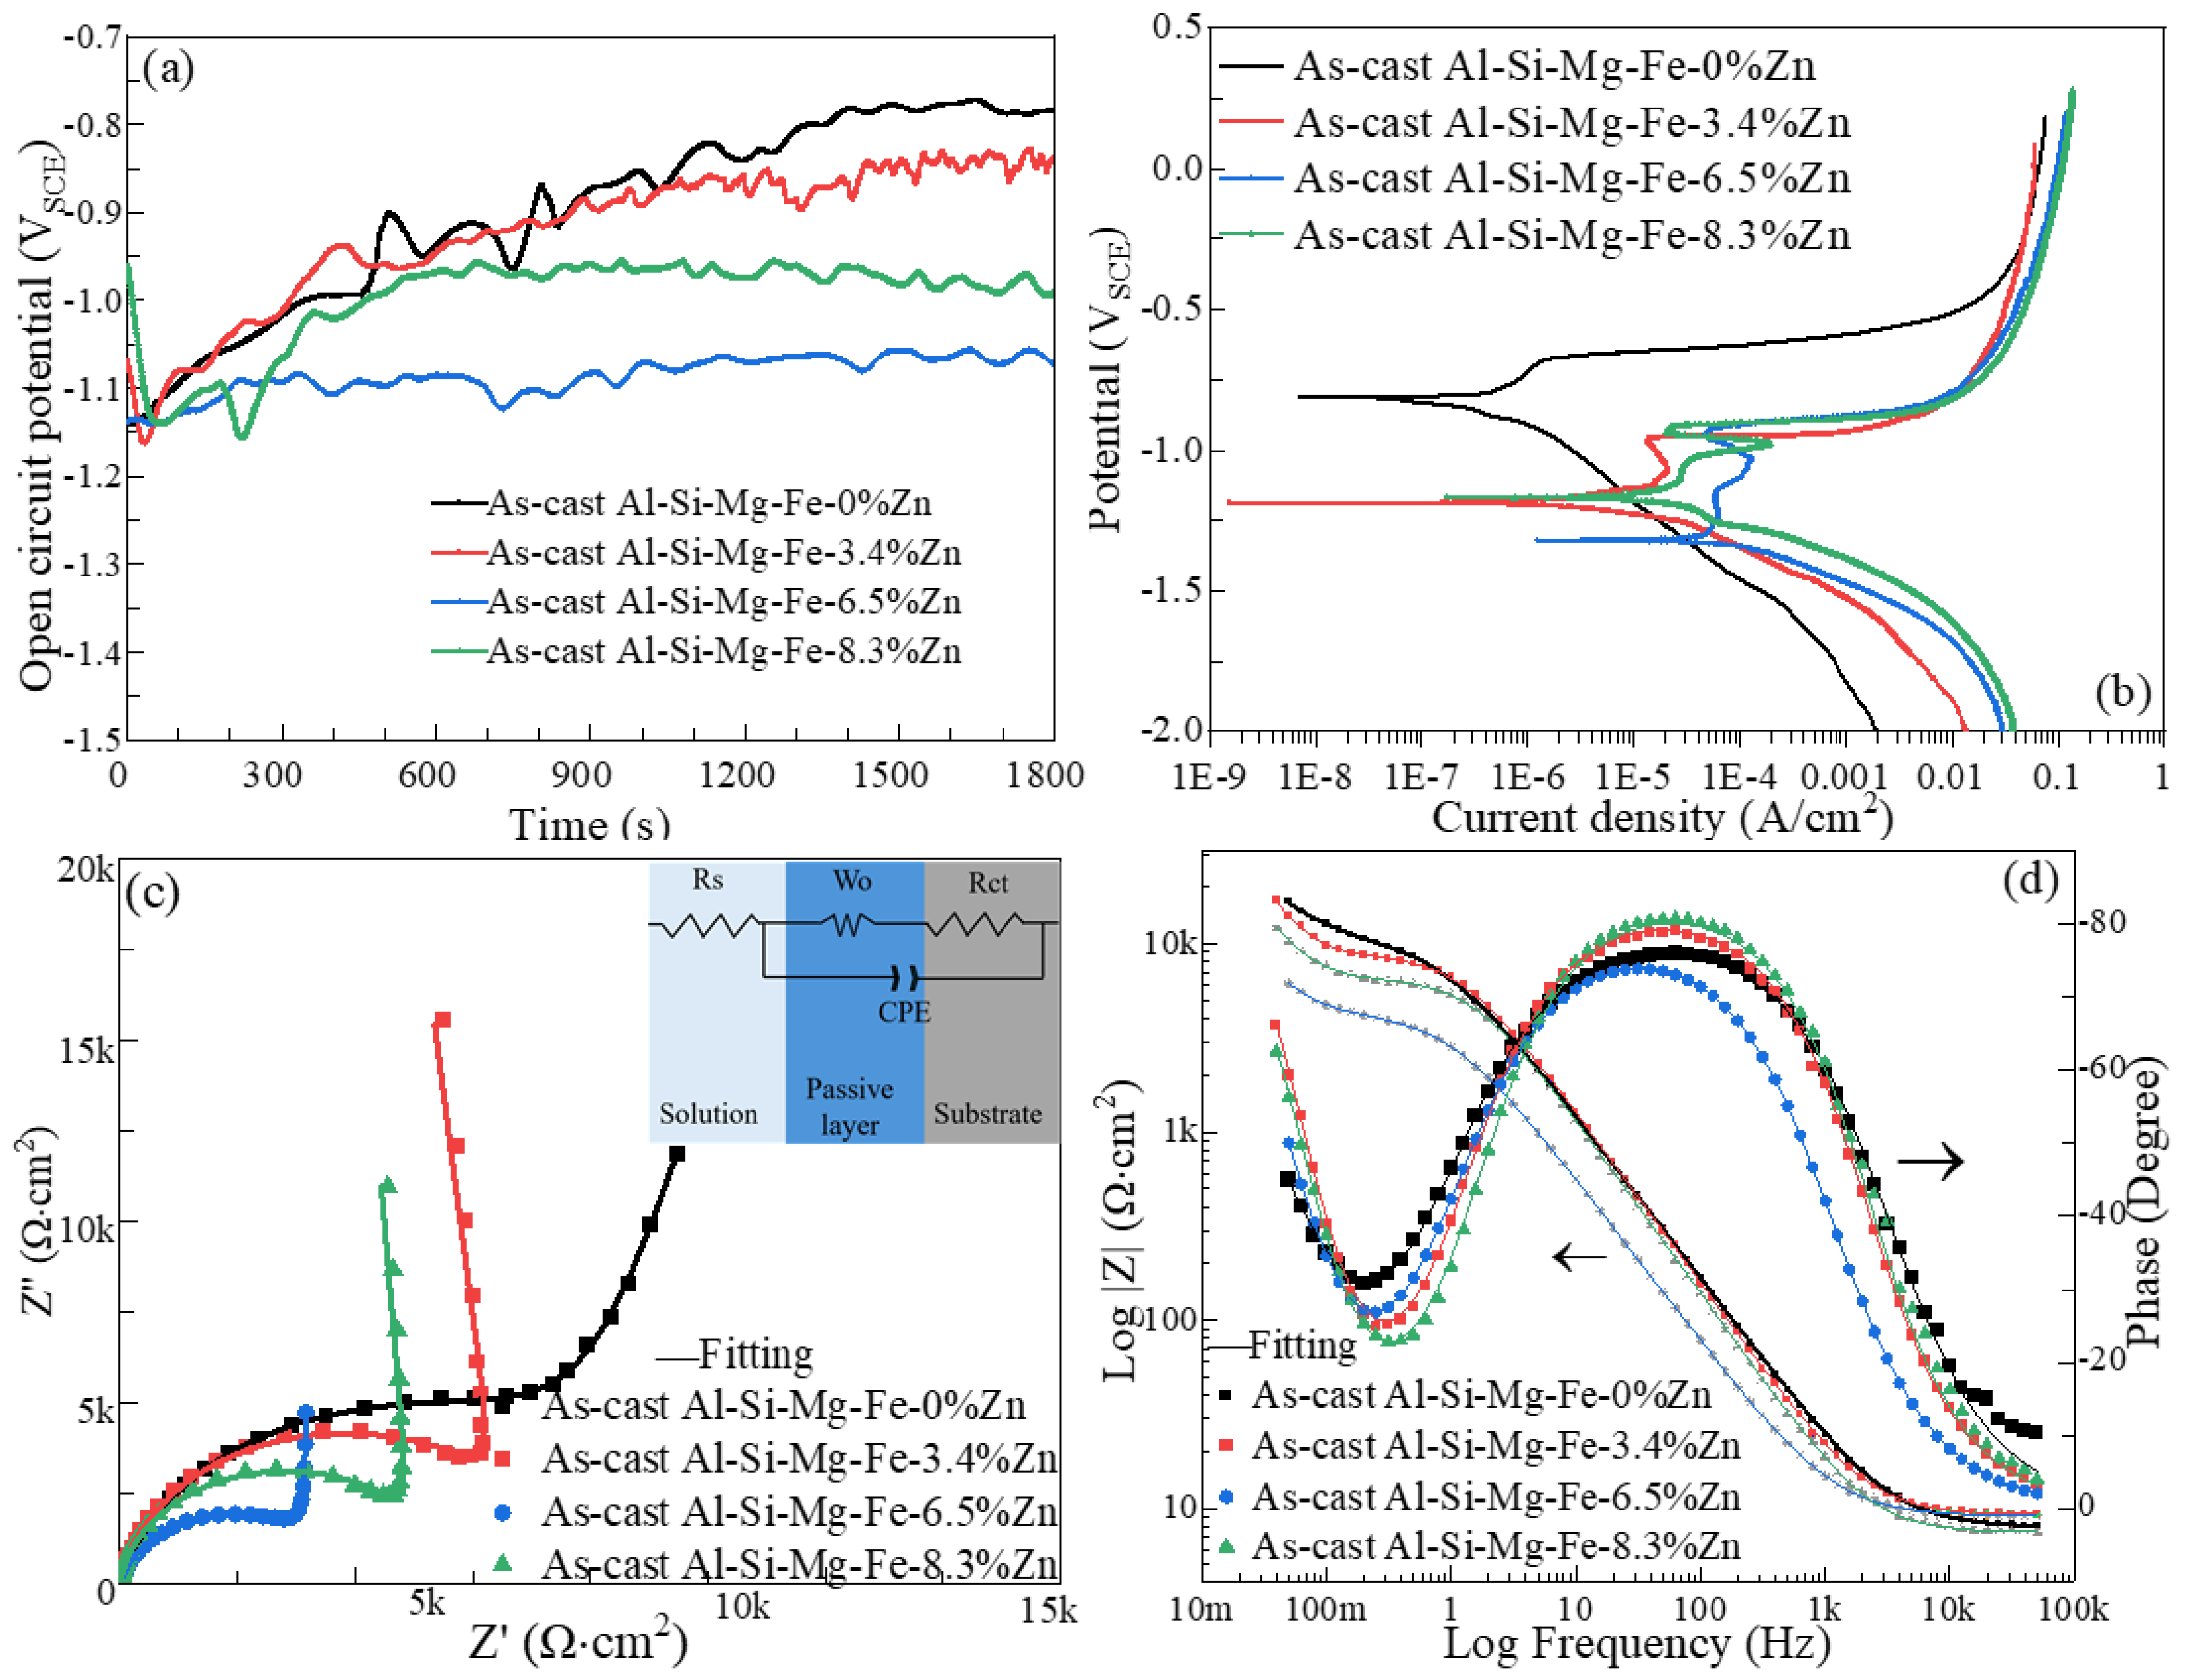
- The corrosion resistance of the as-cast Al-Si-Mg-Fe-3.4%Zn is the highest, caused by the fewest coarse and coalesce Mg2Si and MgZn2. The corrosion resistance of the as-cast Al-Si-Mg-Fe-8.3%Zn is the second one owing to the lowest KAM and least eutectic Al-Si. The corrosion resistance of the as-cast Al-Si-Mg-Fe-6.5%Zn is the lowest, attributed to the highest KAM and LAGBs, the most Si and many coarse and coalesce Mg2Si and MgZn2.
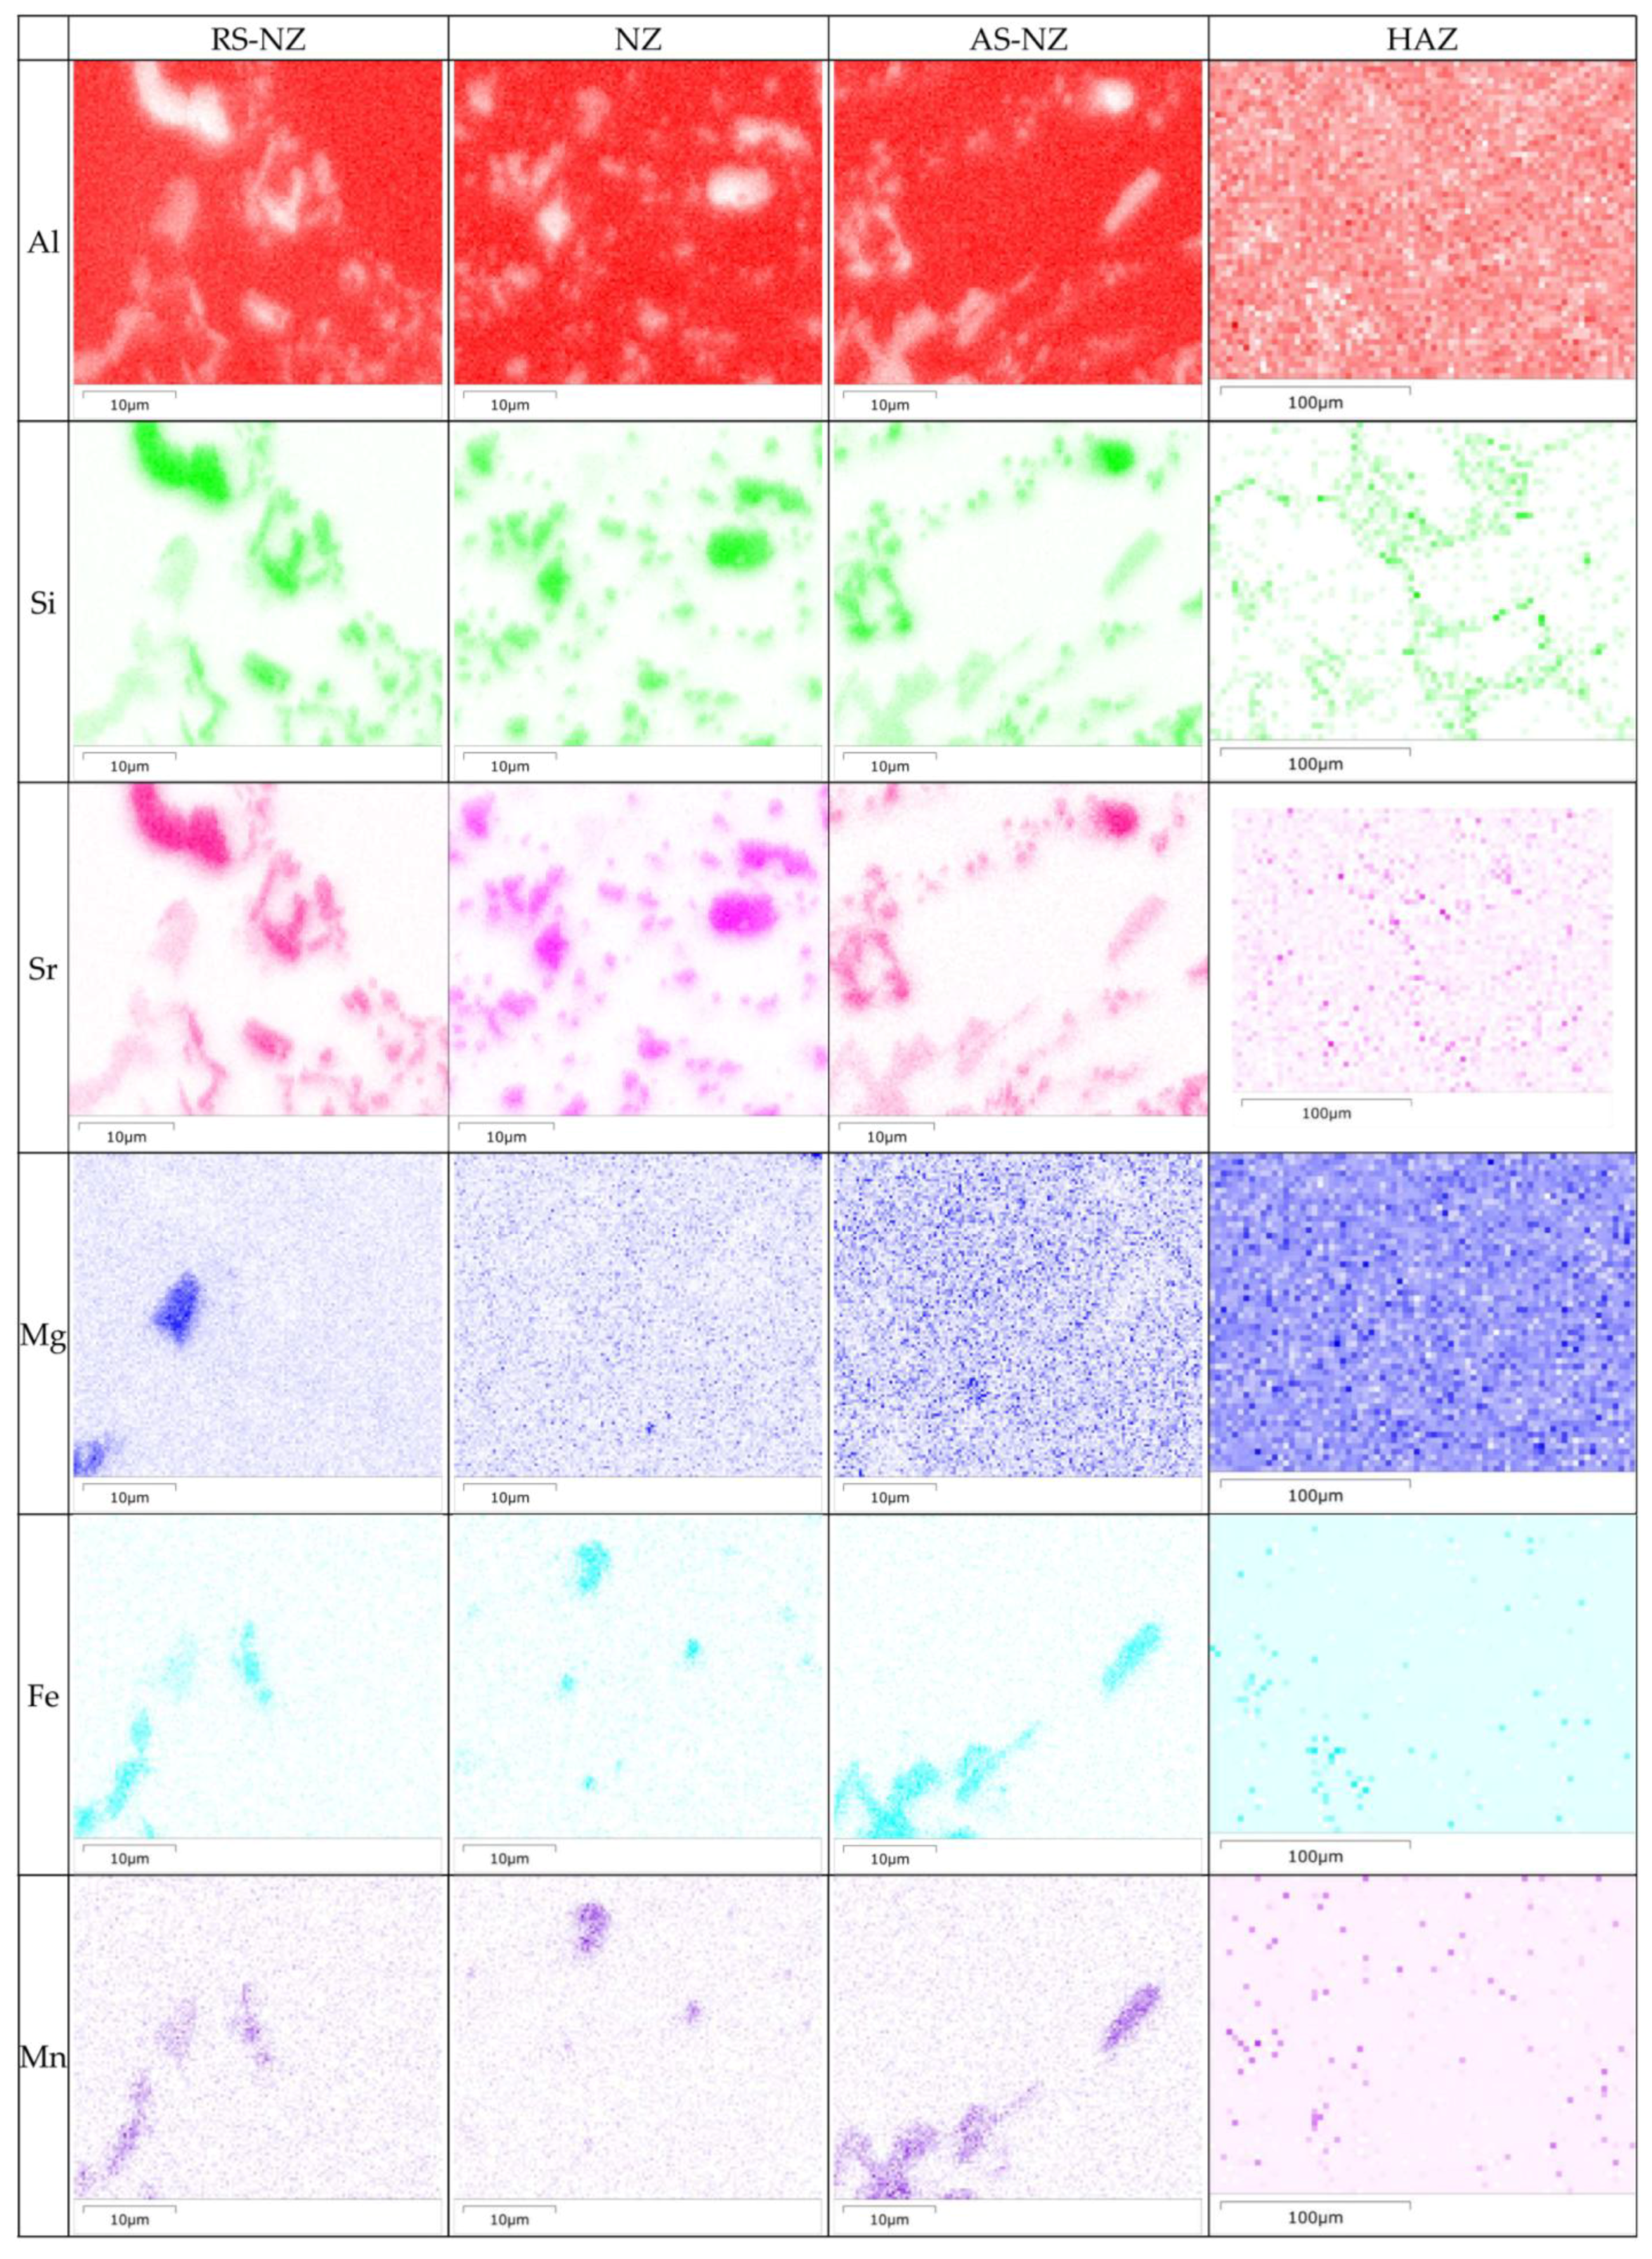
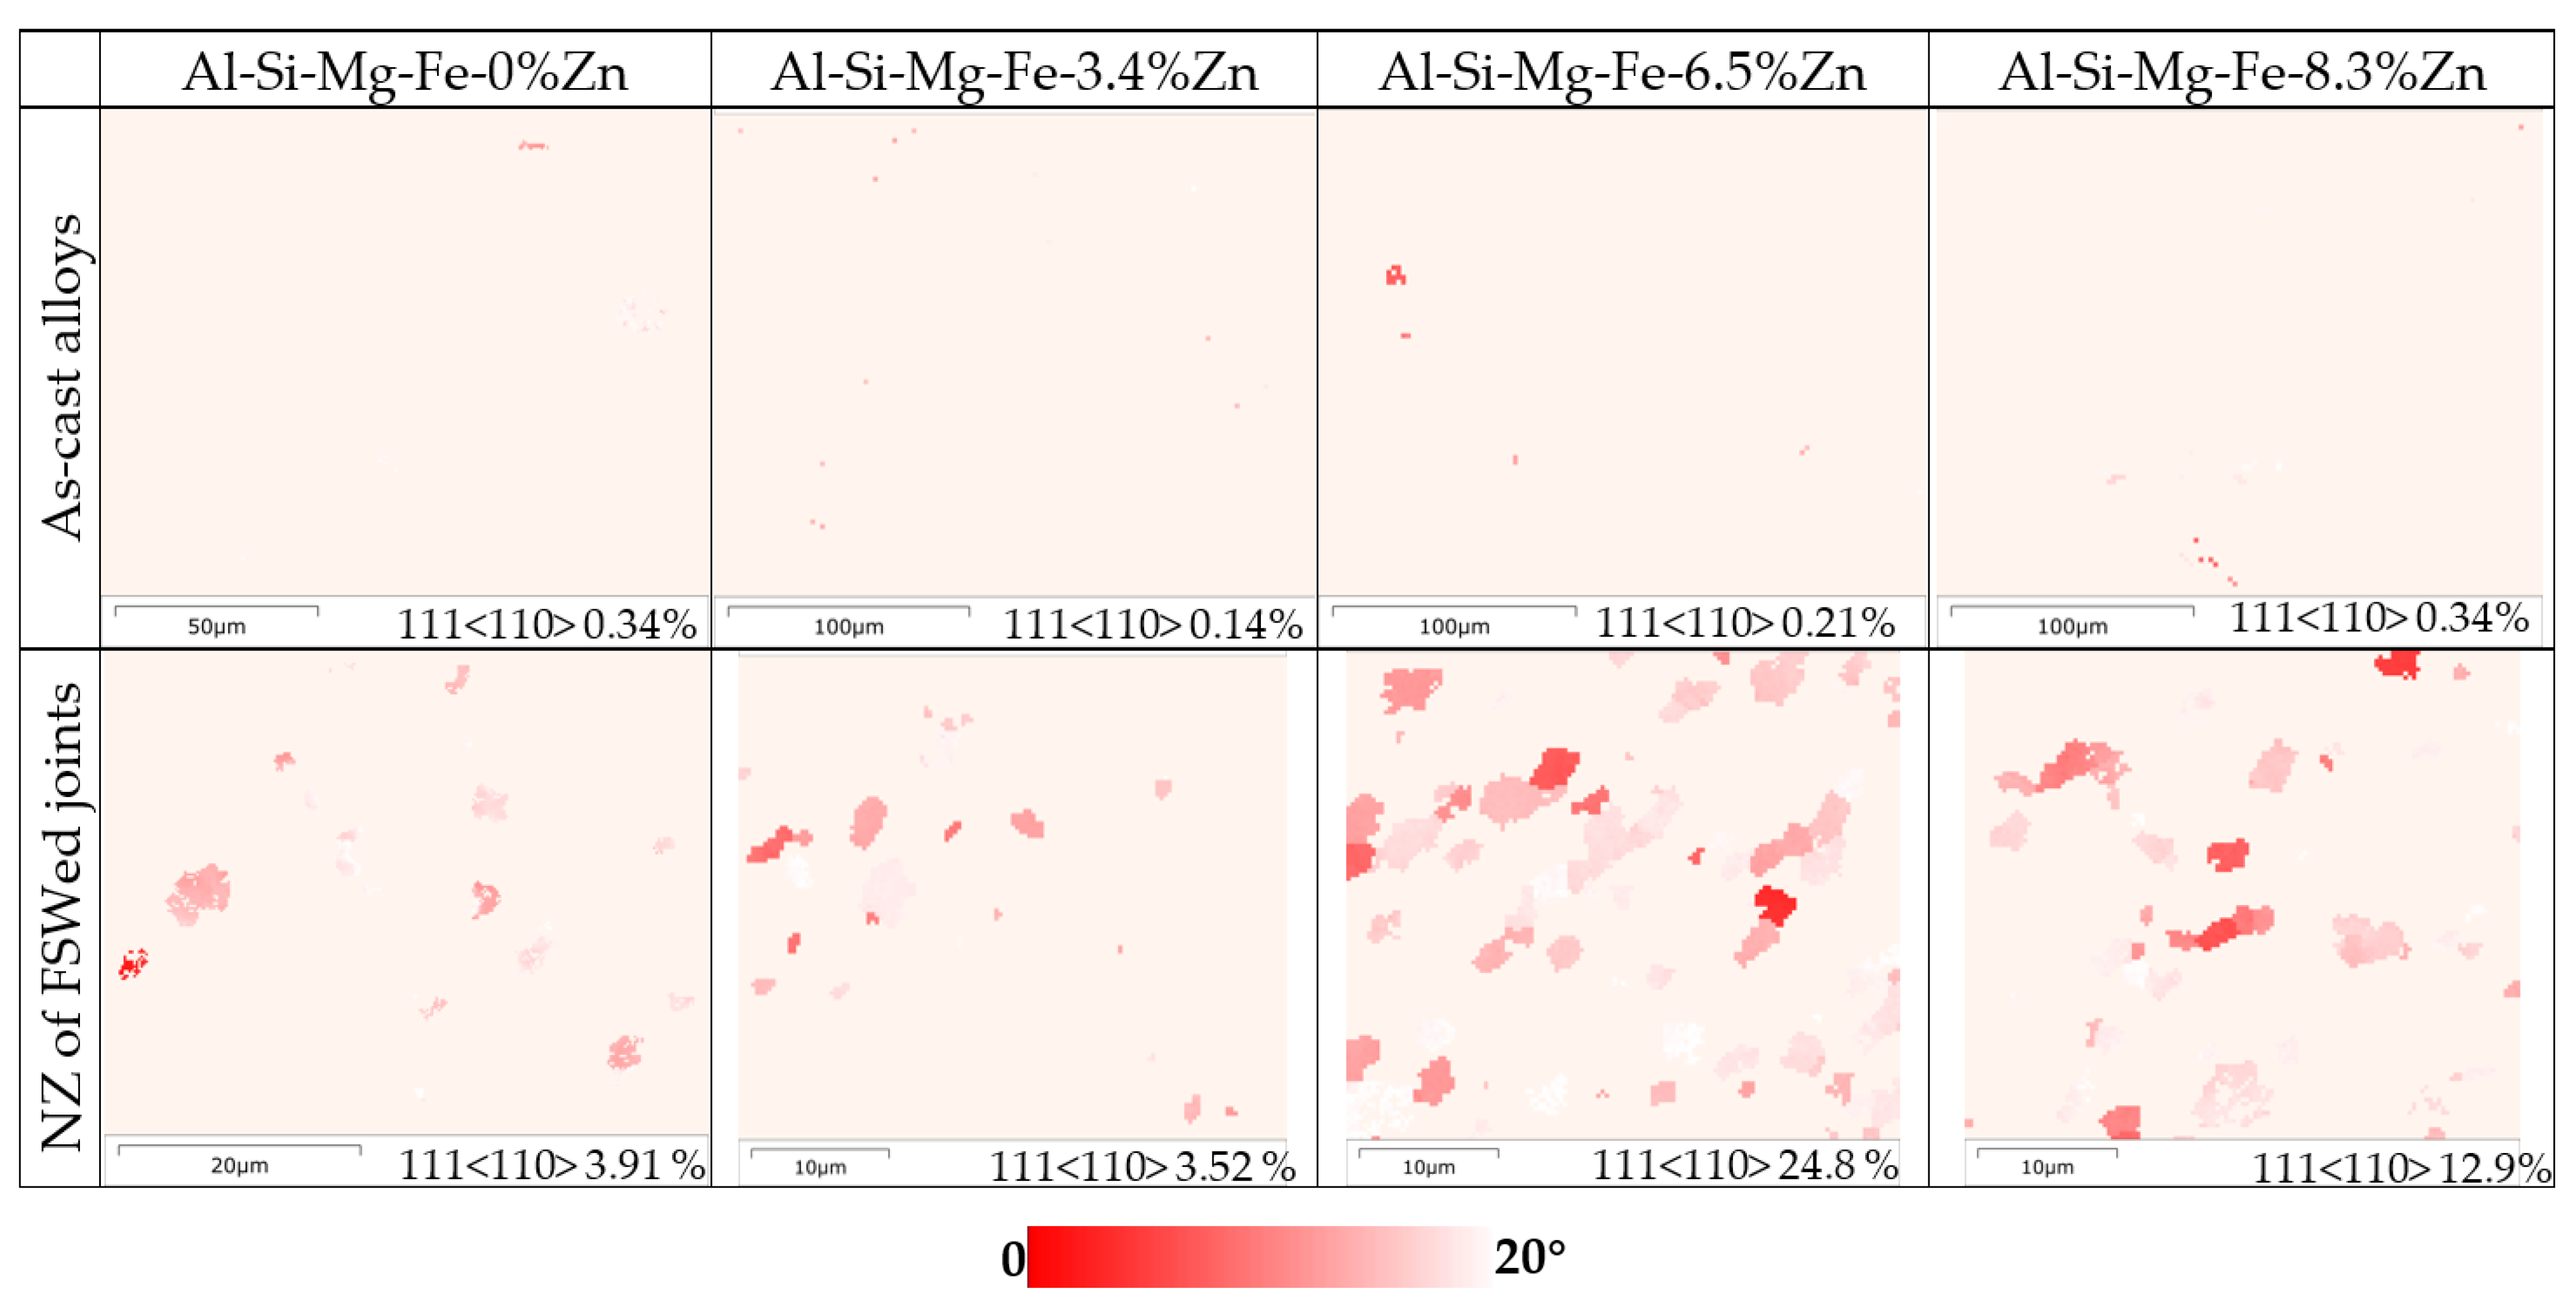
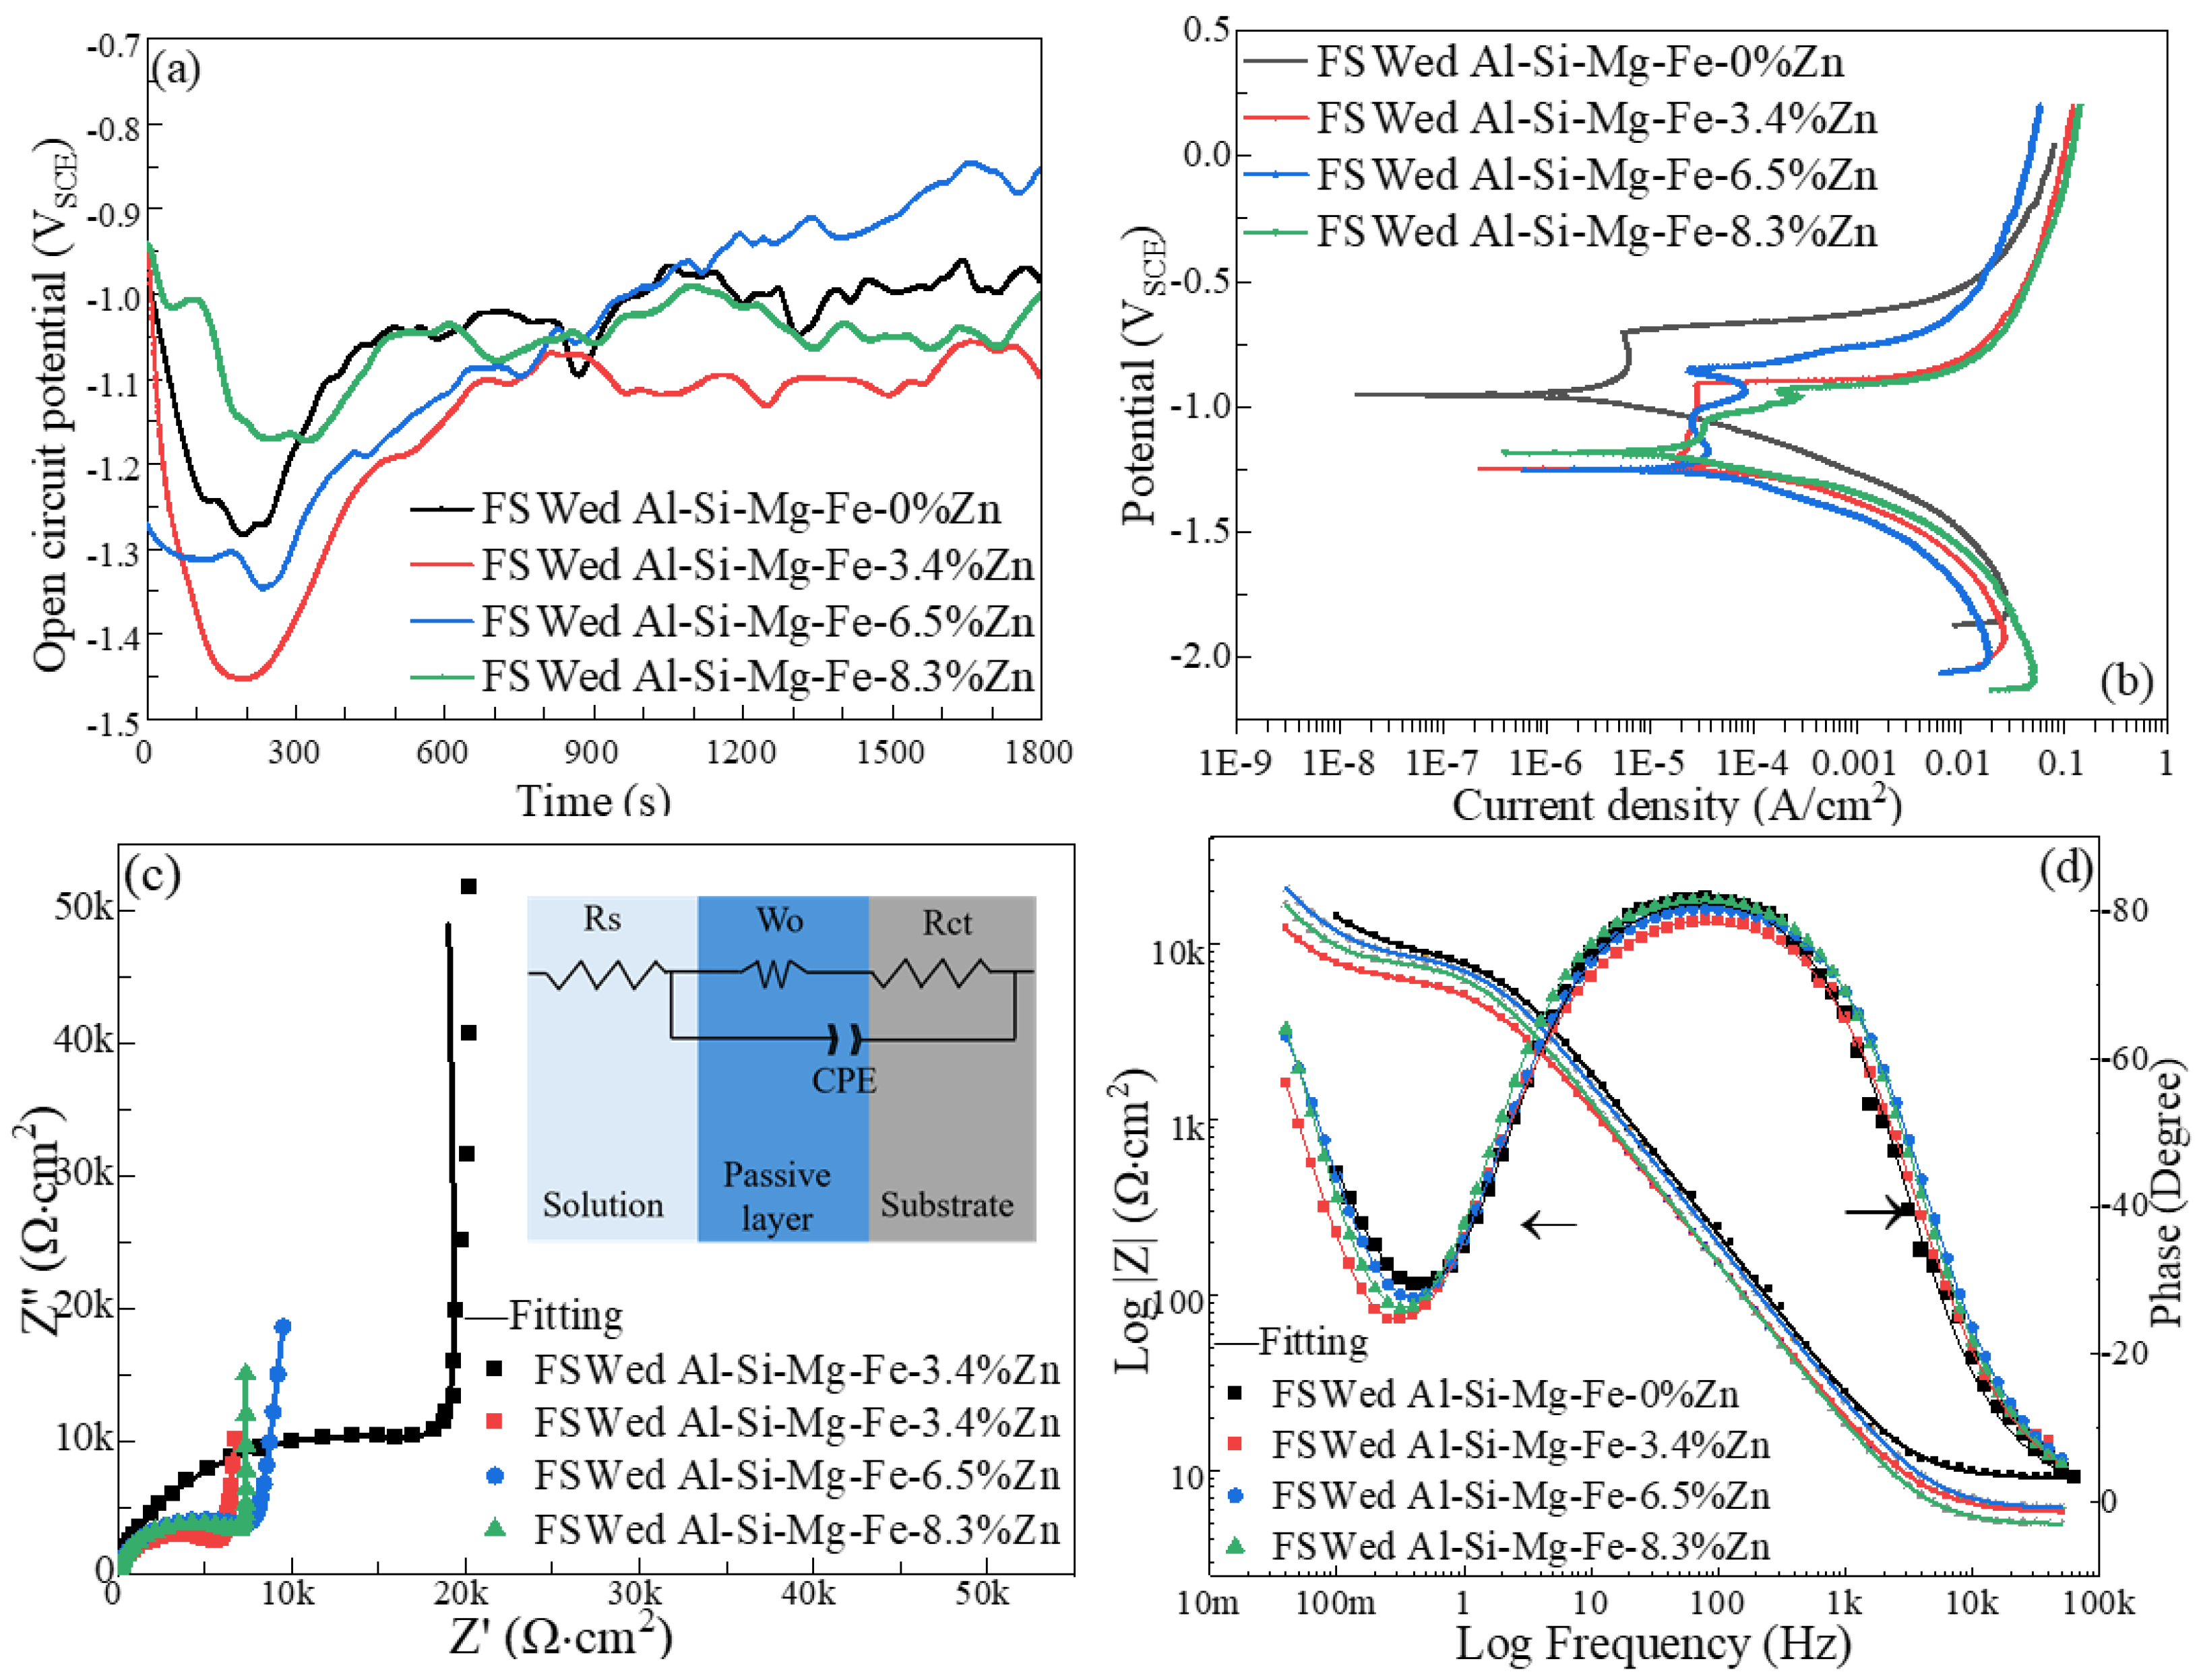
- The highest corrosion resistance of FSWed Al-Si-Mg-Fe-6.5%Zn is due to the smallest grain size and KAM, less secondary phases without MgZn2 and most {111} plane in NZ of FSWed 6.5%Zn joint. The corrosion resistance of FSWed Al-Si-Mg-Fe-8.3%Zn is also higher than the as-cast Al-Si-Mg-Fe-8.3%Zn and just slightly lower than FSWed Al-Si-Mg-Fe-6.5%Zn, which mainly caused by the refined grain size, decease of KAM, and the dispersed secondary phases and more close-packed {111} plane but the existence of many MgZn2 reduces its corrosion resistance.
Author Contributions
Funding
Institutional Review Board Statement
Informed Consent Statement
Data Availability Statement
Conflicts of Interest
Abbreviations
| ASTM | American Society of Testing and Materials |
| BIW | Boby in white |
| CE | Counter electrode |
| CR | Corrosion resistance |
| DSC | Differential thermal analysis |
| EBSD | Electron backscattered diffraction |
| Ecorr | Corrosion potential |
| EDX | Energy dispersive X-ray spectrometer |
| EIS | Electrochemical impedance spectroscopy |
| Epit | Pitting potential |
| FSW | Friction stir welding |
| HAZ | Heat-affected zone |
| HV | Vickers hardness |
| Icorr | Corrosion current density |
| KAM | Kernel average misorientation |
| NZ | nugget zone |
| OCP | Open circuit potential |
| RE | Reference electrode |
| SCE | Saturated calomel electrode |
| SEM | Scanning electron microscope |
| TEM | Transmission electron microscopy |
| TMAZ | Thermo-mechanically affected zone |
| UTS | Ultimate tensile stress |
| WE | Working electrode |
| XPS | X-ray photoelectron spectroscopy |
| XRD | X-ray diffractometer |
| YS | Yield stress |
Appendix A


References
- Ersoy, E.; Schaffer, M.E.; Ditzen, J. BP Statistical Review of World Energy, 68th ed.; British Petroleum Company: London, UK, 2019; pp. 2–60. [Google Scholar]
- Luo, A.; Sachdev, A.; Powell, B. Advanced casting technologies for lightweight automotive application. Casting 2011, 60, 113–119. [Google Scholar]
- Hirsch, J. Recent development in aluminium for automotive applications. Trans. Nonferrous Met. Soc. China 2014, 24, 1995–2002. [Google Scholar] [CrossRef]
- Zhang, D.D.; Liu, Y.B.; Zhang, R.H. Research on Die Casting Process of AlSi9Cu Aluminum Alloy for Automobile. Hot Work. Technol. 2023, 52, 75–78. [Google Scholar] [CrossRef]
- Li, Y.Y.; Zhang, W.W.; Zhao, H.; You, D.D.; Zhang, D.T.; Shao, M.; Zhang, W. Research progress on squeeze casting in China. China Foundry 2014, 11, 239–246. [Google Scholar]
- Tian, R.Z. Cast Aluminum Alloys; Central South University Press: Changsha, China, 2006; pp. 178–251. [Google Scholar]
- Belmares-Perales, S.; Castro-Román, M.; Herrera-Trejo, M.; Ramírez-Vidaurri, L.E. Effect of cooling rate and Fe/Mn weight ratio on volume fractions of α-AlFeSi and β-AlFeSi phases in Al–7.3Si–3.5Cu alloy. Met. Mater. Int. 2008, 14, 307–314. [Google Scholar] [CrossRef]
- Kral, M.V.; McIntyre, H.R.; Smillie, M.J. Identification of intermetallic phases in a eutectic Al–Si casting alloy using electron backscatter diffraction pattern analysis. Scr. Mater. 2004, 51, 215–219. [Google Scholar] [CrossRef]
- Yang, C. Study on the Behavior and Mechanism of Mn Inhibiting the Corrosion Effect of Impurity Fe in Mg Alloys. Master’s Thesis, Northeastern University, Shenyang, China, 2020. [Google Scholar]
- Che, Y.; Zhang, Z.K.; Men, S.Q.; Li, X.; Chen, K.; Xu, G.Y.; Li, R.H.; Zhu, S.Y. The Influence of Sr Modification on the Mechanical Property and Microstructure of Cast Aluminum Alloy. J. Guizhou Univ. (Nat. Sci.) 2011, 28, 39–48. [Google Scholar] [CrossRef]
- Zhao, H.L.; Zhou, J.X.; Tang, S.Q.; Wang, J.W.; Zhang, L.L.; Chen, Y.F.; Li, C.L.; Wu, J.H. Impact of Sr content on microstructure and mechanical properties of A356 alloy. Shandong Sci. 2016, 29, 65–69. [Google Scholar] [CrossRef]
- Maxwell, I.; Hellawell, A. An analysis of the peritectic reaction with particular reference to Al-Ti alloys. Acta Metall. 1975, 23, 901–909. [Google Scholar] [CrossRef]
- Huang, J.H.; Sun, M.; Zhang, Y.Y.; Weng, Q.L.; Chen, Z.W.; Ma, Q.C.; CAI, D.L. Research progress of grain refinement behavior of Al-Ti-B in Al-Si alloys. Nonferrous Met. Mater. Eng. 2022, 43, 47–60. [Google Scholar] [CrossRef]
- Crossley, F.A.; Mondolfo, L.F. Mechanism of Grain Refinement in Aluminum Alloys. JOM 1951, 3, 1143–1148. [Google Scholar] [CrossRef]
- Zhang, G.Q.; Song, R.B.; Liu, J.Y.; Zhao, S.; Cai, C.H. Effect of Mg content on structure and corrosion behavior of novel hot-dip Al-Zn-Si-rE-Mg coatings. Mater. Lett. 2022, 328, 133098. [Google Scholar] [CrossRef]
- Gu, W.L.; Lu, C.X.; Zhou, P.F. Effect of Mg Addition on Microstructure Modification of Hypereutectic Al-Si Alloy. Foundry 2021, 70, 921–927. [Google Scholar]
- Yang, W.C.; Shen, W.W.; Zhang, R.R.; Cao, K.L.; Zhang, J.; Liu, L. Enhanced age-hardening by synergistic strengthening from MgSi and MgZn precipitates in Al-Mg-Si alloy with Zn addition. Mater. Charact. 2020, 169, 110579. [Google Scholar] [CrossRef]
- Gong, W.Y.; Xie, M.J.; Wu, Y.; Zhang, J.S. Synergistic strengthening by β′′ and η’ phases in Al-Mg-Si-Cu-Zn alloys. Mater. Lett. 2022, 308, 131213. [Google Scholar] [CrossRef]
- Song, D.F.; Zeng, Q.; Jia, Y.W.; Xiang, J.F.; Zhang, W.W. Effects of Zn Content on the Aging Precipitation Behavior of Mg2Si in Al-Si-Mg Alloy. Spec. Cast. Nonferrous Alloys 2022, 42, 323–329. [Google Scholar] [CrossRef]
- Shi, J.C.; Luo, H.J.; Yao, G.C. Effect of Zn on Microstructure and Mechanical Properties of 5083 Alloy. J. Northeast. Univ. Nat. Sci. 2017, 38, 950–954. [Google Scholar] [CrossRef]
- Cao, L.Y.; Cai, Y.H.; Cui, H.; Zhang, J.S. Effect of Zn content on the microstructure and mechanical properties of A1MgSiCu alloys. Chin. J. Eng. 2013, 35, 1040–1045. [Google Scholar] [CrossRef]
- Nemri, Y.; Guedouar, B.; Benamar, M.; Sahraoui, T.; Chiker, N.; Mohamed, H. Effect of Mg and Zn Contents on the Microstructures and Mechanical Properties of Al–Si–Cu–Mg Alloys. Int. J. Met. 2017, 12, 20–27. [Google Scholar] [CrossRef]
- Tang, R.K. Influence of Zn contents on properties and microstructure of aluminum alloy 7XXX. Forg. Stamp. Technol. 2017, 42, 184–187. [Google Scholar] [CrossRef]
- Zheng, J.; Hu, W.; Kong, J.; Du, X. Effect of Zinc Addition on the Microstructure and Properties of Al–Si–Cu–Mg Cast Alloy. Trans. Indian Inst. Met. 2024, 77, 3267–3277. [Google Scholar] [CrossRef]
- Zhang, X.L. The Microstructure and Mechanical Properties of Zn in Cast Al-Si-Cu-Mg Alloy. Master’s Thesis, Shenyang University of Technology, Shenyang, China, 2008. Available online: https://kns.cnki.net/KCMS/detail/detail.aspx?dbname=CMFD2009&filename=2008204250.nh (accessed on 2 July 2025).
- Zhou, J.; Yang, Z.Q.; Pang, X. Corrosion performance of aluminum alloy automobile heat exchanger. Light Met. 1998, 01, 52–55. [Google Scholar]
- Wang, J.J.; Zhu, Y.T.; Liu, Y.; Mo, Z.Y. Effects of Zn Element on Phase Transformation during Heat Treatment Process and Mechanical Properties of 3003 Aluminum Alloy. Hot Work. Technol. 2018, 47, 192–194. [Google Scholar] [CrossRef]
- Masoodi, P.A.S.; Gupta, S.; Nandal, V. Influence of Zn content on mechanical properties of aluminum alloy AA6061. Int. J. Res. Eng. Innov. 2020, 4, 318–324. [Google Scholar] [CrossRef]
- Lim, J.; Jeong, G.; Seo, K.; Lim, J.; Park, S.; Ju, W.; Gnanaprakasam, J.; Lee, D.-K.; Kim, J.; Han, M.-K.; et al. Controlled optimization of Mg and Zn in Al alloys for improved corrosion resistance via uniform corrosion. Mater. Adv. 2022, 12, 4813–4823. [Google Scholar] [CrossRef]
- Wang, R.; Wang, D.; Nagaumi, H.; Wu, Z.; Li, X.; Zhang, H. Understanding the corrosion behavior by passive film evolution in Zn-containing Al-Si-Cu cast alloy. Corros. Sci. 2022, 205, 110468. [Google Scholar] [CrossRef]
- Wang, R.; Wang, D.; Nagaumi, H.; Wu, Z.; Zhang, X.; Li, X. Effect of Zn content on corrosion resistance of as-cast Al-6Si-3Cu alloy. Mater. Lett. 2022, 312, 131658. [Google Scholar] [CrossRef]
- Wang, C.; Cui, H.; Tang, X.; He, K. Friction-Stir Welding of a Wrought Al-Si-Mg Alloy in As-Fabricated and Heat-Treatment States. Materials 2020, 13, 861. [Google Scholar] [CrossRef]
- Vysotskiy, I.; Malopheyev, S.; Rahimi, S.; Mironov, S.; Kaibyshev, R. Unusual fatigue behavior of friction-stir welded Al–Mg–Si alloy. Mater. Sci. Eng. A 2019, 760, 277–286. [Google Scholar] [CrossRef]
- Shao, M.; Wang, C.; Zhang, H.; Zhang, J.; Liu, D.; Wang, F.; Ji, Y.; Chen, G. Microstructure and corrosion behavior of bobbin tool friction stir welded 2219 aluminum alloy. Mater. Charact. 2022, 192, 112178. [Google Scholar] [CrossRef]
- Wu, D.; Li, W.Y.; Gao, Y.J.; Yang, J.; Wen, Q.; Vidakis, N.; Vairis, A. Impact of travel speed on the microstructure and mechanical properties of adjustable-gap bobbin-tool friction stir welded Al-Mg joints. Int. J. Miner. Metall. Mater. 2021, 28, 710–717. [Google Scholar] [CrossRef]
- Liu, X.; Jia, R.; Cheng, W.; Zhang, H.; Tian, J.; Zhai, X. Influence of the second phase on relative fracture behavior of friction stir welded 7A52 aluminum alloy. Mater. Today Commun. 2022, 33, 104215. [Google Scholar] [CrossRef]
- Thomas, W.M.; Nicholas, E.D.; Needham, J.C.; Murch, M.G.; Temple-Smith, P.; Dawes, C.J. Friction Welding. US Patent No. 5460317, 24 October 1995. [Google Scholar]
- Ericsson, M.; Sandström, R. Influence of welding speed on the fatigue of friction stir welds, and comparison with MIG and TIG. Int. J. Fatigue 2003, 25, 1379–1387. [Google Scholar] [CrossRef]
- Kumar Maurya, S.; Kumar, R.; Krishna Mishra, S.; Sharma, A.; Singh Yadav, A.; Ranjan Kar, V. Friction stir welding of cast aluminum alloy (A319): Effect of process parameters. Mater. Today Proc. 2022, 56, 1024–1033. [Google Scholar] [CrossRef]
- Mishra, R.S.; Ma, Z.Y. Friction stir welding and processing. Mater. Sci. Eng. R Rep. 2005, 50, 1–78. [Google Scholar] [CrossRef]
- Peng, C.; Jing, C.; Siyi, Q.; Siqi, Z.; Shoubo, S.; Ting, J.; Zhiqing, Z.; Zhihong, J.; Qing, L. Friction stir welding joints of 2195-T8 Al–Li alloys: Correlation of temperature evolution, microstructure and mechanical properties. Mater. Sci. Eng. A 2021, 823, 141501. [Google Scholar] [CrossRef]
- Yau, Y.H.; Hussain, A.; Lalwani, R.K.; Chan, H.K.; Hakimi, N. Temperature distribution study during the friction stir welding process of Al2024-T3 aluminum alloy. Int. J. Miner. Metall. Mater. 2013, 20, 779–787. [Google Scholar] [CrossRef]
- Nian, S.; Li, M.; Ji, S.; Hu, W.; Zhang, Z.; Sun, Z. A novel seal-flow multi-vortex friction stir lap welding of metal to polymer matrix composites. Chin. J. Aeronaut. 2024, 37, 451–462. [Google Scholar] [CrossRef]
- Schmidt, H.; Hattel, J. Modelling heat flow around tool probe in friction stir welding. Sci. Technol. Weld. Join. 2005, 10, 176–186. [Google Scholar] [CrossRef]
- Zhao, Y.Y. The Research of Aluminum Alloy Friction Stir Welding Thermal Action. Master’s Thesis, Jiangsu University of Science and Technology, Zhenjiang, China, 2013. [Google Scholar]
- Su, P.; Gerlich, A.; Yamamoto, M.; North, T.H. Formation and retention of local melted films in AZ91 friction stir spot welds. J. Mater. Sci. 2007, 42, 9954–9965. [Google Scholar] [CrossRef]
- Wang, G.Q.; Zhao, Y.H. Friction Stir Welding of Aluminum Alloy; China Aerospace Publishing House: Beijing, China, 2010; pp. 60–167. [Google Scholar]
- Feng, A.H.; Chen, D.L.; Ma, Z.Y. Microstructure and Cyclic Deformation Behavior of a Friction-Stir-Welded 7075 Al Alloy. Metall. Mater. Trans. A 2010, 41, 957–971. [Google Scholar] [CrossRef]
- Rometsch, P.A.; Zhang, Y.; Knight, S. Heat treatment of 7xxx series aluminium alloys—Some recent developments. Trans. Nonferrous Met. Soc. China 2014, 24, 2003–2017. [Google Scholar] [CrossRef]
- dos Santos, J.F.; Staron, P.; Fischer, T.; Robson, J.D.; Kostka, A.; Colegrove, P.; Wang, H.; Hilgert, J.; Bergmann, L.; Hütsch, L.L.; et al. Understanding precipitate evolution during friction stir welding of Al-Zn-Mg-Cu alloy through in-situ measurement coupled with simulation. Acta Mater. 2018, 148, 163–172. [Google Scholar] [CrossRef]
- Kesharwani, R.; Jha, K.K.; Imam, M.; Sarkar, C.; Barsoum, I. Comparison of microstructural, texture and mechanical properties of SiC and Zn particle reinforced FSW 6061-T6 aluminium alloy. J. Mater. Res. Technol. 2023, 26, 3301–3321. [Google Scholar] [CrossRef]
- Wang, J.F.; Zhang, D.; Guo, Q.N.; Liu, Z.X.; Wang, M.X. The influence of Zn on the microstructure and mechanical properties at room temperature of Al-Cu-Mg-Ag alloy. J. Zhengzhou Univ. 2017, 38, 6–9. [Google Scholar] [CrossRef]
- Dhakar, P.; Kumar, S.; Manani, S.; Pradhan, A.K. Effect of Zn content on microstructure and properties of hypoeutectic and near-eutectic Al-Si alloys. IOP Conf. Ser. Mater. Sci. Eng. 2022, 1248, 012020. [Google Scholar] [CrossRef]
- Xu, X.; Zhu, W.; Yuan, M.; Liang, C.; Deng, Y. The effect of Zn content on the microstructure and mechanical properties of the Al-mg-Si alloy. Mater. Charact. 2023, 198, 112714. [Google Scholar] [CrossRef]
- Muhayat, N.; Utama, A.R.P.; Triyono. Surface Hardening of Aluminium Alloy with Addition of Zinc Particles by Friction Stir Processing. Open Eng. 2020, 10, 408–414. [Google Scholar] [CrossRef]
- Shamsipur, A.; Anvari, A.; Keyvani, A. Improvement of microstructure and corrosion properties of friction stir welded AA5754 by adding Zn interlayer. Int. J. Miner. Metall. Mater. 2018, 25, 967–973. [Google Scholar] [CrossRef]
- Chinchanikar, S.; Swaroop, G.; Gadge, M. Investigation of tool forces, weld bead micro-hardness and surface roughness during friction stir welding of Aluminium 6063 alloy. Adv. Mater. Process. Technol. 2022, 8, 231–239. [Google Scholar] [CrossRef]
- Farhang, M.; Farahani, M.; Nazari, M.; Sam-Daliri, O. Experimental Correlation Between Microstructure, Residual Stresses and Mechanical Properties of Friction Stir Welded 2024-T6 Aluminum Alloys. J. Adv. Des. Manuf. Technol. 2022, 15, 1–9. [Google Scholar] [CrossRef]
- Cahalan, L.P.; Williams, M.B.; Brewer, L.N.; McDonnell, M.M.; Kelly, M.R.; Lalonde, A.D.; Allison, P.G.; Jordon, J.B. Parametric Investigation of Parallel Deposition Passes on the Microstructure and Mechanical Properties of 7075 Aluminum Alloy Processed with Additive Friction Stir Deposition. Appl. Sci. 2024, 14, 457. [Google Scholar] [CrossRef]
- Calcagnotto, M.; Ponge, D.; Demir, E.; Raabe, D. Orientation gradients and geometrically necessary dislocations in ultrafine grained dual-phase steels studied by 2D and 3D EBSD. Mater. Sci. Eng. A 2010, 527, 2738–2746. [Google Scholar] [CrossRef]
- Yan, Z.; Wang, D.; He, X.; Wang, W.; Zhang, H.; Dong, P.; Li, C.; Li, Y.; Zhou, J.; Liu, Z.; et al. Deformation behaviors and cyclic strength assessment of AZ31B magnesium alloy based on steady ratcheting effect. Mater. Sci. Eng. A 2018, 723, 212–220. [Google Scholar] [CrossRef]
- Zribi, Z.; Ktari, H.H.; Herbst, F.; Optasanu, V.; Njah, N. EBSD, XRD and SRS characterization of a casting Al-7wt%Si alloy processed by equal channel angular extrusion: Dislocation density evaluation. Mater. Charact. 2019, 153, 190–198. [Google Scholar] [CrossRef]
- Zhang, D.; Dong, J.H.; Xiong, J.T.; Jiang, N.; Li, J.L.; Guo, W. Microstructure characteristics and corrosion behavior of refill friction stir spot welded 7050 aluminum alloy. J. Mater. Res. Technol. 2022, 20, 1302–1314. [Google Scholar] [CrossRef]
- ASTM-E8M-04; Standard Test Methods for Tension Testing of Metallic Materials. ASTM International: West Conshohocken, PA, USA, 2004.
- Huang, G.R.; Sun, Y.M.; Li, Z.; Liu, Y.L. Effect of Mg Content on Microstructure and Properties of Near-rapidly Solidified Al-Zn-Mg-Cu-Zr Alloys. J. Mater. Eng. 2017, 46, 109–114. [Google Scholar] [CrossRef]
- Alencar, L.C.B.; Santana, C.P.; Silva, K.M.A.; Nóbrega, F.P.; Correia, L.P.; Santos, W.M.; Andrade, F.H.D.; Santos, F.S.; Macêdo, R.O.; Medeiros, A.C.D. Thermal study of active pharmaceutical ingredients used as analgesics by DTA and DSC coupled to photovisual system. Chem. Thermodyn. Therm. Anal. 2022, 7, 100072. [Google Scholar] [CrossRef]
- Hao, S.M.; Jiang, M.; Li, H.X. Material Thermodynamics, 2nd ed.; Chemical Industry Press: Beijing, China, 2010; pp. 67–89. [Google Scholar]
- Zhu, Y.; Cullen, D.A.; Kar, S.; Free, M.L.; Allard, L.F. Evaluation of Al3Mg2 Precipitates and Mn-Rich Phase in Aluminum-Magnesium Alloy Based on Scanning Transmission Electron Microscopy Imaging. Metall. Mater. Trans. A 2012, 43, 4933–4939. [Google Scholar] [CrossRef]
- Amado, M.; Daroqui, F. Revision of The Solvus Limit of Al-Mg2Si Pseudo Binary Phase Diagram. Procedia Mater. Sci. 2015, 8, 1079–1088. [Google Scholar] [CrossRef]
- Zuo, J.R.; Hou, L.; Shu, X.D.; Peng, W.F.; Yin, A.M.; Zhang, J.H. Grain Refinement Assisted by Deformation Enhanced Precipitates through Thermomechanical Treatment of AA7055 Al Alloy. Metals 2020, 10, 594. [Google Scholar] [CrossRef]
- Guo, D.; Chen, J.; Cristino, V.A.M.; Kwok, C.T.; Tam, L.M.; Li, W.; Yang, G.; Qian, H.; Zhang, D.; Li, X. Friction surfacing of precipitation hardening stainless steel coatings for cavitation erosion resistance. Surf. Coat. Technol. 2022, 434, 128206. [Google Scholar] [CrossRef]
- Guo, D.; Kwok, C.T.; Chan, S.L.I.; Tam, L.M. Friction surfacing of AISI 904L super austenitic stainless steel coatings: Microstructure and properties. Surf. Coat. Technol. 2021, 408, 126811. [Google Scholar] [CrossRef]
- Guo, D.; Lam, W.I.; Kwok, C.T.; Chan, S.L.I.; Li, W.; Yang, G.; Tam, L.M. A study on formation mechanism of friction-surfaced stainless steel coating via a stop-action method. Surf. Coat. Technol. 2022, 441, 128511. [Google Scholar] [CrossRef]
- Sabooni, S.; Karimzadeh, F.; Enayati, M.H.; Ngan, A.H.W. Friction-stir welding of ultrafine grained austenitic 304L stainless steel produced by martensitic thermomechanical processing. Mater. Des. 2015, 76, 130–140. [Google Scholar] [CrossRef]
- Sato, Y.S.; Nelson, T.W.; Sterling, C.J. Recrystallization in type 304L stainless steel during friction stirring. Acta Mater. 2005, 53, 637–645. [Google Scholar] [CrossRef]
- Guo, D.; Kwok, C.T.; Tam, L.M.; Zhang, D.; Li, X. Hardness, microstructure and texture of friction surfaced 17-4PH precipitation hardening stainless steel coatings with and without subsequent aging. Surf. Coat. Technol. 2020, 402, 126302. [Google Scholar] [CrossRef]
- Canova, G.R.; Kocks, U.F.; Jonas, J.J. Theory of torsion texture development. Acta Metall. 1984, 32, 211–226. [Google Scholar] [CrossRef]
- Han, P.W.; Yuan, L.Y.; Ghulam, A.; Liu, B.L.; Hu, Z.H.; Fu, P.H.; Peng, L.M. Coarsening of Eutectic Si in Die-casting Al-Si Alloy by Zn and Modification Treatment after Coarsening. Spec. Cast. Nonferrous Alloys 2021, 41, 483–489. [Google Scholar] [CrossRef]
- He, J.g.; Guo, R.; Zeng, D.X.; Li, F.G.; Shi, Q.Y. Effects of Zn Content on Castability of Al-12Si-2Cu-1Mg-xZn Alloy. Spec. Cast. Nonferrous Alloys 2023, 43, 1545–1549. [Google Scholar] [CrossRef]
- Li, M.; Chang, B.W.; Liu, Z.Z.; Li, Y.F.; Liu, J.Y.; Kang, M.; Jiang, Z.A. Effect of Zn on the Microstructure and Mechanical Properties of Al-Si Non-Heat Treatment Alloy. Foundry 2024, 73, 3195–3199. [Google Scholar] [CrossRef]
- Ji, S.; Cui, X.; Ma, L.; Liu, H.; Zuo, Y.; Zhang, Z. Achieving High-Quality Aluminum to Copper Dissimilar Metals Joint via Friction Stir Double-Riveting Welding. Acta Metall. Sin. (Engl. Lett.) 2023, 36, 552–572. [Google Scholar] [CrossRef]
- Li, P.; You, G.; Wen, H.; Guo, W.; Tong, X.; Li, S. Friction stir welding between the high-pressure die casting of AZ91 magnesium alloy and A383 aluminum alloy. J. Mater. Process. Technol. 2019, 264, 55–63. [Google Scholar] [CrossRef]
- Wang, H.; Wei, Y.; Wang, W.; Huang, T.Z.; Zhou, L.L. Microstructure and properties of friction stir welded joint of 7075 aluminum alloy under different cooling media. Electr. Weld. Mach. 2020, 50, 70–74. [Google Scholar] [CrossRef]
- Mao, Y.-Q.; Yang, P.; Ke, L.-M.; Xu, Y.; Chen, Y.-H. Microstructure Evolution and Recrystallization Behavior of Friction Stir Welded Thick Al–Mg–Zn–Cu alloys: Influence of Pin Centerline Deviation. Acta Metall. Sin. 2022, 35, 745–756. [Google Scholar] [CrossRef]
- Ma, Z.Y.; Feng, A.H.; Chen, D.L.; Shen, J. Recent Advances in Friction Stir Welding/Processing of Aluminum Alloys: Microstructural Evolution and Mechanical Properties. Crit. Rev. Solid State Mater. Sci. 2018, 43, 269–333. [Google Scholar] [CrossRef]
- Qin, H.; Zhang, H.; Wu, H. The evolution of precipitation and microstructure in friction stir welded 2195-T8 Al–Li alloy. Mater. Sci. Eng. A 2015, 626, 322–329. [Google Scholar] [CrossRef]
- Jata, K.V.; Semiatin, S.L. Continuous dynamic recrystallization during friction stir welding of high strength aluminum alloys. Scr. Mater. 2000, 43, 743–749. [Google Scholar] [CrossRef]
- Pan, J.S.; Tong, J.M.; Tian, M.B. Fundamentals of Materials Science (Revised Edition); Tsinghua University Press: Beijing, China, 2011; pp. 1–369. [Google Scholar]
- Li, P.Z.; Aranishi, K.; Xu, Q. ZIF-8 immobilized nickel nanoparticles: Highly effective catalysts for hydrogen generation from hydrolysis of ammonia borane. Chem. Commun. 2012, 48, 3173–3175. [Google Scholar] [CrossRef]
- Cáceres, C.H.; Griffiths, J.R.; Pakdel, A.R.; Davidson, C.J. Microhardness mapping and the hardness-yield strength relationship in high-pressure diecast magnesium alloy AZ91. Mater. Sci. Eng. A 2005, 402, 258–268. [Google Scholar] [CrossRef]
- Yuan, Z.Z.; Dai, Q.X. Metallic Materials; Chemical Industry Press: Beijing, China, 2009; pp. 187–200. [Google Scholar]
- Patil, S.; Nagamadhu, M.; Malyadri, T. A critical review on microstructure and hardness of aluminum alloy 6061 joints obtained by friction stir welding-past, present, and its prospects. Mater. Today Proc. 2023, 82, 75–78. [Google Scholar] [CrossRef]
- Tariq, M.; Khan, I.; Hussain, G.; Farooq, U. Microstructure and micro-hardness analysis of friction stir welded bi-layered laminated aluminum sheets. Int. J. Lightweight Mater. Manuf. 2019, 2, 123–130. [Google Scholar] [CrossRef]
- Rajakumar, S.; Muralidharan, C.; Balasubramanian, V. Predicting tensile strength, hardness and corrosion rate of friction stir welded AA6061-T6 aluminium alloy joints. Mater. Des. 2011, 32, 2878–2890. [Google Scholar] [CrossRef]
- Hu, Z.P.; Jiang, J.; Liao, F.J.; Wang, L.D.; Zhu, D.Y. Kinetics of Precipitation and Coarsening of Si-containing Phases in a SupersaturatedAl-20% Si Alloy. Chin. J. Mater. Res. 2018, 32, 743–750. [Google Scholar] [CrossRef]
- Wang, H.; Yu, F.X.; Sun, Z.G. Coarsening Characteristic of Si Particles in Powders of Rapidly Solidified Al-Si Alloy. Foundry 2007, 56, 65–67. [Google Scholar] [CrossRef]
- Uday, K.N.; Rajamurugan, G. Influence of tool rotational and transverse speed on friction stir welding of dissimilar aluminum 6061 composites. Mater. Lett. 2022, 329, 133182. [Google Scholar] [CrossRef]
- Chen, X.; Liu, K.; Liu, Q.; Cristino, V.A.M.; Lo, K.H.; Xie, Z.; Wang, Z.; Song, D.; Kong, J.; Kwok, C.T. Friction stir welding of as-cast and pre-aged Al–Si–Zn–Mg–Fe alloy: Microstructure, mechanical and corrosion properties. J. Mater. Res. Technol. 2024, 31, 3160–3188. [Google Scholar] [CrossRef]
- Arthanari, S.; Jang, J.C.; Shin, K.S. Corrosion performance of high pressure die-cast Al-Si-Mg-Zn alloys in 3.5 wt% NaCl solution. J. Alloys Compd. 2019, 783, 494–502. [Google Scholar] [CrossRef]
- Birbilis, N.; Buchheit, R.G. Electrochemical Characteristics of Intermetallic Phases in Aluminum Alloys: An Experimental Survey and Discussion. J. Electrochem. Soc. 2005, 152, B140. [Google Scholar] [CrossRef]
- Zeng, R.X.; Cheng, T.F.; Yang, Y.T. Study on corrosion resistance of new low silicon cast aluminum alloy. Foundry 2019, 68, 872–879. [Google Scholar] [CrossRef]
- Li, T.; Feng, H.T.; Li, X.G.; Zhou, J.L. Corrosion behavior of 2A12 aluminum alloy in Cl− containing solution. Mater. Sci. Technol. 2011, 19, 43–48. [Google Scholar]
- Jiang, L.; Zhang, Z.; Fu, H.; Huang, S.; Zhuang, D.; Xie, J. Corrosion behavior and mechanism of Al–Zn–Mg–Cu alloy based on the characterization of the secondary phases. Mater. Charact. 2022, 189, 111974. [Google Scholar] [CrossRef]
- Nicard, C.; Allély, C.; Volovitch, P. Effect of Zn and Mg alloying on microstructure and anticorrosion mechanisms of Al-Si based coatings for high strength steel. Corros. Sci. 2019, 146, 192–201. [Google Scholar] [CrossRef]
- Li, L.L. Study on the Localized Corrosion Mechanism of the Second Phase Mg2Si in 6××× Series Aluminum Alloys. Master’s Thesis, Shenyang University of Technology, Shenyang, China, 2017. [Google Scholar]
- He, J.G.; Wen, J.B.; Zhou, X.D. Influence of second phase on corrosion behavior of Al-Zn-Sn-Ga-Mg alloy. Chin. J. Nonferrous Met. 2013, 23, 628–634. [Google Scholar]
- Venugopal, A.; Raja, V.S. AC impedance study on the activation mechanism of aluminium by indium and zinc in 3.5% NaCl medium. Corros. Sci. 1997, 39, 2053–2065. [Google Scholar] [CrossRef]
- Eckermann, F.; Suter, T.; Uggowitzer, P.J.; Afseth, A.; Schmutz, P. The influence of MgSi particle reactivity and dissolution processes on corrosion in Al–Mg–Si alloys. Electrochim. Acta 2008, 54, 844–855. [Google Scholar] [CrossRef]
- Zhang, H.; Yu, S.; Yang, Z.; Zhang, C. The influence of porosity and precipitates on the corrosion behavior of A356 aluminum alloy. J. Electroanal. Chem. 2023, 948, 117796. [Google Scholar] [CrossRef]
- Dong, C.F.; Kong, D.C.; Zhang, L. Corrosion of Metals Fabricated by Additive Manufacturing; Chemical Industry Press: Beijing, China, 2023; pp. 23–32, 179–204. [Google Scholar]
- Meng, Q.; Liu, Y.; Kang, J.; Fu, R.-D.; Guo, X.-Y.; Li, Y.-J. Effect of precipitate evolution on corrosion behavior of friction stir welded joints of AA2060-T8 alloy. Trans. Nonferrous Met. Soc. China 2019, 29, 701–709. [Google Scholar] [CrossRef]
- Chen, H.; Lu, L. Effect of residual stress on localized corrosion behavior of metallic materials. Chin. J. Eng. 2019, 41, 929–939. [Google Scholar] [CrossRef]
- Aung, N.N.; Zhou, W. Effect of grain size and twins on corrosion behaviour of AZ31B magnesium alloy. Corros. Sci. 2010, 52, 589–594. [Google Scholar] [CrossRef]
- Song, D.; Ma, A.; Jiang, J.; Lin, P.; Yang, D.; Fan, J. Corrosion behavior of equal-channel-angular-pressed pure magnesium in NaCl aqueous solution. Corros. Sci. 2010, 52, 481–490. [Google Scholar] [CrossRef]
- Sotniczuk, A.; Kuczyńska-Zemła, D.; Królikowski, A.; Garbacz, H. Enhancement of the corrosion resistance and mechanical properties of nanocrystalline titanium by low-temperature annealing. Corros. Sci. 2019, 147, 342–349. [Google Scholar] [CrossRef]
- Wang, P.J.; Ma, L.W.; Cheng, X.Q.; Li, X.G. Influence of grain refinement on the corrosion behavior of metallic materials: A review. Int. J. Miner. Metall. Mater. 2021, 28, 1112–1126. [Google Scholar] [CrossRef]
- Balyanov, A.; Kutnyakova, J.; Amirkhanova, N.A.; Stolyarov, V.V.; Valiev, R.Z.; Liao, X.Z.; Zhao, Y.H.; Jiang, Y.B.; Xu, H.F.; Lowe, T.C.; et al. Corrosion resistance of ultra fine-grained Ti. Scr. Mater. 2004, 51, 225–229. [Google Scholar] [CrossRef]
- Tong, L.; Xu, Q.L.; Ma, Y.P.; Liu, C.L. Effect of Grain refinement on the Electrochemical Corrosion Behavior of Friction Stir Processing 7075 Aluminum Alloy. J. Chongqing Univ. Technol. (Nat. Sci.) 2016, 30, 52–58. [Google Scholar]
- Chouthai, S.S.; Elayaperumal, K. Texture dependence of corrosion of mild steel after cold rolling. Br. Corros. J. 1976, 11, 40–43. [Google Scholar] [CrossRef]
- Ravi Kumar, B.; Singh, R.; Mahato, B.; De, P.K.; Bandyopadhyay, N.R.; Bhattacharya, D.K. Effect of texture on corrosion behavior of AISI 304L stainless steel. Mater. Charact. 2005, 54, 141–147. [Google Scholar] [CrossRef]
- Lv, J.; Luo, H. Effect of surface burnishing on texture and corrosion behavior of 2024 aluminum alloy. Surf. Coat. Technol. 2013, 235, 513–520. [Google Scholar] [CrossRef]
- Wang, K.; Naumov, A.; Panchenko, E.; Panchenko, O. A Review on Friction Stir Welding of High-Strength Al-Zn-Mg Alloy: Insights on Second-Phase Particles. Materials 2024, 17, 5107. [Google Scholar] [CrossRef]


| Specimen | Al | Si | Zn | Mg | Fe | Mn | Ti | Sr |
|---|---|---|---|---|---|---|---|---|
| Al-Si-Mg-Fe-0%Zn | Bal. | 10.1 | 0.0 | 0.5 | 0.6 | 0.4 | 0.1 | 0.02 |
| Al-Si-Mg-Fe-3.4%Zn | Bal. | 10.4 | 3.4 | 0.5 | 0.6 | 0.4 | 0.2 | 0.04 |
| Al-Si-Mg-Fe-6.5%Zn | Bal. | 10.2 | 6.5 | 0.5 | 0.6 | 0.4 | 0.1 | 0.02 |
| Al-Si-Mg-Fe-8.3%Zn | Bal. | 9.8 | 8.3 | 0.5 | 0.6 | 0.4 | 0.1 | 0.01 |
| Specimen | α-Al Endothermic Peak | MgZn2 Endothermic Peak | ||
|---|---|---|---|---|
| Melting Enthalpy (J/g) | Tpeak (°C) | Melting Enthalpy (J/g) | Tpeak (°C) | |
| As-cast Al-Si-Mg-Fe-0%Zn | 590.8 | 581.5 | - | - |
| As-cast Al-Si-Mg-Fe-3.4%Zn | 524.5 | 576.8 | 3.09 | 542.5 |
| As-cast Al-Si-Mg-Fe-6.5%Zn | 459.5 | 568.5 | 4.13 | 517.3 |
| As-cast Al-Si-Mg-Fe-8.3%Zn | 437.9 | 567.1 | 8.14 | 530.8 |
| FSWed Al-Si-Mg-Fe-0%Zn | 661.5 | 579.6 | - | - |
| FSWed Al-Si-Mg-Fe-3.4%Zn | 534.0 | 576.9 | 576.9 | 544.5 |
| FSWed Al-Si-Mg-Fe-6.5%Zn | 423.2 | 571.9 | - | - |
| FSWed Al-Si-Mg-Fe-8.3%Zn | 497.4 | 568.2 | 8.21 | 534.6 |
| Specimen | E (GPa) | YS (MPa) | UTS (MPa) | %EL (%) | Strength Coefficient (%) | Average Hardness (HV0.2) |
|---|---|---|---|---|---|---|
| As-cast Al-Si-Mg-Fe-0%Zn | 30.9 ± 2.7 | 99.8 ± 12.3 | 169.0 ± 23.7 | 2.3 | - | 86.3 ± 6.2 |
| As-cast Al-Si-Mg-Fe-3.4%Zn | 46.8 ± 3.4 | 163.4 ± 12.2 | 184.1 ± 15.2 | 1.1 | - | 98.0 ± 11.3 |
| As-cast Al-Si-Mg-Fe-6.5%Zn | 59.7 ± 5.2 | 181.1 ± 15.1 | 206.1 ± 19.7 | 1.2 | - | 110.3 ± 10.6 |
| As-cast Al-Si-Mg-Fe-8.3%Zn | 57.4 ± 3.8 | 180.5 ± 14.6 | 201.7 ± 18.2 | 1.2 | - | 105.8 ± 7.1 |
| FSWed Al-Si-Mg-Fe-0%Zn | 20.8 ± 2.3 | 76.2 ± 10.2 | 153.8 ± 20.5 | 2.6 | 91.0 | 71.8 ± 1.8 |
| FSWed Al-Si-Mg-Fe-3.4%Zn | 45.2 ± 3.5 | 137.6 ± 12.5 | 170.5 ± 13.2 | 1.7 | 92.6 | 86.7 ± 5.8 |
| FSWed Al-Si-Mg-Fe-6.5%Zn | 52.5 ± 4.2 | 176.5 ± 14.2 | 185.9 ± 16.4 | 0.7 | 90.1 | 103.6 ± 8.8 |
| FSWed Al-Si-Mg-Fe-8.3%Zn | 58.5 ± 5.3 | 184.4 ± 17.5 | 226.9 ± 20.3 | 1.8 | 112.5 | 116.3 ± 9.0 |
| Specimen | OCP (mVSCE) | Icorr (μA/cm2) | Epit (mVSCE) |
|---|---|---|---|
| As-cast Al-Si-Mg-Fe-0%Zn | −787 ± 22 | 0.4 ± 0.1 | −740.5 ± 28 |
| As-cast Al-Si-Mg-Fe-3.4%Zn | −867 ± 15 | 1.7 ± 1.1 | −955 ± 10 |
| As-cast Al-Si-Mg-Fe-6.5%Zn | −1071 ± 13 | 35.4 ± 5.2 | −937 ± 13 |
| As-cast Al-Si-Mg-Fe-8.3%Zn | −971 ± 17 | 8.3 ± 3.5 | −941 ± 15 |
| FSWed Al-Si-Mg-Fe-0%Zn | −994 ± 30 | 2.9 ± 1.4 | −707 ± 26 |
| FSWed Al-Si-Mg-Fe-3.4%Zn | −1094 ± 24 | 31.0 ± 8.3 | −904 ± 12 |
| FSWed Al-Si-Mg-Fe-6.5%Zn | −898 ± 20 | 10.4 ± 4.0 | −849 ± 7 |
| FSWed Al-Si-Mg-Fe-8.3%Zn | −1044 ± 23 | 20.9 ± 5.2 | −928 ± 12 |
| Specimen | χ2 × 10⁻³ | Rs (Ω·cm2) | Rct (Ω·cm2) | W-R (Ω·cm2) | W-Y0 (SSn cm−2 × 10⁻³) | W-N (SSncm−2) | CPE-Y0 (SSn cm−2 × 10⁻⁶) | CPE-N (SSncm−2) |
|---|---|---|---|---|---|---|---|---|
| As-cast Al-Si-Mg-Fe-0%Zn | 0.95 | 7.91 ± 0.05 | 11,375 ± 234 | 19 | 2 | 0.42 | 2.17 | 0.87 |
| As-cast Al-Si-Mg-Fe-3.4%Zn | 0.47 | 9.27 ± 0.03 | 9245 ± 426 | 559 | 167 | 0.53 | 8.90 | 0.92 |
| As-cast Al-Si-Mg-Fe-6.5%Zn | 2.5 × 10⁻⁷ | 9.14 ± 0.18 | 4627 ± 1 | 37 | 24 | 0.50 | 46.18 | 0.87 |
| As-cast Al-Si-Mg-Fe-8.3%Zn | 0.12 | 7.48 ± 0.05 | 6934 ± 80 | 8116 | 298 | 0.50 | 18.03 | 0.93 |
| FSWed Al-Si-Mg-Fe-0%Zn | 5.2 | 9.36 ± 0.10 | 9546 ± 300 | 11 | 1 | 0.43 | 1.07 | 0.88 |
| FSWed Al-Si-Mg-Fe-3.4%Zn | 0.31 | 5.71 ± 0.02 | 6167 ± 73 | 2184 | 770 | 0.48 | 18.88 | 0.91 |
| FSWed Al-Si-Mg-Fe-6.5%Zn | 0.78 | 6.00 ± 0.07 | 9192 ± 155 | 15,557 | 333 | 0.47 | 14.23 | 0.92 |
| FSWed Al-Si-Mg-Fe-8.3%Zn | 1.02 | 4.87 ± 0.05 | 8742 ± 110 | 13,149 | 352 | 0.51 | 1.07 | 0.94 |
Disclaimer/Publisher’s Note: The statements, opinions and data contained in all publications are solely those of the individual author(s) and contributor(s) and not of MDPI and/or the editor(s). MDPI and/or the editor(s) disclaim responsibility for any injury to people or property resulting from any ideas, methods, instructions or products referred to in the content. |
© 2025 by the authors. Licensee MDPI, Basel, Switzerland. This article is an open access article distributed under the terms and conditions of the Creative Commons Attribution (CC BY) license (https://creativecommons.org/licenses/by/4.0/).
Share and Cite
Chen, X.; Liu, K.; Liu, Q.; Kong, J.; Cristino, V.A.M.; Lo, K.-H.; Xie, Z.; Wang, Z.; Song, D.; Kwok, C.-T. Influence of Zn Content on the Corrosion and Mechanical Properties of Cast and Friction Stir-Welded Al-Si-Mg-Fe-Zn Alloys. Materials 2025, 18, 3306. https://doi.org/10.3390/ma18143306
Chen X, Liu K, Liu Q, Kong J, Cristino VAM, Lo K-H, Xie Z, Wang Z, Song D, Kwok C-T. Influence of Zn Content on the Corrosion and Mechanical Properties of Cast and Friction Stir-Welded Al-Si-Mg-Fe-Zn Alloys. Materials. 2025; 18(14):3306. https://doi.org/10.3390/ma18143306
Chicago/Turabian StyleChen, Xiaomi, Kun Liu, Quan Liu, Jing Kong, Valentino A. M. Cristino, Kin-Ho Lo, Zhengchao Xie, Zhi Wang, Dongfu Song, and Chi-Tat Kwok. 2025. "Influence of Zn Content on the Corrosion and Mechanical Properties of Cast and Friction Stir-Welded Al-Si-Mg-Fe-Zn Alloys" Materials 18, no. 14: 3306. https://doi.org/10.3390/ma18143306
APA StyleChen, X., Liu, K., Liu, Q., Kong, J., Cristino, V. A. M., Lo, K.-H., Xie, Z., Wang, Z., Song, D., & Kwok, C.-T. (2025). Influence of Zn Content on the Corrosion and Mechanical Properties of Cast and Friction Stir-Welded Al-Si-Mg-Fe-Zn Alloys. Materials, 18(14), 3306. https://doi.org/10.3390/ma18143306