
Acoustic Analysis of Soundproofing Materials Using Recycled Rubber from Automobiles


Abstract
1. Introduction
2. Materials and Methods
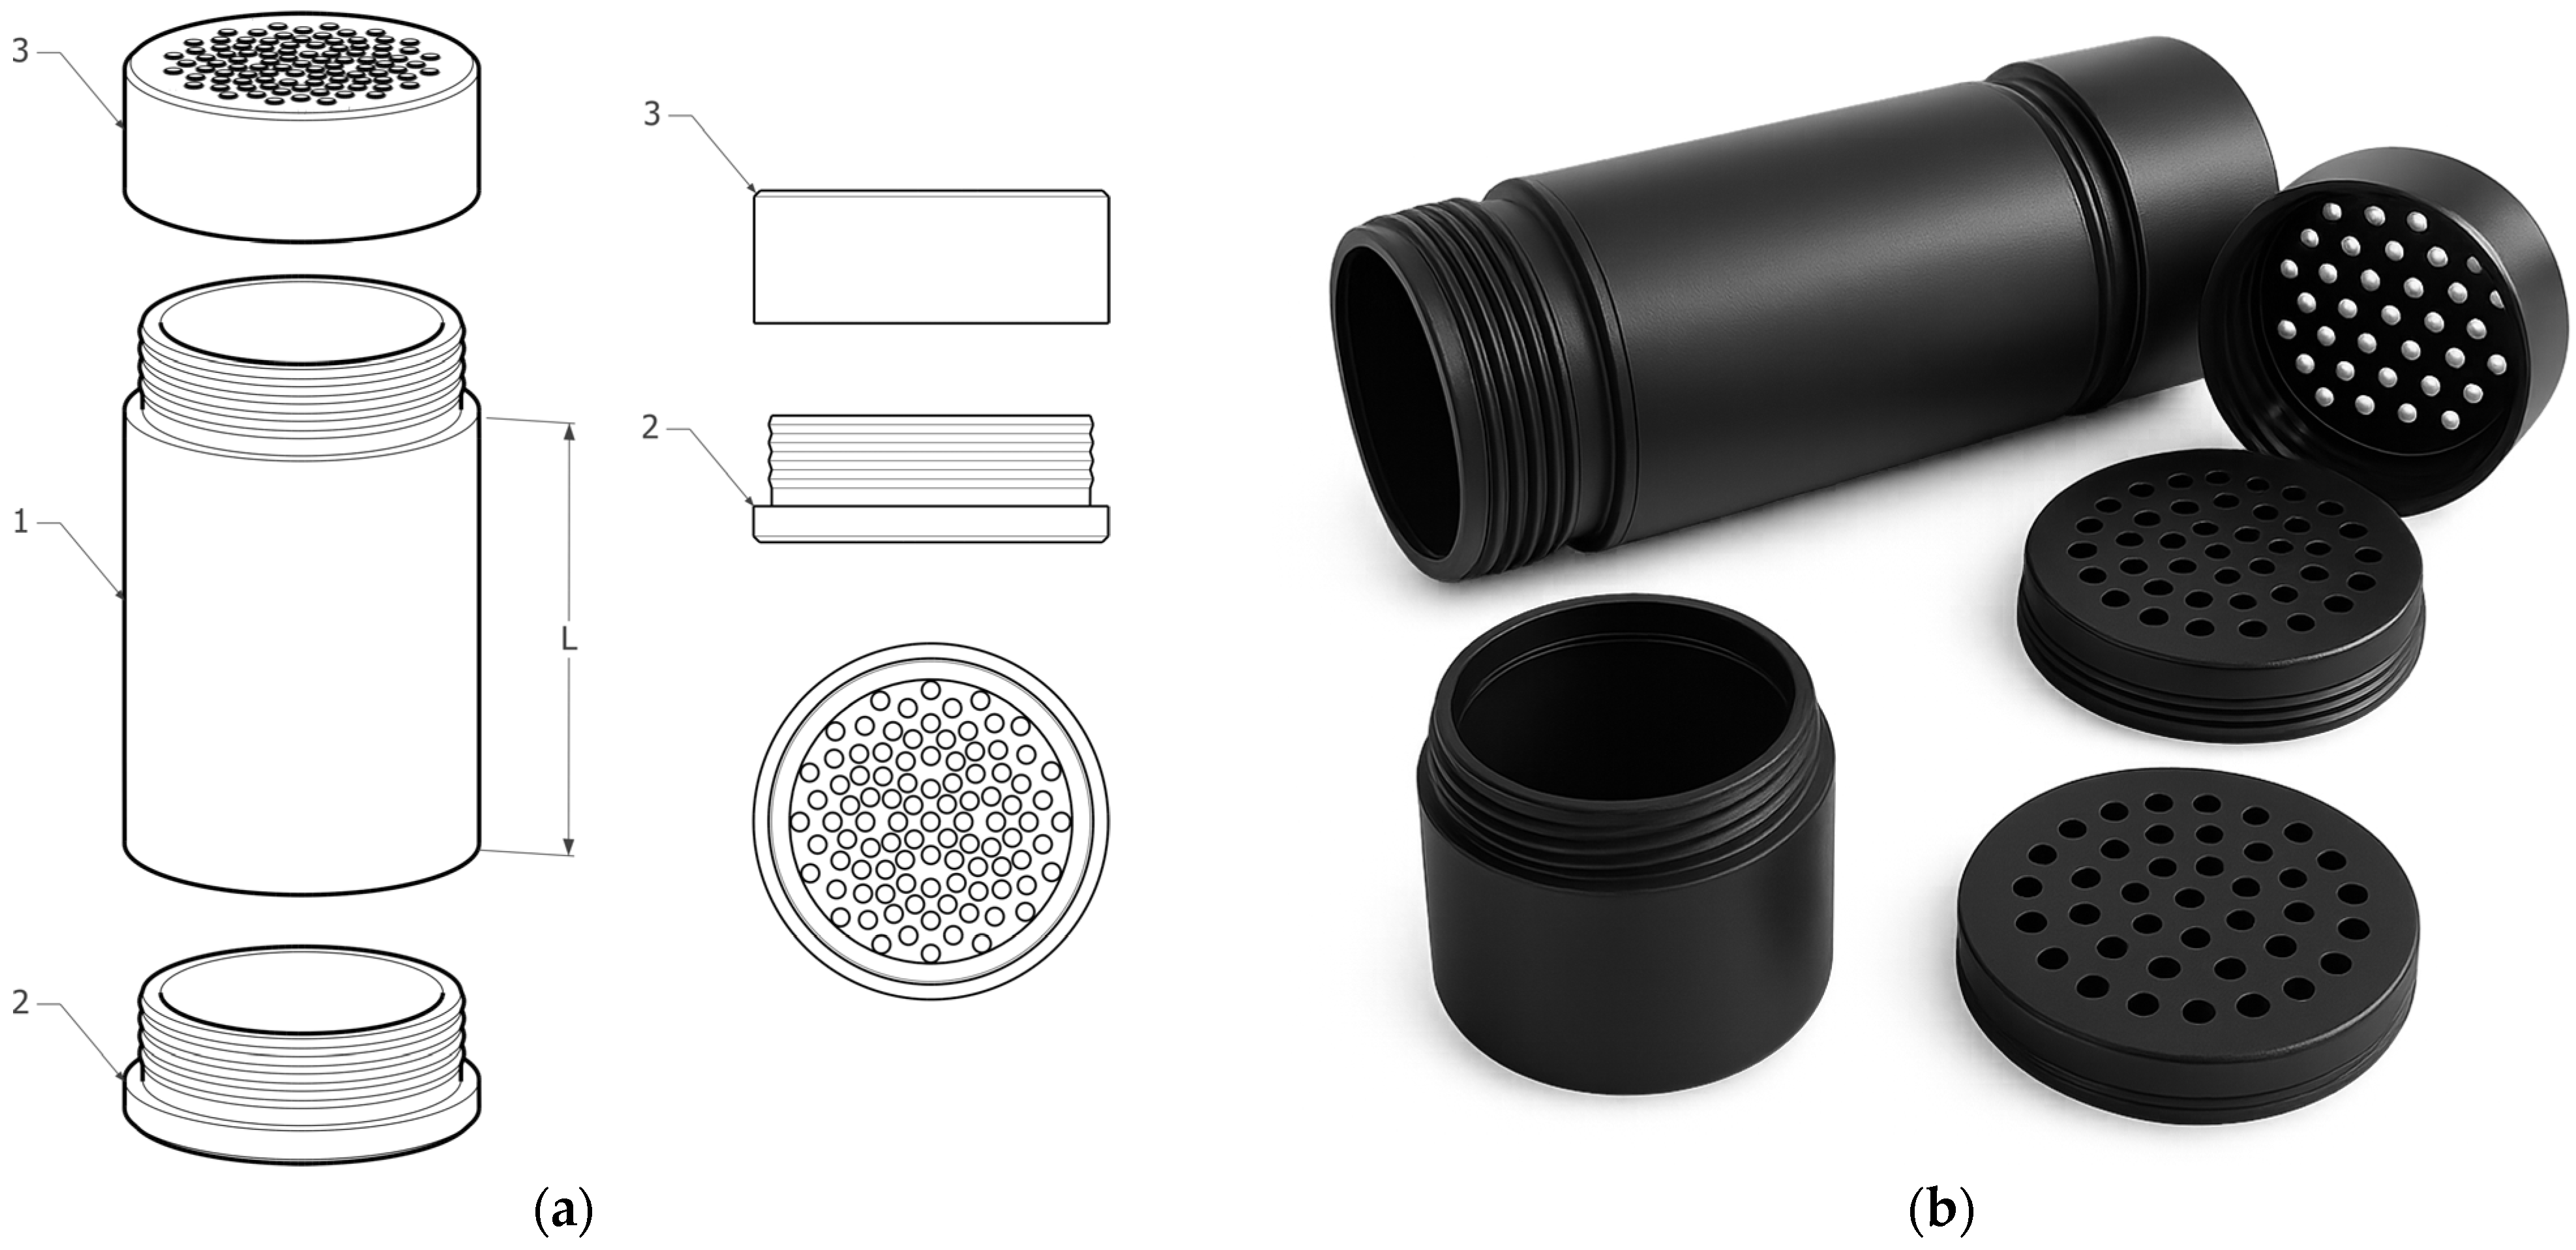
2.1. Development and Construction of Test Cartridges for the Experimental Evaluation of Acoustic Properties of Granular Materials
- The proposed design allows for the measurement of both granular and compact samples without the need to modify the entire measurement setup.
- The mechanism enables fast and precise adjustment of sample thickness with high repeatability, without interfering with the measurement equipment.
- The integrated pressing and filling system with adjustable pressure enables regulation of the density (kg/m3) of the material to be examined.
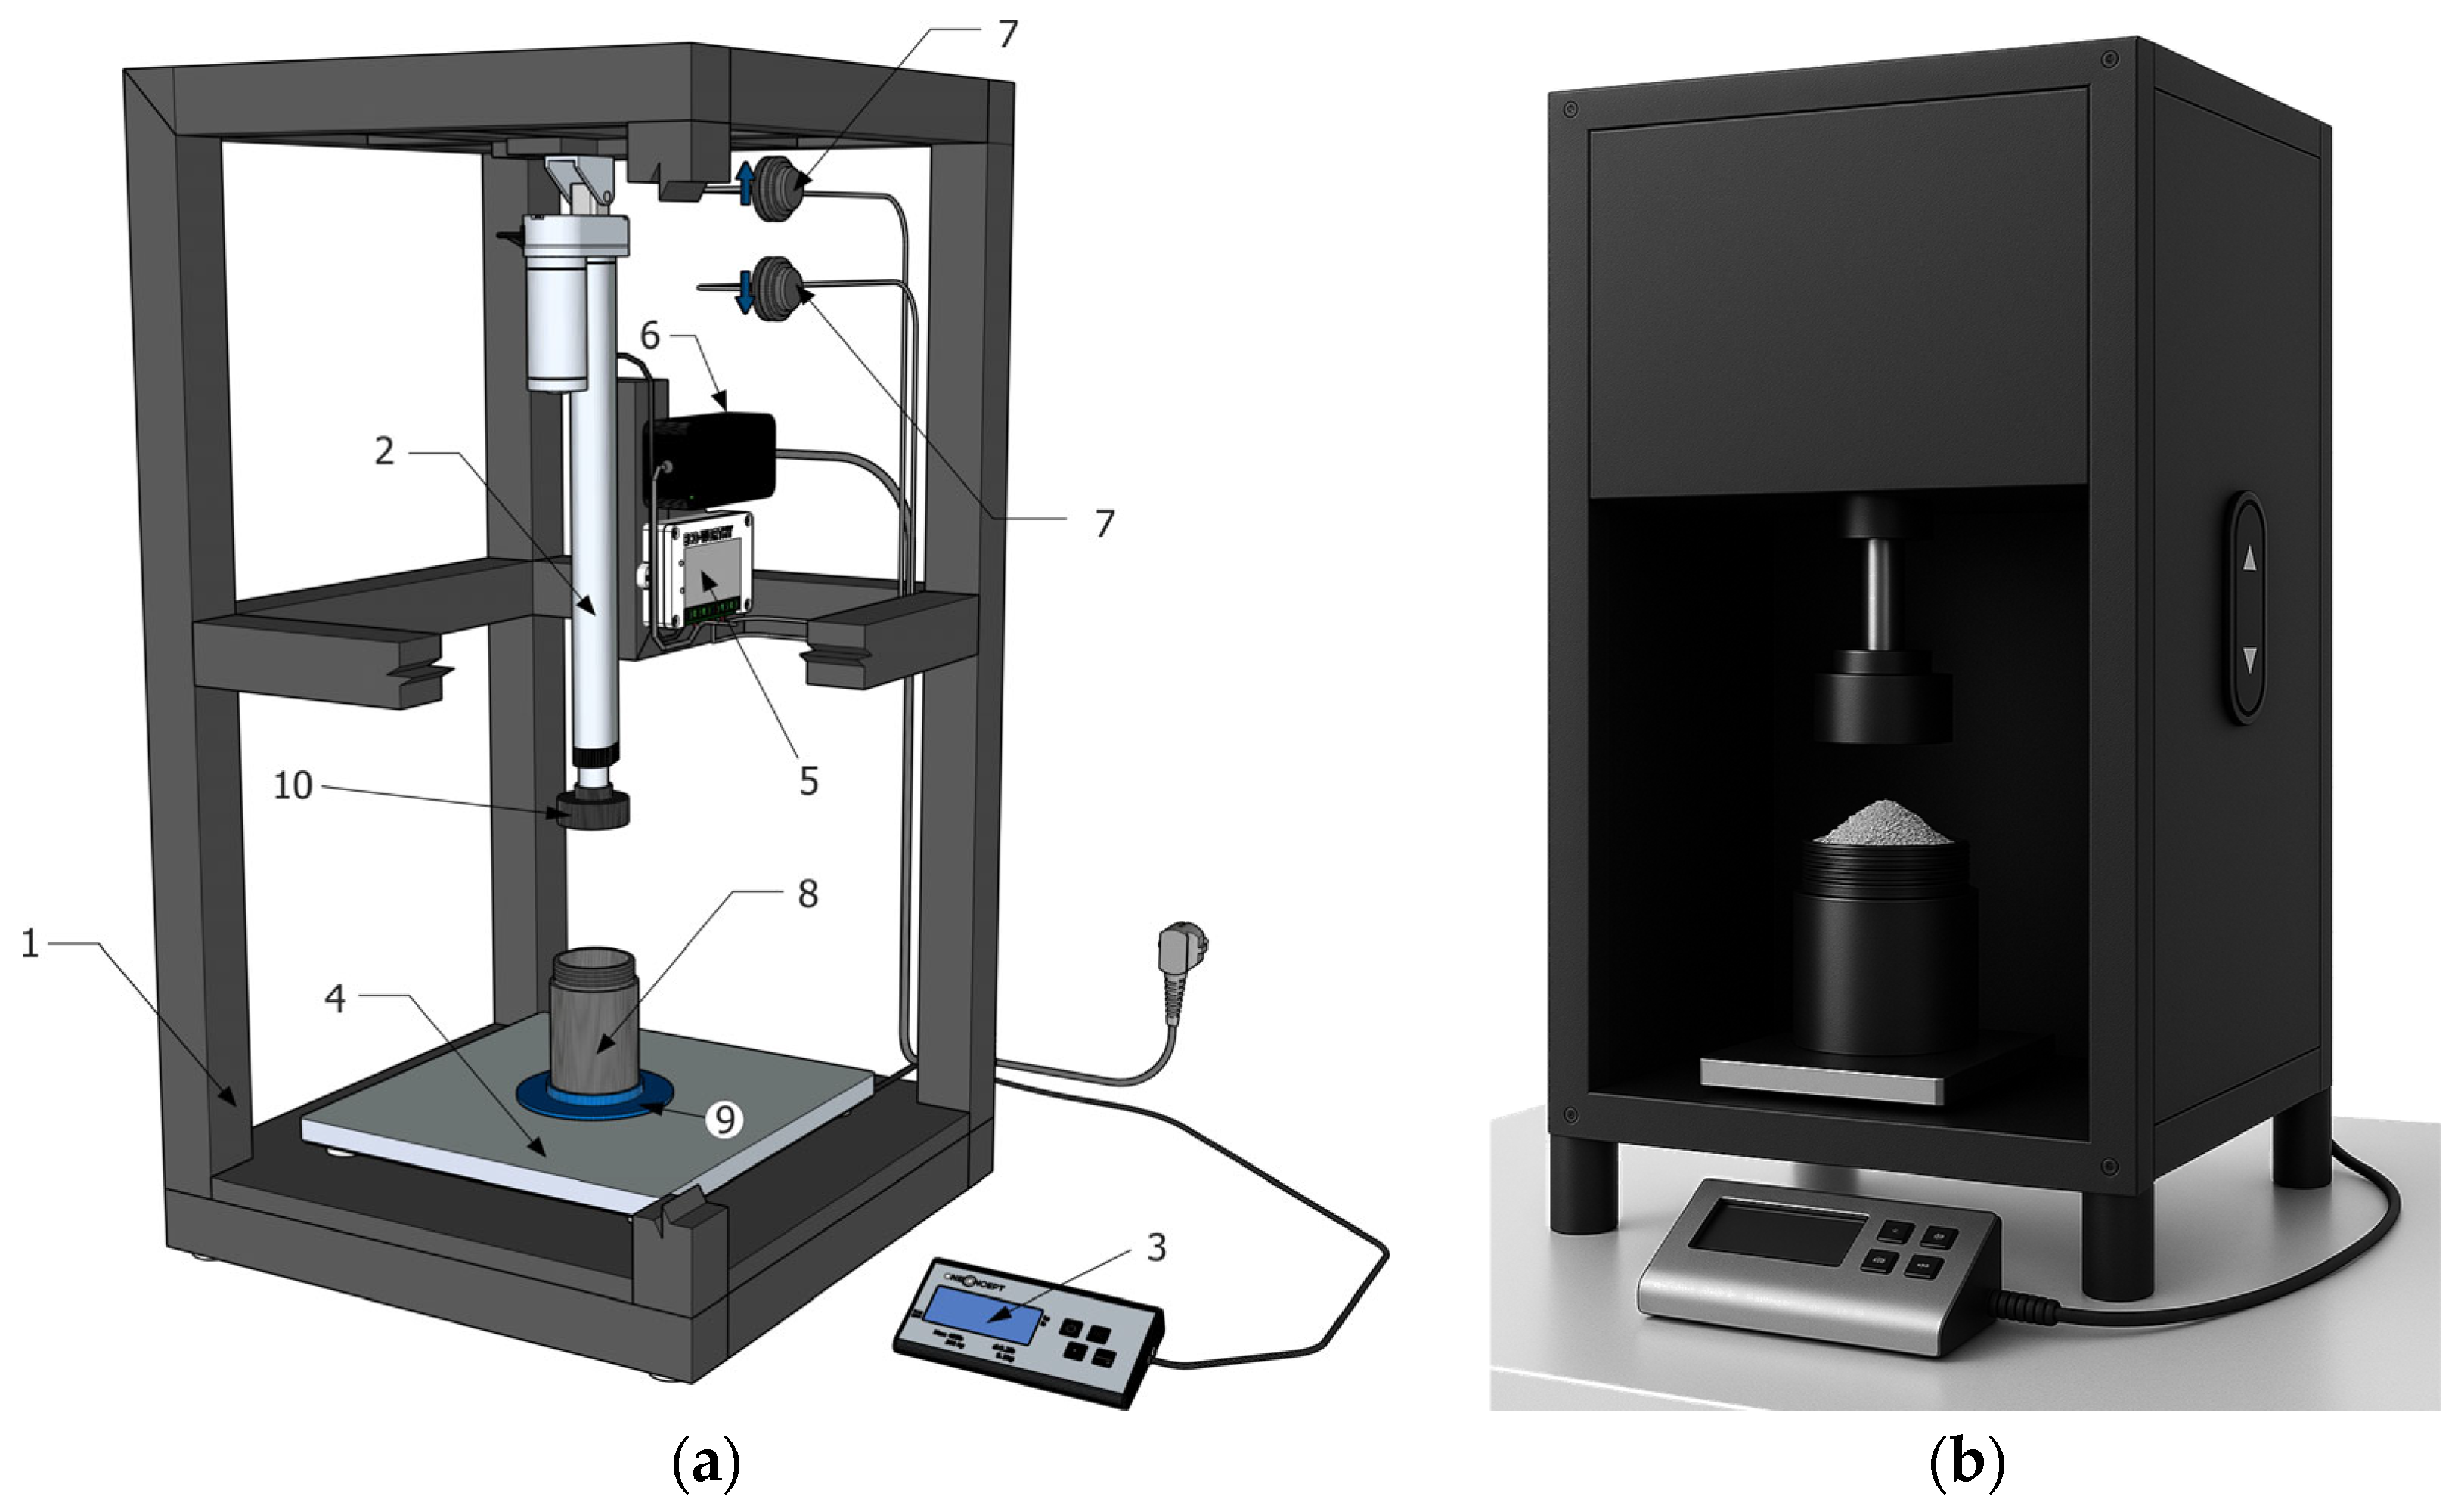
2.2. Semi-Automated Equipment for Filling and Compacting Granular Materials in Test Cartridges
- Preparation: The required amount of recycled material is poured into the cartridge, ensuring that it is evenly distributed throughout the cartridge volume. The cartridge is then inserted into the centering ring, which guarantees accurate and repeatable cartridge placement in the device, minimizing the risk of improper pressing and ensuring consistency of results in further sample processing.
- Pressing: Using a linear piston driven by an electric motor, the material is compressed to the desired pressure. The compression force is displayed on the control panel, and the device allows pressure settings from 250 to 750 kPa in 50 kPa increments. This range provides precise and repeatable compaction tailored to the specific application requirements.
- Closure: After compaction, the lid is securely screwed onto the cartridge, maintaining the stability and integrity of the sample during handling and subsequent measurement. This step is important to maintain the desired degree of compaction and to prevent undesirable changes in the properties of the sample before it is inserted into the impedance tube.
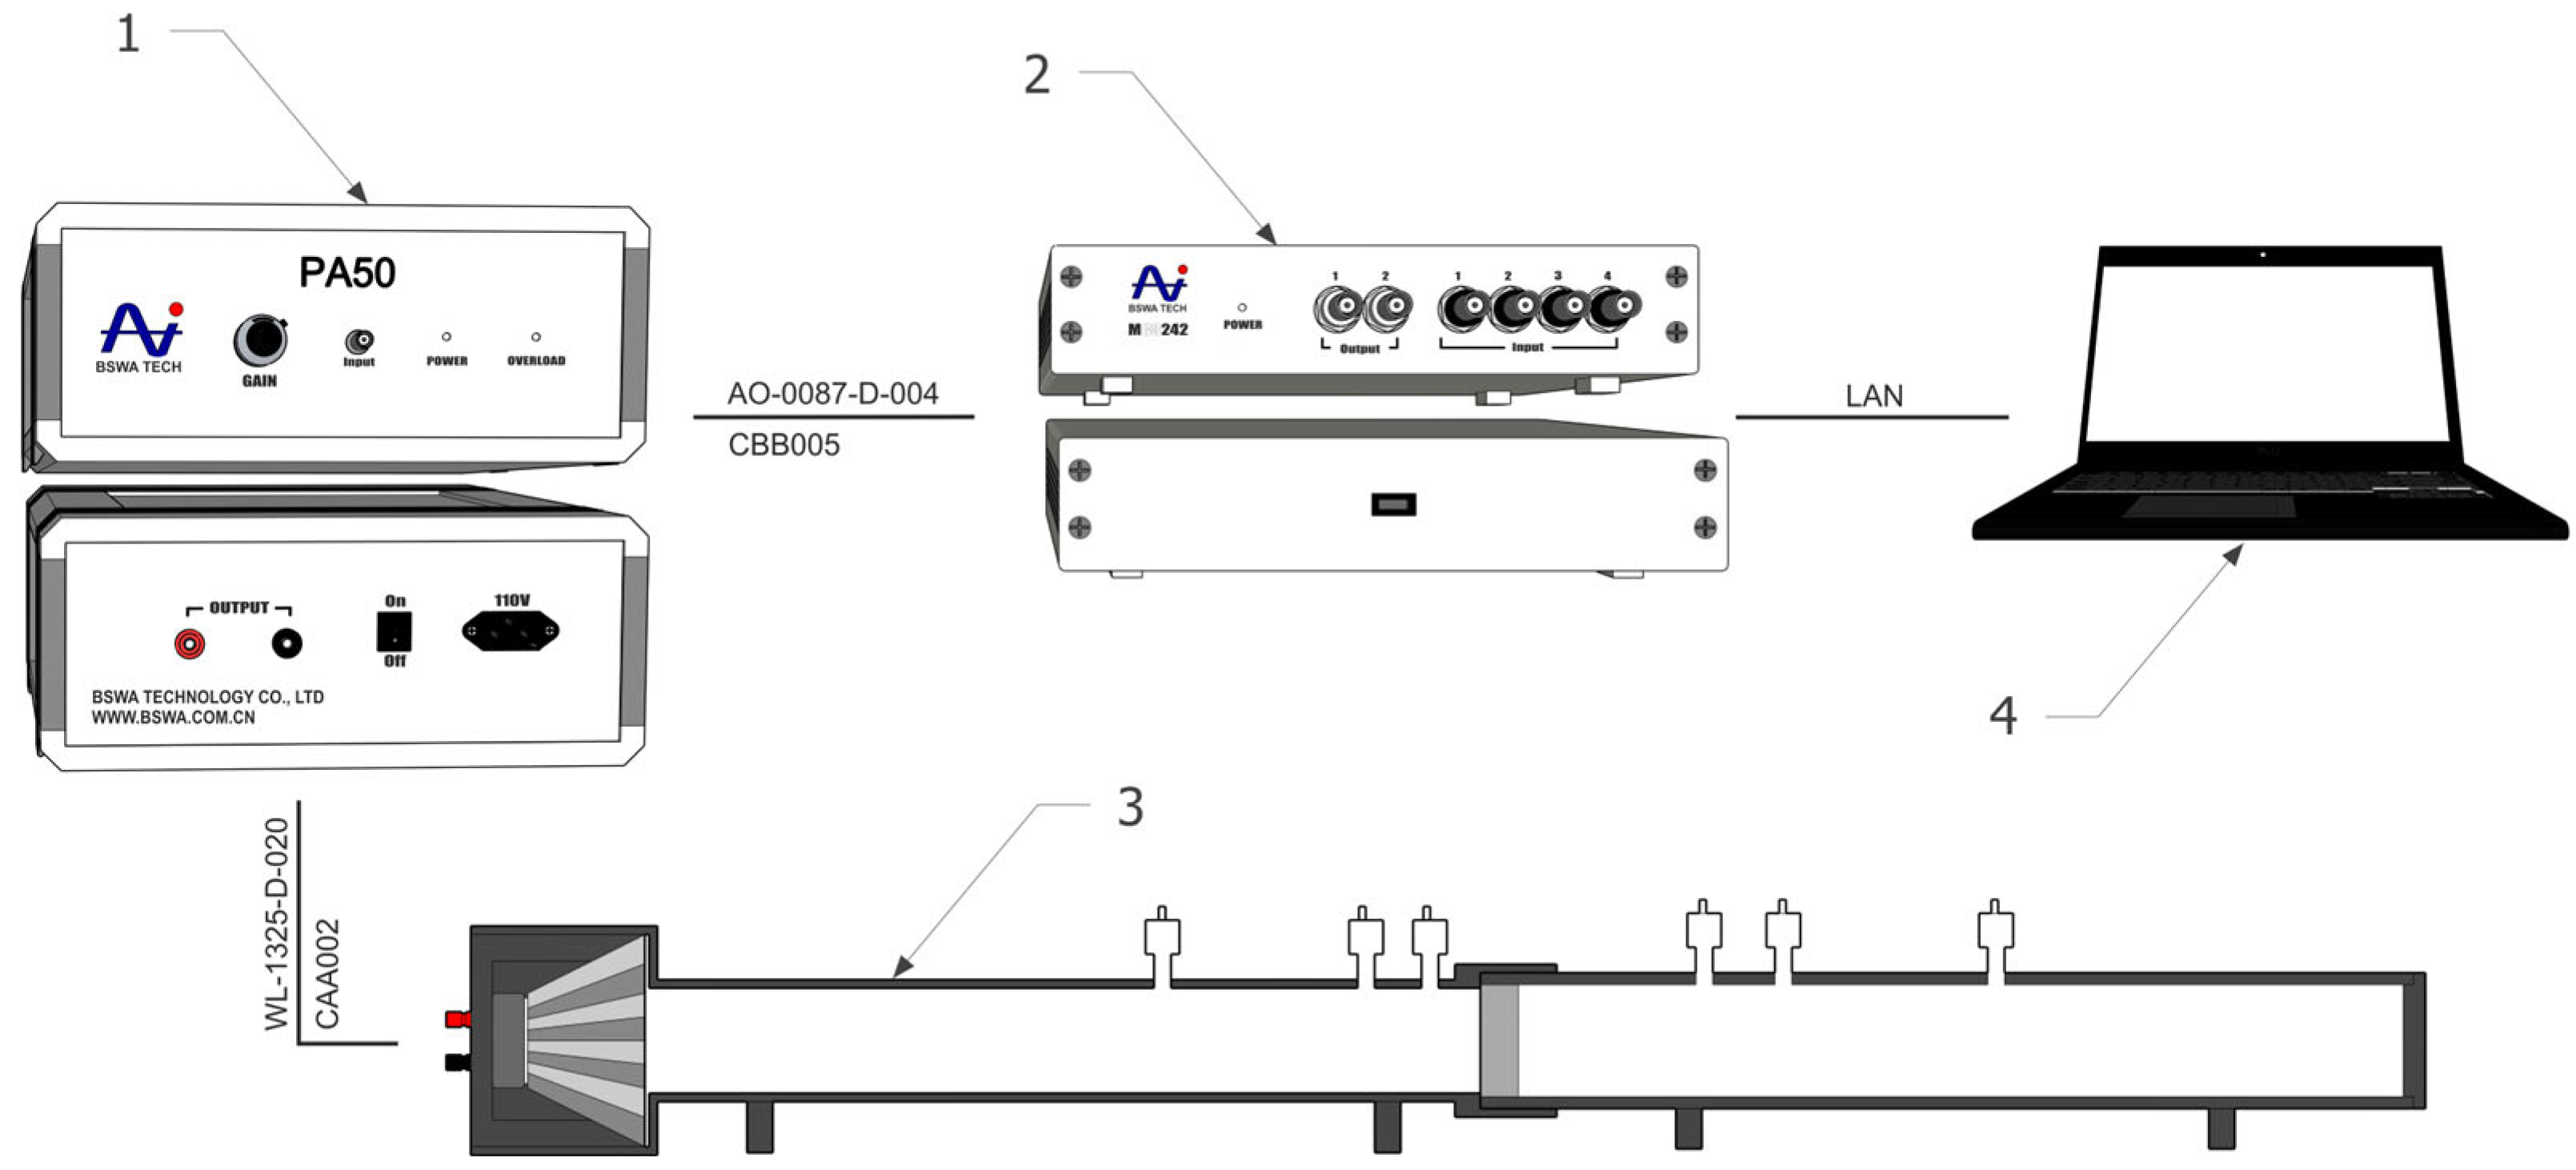
- Preparation for measurement: The compacted sample is then inserted into an impedance tube for accurate measurement of its acoustic properties, specifically transmission loss (TL, dB). Measurements follow the STN EN ISO 10534-2 standard, typically using the transfer function method, which employs two or more microphones to analyze the standing wave within the tube. The test cartridge prevents material spillage and ensures measurement repeatability. Results are processed using VA-Lab4 software, providing data on the acoustic behavior of the recycled material across the frequency range of 100 Hz to 2.5 kHz.
2.3. Characteristics of the Material Samples Tested
2.4. Measurement of Transmission Loss (TL) Using an Impedance Tube
- Compaction of samples using calibrated equipment with precisely set pressure (for more details, see Section 2.2).
- Sorting rubber crumb particles by sieving through sieves with standardized holes.
- Stabilization of samples in an air-conditioned environment prior to measurement.
2.5. Methods of Data Analysis and Processing
2.5.1. Transfer Matrix Method
- If τf × 100% → 100%, the output power equals the input power, meaning there is no attenuation (0 dB attenuation).
- If τf × 100 % → 50%, about 50% of the input power is transmitted, which corresponds to a transmission loss of approximately 3 dB.
- If τf × 100% → 10%, about 10% of the input power is transmitted, which corresponds to a transmission loss of approximately 10 dB.
- If τf × 100% → 0%, almost no input power is transmitted, indicating nearly complete attenuation.
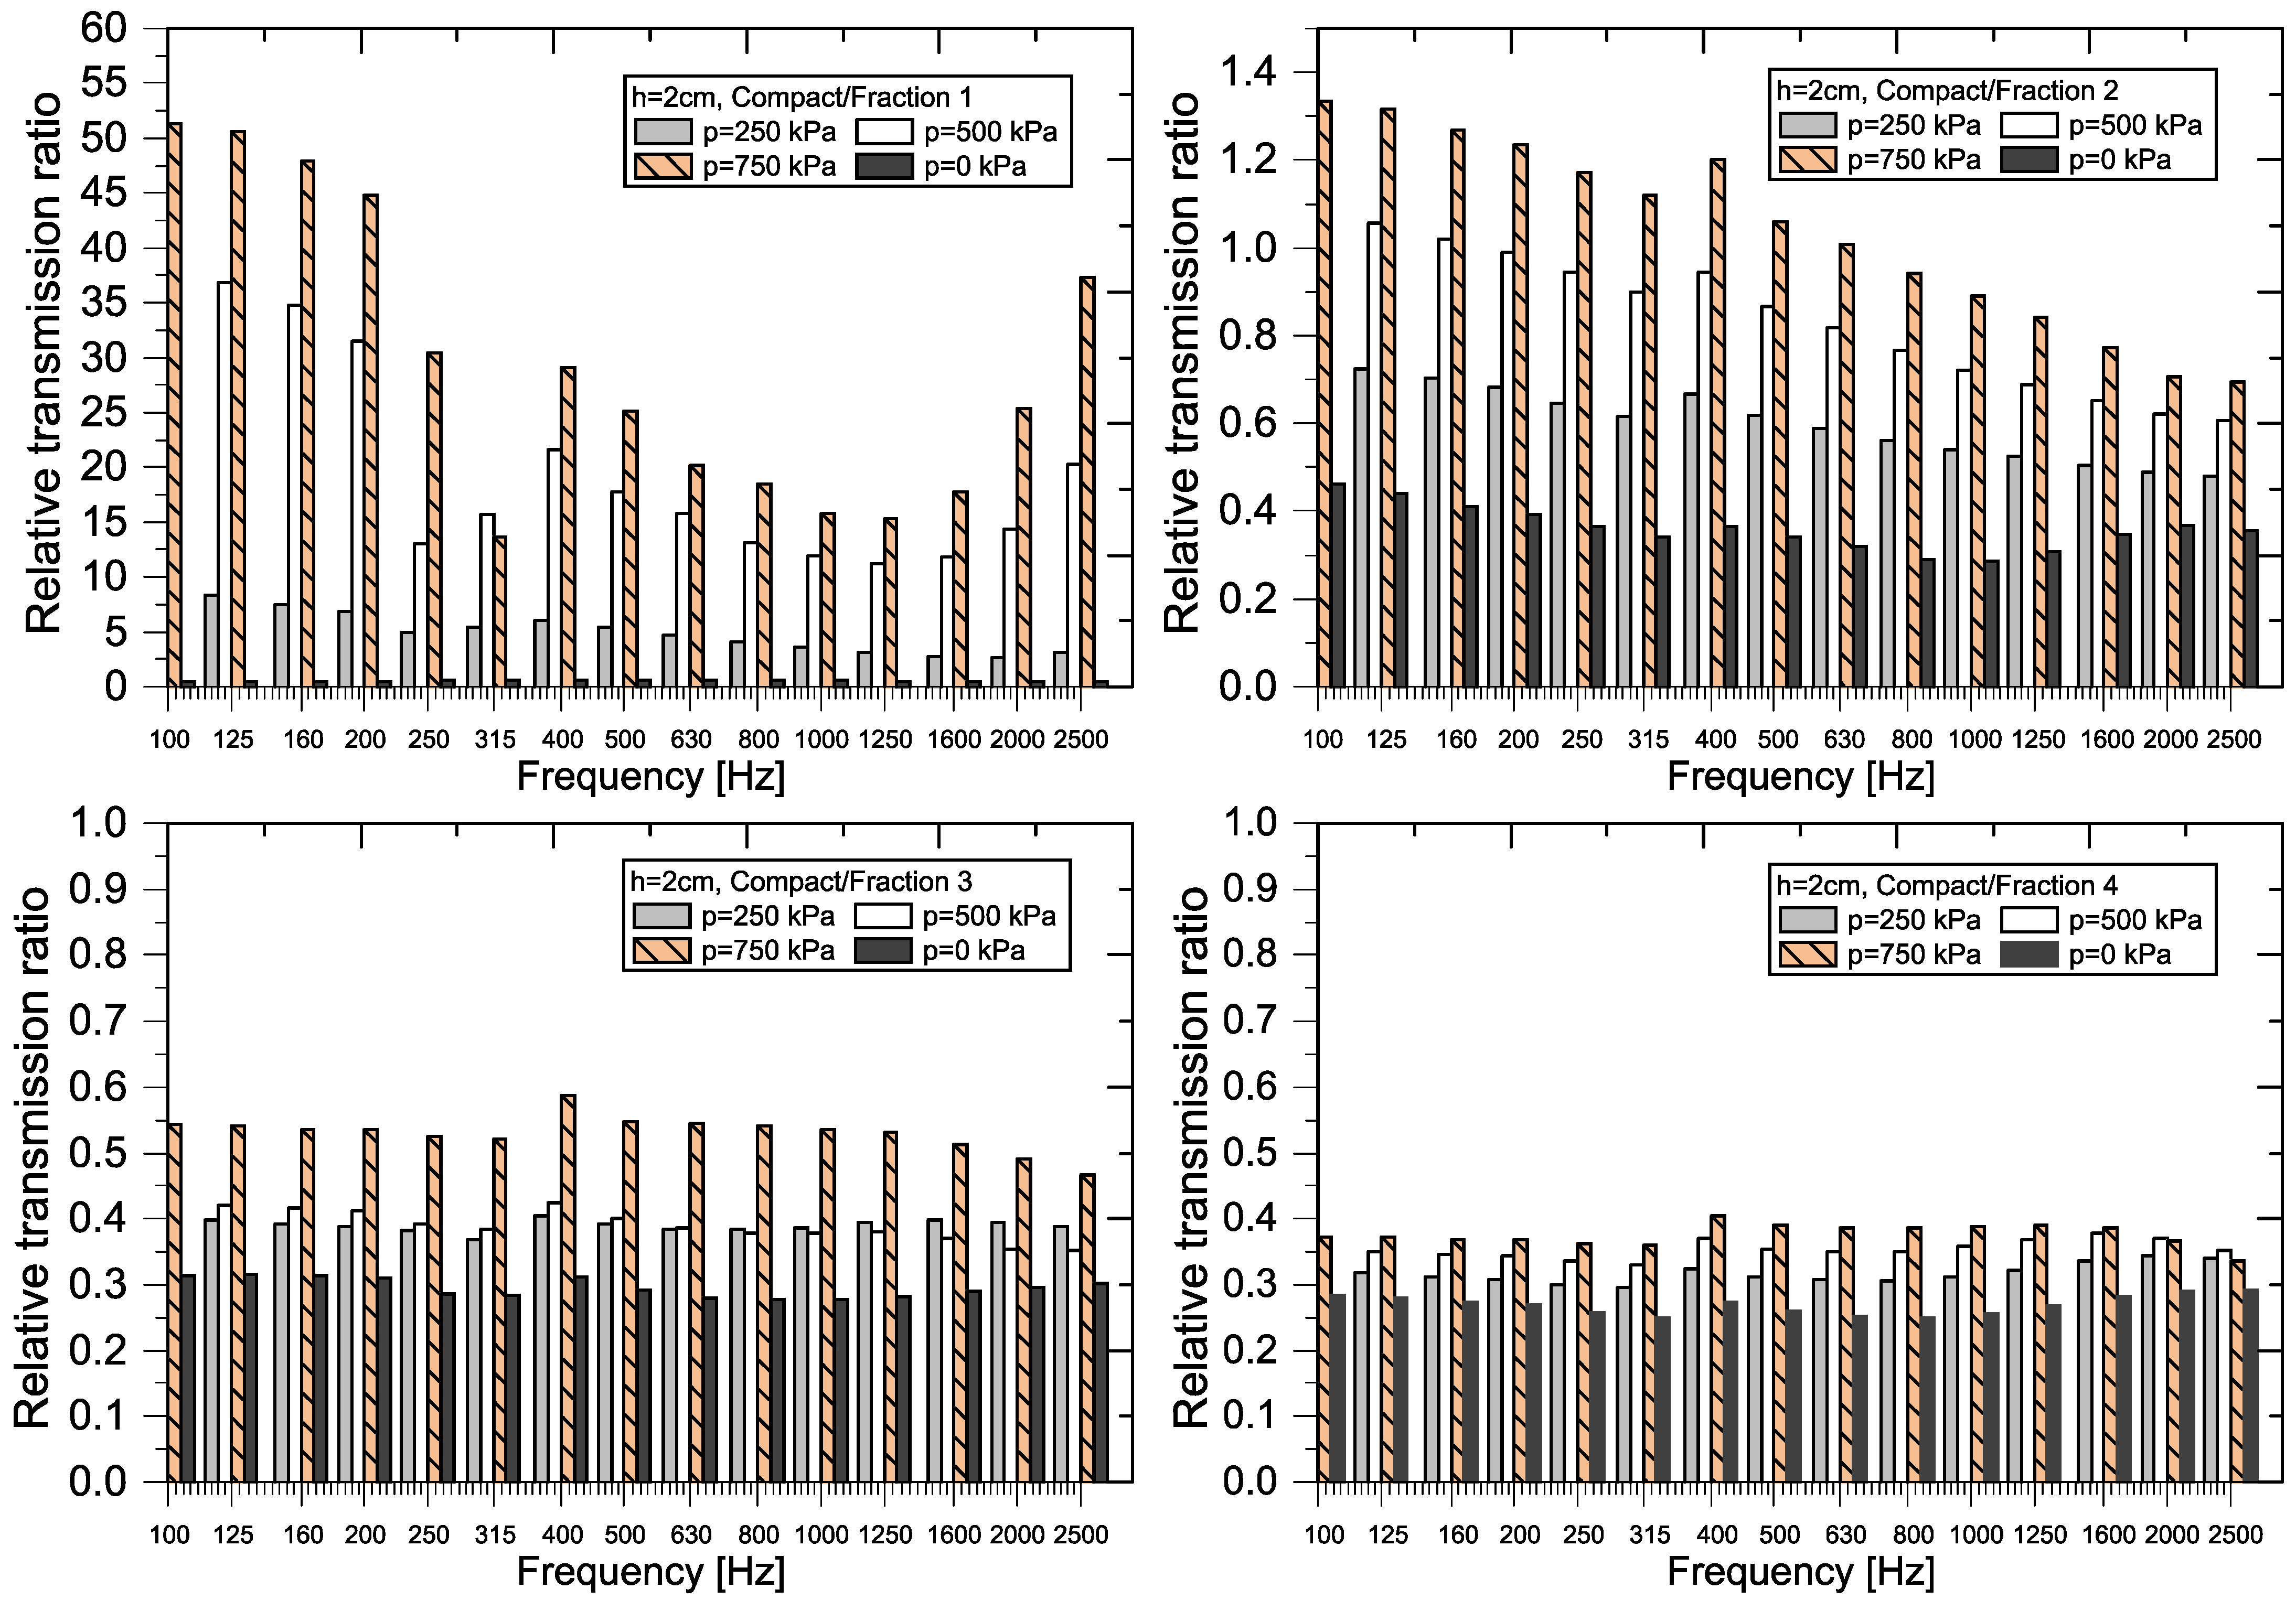
- If RTRf > 1, sample A transmits more input power at the given frequency than sample B. This indicates sample A has lower transmission loss (less power loss) compared to sample B.
- If RTRf < 1, sample A transmits less input power at the given frequency than sample B. This means sample A has greater transmission loss (more power loss) compared to sample B.
- If RTRf ≈ 1, both samples transmit nearly the same amount of input power at the given frequency, indicating similar transmission loss between the two.
2.5.2. Regression Analysis
3. Results
3.1. Defining Variables
3.2. Acoustic Performance Evaluation of Recycled Rubber Crumb
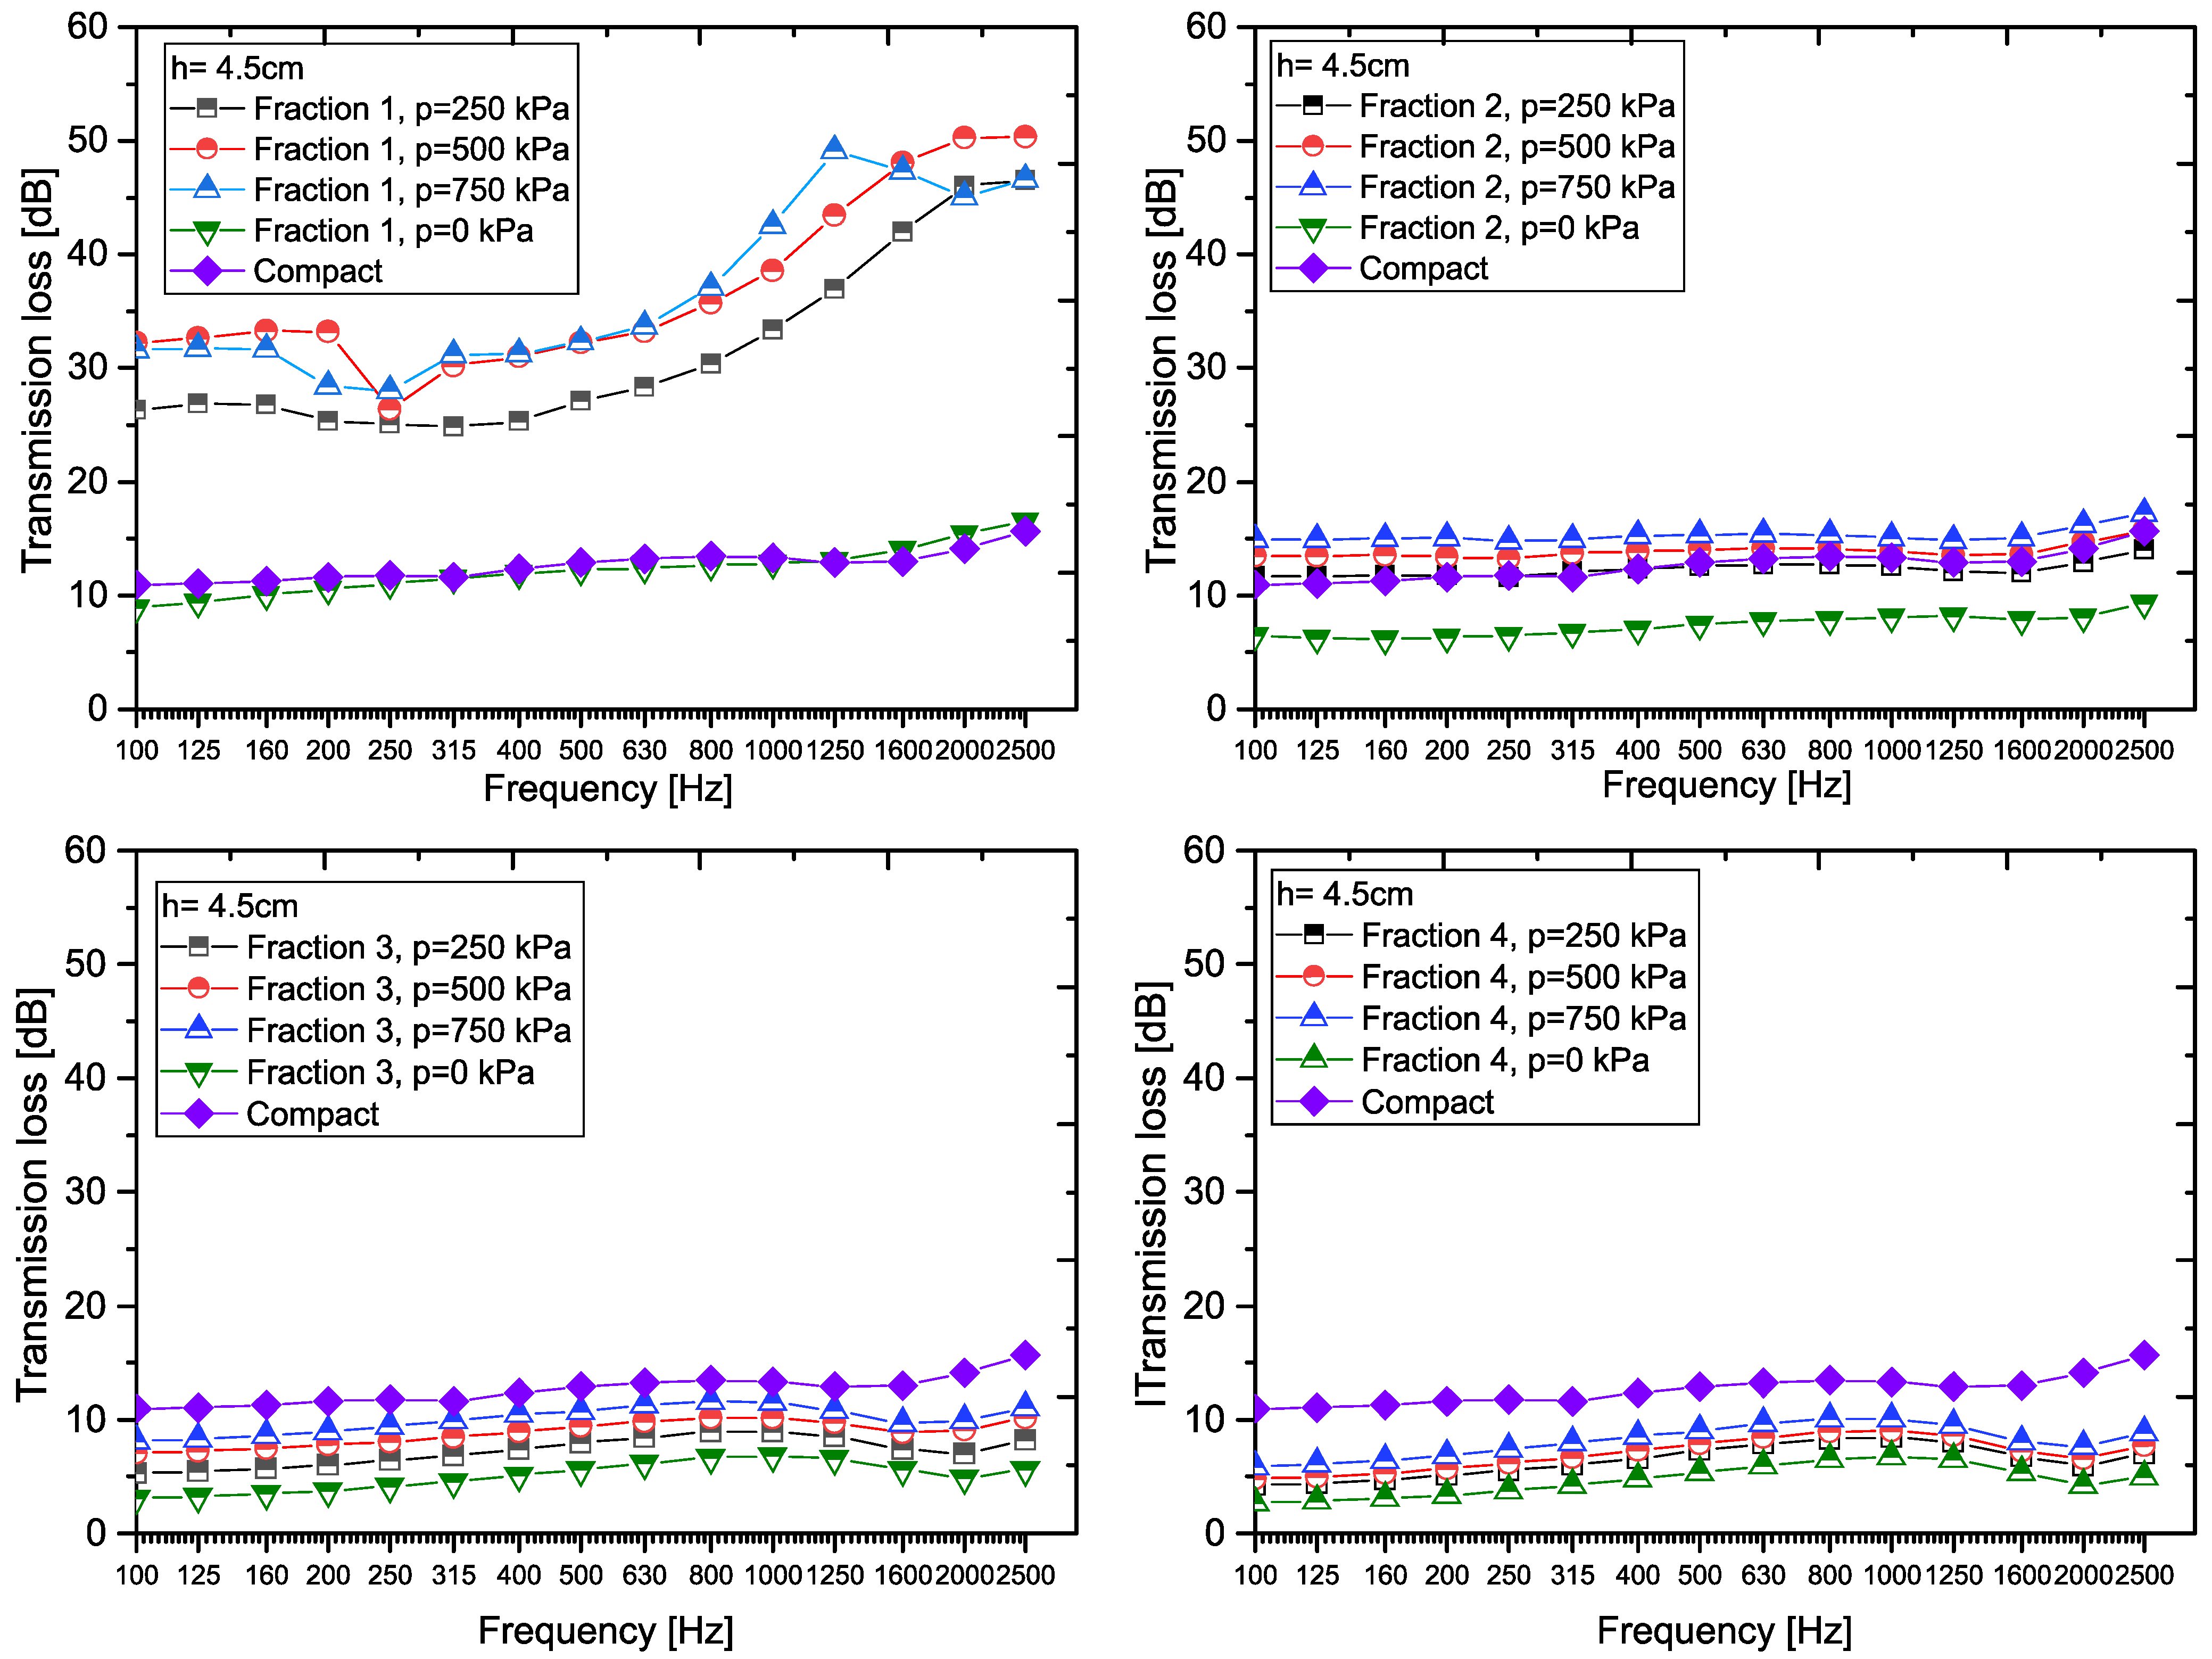
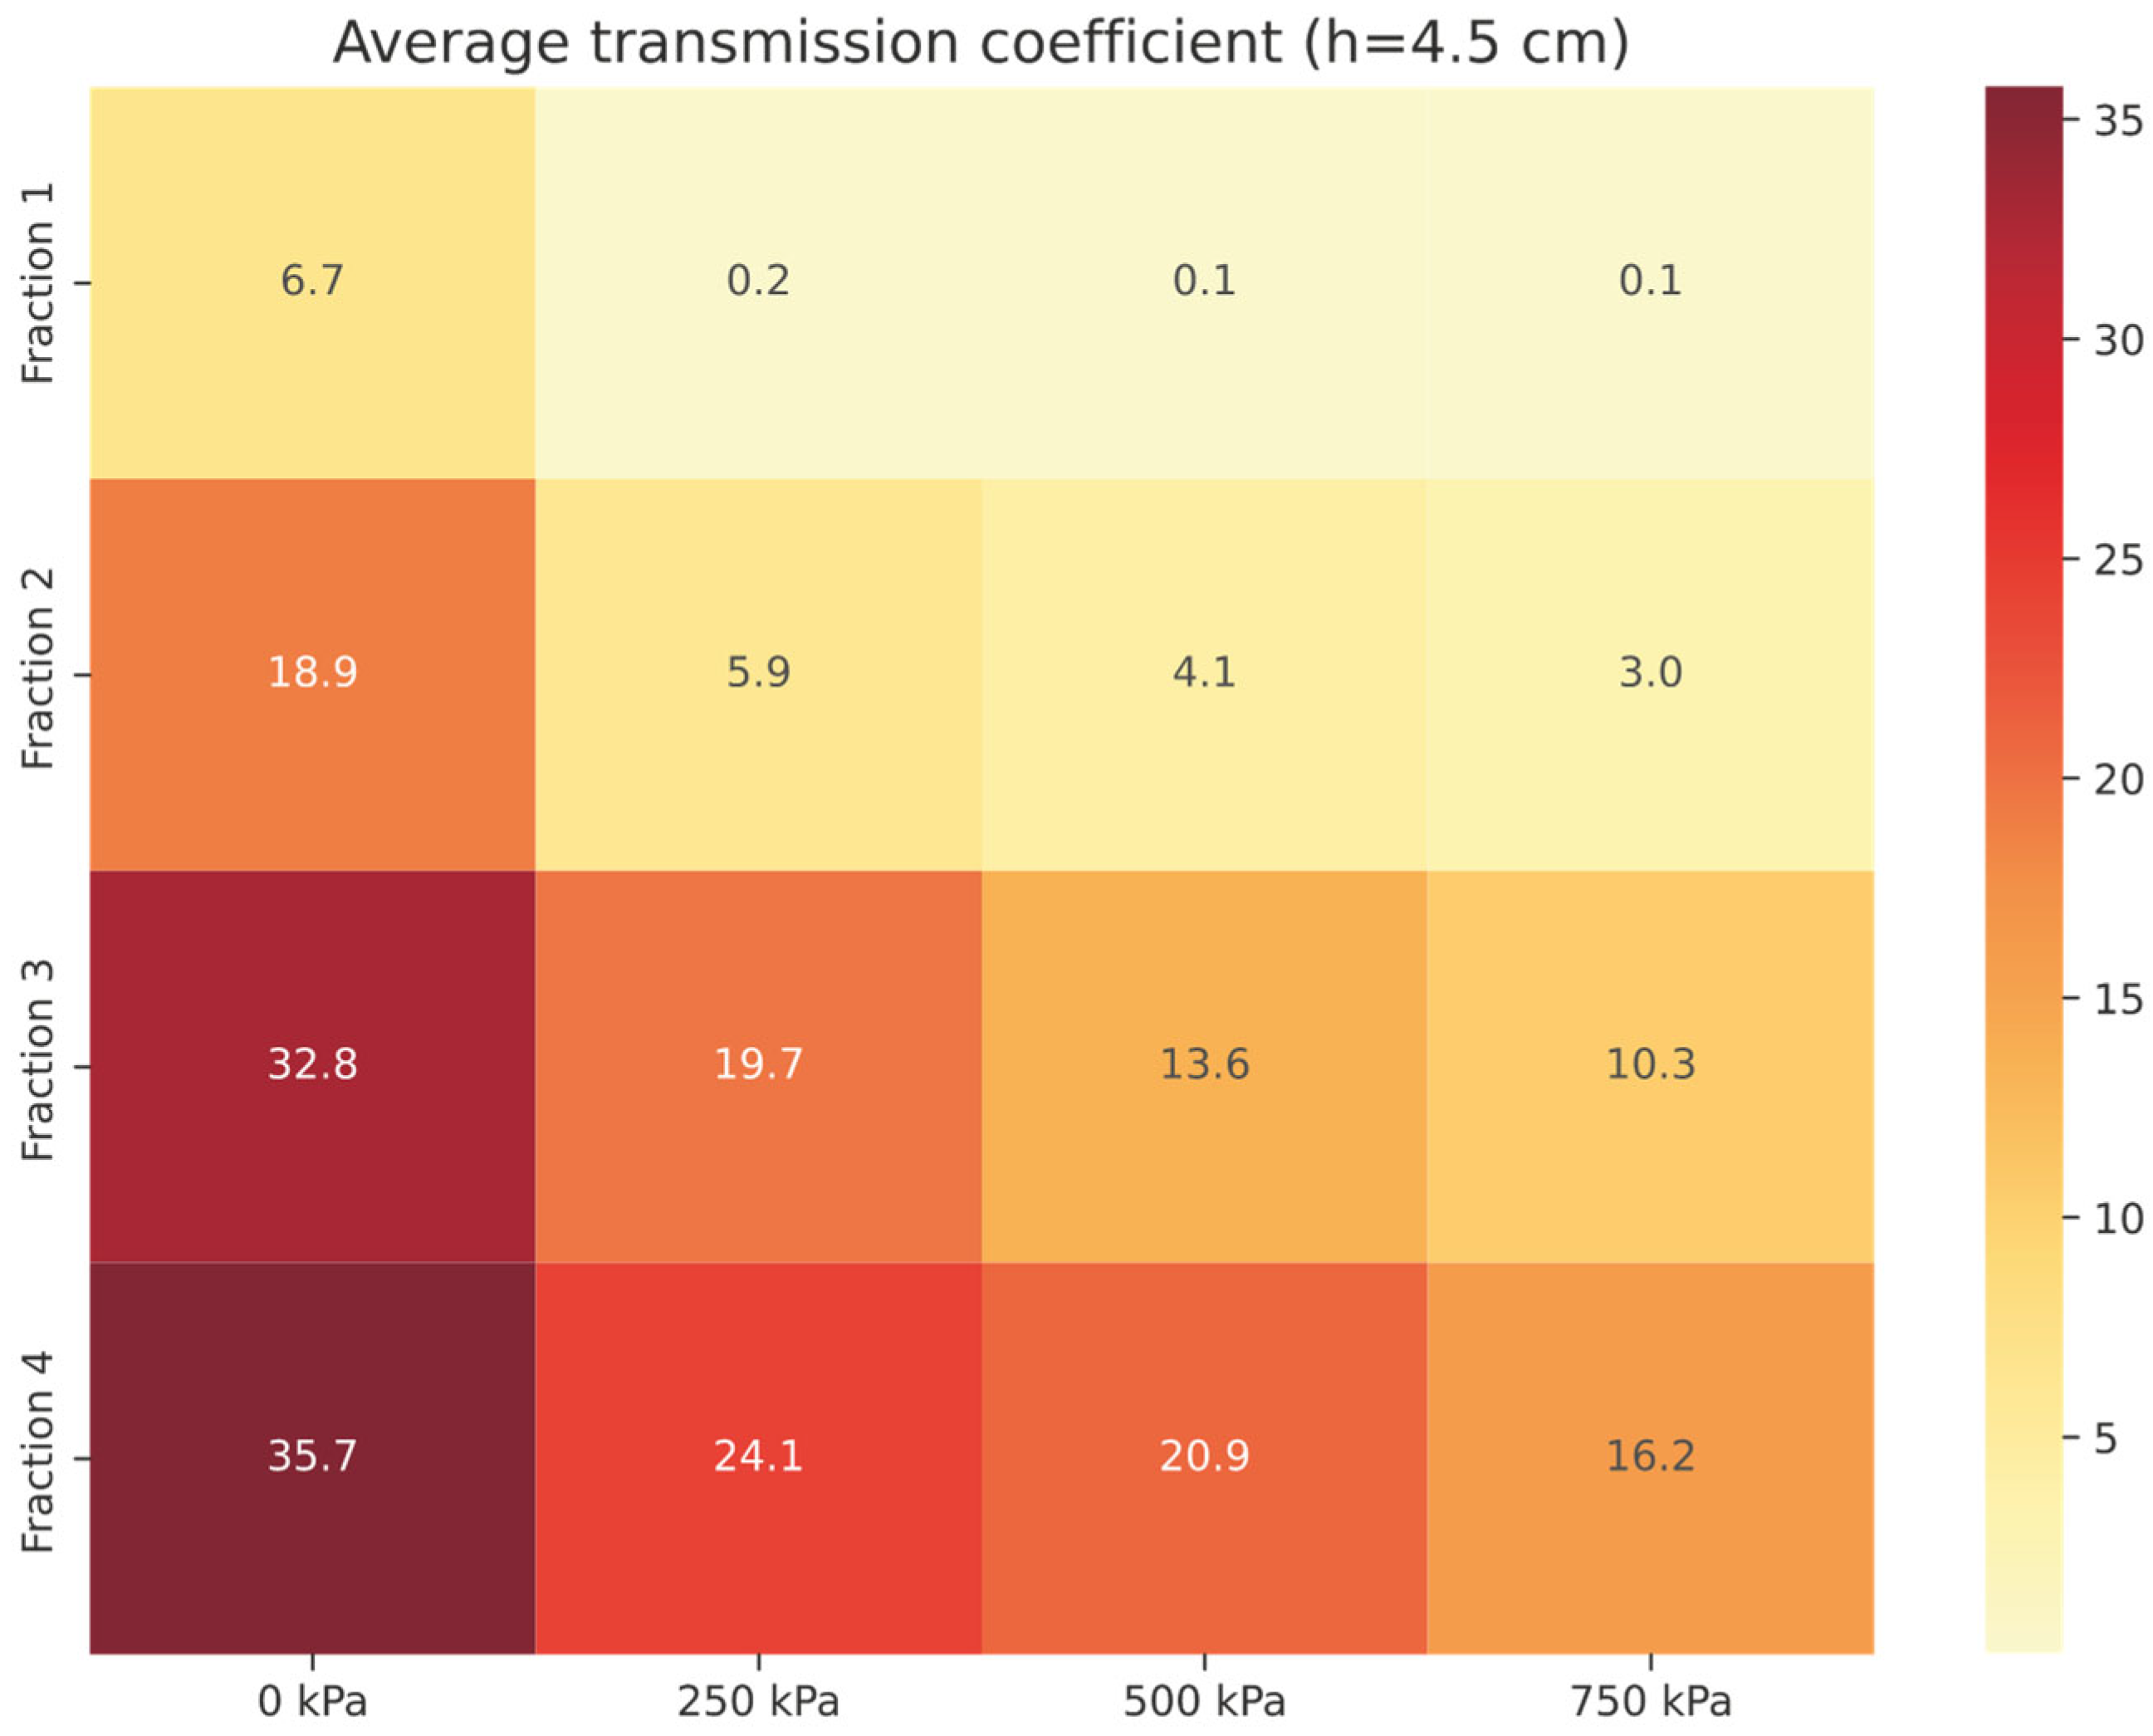
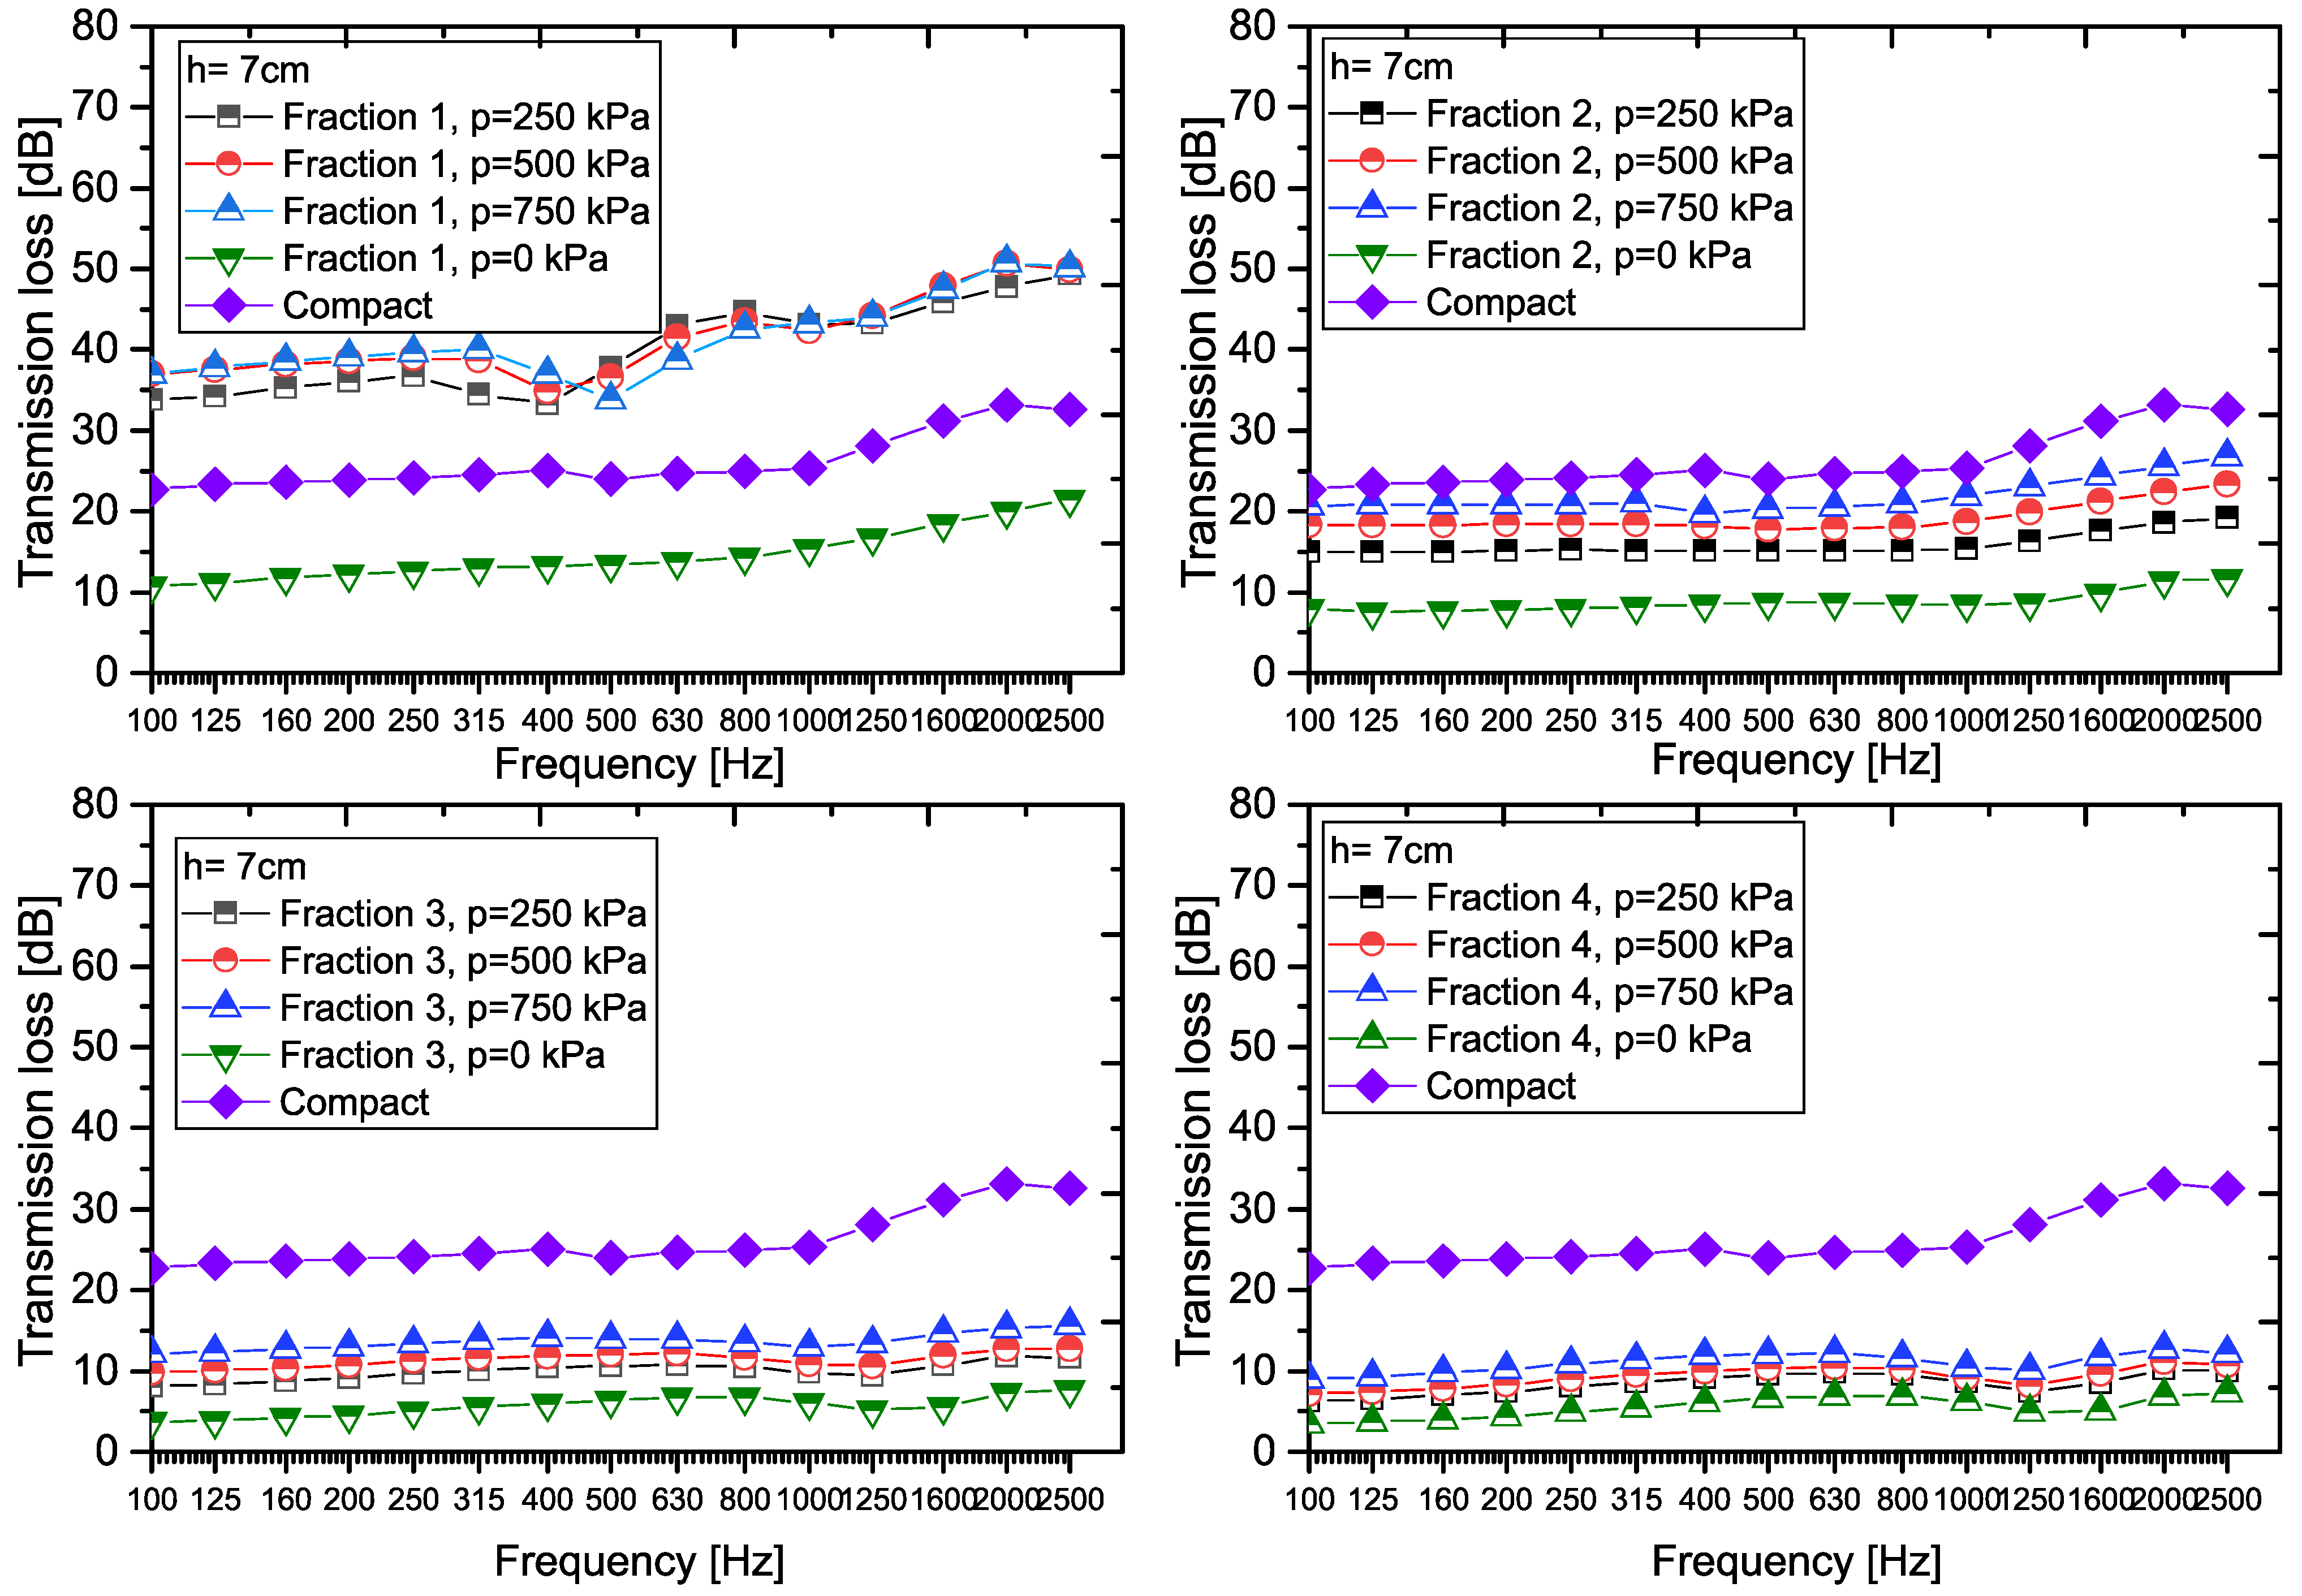
3.2.1. Transmission Loss and Transmission Coefficient Analysis
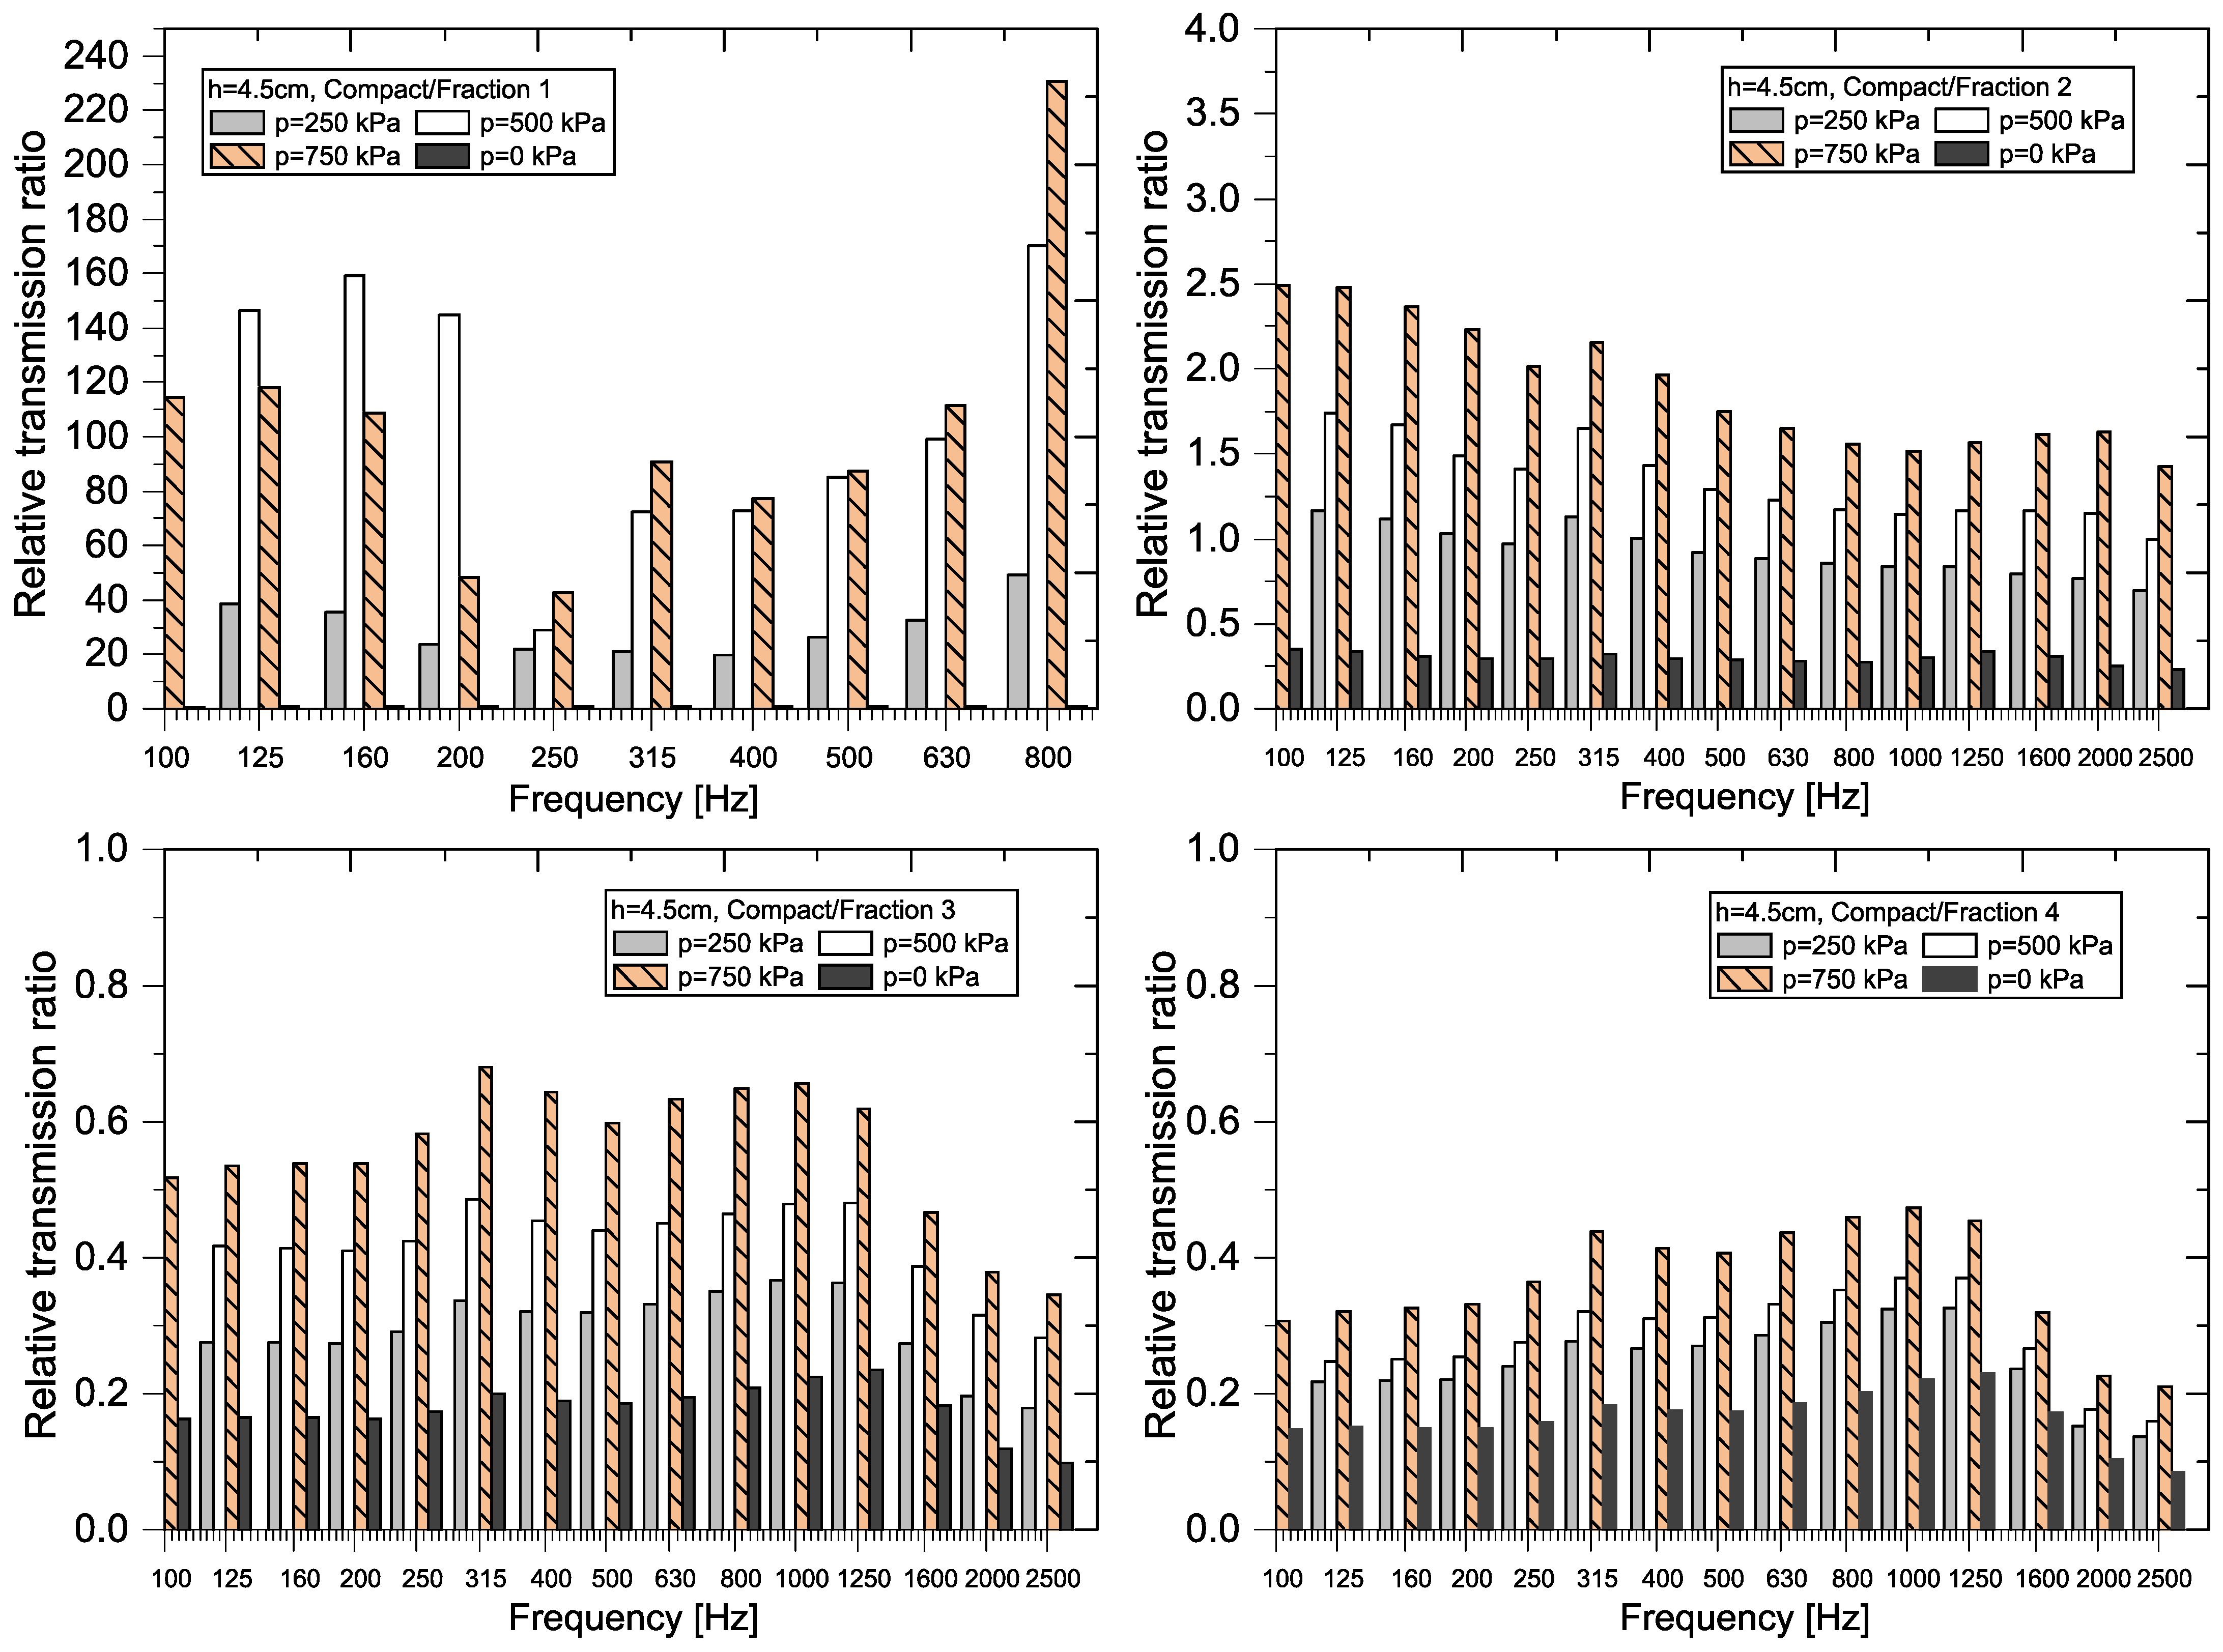
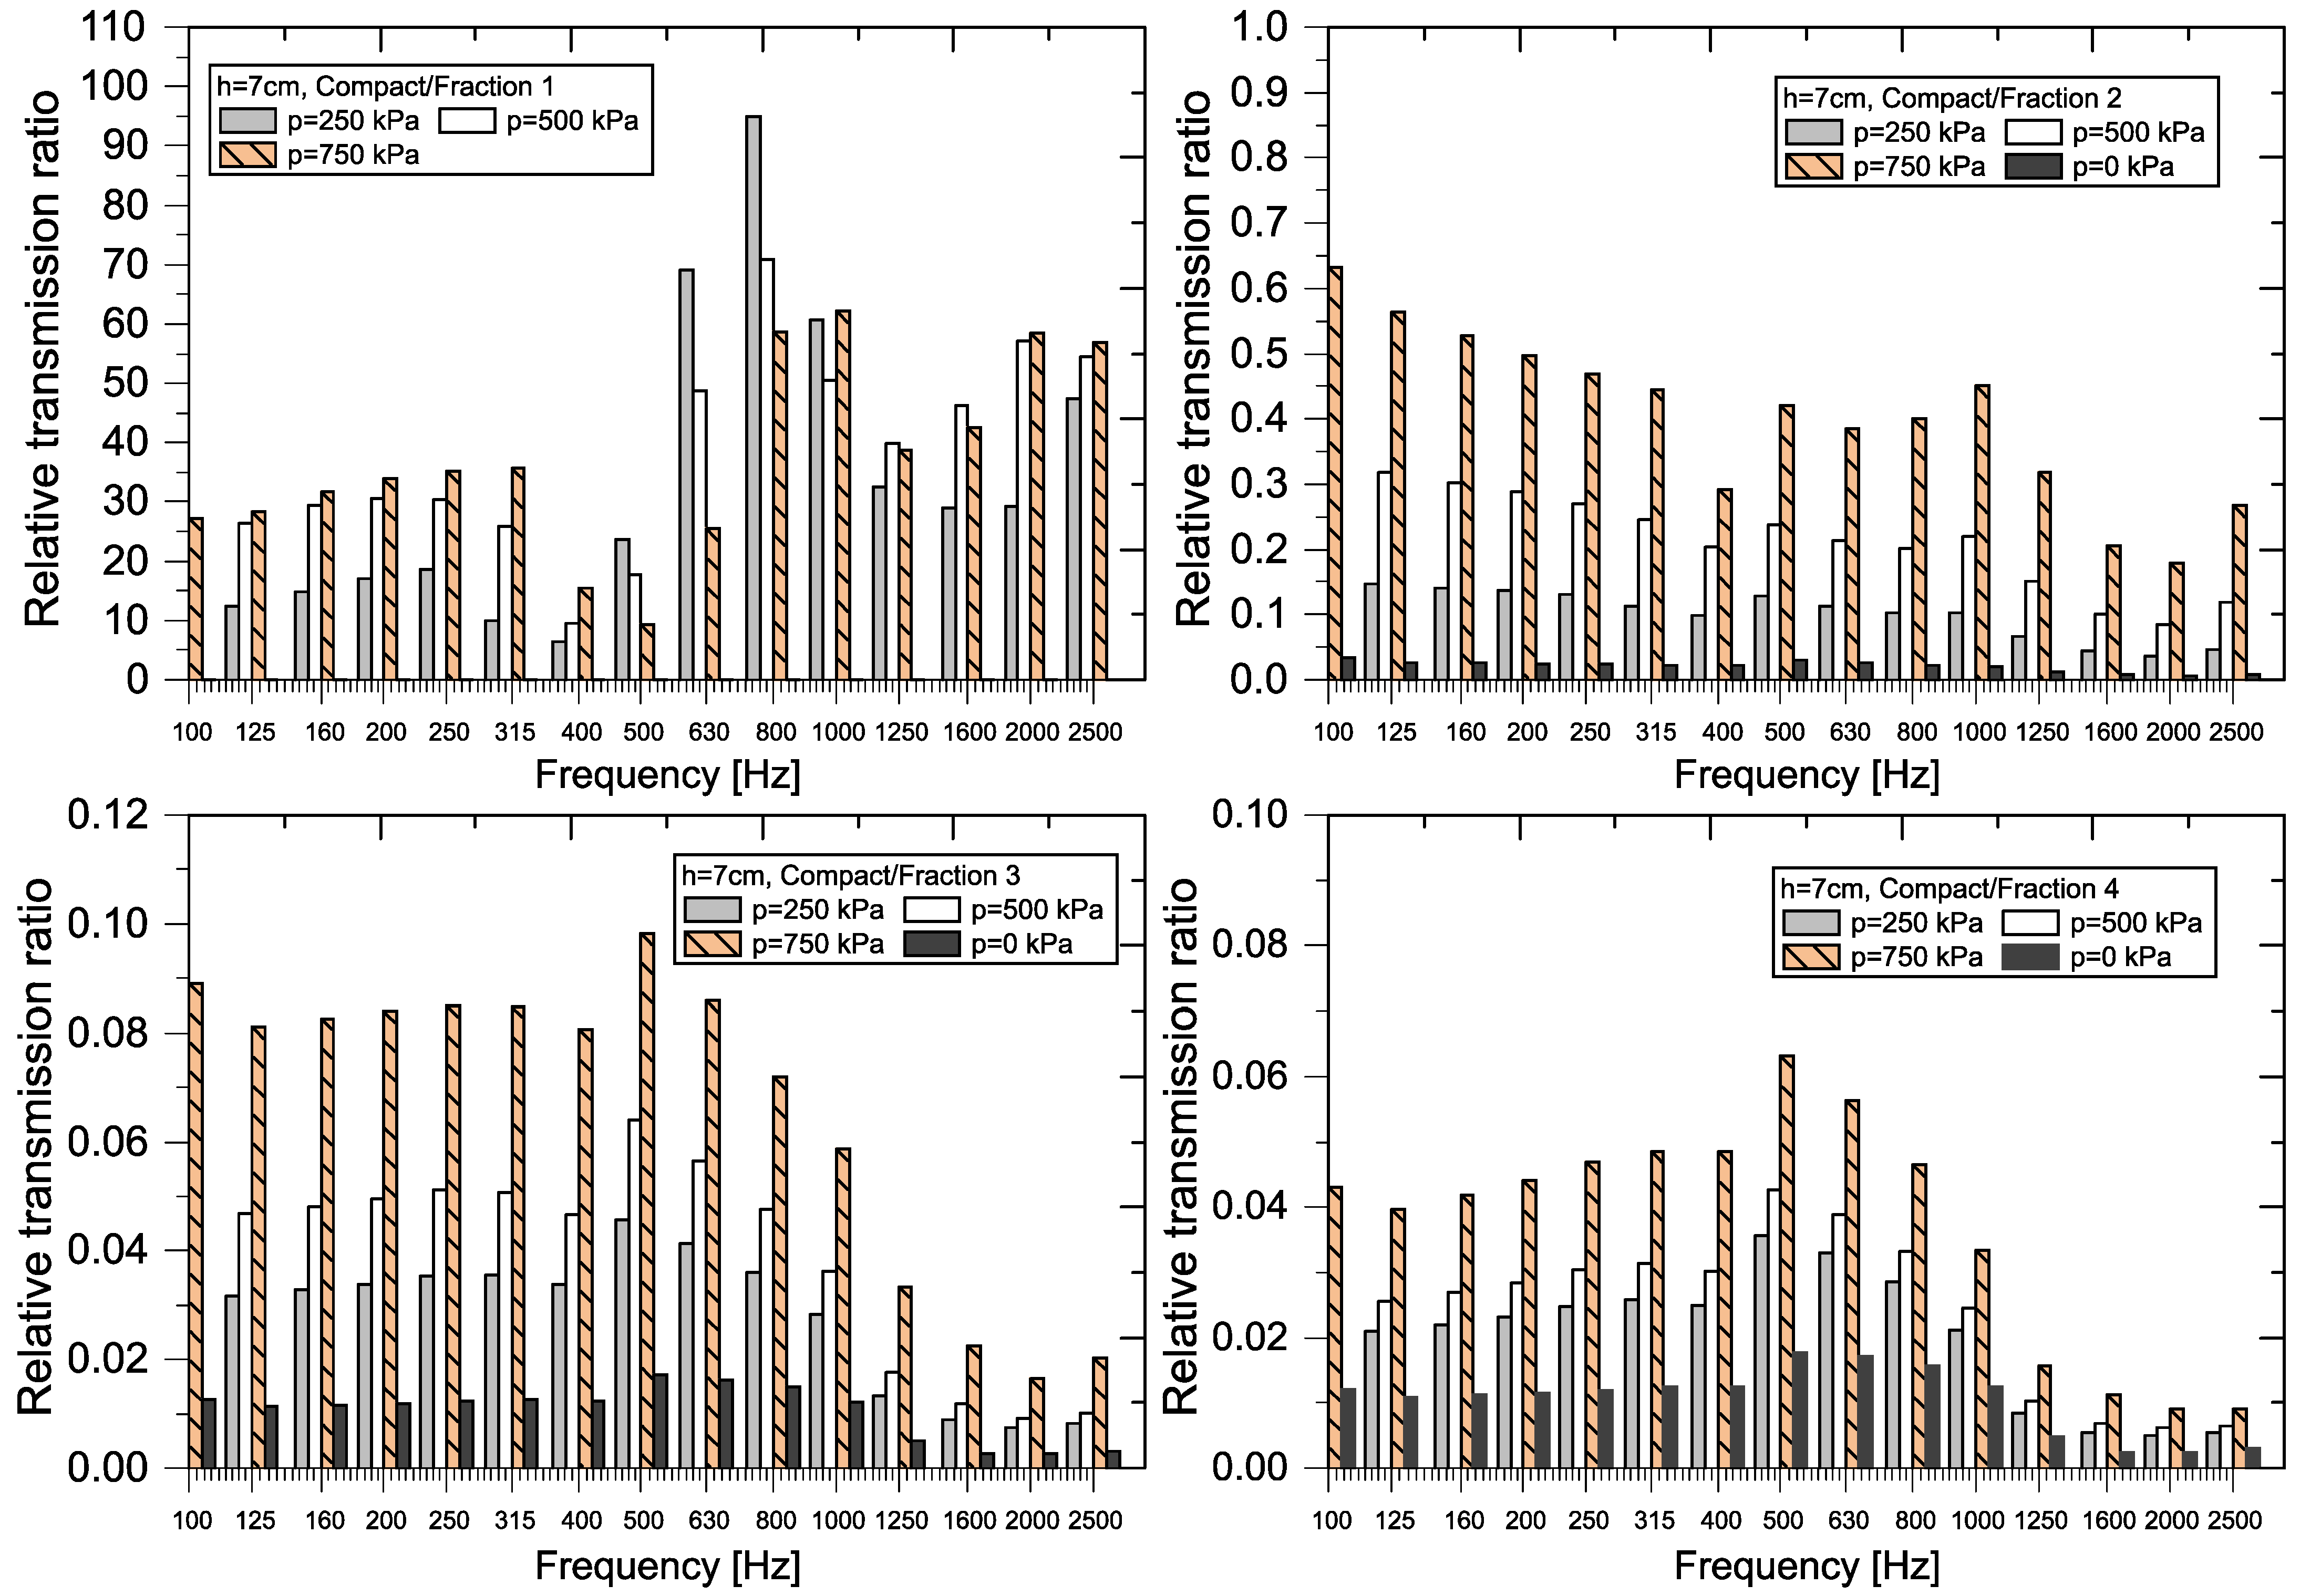
3.2.2. Comparison of Samples Using the Relative Transmission Ratio (RTR)
3.3. Model Development via Regression Analysis
- Fraction 1: the pressure variable (p) has the most significant effect on transmission loss, with the thickness (h) of the samples having a slightly smaller effect.
- Fraction 2: the interaction between the variable h and the variable p (p × h) has the most significant influence.
- Fraction 3: the variables pressure (p) and thickness (h) have a comparable effect on transmission loss.
- Fraction 4: the thickness variable (h) has the most significant effect on transmission loss; the other two variables have a comparable effect.
- Compact recyclable crumb: variable thickness (h) has by far the most significant influence on transmission loss.
4. Discussion and Conclusions
- Scientific and professional studies by the authors [15,26,37] focus on the analysis of the structure of individual materials and its influence on acoustic properties. The results of the research show that Fraction 1 has the best soundproofing properties, which is reflected in the lowest value of the transmission coefficient. This trend is in line with the law of mass, according to which smaller particles form a more compact structure with a higher density, resulting in more effective sound damping. The authors [26,37] state in their publications that the size of the fraction and compactness of materials significantly affect acoustic properties, while smaller and more compact particles improve the ability of the material to dampen the propagation of sound waves. This knowledge provides a theoretical basis for optimizing the composition and structure of materials in order to achieve a higher level of sound insulation.
- The results of experimental measurements show that thicker samples of material have much better sound insulation properties than thinner samples. This phenomenon is due to the fact that with a greater thickness of material, several factors are better applied together—in particular, the higher mass, the ability of the material to absorb vibrations (viscoelastic damping), and a more complex internal structure. These findings are also confirmed by other authors [3,4], who emphasize that it is the combination of a higher specific gravity and a more complex structure that is key to the best possible sound insulation.
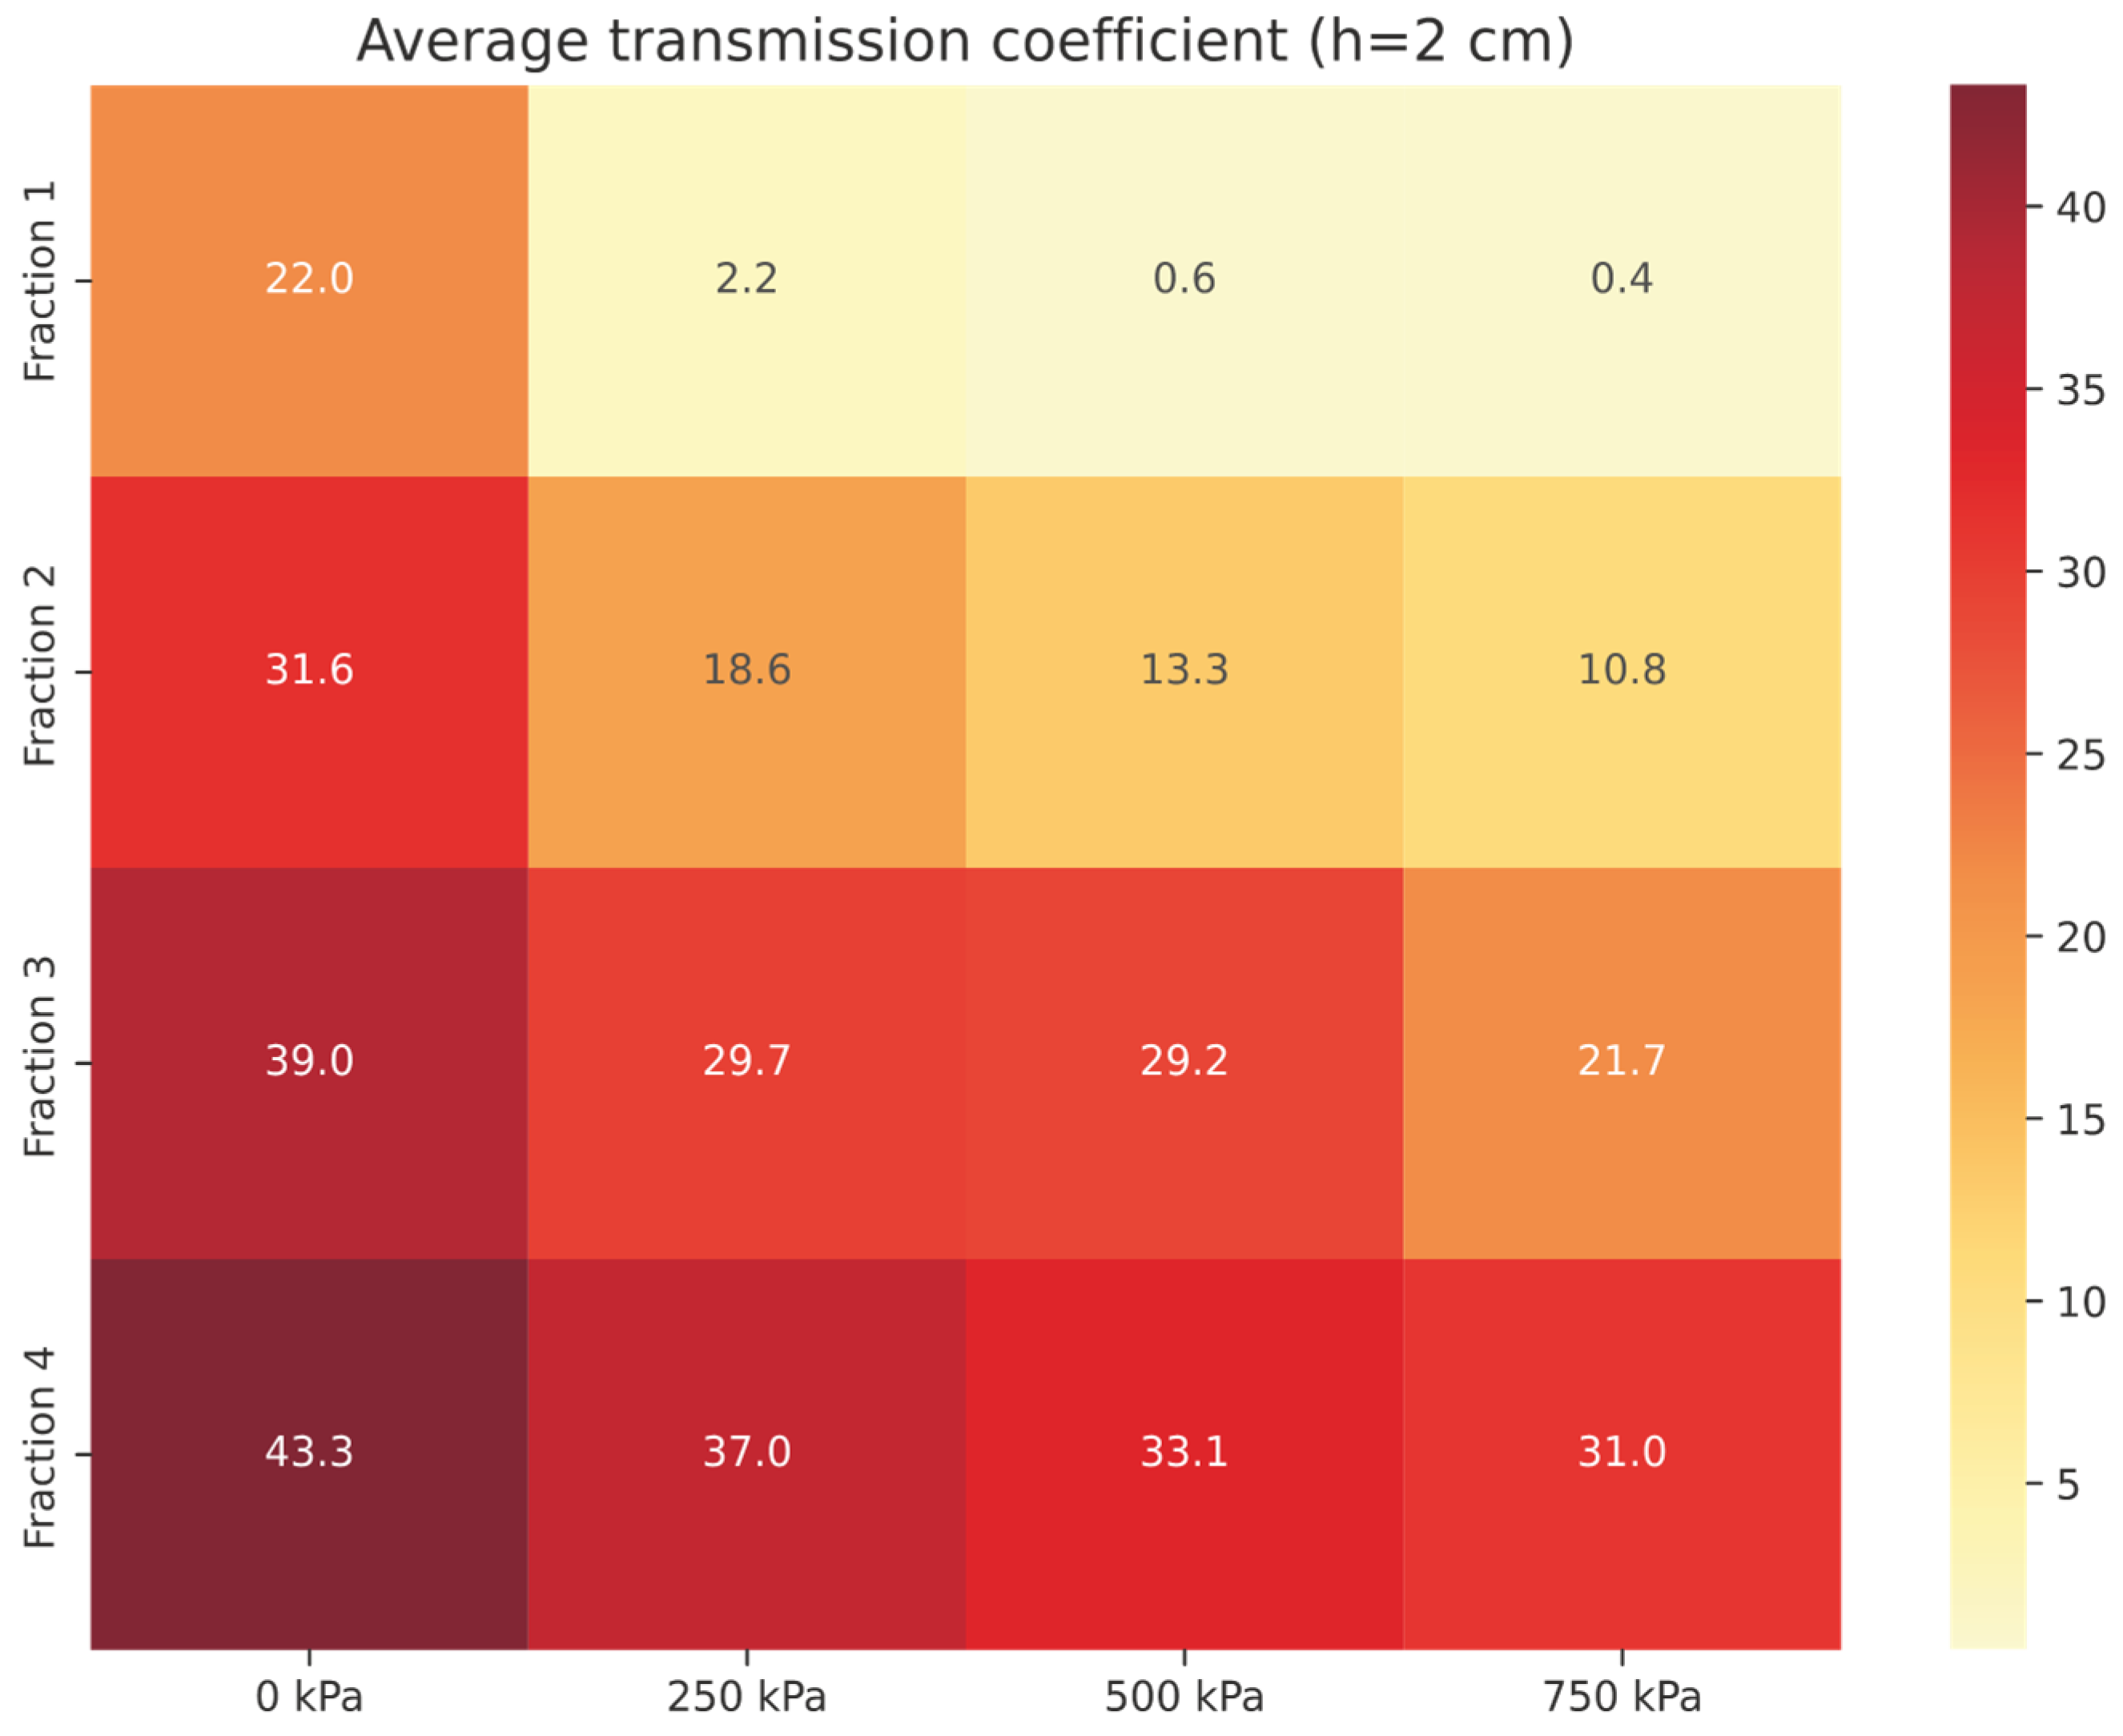
- Experimental results show that with increasing pressure, the porosity of the material decreases, and its density increases. These changes lead to a decrease in the value of the transmission coefficient τf in all the investigated fractions, which means that the material better prevents the attenuation of sound. The most pronounced effect was observed in Fraction 1, where the difference in attenuation between the loose granular material and the sample exposed to pressure (p = 750 kPa) was very significant. This clearly confirms that mechanical compression, i.e., compaction of the material, significantly improves its acoustic properties. This positive effect is mainly due to the fact that compression eliminates air gaps, creating a more homogeneous and dense material structure that better absorbs and dissipates sound energy.
- The analysis of the transmission coefficients of recycled rubber crumb shows that this material has significant potential as an effective sound insulation element, especially when using fine fractions exposed to pressure. The frequency dependence of the transmission coefficients corresponds to the theoretical assumptions of acoustics of porous materials, which is also confirmed by several scientific studies [3,15,23]. These results suggest that recycled rubber crumb may be a suitable alternative for applications aimed at improving sound insulation.
- The analysis confirmed that the acoustic properties of recycled rubber crumb are significantly influenced by the synergistic action of the mass law, structural heterogeneity, and resonance phenomena. The increase in the thickness of the samples caused the critical frequency to shift to a lower frequency band, which has a significant impact on the effectiveness of sound insulation. For practical use, it is recommended to combine fractions of different sizes and apply a layered structure of the material, which will achieve more effective suppression of broad-spectrum noise.
- Fraction 3 and Fraction 4: these fractions are not recommended for use if the goal is to achieve better transmission loss, as their acoustic insulation properties are insufficient.
- Fraction 1: Loose granular RRC (at a pressure of 0 kPa) is not suitable for use, as it does not provide sufficient attenuation. On the contrary, it is recommended to apply a pressure of 500 kPa or 700 kPa, which will significantly improve the acoustic properties of this fraction.
- Fraction 2: Loose granular RRC (0 kPa) or granular RRC with a pressure of 250 kPa is also not suitable, because the attenuation is low in these cases. The use of a pressure of 500 kPa or 700 kPa is recommended, with a greater sample thickness further improving the transmission loss values for this fraction.
5. Patents
Author Contributions
Funding
Institutional Review Board Statement
Informed Consent Statement
Data Availability Statement
Acknowledgments
Conflicts of Interest
References
- Niresh, J.; Neelakrishnan, S.; Subharani, S.; Kannaian, T.; Prabhakaran, R. Review of acoustic characteristics of materials using impedance tube. ARPN J. Eng. Appl. Sci. 2015, 10, 3319–3326. [Google Scholar]
- Arunkumar, B.; Jeyanthi, S. Design and analysis of impedance tube for sound absorption measurement. ARPN J. Eng. Appl. Sci. 2017, 12, 1400–1405. [Google Scholar]
- Desarnaulds, V.; Costanzo, E.; Carvalho, A.P.O.; Arlaud, B. Sustainability of acoustic materials and acoustic characterization of sustainable materials. In Proceedings of the 12th International Congress on Sound and Vibration (ICSV12), Lisbon, Portugal, 11–14 July 2005. [Google Scholar]
- Bhingare, N.H.; Prakash, S.; Jatti, V.S. A review on natural and waste material composite as acoustic material. Polym. Test. 2019, 80, 106142. [Google Scholar] [CrossRef]
- Berardi, U.; Iannace, G. Acoustic characterization of natural fibers for sound absorption applications. Build. Environ. 2015, 94, 840–852. [Google Scholar] [CrossRef]
- Ashby, M.F. Materials and the Environment, 3rd ed.; Butterworth-Heinemann: Oxford, UK, 2021; pp. 267–294. [Google Scholar]
- McGinnes, C.; Kleiner, M.; Xiang, N. An environmental and economical solution to sound absorption using straw. J. Acoust. Soc. Am. 2005, 118, 1869. [Google Scholar] [CrossRef]
- D’Alessandro, F.; Schiavoni, S.; Bianchi, F. Straw as an acoustic material. In Proceedings of the 24th International Congress on Sound & Vibration, London, UK, 23–27 July 2017. [Google Scholar]
- Colom, X.; Girbau, J.; Marin, M.; Formela, K.; Saeb, R.M.; Carrillo, F.; Cañavate, J. New approach in the reuse of modified ground tire rubber as thermal and acoustic insulation to be used in civil engineering. J. Mater. Cycles Waste Manag. 2023, 25, 3557–3566. [Google Scholar] [CrossRef]
- Sambucci, M.; Marini, D.; Sibai, A.; Valente, M. Preliminary mechanical analysis of rubber-cement composites suitable for additive process construction. J. Compos. Sci. 2020, 4, 120. [Google Scholar] [CrossRef]
- Sambucci, M.; Valente, M. Ground waste tire rubber as a total replacement of natural aggregates in concrete mixes: Application for lightweight paving blocks. Materials 2021, 14, 7493. [Google Scholar] [CrossRef]
- Sambucci, M.; Marini, D.; Valente, M. Tire recycled rubber for more eco-sustainable advanced cementitious aggregate. Recycling 2020, 5, 11. [Google Scholar] [CrossRef]
- Akiwate, D.; Mohan, S.R.; Venkatesham, B.; Suryakumar, S. Acoustic characterization of additive manufactured layered porous materials. In Proceedings of the 48th International Congress and Exhibition on Noise Control Engineering (INTERNOISE 2019), Madrid, Spain, 16–19 June 2019. [Google Scholar]
- Labašová, E.; Ďuriš, R. Measurement of the Acoustic Absorption Coefficient by Impedance Tube. Res. Pap. Fac. Mater. Sci. Technol. Slovak Univ. Technol. 2019, 27, 94–101. [Google Scholar] [CrossRef]
- Sandu, C.; Totu, A.G.; Trifu, A.T.; Deaconu, M. Advances in Experimental Research on the Influence of Friction Powders on Acoustic Liners (Helmholtz Resonators). Aerospace 2023, 10, 1000. [Google Scholar] [CrossRef]
- Vasile, O.; Iaşnicu, I.; Iatan, R. The analysis of sound absorbing performances for composite plates containing recycled textile wastes. U.P.B. Sci. Bull. Ser. D 2016, 78, 213–220. [Google Scholar]
- Djikou, M.S.; Houngan, C.A.; Anjorin, M.; Vianou, A.; Degan, G. Measurement of the acoustic absorption coefficient of some local building materials for residential buildings using the kundt tube method. In Proceedings of the 33rd International Conference on Vibroengineering (Procedia), Zittau, Germany, 24–26 September 2018. [Google Scholar]
- Suhanek, M.; Jambrosic, K.; Domitrovic, H. Student project of building an impedance tube. J. Acoust. Soc. Am. 2008, 123, 3616. [Google Scholar] [CrossRef]
- Pierre, J.; Guillermic, R.-M.; Elias, F.; Drenckhan, W.; Leroy, V. Acoustic characterisation of liquid foams with an impedance tube. Eur. Phys. J. E 2013, 36, 113. [Google Scholar] [CrossRef]
- Koruk, H. An assessment of the performance of impedance tube method. Noise Control Eng. J. 2014, 62, 264–274. [Google Scholar] [CrossRef]
- Tan, W.H.; Ahmad, R.; Zunaidi, N.H.; Daud, R.; Cheng, E.M. Development of an Indigenous Impedance Tube. Appl. Mech. Mater. 2015, 786, 149–155. [Google Scholar] [CrossRef]
- Neto, B.; Pereira, I.; Futatsugi, S.; Mareze, P.; Brandão, E.; Fonseca, W. Experimental analysis of the dispersion in the measurement of the absorption coefficient with the impedance tube. In Proceedings of the 47th International Congress and Exposition on Noise Control Engineering (INTERNOISE 2018), Chicago, IL, USA, 26–29 August 2018. [Google Scholar]
- Ipek, O.; Koru, M.; Serce, O.; Karabulut, H.; Hıdıroglu, M. Determining sound absorbing and transmission loss properties of rubbers used in automotive industries. Eurasia Proc. Sci. Technol. Eng. Math. 2018, 4, 137–148. [Google Scholar]
- Designing Acoustics in Industry. Available online: https://www.isover-technical-insulation.com/ (accessed on 13 May 2025).
- Ivanova, Y.; Partalin, T. Experimental study of acoustical properties of recycled rubber panels. Eurasia Proc. Sci. Technol. Eng. Math. 2024, 32, 379–388. [Google Scholar] [CrossRef]
- Canli, E.; Sertkaya, A.A.; Canli, E.; Sarikaya, A.; Güler, C. Determination of Sound Absorption Coefficient and Transmission Loss Properties of Almond Shell Particle Boards. In Proceedings of the 5th International Conference on Materials Science, Mechanical and Automotive Engineering and Technology (IMSMATEC’22), Nevşehir, Türkiye, 2–4 September 2022. [Google Scholar]
- 2023 ESG Report Press Release. Available online: https://libertytire.com/Resources/2023-ESG-Report-Press-Release/ (accessed on 13 May 2025).
- Bušić, R.; Miličević, I.; Šipoš, T.K.; Strukar, K. Recycled Rubber as an Aggregate Replacement in Self-Compacting Concrete—Literature Overview. Materials 2018, 11, 1729. [Google Scholar] [CrossRef]
- Medina, N.F.; Garcia, R.; Hajirasouliha, I.; Pilakoutas, K.; Guadagnini, M.; Raffoul, S. Composites with recycled rubber aggregates: Properties and opportunities in construction. Constr. Build. Mater. 2018, 188, 884–897. [Google Scholar] [CrossRef]
- Osvaldová, M.; Potkány, M. Economic principles and possibilities of using recycled material based on wood—Plastic—Rubber. In Proceedings of the 15th International Scientific Conference WoodEMA 2022, Trnava, Slovakia, 8–10 June 2022. [Google Scholar]
- Abdelmonem, A.; El-Feky, M.S.; Nasr, E.-S.A.R.; Kohail, M. Performance of high strength concrete containing recycled rubber. Constr. Build. Mater. 2019, 227, 116660. [Google Scholar] [CrossRef]
- Badida, M.; Moravec, M.; Pinosova, M.; Andrejiova, M.; Pástor, K.; Nováková, A.; Dzuro, T. Analysis and Research on the Use of Bulk Recycled Materials for Sound Insulation Applications. Sustainability 2022, 14, 11539. [Google Scholar] [CrossRef]
- STN EN ISO 10534-2 (730537); Acoustics—Determination of Sound Absorption Coefficient and Impedance in Impedances Tubes—Part 2: Transfer-Function Method (ISO 10534-2:1998). International Organization for Standardization: Geneva, Switzerland, 2024.
- Jedidi, M.; Boulila, A.; Benjeddou, O.; Soussi, C. Crumb Rubber Effect on Acoustic Properties of Self- Consolidating Concrete. Int. J. Therm. Environ. Eng. 2014, 8, 69–76. [Google Scholar] [CrossRef]
- Gumanova, V.; Sobotova, L.; Dzuro, T.; Badida, M.; Moravec, M. Experimental Survey of the Sound Absorption Performance of Natural Fibres in Comparison with Conventional Insulating Materials. Sustainability 2022, 14, 4258. [Google Scholar] [CrossRef]
- Maděra, J.; Fořt, J.; Fiala, L.; Kočí, V.; Černý, R. Acoustic Properties of Rubber Crumb Boards Originated from End-of-Life Tires. In Proceedings of the International Conference of Numerical Analysis and Applied Mathematics ICNAAM 2021, Rhodes, Greece, 20–26 September 2021. [Google Scholar]
- Ḿaderuelo-Sanz, R.; Morillas, J.; Ḿiguel, B.; Ḿartin-Castizo, M.; Escobar, V.G.; Gozalo, G.R. Acoustical performance of porous absorber made from recycled rubber and polyurethane resin. Lat. Am. J. Solids Struct. 2013, 10, 585–600. [Google Scholar] [CrossRef]
- Lu, K.; Shang, X.; Yuan, M. Preparation and performance analysis of porous materials for road noise abatement using waste rubber tires. Appl. Acoust. 2025, 228, 110374. [Google Scholar] [CrossRef]


| Material | Structure | Fraction (mm) | Sample Views Macro/Micro Views | Bulk Density (kg/m3) |
|---|---|---|---|---|
| Recycled rubber panel | compact | 0–4 | 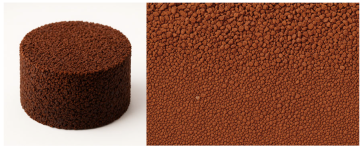 | 849 |
| Recycled rubber crumb | granular | ≥ 1 |  | 377 |
| 1–2 |  | 458 | ||
| 2–3 |  | 472 | ||
| 3–4 |  | 500 |
| Label | Description |
|---|---|
| F | Rubber material fraction (mm) |
| F1 | Fraction of rubber material of size 1 mm (Fraction 1) |
| F2 | Fraction of rubber material of size from 1–2 mm (Fraction 2) |
| F3 | Fraction of rubber material of size from 2–3 mm (Fraction 3) |
| F4 | Fraction of rubber material of sizes from 3–4 mm (Fraction 4) |
| h | Sample thickness (cm), h = 2 cm, h = 4.5 cm, h = 7 cm |
| p | Pressure under which the granular sample was compacted (kPa), 0 kPa (loose granular), 250 kPa, 500 kPa, 750 kPa (granular material) |
| Freq | Frequency (Hz), frequency band from 100 Hz to 2500 Hz |
| TL | Transmission loss (dB) |
| TLC | Transmission loss of compact material of recycled rubber crumb |
| TLF | Transmission loss of granular recycled rubber crumb at fraction F |
| TLC,h | Transmission loss of compact material of recycled rubber crumb at thickness h |
| TLF,p,h | Transmission loss of granular recycled rubber crumb at fraction F, pressure p and thickness h |
| τf | Transmission coefficient at frequency f (unitless, –) |
| τavg | Average transmission coefficient (unitless, –) |
| TLf | Transmission loss at frequency f (dB) |
| TLavg | Average transmission loss (dB) |
| RTRf | Relative transmission ratio at frequency f (unitless, –) |
| Freq (Hz) | F1 | F2 | Compact | ||||||
| 250 kPa | 500 kPa | 750 kPa | 0 kPa | 250 kPa | 500 kPa | 750 kPa | 0 kPa | ||
| 100 | 2.1 | 0.5 | 0.4 | 40.8 | 24.9 | 17.1 | 13.7 | 39.7 | 18.3 |
| 125 | 2.2 | 0.5 | 0.4 | 37.8 | 24.8 | 17.0 | 13.6 | 40.7 | 17.9 |
| 160 | 2.3 | 0.5 | 0.4 | 33.4 | 24.2 | 16.7 | 13.4 | 41.5 | 17.1 |
| 200 | 2.4 | 0.5 | 0.4 | 29.8 | 23.6 | 16.3 | 13.1 | 41.2 | 16.1 |
| 250 | 3.0 | 1.1 | 0.5 | 26.4 | 22.8 | 15.6 | 12.6 | 40.5 | 14.8 |
| 315 | 2.4 | 0.9 | 1.0 | 23.1 | 21.7 | 14.9 | 12.0 | 39.1 | 13.4 |
| 400 | 2.2 | 0.6 | 0.5 | 20.3 | 20.2 | 14.2 | 11.2 | 36.8 | 13.5 |
| 500 | 2.1 | 0.7 | 0.5 | 18.1 | 18.7 | 13.3 | 10.9 | 33.8 | 11.6 |
| 630 | 2.1 | 0.6 | 0.5 | 16.2 | 16.9 | 12.1 | 9.8 | 30.9 | 9.9 |
| 800 | 2.1 | 0.6 | 0.5 | 14.5 | 15.0 | 11.0 | 8.9 | 28.9 | 8.4 |
| 1000 | 2.0 | 0.6 | 0.5 | 13.5 | 13.6 | 10.2 | 8.3 | 25.7 | 7.4 |
| 1250 | 2.1 | 0.6 | 0.4 | 13.1 | 12.6 | 9.6 | 7.9 | 21.5 | 6.6 |
| 1600 | 2.2 | 0.5 | 0.3 | 13.2 | 12.1 | 9.4 | 7.9 | 17.7 | 6.1 |
| 2000 | 2.3 | 0.4 | 0.2 | 14.0 | 12.8 | 10.1 | 8.8 | 17.0 | 6.3 |
| 2500 | 2.2 | 0.3 | 0.2 | 15.0 | 14.4 | 11.5 | 10.0 | 19.6 | 7.0 |
| τavg (in %) | 2.25 | 0.60 | 0.43 | 21.96 | 18.57 | 13.27 | 10.81 | 31.64 | 11.62 |
| TLavg (in dB) | 16.48 | 22.22 | 23.67 | 6.58 | 7.31 | 8.77 | 9.66 | 5.00 | 9.35 |
| Freq (Hz) | F3 | F3 | Compact | ||||||
| 250 kPa | 500 kPa | 750 kPa | 0 kPa | 250 kPa | 500 kPa | 750 kPa | 0 kPa | ||
| 100 | 45.9 | 43.3 | 33.7 | 58.2 | 57.5 | 52.0 | 49.2 | 64.8 | 18.3 |
| 125 | 45.0 | 42.6 | 33.1 | 56.9 | 56.6 | 51.1 | 48.3 | 64.3 | 17.9 |
| 160 | 43.4 | 41.0 | 31.8 | 54.3 | 54.7 | 49.3 | 46.3 | 62.3 | 17.1 |
| 200 | 41.5 | 39.2 | 30.2 | 52.0 | 52.4 | 47.0 | 43.9 | 60.1 | 16.1 |
| 250 | 38.6 | 37.7 | 28.1 | 51.5 | 49.1 | 44.0 | 40.9 | 57.2 | 14.8 |
| 315 | 36.4 | 34.8 | 25.7 | 47.4 | 45.3 | 40.5 | 37.2 | 53.8 | 13.4 |
| 400 | 33.3 | 31.8 | 22.9 | 43.0 | 41.5 | 36.3 | 33.3 | 49.2 | 13.5 |
| 500 | 29.4 | 28.9 | 21.1 | 39.7 | 37.0 | 32.6 | 29.6 | 44.4 | 11.6 |
| 630 | 25.8 | 25.6 | 18.2 | 35.4 | 32.3 | 28.3 | 25.6 | 39.3 | 9.9 |
| 800 | 21.9 | 22.2 | 15.5 | 30.4 | 27.5 | 24.0 | 21.8 | 33.6 | 8.4 |
| 1000 | 19.0 | 19.4 | 13.7 | 26.5 | 23.6 | 20.6 | 19.0 | 28.8 | 7.4 |
| 1250 | 16.7 | 17.4 | 12.5 | 23.4 | 20.5 | 17.9 | 16.9 | 24.8 | 6.6 |
| 1600 | 15.3 | 16.6 | 11.9 | 21.1 | 18.2 | 16.2 | 15.8 | 21.7 | 6.1 |
| 2000 | 15.9 | 17.6 | 12.8 | 21.1 | 18.2 | 16.9 | 17.1 | 21.5 | 6.3 |
| 2500 | 17.9 | 19.7 | 14.9 | 23.1 | 20.4 | 19.8 | 20.7 | 23.8 | 7.0 |
| τavg (in %) | 29.74 | 29.20 | 21.74 | 38.95 | 36.98 | 33.11 | 31.03 | 43.31 | 11.62 |
| TLavg (in dB) | 5.27 | 5.35 | 6.63 | 4.09 | 4.32 | 4.80 | 5.08 | 3.63 | 9.35 |
| Freq (Hz) | F1 | F2 | Compact | ||||||
| 250 kPa | 500 kPa | 750 kPa | 0 kPa | 250 kPa | 500 kPa | 750 kPa | 0 kPa | ||
| 100 | 0.23 | 0.06 | 0.07 | 12.93 | 6.83 | 4.53 | 3.20 | 22.63 | 7.98 |
| 125 | 0.21 | 0.05 | 0.07 | 11.46 | 6.77 | 4.54 | 3.19 | 23.65 | 7.91 |
| 160 | 0.21 | 0.05 | 0.07 | 9.93 | 6.63 | 4.45 | 3.14 | 24.07 | 7.41 |
| 200 | 0.29 | 0.05 | 0.14 | 8.79 | 6.65 | 4.62 | 3.08 | 23.53 | 6.87 |
| 250 | 0.31 | 0.23 | 0.16 | 7.82 | 6.90 | 4.74 | 3.32 | 22.67 | 6.70 |
| 315 | 0.33 | 0.10 | 0.08 | 7.03 | 6.18 | 4.23 | 3.23 | 21.35 | 6.97 |
| 400 | 0.29 | 0.08 | 0.08 | 6.39 | 5.80 | 4.07 | 2.96 | 19.60 | 5.82 |
| 500 | 0.19 | 0.06 | 0.06 | 6.01 | 5.56 | 3.94 | 2.92 | 17.88 | 5.09 |
| 630 | 0.15 | 0.05 | 0.04 | 5.70 | 5.34 | 3.84 | 2.86 | 16.80 | 4.72 |
| 800 | 0.09 | 0.03 | 0.02 | 5.46 | 5.29 | 3.85 | 2.90 | 16.48 | 4.52 |
| 1000 | 0.05 | 0.01 | 0.01 | 5.27 | 5.57 | 4.07 | 3.07 | 15.57 | 4.66 |
| 1250 | 0.02 | 0.005 | 0.001 | 4.90 | 6.149 | 4.41 | 3.29 | 15.22 | 5.14 |
| 1600 | 0.01 | 0.002 | 0.002 | 3.97 | 6.339 | 4.32 | 3.11 | 16.35 | 5.02 |
| 2000 | 0.002 | 0.001 | 0.003 | 2.89 | 5.093 | 3.39 | 2.39 | 15.53 | 3.90 |
| 2500 | 0.002 | 0.001 | 0.002 | 2.21 | 3.941 | 2.73 | 1.91 | 11.72 | 2.73 |
| τavg (in %) | 0.159 | 0.051 | 0.053 | 6.72 | 5.94 | 4.12 | 2.97 | 18.87 | 5.70 |
| TLavg (in dB) | 28.00 | 32.89 | 32.77 | 11.73 | 12.27 | 13.86 | 15.27 | 7.24 | 12.44 |
| Freq (Hz) | F3 | F4 | Compact | ||||||
| 250 kPa | 500 kPa | 750 kPa | 0 kPa | 250 kPa | 500 kPa | 750 kPa | 0 kPa | ||
| 100 | 29.51 | 19.57 | 15.40 | 48.96 | 37.91 | 33.39 | 26.04 | 54.23 | 7.98 |
| 125 | 28.68 | 18.97 | 14.76 | 47.73 | 36.48 | 31.93 | 24.68 | 52.50 | 7.91 |
| 160 | 26.89 | 17.87 | 13.78 | 45.10 | 33.82 | 29.48 | 22.75 | 49.59 | 7.41 |
| 200 | 25.18 | 16.72 | 12.74 | 42.29 | 31.07 | 27.01 | 20.75 | 46.20 | 6.87 |
| 250 | 23.04 | 15.78 | 11.49 | 38.69 | 27.91 | 24.29 | 18.35 | 42.42 | 6.70 |
| 315 | 20.71 | 14.35 | 10.24 | 34.90 | 25.17 | 21.72 | 15.89 | 38.02 | 6.97 |
| 400 | 18.12 | 12.80 | 9.05 | 30.86 | 21.84 | 18.76 | 14.06 | 33.31 | 5.82 |
| 500 | 15.98 | 11.55 | 8.52 | 27.44 | 18.80 | 16.30 | 12.54 | 29.32 | 5.09 |
| 630 | 14.24 | 10.49 | 7.45 | 24.20 | 16.47 | 14.25 | 10.81 | 25.44 | 4.72 |
| 800 | 12.86 | 9.72 | 6.95 | 21.71 | 14.78 | 12.84 | 9.81 | 22.41 | 4.52 |
| 1000 | 12.72 | 9.72 | 7.09 | 20.66 | 14.32 | 12.58 | 9.82 | 21.12 | 4.66 |
| 1250 | 14.164 | 10.71 | 8.30 | 21.88 | 15.72 | 13.90 | 11.33 | 22.32 | 5.14 |
| 1600 | 18.323 | 12.96 | 10.78 | 27.54 | 21.25 | 18.84 | 15.75 | 29.17 | 5.02 |
| 2000 | 19.898 | 12.35 | 10.31 | 32.89 | 25.49 | 21.97 | 17.25 | 37.62 | 3.90 |
| 2500 | 15.241 | 9.65 | 7.89 | 27.57 | 20.05 | 17.01 | 13.01 | 32.28 | 2.73 |
| τavg (in %) | 19.70 | 13.35 | 10.32 | 32.83 | 24.07 | 20.98 | 16.19 | 35.73 | 5.70 |
| TLavg (in dB) | 7.05 | 8.68 | 9.86 | 4.84 | 6.18 | 6.79 | 7.91 | 4.47 | 12.44 |
| Freq (Hz) | F1 | F2 | Compact | ||||||
| 250 kPa | 500 kPa | 750 kPa | 0 kPa | 250 kPa | 500 kPa | 750 kPa | 0 kPa | ||
| 100 | 0.04 | 0.02 | 0.02 | 8.6 | 3.2 | 1.5 | 0.9 | 16.3 | 0.5 |
| 125 | 0.04 | 0.02 | 0.02 | 7.6 | 3.2 | 1.5 | 0.8 | 17.4 | 0.5 |
| 160 | 0.03 | 0.02 | 0.01 | 6.7 | 3.1 | 1.5 | 0.8 | 17.2 | 0.4 |
| 200 | 0.02 | 0.01 | 0.01 | 6.0 | 3.0 | 1.4 | 0.8 | 16.8 | 0.4 |
| 250 | 0.02 | 0.01 | 0.01 | 5.5 | 2.9 | 1.4 | 0.8 | 16.1 | 0.4 |
| 315 | 0.04 | 0.01 | 0.01 | 5.1 | 3.1 | 1.4 | 0.8 | 15.2 | 0.4 |
| 400 | 0.05 | 0.03 | 0.02 | 4.8 | 3.1 | 1.5 | 1.1 | 14.1 | 0.3 |
| 500 | 0.02 | 0.02 | 0.04 | 4.5 | 3.0 | 1.7 | 0.9 | 13.3 | 0.4 |
| 630 | 0.005 | 0.01 | 0.01 | 4.2 | 3.1 | 1.6 | 0.9 | 13.2 | 0.3 |
| 800 | 0.003 | 0.00 | 0.01 | 3.7 | 3.1 | 1.6 | 0.8 | 14.0 | 0.3 |
| 1000 | 0.005 | 0.01 | 0.005 | 2.9 | 2.9 | 1.3 | 0.7 | 14.2 | 0.3 |
| 1250 | 0.005 | 0.004 | 0.004 | 2.2 | 2.3 | 1.0 | 0.5 | 13.8 | 0.2 |
| 1600 | 0.003 | 0.002 | 0.002 | 1.4 | 1.7 | 0.8 | 0.4 | 10.3 | 0.1 |
| 2000 | 0.002 | 0.001 | 0.001 | 1.0 | 1.4 | 0.6 | 0.3 | 7.2 | 0.0 |
| 2500 | 0.001 | 0.001 | 0.001 | 0.7 | 1.2 | 0.5 | 0.2 | 6.8 | 0.1 |
| τavg (in %) | 0.018 | 0.011 | 0.012 | 4.33 | 2.69 | 1.28 | 0.71 | 13.74 | 0.31 |
| TLavg (in dB) | 37.34 | 39.42 | 39.29 | 13.64 | 15.69 | 18.92 | 21.49 | 8.62 | 25.14 |
| Freq (Hz) | F3 | F4 | Compact | ||||||
| 250 kPa | 500 kPa | 750 kPa | 0 kPa | 250 kPa | 500 kPa | 750 kPa | 0 kPa | ||
| 100 | 15.5 | 10.4 | 6.1 | 43.1 | 23.8 | 19.4 | 12.6 | 45.2 | 0.5 |
| 125 | 14.7 | 9.9 | 5.8 | 41.3 | 22.3 | 18.3 | 11.7 | 43.2 | 0.5 |
| 160 | 13.5 | 9.2 | 5.3 | 38.1 | 20.1 | 16.4 | 10.5 | 39.5 | 0.4 |
| 200 | 12.3 | 8.4 | 4.9 | 35.1 | 17.9 | 14.7 | 9.4 | 36.5 | 0.4 |
| 250 | 10.9 | 7.5 | 4.5 | 31.6 | 15.6 | 12.7 | 8.2 | 32.4 | 0.4 |
| 315 | 9.9 | 6.9 | 4.1 | 28.2 | 13.6 | 11.2 | 7.2 | 28.3 | 0.4 |
| 400 | 9.1 | 6.6 | 3.8 | 25.0 | 12.3 | 10.2 | 6.3 | 24.7 | 0.3 |
| 500 | 8.6 | 6.1 | 4.0 | 22.9 | 11.0 | 9.2 | 6.2 | 22.1 | 0.4 |
| 630 | 8.3 | 6.1 | 4.0 | 21.2 | 10.4 | 8.8 | 6.1 | 20.2 | 0.3 |
| 800 | 8.9 | 6.7 | 4.4 | 21.3 | 11.2 | 9.6 | 6.9 | 20.3 | 0.3 |
| 1000 | 10.5 | 8.2 | 5.0 | 24.3 | 13.9 | 12.1 | 8.8 | 23.6 | 0.3 |
| 1250 | 11.5 | 8.8 | 4.6 | 30.2 | 18.1 | 15.0 | 9.9 | 31.9 | 0.2 |
| 1600 | 8.5 | 6.4 | 3.4 | 28.2 | 14.1 | 10.9 | 6.7 | 31.4 | 0.1 |
| 2000 | 6.6 | 5.3 | 2.9 | 18.8 | 9.6 | 7.7 | 5.4 | 20.2 | 0.0 |
| 2500 | 6.7 | 5.4 | 2.7 | 17.0 | 10.0 | 8.5 | 6.1 | 18.7 | 0.1 |
| τavg (in %) | 10.38 | 7.46 | 4.39 | 28.41 | 14.93 | 12.31 | 8.14 | 29.2 | 0.31 |
| TLavg (in dB) | 9.84 | 11.27 | 13.58 | 5.46 | 8.26 | 9.10 | 10.89 | 5.335 | 25.14 |
| Parameters | Coefficients | Standardized Coefficients Beta | t-Stat | p-Value |
|---|---|---|---|---|
| Granular recycled rubber crumb—Fraction 1 (p-value < 2 × 10⁻¹⁶), R2 = 0.820 | ||||
| Intercept | 1.221 | −5.96 × 10⁻¹⁸ | 0.716 | 0.0371 |
| p | 1.902 × 10⁻² | 0.436 | 5.384 | 2 × 10⁻⁷ |
| h | 2.437 × 10² | 0.408 | 7.271 | <10−10 |
| Freq | 4.158 × 10⁻³ | 0.219 | 6.561 | <10−10 |
| p × h | 2.333 × 10⁻¹ | 0.300 | 3.237 | 1.1 × 10⁻³ |
| Granular recycled rubber crumb—Fraction 2 (p-value < 2 × 10⁻¹⁶), R2 = 0.955 | ||||
| Intercept | 2.755 | 3.9 × 10⁻¹⁶ | 7.822 | <10−16 |
| p | 1.562 × 10⁻³ | 0.086 | 2.156 | 3.10−2 |
| h | 93.09 | 0.377 | 13.315 | <10−16 |
| Freq | 1.408 × 10⁻³ | 0.189 | 11.412 | <10−13 |
| p × h | 2.115 × 10⁻¹ | 0.656 | 14.154 | <10−13 |
| Granular recycled rubber crumb—Fraction 3 (p-value < 2 × 10⁻¹⁶), R2 = 0.838 | ||||
| Intercept | 2.482 × 10⁻¹ | 3.9 × 10⁻¹⁶ | 0.883 | 0.379 |
| p | 6.643 × 10⁻³ | 0.579 | 18.954 | <10−16 |
| h | 91.69 | 0.609 | 18.930 | <10−16 |
| Freq | 1.417 × 10⁻³ | 0.324 | 9.514 | <10−16 |
| Granular recycled rubber crumb—Fraction 4 (p-value < 2 × 10⁻¹⁶), R2 = 0.808 | ||||
| Intercept | 5.317 × 10⁻¹ | 3.8 × 10⁻¹⁶ | 2.109 | 0.036 |
| p | 3.809 × 10⁻³ | 0.415 | 11.921 | <10−16 |
| h | 76.3 | 0.618 | 17.748 | <10−16 |
| Freq | 1.75 × 10⁻³ | 0.466 | 13.387 | <10−16 |
| Compact Sample (p-value < 2 × 10⁻¹⁶), R2 = 0.862 | ||||
| Intercept | 2.75 × 10⁻² | 2.2 × 10⁻¹⁶ | 0.024 | 0.981 |
| h | 3.12 | 0.923 | 3.171 | <10−16 |
| Freq | 2.43 × 10⁻³ | 0.191 | 15.251 | 3 × 10⁻³ |
Disclaimer/Publisher’s Note: The statements, opinions and data contained in all publications are solely those of the individual author(s) and contributor(s) and not of MDPI and/or the editor(s). MDPI and/or the editor(s) disclaim responsibility for any injury to people or property resulting from any ideas, methods, instructions or products referred to in the content. |
© 2025 by the authors. Licensee MDPI, Basel, Switzerland. This article is an open access article distributed under the terms and conditions of the Creative Commons Attribution (CC BY) license (https://creativecommons.org/licenses/by/4.0/).
Share and Cite
Badida, M.; Andrejiova, M.; Pinosova, M.; Moravec, M. Acoustic Analysis of Soundproofing Materials Using Recycled Rubber from Automobiles. Materials 2025, 18, 3144. https://doi.org/10.3390/ma18133144
Badida M, Andrejiova M, Pinosova M, Moravec M. Acoustic Analysis of Soundproofing Materials Using Recycled Rubber from Automobiles. Materials. 2025; 18(13):3144. https://doi.org/10.3390/ma18133144
Chicago/Turabian StyleBadida, Miroslav, Miriam Andrejiova, Miriama Pinosova, and Marek Moravec. 2025. "Acoustic Analysis of Soundproofing Materials Using Recycled Rubber from Automobiles" Materials 18, no. 13: 3144. https://doi.org/10.3390/ma18133144
APA StyleBadida, M., Andrejiova, M., Pinosova, M., & Moravec, M. (2025). Acoustic Analysis of Soundproofing Materials Using Recycled Rubber from Automobiles. Materials, 18(13), 3144. https://doi.org/10.3390/ma18133144