
Effect of Incorporating L-Shaped Folded Metal Aggregates on the Performance of Asphalt Mixtures


Highlights
- L-shaped folded metal aggregates (LFMA) form effective bonds with SBS asphalt, enhancing high-temperature stability (Marshall Stability +34.8%) and low-temperature crack resistance (flexural strength +10%);
- Under immersion/freeze–thaw conditions, the water damage resistance of asphalt mixtures decreases with increasing LFMA dosage (maximum TSR reduction in −3.5%);
- Smaller LFMA sizes (Group L3) exhibit superior reinforcement due to uniform distribution;
- This study expands the application of 3D metal aggregates, breaking through the limitations of fiber-based materials in heavy-duty pavement applications.
Abstract
1. Introduction
2. Materials and Methods
2.1. Raw Materials
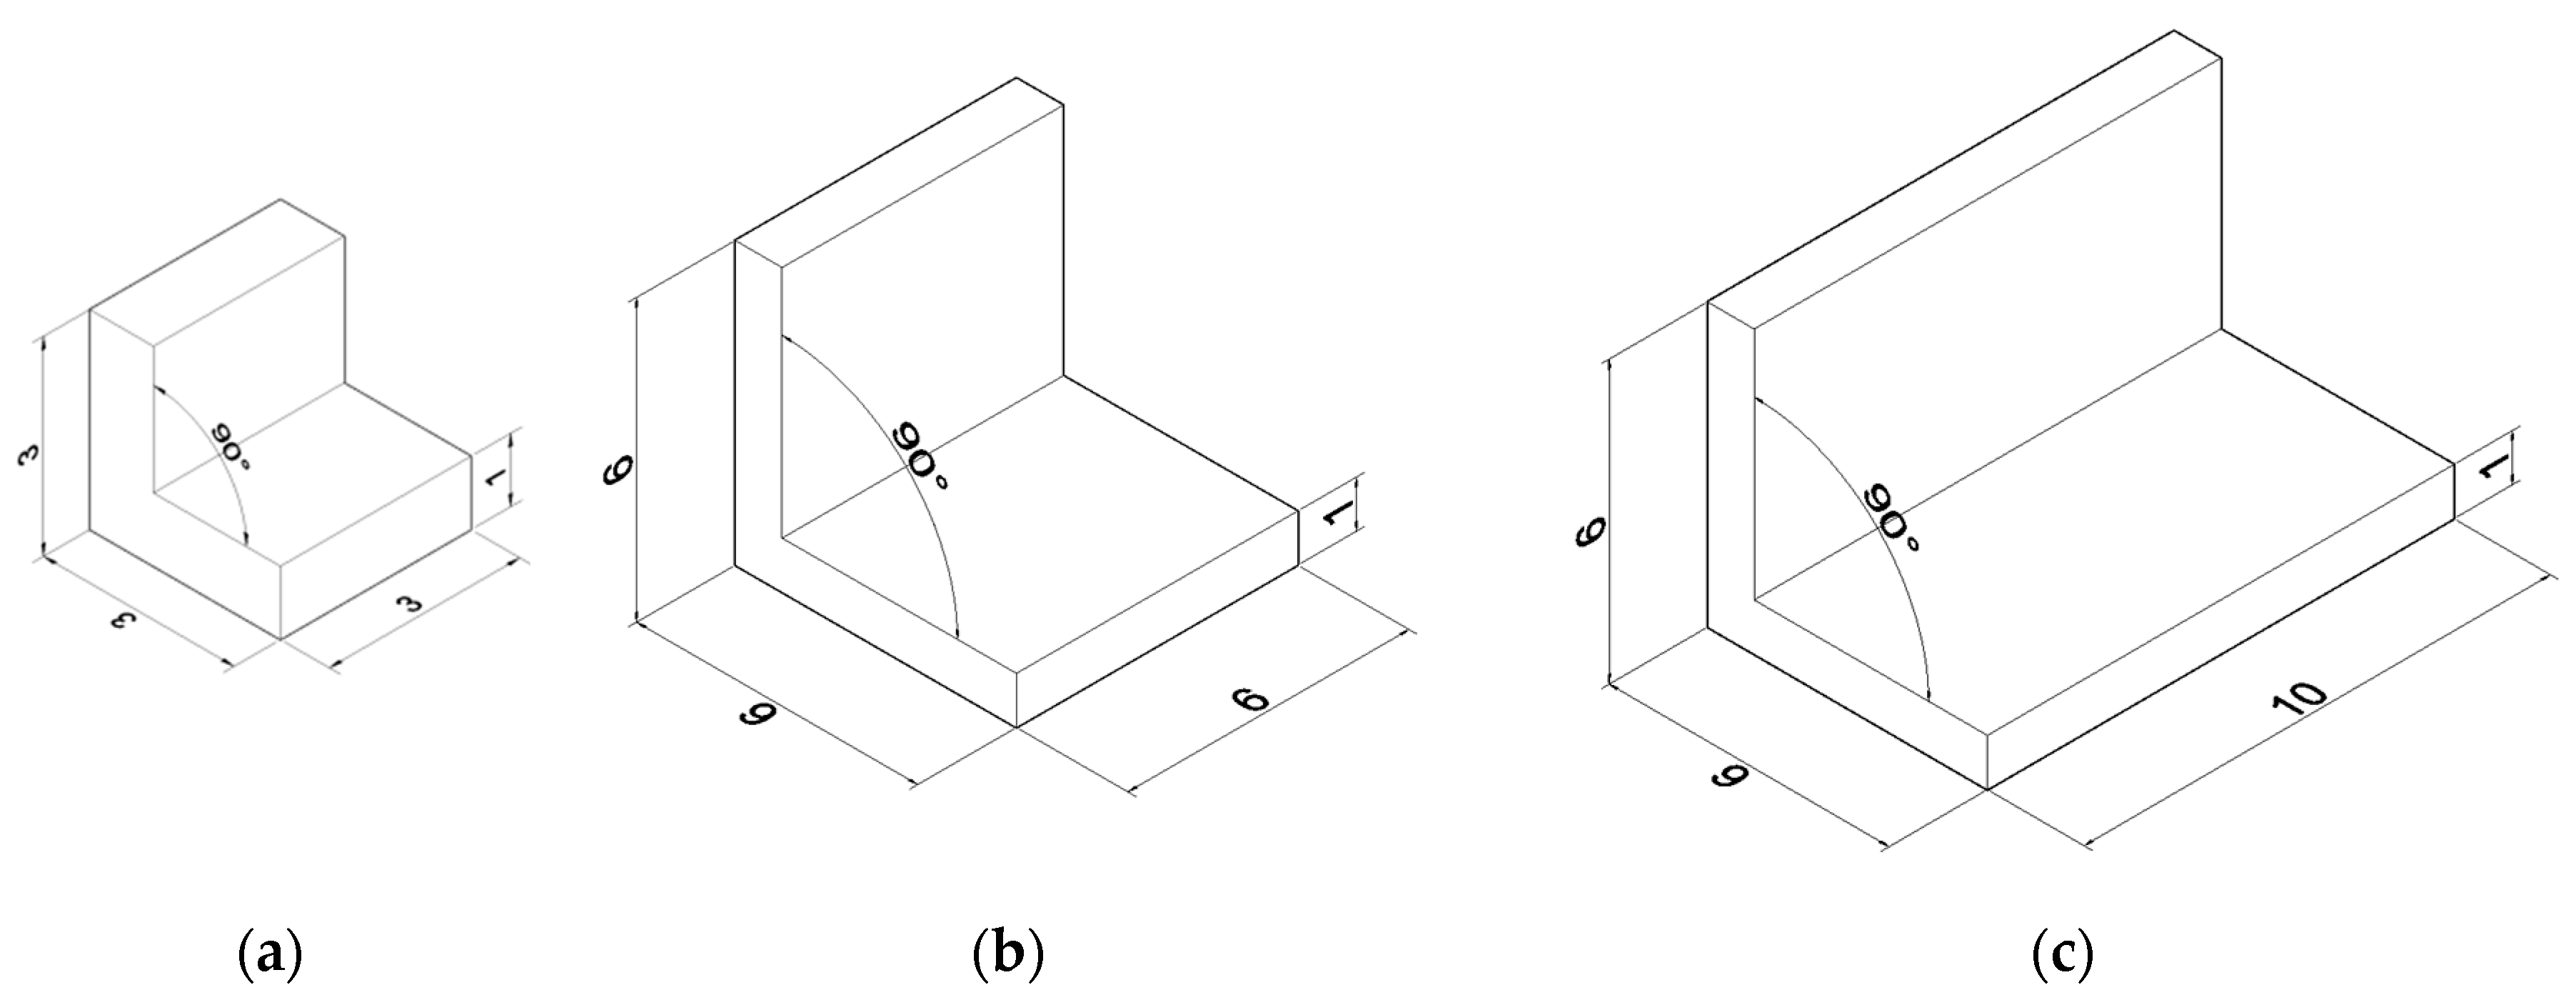
2.1.1. LFMAs
2.1.2. Asphalt
2.1.3. Aggregates and Fillers
2.2. Asphalt Mixture Design
2.3. Test Items and Experimental Methods
2.3.1. Surface Energy Theory and Test Methods
- (1)
- Surface Free Energy
- (2)
- Adhesion Model
2.3.2. Marshall Test
2.3.3. Rutting Test
2.3.4. Low-Temperature Crack Resistance and Test Methods
2.3.5. Water Stability and Test Methods
- (1)
- Immersion Marshall Test
- (2)
- Freeze–Thaw Splitting Test
3. Results and Discussion
3.1. Interface Adhesion Characteristics Between Metal Aggregates and Asphalt
3.2. Marshall Stability
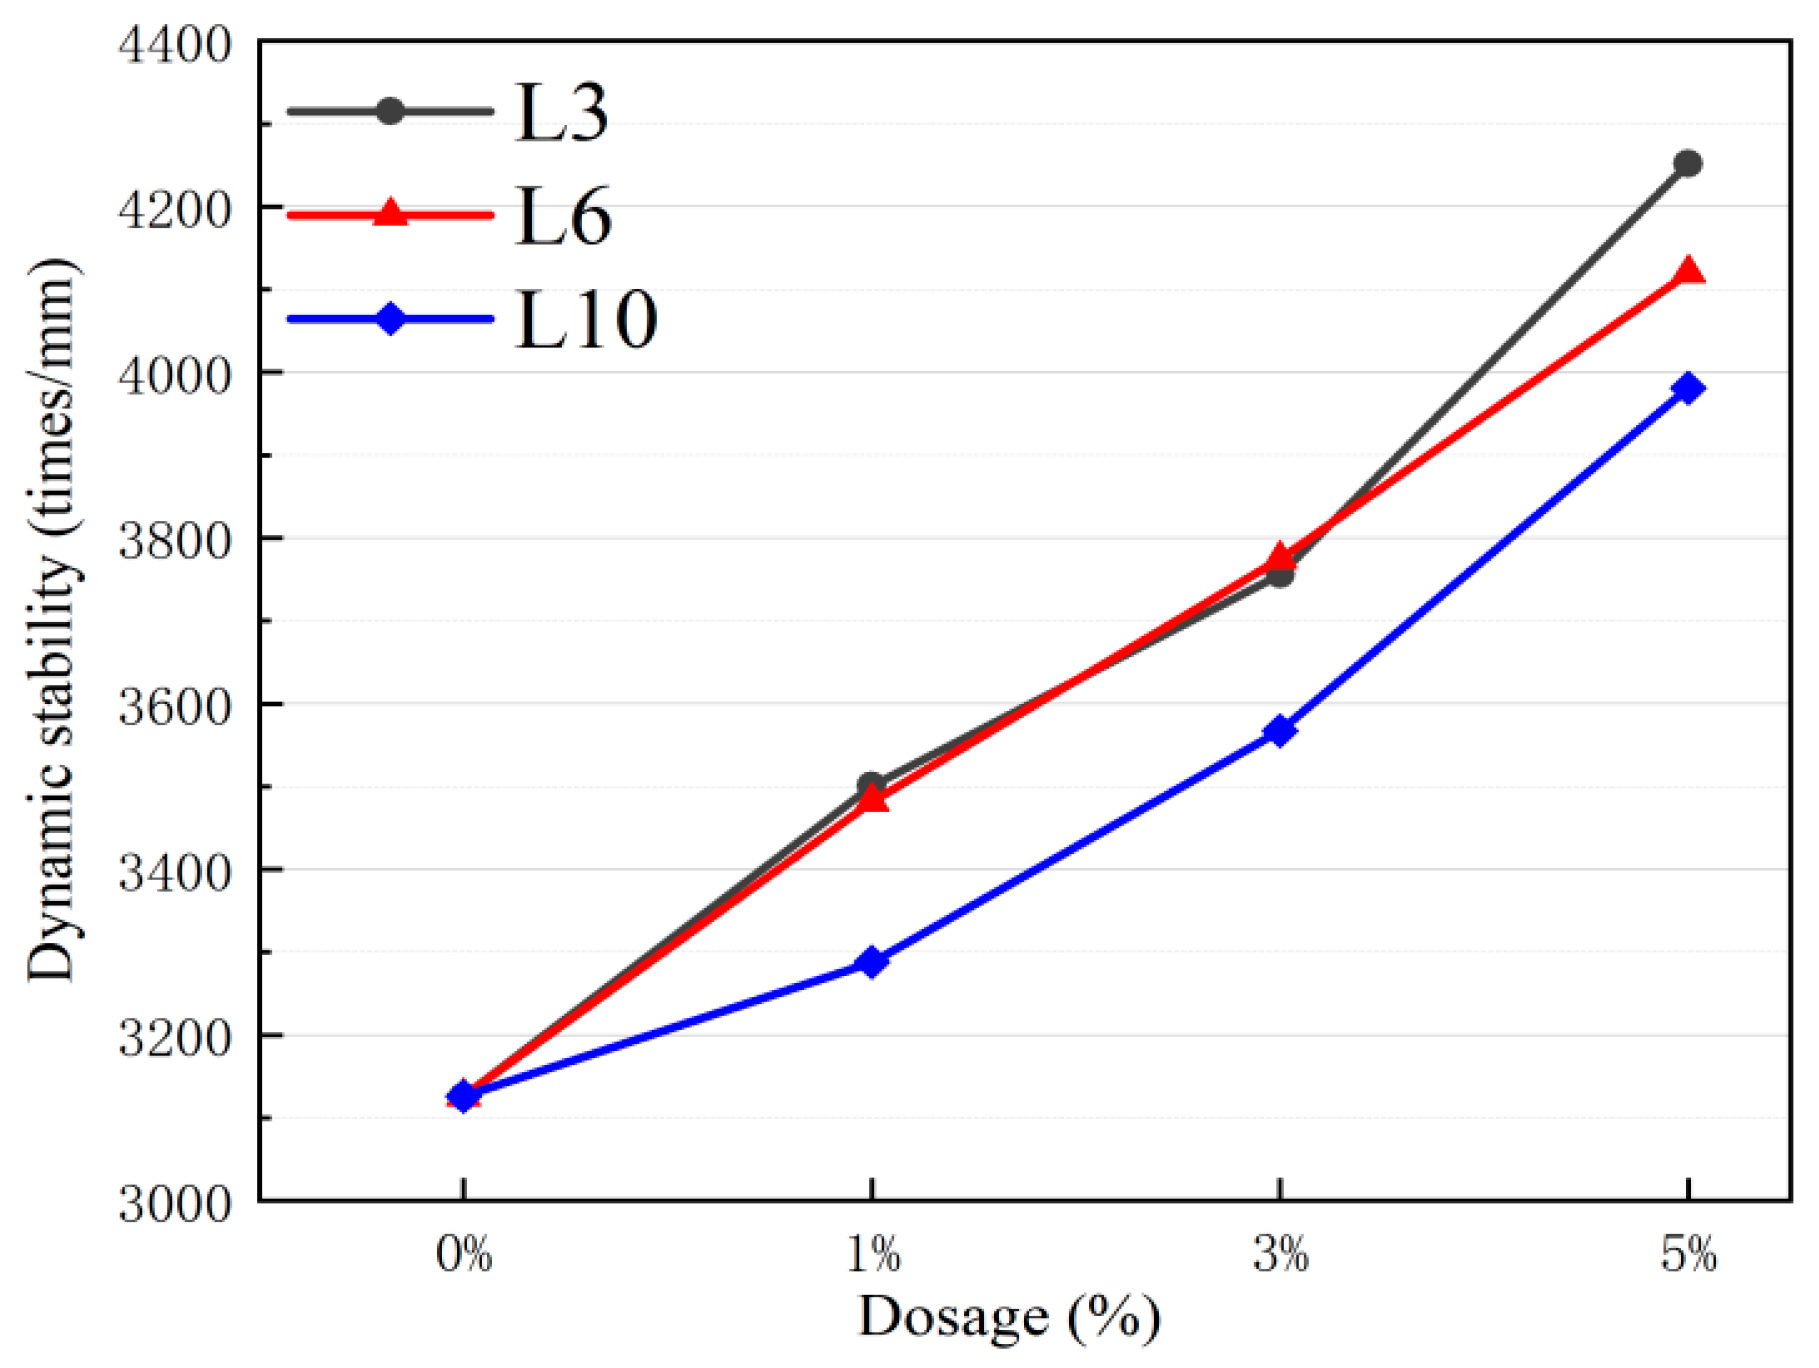
3.3. Dynamic Stability
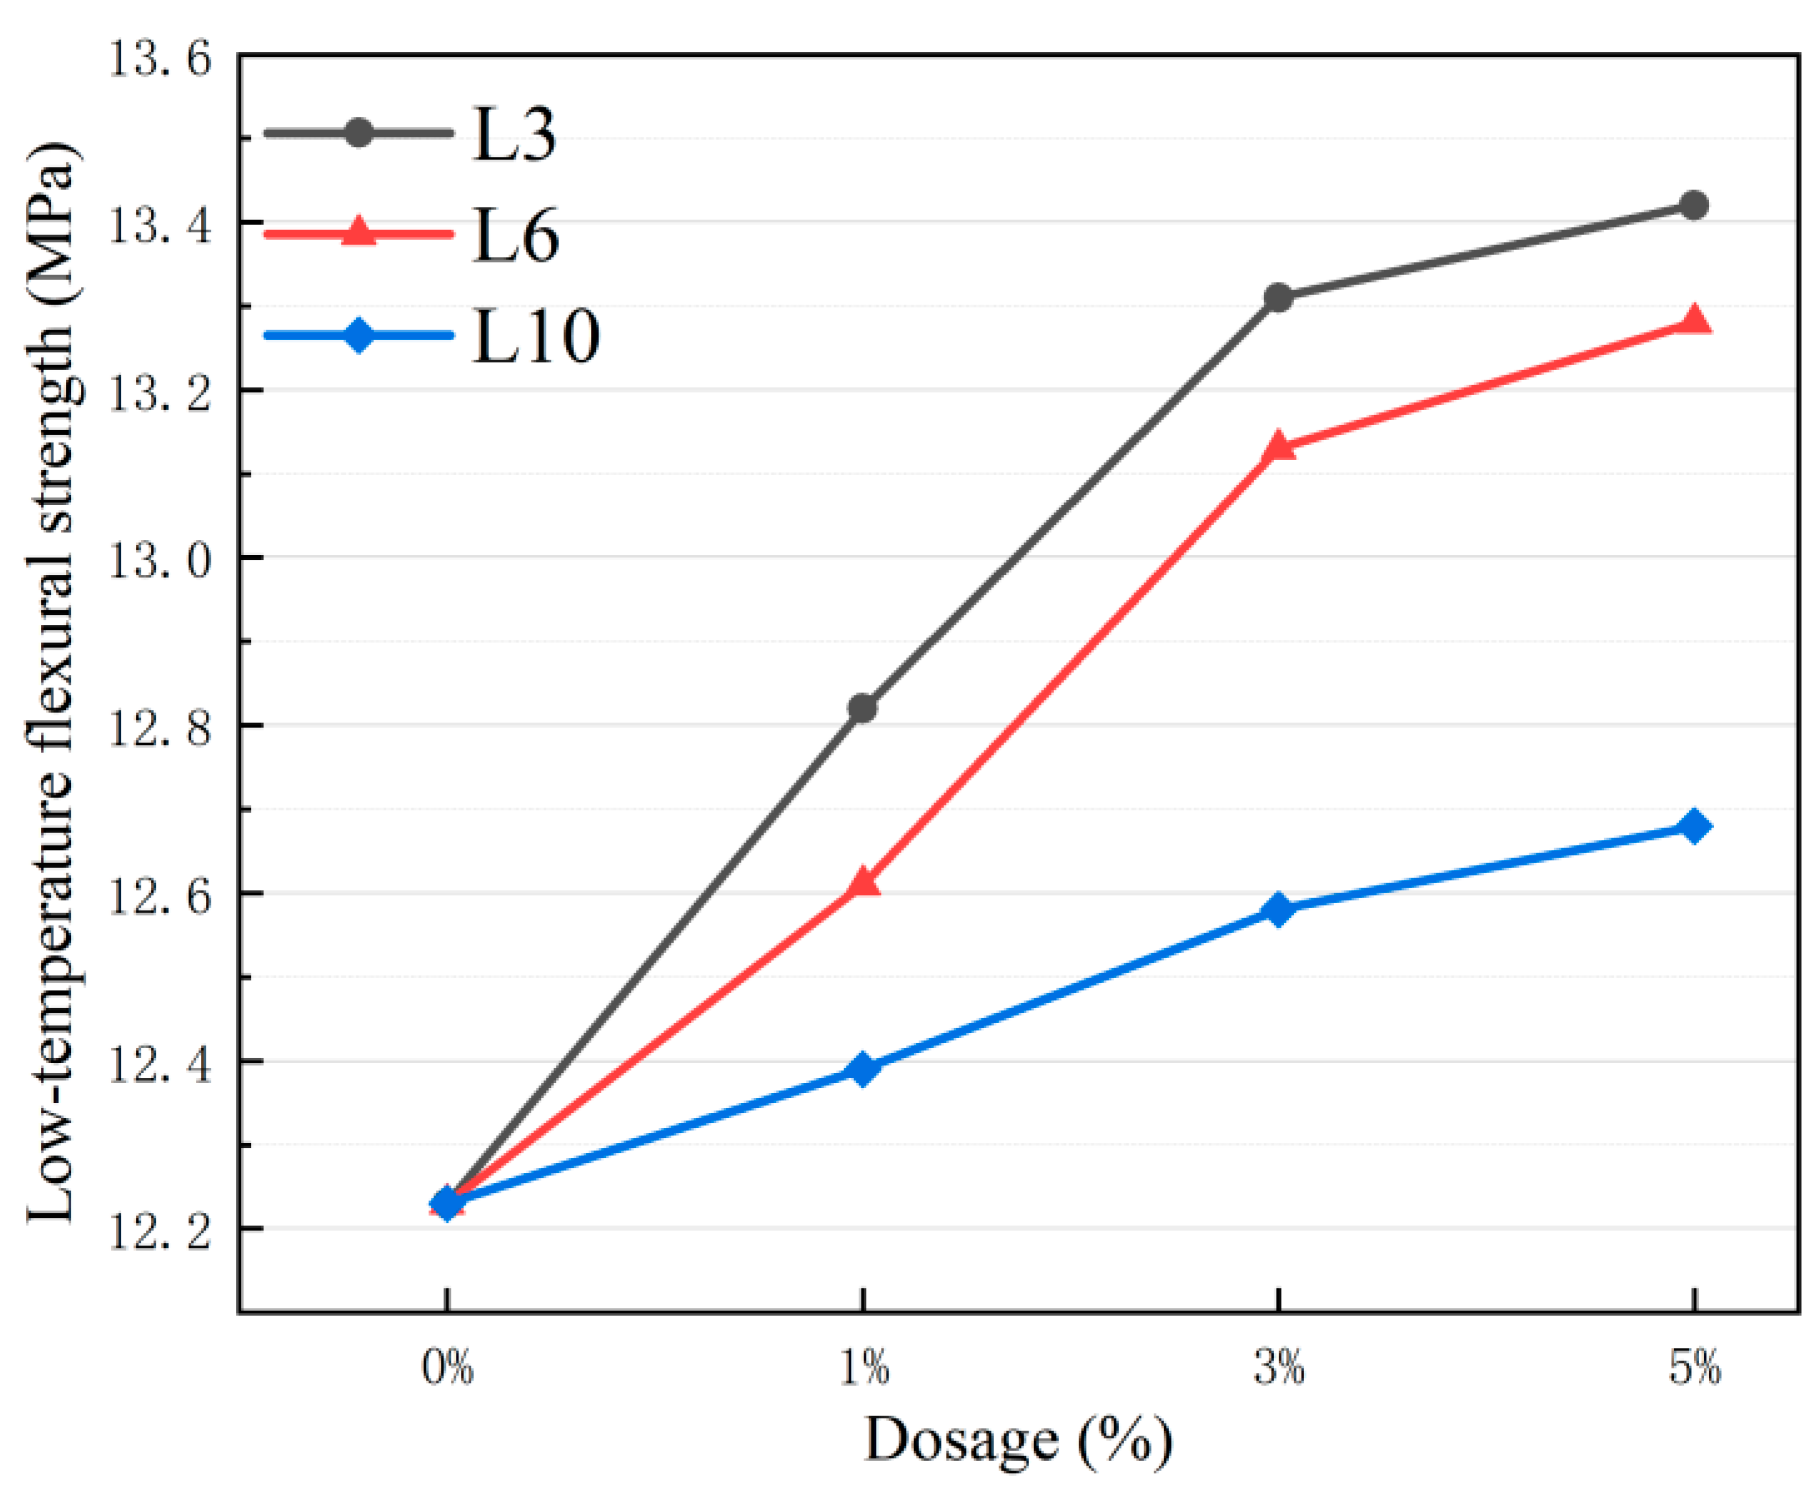
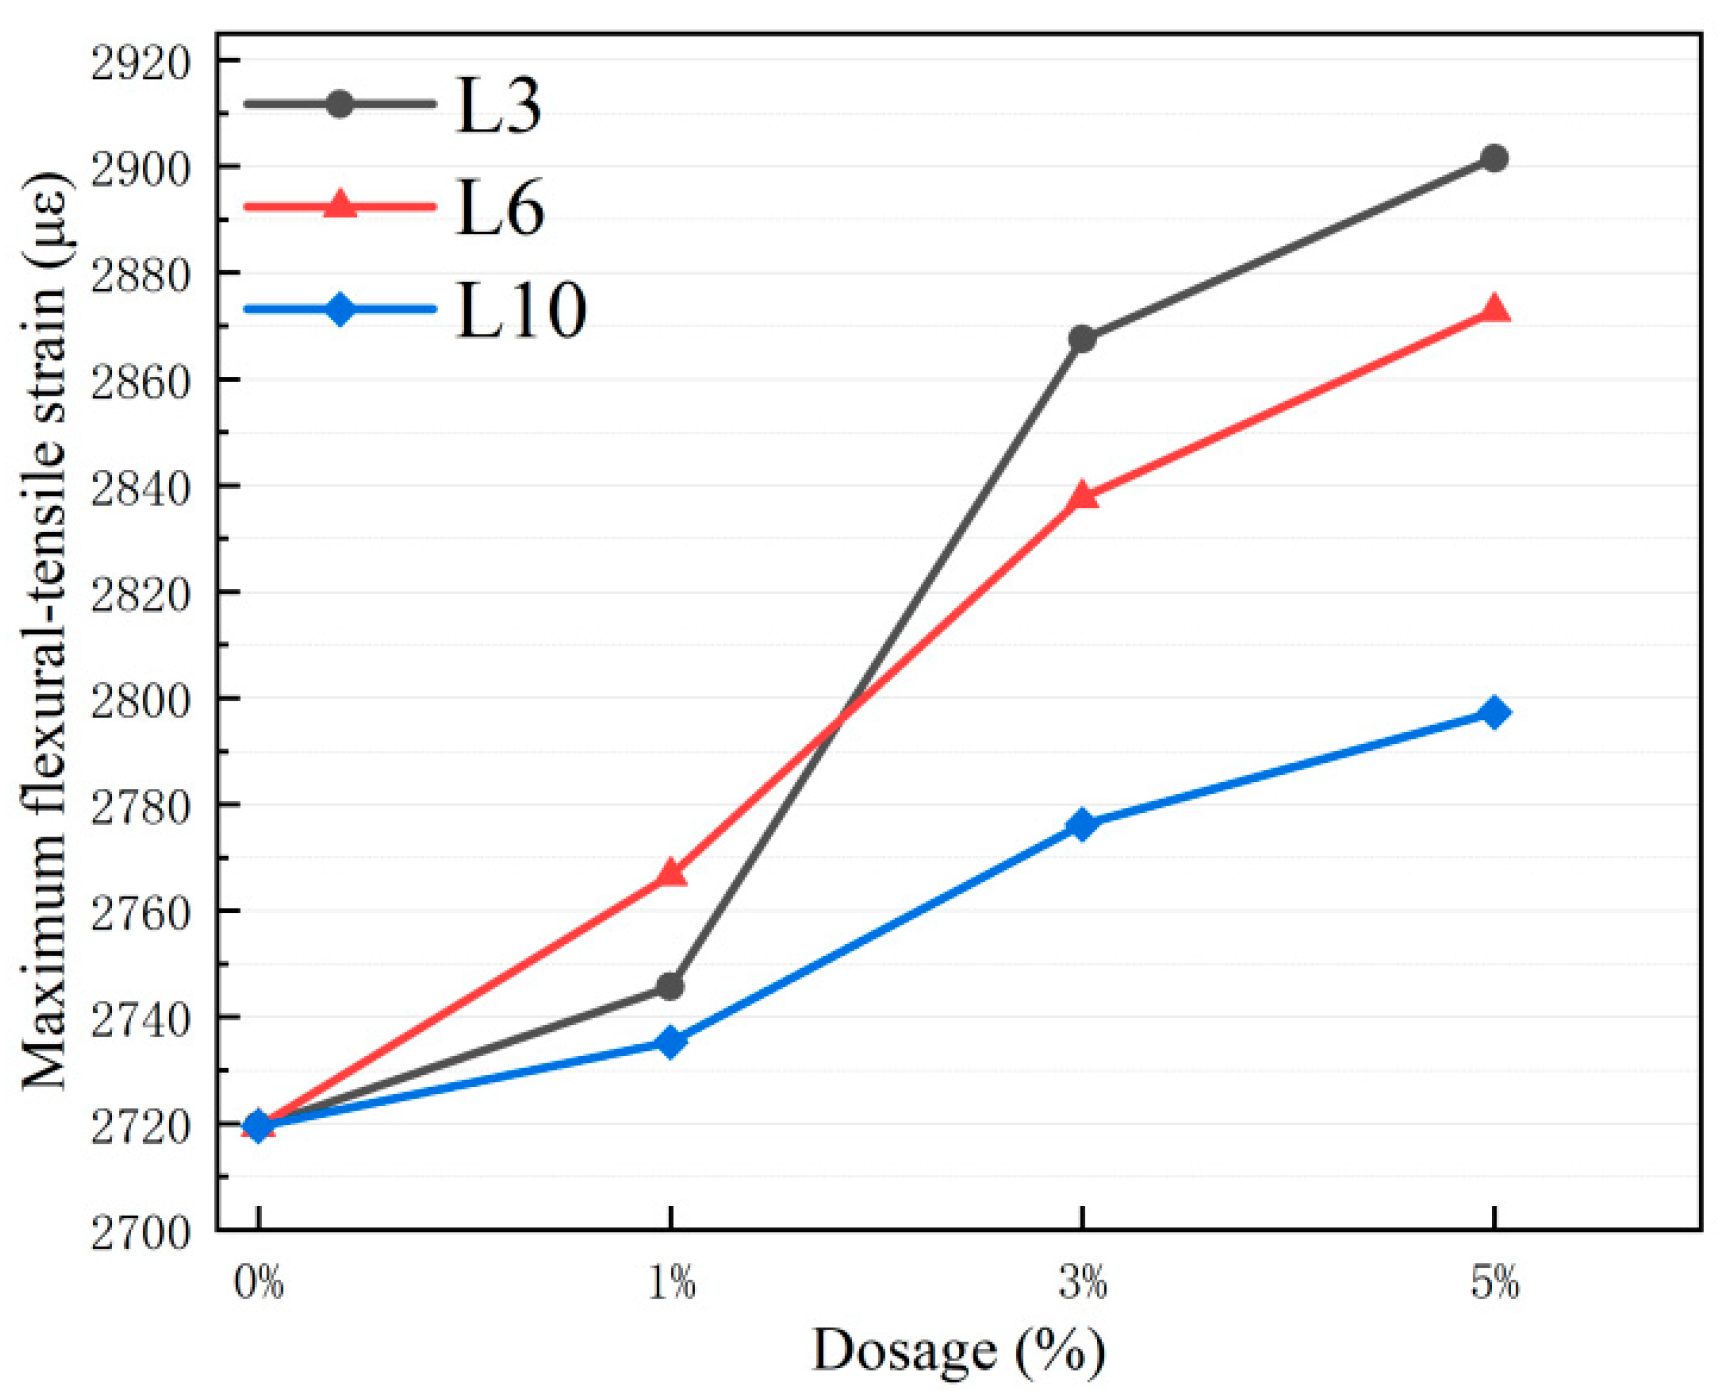
3.4. Low-Temperature Cracking Resistance
3.5. Water Stability
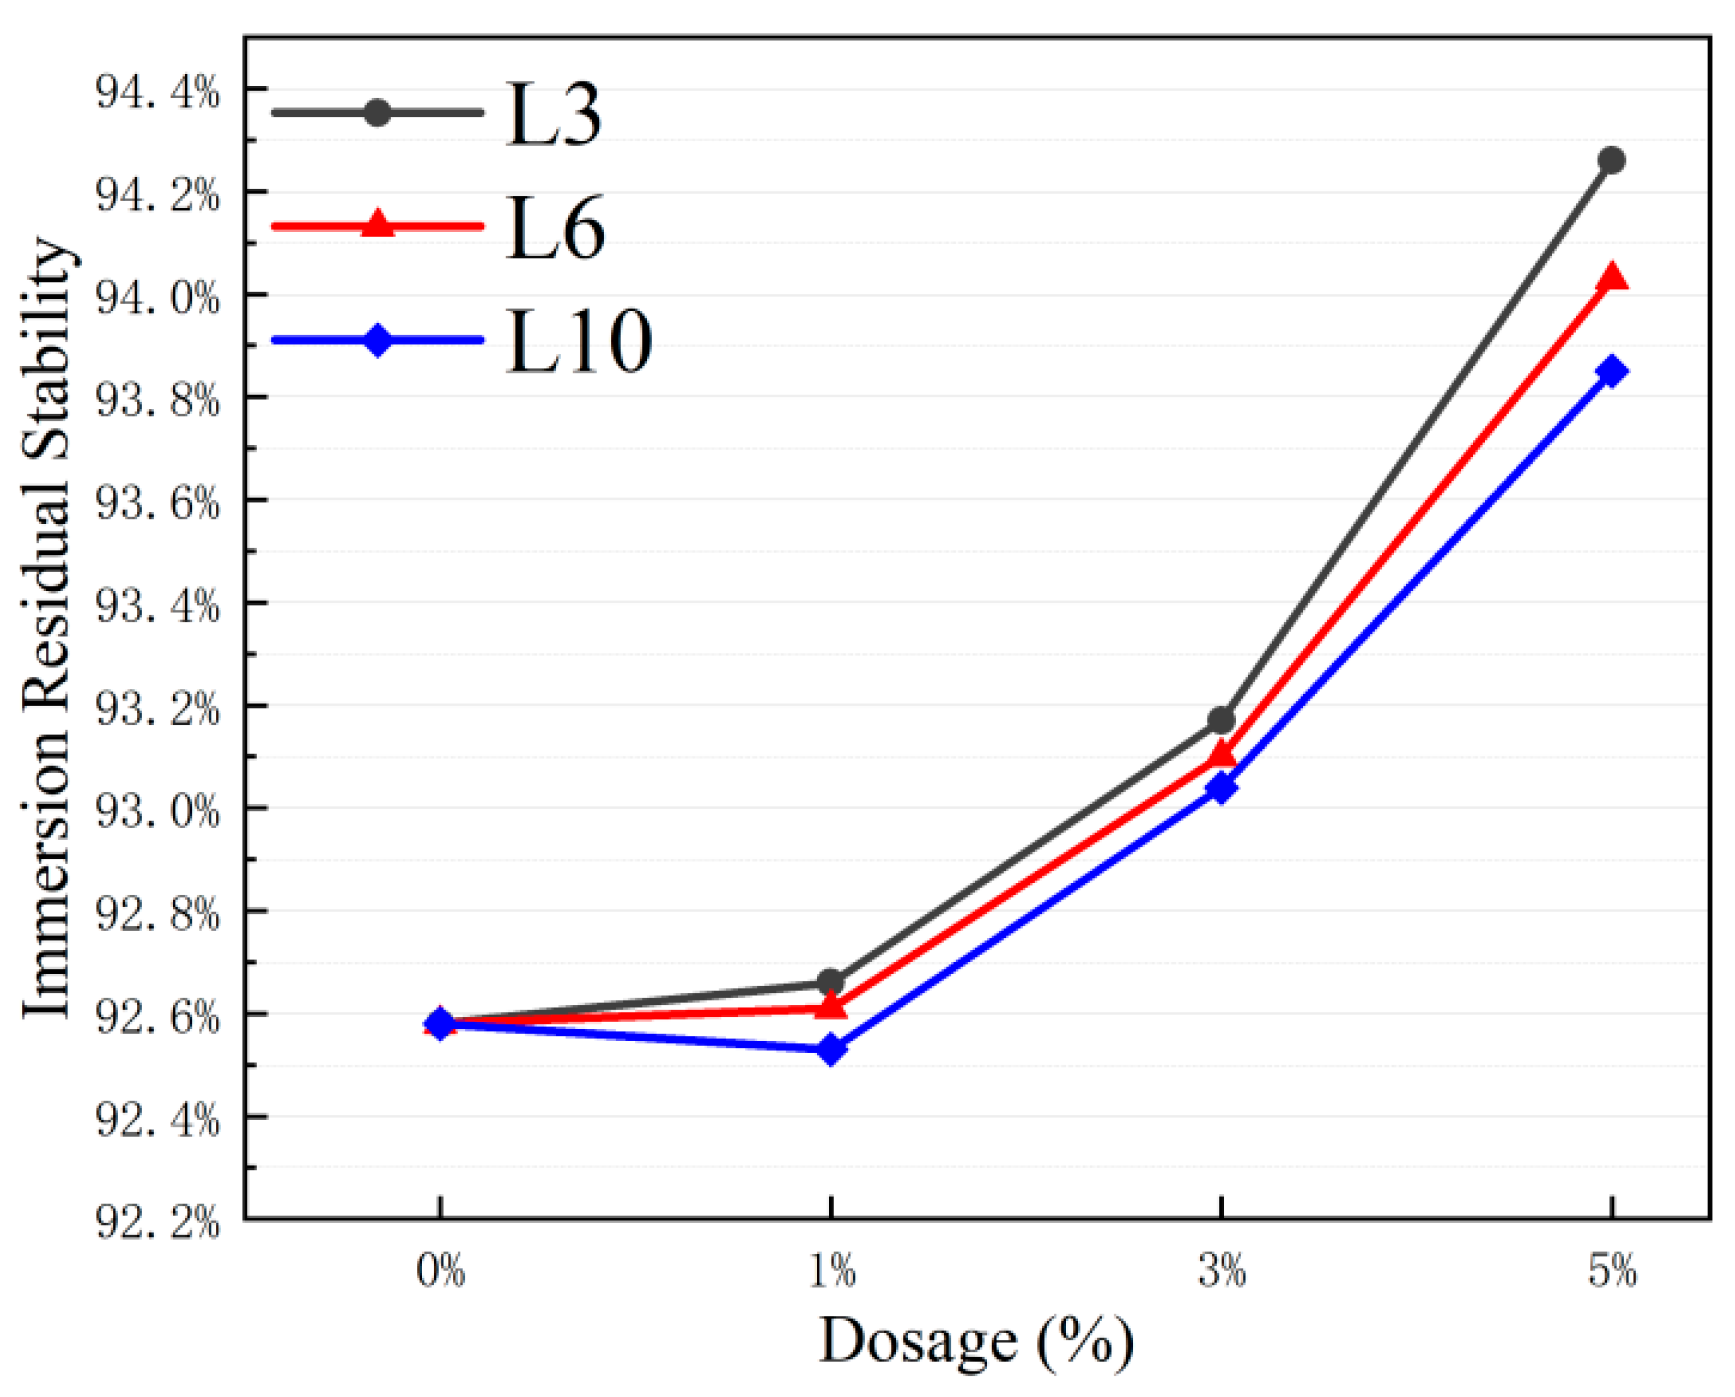
3.5.1. Immersion Marshall Stability
3.5.2. Freeze–Thaw Splitting Test
3.6. Comparative Analysis of Data
4. Conclusions
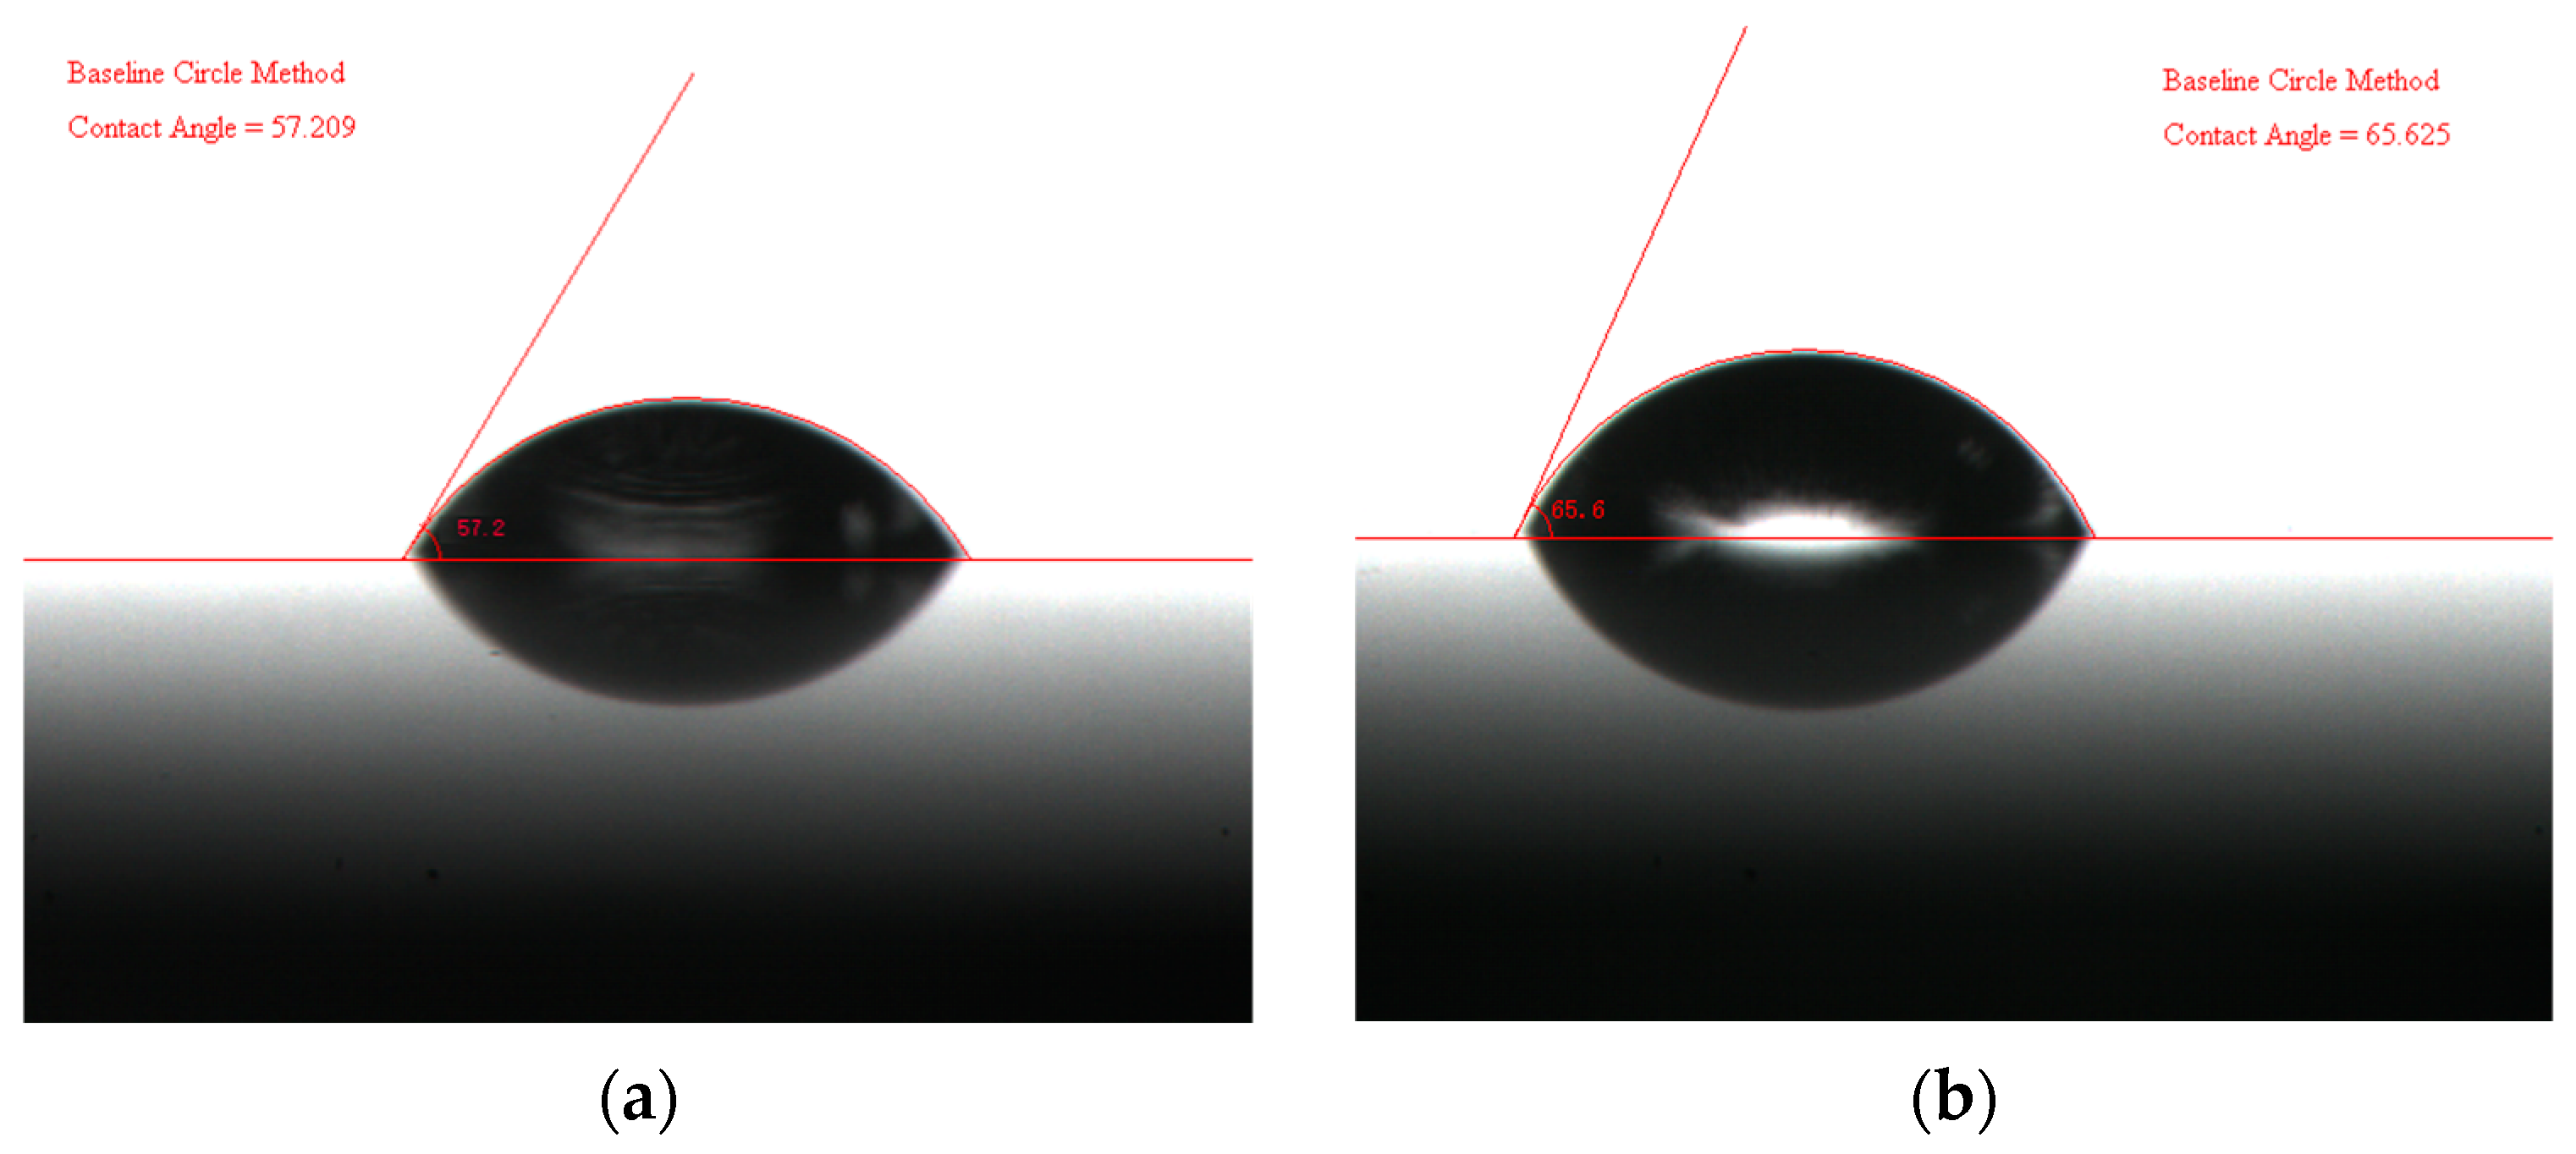
- LFMAs exhibit moderate surface energy, with their non-polar molecular structure generating polar forces due to the surface oxide layer. The adhesion work between LFMAs and SBS-modified asphalt reaches 58.80 mJ/m2. Although lower than that of limestone (62.60 mJ/m2), it still forms an effective interfacial bond.
- The addition of LFMAs can increase the Marshall stability and dynamic stability of asphalt mixtures by up to 34.8% and 36%, respectively, and the flexural strength and strain at low temperatures by up to 10% and 6.7%, respectively. Its high-temperature and low-temperature performance show a linear growth with the increase in LFMA content. The enhancement effect is more significant under high-temperature conditions.
- Under high-temperature conditions, the water stability of asphalt mixtures at high temperatures improves with the decrease in LFMA particle size and the increase in content. The addition of LFMAs in the L3-A5 group increases water stability by up to 1.68%.
- Under low-temperature conditions, the water stability of asphalt mixtures in low-temperature environments decreases with the decrease in LFMA particle size and the increase in content. The addition of LFMAs in the L3-A5 group causes the maximum decrease of 4.1% in the TSP.
- Limitations and future research
- In acid rain and coastal environments, the influence of the chemical reaction mechanism of the oxide film on the surface of L-shaped multi—folded metal aggregates (LFMAs) under environmental actions on the performance of asphalt mixtures.
- The enhancement potential of LFMA’s surface modification and geometric parameters (e.g., particle size, fold structure) on mixture performance has not been fully exploited, warranting systematic research.
- The impact of excessive shrinkage of LFMAs in low-temperature environments on the interfacial characteristics between asphalt and LFMA has not been considered and needs in-depth analysis.
- During the construction and mixing process of LFMAs, local overheating is prone to occur, leading to a decline in asphalt performance.
Author Contributions
Funding
Institutional Review Board Statement
Informed Consent Statement
Data Availability Statement
Acknowledgments
Conflicts of Interest
Abbreviations
| LFMA | L-shaped multi-faceted metal aggregate |
| SBS | Styrene–Butadiene–Styrene block copolymer |
| CV | Coefficient of variation |
| MS | Marshall stability |
| DS | Dynamic Stability |
References
- Meng, Y.; Lai, J.; Mo, S.; Fang, G.; Deng, S.; Wei, X.; Yang, F. Investigating the deterioration mechanism of adhesion between asphalt and aggregate interface under acid rain erosion. Appl. Surf. Sci. 2023, 639, 158171. [Google Scholar] [CrossRef]
- Yun, D.; Tang, C.; Gao, J.; Ran, M.; Zhou, X. Effect of asphalt mixture gradation characteristics on long-term skid resistance under high temperature and heavy load. Constr. Build. Mater. 2024, 441, 137386. [Google Scholar] [CrossRef]
- Gong, F.; Liu, Y.; You, Z.; Zhou, X. Characterization and evaluation of morphological features for aggregate in asphalt mixture: A review. Constr. Build. Mater. 2021, 273, 121989. [Google Scholar] [CrossRef]
- Zou, X.; Xie, Y.; Bi, Y.; Li, B.; Wang, W.; Ye, X. Study on the shear strength of asphalt mixture by discrete element modeling with coarse aggregate morphology. Constr. Build. Mater. 2023, 409, 134058. [Google Scholar] [CrossRef]
- Gao, J.; Wang, H.; Bu, Y.; You, Z.; Hasan, M.R.M.; Irfan, M. Effects of coarse aggregate angularity on the microstructure of asphalt mixture. Constr. Build. Mater. 2018, 183, 472–484. [Google Scholar] [CrossRef]
- Wang, F.; Xiao, Y.; Cui, P.; Ma, T.; Kuang, D. Effect of aggregate morphologies and compaction methods on the skeleton structures in asphalt mixtures. Constr. Build. Mater. 2020, 263, 120220. [Google Scholar] [CrossRef]
- Hassan, H.M.Z.; Wu, K.; Huang, W.; Chen, S.; Zhang, Q.; Xie, J.; Cai, X. Study on the influence of aggregate strength and shape on the performance of asphalt mixture. Constr. Build. Mater. 2021, 294, 123599. [Google Scholar] [CrossRef]
- Cheng, Y.C.; Wang, W.S.; Tao, J.L.; Xu, M.; Xu, X.L.; Ma, G.R.; Wang, S.R. Influence Analysis and Optimization for Aggregate Morphological Characteristics on High- and Low-Temperature Viscoelasticity of Asphalt Mixtures. Materials 2018, 11, 2034. [Google Scholar] [CrossRef]
- Lei, R.; Yu, H.; Qian, G.; Zhang, C.; Ge, J.; Dai, W. Impact of aggregate morphology on the compression strength of asphalt mixtures during different compaction stages. Constr. Build. Mater. 2024, 439, 137319. [Google Scholar] [CrossRef]
- Gong, F.; Liu, Y.; Zhou, X.; You, Z. Lab assessment and discrete element modeling of asphalt mixture during compaction with elongated and flat coarse aggregates. Constr. Build. Mater. 2018, 182, 573–579. [Google Scholar] [CrossRef]
- Valdés-Vidal, G.; Calabi-Floody, A.; Miró-Recasens, R.; Norambuena-Contreras, J. Mechanical behavior of asphalt mixtures with different aggregate type. Constr. Build. Mater. 2015, 101, 474–481. [Google Scholar] [CrossRef]
- Chen, B.; Yu, X.; Dong, F.; Zheng, C.; Ding, G. Geometrical characteristics of aggregates: The influence of sphericity, angularity, and surface texture on the workability of asphalt mixtures. Constr. Build. Mater. 2023, 402, 132941. [Google Scholar] [CrossRef]
- Busang, S.; Maina, J. Influence of aggregates properties on microstructural properties and mechanical performance of asphalt mixtures. Constr. Build. Mater. 2022, 318, 126002. [Google Scholar] [CrossRef]
- Kuang, D.; Zhang, B.; Jiao, Y.; Fang, J.; Chen, H.; Wang, L. Impact of particle morphology on aggregate-asphalt interface behavior. Constr. Build. Mater. 2017, 132, 142–149. [Google Scholar] [CrossRef]
- Ge, J.; Yu, H.; Qian, G.; Dai, W.; Zhang, C.; Shi, C.; Zhou, H.; Nian, T.; Zhong, Y. Enhancement mechanism of aggregate surface roughness structure on interfacial properties of asphalt mixtures. Constr. Build. Mater. 2024, 449, 138388. [Google Scholar] [CrossRef]
- Sun, P.; Zhang, K.; Han, S.; Xiao, Y. Aggregate Geometrical Features and Their Influence on the Surface Properties of Asphalt Pavement. Materials 2022, 15, 3222. [Google Scholar] [CrossRef]
- Ma, Z.; Wang, H.; Zhang, Y.; Jelagin, D.; Hui, B. Study of the surface texture evolution and friction degradation in asphalt pavements during wear process. Wear 2025, 564–565, 205714. [Google Scholar] [CrossRef]
- Zhang, X.; Wang, H.; Chi, M.; Xu, Z.; Xu, G. Experimental investigation on wear behavior of asphalt pavement based on three-dimensional surface texture scan technology. Constr. Build. Mater. 2024, 412, 134851. [Google Scholar] [CrossRef]
- Yang, Q.; Lin, J.; Wang, X.; Wang, D.; Xie, N.; Shi, X. A review of polymer-modified asphalt binder: Modification mechanisms and mechanical properties. Clean. Mater. 2024, 12, 100255. [Google Scholar] [CrossRef]
- Wu, S.H.; Haji, A.; Adkins, I. State of art review on the incorporation of fibres in asphalt pavements. Road Mater. Pavement Des. 2023, 24, 1559–1594. [Google Scholar] [CrossRef]
- Li, Y.; Hao, P.; Zhao, C.; Ling, J.; Wu, T.; Li, D.; Liu, J.; Sun, B. Anti-rutting performance evaluation of modified asphalt binders: A review. J. Traffic Transp. Eng. 2021, 8, 339–355. [Google Scholar] [CrossRef]
- Huang, G.; Yang, T.H.; He, Z.Y.; Yu, L.; Xiao, H.X. Polyurethane as a modifier for road asphalt: A literature review. Constr. Build. Mater. 2022, 356, 129058. [Google Scholar] [CrossRef]
- Kang, X.L.; Wang, R.R.; Yue, J.C.; An, X.; Tang, G.Q. Investigation of the Adhesion Characteristics of a Novel Fast-Melting SBS-Based Modifier to Asphalt-Aggregate Systems Based on a Multiscale Approach. J. Mater. Civ. Eng. 2023, 35, 04023435. [Google Scholar] [CrossRef]
- Hui, Y.X.; Men, G.Y.; Xiao, P.; Tang, Q.; Han, F.Y.; Kang, A.H.; Wu, Z.G. Recent Advances in Basalt Fiber Reinforced Asphalt Mixture for Pavement Applications. Materials 2022, 15, 6826. [Google Scholar] [CrossRef]
- Zhu, X.; Yu, H.; Qian, G.; Yao, D.; Dai, W.; Zhang, H.; Li, J.; Zhong, H. Evaluation of asphalt mixture micromechanical behavior evolution in the failure process based on Discrete Element Method. Case Stud. Constr. Mater. 2023, 18, e01773. [Google Scholar] [CrossRef]
- Shi, L.; Yang, Z.; Wang, D.; Qin, X.; Xiao, X.; Julius, M.K. Gradual Meso-Structural Response Behaviour of Characteristics of Asphalt Mixture Main Skeleton Subjected to Load. Appl. Sci. 2019, 9, 2425. [Google Scholar] [CrossRef]
- Serin, S.; Morova, N.; Saltan, M.; Terzi, S. Investigation of usability of steel fibers in asphalt concrete mixtures. Constr. Build. Mater. 2012, 36, 238–244. [Google Scholar] [CrossRef]
- Nian, T.; Wang, M.; Huang, X.; Ge, J.; Song, J.; Li, P. Investigating crack resistance and mechanisms of crack extension in high-content steel fibers reinforced hot recycled asphalt mixtures. Constr. Build. Mater. 2024, 450, 138717. [Google Scholar] [CrossRef]
- Shapie, S.S.; Taher, M.N.M. A review of steel fiber’s potential use in Hot Mix Asphalt. IOP Conf. Ser. Earth Environ. Sci. 2022, 1022, 012024. [Google Scholar] [CrossRef]
- Al-Ridha, A.S.D.; Alkaissi, Z.A.; Kareem, S.M. Evaluating the influence of adding steel fibers on the moisture damage and aging resistance of hot asphalt mixtures. Mater. Today Proc. 2021, 47, 2520–2528. [Google Scholar] [CrossRef]
- Messaoud, M.; Glaoui, B.; Abdelkhalek, O. The Effect of Adding Steel Fibers and Graphite on Mechanical and Electrical Behaviors of Asphalt Concrete. Civ. Eng. J. 2022, 8, 348–361. [Google Scholar] [CrossRef]
- Serin, S.; Emiroğlu, M.; Gönül, V.E. Investigation of the fracture energy of hot mixtures asphalt incorporating metallic wastes via semi-circular bending test. Constr. Build. Mater. 2021, 300, 124006. [Google Scholar] [CrossRef]
- Yu, H.; Zhang, C.; Qian, G.; Ge, J.; Zhu, X.; Yao, D.; Shi, C. Characterization and evaluation of coarse aggregate wearing morphology on mechanical properties of asphalt mixture. Constr. Build. Mater. 2023, 388, 131299. [Google Scholar] [CrossRef]
- Ding, X.; Liu, F.; Ma, T.; Xiao, B. Effects of coarse aggregate morphology on Asphalt mixture’s flowability: Parametric and prediction study. Case Stud. Constr. Mater. 2024, 21, e03735. [Google Scholar] [CrossRef]
- Cai, J.; Song, C.; Gong, X.; Zhang, J.; Pei, J.; Chen, Z. Gradation of limestone-aggregate-based porous asphalt concrete under dynamic crushing test: Composition, fragmentation and stability. Constr. Build. Mater. 2022, 323, 126532. [Google Scholar] [CrossRef]
- Cui, S.; Blackman, B.R.K.; Kinloch, A.J.; Taylor, A.C. Durability of asphalt mixtures: Effect of aggregate type and adhesion promoters. Int. J. Adhes. Adhes. 2014, 54, 100–111. [Google Scholar] [CrossRef]
- Wu, H.; Li, P.; Nian, T.; Zhang, G.; He, T.; Wei, X. Evaluation of asphalt and asphalt mixtures’ water stability method under multiple freeze-thaw cycles. Constr. Build. Mater. 2019, 228, 117089. [Google Scholar] [CrossRef]
- Mun, S.; Lee, S. Determination of the fatigue-cracking resistance of asphalt concrete mixtures at low temperatures. Cold Reg. Sci. Technol. 2010, 61, 116–124. [Google Scholar] [CrossRef]
- Huang, G.; Chen, Z.; Wang, S.; Hu, D.; Zhang, J.; Pei, J. Investigation of fracture failure and water damage behavior of asphalt mixtures and their correlation with asphalt-aggregate bonding performance. Constr. Build. Mater. 2024, 449, 138352. [Google Scholar] [CrossRef]
- Javilla, B.; Fang, H.; Mo, L.; Shu, B.; Wu, S. Test evaluation of rutting performance indicators of asphalt mixtures. Constr. Build. Mater. 2017, 155, 1215–1223. [Google Scholar] [CrossRef]
- Sun, Y.; Han, P.; Hu, M.; Xu, B.; Wang, W.; Liu, J. A multiscale investigation on asphalt surface free energy with different aged-fresh asphalt mixing ratios utilizing molecular dynamics simulation and contact angle test. Constr. Build. Mater. 2024, 448, 138195. [Google Scholar] [CrossRef]
- Sun, Z.; Li, S.; Zhang, J.; Zeng, Y. Adhesion property of bituminous crack sealants to different asphalt mixtures based on surface energy theory. Constr. Build. Mater. 2020, 261, 120006. [Google Scholar] [CrossRef]
- JTG E20-2011; Standard Test Methods of Bitumen and Bituminous Mixtures for Highway Engineering. Ministry of Transport of the People’s Republic of China: Beijing, China, 2011.
- JTG E42-2005; Test Methods of Aggregate for Highway Engineering. Ministry of Transport of the People’s Republic of China: Beijing, China, 2005.
- JTG F40-2004; Technical Specifications for Construction of Highway Asphalt Pavements. Ministry of Transport of the People’s Republic of China: Beijing China, 2004.
- Singh, D.; Habal, A.; Ashish, P.K.; Kataware, A. Evaluating suitability of energy efficient and anti-stripping additives for polymer and Polyphosphoric acid modified asphalt binder using surface free energy approach. Constr. Build. Mater. 2018, 158, 949–960. [Google Scholar] [CrossRef]
- Le, V.P.; Bui, M.P.; Nguyen, Q.P.; Vo, H.L.; Nguyen, V.D. Marshall and Balanced mix design in determining the asphalt content for hot mix asphalt mixture: A comparative study. Case Stud. Constr. Mater. 2024, 21, e03753. [Google Scholar] [CrossRef]
- Dejun, K.; Jinchun, W. Salt spray corrosion and electrochemical corrosion properties of anodic oxide film on 7475 aluminum alloy. J. Alloys Compd. 2015, 632, 286–290. [Google Scholar] [CrossRef]
- Dong, L.; Wei, X.-W.; Liu, M.-J.; Zhang, X.-F.; Yang, G.-J.; Zhou, K.-S. Boosting corrosion resistance of environmental barrier coatings through surface aluminum modification against molten salts. Corros. Sci. 2025, 244, 112646. [Google Scholar] [CrossRef]
- Guo, Q.; Li, G.; Gao, Y.; Wang, K.; Dong, Z.; Liu, F.; Zhu, H. Experimental investigation on bonding property of asphalt-aggregate interface under the actions of salt immersion and freeze-thaw cycles. Constr. Build. Mater. 2019, 206, 590–599. [Google Scholar] [CrossRef]
- Wang, A.; Guan, B.; Zhao, H.; He, Z.; Ding, D.; Gai, W. Microwave self-healing characteristics of the internal voids in steel slag asphalt mixture subjected to salt-freeze-thaw cycles. Constr. Build. Mater. 2024, 449, 138362. [Google Scholar] [CrossRef]
- Yu, L.; Lei, B.; Zhao, H.; Jiang, W.; Yuan, M. Study on deterioration mechanisms of steel slag asphalt concrete subjected to coupled salt freeze-thaw and cyclic preloading. Constr. Build. Mater. 2025, 479, 141409. [Google Scholar] [CrossRef]
- Zhao, X.; Sheng, Y.; Lv, H.; Jia, H.; Liu, Q.; Ji, X.; Xiong, R.; Meng, J. Laboratory investigation on road performances of asphalt mixtures using steel slag and granite as aggregate. Constr. Build. Mater. 2022, 315, 125655. [Google Scholar] [CrossRef]


| Measurement Parameter | Unit | Measured Value |
|---|---|---|
| Density (20 °C) | g/cm3 | 2.7 |
| Melting Point | °C | 582–652 |
| Coefficient of Thermal Expansion (20–100 °C) | °C | 23.6 × 10⁻⁶ |
| Elastic Modulus | GPa | 68.9 |
| Poisson’s Ratio | - | 0.33 |
| Tensile Strength (25 °C) | MPa | 310 |
| Yield Strength (25 °C) | MPa | 276 |
| Hardness (500 kg force, 10 mm ball) | N/mm2 | 95 |
| Asphalt | Aggregate Type | Asphalt Coverage Status | Asphalt Stripping Rate |
|---|---|---|---|
| SBS | L-shaped Folded Metal | Partial Asphalt Shedding | <5% |
| Limestone | Asphalt Coverage Intact | 0% |
| Material | Test Items | Unit | Result | Specification |
|---|---|---|---|---|
| SBS modified | Penetration (25 °C) | 0.1 mm | 51 | 40–60 |
| Asphalt binder | Penetration Index | - | 0.28 | ≮0 |
| Ductility (5 °C, 5 cm/min) | cm | 28 | ≮20 | |
| Softening Point | °C | 81.3 | ≮60 | |
| Viscosity | Pa·s | 1.8 | ≯3 | |
| Flash Point Temp | °C | 293 | ≮230 | |
| Elastic Recovery (25 °C) | % | 86 | ≮75 | |
| RTPOT binder (163 °C, 75 min) | Penetration Ratio (25 °C) | % | 70 | ≮65 |
| Ductility (5 °C) | cm | 17 | ≮15 | |
| Quality Loss | % | −0.52 | ≯±0.1 |
| Index | Unit | Result | Standard | Method |
|---|---|---|---|---|
| Apparent Relative Density | 13.2–16 mm | -- | 2.709 | ≥2.5 |
| 9.5–13.2 mm | -- | 2.718 | ||
| 4.75–9.5 mm | -- | 2.714 | ||
| 2.36–4.75 mm | -- | 2.711 | ||
| Water Absorption | 13.2–16 mm | % | 0.56 | ≤3.0 |
| 9.5–13.2 mm | % | 0.58 | ||
| 4.75–9.5 mm | % | 0.63 | ||
| 2.36–4.75 mm | % | 0.79 | ||
| Los Angeles Abrasion Value | % | 20.5 | ≤30 | T 0317-2005 |
| Flakiness and Elongation Index | % | 8.7 | ≤20 | T 0312-2005 |
| Crushing Value | % | 19.3 | ≤28 | T 0316-2005 |
| Adhesion with Asphalt | -- | Grade 5 | >Grade 4 | T 0616-1993 |
| Index | Unit | Result | Standard | Method |
|---|---|---|---|---|
| Apparent Relative Density | 1.18–2.36 mm | - | 2.660 | ≥2.5 |
| 0.6–1.18 mm | - | 2.679 | ||
| 0.3–0.6 mm | - | 2.658 | ||
| 0.15–0.3 mm | - | 2.616 | ||
| 0.075–0.15 mm | - | 2.635 | ||
| Soundness (Part > 0.3 mm) | % | 8.9 | ≤12 | T 0317-2005 |
| Content of Particles < 0.075 mm | % | 0.9 | ≤1.0 | T 0333-2000 |
| Sample Type | Distilled Water (Mean °/CV%) | Glycerol (Mean °/CV%) |
|---|---|---|
| SBS | 96.20/1.91 | 87.36/2.04 |
| 70# | 102.65/0.84 | 91.92/2.07 |
| Limestone | 57.32/2.70 | 46.88/4.19 |
| LFMAs | 65.56/3.57 | 56.42/2.90 |
| Sample Type | Fitted Equation | Coefficient of Determination (R2) |
|---|---|---|
| 70# Asphalt | y = 1.421x + 4.172 | 0.9551 |
| SBS-Modified Asphalt | y = 1.757x + 4.459 | 0.9941 |
| Limestone | y = 4.450x + 5.308 | 0.9984 |
| LFMAs | y = 3.911x + 5.028 | 0.9426 |
| Specimen | Surface Energy (mJ/m2) | Dispersion Component (mJ/m2) | Polar Component (mJ/m2) |
|---|---|---|---|
| 70# Asphalt | 19.54 | 17.54 | 2.15 |
| SBS Asphalt | 22.86 | 19.84 | 3.02 |
| Limestone | 47.67 | 28.10 | 19.57 |
| LFMAs | 40.77 | 26.04 | 14.73 |
| Asphalt | Limestone (mJ/m2) | LFMAs (mJ/m2) |
|---|---|---|
| 70# | 57.37 | 53.99 |
| SBS | 62.60 | 58.80 |
| Material Group | Mean Value of Marshal Stability (kN) | Standard Deviation (kN) | CV (%) |
|---|---|---|---|
| A0 | 13.8 | 0.2073 | 1.42% |
| L3-A1 | 15.9 | 0.0802 | 0.48% |
| L3-A3 | 16.9 | 0.0736 | 0.45% |
| L3-A5 | 18.6 | 0.1351 | 0.86% |
| L6-A1 | 15.3 | 0.2259 | 1.28% |
| L6-A3 | 16.5 | 4.0620 | 2.26% |
| L6-A5 | 18.1 | 0.6875 | 4.15% |
| L10-A1 | 14.6 | 0.1389 | 0.73% |
| L10-A3 | 15.9 | 0.527 | 2.80% |
| L10-A5 | 17.6 | 0.4375 | 2.35% |
| Material Group | Mean Value of Marshal Flow Value (mm) | Standard Deviation (mm) | CV (%) |
|---|---|---|---|
| A0 | 3.55 | 0.0724 | 2.16% |
| L3-A1 | 3.42 | 0.045 | 1.15% |
| L3-A3 | 3.65 | 0.0719 | 2.01% |
| L3-A5 | 3.61 | 0.206 | 5.37% |
| L6-A1 | 3.75 | 0.0823 | 2.20% |
| L6-A3 | 3.66 | 0.09 | 2.26% |
| L6-A5 | 3.86 | 0.2486 | 7.10% |
| L10-A1 | 3.61 | 0.0861 | 2.28% |
| L10-A3 | 3.65 | 0.0512 | 1.22% |
| L10-A5 | 3.76 | 0.217 | 5.09% |
| Material Group | Mean Value of Dynamic Stability (times/mm) | Standard Deviation (times/mm) | CV (%) |
|---|---|---|---|
| A0 | 3126 | 82 | 2.63% |
| L3-A1 | 3501 | 79 | 2.26% |
| L3-A3 | 3756 | 136 | 3.63% |
| L3-A5 | 4252 | 128 | 3.02% |
| L6-A1 | 3482 | 111 | 3.18% |
| L6-A3 | 3775 | 108 | 2.87% |
| L6-A5 | 4120 | 111 | 2.69% |
| L10-A1 | 3288 | 106 | 3.21% |
| L10-A3 | 3567 | 104 | 2.91% |
| L10-A5 | 3981 | 106 | 2.67% |
| Material Group | Mean Value of Flexural Tensile Strength (MPa) | Standard Deviation (MPa) | CV (%) |
|---|---|---|---|
| A0 | 12.23 | 0.15 | 1.21% |
| L3-A1 | 12.82 | 1.43 | 11.87% |
| L3-A3 | 13.31 | 0.52 | 3.97% |
| L3-A5 | 13.42 | 0.66 | 4.98% |
| L6-A1 | 12.61 | 0.8 | 6.38% |
| L6-A3 | 13.13 | 0.3 | 2.33% |
| L6-A5 | 13.28 | 1.42 | 12.13% |
| L10-A1 | 12.39 | 0.35 | 2.83% |
| L10-A3 | 12.58 | 0.98 | 8.44% |
| L10-A5 | 12.68 | 0.91 | 8.15% |
| Material Group | Mean Value of Flexural Strain (με) | Standard Deviation (με) | CV (%) |
|---|---|---|---|
| A0 | 2719.5 | 31.4 | 1.17% |
| L3-A1 | 2745.7 | 68.25 | 2.42% |
| L3-A3 | 2867.5 | 72.81 | 2.52% |
| L3-A5 | 2901.5 | 108.49 | 3.97% |
| L6-A1 | 2766.6 | 105.7 | 3.53% |
| L6-A3 | 2837.7 | 202.58 | 7.81% |
| L6-A5 | 2872.8 | 155.24 | 5.93% |
| L10-A1 | 2735.3 | 44.65 | 1.64% |
| L10-A3 | 2776.2 | 67.71 | 2.53% |
| L10-A5 | 2797.3 | 181.28 | 7.09% |
| Material Group | Mean Value of Unimmersed Marshall Stability (kN) | Standard Deviation (kN) | CV (%) |
|---|---|---|---|
| A0 | 13.80 | 0.51 | 3.67% |
| L3-A1 | 15.10 | 0.66 | 4.37% |
| L3-A3 | 16.60 | 0.73 | 4.37% |
| L3-A5 | 17.70 | 0.73 | 4.10% |
| L6-A1 | 14.50 | 0.74 | 5.10% |
| L6-A3 | 16.23 | 0.78 | 4.77% |
| L6-A5 | 17.30 | 0.78 | 4.51% |
| L10-A1 | 14.20 | 0.91 | 6.41% |
| L10-A3 | 15.60 | 0.76 | 4.88% |
| L10-A5 | 16.80 | 0.74 | 4.41% |
| Material Group | Mean Value of Splitting Strength Prior to Freeze–Thaw (MPa) | Standard Deviation (MPa) | CV (%) |
|---|---|---|---|
| A0 | 1.278 | 0.35 | 2.84% |
| L3-A1 | 1.392 | 0.34 | 2.36% |
| L3-A3 | 1.468 | 0.37 | 2.45% |
| L3-A5 | 1.347 | 0.16 | 1.04% |
| L6-A1 | 1.435 | 0.37 | 2.66% |
| L6-A3 | 1.474 | 0.23 | 1.59% |
| L6-A5 | 1.396 | 0.30 | 2.00% |
| L10-A1 | 1.470 | 0.39 | 3.00% |
| L10-A3 | 1.525 | 0.24 | 1.69% |
| L10-A5 | 1.193 | 0.32 | 2.12% |
| Material Group | Mean Value of Splitting Strength After Freeze–Thaw (MPa) | Standard Deviation (MPa) | CV (%) |
|---|---|---|---|
| A0 | 1.191 | 0.35 | 3.05% |
| L3-A1 | 1.283 | 0.34 | 2.58% |
| L3-A3 | 1.338 | 0.37 | 2.75% |
| L3-A5 | 1.233 | 0.16 | 1.17% |
| L6-A1 | 1.300 | 0.39 | 3.06% |
| L6-A3 | 1.320 | 0.23 | 1.76% |
| L6-A5 | 1.272 | 0.30 | 2.24% |
| L10-A1 | 1.312 | 0.41 | 3.38% |
| L10-A3 | 1.356 | 0.22 | 1.69% |
| L10-A5 | 1.110 | 0.30 | 2.16% |
| Material Group | MS (kN) | DS (times/mm) | Mean Low-Temp Flexural Tensile Strength (MPa) | Mean Low-Temp Flexural Tensile Strain (με) | Immersion Residual Stability | TSR |
|---|---|---|---|---|---|---|
| A0 | 13.8 | 3126 | 12.23 | 2719.5 | 92.61% | 93.06% |
| L3-A1 | 15.9 | 3501 | 12.82 | 2745.7 | 92.85% | 91.13% |
| L3-A3 | 16.9 | 3756 | 13.31 | 2867.5 | 92.77% | 89.26% |
| L3-A5 | 18.6 | 4252 | 13.42 | 2901.5 | 94.24% | 88.95% |
| L6-A1 | 15.3 | 3482 | 12.61 | 2766.6 | 92.62% | 91.53% |
| L6-A3 | 16.5 | 3775 | 13.13 | 2837.7 | 92.85% | 90.63% |
| L6-A5 | 18.1 | 4120 | 13.28 | 2872.8 | 94.05% | 89.55% |
| L10-A1 | 14.6 | 3288 | 12.39 | 2735.3 | 92.54% | 93.14% |
| L10-A3 | 15.9 | 3567 | 12.58 | 2776.2 | 93.01% | 92.16% |
| L10-A5 | 17.6 | 3981 | 12.68 | 2797.3 | 93.87% | 91.17% |
| AC-GSAM | 12.7 | 2710 | 13.2 | 3120 | 84.90% | 91.80% |
| AC-LAM | 11.1 | 1480 | 12.8 | 2970 | 86.20% | 82.30% |
| SMA-GSAM | 9.1 | 3000 | 10.5 | 2820 | 87% | 94% |
| SMA-LAM | 8.4 | 2900 | 10.1 | 2640 | 88.50% | 86.50% |
Disclaimer/Publisher’s Note: The statements, opinions and data contained in all publications are solely those of the individual author(s) and contributor(s) and not of MDPI and/or the editor(s). MDPI and/or the editor(s) disclaim responsibility for any injury to people or property resulting from any ideas, methods, instructions or products referred to in the content. |
© 2025 by the authors. Licensee MDPI, Basel, Switzerland. This article is an open access article distributed under the terms and conditions of the Creative Commons Attribution (CC BY) license (https://creativecommons.org/licenses/by/4.0/).
Share and Cite
Yang, Q.; Chen, K.; Guan, L.; Li, Y.; Li, Y.; Zhou, Y.; Yin, W. Effect of Incorporating L-Shaped Folded Metal Aggregates on the Performance of Asphalt Mixtures. Materials 2025, 18, 3039. https://doi.org/10.3390/ma18133039
Yang Q, Chen K, Guan L, Li Y, Li Y, Zhou Y, Yin W. Effect of Incorporating L-Shaped Folded Metal Aggregates on the Performance of Asphalt Mixtures. Materials. 2025; 18(13):3039. https://doi.org/10.3390/ma18133039
Chicago/Turabian StyleYang, Qingguo, Kelin Chen, Longfei Guan, Ya Li, Yunhao Li, Yu Zhou, and Wujing Yin. 2025. "Effect of Incorporating L-Shaped Folded Metal Aggregates on the Performance of Asphalt Mixtures" Materials 18, no. 13: 3039. https://doi.org/10.3390/ma18133039
APA StyleYang, Q., Chen, K., Guan, L., Li, Y., Li, Y., Zhou, Y., & Yin, W. (2025). Effect of Incorporating L-Shaped Folded Metal Aggregates on the Performance of Asphalt Mixtures. Materials, 18(13), 3039. https://doi.org/10.3390/ma18133039