
DNA Type Influence on Properties of Thin Layer of DNA Complexes

 , , , ,
 Highlights
- Thin self-organized layers of DNA complexes can be created on the mica slices.
- The Langmuir–Blodgett technique enables control over the structure of DNA complexes.
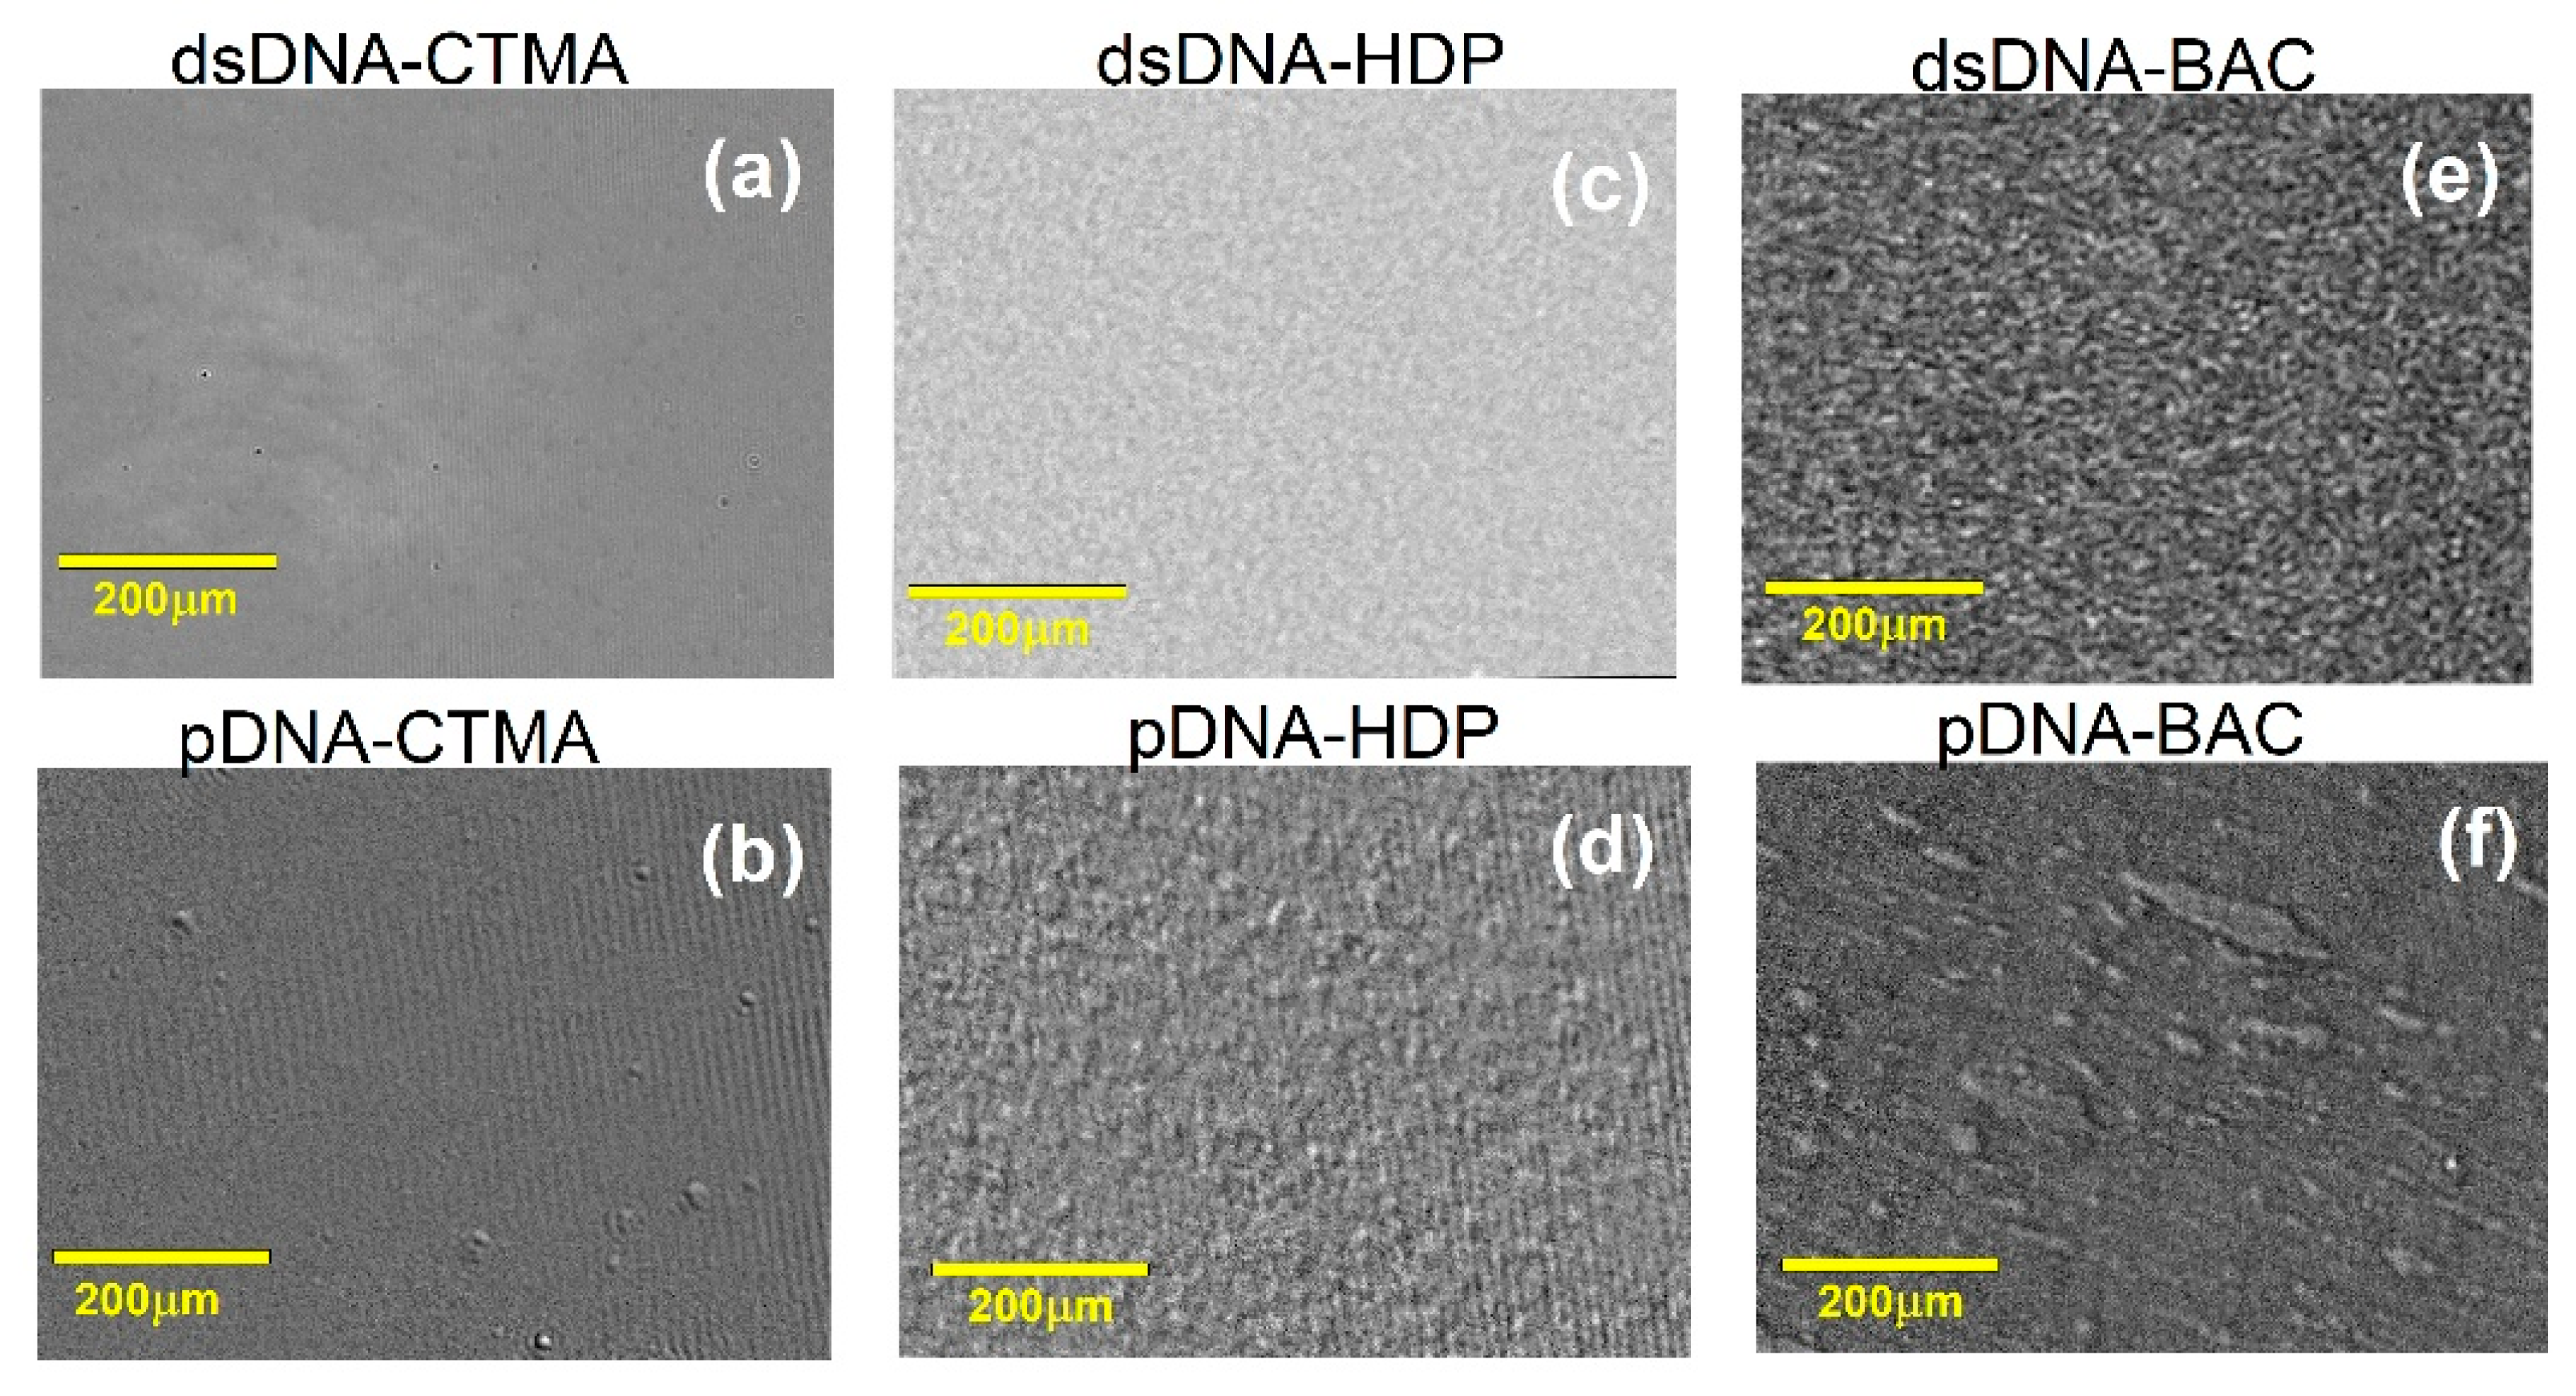
- The type of DNA influences the morphology of DNA complexes thin films.
- The surfactant structure has a smaller effect on the morphology of the DNA films.
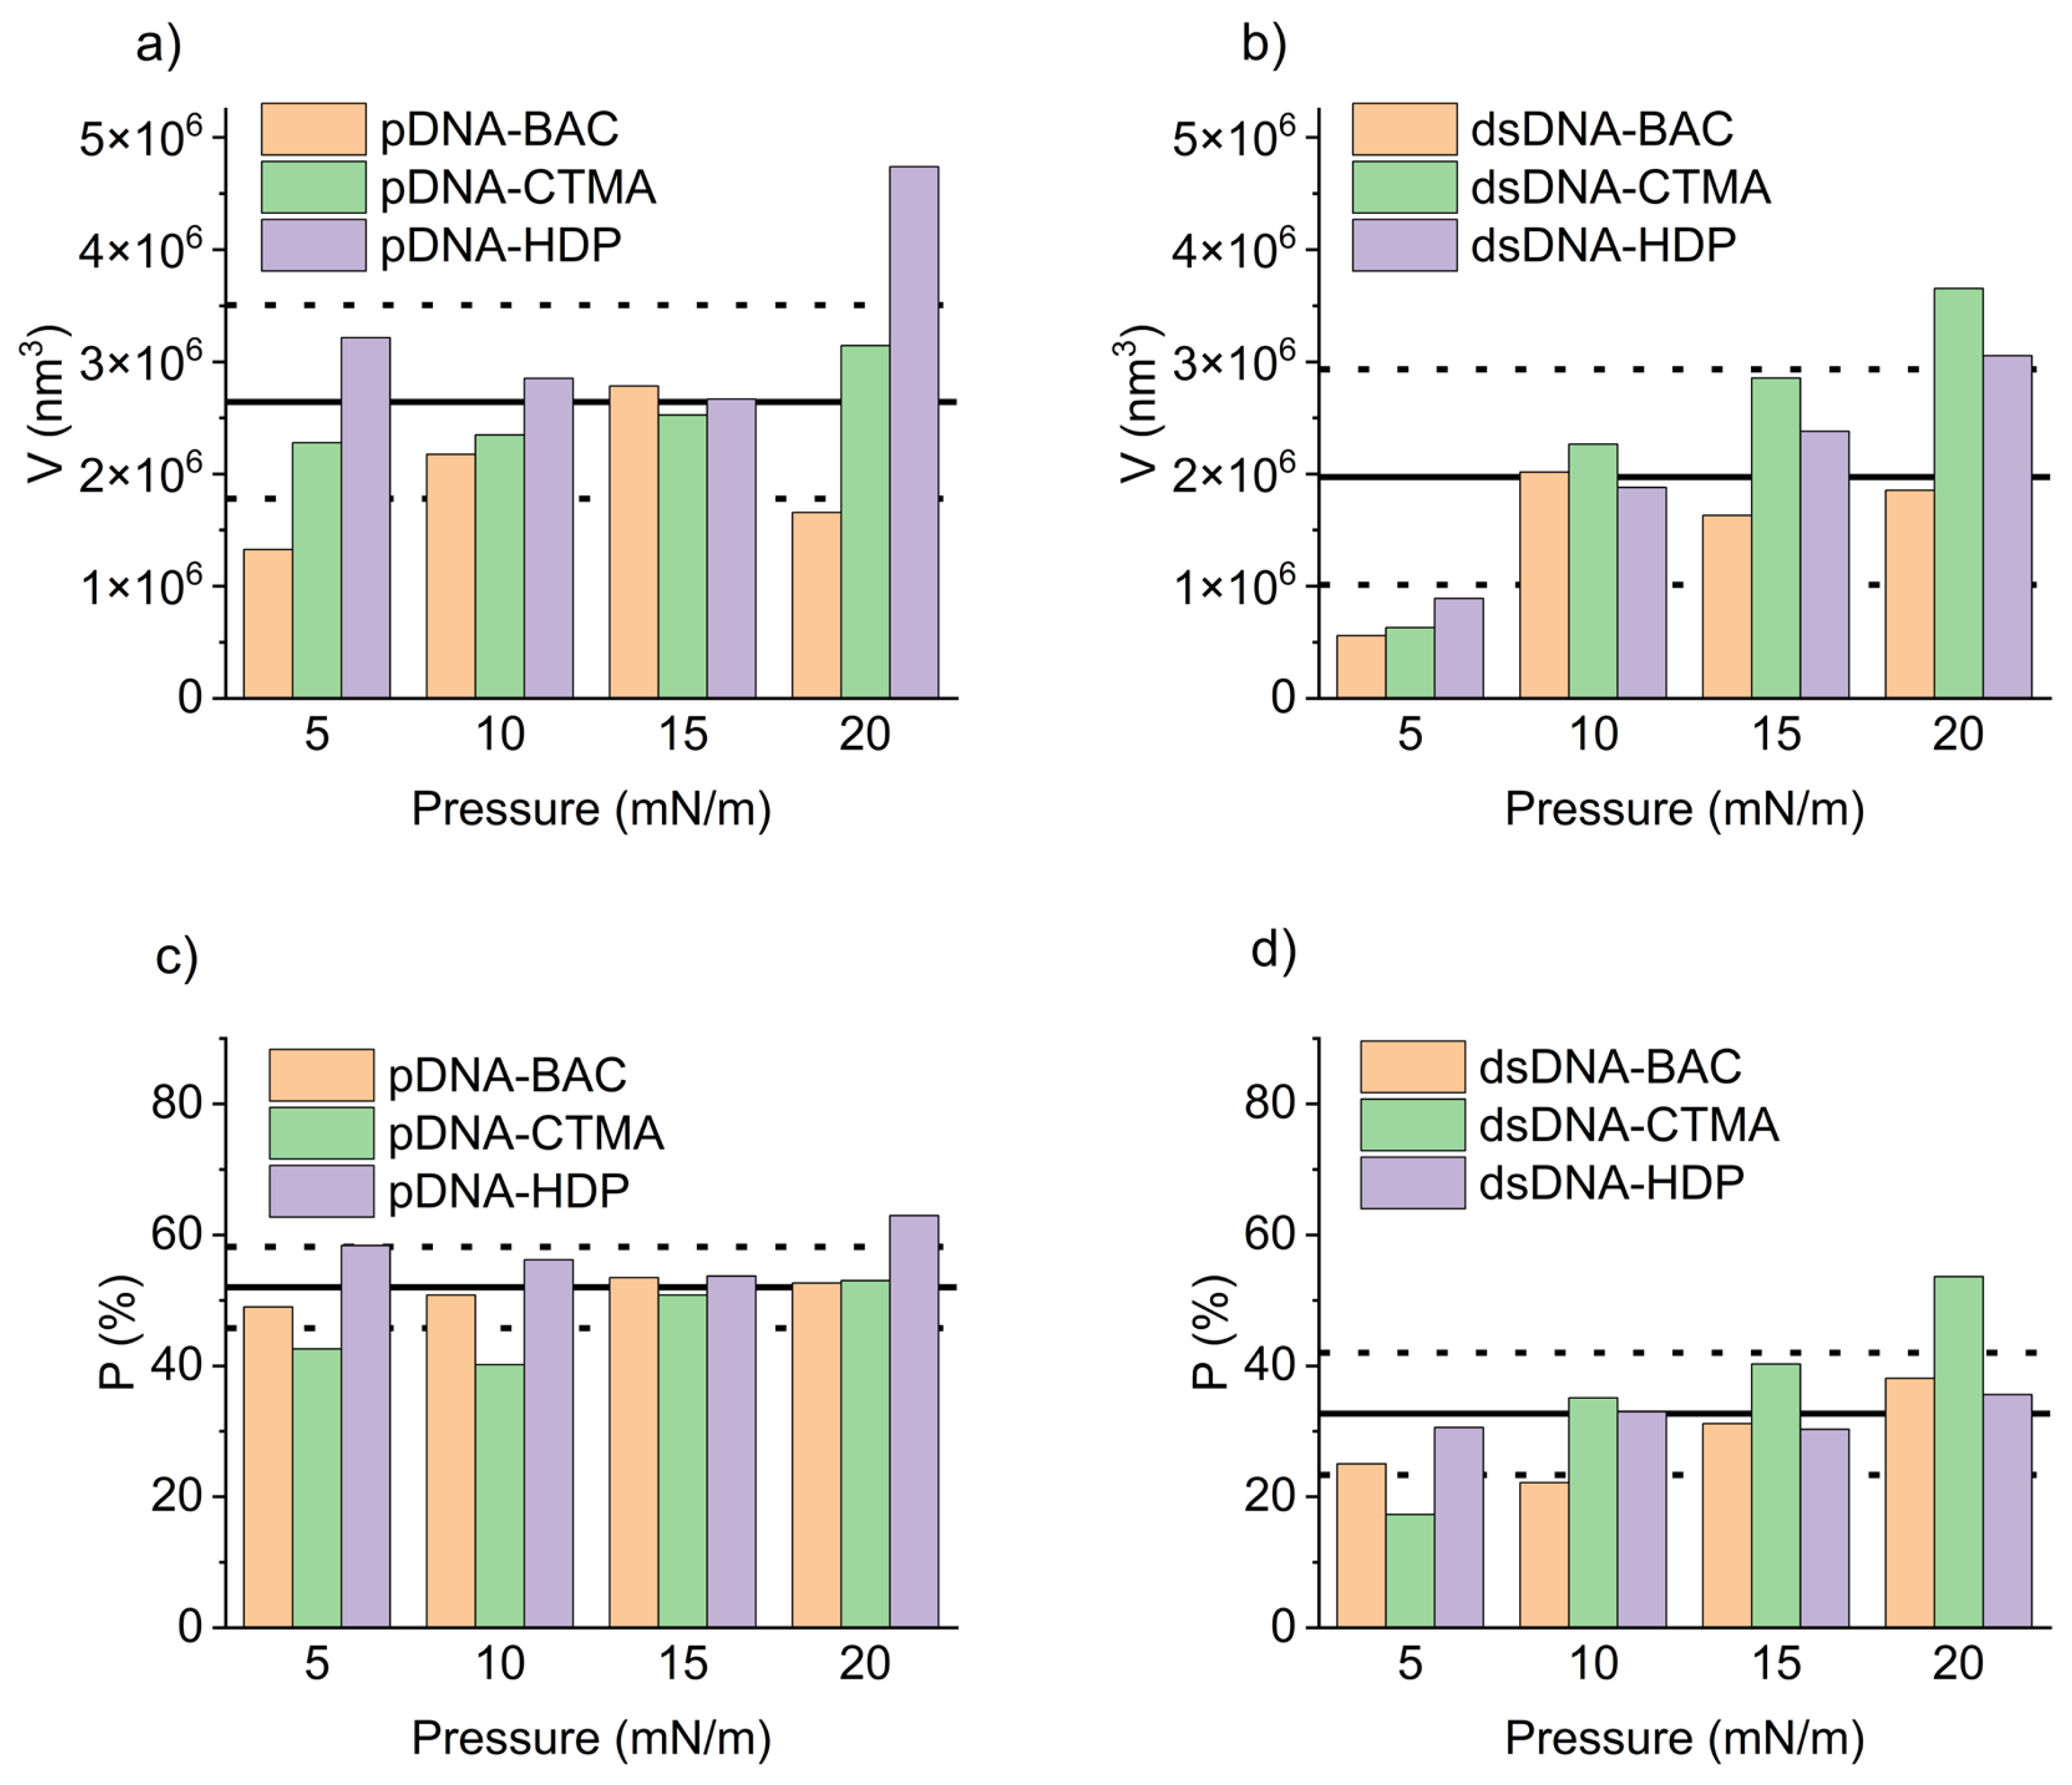
- Thin films of linear or plasmid DNA complexes cover different percentages of the mica surface.
Abstract

1. Introduction
2. Materials and Methods
2.1. Materials
2.2. Methods
3. Results and Discussion
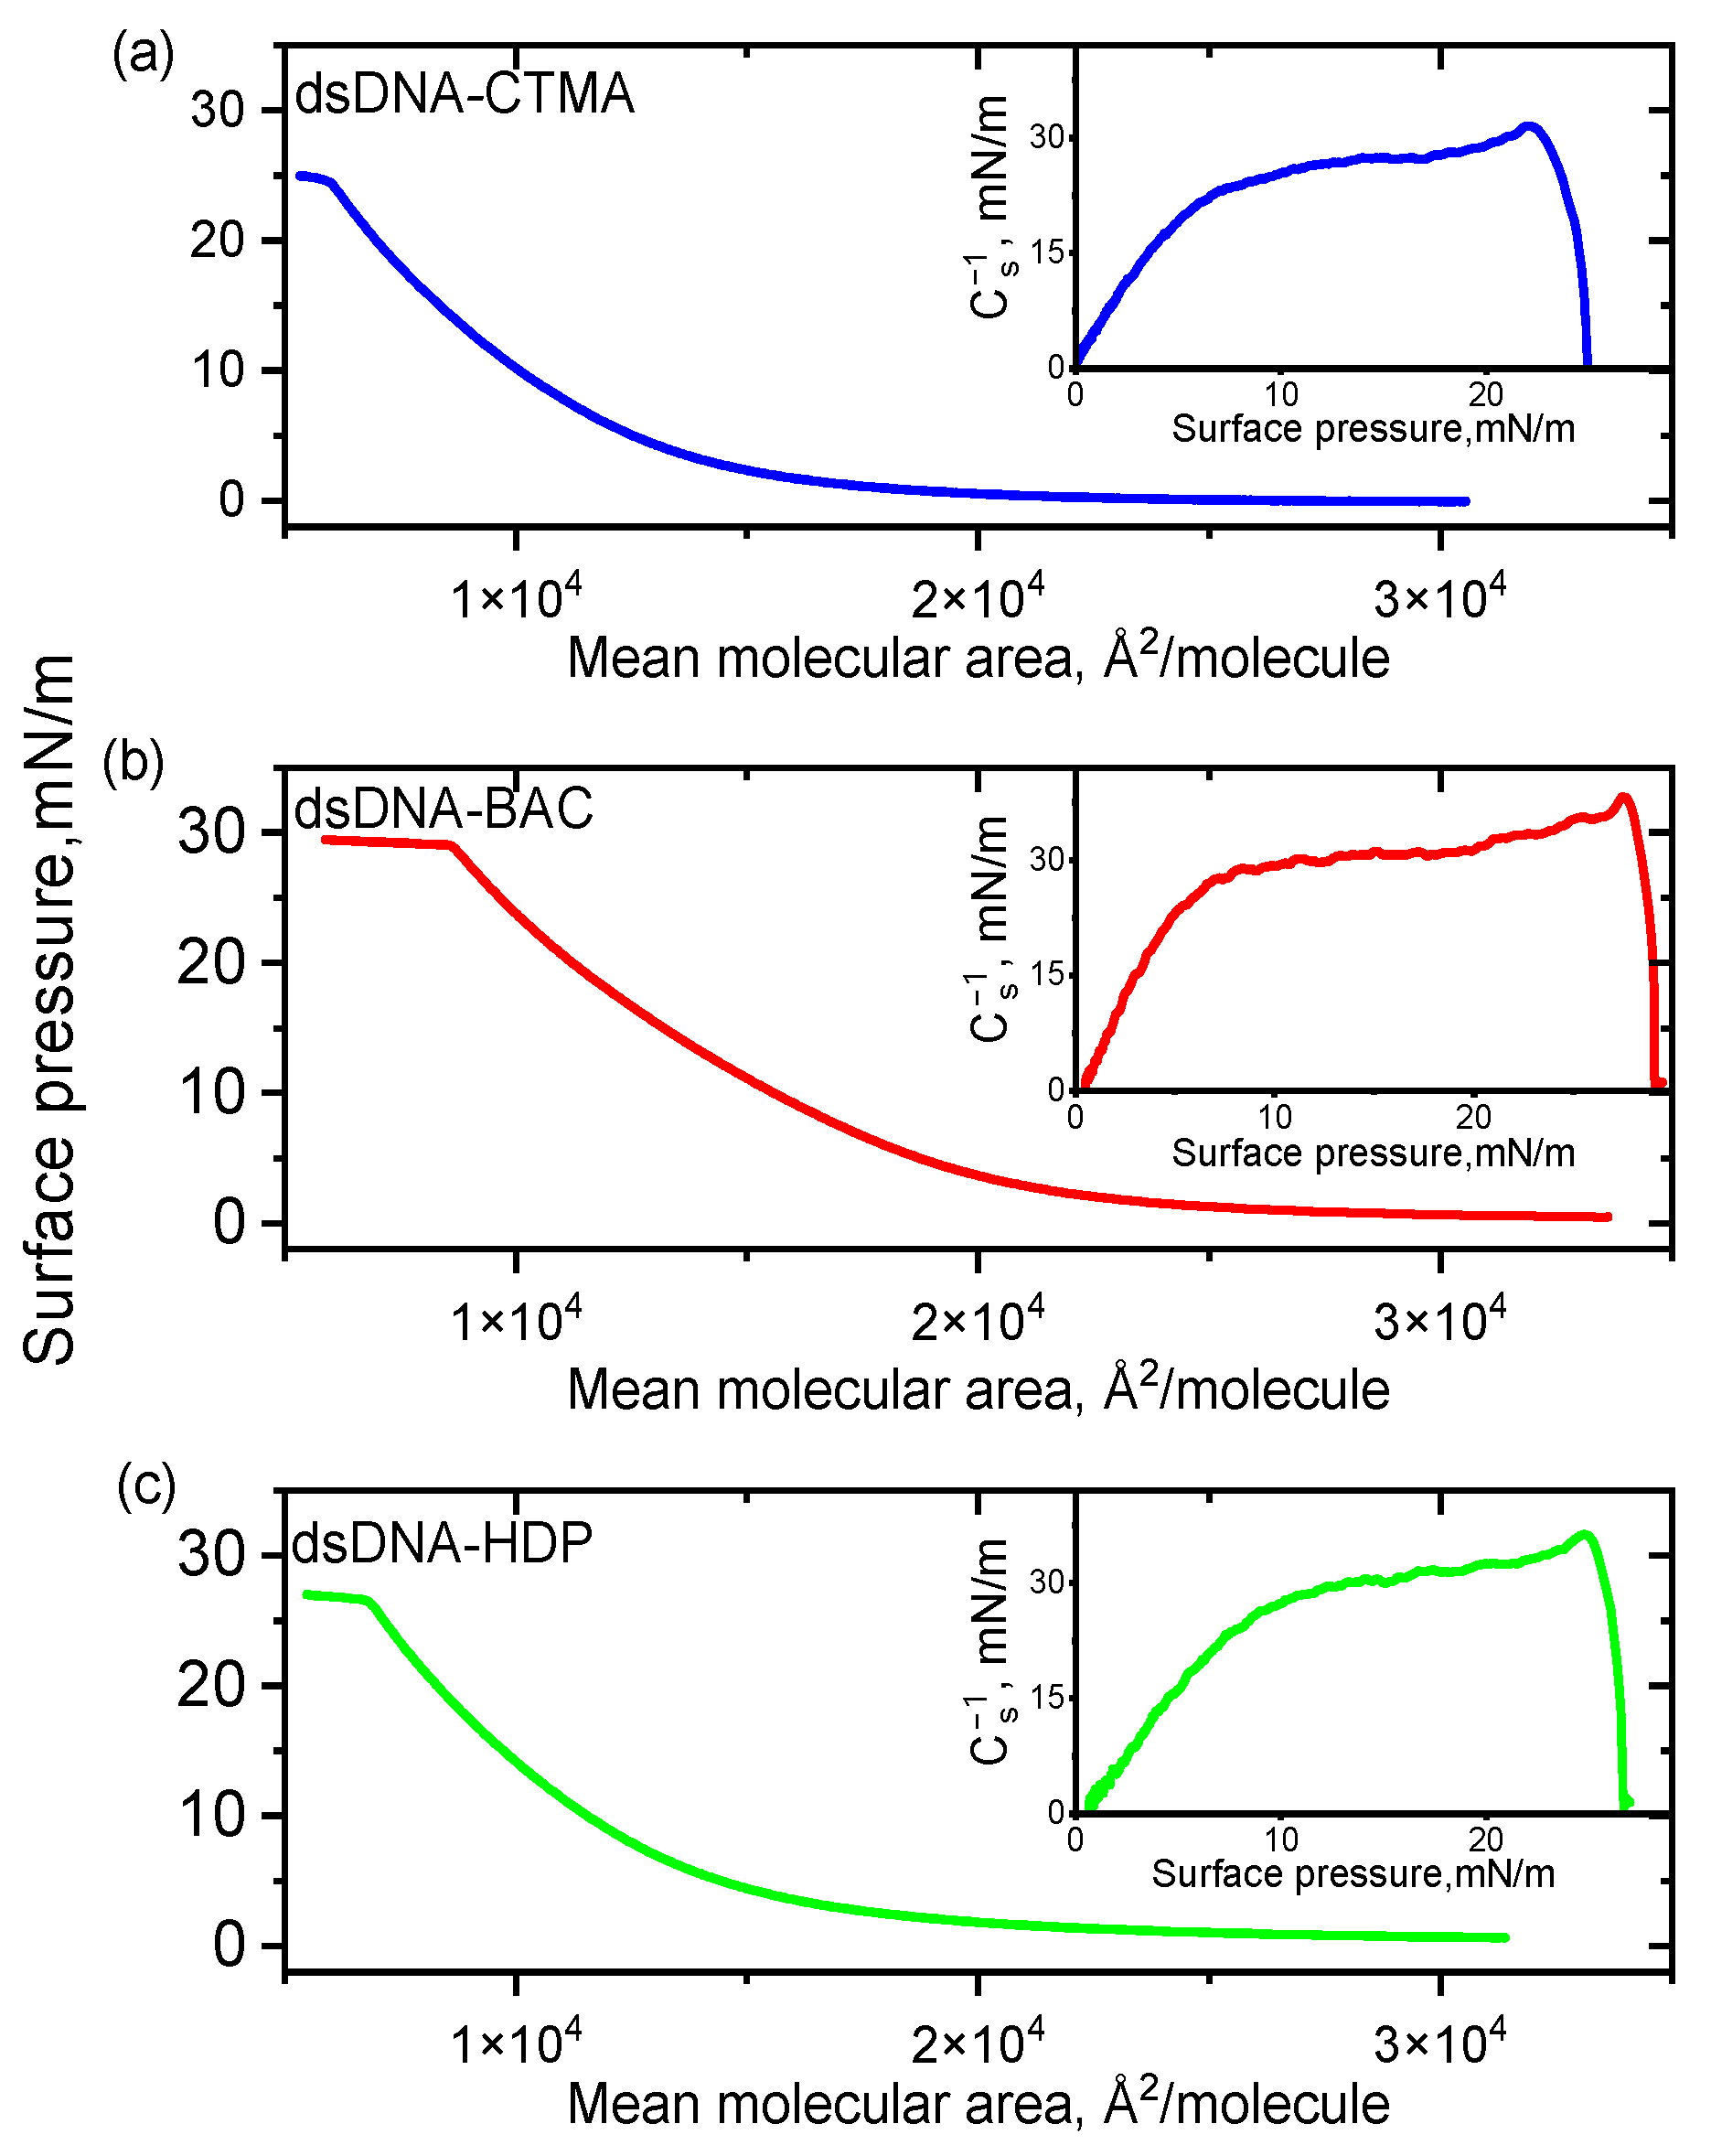
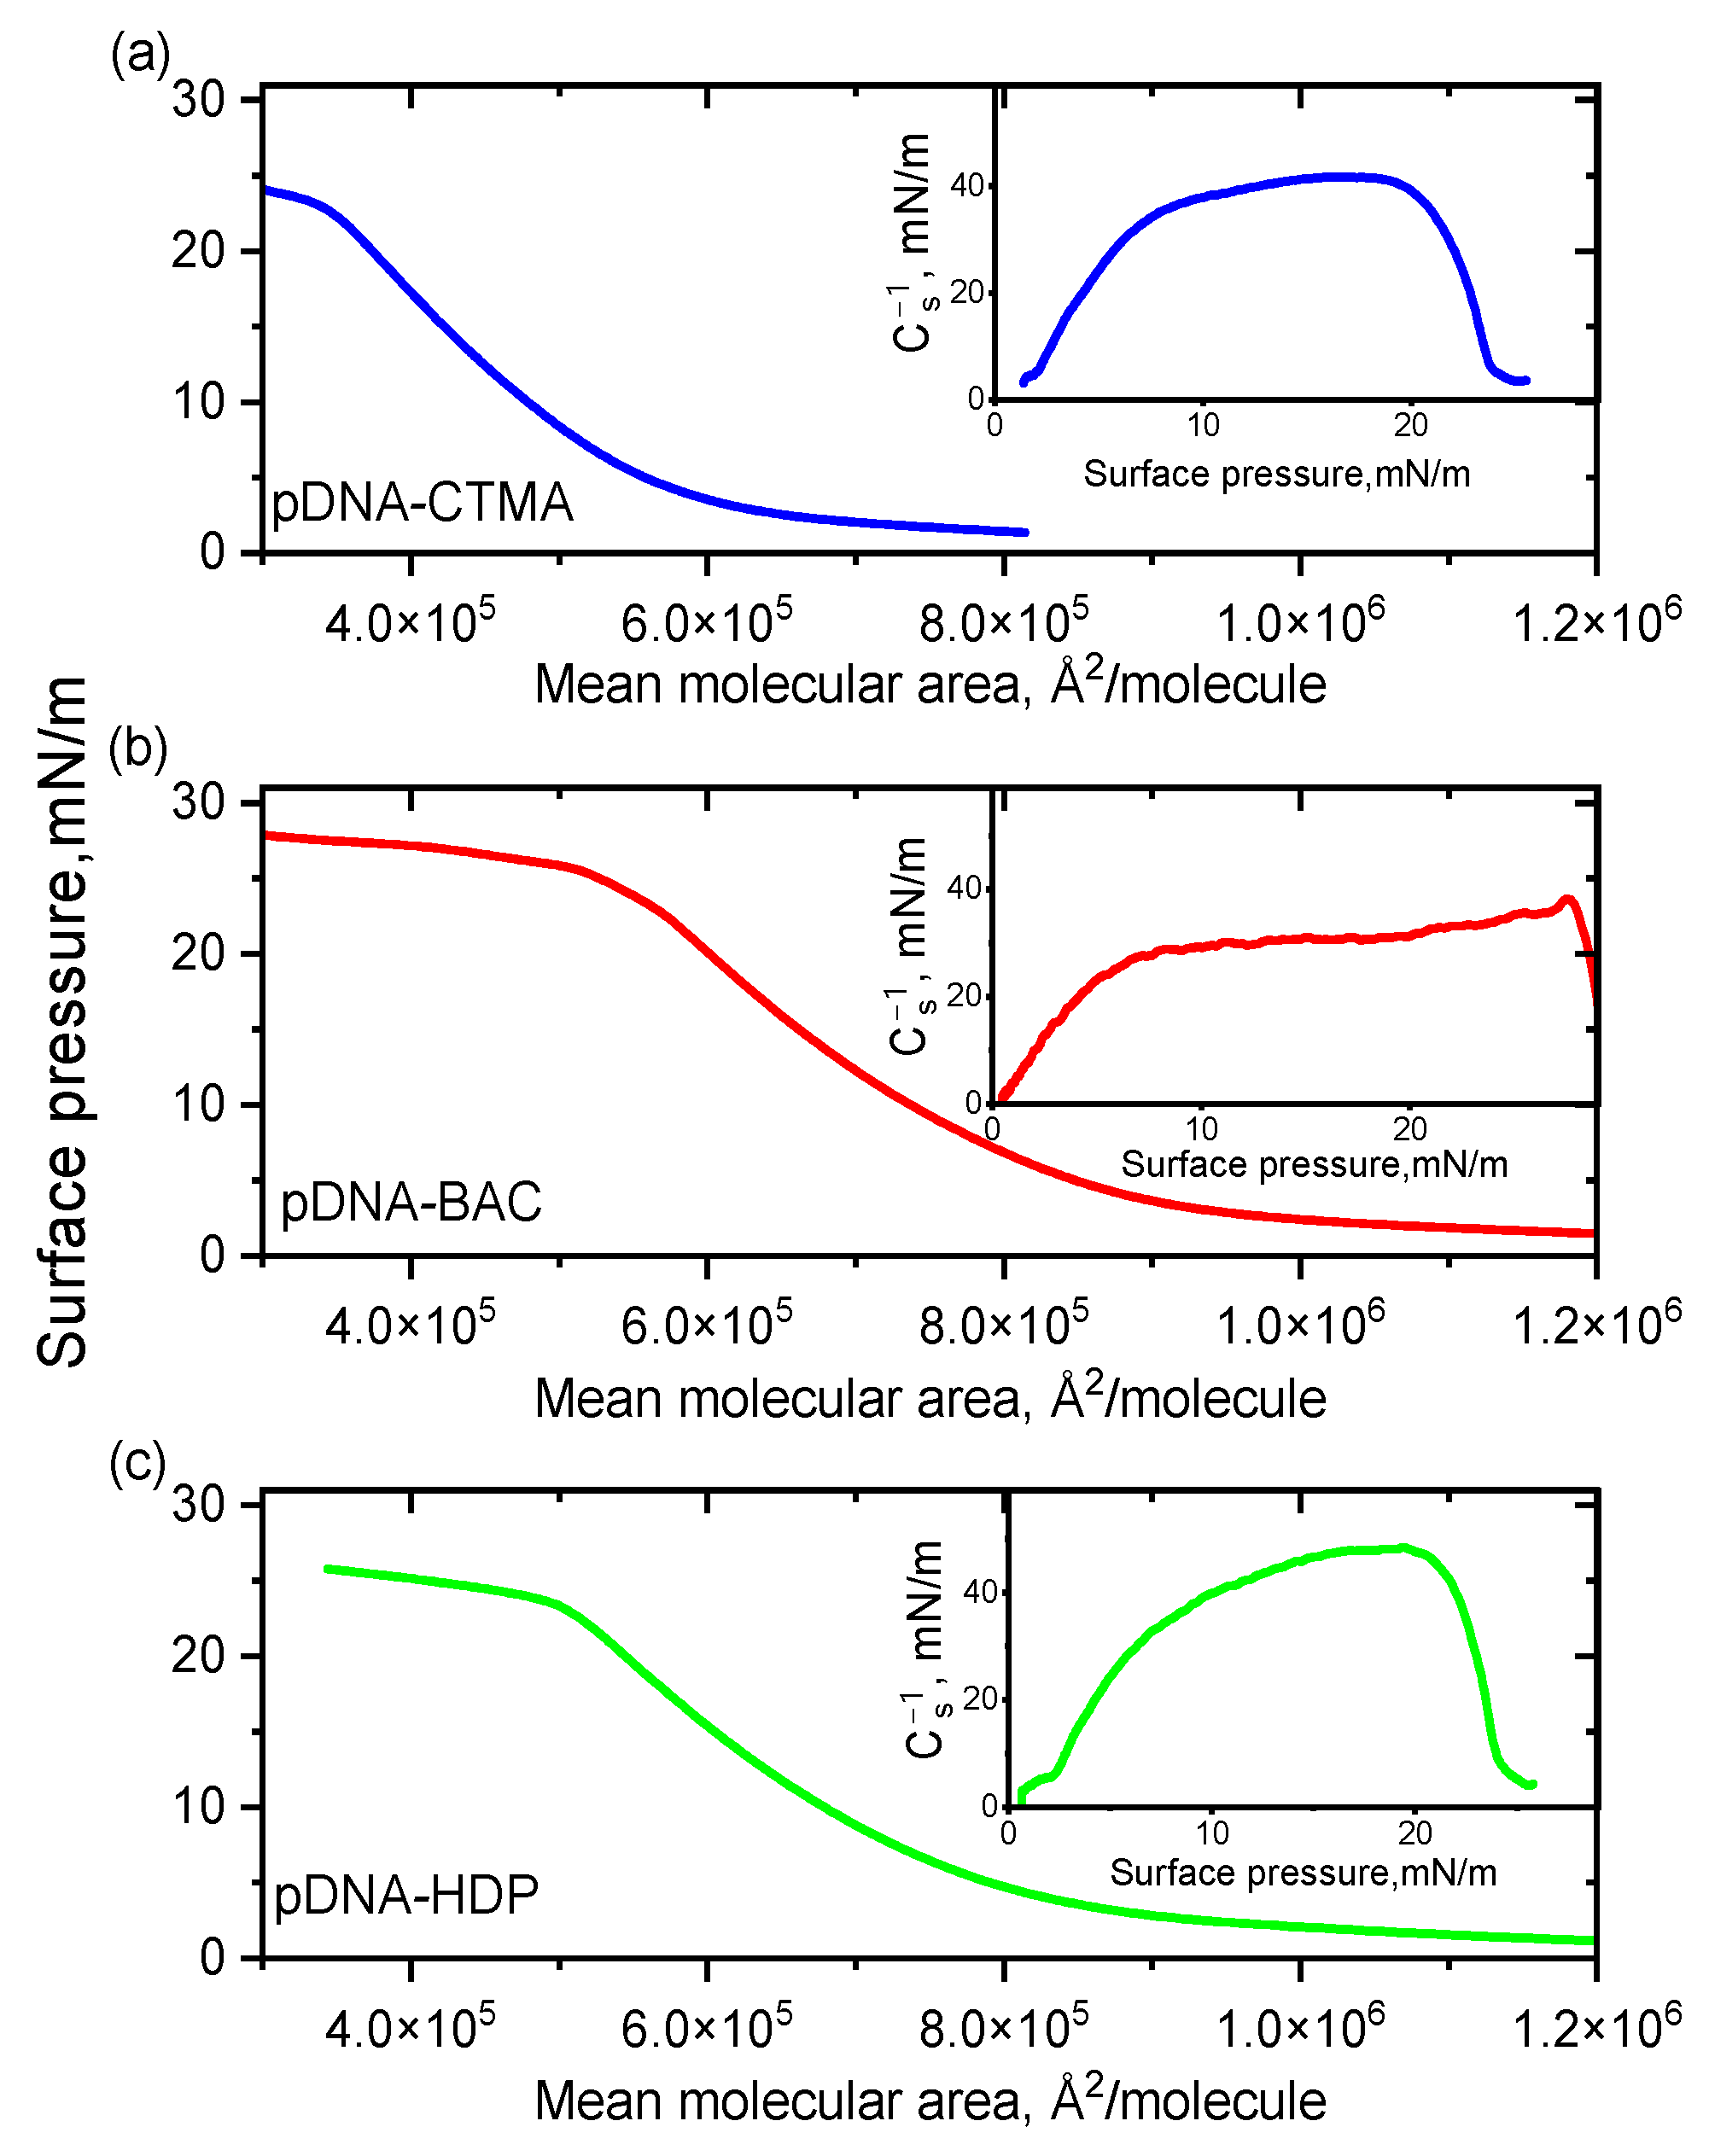
3.1. Langmuir Monolayer Technique
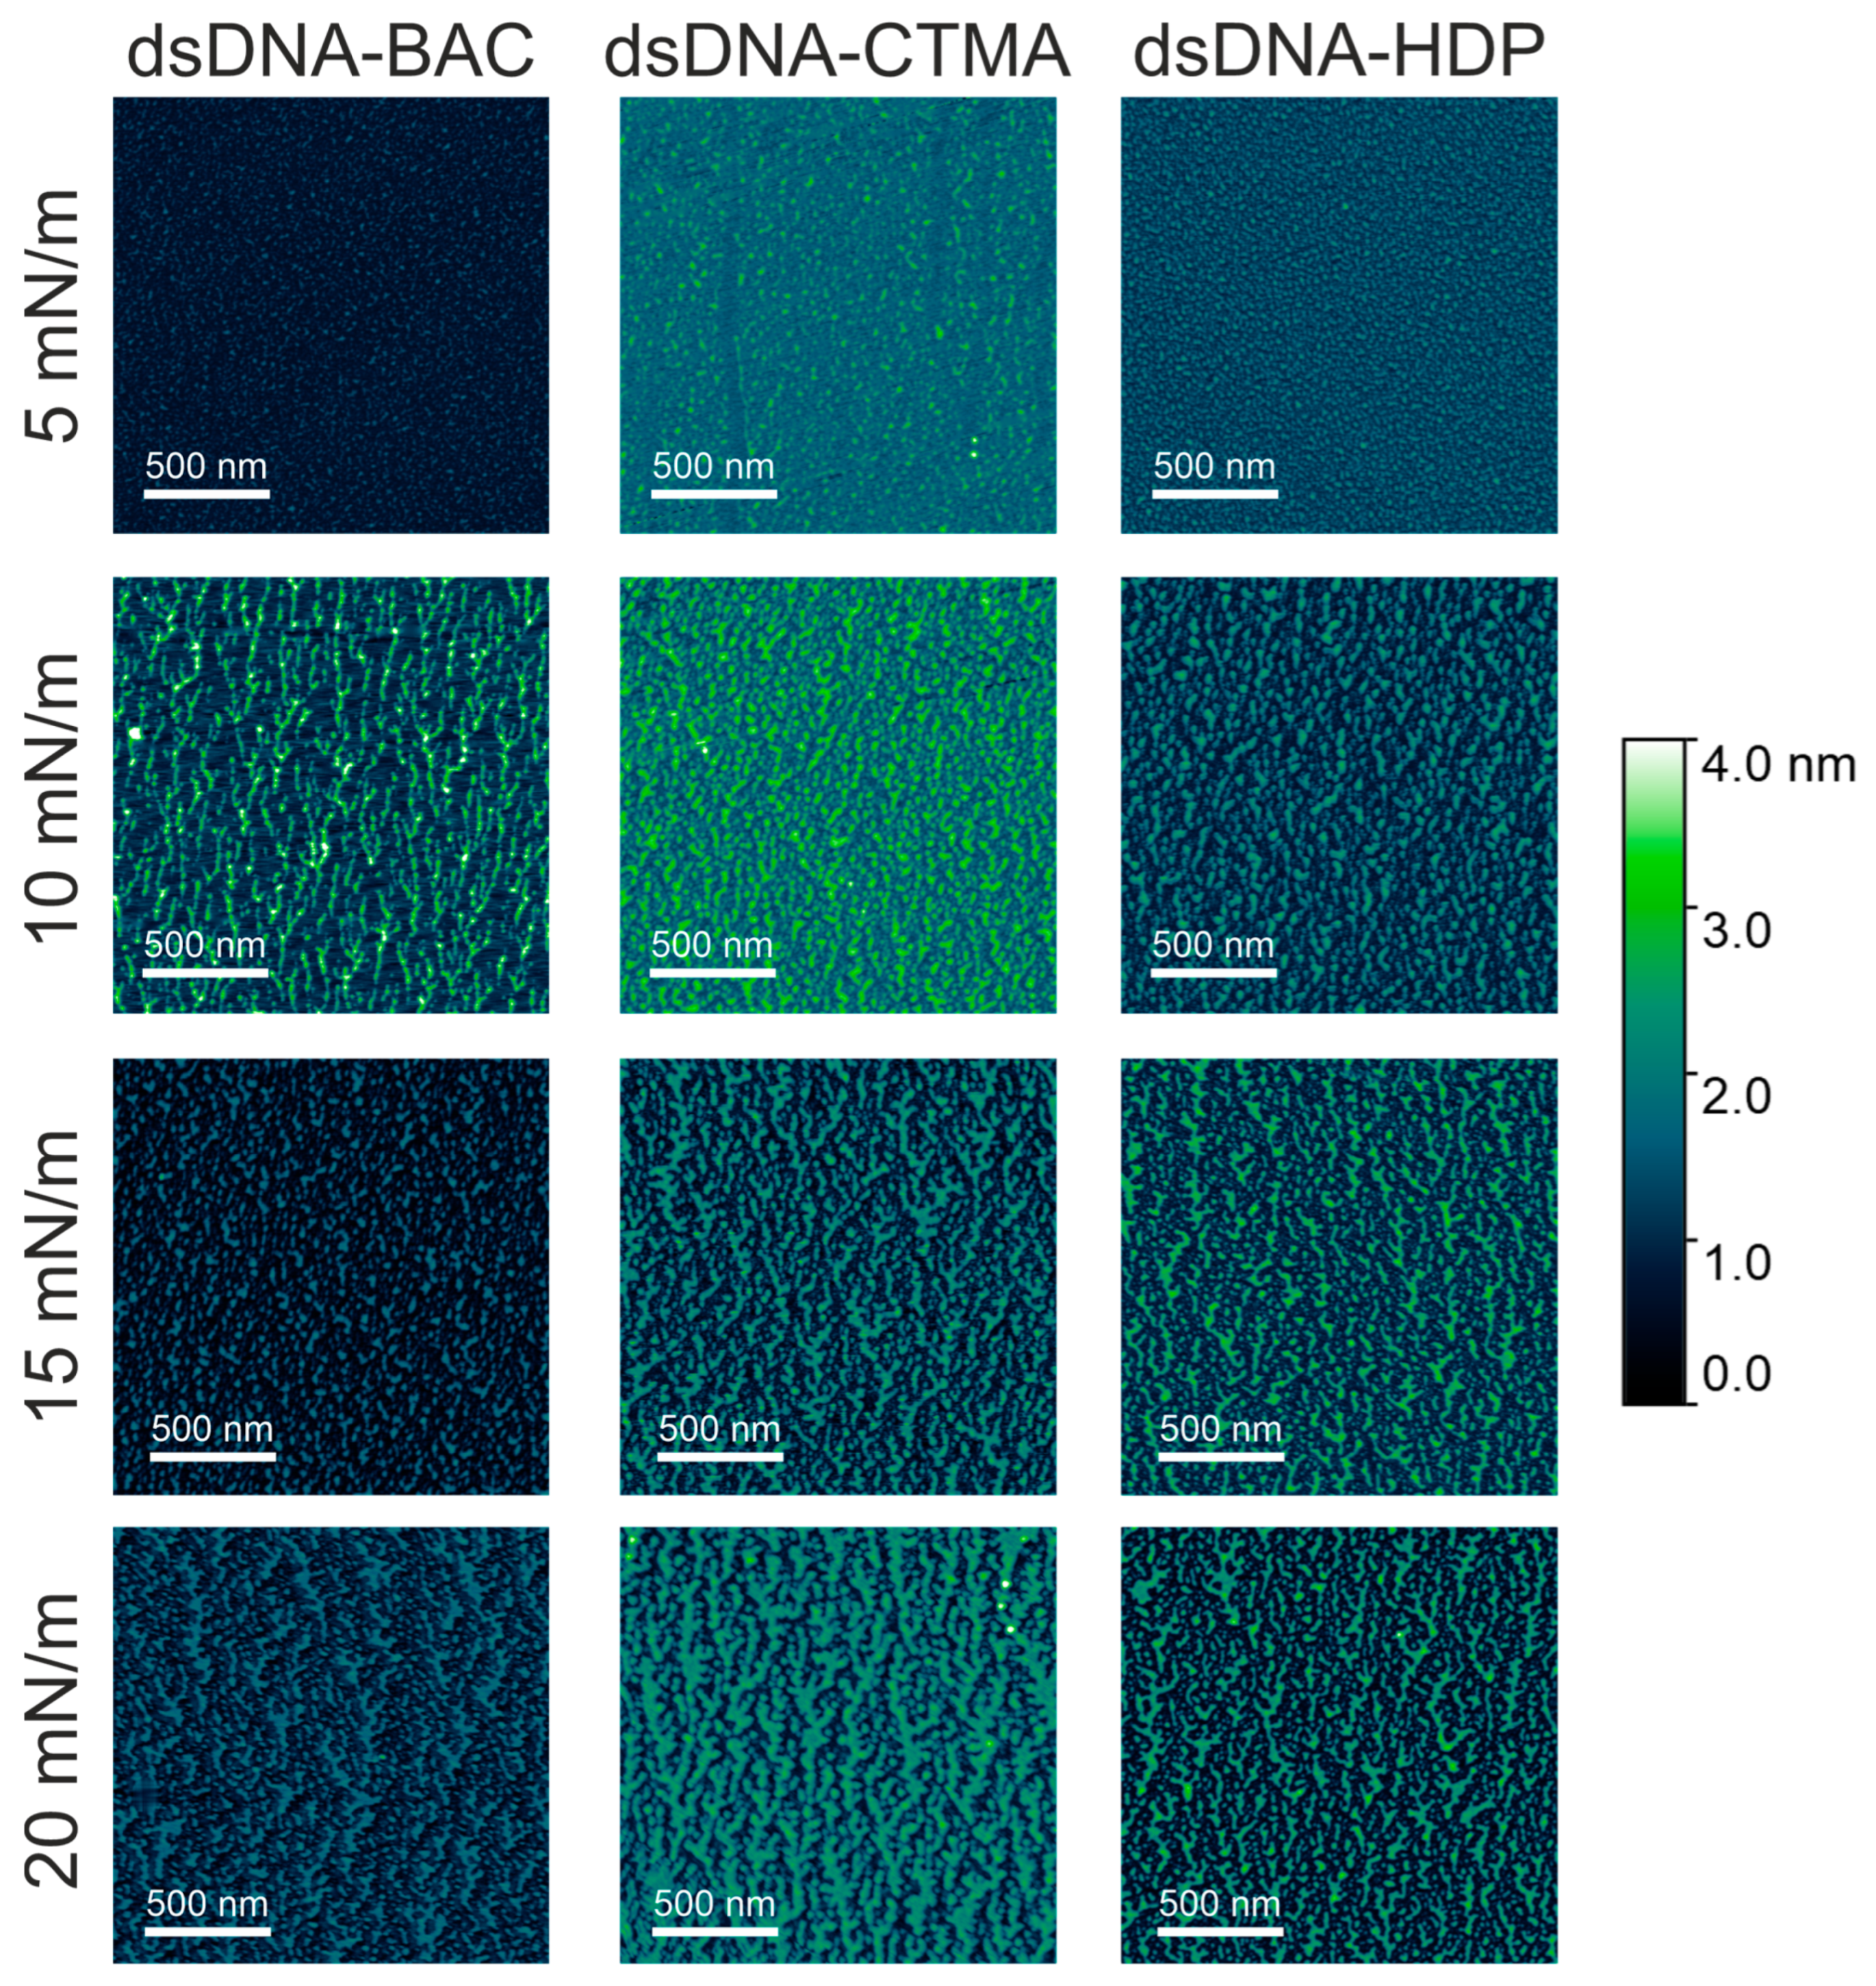
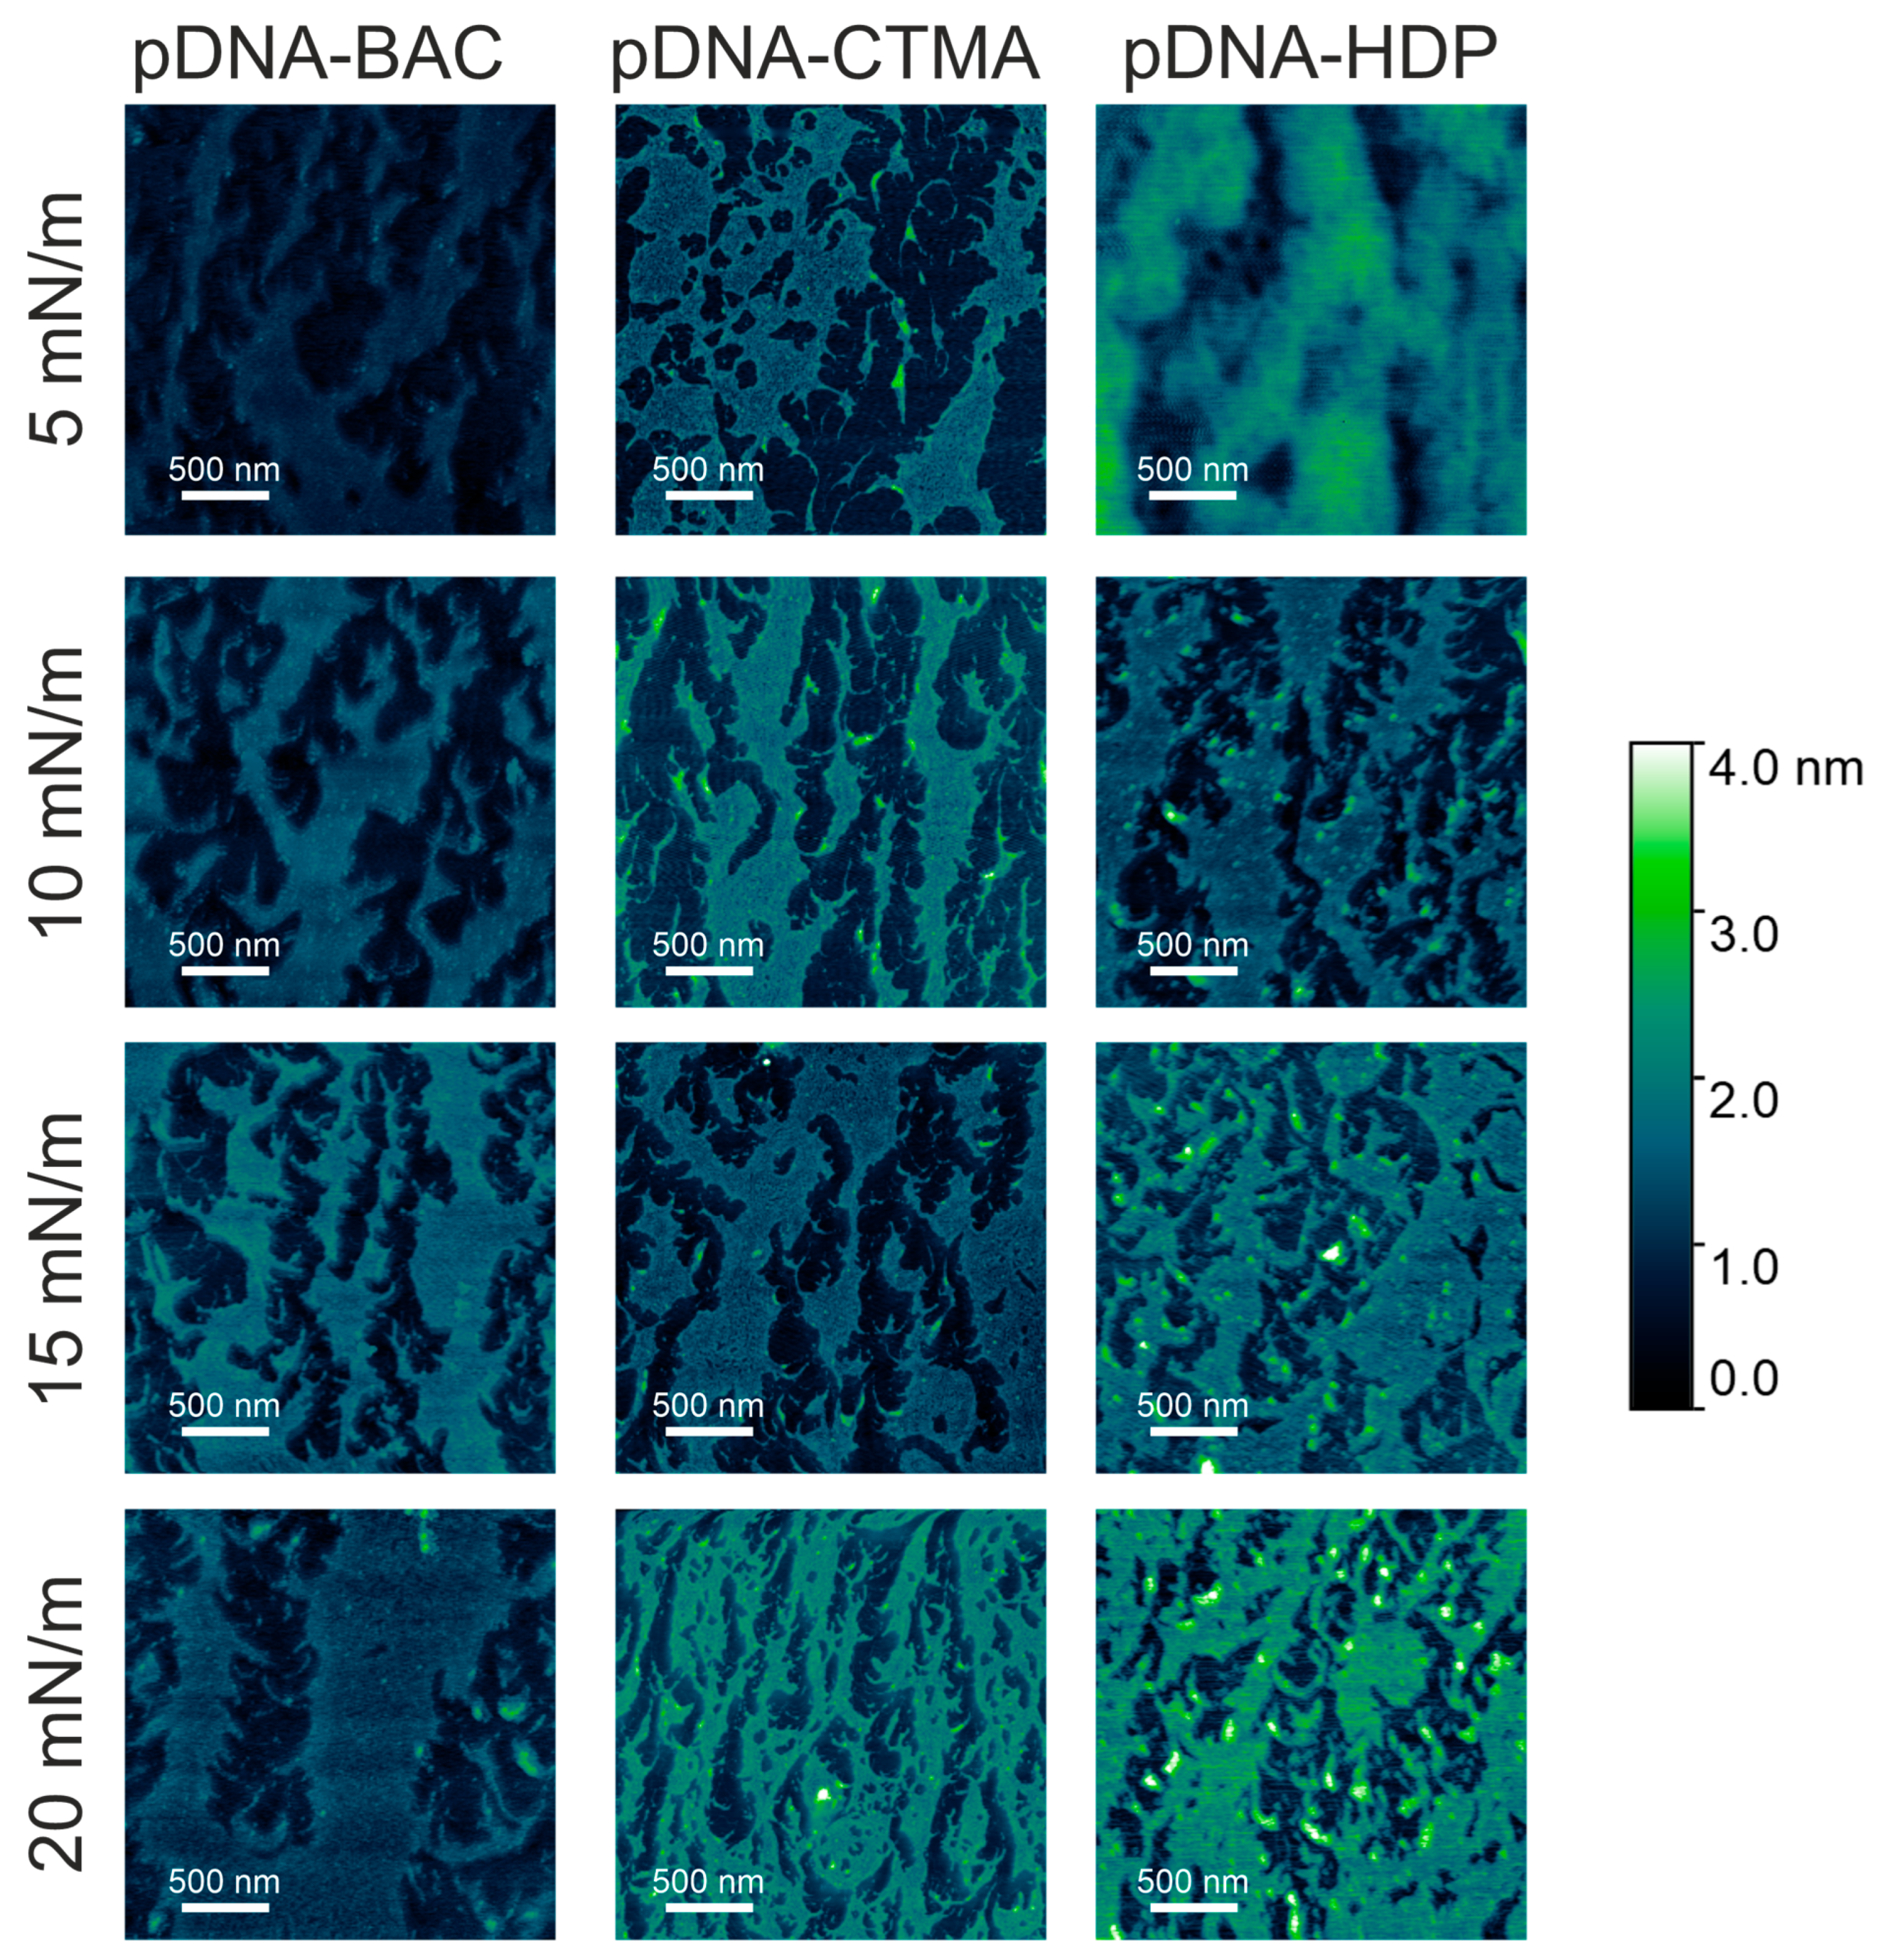
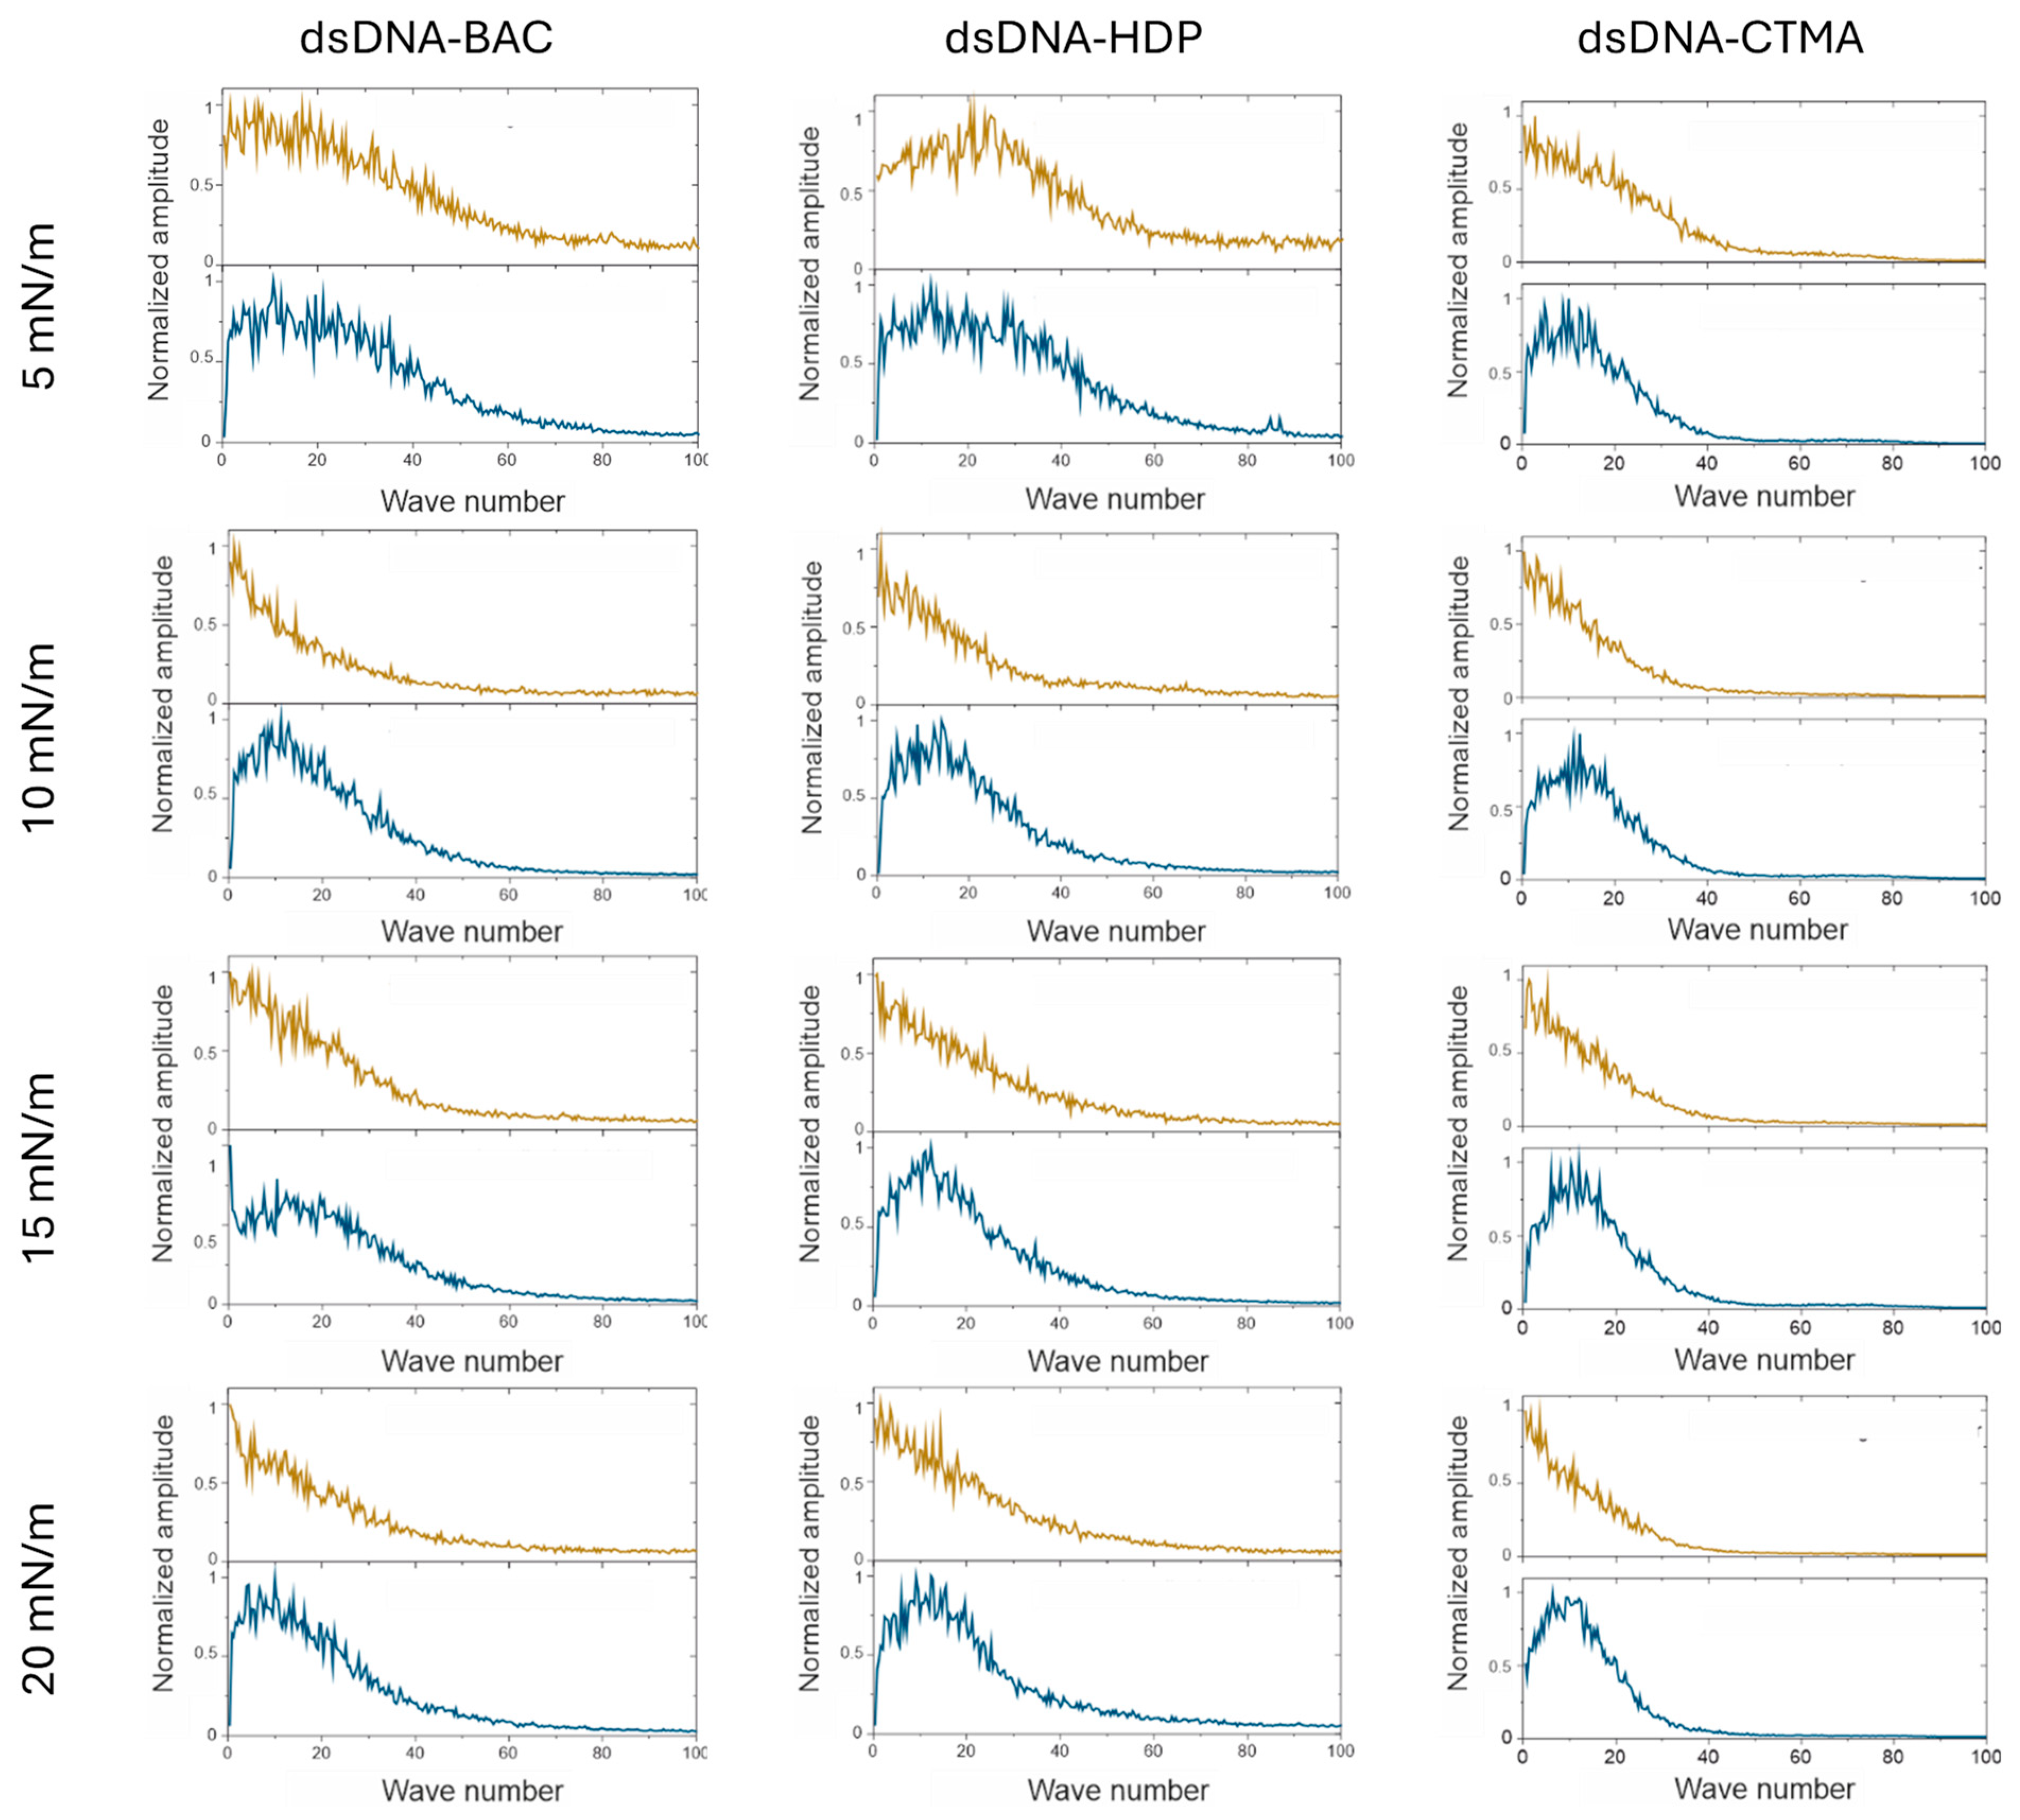
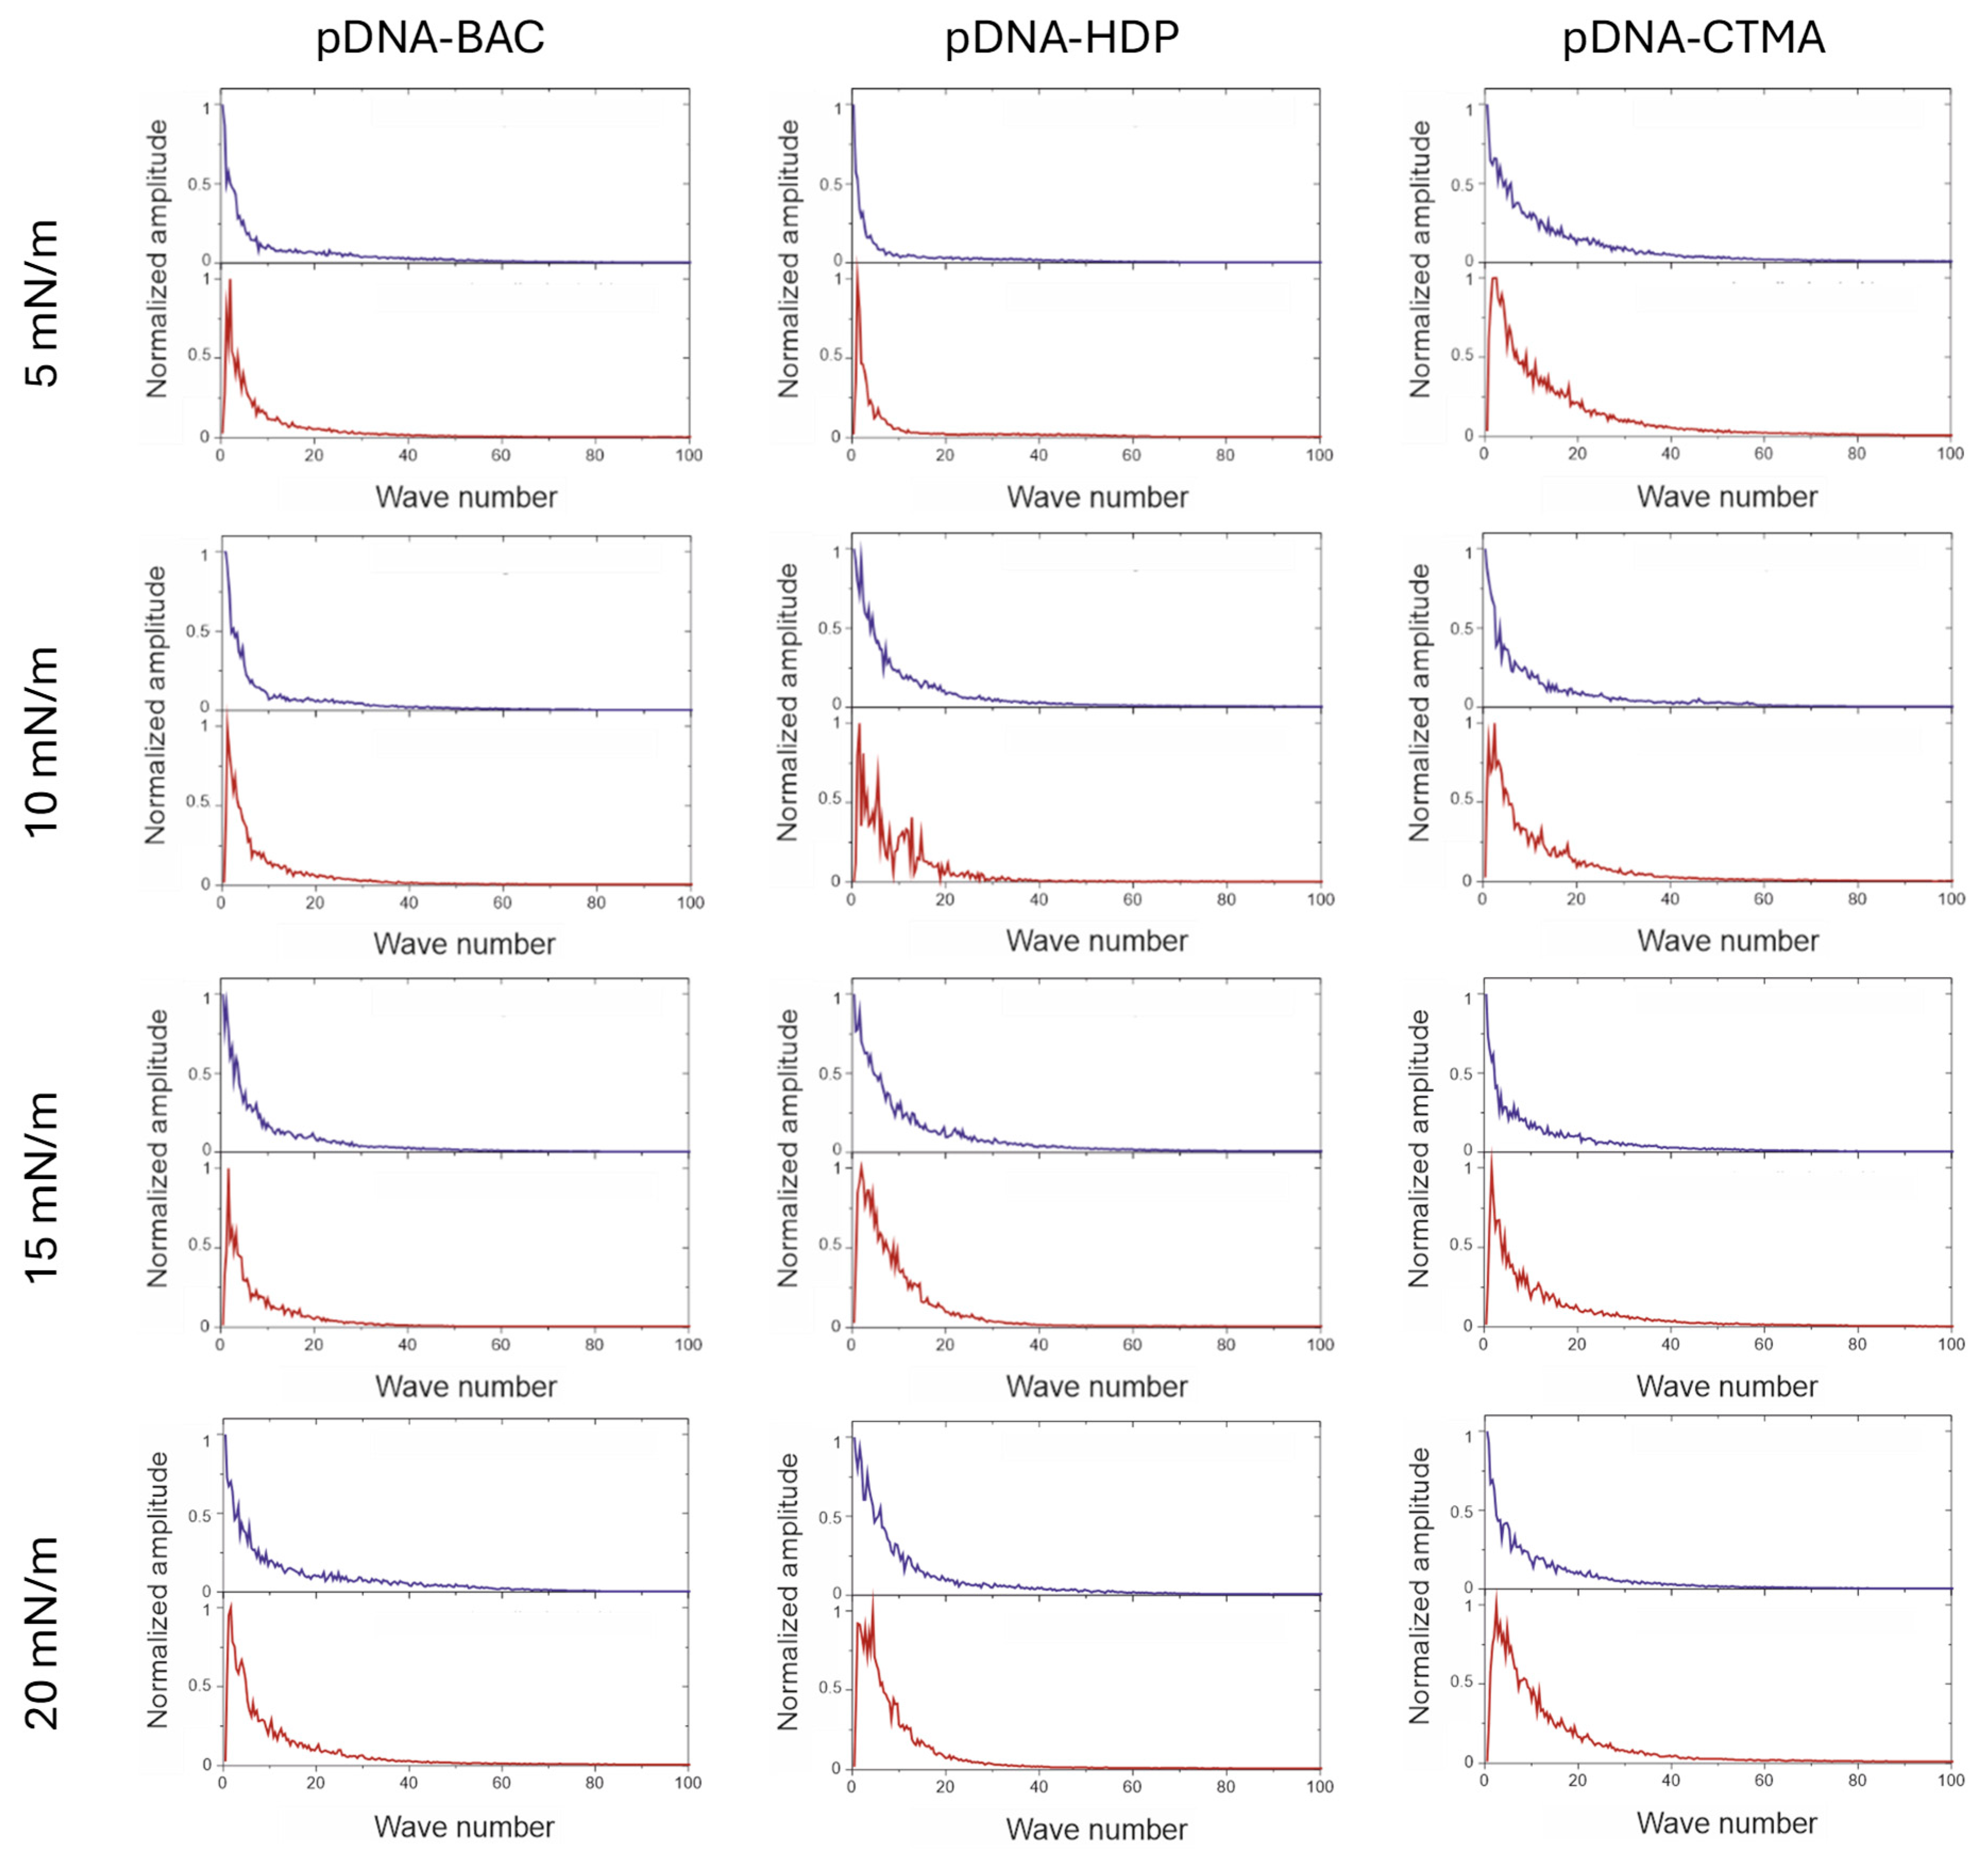
3.2. AFM Imaging and FFT Analysis
4. Conclusions
- DNA–cationic surfactant complexes form monolayers at the liquid–gas interface, which spontaneously self-organise during transfer onto the mica surface under specific boundary conditions (surface pressure 10–20 mN/m, lifting speed 5 mm/min).
- FFT analysis of AFM images confirmed the formation of elongated structures aligned with the lifting direction.
- The type of DNA (linear or plasmid) mainly influences the appearance of surface structures, while the surfactant structure has a much smaller effect.
- The type of DNA does not significantly impact the shape of the isotherm, including the monolayer collapse pressure.
- The type of DNA influences the percentage of surface coverage; for plasmid pDNA-based complexes, the coverage remains nearly constant at approximately 52%, higher than that observed for linear dsDNA-based complexes.
Author Contributions
Funding
Institutional Review Board Statement
Informed Consent Statement
Data Availability Statement
Acknowledgments
Conflicts of Interest
Appendix A
References
- Heckman, E.M.; Hagen, J.A.; Yaney, P.P.; Grote, J.G.; Hopkins, F.K. Processing techniques for deoxyribonucleic acid: Biopolymer for photonics applications. Appl. Phys. Lett. 2005, 87, 211115. [Google Scholar] [CrossRef]
- Steckl, A.J. DNA—A new material for photonics? Nat. Photon. 2007, 1, 3–5. [Google Scholar] [CrossRef]
- Yumusak, C.; Singh, T.B.; Sariciftci, N.S.; Grote, J.G. Bio-organic field transistors based on crosslinked deoxyribonucleic acid (DNA) gate dielectric. Appl. Phys. Lett. 2009, 95, 263304. [Google Scholar] [CrossRef]
- Singh, B.; Saricifti, N.S.; Grote, J.G.; Hopkins, F.K. Bio-organic-semiconductor-field-effect-transistor based on deoxyribonucleic acid gate dielectric. J. Appl. Phys. 2006, 100, 024514. [Google Scholar] [CrossRef]
- Steckl, A.J.; Spaeth, H.; You, H.; Gomez, E.; Grote, J. DNA as an Optical Material. Opt. Photonics News 2011, 22, 34–39. [Google Scholar] [CrossRef]
- Church, G.M.; Gao, Y.; Kosuri, S. Next-Generation Digital Information Storage in DNA. Science 2012, 337, 1628. [Google Scholar] [CrossRef]
- Taluja, S.; Bhupal, J.; Krishnan, S.R. A survey paper on DNA-based data storage. In Proceedings of the 2020 International Conference on Emerging Trends in Information Technology and Engineering (Ic-ETITE), Vellore, India, 24–25 February 2020. [Google Scholar] [CrossRef]
- Hao, Y.; Li, Q.; Fan, C.; Wang, F. Data storage based on DNA. Small Struct. 2021, 2, 2000046. [Google Scholar] [CrossRef]
- Braun, E.; Eichen, Y.; Sivan, U.; Ben-Yoseph, G. DNA-templated assembly and electrode attachment of a conducting silver wire. Nature 1998, 391, 775–778. [Google Scholar] [CrossRef]
- Nithiyanantham, U.; Ramadoss, A.; Ede, S.R.; Kundu, S. DNA mediated wire-like clusters of self-assembled TiO2 nanomaterials: Supercapacitor and dye sensitized solar cell applications. Nanoscale 2014, 6, 8010–8023. [Google Scholar] [CrossRef]
- Rangnekar, A.; LaBean, T.H. Building DNA nanostructures for molecular computation, templated assembly, and biological applications. Acc. Chem. Res. 2014, 47, 1778–1788. [Google Scholar] [CrossRef]
- Manea-Saghin, A.-M.; Marin, C.A.; Padurețu, C.-C.; Kajzar, F. Third-order optical nonlinearity of DNA-CTMA complex doped with different aromatic moieties. Opt. Laser Technol. 2022, 149, 107863. [Google Scholar] [CrossRef]
- Harańczyk, H.; Kobierski, J.; Nizioł, J.; Hebda, E.; Pielichowski, J.; Zalitach, D.; Marzec, M.; El-Ghayoury, A. Mild hydration of didecyldimethylammonium chloride modified DNA by 1H-nuclear magnetic resonance and by sorption isotherm. J. Appl. Phys. 2013, 113, 044702. [Google Scholar] [CrossRef]
- Nizioł, J.; Harańczyk, H.; Kobierski, J.; Hebda, E.; Pielichowski, J.; Ostachowicz, B. Hydration effect on solid DNA-didecyldimethylammonium chloride complexes measured using 1H-nuclear magnetic resonance spectroscopy. J. Appl. Phys. 2013, 114, 144701. [Google Scholar] [CrossRef]
- Liang, L.; Fu, Y.; Wang, D.; Wei, Y.; Kobayashi, N.; Minari, T. DNA as Functional Material in Organic-Based Electronics. Appl. Sci. 2018, 8, 90. [Google Scholar] [CrossRef]
- Wang, L.; Yoshida, J.; Ogata, N.; Sasaki, S.; Kajiyama, T. Self-Assembled Supramolecular Films Derived from Marine Deoxyribonucleic Acid (DNA)−Cationic Surfactant Complexes: Large-Scale Preparation and Optical and Thermal Properties. Chem. Mater. 2001, 13, 1273–1281. [Google Scholar] [CrossRef]
- Mariyappan, K.; Park, S.; Nanda, S.S.; Kokkiligadda, S.; Jo, S.; Lee, J.; Tandon, A.; Yi, D.K.; Park, S.H. Fibres and films made from DNA and CTMA-modified DNA embedded with gold nanorods and organic light-emitting materials. Colloids Surf. B Biointerfaces 2022, 211, 112291. [Google Scholar] [CrossRef]
- Lin, Y.-C.; Hsiao, T.-H.; Li, Y.-L.; Huang, L.-D.; Fruk, L.; Hung, Y.-C. Natural DNA biopolymer synaptic emulator for neuromorphic computing. Org. Electron. 2023, 114, 106745. [Google Scholar] [CrossRef]
- Sun, Q.; Subramanyam, G.; Dai, L.; Check, M.; Campbell, A.; Naik, R.; Grote, J.; Wang, Y. Highly efficient quantum-dot light-emitting diodes with DNA—CTMA as a combined hole-transporting and electron-blocking layer. ACS Nano 2009, 3, 737–743. [Google Scholar] [CrossRef]
- Hagen, J.A.; Li, W.-X.; Spaeth, H.; Grote, J.G.; Steckl, A.J. Molecular beam deposition of DNA nanometer films. Nano Lett. 2007, 7, 133–137. [Google Scholar] [CrossRef]
- Nizioł, J.; Makyła-Juzak, K.; Radko, A.; Ekiert, R.; Zemła, J.; Górska, N.; Chachaj-Brekiesz, A.; Marzec, M.; Harańczyk, H.; Dynarowicz-Latka, P. Linear, self-assembled patterns appearing spontaneously as a result of DNACTMA lipoplex Langmuir-Blodgett deposition on a solid surface. Polymer 2019, 178, 121643. [Google Scholar] [CrossRef]
- Radko, A.; Lalik, S.; Deptuch, A.; Jaworska-Gołąb, T.; Ekiert, R.; Górska, N.; Makyła-Juzak, K.; Nizioł, J.; Marzec, M. Physicochemical characterization of the DNA complexes with different surfactants. Polymer 2021, 235, 124277. [Google Scholar] [CrossRef]
- Radko, A.; Lalik, S.; Górska, N.; Deptuch, A.; Świergiel, J.; Marzec, M. Plasmid DNA Complexes in Powder Form Studied by Spectroscopic and Diffraction Methods. Materials 2024, 17, 3530. [Google Scholar] [CrossRef] [PubMed]
- Radko, A.; Nizioł, J.; Makyła-Juzak, K.; Ekiert, R.; Górska, N.; Górecki, A.; Marzec, M. Properties of DNA-CTMA monolayers obtained by Langmuir-Blodgett technique. Mater. Sci. Eng. B 2021, 263, 114859. [Google Scholar] [CrossRef]
- Postigo, A.; Marcuello, M.; Verstraeten, W.; Sarasa, S.; Walther, T.; Lostao, A.; Göpfrich, K.; del Barrio, J.; Hernández-Ainsa, S. Folding and Functionalizing DNA Origami: A Versatile Approach Using a Reactive Polyamine. J. Am. Chem. Soc. 2025, 147, 3919–3924. [Google Scholar] [CrossRef]
- Kumar, M.; Jha, A.; Mishra, B. DNA-Based Nanostructured Platforms as Drug Delivery Systems. Chem. Bio Eng. 2024, 1, 179–198. [Google Scholar] [CrossRef]
- Douarche, C.; Cortès, R.; Roser, S.J.; Sikorav, J.-L.; Braslau, A. DNA adsorption at liquid/solid interfaces. J. Phys. Chem. B 2008, 112, 13676–13679. [Google Scholar] [CrossRef]
- Dai, S.; Zhang, X.; Du, Z.; Dang, H. Fabrication of nanopatterned DNA films by Langmuir–Blodgett technique. Mater. Lett. 2004, 59, 423–429. [Google Scholar] [CrossRef]

| πcoll [mN/m] | Cs−1 [mN/m] | |
|---|---|---|
| pDNA-CTMA | 22(0.4) | 42(1) |
| pDNA-BAC | 25(0.7) | 52(1) |
| pDNA-HDP | 23(0.7) | 48(2) |
| dsDNA-CTMA | 25(0.2) | 30(1) |
| dsDNA-BAC | 29(0.5) | 36(2) |
| dsDNA-HDP | 26(0.5) | 35(1) |
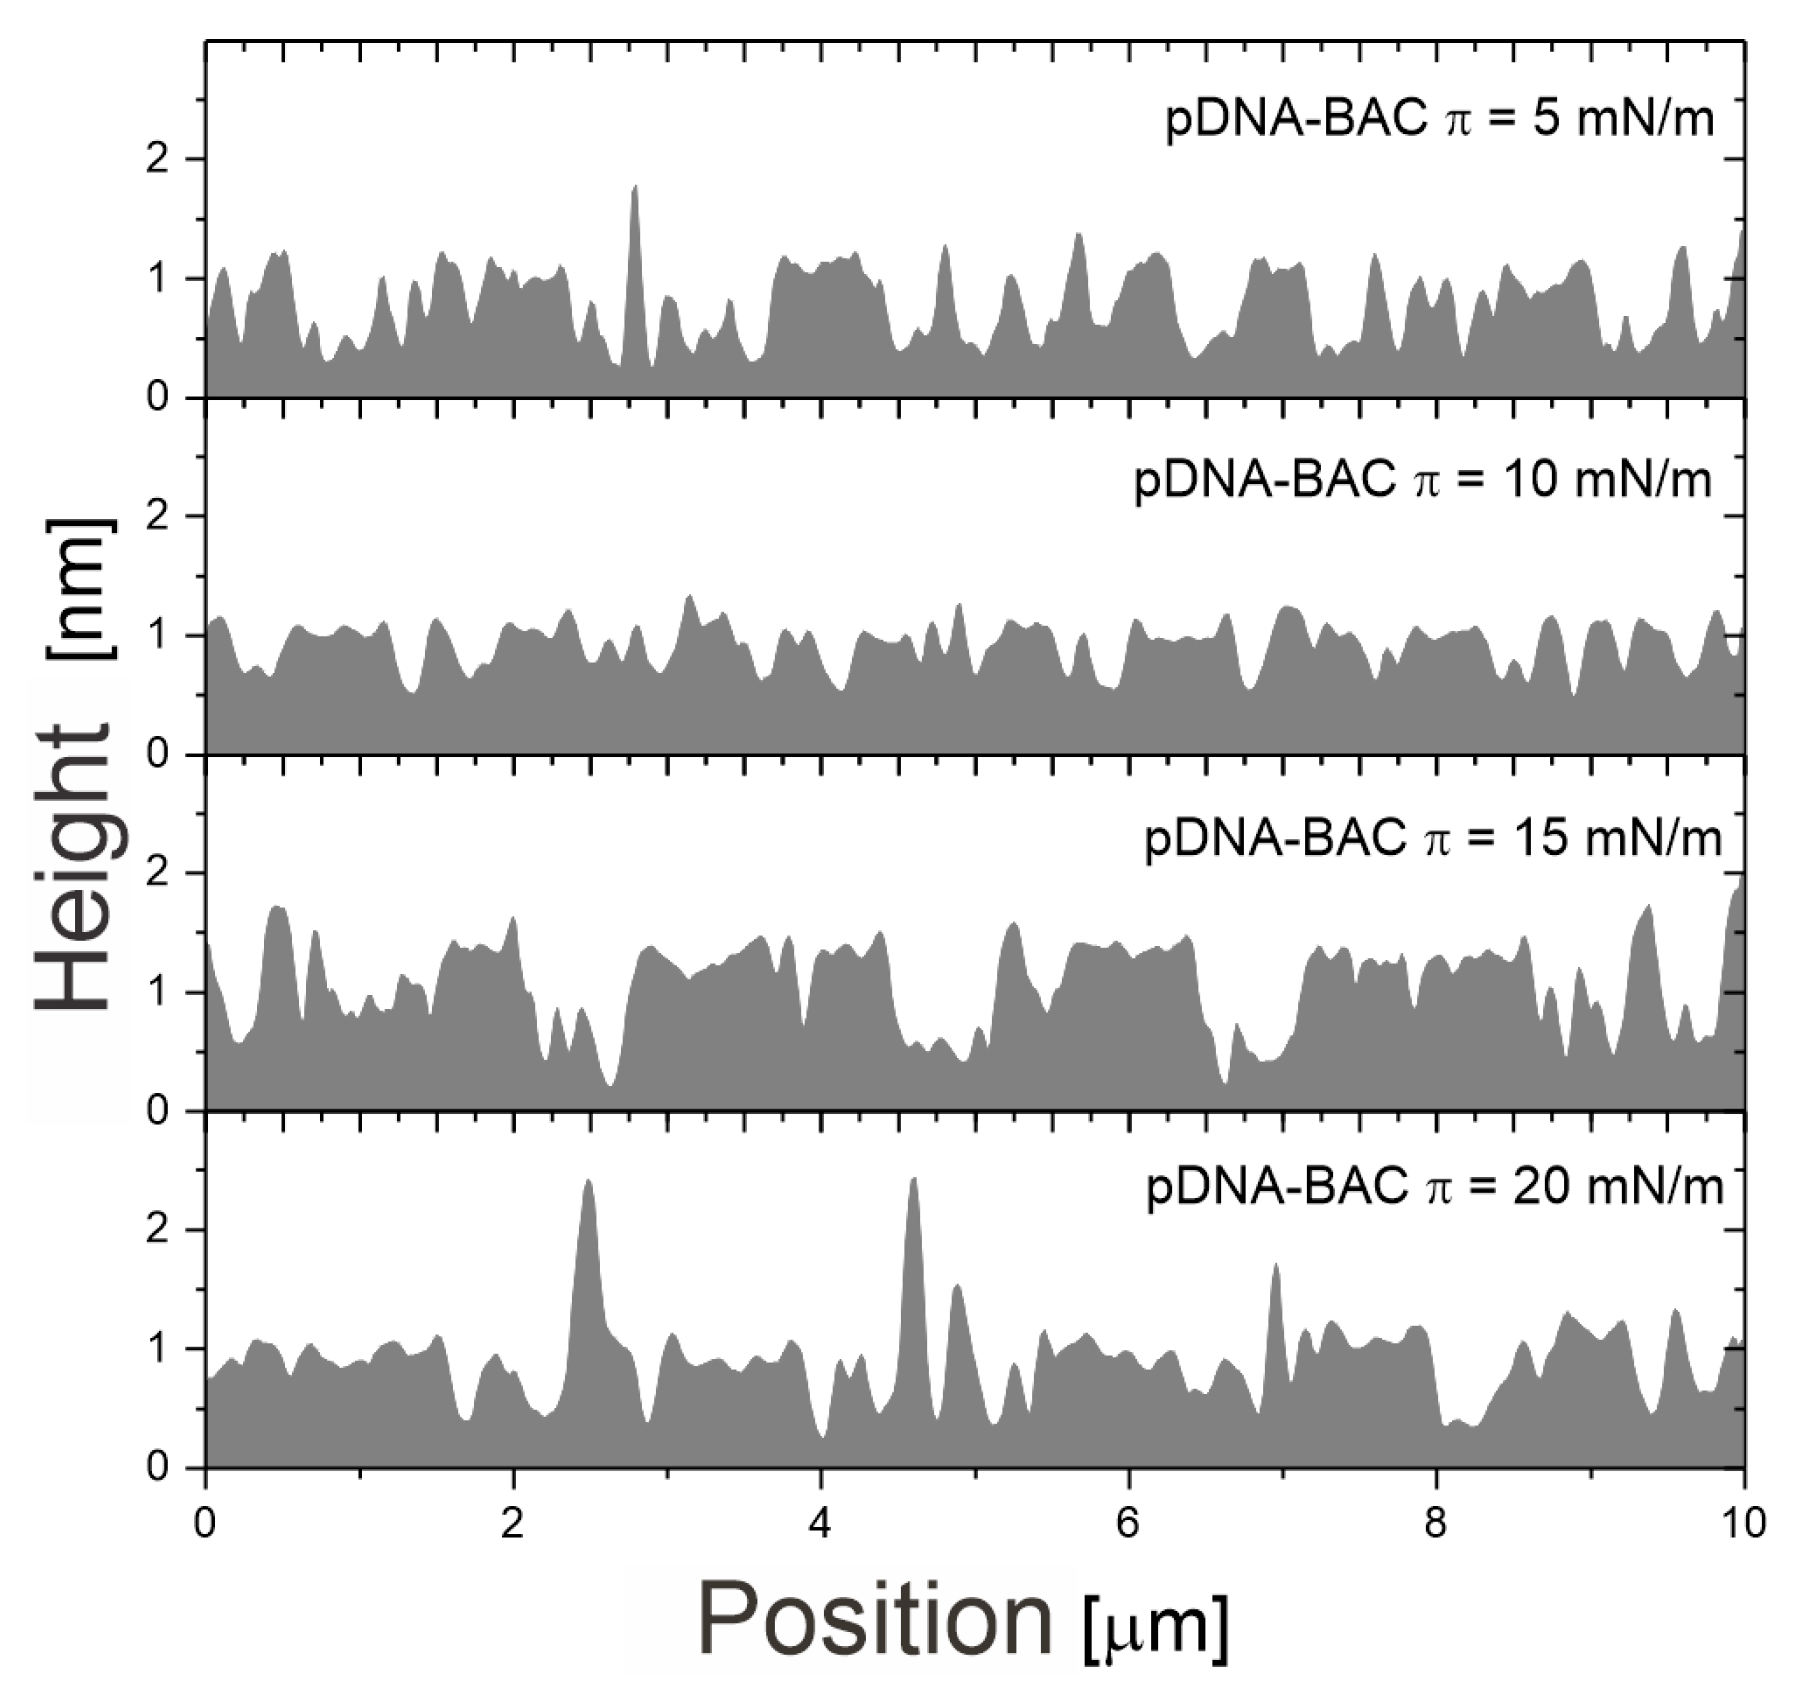
| Surface Pressure [mN/m] | pDNA-CTMA [nm] | pDNA-BAC [nm] | pDNA-HDP [nm] | dsDNA-CTMA [nm] | dsDNA-BAC [nm] | dsDNA-HDP [nm] |
|---|---|---|---|---|---|---|
| 5 | 120(49) | 134(57) | 150(63) | - | - | - |
| 10 | 114(50) | 178(76) | 160(68) | - | - | - |
| 15 | 115(44) | 182(85) | 162(65) | 21(9) | - | - |
| 20 | 122(47) | 195(71) | 159(70) | 38(12) | 23(10) | 26(10) |
Disclaimer/Publisher’s Note: The statements, opinions and data contained in all publications are solely those of the individual author(s) and contributor(s) and not of MDPI and/or the editor(s). MDPI and/or the editor(s) disclaim responsibility for any injury to people or property resulting from any ideas, methods, instructions or products referred to in the content. |
© 2025 by the authors. Licensee MDPI, Basel, Switzerland. This article is an open access article distributed under the terms and conditions of the Creative Commons Attribution (CC BY) license (https://creativecommons.org/licenses/by/4.0/).
Share and Cite
Radko, A.; Makyła-Juzak, K.; Ekiert, R.; Chudzik, J.; Sokołowska, D.; Lalik, S.; Marzec, M. DNA Type Influence on Properties of Thin Layer of DNA Complexes. Materials 2025, 18, 3022. https://doi.org/10.3390/ma18133022
Radko A, Makyła-Juzak K, Ekiert R, Chudzik J, Sokołowska D, Lalik S, Marzec M. DNA Type Influence on Properties of Thin Layer of DNA Complexes. Materials. 2025; 18(13):3022. https://doi.org/10.3390/ma18133022
Chicago/Turabian StyleRadko, Aleksandra, Katarzyna Makyła-Juzak, Robert Ekiert, Julia Chudzik, Dagmara Sokołowska, Sebastian Lalik, and Monika Marzec. 2025. "DNA Type Influence on Properties of Thin Layer of DNA Complexes" Materials 18, no. 13: 3022. https://doi.org/10.3390/ma18133022
APA StyleRadko, A., Makyła-Juzak, K., Ekiert, R., Chudzik, J., Sokołowska, D., Lalik, S., & Marzec, M. (2025). DNA Type Influence on Properties of Thin Layer of DNA Complexes. Materials, 18(13), 3022. https://doi.org/10.3390/ma18133022