
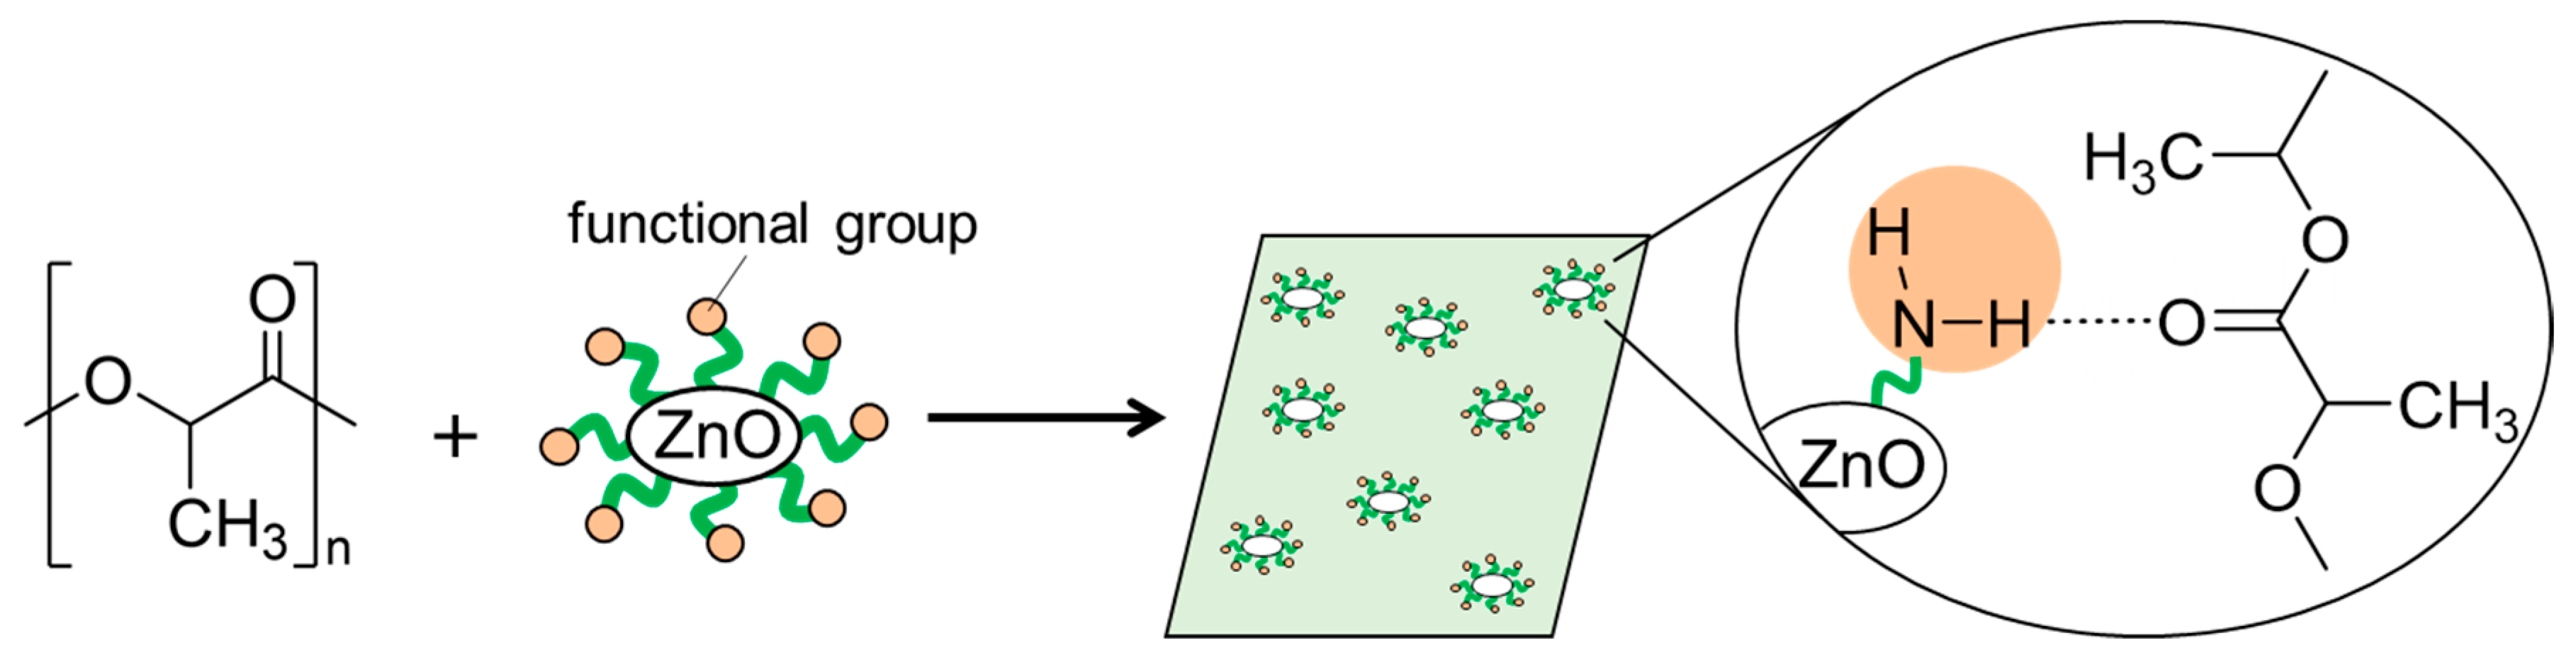
Preparation of Particle-Reinforced Resin Using Highly Functional ZnO Particle Filler Driven by Supramolecular Interactions


Abstract
1. Introduction
2. Materials and Methods
2.1. Reagents
2.2. Syntheses of Surface-Modified ZnONPs
2.3. Structural Analysis of ZnONP Samples
2.4. Evaluations of Surface Modification
2.5. Preparations of PLA Composite Films
2.6. Tensile Testing of Films
2.7. Evaluations of Films Based on FT-IR Measurements
2.8. Water Repellency Test for Films
2.9. Analyses for Particle Distribution in the Composite Film
3. Results and Discussion
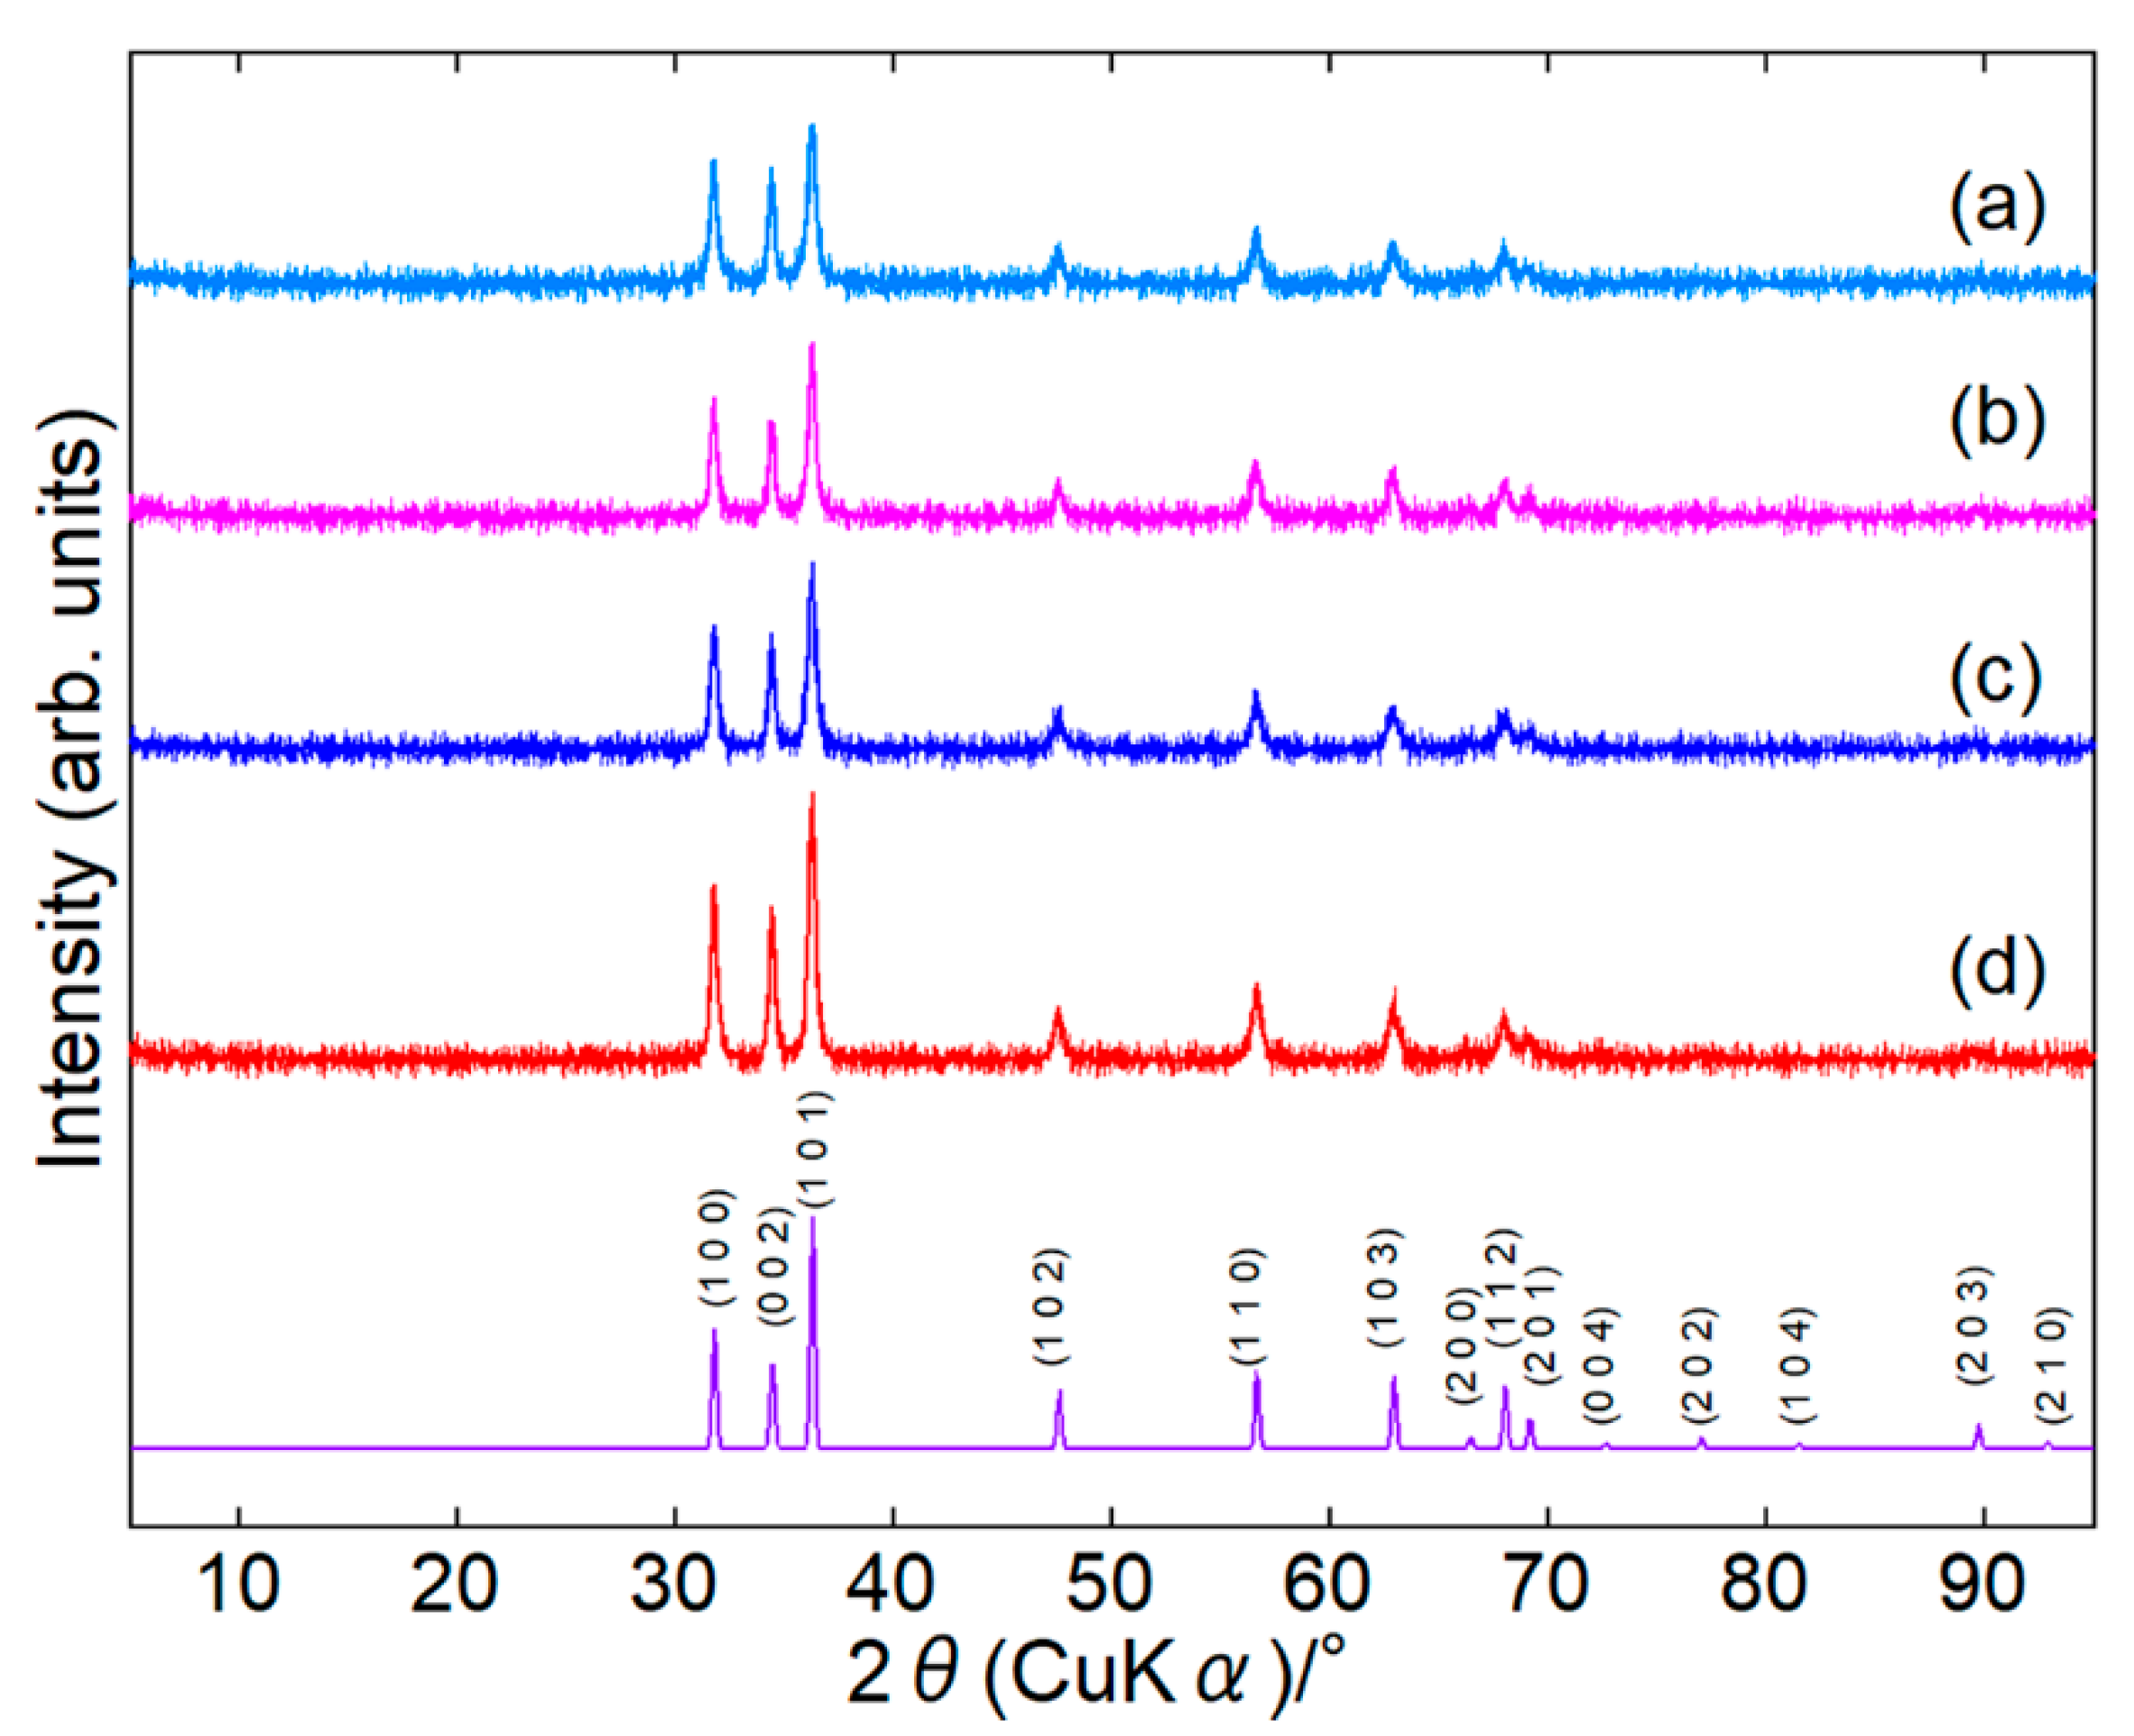
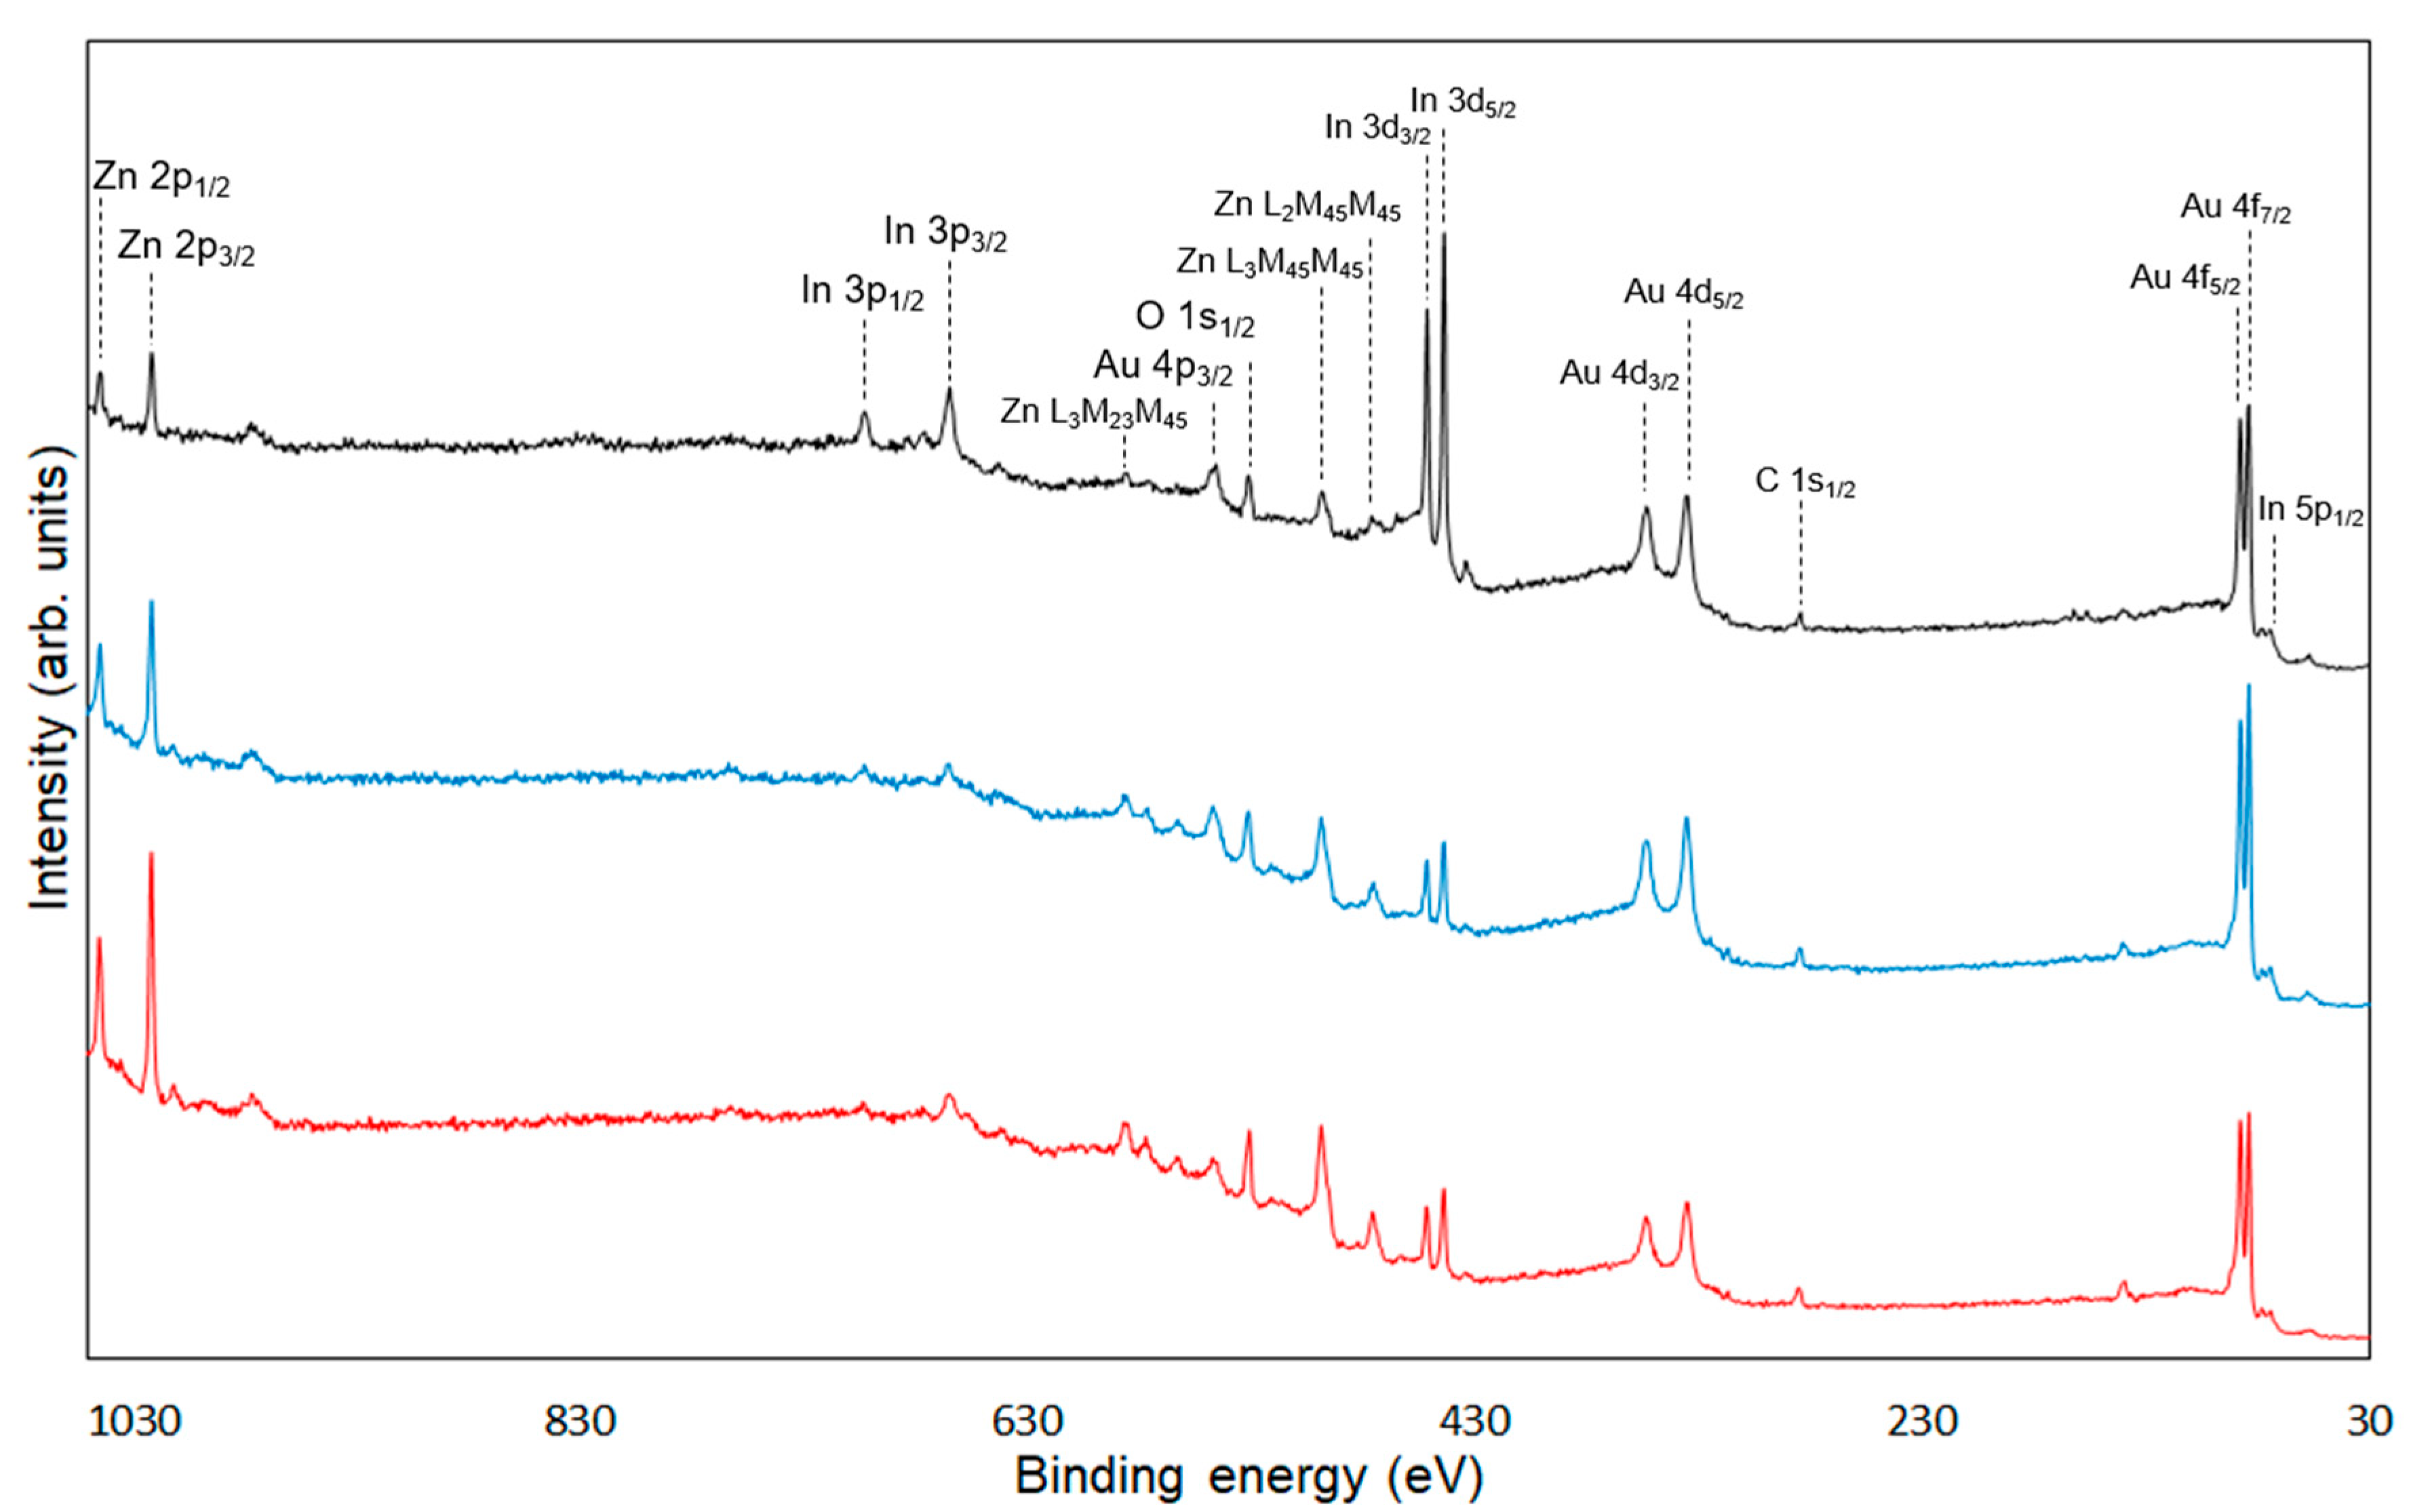
3.1. Structural Analyses of Products
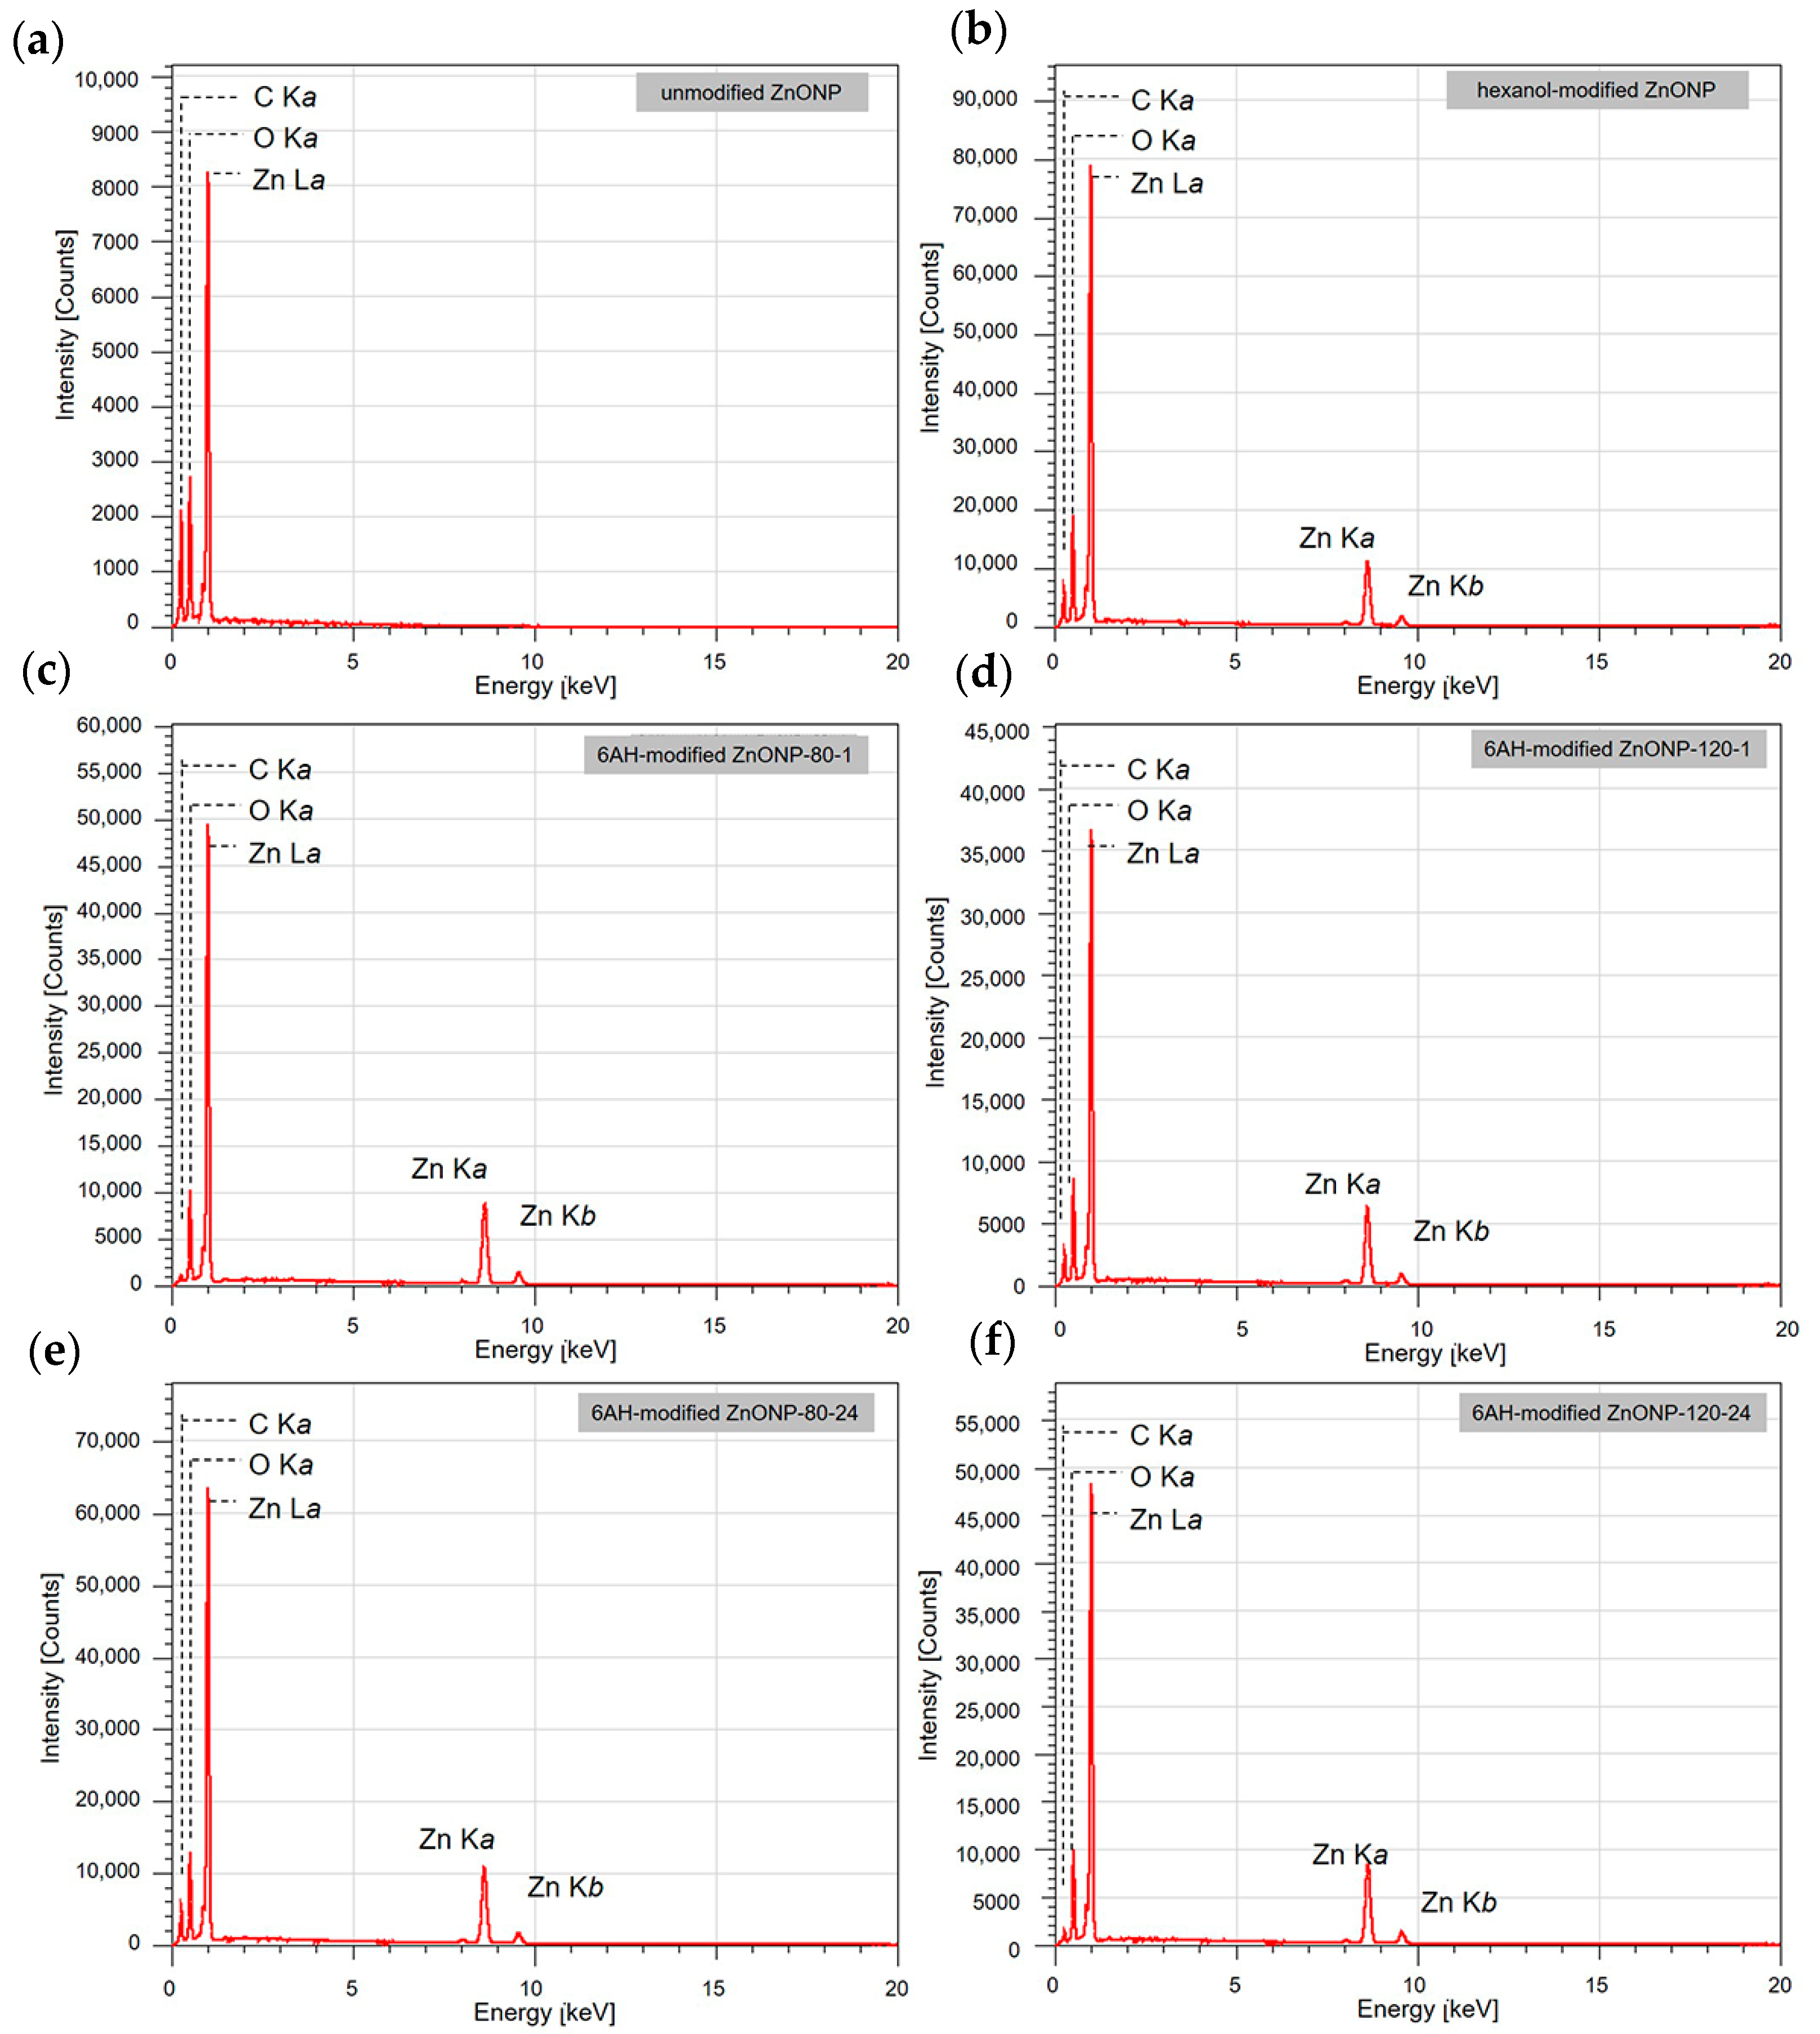
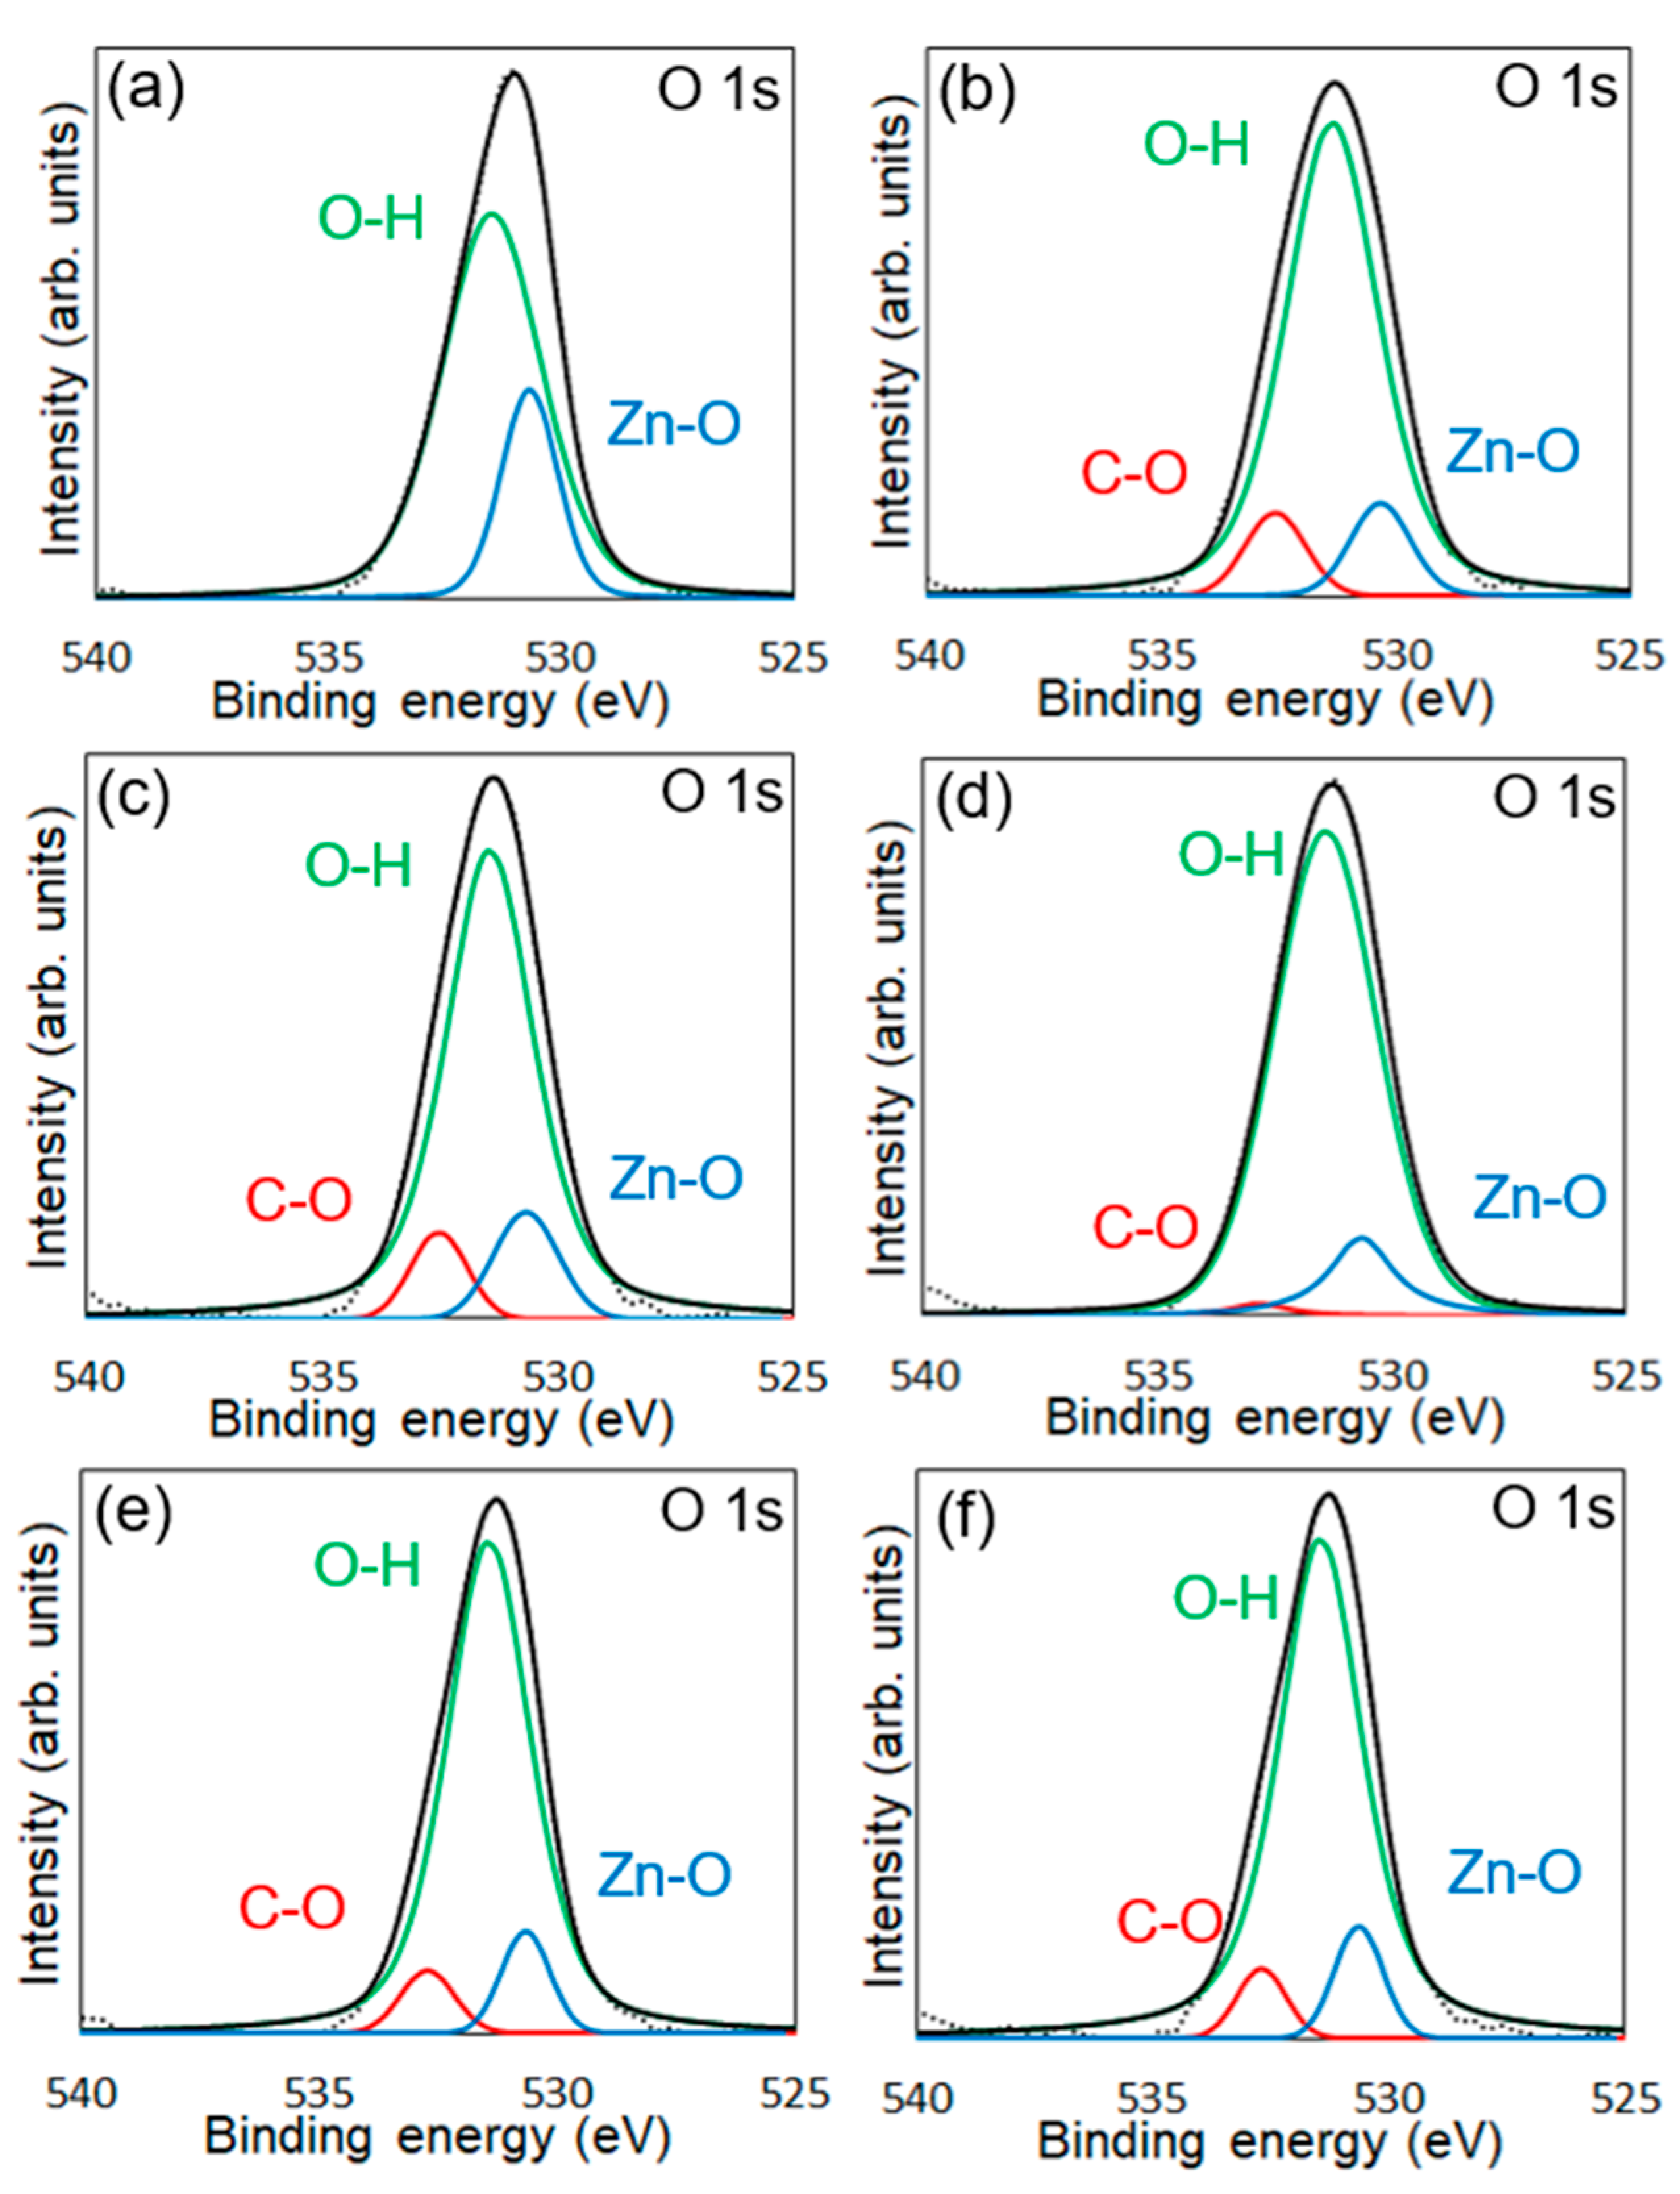
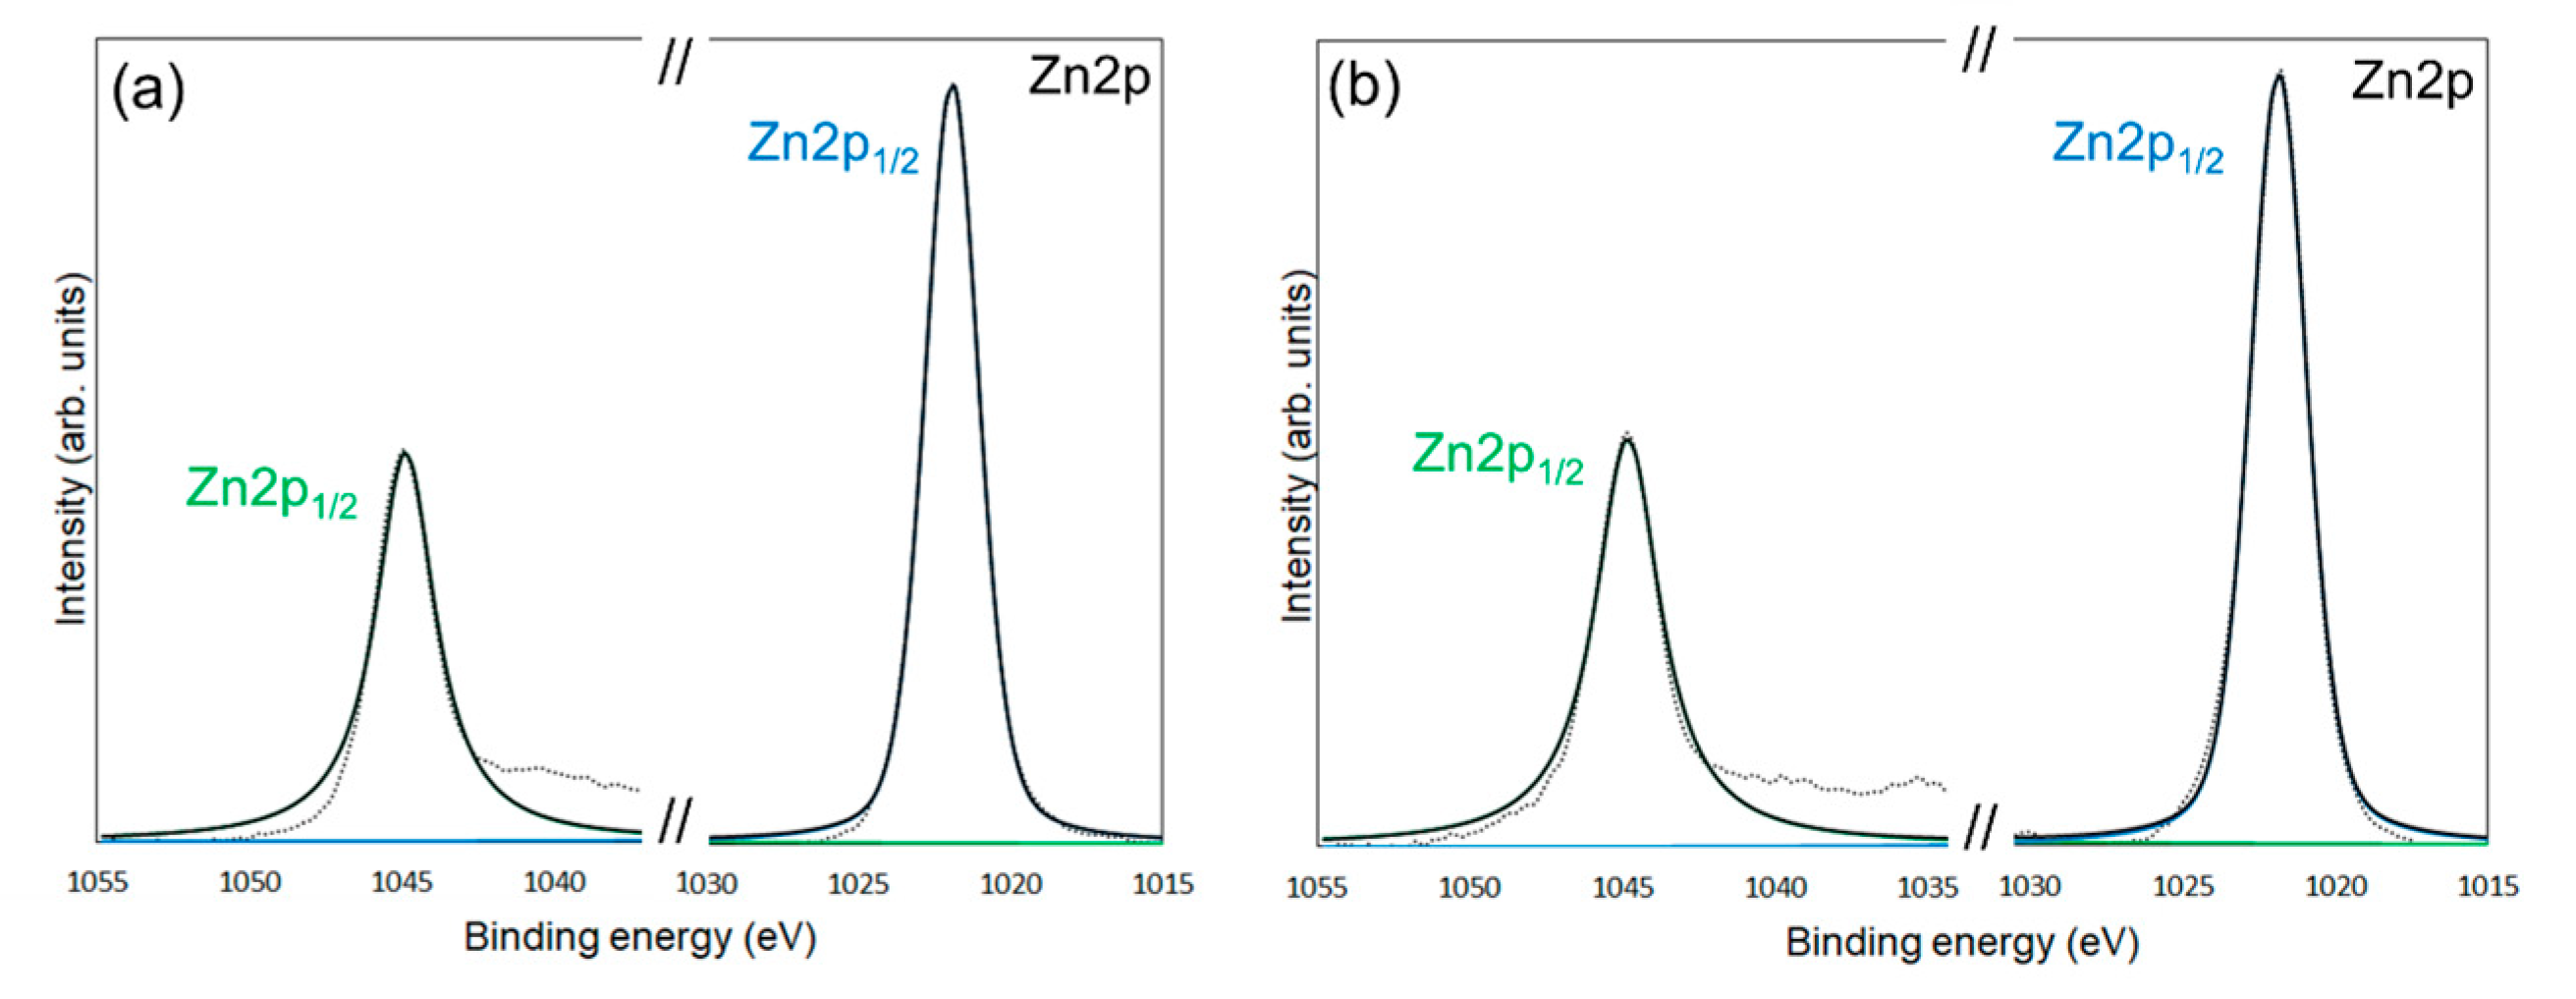
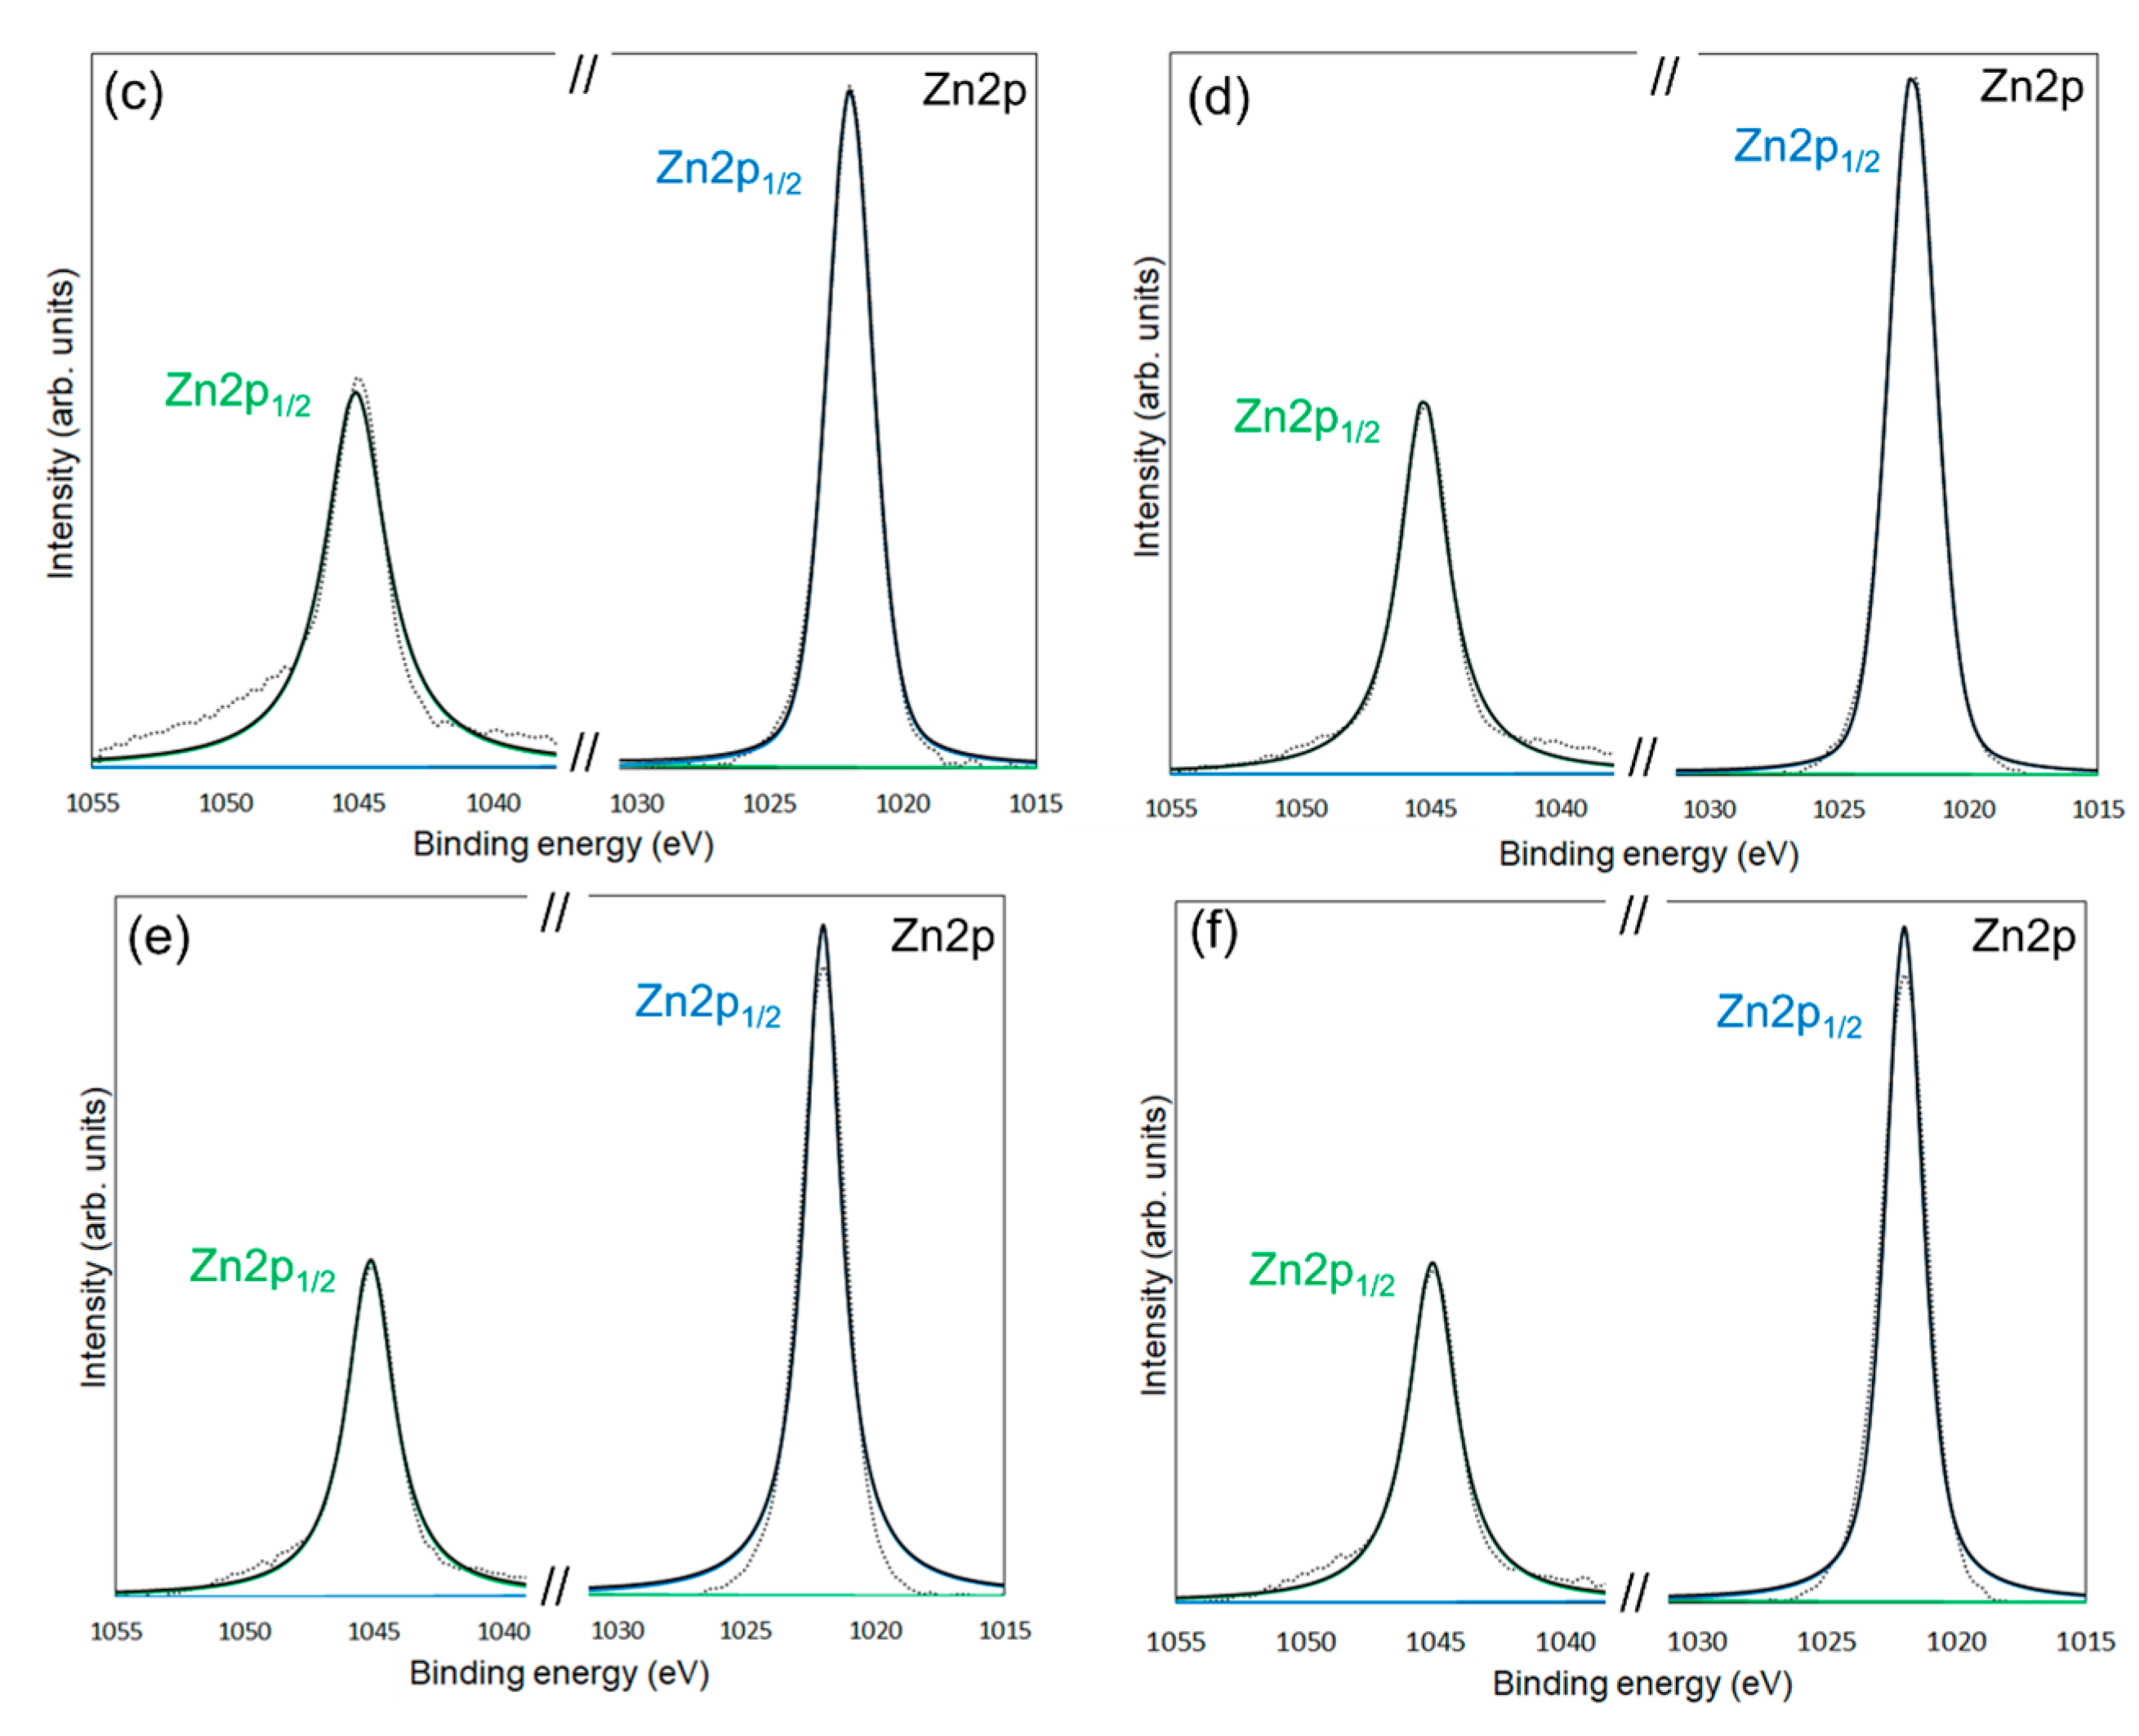
3.2. Evaluations of Surface Modification
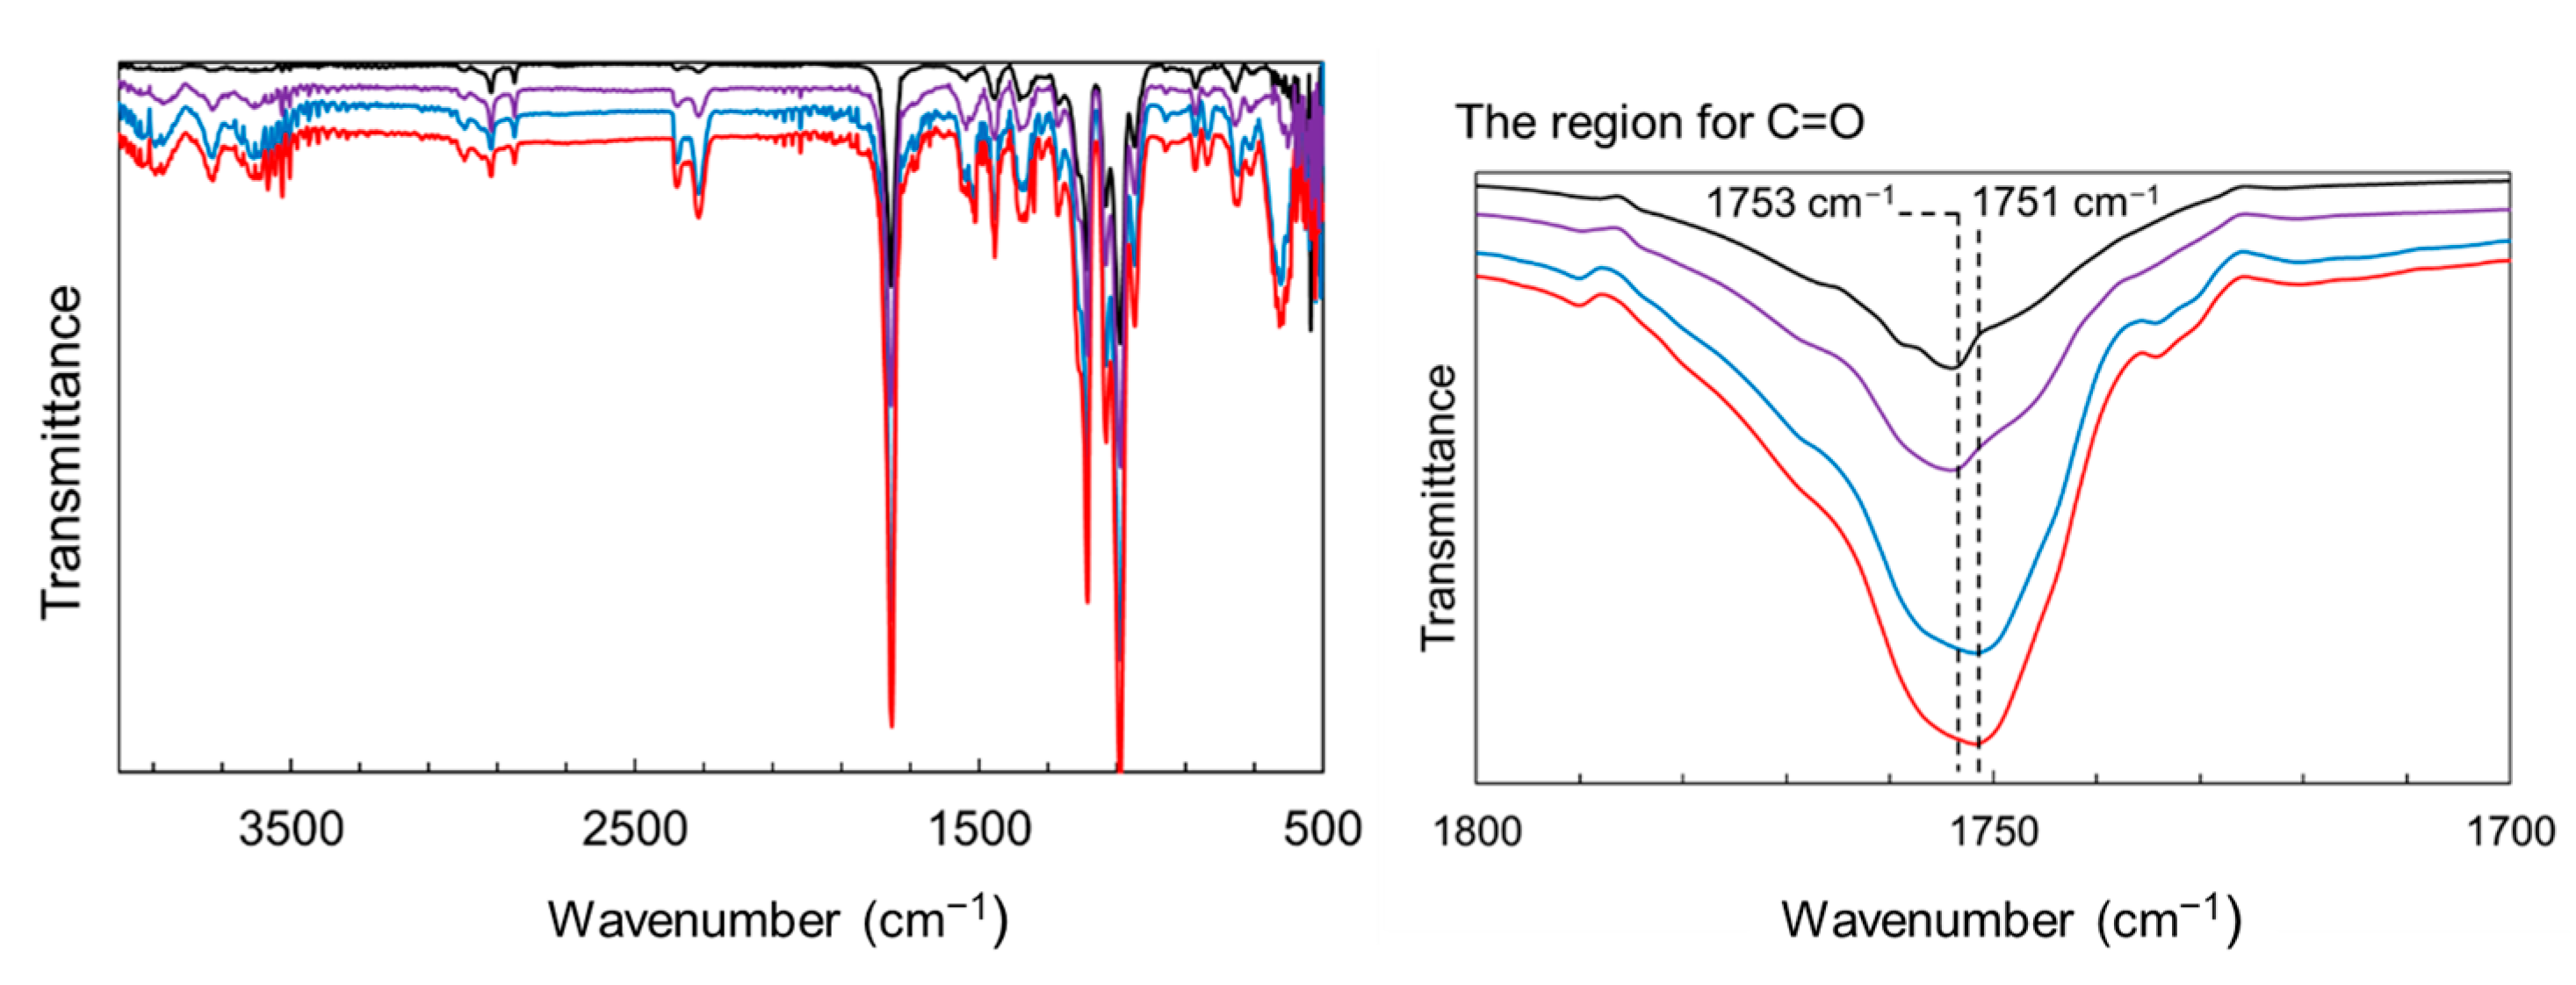
3.3. Functional Evaluations of Composite Films
4. Conclusions
Supplementary Materials
Author Contributions
Funding
Institutional Review Board Statement
Informed Consent Statement
Data Availability Statement
Acknowledgments
Conflicts of Interest
References
- Schilling, K.; Bradford, B.; Castelli, D.; Dufour, E.; Nash, J.F.; Pape, W.; Schulte, S.; Tooley, I.; van den Boschi, J.; Schellauf, F. Human safety review of “nano” titanium dioxide and zinc oxide. Photochem. Photobiol. Sci. 2010, 9, 495–509. [Google Scholar] [CrossRef] [PubMed]
- Falcaro, P.; Ricco, R.; Yazdi, A.; Imaz, I.; Furukawa, S.; Maspoch, D.; Ameloot, R.; Evans, J.D.; Doonan, C.J. Application of metal and metal oxide nanoparticles@MOFs. Coord. Chem. Rev. 2016, 307, 237–254. [Google Scholar] [CrossRef]
- Chavali, M.S.; Nikolova, M.P. Metal oxide nanoparticles and their applications in nanotechnology. Appl. Sci. 2019, 1, 607. [Google Scholar] [CrossRef]
- Shang, G.; Tang, L.; Wu, G.; Yuan, S.; Jia, M.; Guo, X.; Zheng, X.; Wang, W.; Yue, B.; Teng, K.S. High-Performance NiO/TiO2/ZnO Photovoltaic UV Detector. Sensors 2023, 23, 2741. [Google Scholar] [CrossRef] [PubMed]
- Song, Z.; Kelf, T.A.; Sanchez, W.H.; Roberts, M.S.; Ricka, J.; Frenz, M.; Zvyagin, A.V. Characterization of optical properties of ZnO nanoparticles for quantitative imaging of transdermal transport. Biomed. Opt. Express 2011, 2, 3321–3333. [Google Scholar] [CrossRef]
- Singh, S.; Gade, J.V.; Verma, D.K.; Elyor, B.; Jain, B. Exploring ZnO nanoparticles: UV–visible analysis and different size estimation methods. Opt. Mater. 2024, 152, 115422. [Google Scholar] [CrossRef]
- Tang, E.; Cheng, G.; Ma, X.; Pang, X.; Zhao, Q. Surface modification of zinc oxide nanoparticle by PMAA and its dispersion in aqueous system. Appl. Surf. Sci. 2006, 252, 5227–5232. [Google Scholar] [CrossRef]
- Zhao, L.-H.; Zhang, R.; Zhang, J.; Sun, S.-Q. Synthesis and characterization of biocompatible ZnO nanoparticles. CrystEngComm 2012, 14, 945. [Google Scholar] [CrossRef]
- Liu, J.-H.; Ma, X.; Xu, Y.; Tang, H.; Yang, S.-T.; Yang, Y.-F.; Kang, D.-D.; Wang, H.; Liu, Y. Low toxicity and accumulation of zinc oxide nanoparticles in mice after 270-day consecutive dietary supplementation. Toxicol. Res. 2017, 6, 134–143. [Google Scholar] [CrossRef]
- Zhang, Z.-Y.; Xiong, H.-M. Photoluminescent ZnO Nanoparticles and Their Biological Applications. Materials 2015, 8, 3101–3127. [Google Scholar] [CrossRef]
- Raha, S.; Ahmaruzzaman, M. ZnO nanostructured materials and their potential applications: Progress, challenges and perspectives. Nanoscale Adv. 2022, 4, 1868–1925. [Google Scholar] [CrossRef] [PubMed]
- Yuan, Q.; Hein, S.; Misara, R.D.K. New generation of chitosan-encapsulated ZnO quantum dots loaded with drug: Synthesis, characterization and in vitro drug delivery response. Acta Biomater. 2010, 6, 2732–2739. [Google Scholar] [CrossRef] [PubMed]
- Nie, L.; Gao, L.; Feng, P.; Zhang, J.; Fu, X.; Liu, Y.; Yan, X.; Wang, T. Three-Dimensional Functionalized Tetrapod-like ZnO Nanostructures for Plasmid DNA Delivery. Small 2006, 2, 621–625. [Google Scholar] [CrossRef] [PubMed]
- Zhang, P.; Liu, W. ZnO QD@PMAA-co-PDMAEMA nonviral vector for plasmid DNA delivery and bioimaging. Biomaterials 2010, 31, 3087–3094. [Google Scholar] [CrossRef]
- Zhu, P.; Weng, Z.; Li, X.; Liu, X.; Wu, S.; Yeung, K.W.K.; Wang, X.; Cui, Z.; Yang, X.; Chu, P.K. Biomedical Applications of Functionalized ZnO Nanomaterials: From Biosensors to Bioimaging. Adv. Mater. Interfaces 2016, 3, 1500494. [Google Scholar] [CrossRef]
- Mahajan, M.; Kaur, R.; Gaur, J.; Kumar, S.; Kaushal, S.; Kaur, H.; Bajwa, A.; Nainawat, A.K.; Singh, G. Surface-modified ZnO nanoparticles for enhanced environmental and biomedical performance. Hybrid Adv. 2025, 8, 100342. [Google Scholar] [CrossRef]
- Khan, A.U.H.; Liu, Y.; Naidu, R.; Fang, C.; Shon, H.K.; Zhang, H.; Dharmarajan, R. Changes in the Aggregation Behaviour of Zinc Oxide Nanoparticles Influenced by Perfluorooctanoic Acid, Salts, and Humic Acid in Simulated Waters. Toxics 2024, 12, 602. [Google Scholar] [CrossRef]
- Kumar, A.; Ansari, Z.A.; Fouad, H.; Umar, A.; Ansari, S.G. Oxidative Stress Control in E. coli and S. aureus Cells Using Amines Adsorbed ZnO. Sci. Adv. Mater. 2014, 6, 1236–1243. [Google Scholar] [CrossRef]
- Duan, L.; Yan, F.; Zhang, L.; Liu, B.; Zhang, Y.; Tian, X.; Liu, Z.; Wang, X.; Wang, S.; Tian, J.; et al. ZnO@Polyvinyl Alcohol/Poly(lactic acid) Nanocomposite Films for the Extended Shelf Life of Pork by Efficient Antibacterial Adhesion. ACS Omega 2022, 7, 44657–44669. [Google Scholar] [CrossRef]
- Mondelaers, D.; Vanhoyland, G.; Van den Rul, H.; D’Haen, J.; Van Bael, M.K.; Mullens, J.; Van Poucke, L.C. Synthesis of ZnO nanopowder via an aqueous acetate-citrate gelation method. Mater. Res. Bull. 2002, 37, 901–914. [Google Scholar] [CrossRef]
- Tokumoto, M.S.; Pulcinelli, S.H.; Santilli, C.V.; Briois, V. Catalysis and Temperature Dependence on the Formation of ZnO Nanoparticles and of Zinc Acetate Derivatives Prepared by the Sol-Gel Route. J. Phys. Chem. B 2003, 107, 568–574. [Google Scholar] [CrossRef]
- Zhang, H.; Yang, D.; Ji, Y.; Ma, X.; Xu, J.; Que, D. Low Temperature Synthesis of Flowerlike ZnO Nanostructures by Cetyltrimethylammonium Bromide-Assisted Hydrothermal Process. J. Phys. Chem. B 2004, 108, 3955–3958. [Google Scholar] [CrossRef]
- Liu, B.; Zeng, H.C. Hydrothermal Synthesis of ZnO Nanorods in the Diameter Regime of 50 nm. J. Am. Chem. Soc. 2003, 125, 4430–4431. [Google Scholar] [CrossRef]
- Mousavand, T.; Ohara, S.; Naka, T.; Umetsu, M.; Takami, S.; Adschiri, T. Organic-ligand-assisted hydrothermal synthesis of ultrafine and hydrophobic ZnO nanoparticles. J. Mater. Res. 2010, 25, 219–223. [Google Scholar] [CrossRef]
- Mahmood, N.B.; Saeed, F.R.; Gbashi, K.R.; Mahmood, U.-S. Synthesis and characterization of zinc oxide nanoparticles via oxalate co-precipitation method. Mater. Lett. X 2022, 13, 100126. [Google Scholar] [CrossRef]
- Ghorbani, H.R.; Mehr, F.P.; Pazoki, H.; Rahmani, B.M. Synthesis of ZnO Nanoparticles by Precipitation Method. Orient. J. Chem. 2015, 31, 1219–1221. [Google Scholar] [CrossRef]
- Ghaffarian, H.R.; Saiedi, M.; Sayyadnejad, M.A.; Rashidi, A.M. Synthesis of ZnO Nanoparticles by Spray Pyrolysis Method. Iran. J. Chem. Chem. Eng. 2011, 30, 1–6. [Google Scholar]
- Wallace, R.; Brown, A.P.; Brydson, R.; Wegner, K.; Milne, S.J. Synthesis of ZnO nanoparticles by flame spray pyrolysis and characterisation protocol. J. Mater. Sci. 2013, 48, 6393–6403. [Google Scholar] [CrossRef]
- Liang, Y.; Wicker, S.; Wang, X.; Erichsen, E.S.; Fu, F. Organozinc Precursor-Derived Crystalline ZnO Nanoparticles: Synthesis, Characterization and Their Spectroscopic Properties. Nanomaterials 2018, 8, 22. [Google Scholar] [CrossRef]
- Primc, G.; Brencic, K.; Mozetic, M.; Gorjanc, M. Recent Advances in the Plasma-Assisted Synthesis of Zinc Oxide Nanoparticles. Nanomaterials 2021, 11, 1191. [Google Scholar] [CrossRef]
- Messai, R.; Ferhat, M.F.; Belmekki, B.; Alam, M.W.; Al-Othoum, M.A.S.; Sadaf, S. GAD plasma-assisted synthesis of ZnO nanoparticles and their photocatalytic activity. Mater. Res. Express 2024, 11, 015006. [Google Scholar] [CrossRef]
- Lu, J.; Ng, K.M.; Yang, S. Efficient, One-Step Mechanochemical Process for the Synthesis of ZnO Nanoparticles. Ind. Eng. Chem. Res. 2008, 47, 1095–1101. [Google Scholar] [CrossRef]
- Otis, G.; Ejgenberg, M.; Mastai, Y. Solvent-Free Mechanochemical Synthesis of ZnO Nanoparticles by High-Energy Ball Milling of ε-Zn(OH)2 Crystals. Nanomaterials 2021, 11, 238. [Google Scholar] [CrossRef] [PubMed]
- Liu, W.; Wang, S.; Wang, J.; Zhang, B.; Liu, L.; Liu, H.; Yang, J. Supercritical hydrothermal synthesis of nano-zinc oxide: Process and mechanism. Ceram. Int. 2022, 48, 22629–22646. [Google Scholar] [CrossRef]
- Sun, P.; Lv, Z.; Sun, C. Study on the Synthesis of Nano Zinc Oxide Particles under Supercritical Hydrothermal Conditions. Nanomaterials 2024, 14, 844. [Google Scholar] [CrossRef]
- Trad, T.M.; Donley, K.B.; Look, D.C.; Eyink, K.G.; Tomich, D.H.; Taylor, C.R. Low temperature deposition of zinc oxide nanoparticles via zinc-rich vapor phase transport and condensation. J. Cryst. Growth 2010, 312, 3675–3679. [Google Scholar] [CrossRef]
- Marin, O.; Real, S.C.; Vega, N.C.; Tirado, M.; Comedi, D. ZnO Nanostructures Synthesized by Vapor Transport and Liquid Phase Synthesis Techniques: Growth and Properties. Sci. Rev. 2020, 1, 6–23. [Google Scholar] [CrossRef]
- López-Cuenca, S.; Pérez Carrillo, L.A.; Rabelero Velasco, M.; Díaz de León, R.; Saade, H.; López, R.G.; Mendizábal, E.; Puig, J.E. High-Yield Synthesis of Zinc Oxide Nanoparticles from Bicontinuous Microemulsions. J. Nanomater. 2011, 2011, 6. [Google Scholar] [CrossRef]
- Yildirim, O.A.; Durucan, C. Synthesis of zinc oxide nanoparticles elaborated by microemulsion method. J. Alloys Compd. 2010, 506, 944–949. [Google Scholar] [CrossRef]
- Usui, H. Electrochemical self-assembly synthesis of zinc oxide nanoparticles and lamellar-structured organic/inorganic hybrids by electrodeposition in surfactant solution. Electrochim. Acta 2011, 56, 3934–3940. [Google Scholar] [CrossRef]
- Rabchinskii, M.K.; Glukhova, O.E.; Sysoev, V.V.; Barkov, P.V.; Ryzhkov, S.A.; Stolyarova, D.Y.; Saveliev, S.D.; Khalturin, B.G.; Varezhnikov, A.S.; Solomatin, M.A.; et al. Delving into the effect of ZnO nanoparticles on the chemistry and electronic properties of aminated graphene: Ab initio and experimental probing. Surf. Interfaces 2025, 65, 106501. [Google Scholar] [CrossRef]
- Rafaela, R.; Dejan, M.; Damjan, B.; Julio, C.; Niksa, K. Synthesis of Silver, Gold, and Platinum Doped Zinc Oxide Nanoparticles by Pulsed Laser Ablation in Water. Nanomaterials 2022, 12, 3484. [Google Scholar] [CrossRef] [PubMed]
- Frankcombe, T.J.; Liu, Y. Interpretation of Oxygen 1s X-ray Photoelectron Spectroscopy of ZnO. Chem. Mater. 2023, 35, 5468–5474. [Google Scholar] [CrossRef]
- Yalovega, G.E.; Brzhezinskaya, M.; Dmitriev, V.O.; Shmatko, V.A.; Ershov, I.V.; Ulyankina, A.A.; Chernysheva, D.V.; Smirnova, N.V. Interfacial Interaction in MeOx/MWNTs (Me–Cu, Ni) Nanostructures as Efficient Electrode Materials for High-Performance Supercapacitors. Nanomaterials 2024, 14, 947. [Google Scholar] [CrossRef]
- Yakimchuk, D.V.; Bundyukova, V.D.; Ustarroz, J.; Terryn, H.; Baert, K.; Kozlovskiy, A.L.; Zdorovets, M.V.; Khubezhov, S.A.; Trukhanov, A.V.; Trukhanov, S.V.; et al. Morphology and Microstructure Evolution of Gold Nanostructures in the Limited Volume Porous Matrices. Sensors 2020, 20, 4397. [Google Scholar] [CrossRef]
- FIZ Karlsruhe—Leibniz Institute for Information Infrastructure. Inorganic Crystal Structure Database (ICSD), Collection Code 26170. Available online: https://icsd.fiz-karlsruhe.de/ (accessed on 26 May 2025).
- Rabchinskii, M.K.; Sysoev, V.V.; Brzhezinskaya, M.; Solomatin, M.A.; Gabrelian, V.S.; Kirilenko, D.A.; Stolyarova, D.Y.; Saveliev, S.D.; Ryzhkov, S.A.; Khalturin, B.G.; et al. Rationalizing Graphene–ZnO Composites for Gas Sensing via Functionalization with Amines. Nanomaterials 2024, 14, 735. [Google Scholar] [CrossRef]
- Ryu, I.S.; Liu, X.; Jin, Y.; Sun, J.; Lee, Y.J. Stoichiometric analysis of competing intermolecular hydrogen bonds using infrared spectroscopy. RSC Adv. 2018, 8, 23481–23488. [Google Scholar] [CrossRef]
- Wang, S.; Xu, Q.; Fen, L.; Dai, J.; Jia, H.; Xu, B. Preparation and properties of cellulose-based carbon microsphere/poly(lactic acid) composites. J. Compos. Mater. 2014, 48, 1297–1302. [Google Scholar]


| Average Binding Energy (eV) | Peak Area (%) | ||||
|---|---|---|---|---|---|
| Zn-O | Zn-OH | C-O | ZnO + Zn-OH | C-O | |
| Modified ZnONP-80-1 | 530.7 | 531.4 | 532.5 | 92.2 | 7.8 |
| Modified ZnONP-120-1 | 530.6 | 531.4 | 532.8 | 98.1 | 1.9 |
| Modified ZnONP-80-24 | 530.6 | 531.4 | 532.7 | 94.2 | 5.8 |
| Modified ZnONP-120-24 | 530.6 | 531.4 | 532.7 | 94.3 | 5.7 |
| Unmodified ZnONP-120-1 | 530.7 | 531.5 | n. d. a | - | - |
| Diffraction Component 1 | Diffraction Component 2 | |||
|---|---|---|---|---|
| Average 2θ/° | Peak Area (%) | Average 2θ/° | Peak Area (%) | |
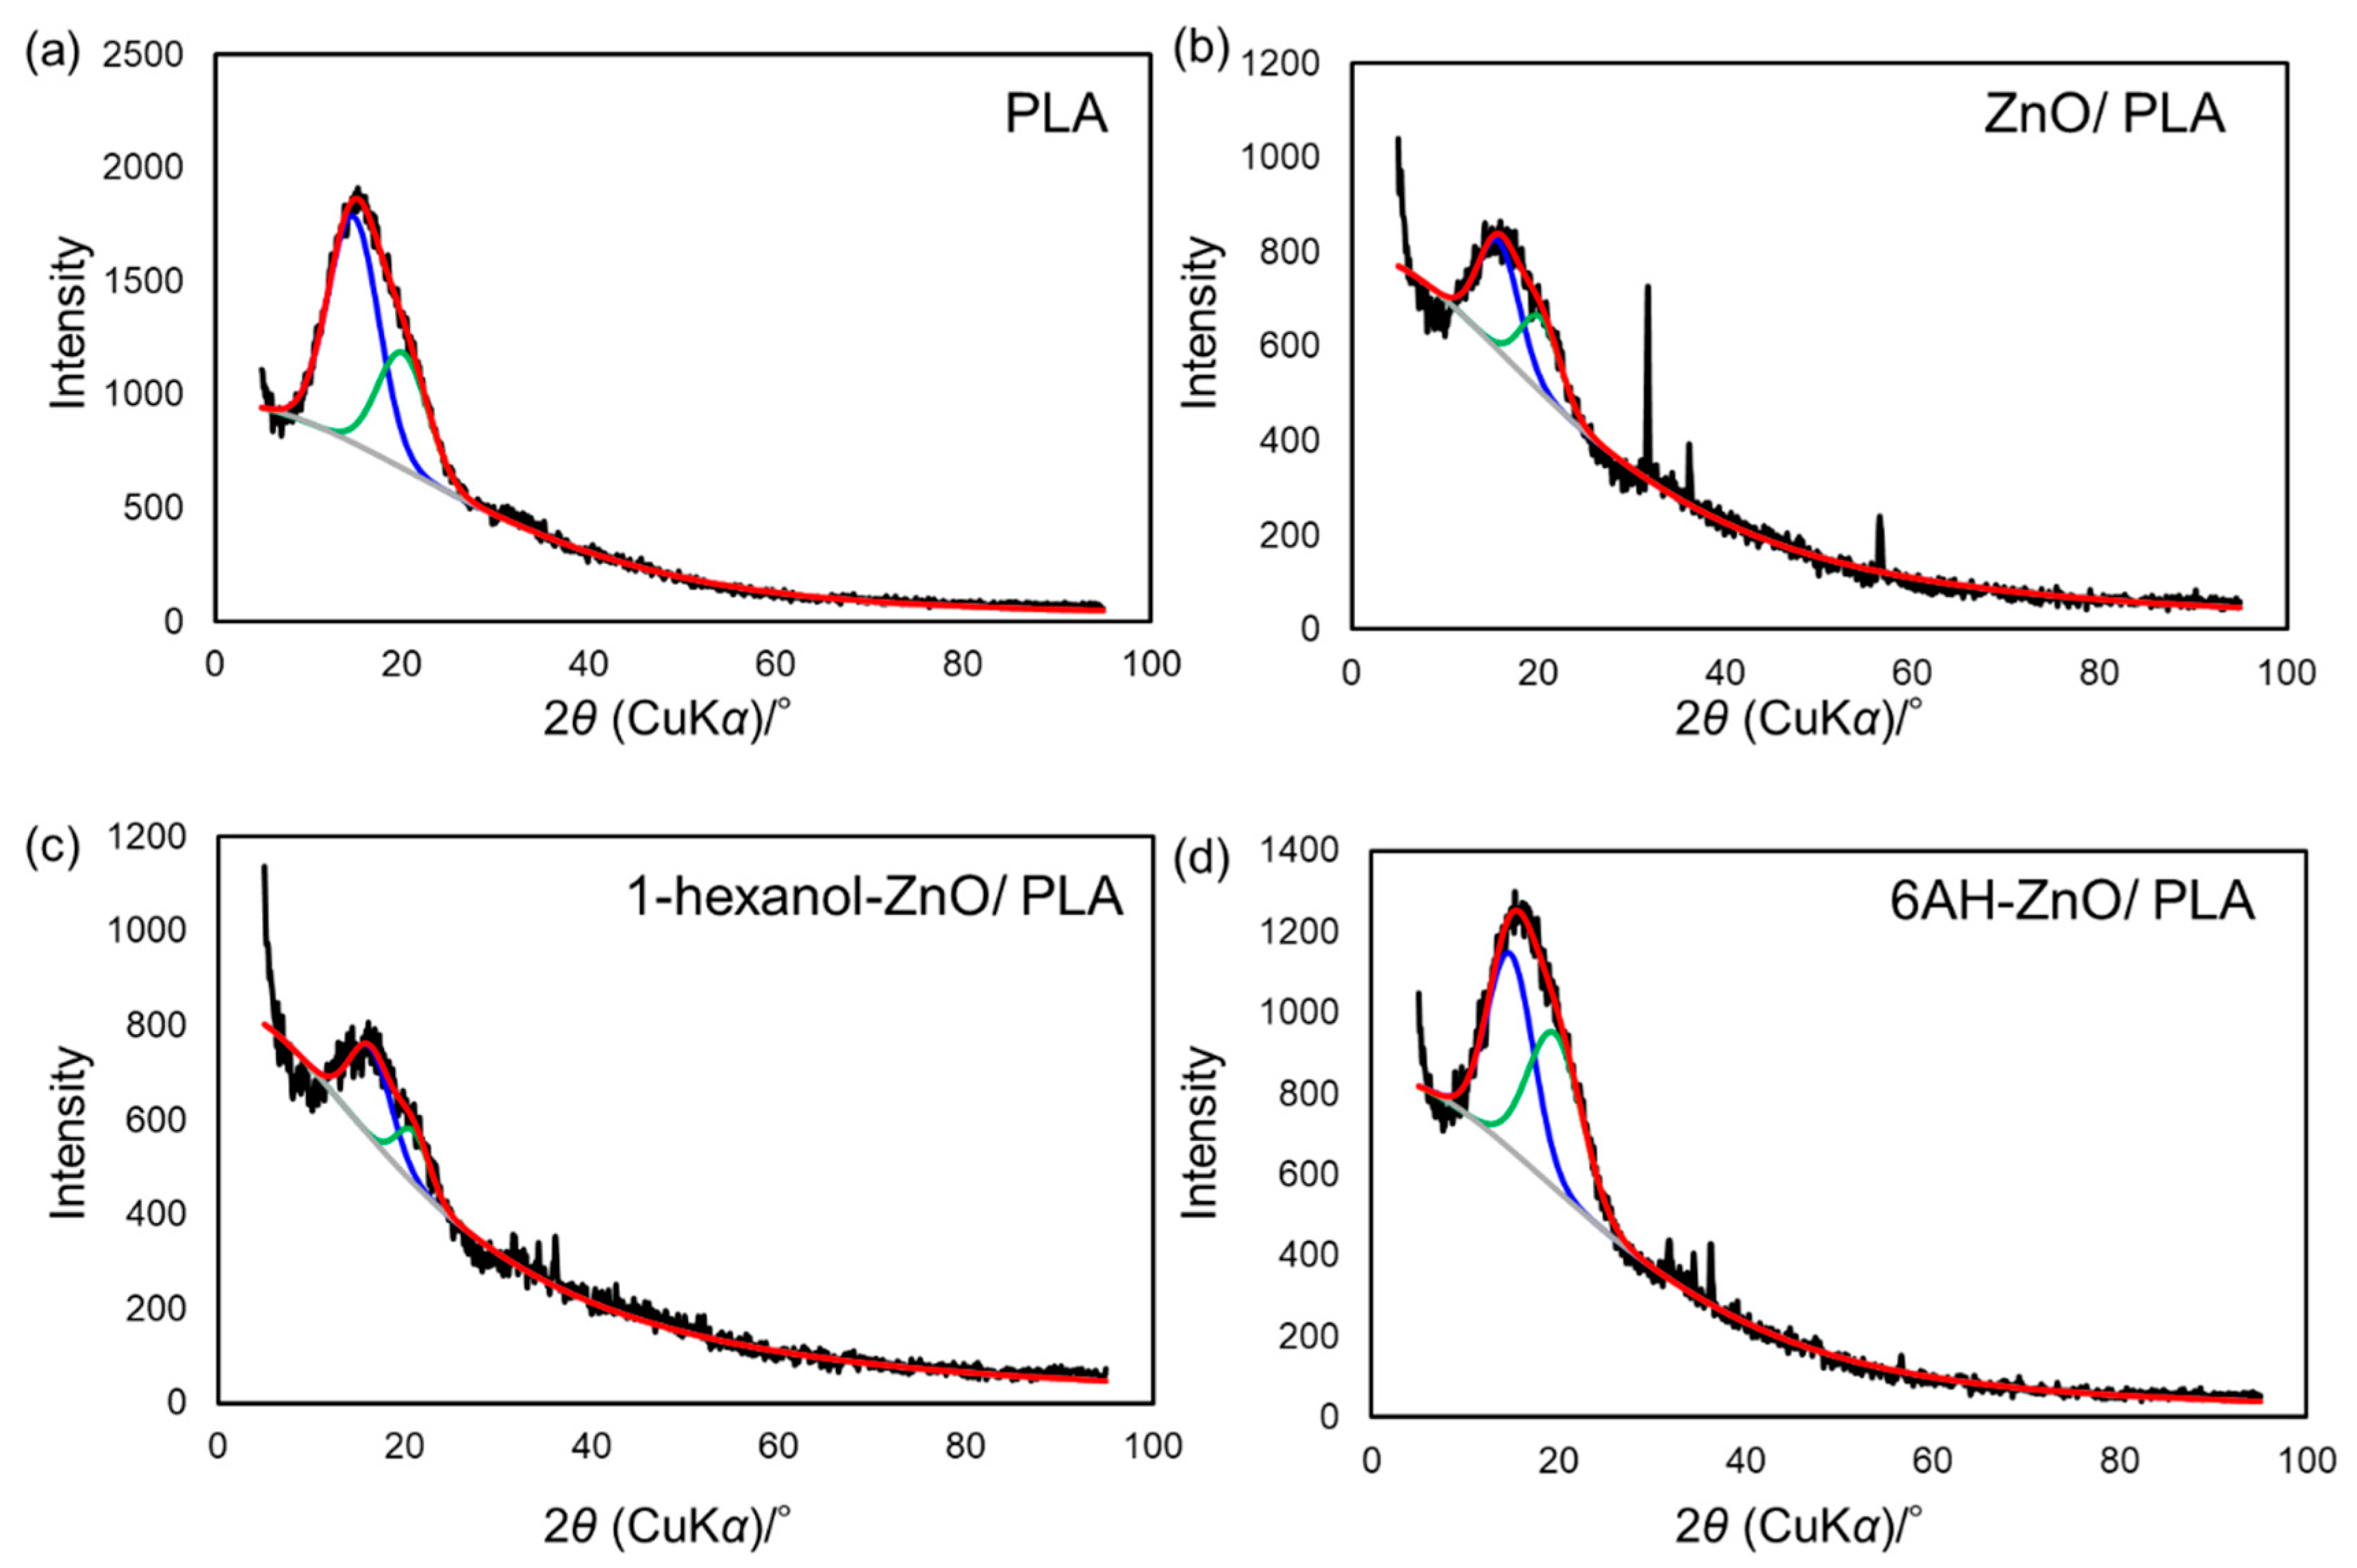
| PLA | 14.8 | 66.2 | 20.1 | 33.8 |
| Unmodified ZnONP/PLA | 15.7 | 60.5 | 20.3 | 39.5 |
| 1-hexanol-ZnONP/PLA | 16.3 | 68.6 | 20.9 | 31.4 |
| 6AH-ZnONP/PLA | 14.8 | 51.6 | 19.6 | 48.4 |
| Tg (°C) | Tcc (°C) | Tm (°C) | |
|---|---|---|---|
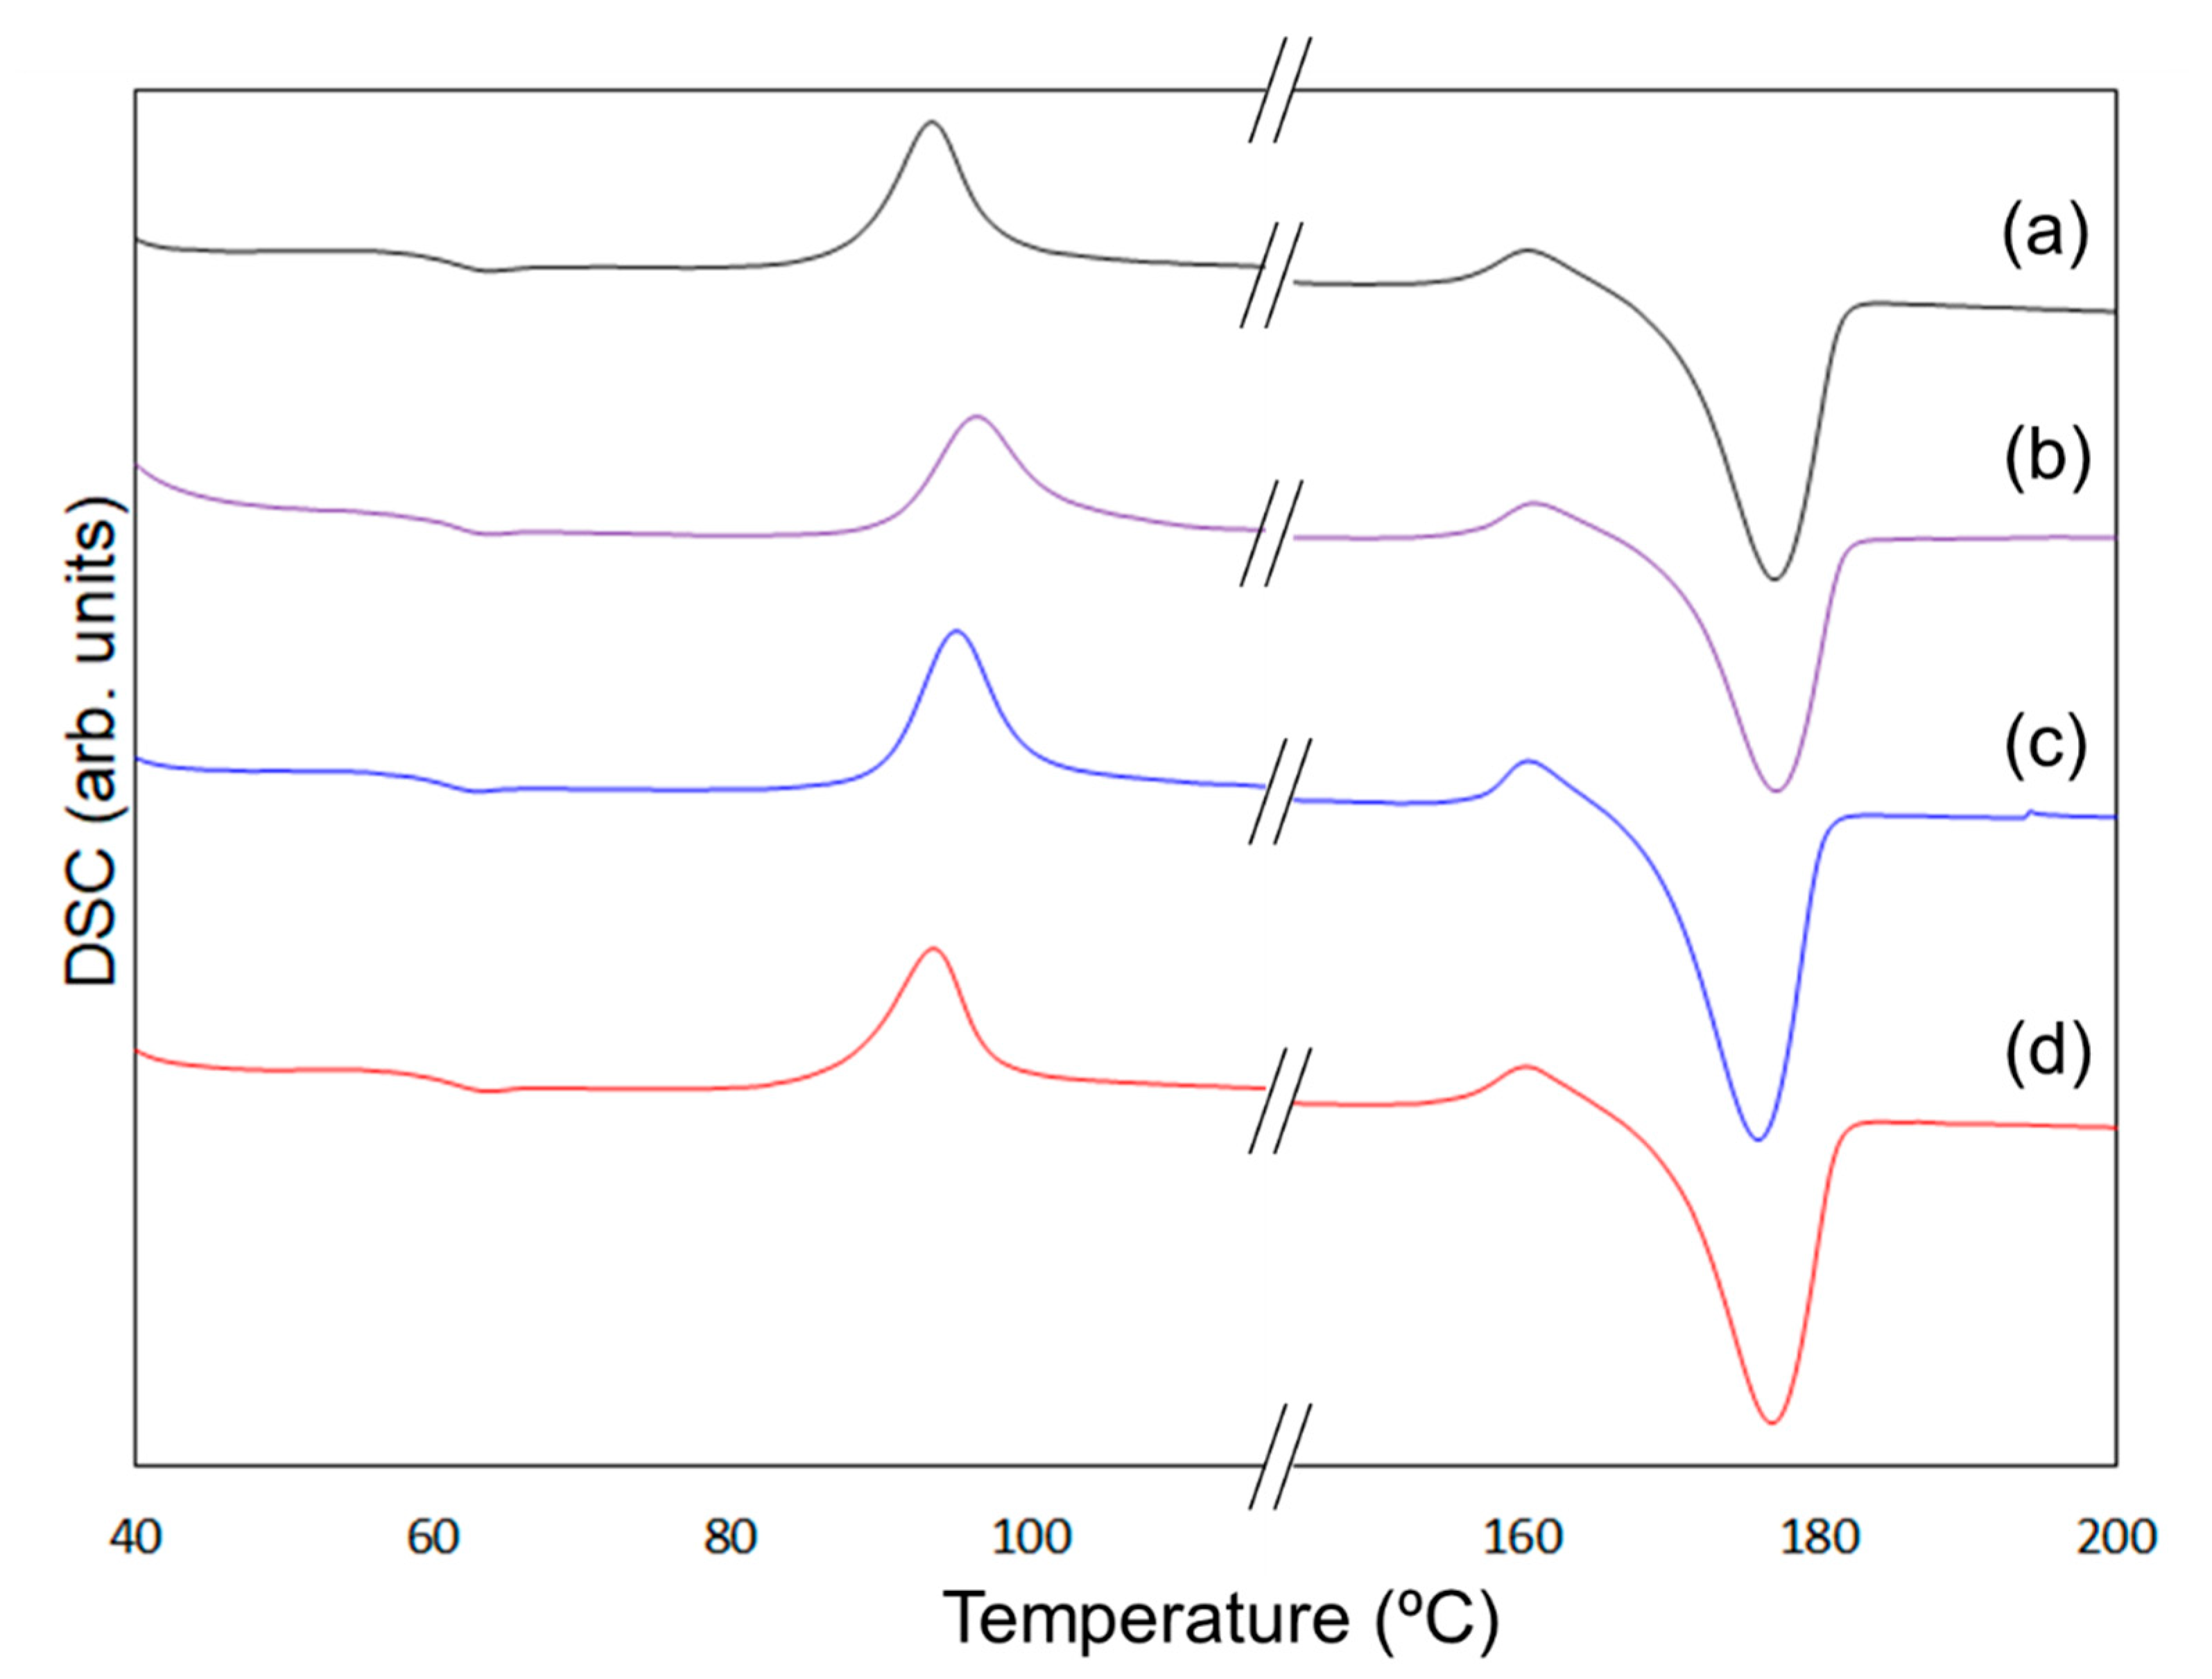
| PLA | 61.2 | 93.4 | 177.1 |
| Unmodified ZnONP/PLA | 61.2 | 96.4 | 177.2 |
| 1-hexanol-ZnONP/PLA | 60.9 | 95.1 | 176.0 |
| 6AH-ZnONP/PLA | 61.6 | 93.5 | 176.9 |
| Estimated Particle Size (μm) | Ratios of Particle Below 1 μm2 (%) | |||
|---|---|---|---|---|
| Average | Standard Deviation | |||
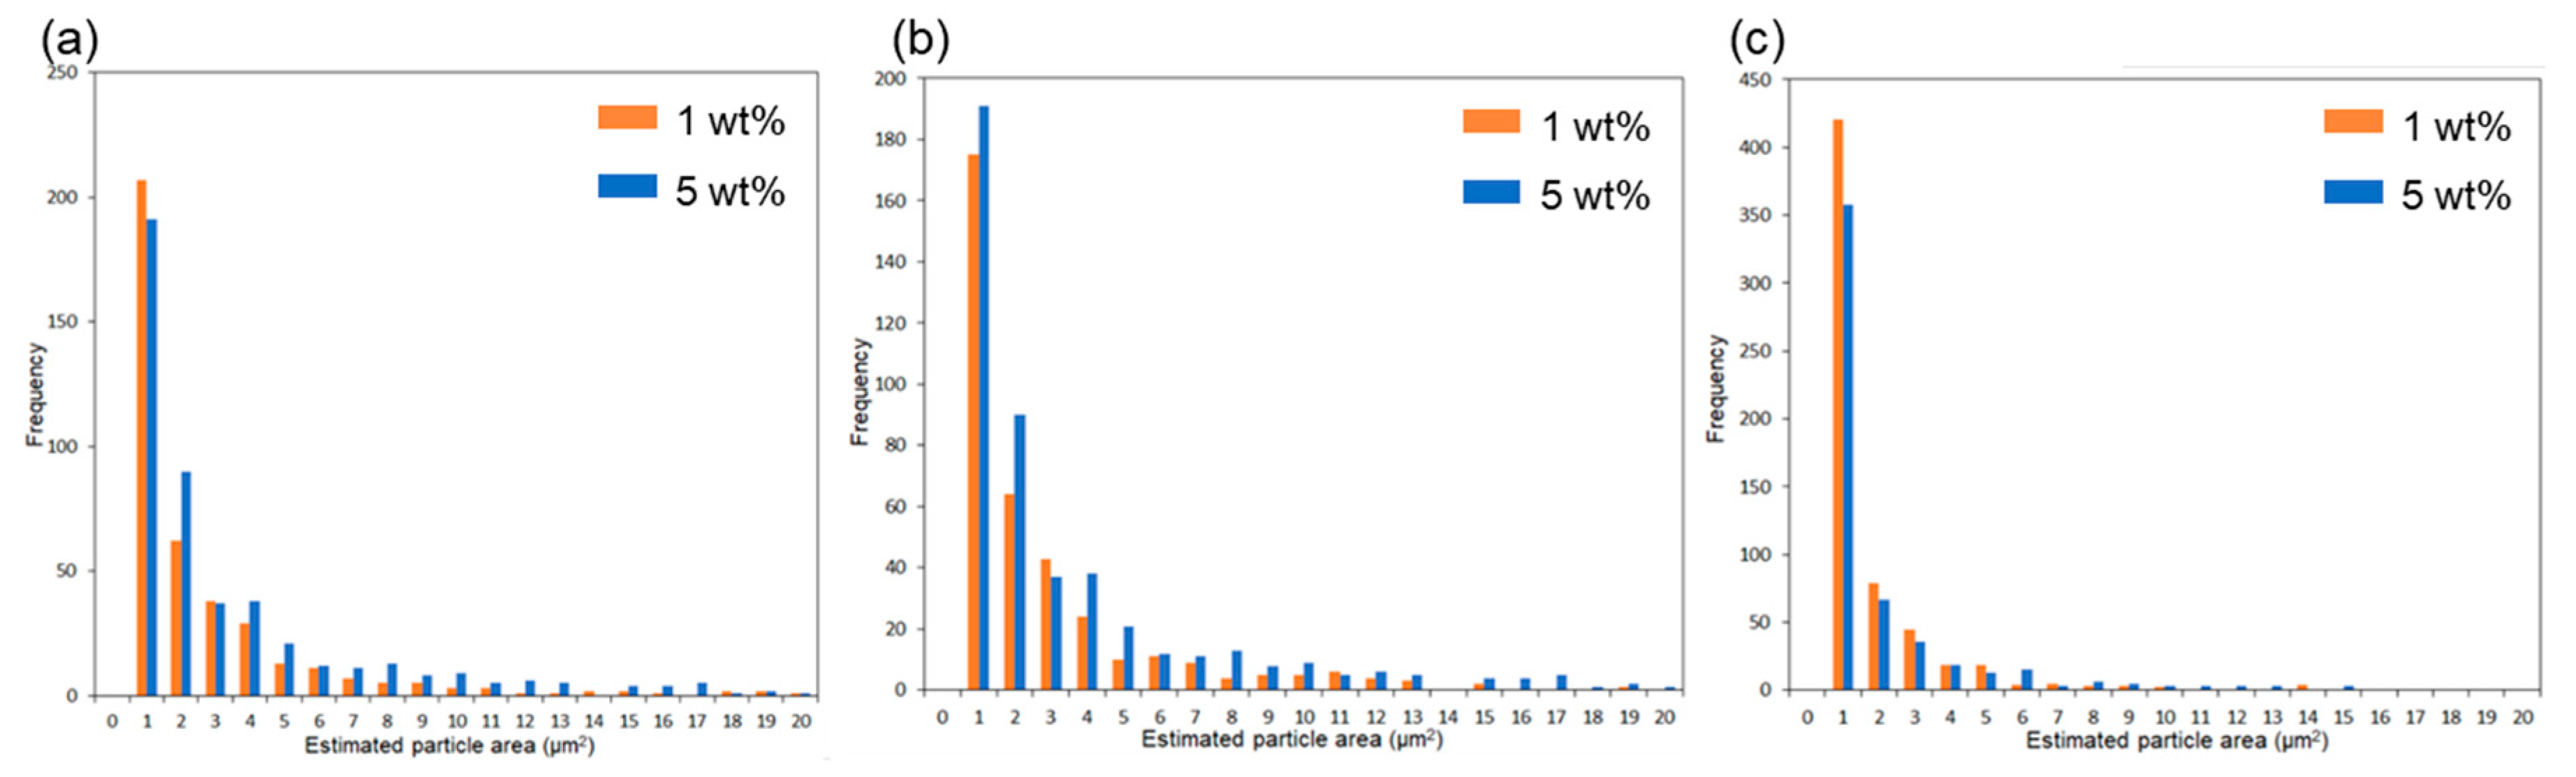
| Unmodified ZnONP/PLA | 1 wt% | 2.48 | 4.11 | 52 |
| 5 wt% | 3.36 | 4.79 | 40 | |
| 1-hexanol-ZnONP/PLA | 1 wt% | 2.37 | 3.36 | 48 |
| 5 wt% | 2.96 | 3.84 | 41 | |
| 6AH-ZnONP/PLA | 1 wt% | 0.54 | 1.04 | 69 |
| 5 wt% | 0.31 | 1.24 | 71 | |
Disclaimer/Publisher’s Note: The statements, opinions and data contained in all publications are solely those of the individual author(s) and contributor(s) and not of MDPI and/or the editor(s). MDPI and/or the editor(s) disclaim responsibility for any injury to people or property resulting from any ideas, methods, instructions or products referred to in the content. |
© 2025 by the authors. Licensee MDPI, Basel, Switzerland. This article is an open access article distributed under the terms and conditions of the Creative Commons Attribution (CC BY) license (https://creativecommons.org/licenses/by/4.0/).
Share and Cite
Nakagawa, H.; Iritani, K. Preparation of Particle-Reinforced Resin Using Highly Functional ZnO Particle Filler Driven by Supramolecular Interactions. Materials 2025, 18, 2986. https://doi.org/10.3390/ma18132986
Nakagawa H, Iritani K. Preparation of Particle-Reinforced Resin Using Highly Functional ZnO Particle Filler Driven by Supramolecular Interactions. Materials. 2025; 18(13):2986. https://doi.org/10.3390/ma18132986
Chicago/Turabian StyleNakagawa, Haruka, and Kohei Iritani. 2025. "Preparation of Particle-Reinforced Resin Using Highly Functional ZnO Particle Filler Driven by Supramolecular Interactions" Materials 18, no. 13: 2986. https://doi.org/10.3390/ma18132986
APA StyleNakagawa, H., & Iritani, K. (2025). Preparation of Particle-Reinforced Resin Using Highly Functional ZnO Particle Filler Driven by Supramolecular Interactions. Materials, 18(13), 2986. https://doi.org/10.3390/ma18132986