
Adjusting LCA Allocation Methods for Cement Industry: A Production-Based Approach to Energy Conservation and Emission Reduction


Highlights
- Analyzed different allocation methods based on actual cement production.
- Solid waste is divided into Valorized Solid Waste (VSW) and Non-Valorized Solid Waste (NVSW).
- Economic Allocation Method is more suitable for VSW.
- Propose the Collaborative Disposal Allocation Method (CD method) for NVSW
Abstract
1. Introduction
- (1)
- The application of this material is certain;
- (2)
- The material is produced as an integral part;
- (3)
- The application of the material only requires industrial practice without further processing;
- (4)
- The use of the material is legitimate and meets the requirements of product, environmental, and health protection standards.
2. Method
2.1. Selection of Allocation Methods
2.2. Life Cycle Assessment
2.3. Functional Unit and System Boundary
2.4. Life Cycle Inventory
3. Results
4. Discussion
4.1. Economic Allocation and Mass Allocation
4.2. Allocation of Domestic Waste
4.2.1. Active/Passive Environmental Load
4.2.2. Collaborative Disposal Allocation Method
5. Conclusions
Author Contributions
Funding
Institutional Review Board Statement
Informed Consent Statement
Data Availability Statement
Conflicts of Interest
References
- UNFCC, 2015. The Paris Agreement UNFCCC. Available online: https://unfccc.int/documents/184656 (accessed on 15 June 2022).
- Yang, P.; Peng, S.; Benani, N.; Dong, L.; Li, X.; Liu, R.; Mao, G. An integrated evaluation on China’s provincial carbon peak and carbon neutrality. J. Clean. Prod. 2022, 377, 134497. [Google Scholar] [CrossRef]
- Benhelal, E.; Shamsaei, E.; Rashid, M.I. Challenges against CO2 abatement strategies in cement industry: A review. J. Environ. Sci. 2021, 104, 84–101. [Google Scholar] [CrossRef] [PubMed]
- Davis, S.J.; Lewis, N.S.; Shaner, M.; Aggarwal, S.; Arent, D.; Azevedo, I.L.; Benson, S.M.; Bradley, T.; Brouwer, J.; Chiang, Y.-M.; et al. Net-zero emissions energy systems. Science 2018, 360, eaas9793. [Google Scholar] [CrossRef] [PubMed]
- Dahanni, H.; Ventura, A.; Guen, L.L.; Dauvergne, M.; Orcesi, A.; Cremona, C. Life cycle assessment of cement: Are existing data and models relevant to assess the cement industry’s climate change mitigation strategies? A literature review. Constr. Build. Mater. 2024, 411, 134415. [Google Scholar] [CrossRef]
- Fan, H.; Yu, H.; Ma, H.; Ma, H.; Chen, X.; Xu, Y.; Zhang, M.; Du, Q. Development of New Method for Concrete Carbon Emission evaluation: The Anti-freezing durability-oriented Carbon Emission Indicator (CEI) System and its application in design of low carbon HPC with high durability. J. Clean. Prod. 2024, 478, 143903. [Google Scholar] [CrossRef]
- Kumar, S.; Gangotra, A.; Barnard, M. Towards a Net Zero Cement: Strategic Policies and Systems Thinking for a Low-Carbon Future. Curr. Sustain./Renew. Energy Rep. 2025, 12, 5. [Google Scholar] [CrossRef]
- Jiang, Y.; Ling, T.-C.; Shi, C.; Pan, S.-Y. Characteristics of steel slags and their use in cement and concrete—A review. Resour. Conserv. Recycl. 2018, 136, 187–197. [Google Scholar] [CrossRef]
- Tamta, S.; Chaudhury, R.; Sharma, U.; Hanifa, M.; Thapliyal, P.C.; Singh, L.P. Low lime–low carbon cement: Achieving sustainability through reduction of CO2 emissions and utilizing limestone mining rejects. Constr. Build. Mater. 2025, 470, 140476. [Google Scholar] [CrossRef]
- Jiang, Z.; Juenger, M.; Santhanam, M. Preface to special issue on: Low-Carbon Cement Composites (LCCC). Cem. Concr. Compos. 2023, 145, 105367. [Google Scholar] [CrossRef]
- ISO 14040:2006; Environmental Management-Life Cycle Assessment-Principles and Framework. International Organization for Standardization: Geneva, Switzerland, 2006.
- Panesar, D.; Seto, K.; Churchill, C. Impact of the selection of functional unit on the life cycle assessment of green concrete. Int. J. Life Cycle Assess. 2017, 22, 1969–1986. [Google Scholar] [CrossRef]
- Josa, A.; Aguado, A.; Cardim, A.; Byars, E. Comparative analysis of the life cycle impact assessment of available cement inventories in the EU. Cem. Concr. Res. 2007, 37, 781–788. [Google Scholar] [CrossRef]
- Yang, D.; Fan, L.; Shi, F.; Liu, Q.; Wang, Y. Comparative study of cement manufacturing with different strength grades using the coupled LCA and partial LCC methods—A case study in China. Resour. Conserv. Recycl. 2017, 119, 60–68. [Google Scholar] [CrossRef]
- Bacatelo, M.; Capucha, F.; Ferrão, P.; Margarido, F. Selection of a CO2 capture technology for the cement industry: An integrated TEA and LCA methodological framework. J. CO2 Util. 2023, 68, 102375. [Google Scholar] [CrossRef]
- Wang, S.Y.; Jin, L.; Feng, Y.; Wang, Z.Y.; Yin, T.Y.; Liu, K.N.; Dong, E.L.; Yu, R. A low carbon embedded low water/binder cement-based composites (LW/BCC) based on steel slag powder and microwave pre-curing: Experiments and Life Cycle Assessment (LCA). Constr. Build. Mater. 2023, 400, 132778. [Google Scholar] [CrossRef]
- Guo, X.; Li, Y.; Shi, H.; She, A.; Guo, Y.; Su, Q.; Ren, B.; Liu, Z.; Tao, C. Carbon reduction in cement industry—An indigenized questionnaire on environmental impacts and key parameters of life cycle assessment (LCA) in China. J. Clean. Prod. 2023, 426, 139022. [Google Scholar] [CrossRef]
- Cao, Z.; Masanet, E.; Tiwari, A.; Akolawala, S. Decarbonizing Concrete: Deep decarbonization pathways for the cement and concrete cycle in the United States, India, and China; Industrial Sustainability Analysis Laboratory, Northwestern University: Evanston, IL, USA, 2021. [Google Scholar]
- Li, Y.; Liu, Y.; Gong, X.; Nie, Z.; Cui, S.; Wang, Z.; Chen, W. Environmental impact analysis of blast furnace slag applied to ordinary Portland cement production. J. Clean. Prod. 2016, 120, 221–230. [Google Scholar] [CrossRef]
- Tosti, L.; Zomeren, A.v.; Pels, J.R.; Damgaard, A.; Comans, R.N.J. Life cycle assessment of the reuse of fly ash from biomass combustion as secondary cementitious material in cement products. J. Clean. Prod. 2020, 245, 118937. [Google Scholar] [CrossRef]
- Kahawalage, A.C.; Melaaen, M.C.; Tokheim, L.-A. Opportunities and challenges of using SRF as an alternative fuel in the cement industry. Clean. Waste Syst. 2023, 4, 100072. [Google Scholar] [CrossRef]
- Ferronato, N.; Giaquinta, C.; Conti, F.; Torretta, V. When solid recovered fuel (SRF) production and consumption maximize environmental benefits? A life cycle assessment. Waste Manag. 2024, 178, 199–209. [Google Scholar] [CrossRef]
- Li, L.; Shao, X.; Ling, T.-C. Life cycle assessment of coal gangue composite cements: From sole OPC towards low-carbon quaternary binder. J. Clean. Prod. 2023, 414, 137674. [Google Scholar] [CrossRef]
- European Parliament. Directive 2008/98/EC of the European Parliament and of the Council of 19 November 2008 on Waste and Repealing Certain Directives (Text with EEA Relevance); European Parliament: Strasbourg, France, 2008.
- Seto, K.E.; Churchill, C.J.; Panesar, D.K. Influence of fly ash allocation approaches on the life cycle assessment of cement-based materials. J. Clean. Prod. 2017, 157, 65–75. [Google Scholar] [CrossRef]
- Uddin, A.; Ali, Y.; Sabir, M.; Petrillo, A.; Felice, F.D. Circular economy and its implementation in cement industry: A case point in Pakistan. Sci. Total Environ. 2023, 898, 165605. [Google Scholar] [CrossRef] [PubMed]
- Chomkhamsri, K.; Wolf, M.-A.; Pant, R. International Reference Life Cycle Data System (ILCD) Handbook: Review Schemes for Life Cycle Assessment. In Towards Life Cycle Sustainability Management; Finkbeiner, M., Ed.; Springer: Dordrecht, The Netherlands, 2011; pp. 107–117. [Google Scholar]
- Chen, C.; Habert, G.; Bouzidi, Y.; Jullien, A.; Ventura, A. LCA allocation procedure used as an incitative method for waste recycling: An application to mineral additions in concrete. Resour. Conserv. Recycl. 2010, 54, 1231–1240. [Google Scholar] [CrossRef]
- Babbitt, C.W.; Lindner, A.S. A life cycle comparison of disposal and beneficial use of coal combustion products in Florida. Int. J. Life Cycle Assess. 2008, 13, 555–563. [Google Scholar] [CrossRef]
- IISI, International Iron Steel Institute. World Steel Life Cycle Inventory; Methodology Report; Committee on Environmental Affairs: Brussels, Belgium, 2002. [Google Scholar]
- ISO 14044:2006; Environmental Management-Life Cycle Assessment-Requirements and Guidelines. International Organization for Standardization: Geneva, Switzerland, 2006.
- Liu, X.; Wang, H.; Chen, J.; He, Q.; Zhang, H.-C.; Jiang, R.; Chen, X.; Hou, P. Method and basic model for development of Chinese reference life cycle database. Huanjing Kexue Xuebao/Acta Sci. Circumstantiae 2010, 30, 2136–2144. [Google Scholar]
- Batuecas, E.; Ramón-Álvarez, I.; Sánchez-Delgado, S.; Torres-Carrasco, M. Carbon footprint and water use of alkali-activated and hybrid cement mortars. J. Clean. Prod. 2021, 319, 128653. [Google Scholar] [CrossRef]
- Al-Subari, B.L.; Hilal, A.; Ekinci, A. Life cycle assessment of soil stabilization using cement and waste additives. Constr. Build. Mater. 2023, 403, 133045. [Google Scholar] [CrossRef]
- Salaripoor, H.; Yousefi, H.; Abdoos, M. Life cycle environmental assessment of Refuse-Derived Fuel (RDF) as an alternative to fossil fuels in cement production: A sustainable approach for mitigating carbon emissions. Fuel Commun. 2025, 22, 100135. [Google Scholar] [CrossRef]
- Dacić, A.; Mester-Szabó, E.; Fenyvesi, O.; Szalay, Z. Life cycle assessment of concrete incorporating all concrete recycling products. Case Stud. Constr. Mater. 2024, 21, e03910. [Google Scholar] [CrossRef]
- Ramón-Álvarez, I.; Batuecas, E.; Sánchez-Delgado, S.; Torres-Carrasco, M. Mechanical performance after high-temperature exposure and Life Cycle Assessment (LCA) according to unit of stored energy of alternative mortars to Portland cement. Constr. Build. Mater. 2023, 365, 130082. [Google Scholar] [CrossRef]
- Zeng, H.; Lyu, F.; Sun, W.; Zhang, H.; Wang, L.; Wang, Y. Progress on the Industrial Applications of Red Mud with a Focus on China. Minerals 2020, 10, 773. [Google Scholar] [CrossRef]
- Shi, Y.; Guan, Y.; Ge, W.; Xia, L.; Wang, L.; Hu, Y.; Wang, S. Value-added utilization of pulverized fuel ash as construction materials: State-of-the-art technologies and future prospects. J. China Coal Soc. 2024, 49, 2860–2875. [Google Scholar] [CrossRef]
- Huo, Y.; Yan, J. Analysis of the Alumina Market in the First Half of 2023. China Nonferrous Met. 2023, 38–39. [Google Scholar] [CrossRef]
- Zhang, H.; Ma, L.; Wu, H.; Bai, J. Application of coalburning furnace slag as raw material in clinker production. Cement 2023, 33–35. [Google Scholar] [CrossRef]
- Fan, Y.; Li, X.; Chen, H.; Li, Q. Experimental Study on Fracture Behavior of Cement Mortar Containing Fly Ash at Early Age. Jianzhu Cailiao Xuebao/J. Build. Mater. 2025, 28, 110–117. [Google Scholar]
- Qin, Z.; Dong, Y.; Hu, C. C-F-S-H/PCE Impact of C-F-S-H/PCE Nanocomposites on Hydration and Mechanical Properties of Slag Cement. Jianzhu Cailiao Xuebao/J. Build. Mater. 2024, 27, 969–976. [Google Scholar]
- Church, J.A.; Clark, P.U.; Cazenave, A.; Gregory, J.M.; Jevrejeva, S.; Levermann, A.; Merrifield, M.A.; Milne, G.A.; Nerem, R.S.; Nunn, P.D.; et al. Sea Level Change. In Climate Change 2013: The Physical Science Basis. Contribution of Working Group I to the Fifth Assessment Report of the Intergovernmental Panel on Climate Change; Stocker, T.F., Qin, D., Plattner, G.-K., Tignor, M., Allen, S.K., Boschung, J., Nauels, A., Xia, Y., Bex, V., Midgley, P.M., Eds.; Cambridge University Press: Cambridge, UK; New York, NY, USA, 2013. [Google Scholar]
- Guinée, J.B.; Heijungs, R.; Huppes, G.; Koning Ade Oers, L.; Sleeswijk, A.W.; Haes Ude Duin Rvan Lindeijer, E. Life Cycle Assessment An Operational Guide to the ISO Standards; Universiteit Leiden: Leiden, The Netherlands, 2001. [Google Scholar]
- Jolliet, O.; Margni, M.; Charles, R.; Humbert, S.; Payet, J.; Rebitzer, G.; Rosenbaum, R. IMPACT 2002+: A new life cycle impact assessment methodology. Int. J. Life Cycle Assess. 2003, 8, 324–330. [Google Scholar] [CrossRef]
- Rosenbaum, R.K.; Bachmann, T.M.; Gold, L.S.; Huijbregts, M.A.J.; Jolliet, O.; Juraske, R.; Koehler, A.; Larsen, H.F.; MacLeod, M.; Margni, M.; et al. USEtox—The UNEP-SETAC toxicity model: Recommended characterisation factors for human toxicity and freshwater ecotoxicity in life cycle impact assessment. Int. J. Life Cycle Assess. 2008, 13, 532–546. [Google Scholar] [CrossRef]
- Feiz, R.; Ammenberg, J.; Baas, L.; Eklund, M.; Helgstrand, A.; Marshall, R. Improving the CO2 performance of cement, part I: Utilizing life-cycle assessment and key performance indicators to assess development within the cement industry. J. Clean. Prod. 2015, 98, 272–281. [Google Scholar] [CrossRef]
- Zhu, L. Some thoughts on application of the polluter pays principle for controlling marine greenhouse gas emissions. Mar. Policy 2023, 158, 105877. [Google Scholar] [CrossRef]
- Glazyrina, I.; Glazyrin, V.; Vinnichenko, S. The polluter pays principle and potential conflicts in society. Ecol. Econ. 2006, 59, 324–330. [Google Scholar] [CrossRef]
- Ruiz-Rosa, I.; García-Rodríguez, F.J.; Antonova, N. Developing a methodology to recover the cost of wastewater reuse: A proposal based on the polluter pays principle. Util. Policy 2020, 65, 101067. [Google Scholar] [CrossRef]
- Tilton, J.E. Global climate policy and the polluter pays principle: A different perspective. Resour. Policy 2016, 50, 117–118. [Google Scholar] [CrossRef]


| Cement (1 t) | Clinker (1 t) | Raw Meal (1 t) | |||
|---|---|---|---|---|---|
| Clinker | 767.760 | Raw meal | 1540.000 | Limestone | 798.860 |
| Electricity (kWh) | 27.605 | Electricity (kWh) | 27.713 | Electricity (kWh) | 13.534 |
| Gypsum | 45.649 | Coal | 136.589 | Fly ash | 58.903 |
| Limestone | 74.036 | Domestic waste | 38.291 | Clay | 127.544 |
| Dust | 2.766 | Red mud | 67.230 | ||
| Slag | 141.966 |
| Raw Material | Road Transportation (km) | Railway Transportation (km) |
|---|---|---|
| Limestone | 7.2 | 0 |
| Fly ash | 16 | 0 |
| Clay | 7.2 | 0 |
| Red mud | 199 | 0 |
| Coal | 23 | 3044.9 |
| Domestic waste | 17 | 0 |
| Gypsum | 16 | 0 |
| By-pass system dust | 0 | 0 |
| Slag | 16 | 0 |
| Index | Units | List Substances | Methods |
|---|---|---|---|
| Global warming potential (GWP) | kg CO2 eq ①. | CO2, CH4, N2O… | IPCC2013 [44] |
| Eutrophication potential (EP) | kg PO43− eq. | NH 3, NH4-N, COD… | CML2002 [45] |
| Abiotic depletion potential (ADP) | kg Sb eq. | Iron, manganese, copper… | CML2002 |
| Acidification potential (AP) | kg SO2 eq. | SO2, NOx, NH3… | CML2002 |
| Respiratory inorganics (RIs) | kg PM2.5 eq. | CO, PM10, PM2.5… | IMPACT2002+ [46] |
| Ecological toxicity (ET) | CTUe | Organic, metal compounds… | USEtox [47] |
| Label | GWP | EP | ADP | AP | RI | ET |
|---|---|---|---|---|---|---|
| Case 1 | 6.855 × 10² | 6.133 × 10⁻² | 2.736 × 10⁻⁴ | 4.057 × 10⁻¹ | 1.032 × 10⁻¹ | 13.080 |
| Case 2 | 6.851 × 10² | 6.201 × 10⁻² | 2.526 × 10⁻⁴ | 4.082 × 10⁻¹ | 1.007 × 10⁻¹ | 12.644 |
| Case 3 | 7.168 × 10² | 8.252 × 10⁻² | 52.760 × 10⁻⁴ | 6.060 × 10⁻¹ | 2.444 × 10⁻¹ | 22.621 |
| Case 4 | 6.904 × 10² | 6.450 × 10⁻² | 7.158 × 10⁻⁴ | 4.341 × 10⁻¹ | 1.154 × 10⁻¹ | 13.603 |
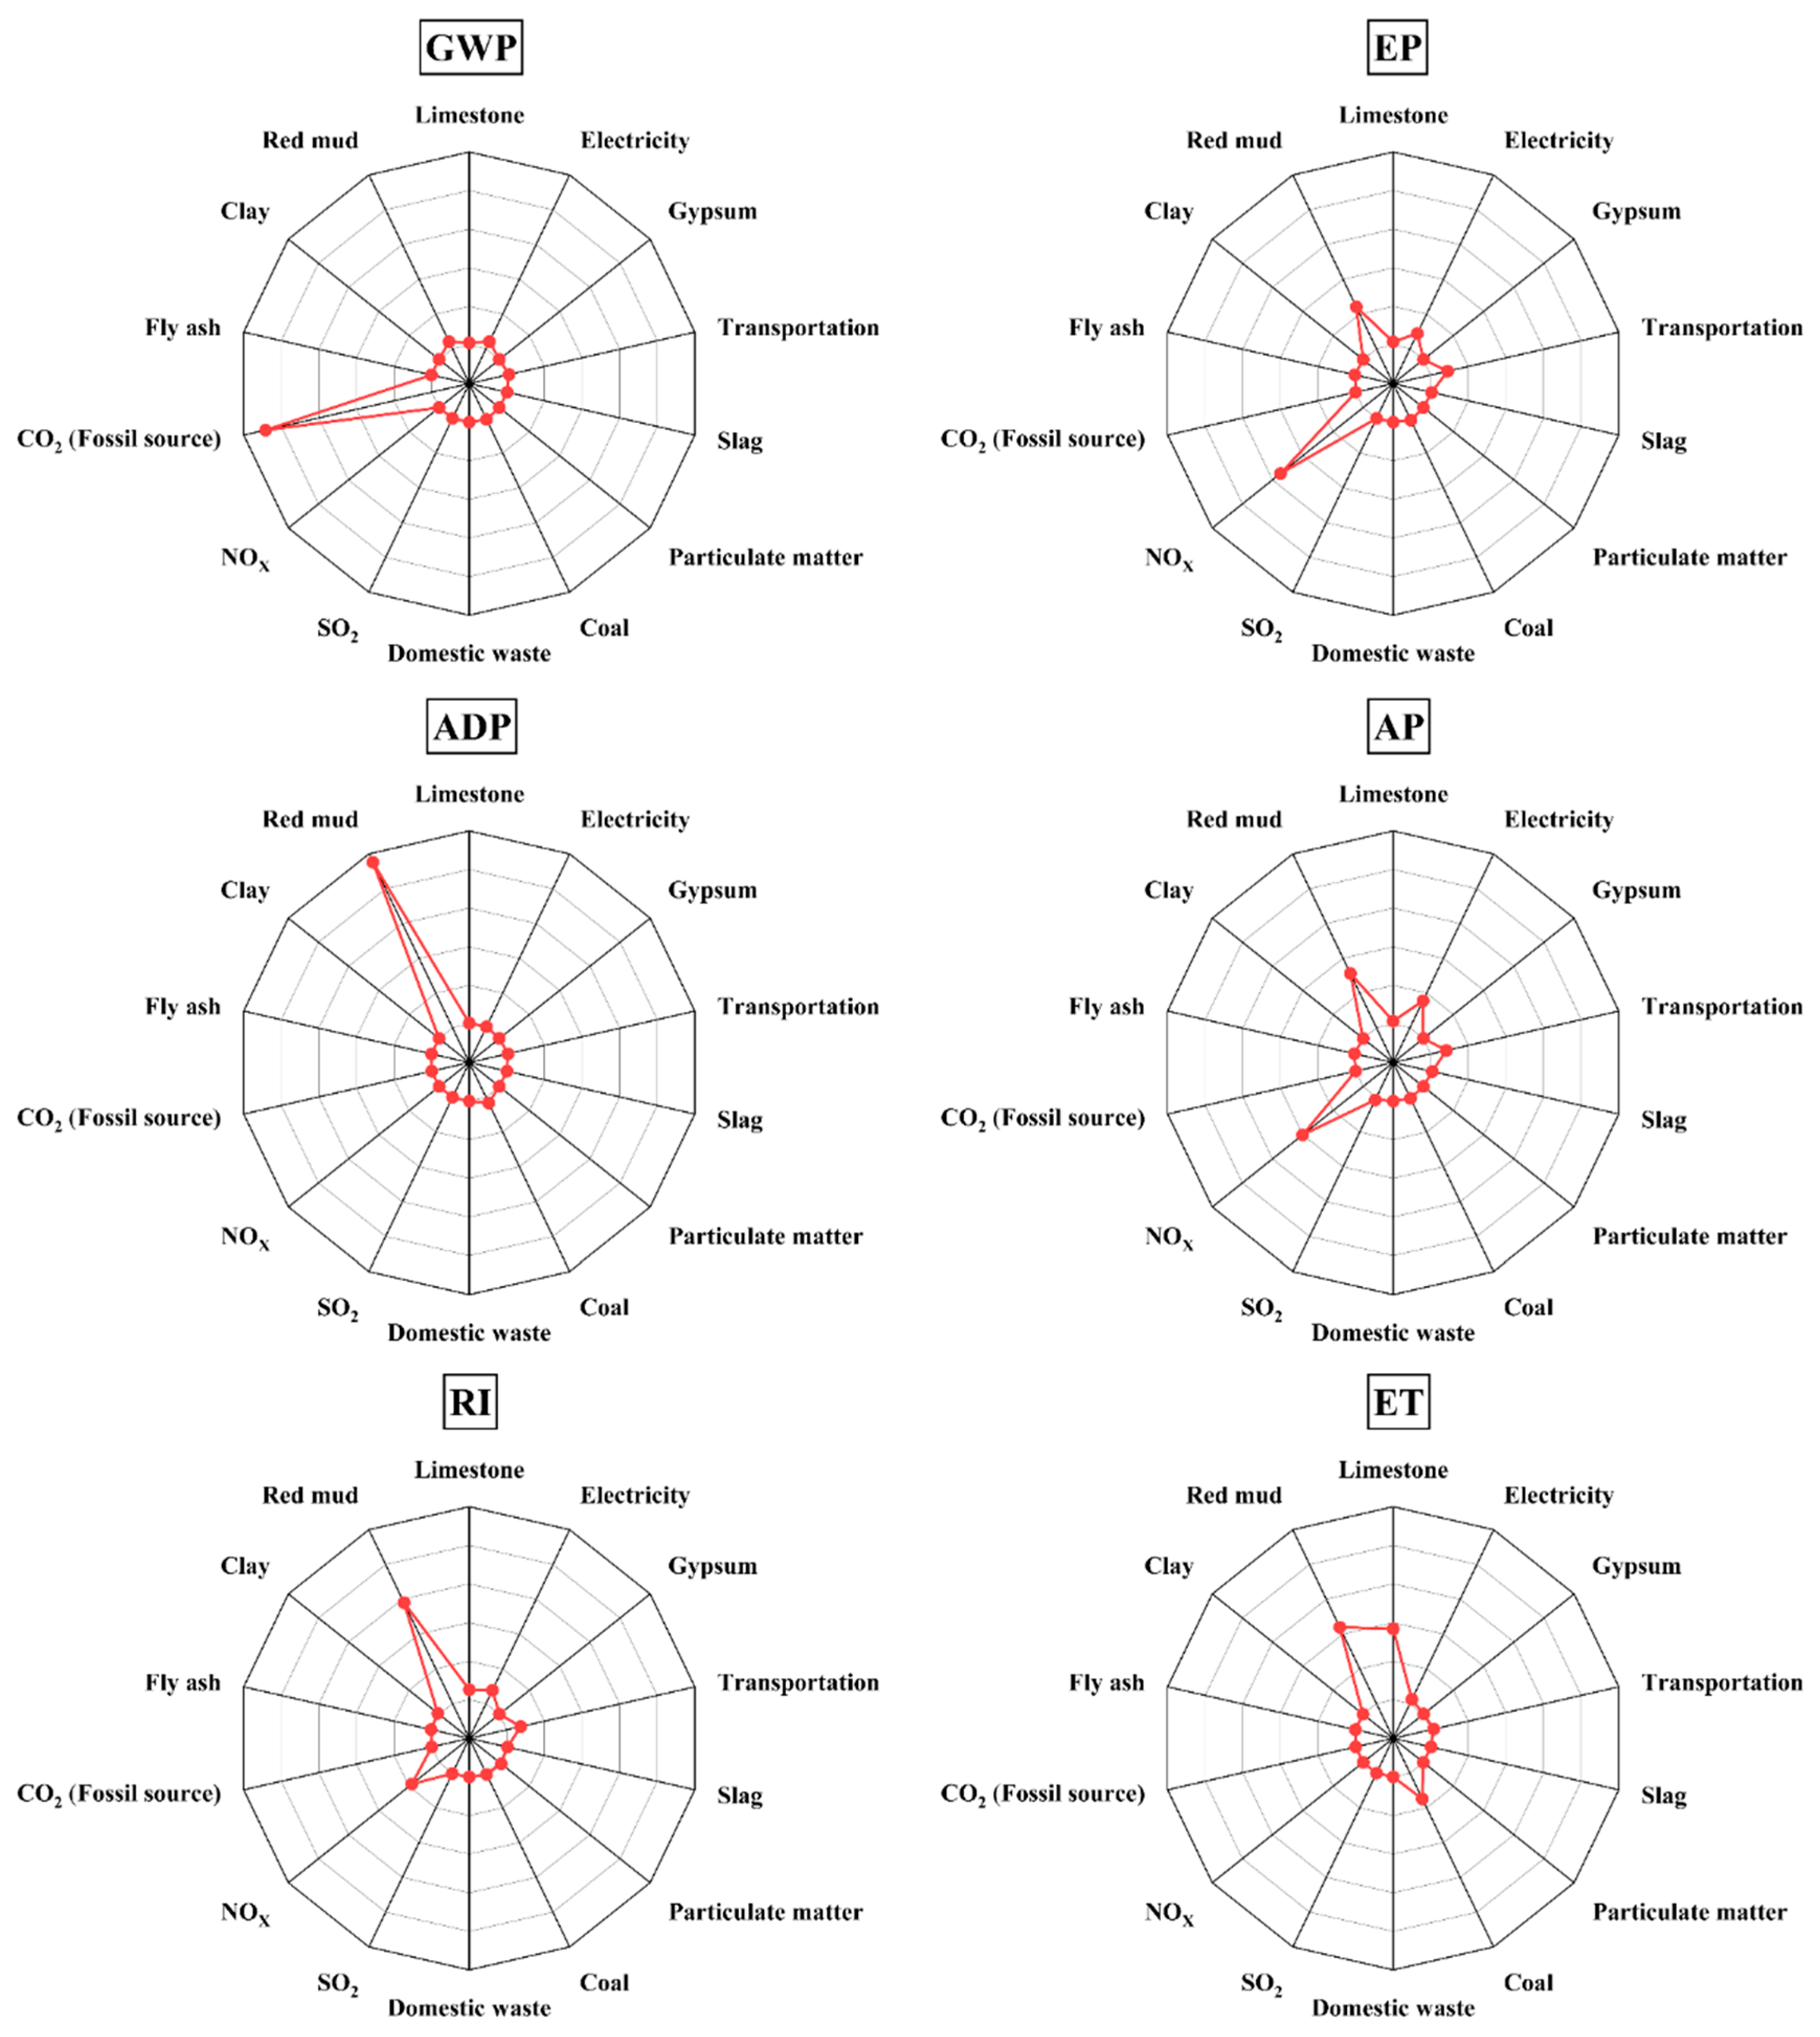
| Inventory Item | GWP | EP | ADP | AP | RI | ET |
|---|---|---|---|---|---|---|
| Limestone | 1.12% | 1.58% | 0.38% | 1.43% | 5.20% | 36.74% |
| Electricity | 4.06% | 8.89% | 0.55% | 15.55% | 7.58% | 2.36% |
| Gypsum | 0.02% | 0.04% | 0.02% | 0.03% | 0.05% | 0.24% |
| Transportation | 1.19% | 8.94% | 0.57% | 8.23% | 7.38% | 1.58% |
| Slag | 0.19% | 0.41% | 0.03% | 0.72% | 0.35% | 0.11% |
| PM (Particulate matter) | 0.00% | 0.00% | 0.00% | 0.00% | 1.20% | 0.00% |
| Coal | 0.70% | 1.02% | 3.20% | 0.64% | 0.71% | 14.88% |
| Domestic waste | 0.00% | 0.00% | 0.00% | 0.00% | 0.00% | 0.00% |
| SO2 | 0.00% | 0.00% | 0.00% | 1.39% | 0.27% | 0.00% |
| NOX | 0.00% | 54.67% | 0.00% | 40.09% | 18.03% | 0.00% |
| CO2 (Fossil source) | 88.43% | 0.00% | 0.00% | 0.00% | 0.00% | 0.00% |
| Fly ash | 0.18% | 0.40% | 0.03% | 0.69% | 0.34% | 0.11% |
| Clay | 0.06% | 0.01% | 0.07% | 0.01% | 0.80% | 0.09% |
| Red mud | 4.05% | 24.04% | 95.16% | 31.22% | 58.10% | 43.89% |
| Lable | GWP | EP | ADP | AP | RI | ET |
| Case 5 | 6.750 × 10² | 6.396 × 10⁻² | 6.648 × 10⁻⁴ | 4.328 × 10⁻¹ | 0.686 × 10⁻¹ | 13.419 |
Disclaimer/Publisher’s Note: The statements, opinions and data contained in all publications are solely those of the individual author(s) and contributor(s) and not of MDPI and/or the editor(s). MDPI and/or the editor(s) disclaim responsibility for any injury to people or property resulting from any ideas, methods, instructions or products referred to in the content. |
© 2025 by the authors. Licensee MDPI, Basel, Switzerland. This article is an open access article distributed under the terms and conditions of the Creative Commons Attribution (CC BY) license (https://creativecommons.org/licenses/by/4.0/).
Share and Cite
Li, Z.; Chen, X.; She, A.; Guo, X.; Qian, C. Adjusting LCA Allocation Methods for Cement Industry: A Production-Based Approach to Energy Conservation and Emission Reduction. Materials 2025, 18, 2483. https://doi.org/10.3390/ma18112483
Li Z, Chen X, She A, Guo X, Qian C. Adjusting LCA Allocation Methods for Cement Industry: A Production-Based Approach to Energy Conservation and Emission Reduction. Materials. 2025; 18(11):2483. https://doi.org/10.3390/ma18112483
Chicago/Turabian StyleLi, Zhengze, Xuan Chen, Anming She, Xiaolu Guo, and Chunxiang Qian. 2025. "Adjusting LCA Allocation Methods for Cement Industry: A Production-Based Approach to Energy Conservation and Emission Reduction" Materials 18, no. 11: 2483. https://doi.org/10.3390/ma18112483
APA StyleLi, Z., Chen, X., She, A., Guo, X., & Qian, C. (2025). Adjusting LCA Allocation Methods for Cement Industry: A Production-Based Approach to Energy Conservation and Emission Reduction. Materials, 18(11), 2483. https://doi.org/10.3390/ma18112483