
Strength Development and Microscopic Characterization of Slag-like Powder Materials Activated by Sodium Carbonate and Sodium Hydroxide

Abstract
1. Introduction
2. Experimental Program
2.1. Materials
2.2. SP Preparation
2.3. Mix Ratio Design
2.4. Methodology
2.4.1. Compressive Strength Determination
2.4.2. Microscopic Analyses
3. Results and Discussion
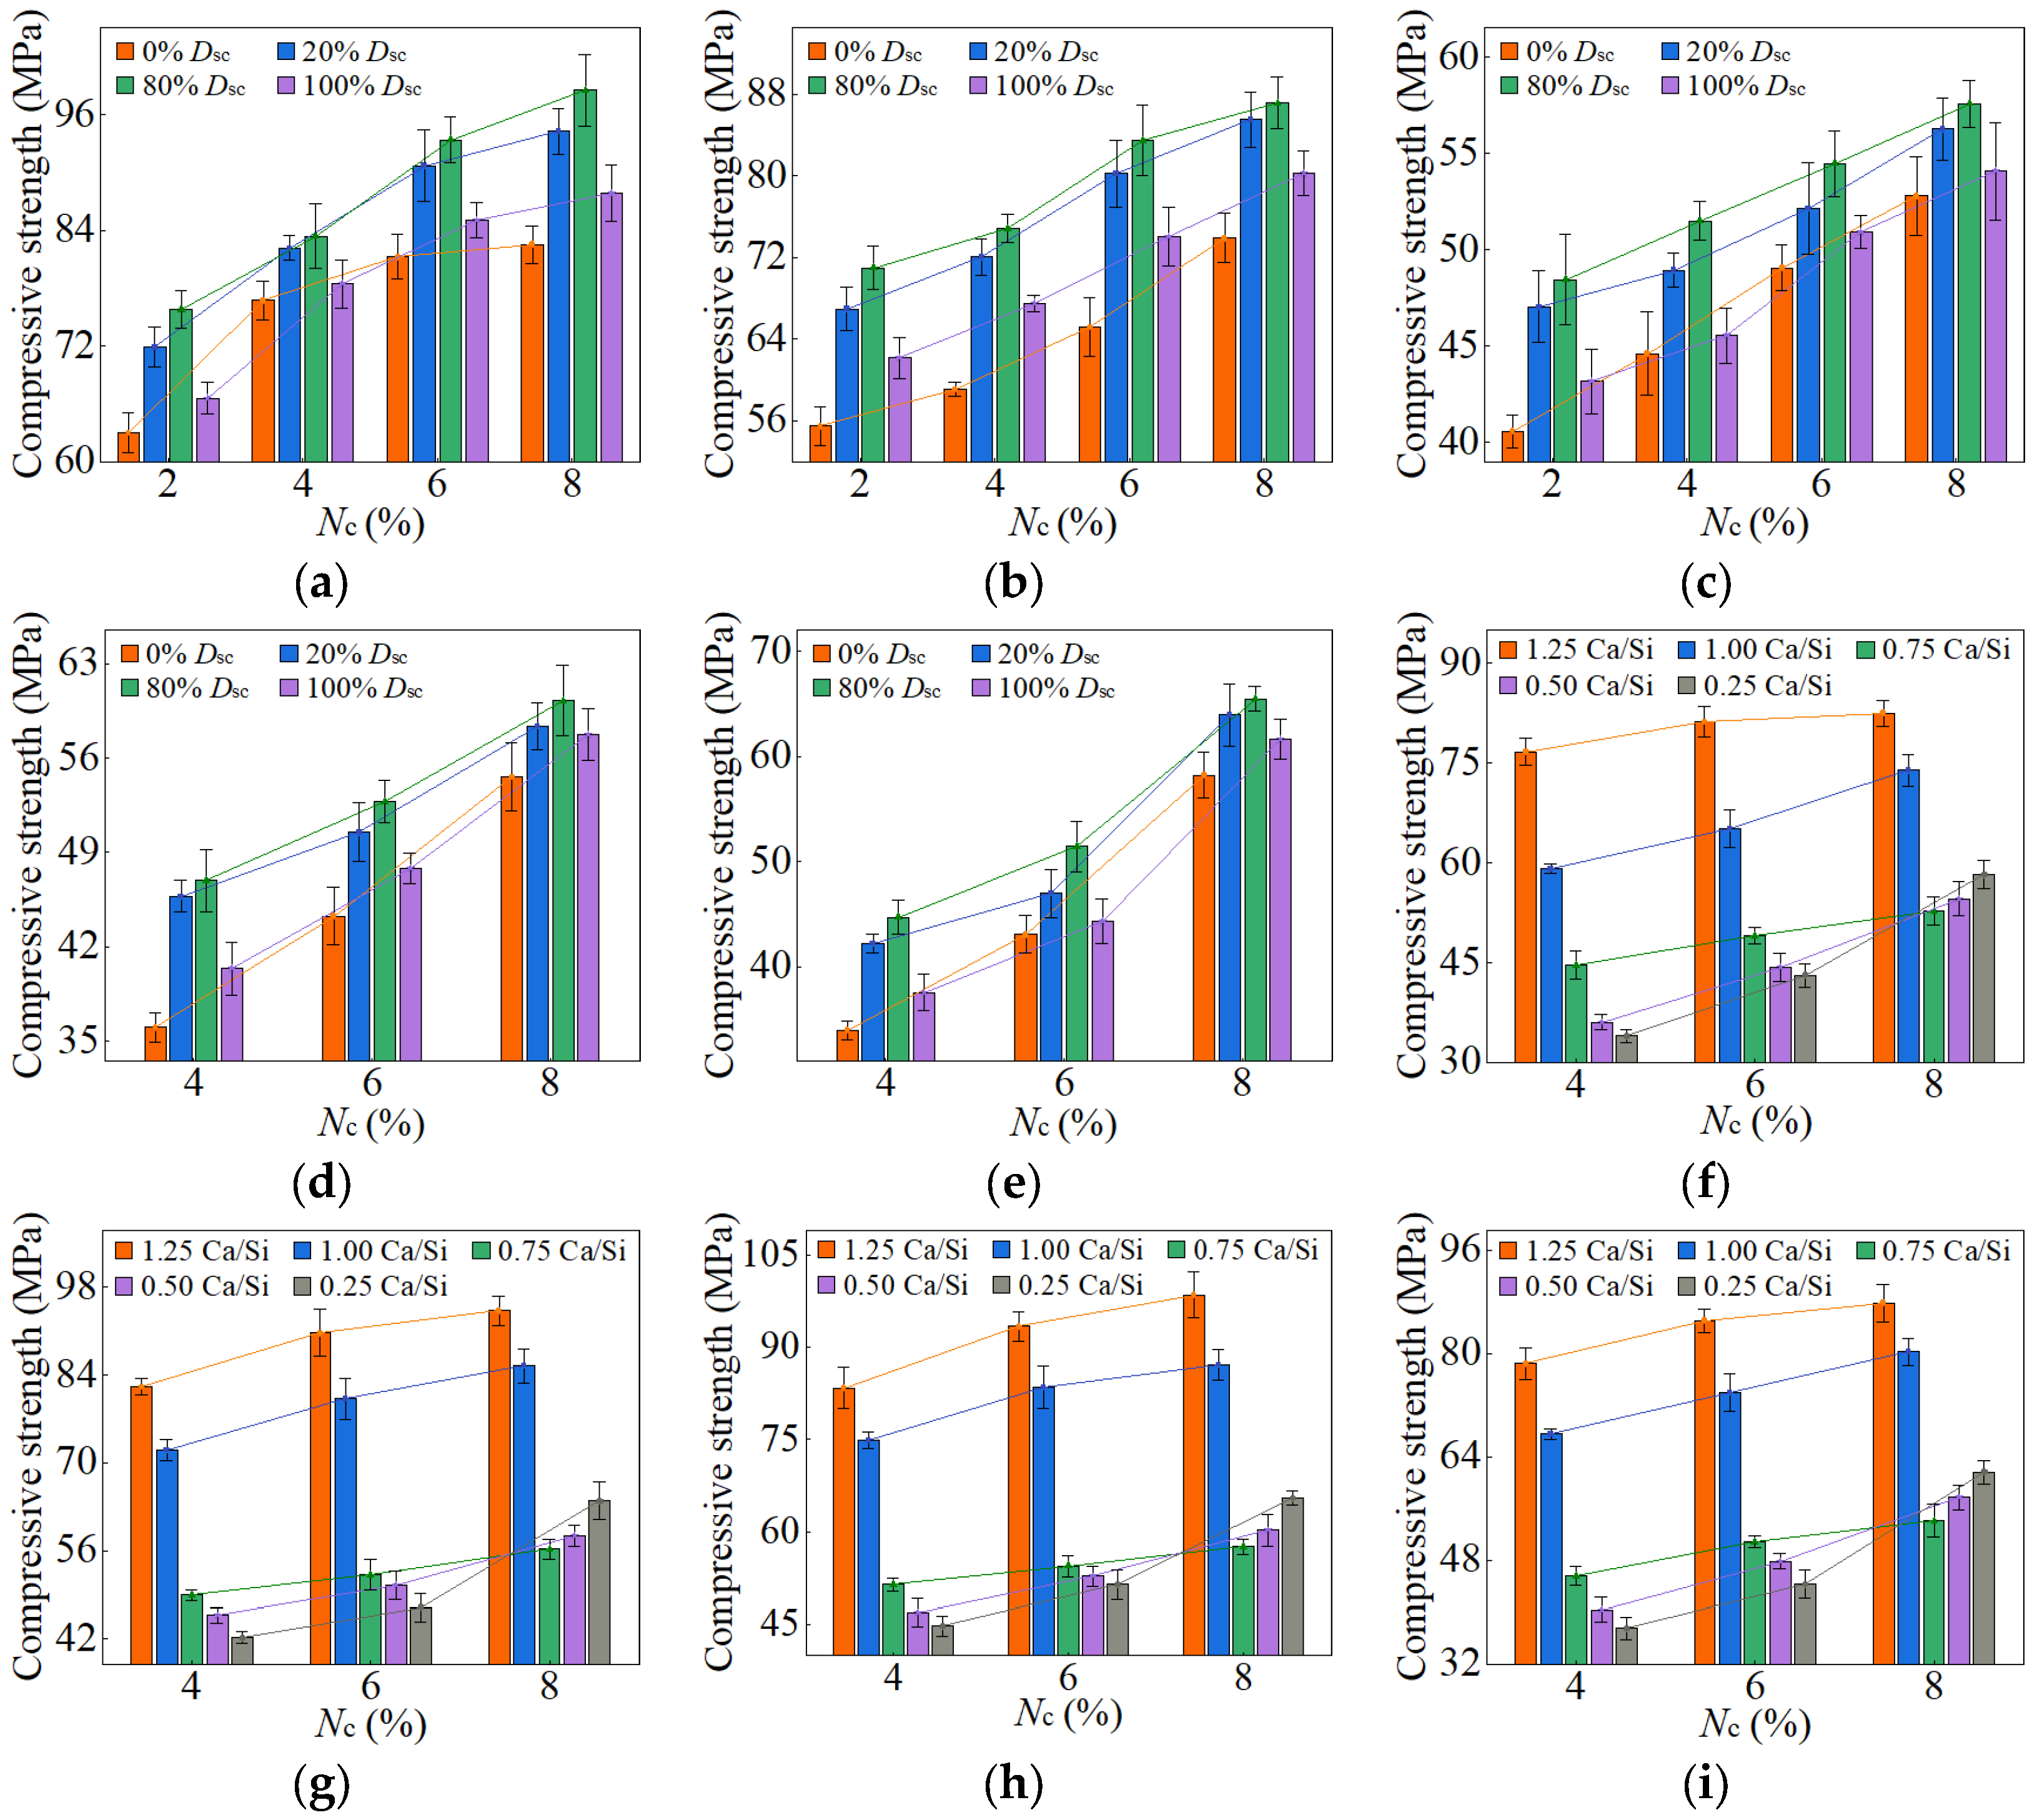
3.1. Compressive Strength Development
3.1.1. Effect of Dsc on Strength
3.1.2. Effect of Nc on Strength
3.1.3. Effect of Ca/Si Ratio on Strength
3.1.4. Optimum Mix Ratio
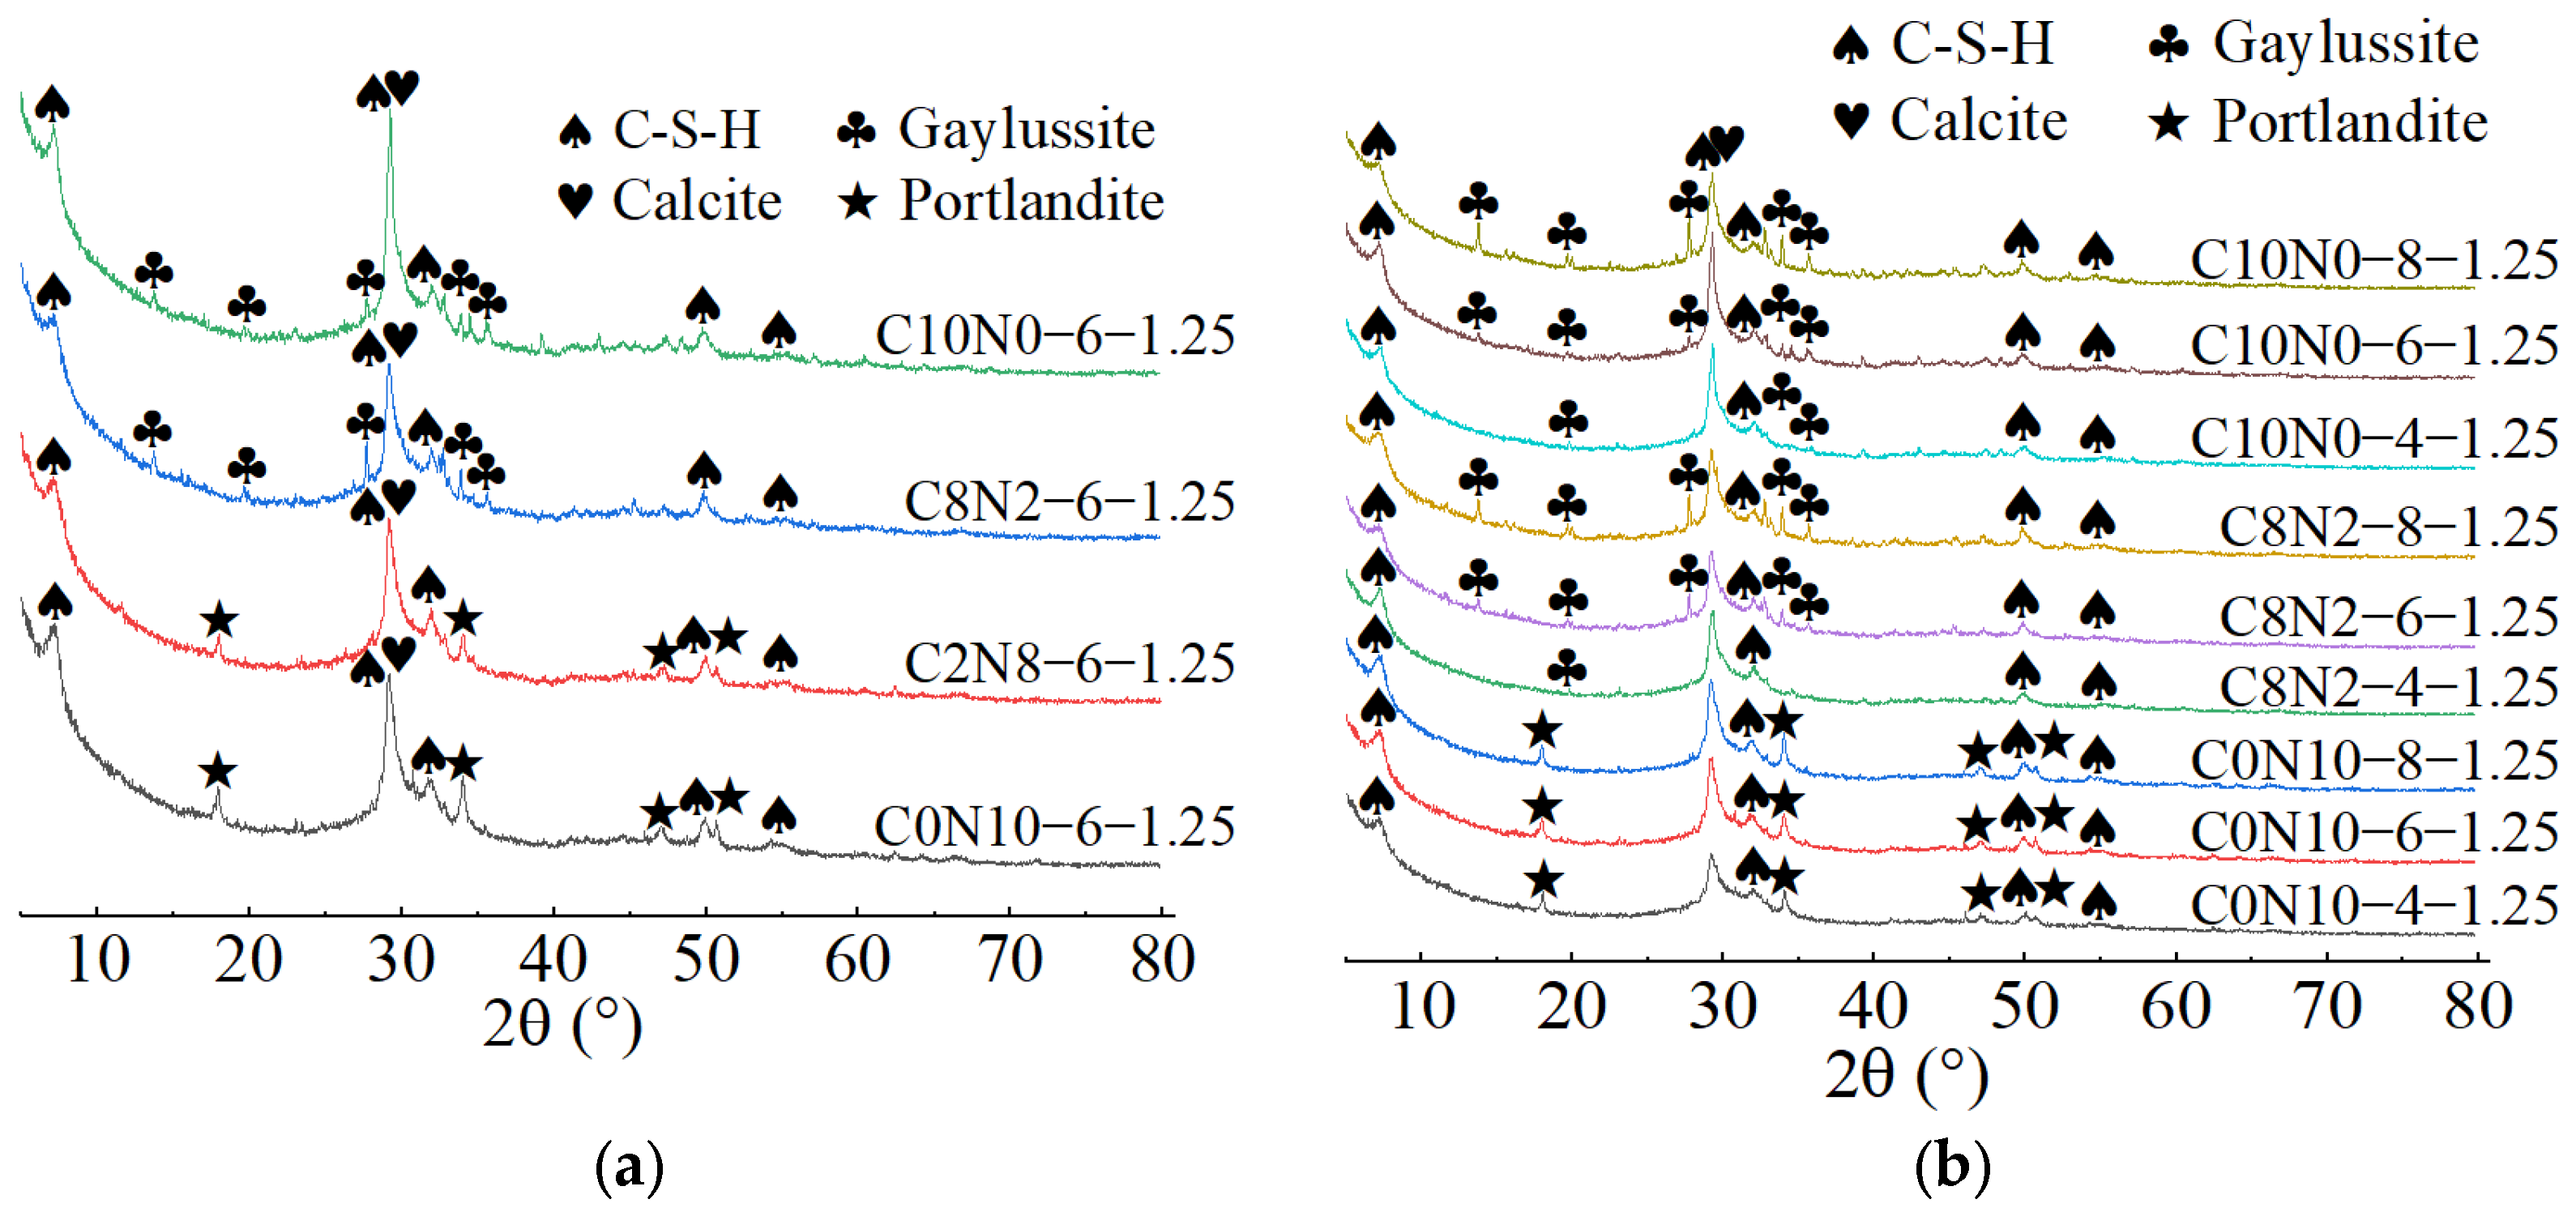
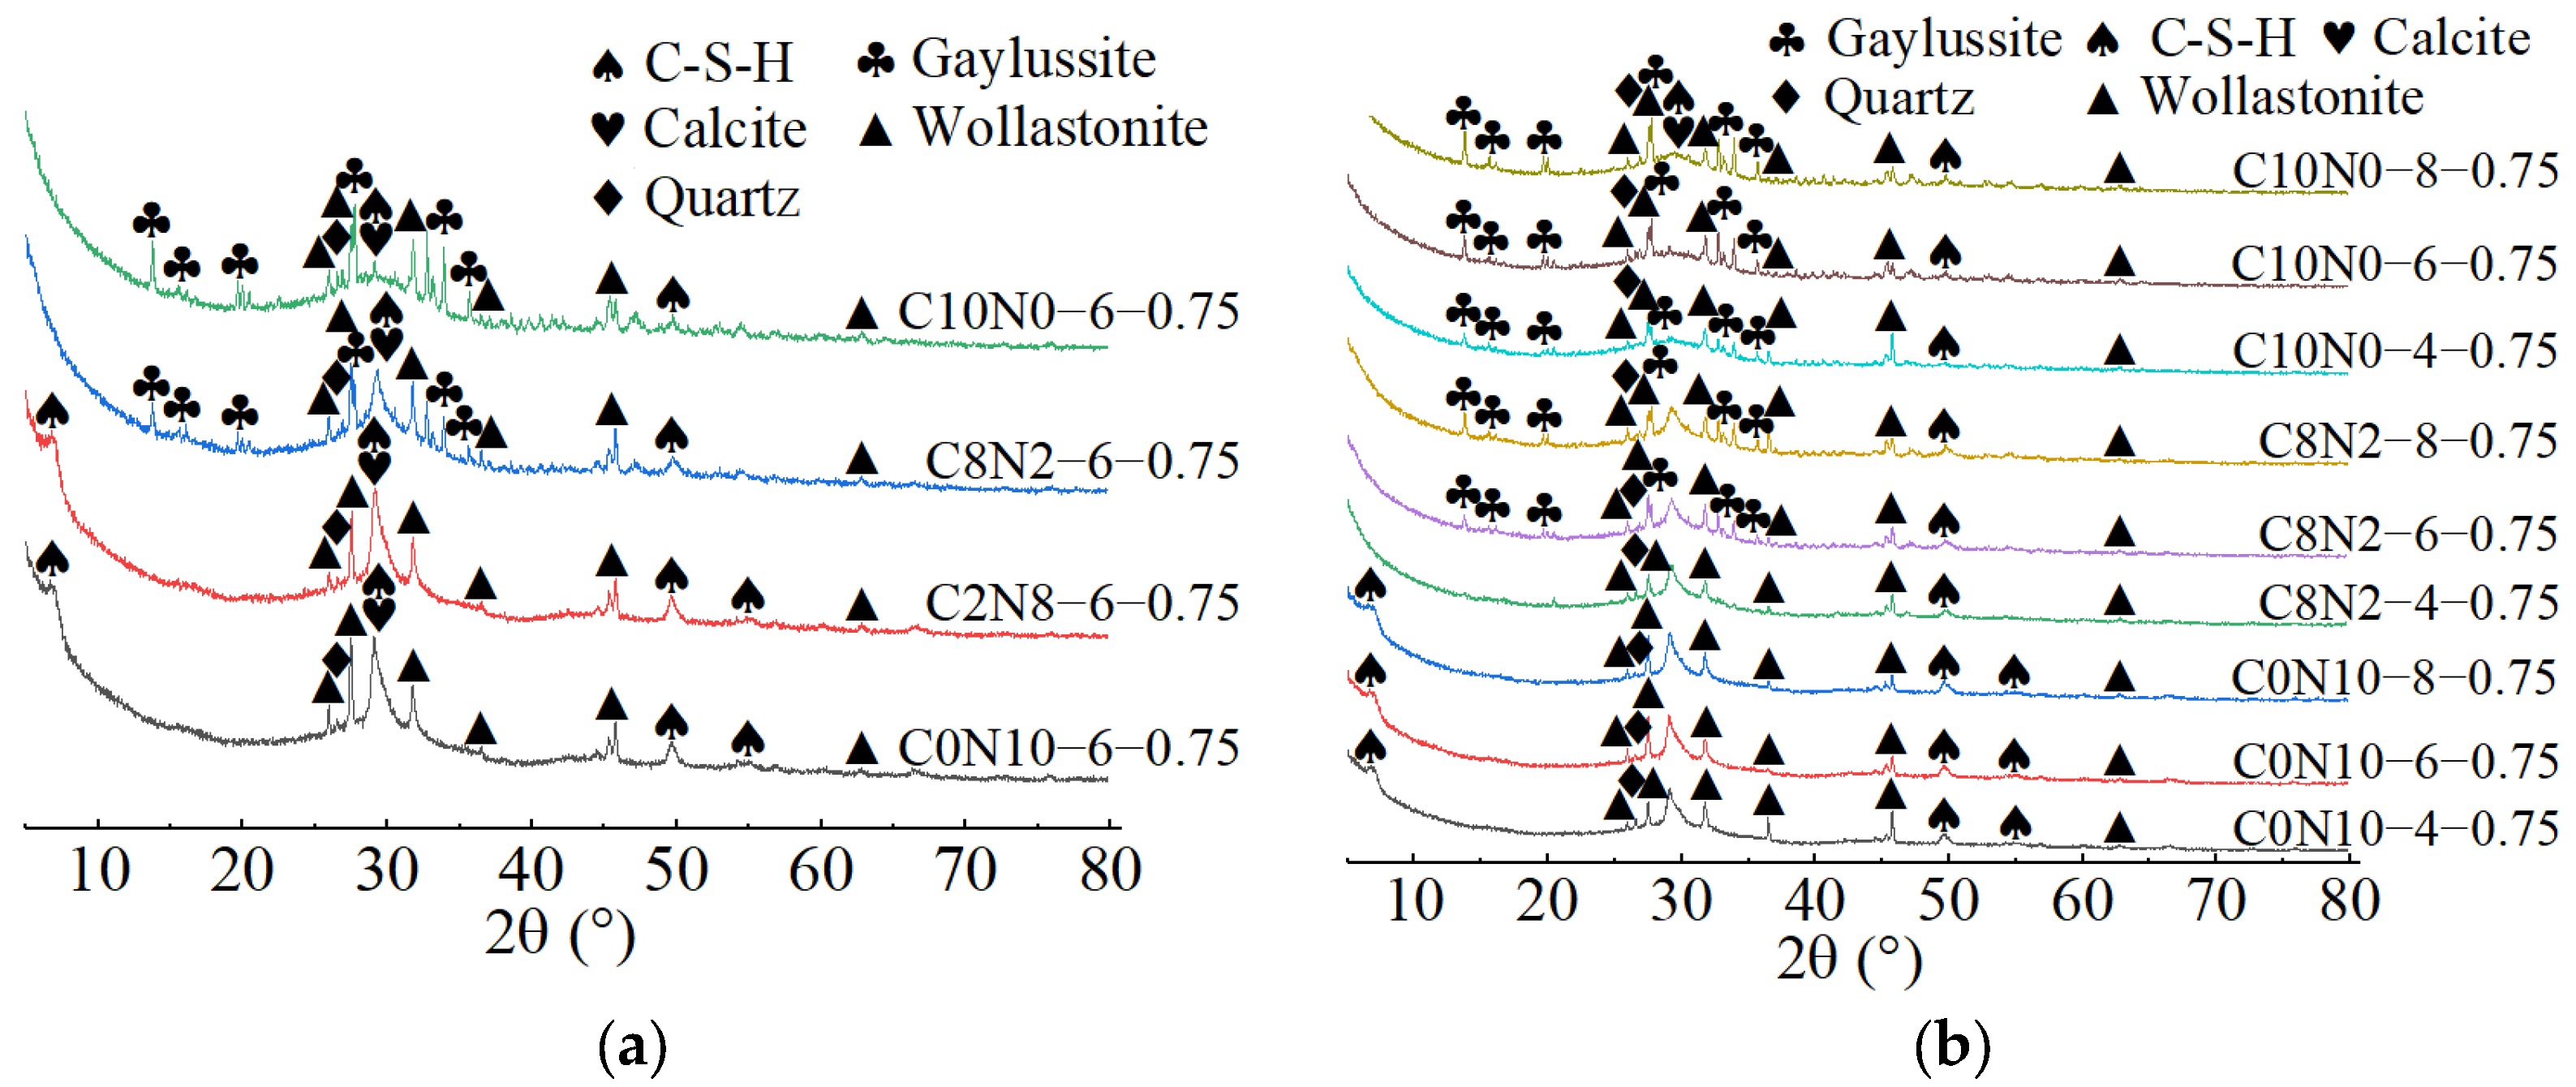
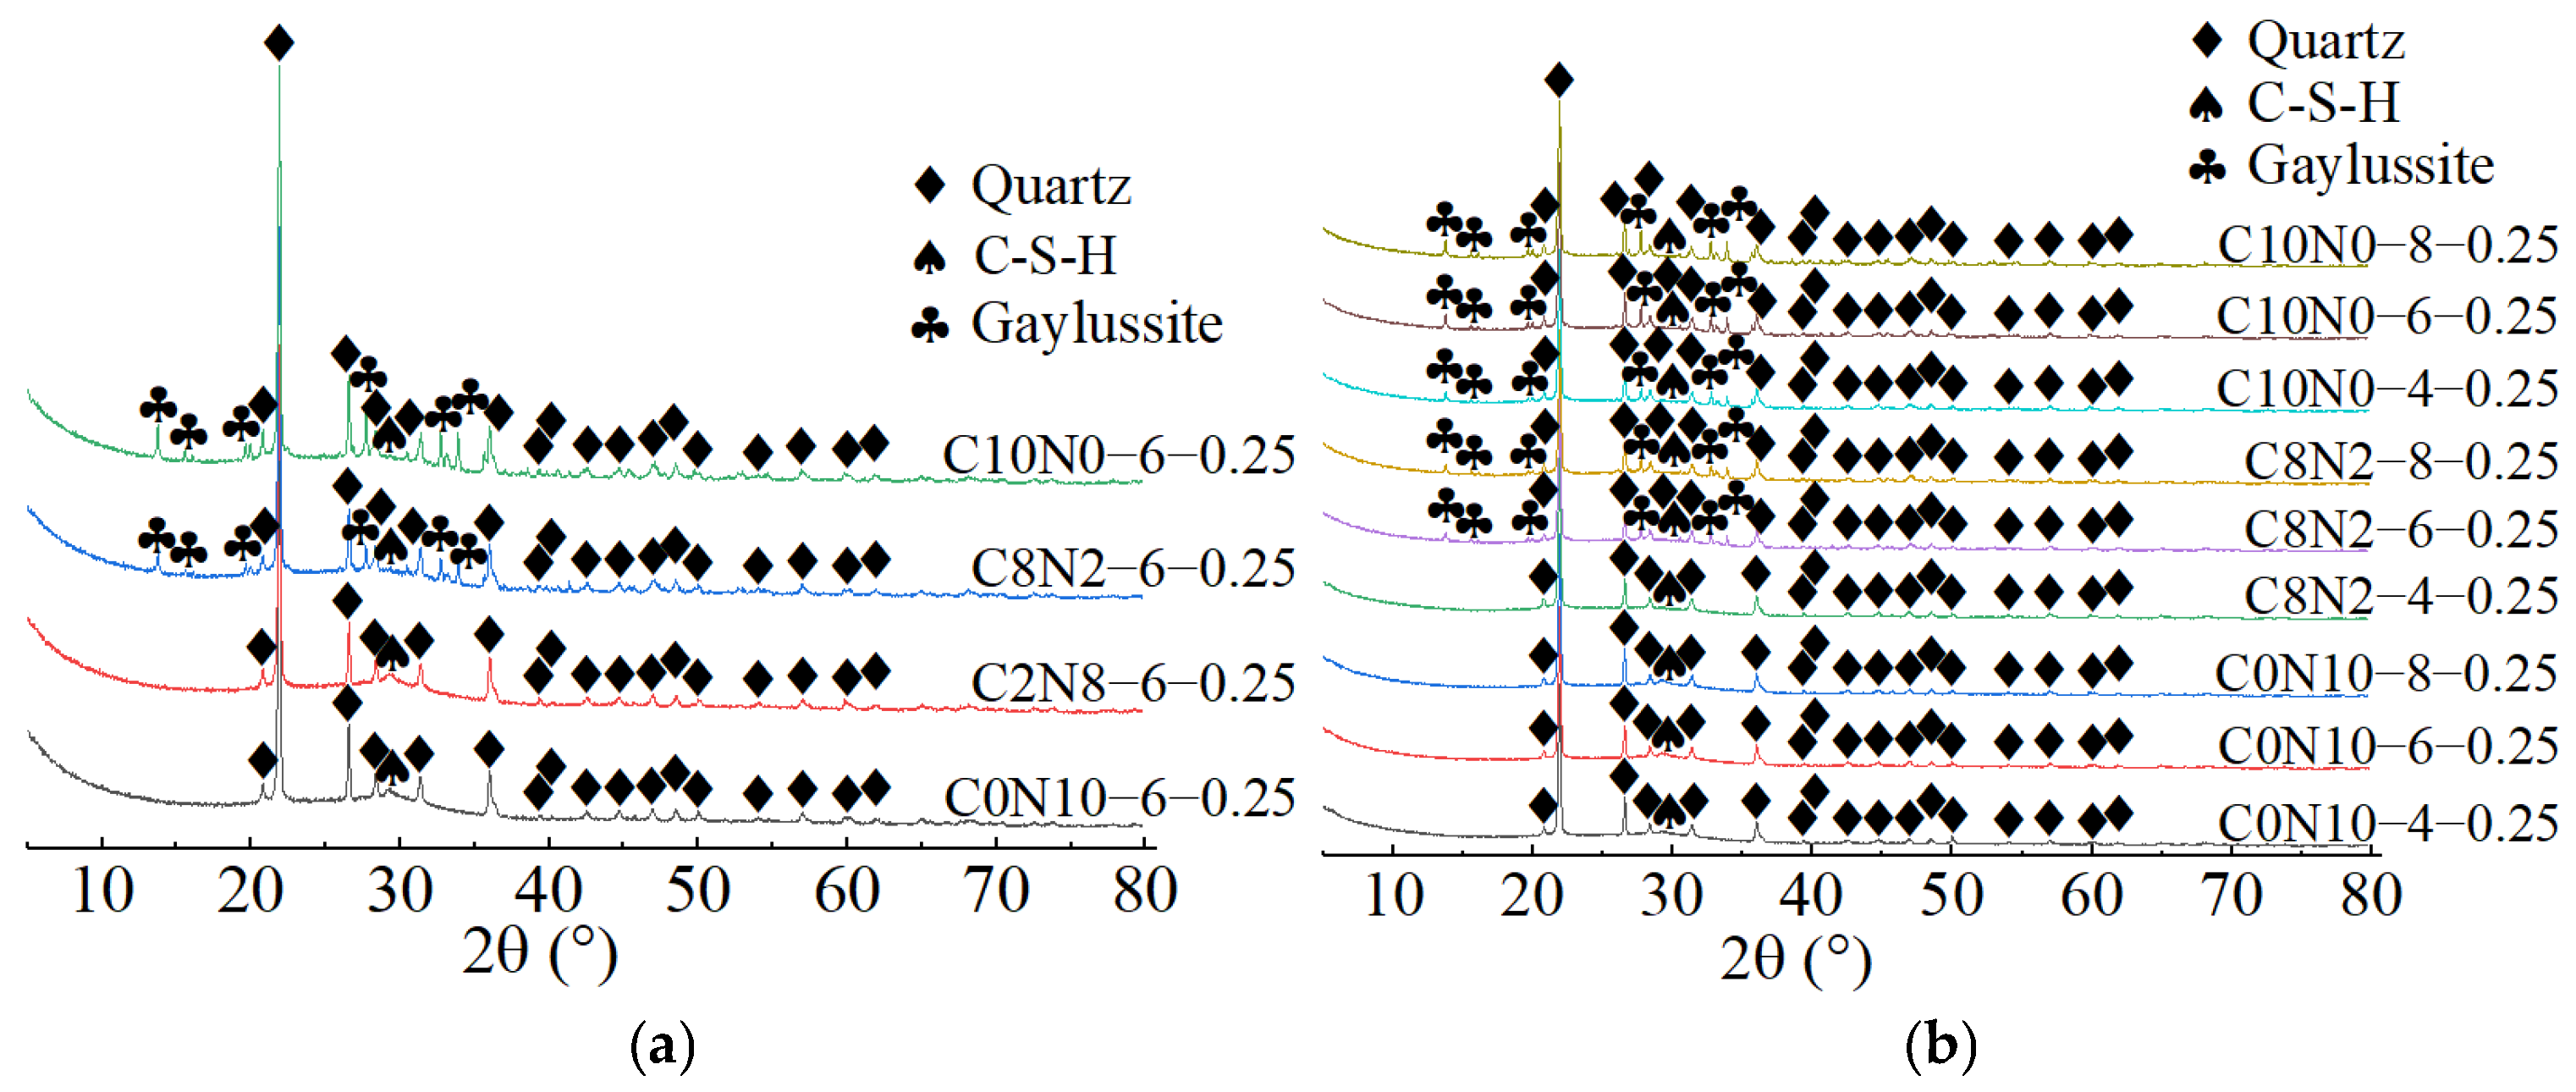
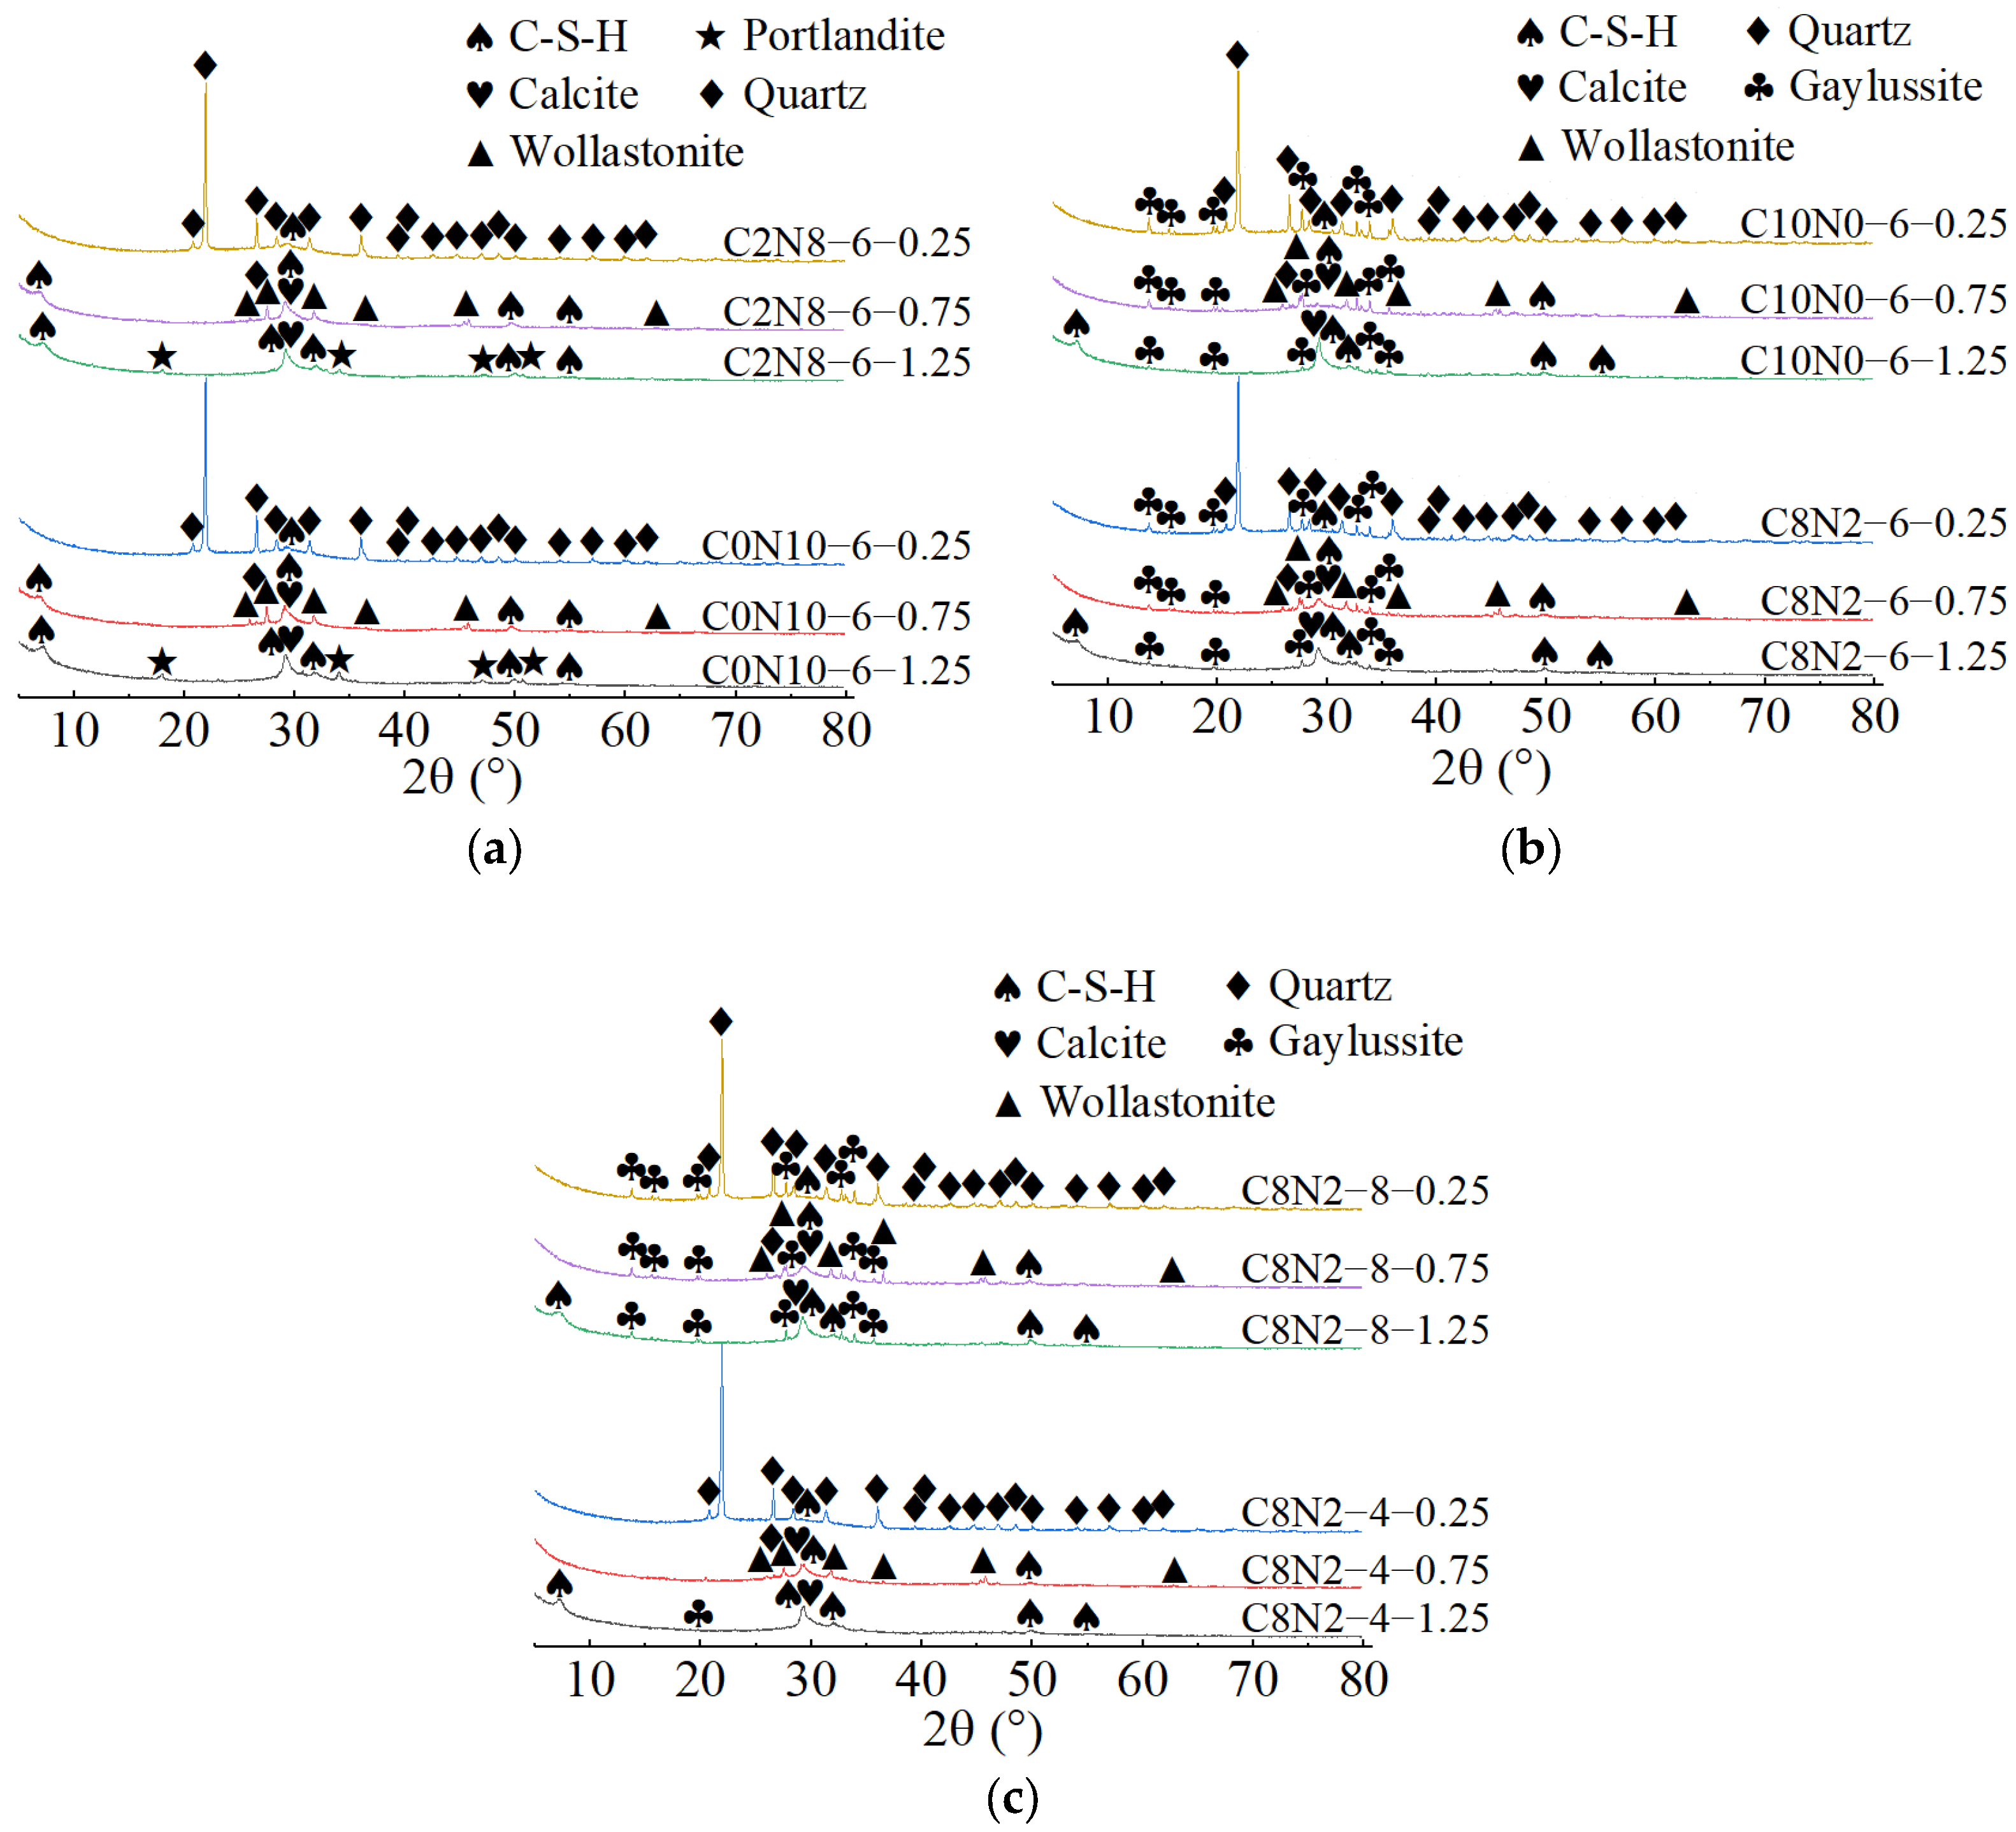
3.2. XRD for Phase Composition Analysis
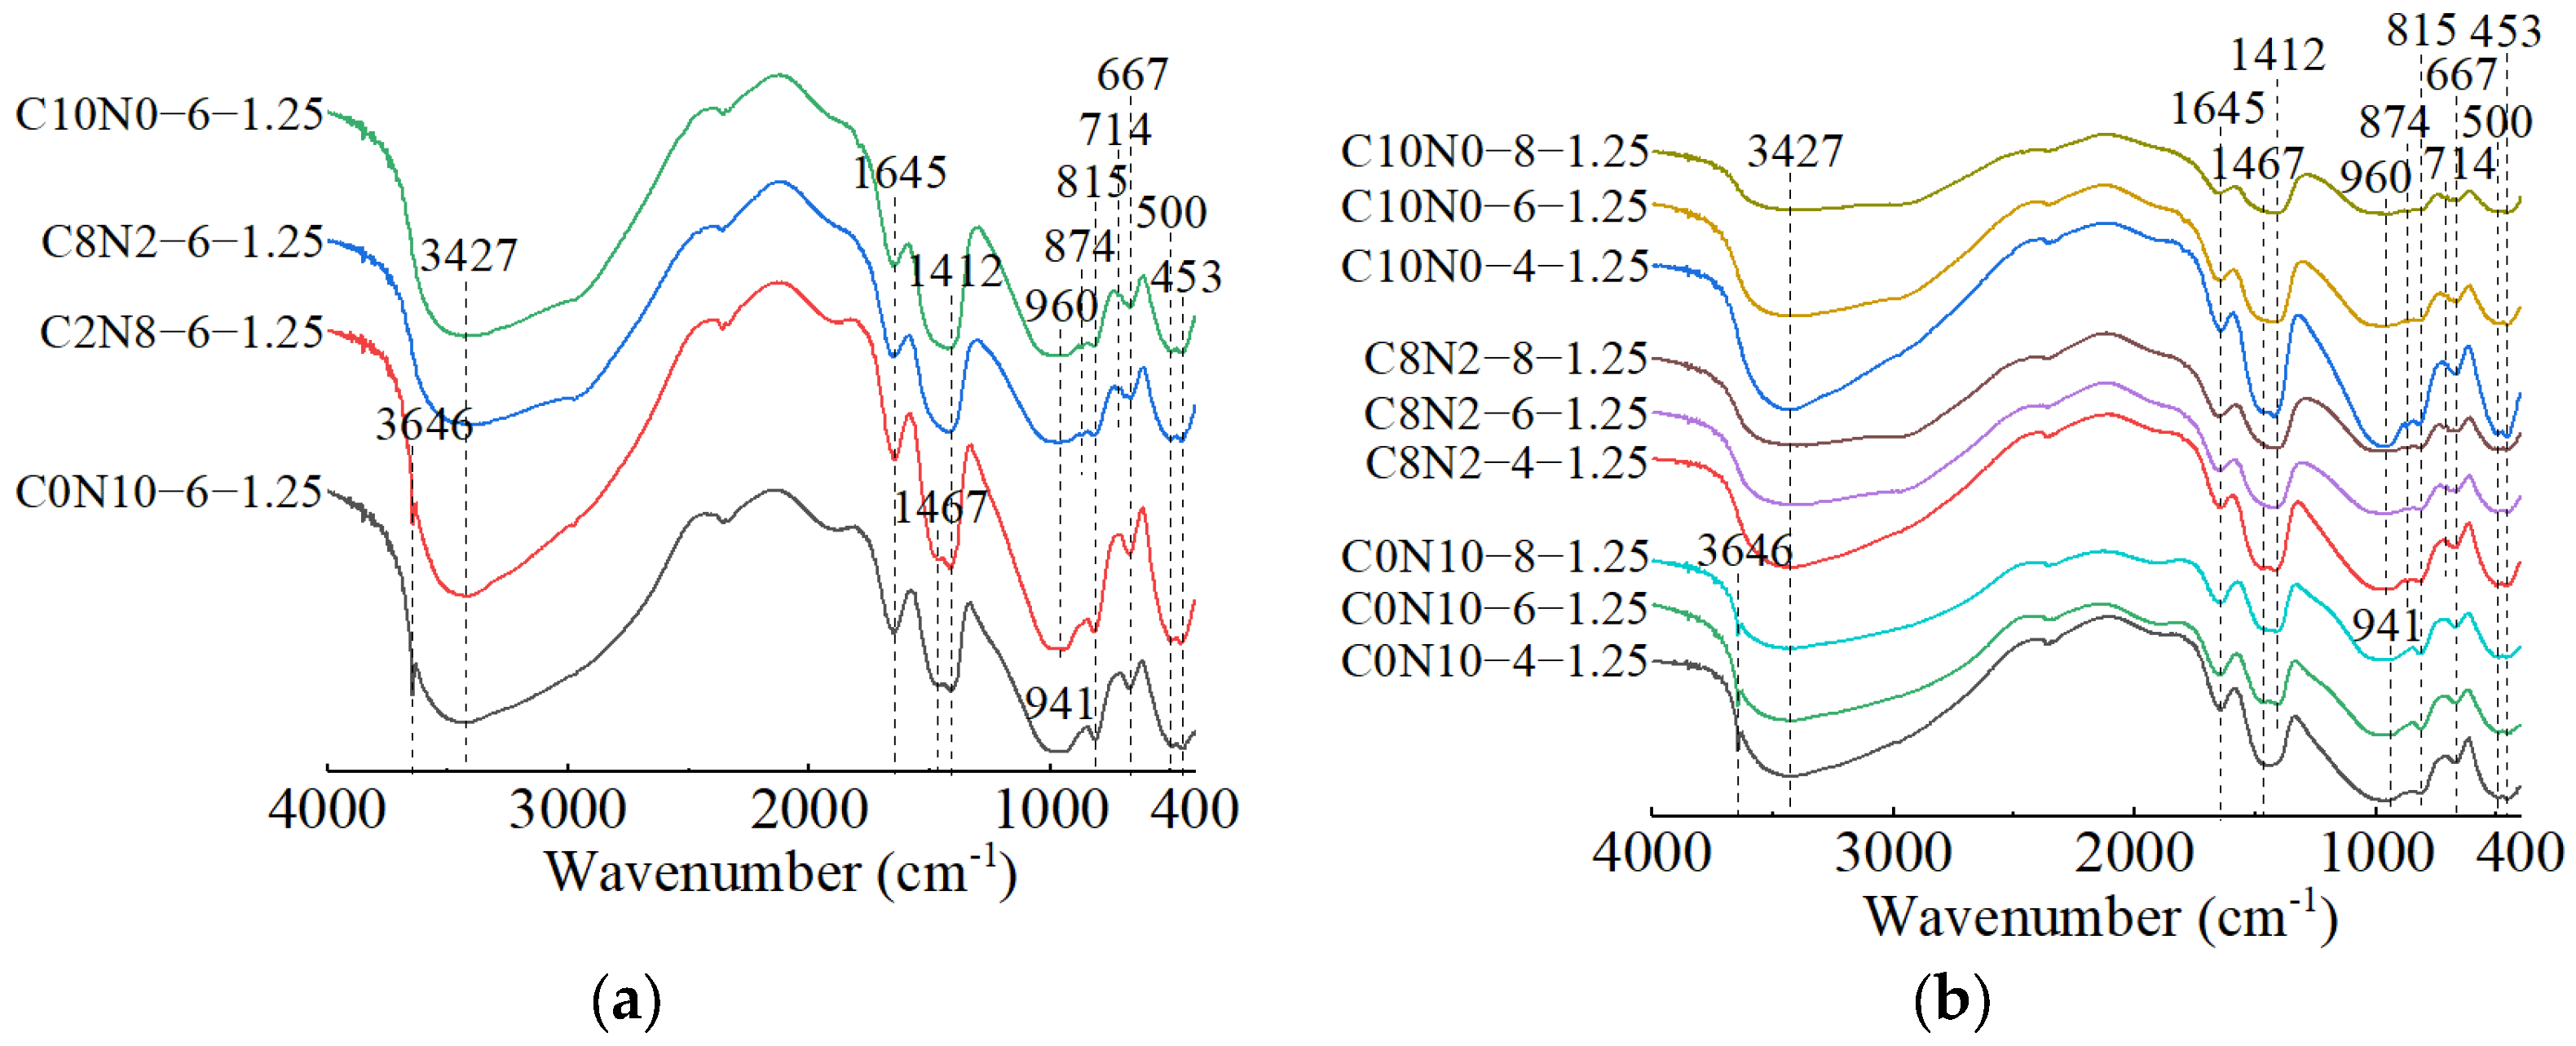
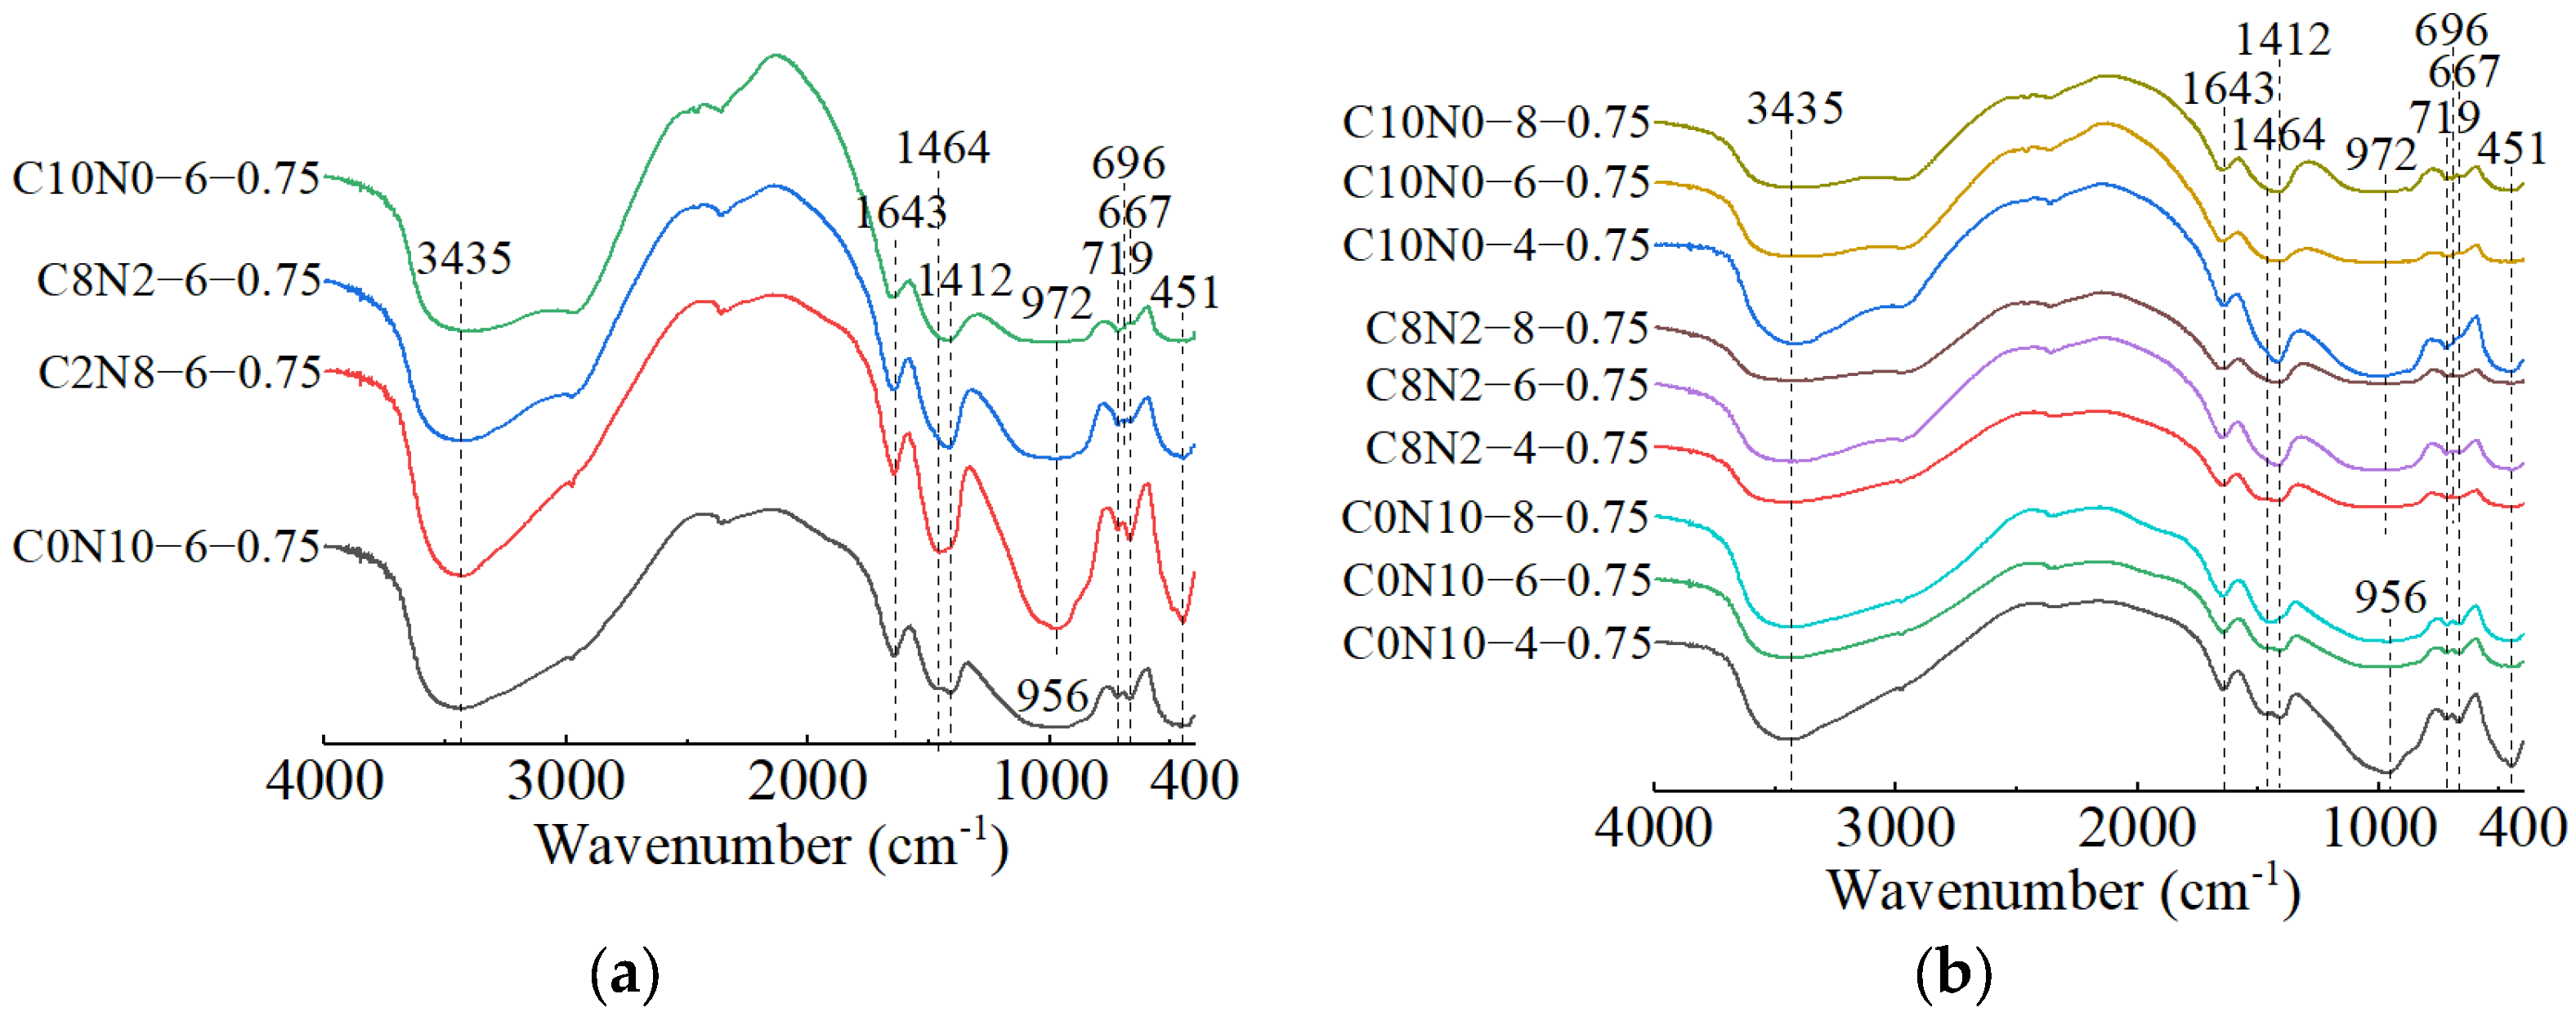
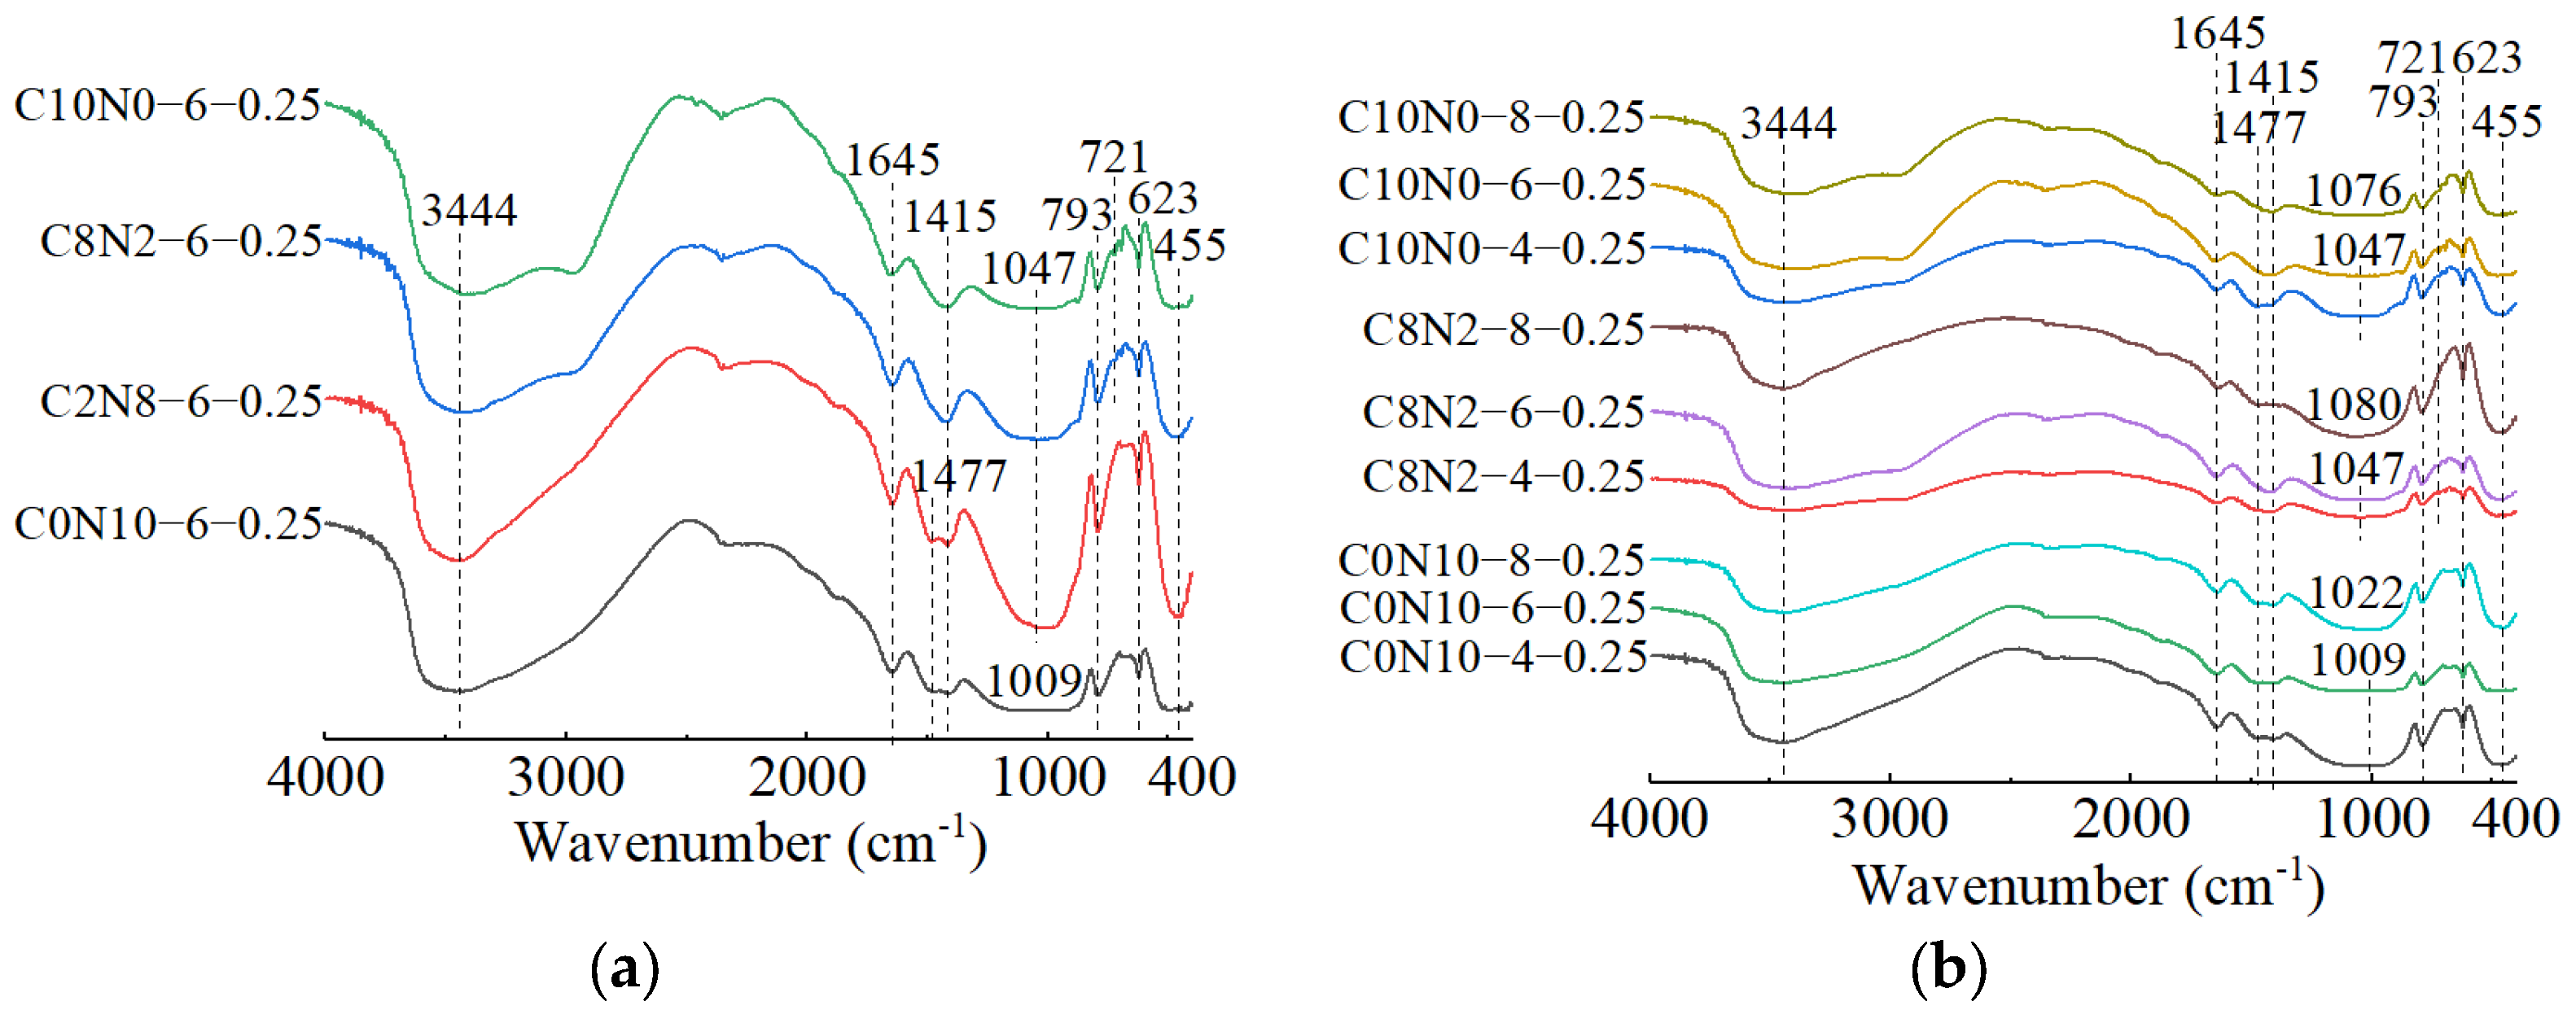
3.3. FT-IR for Chemical Group Analysis
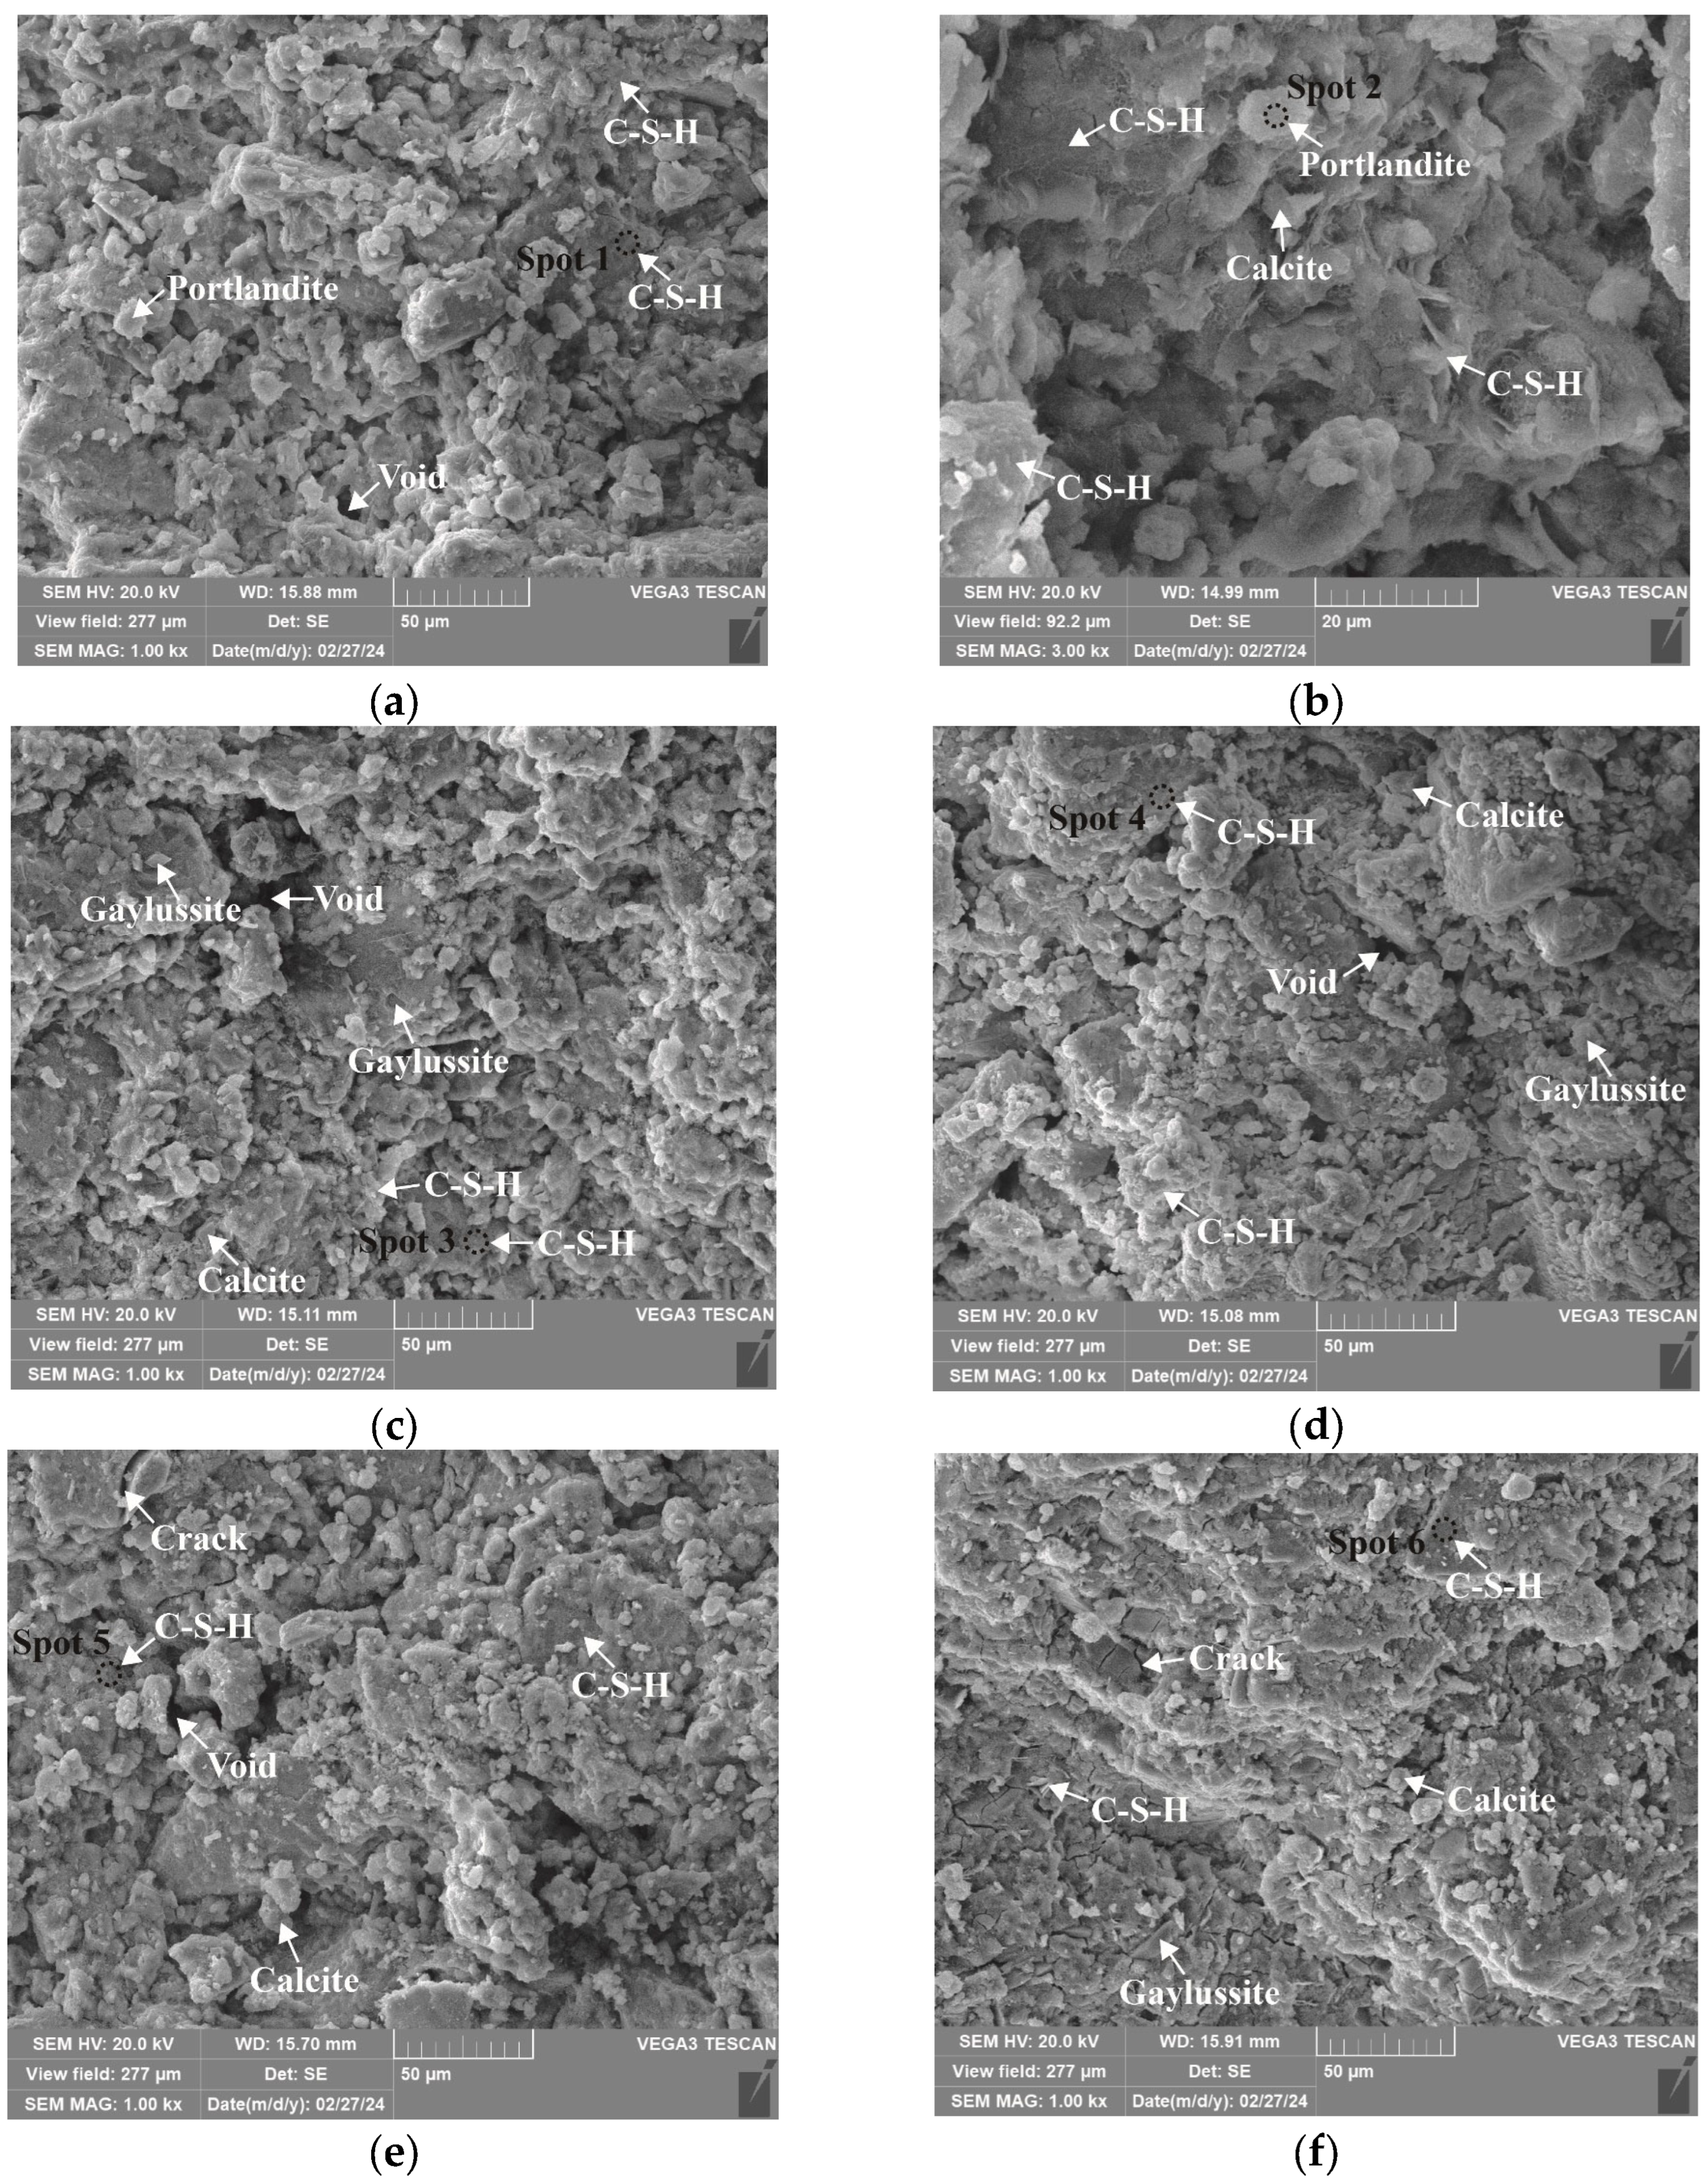
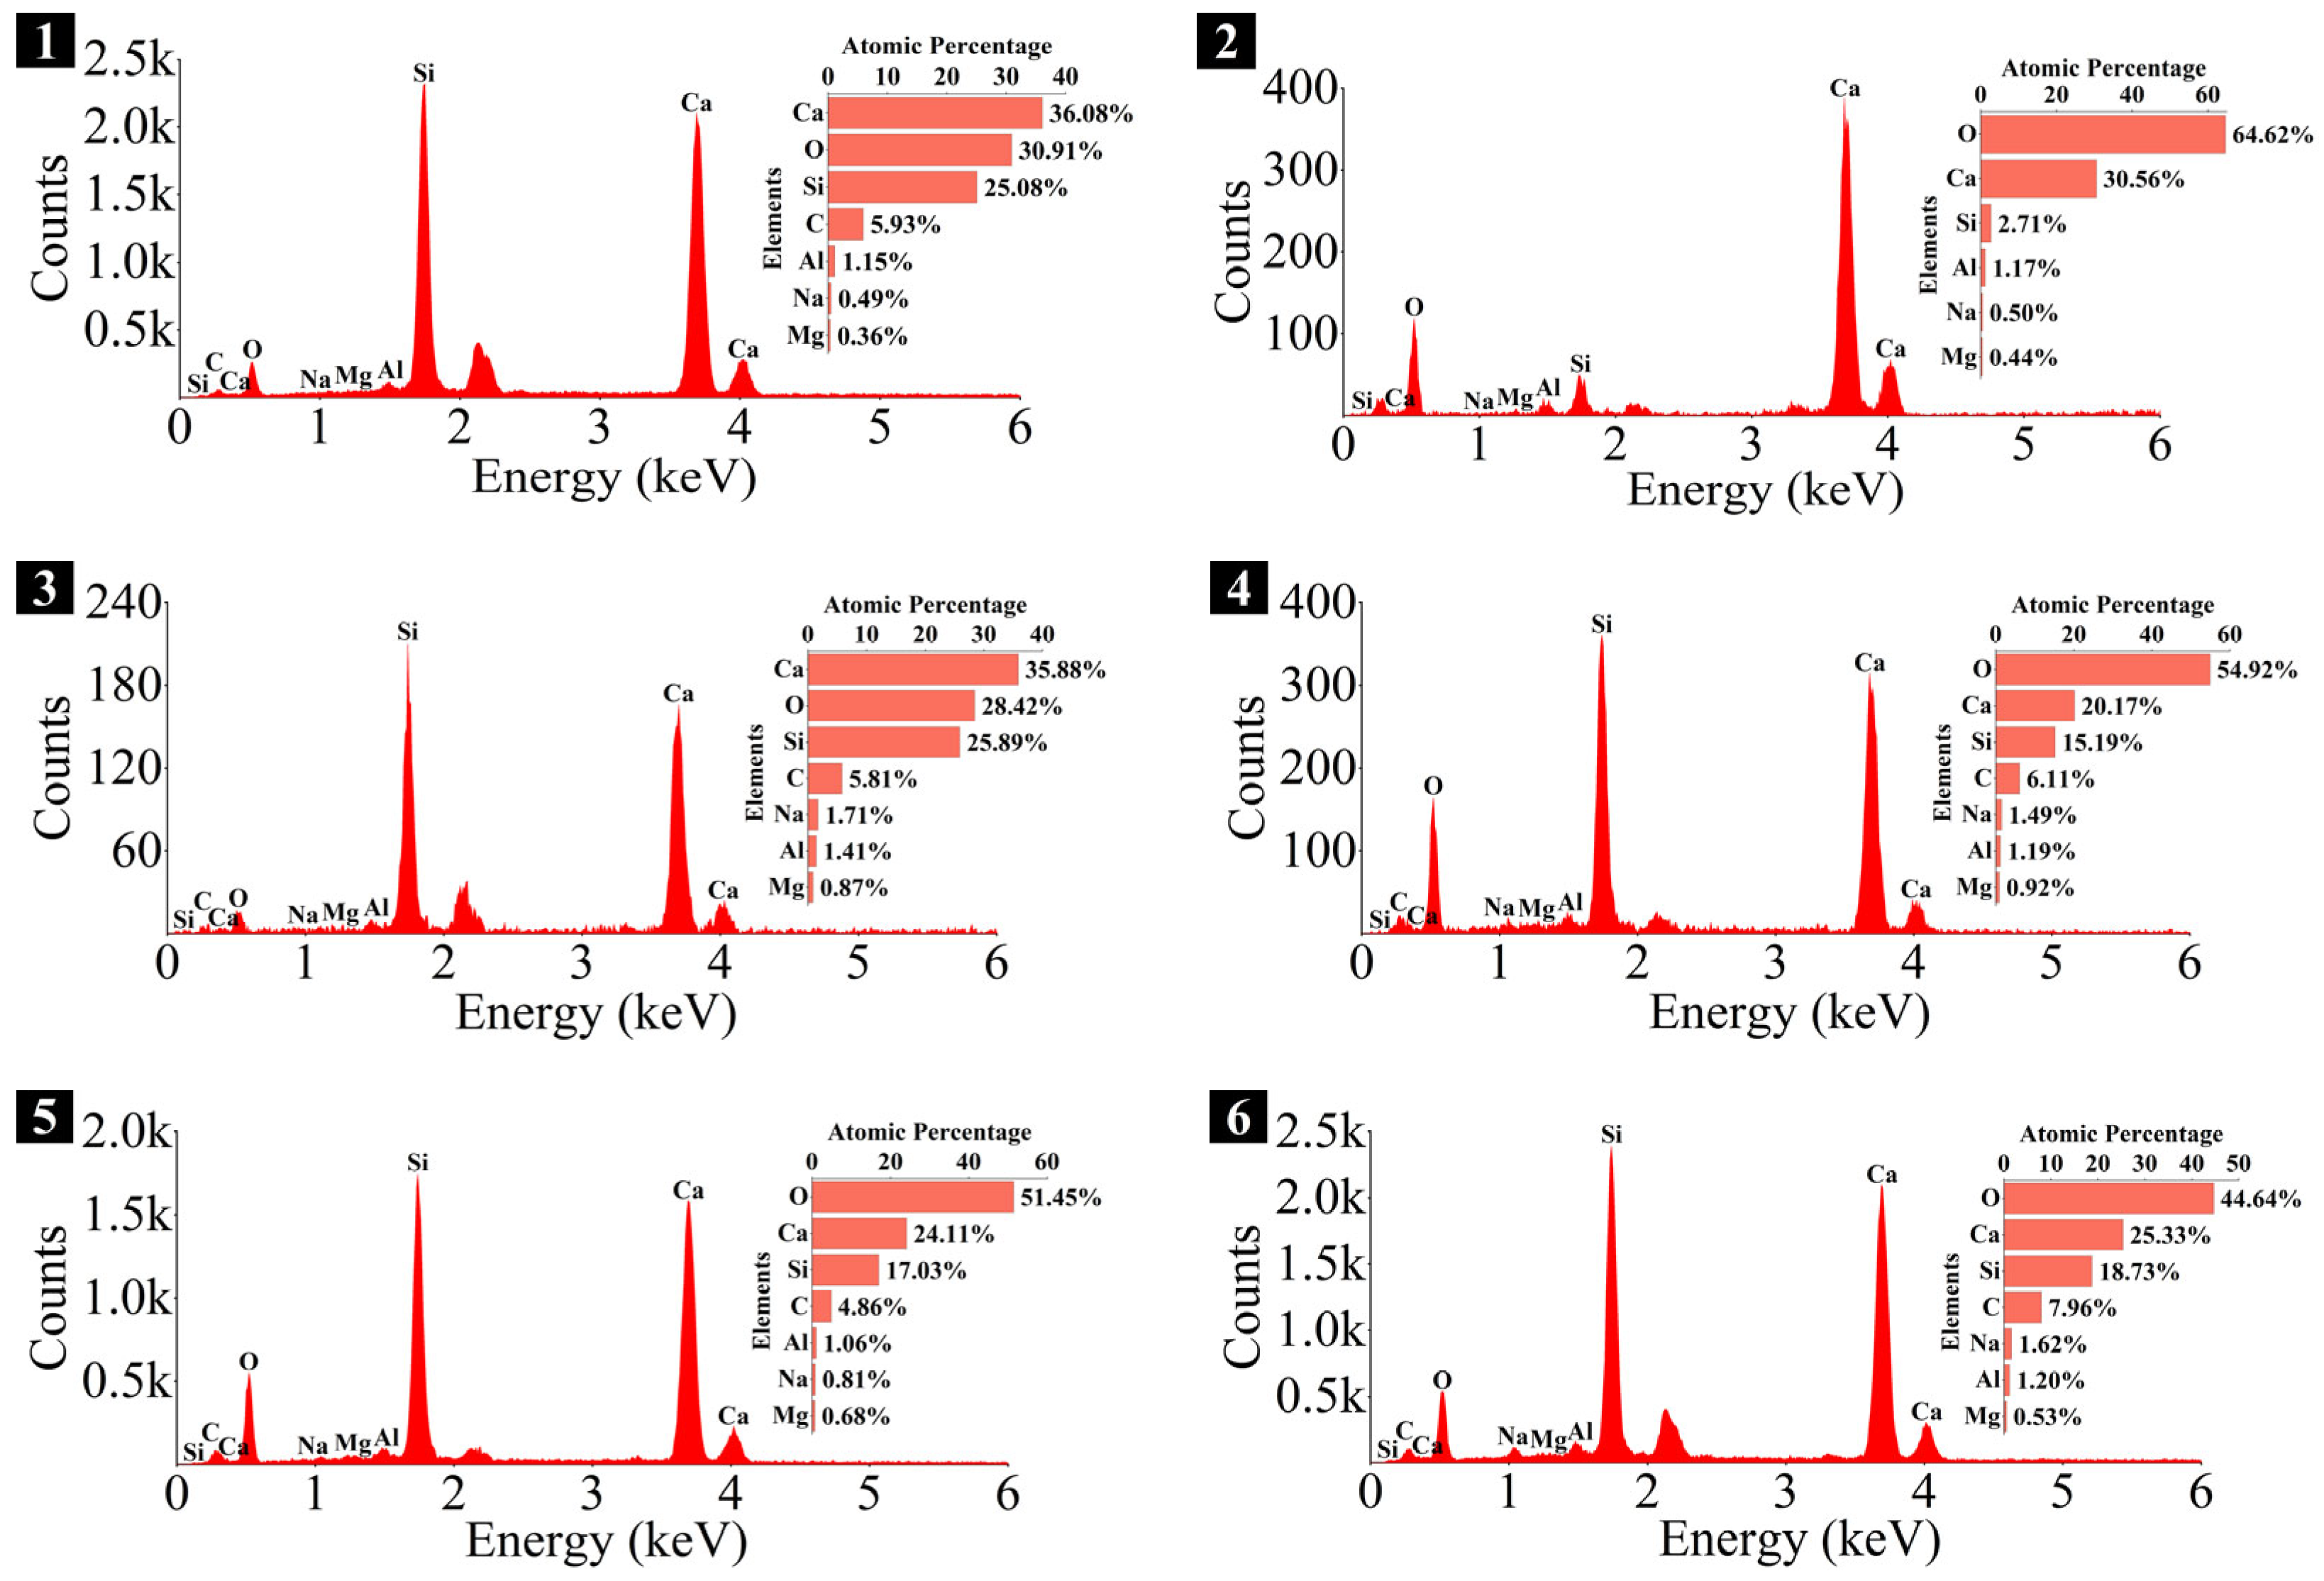
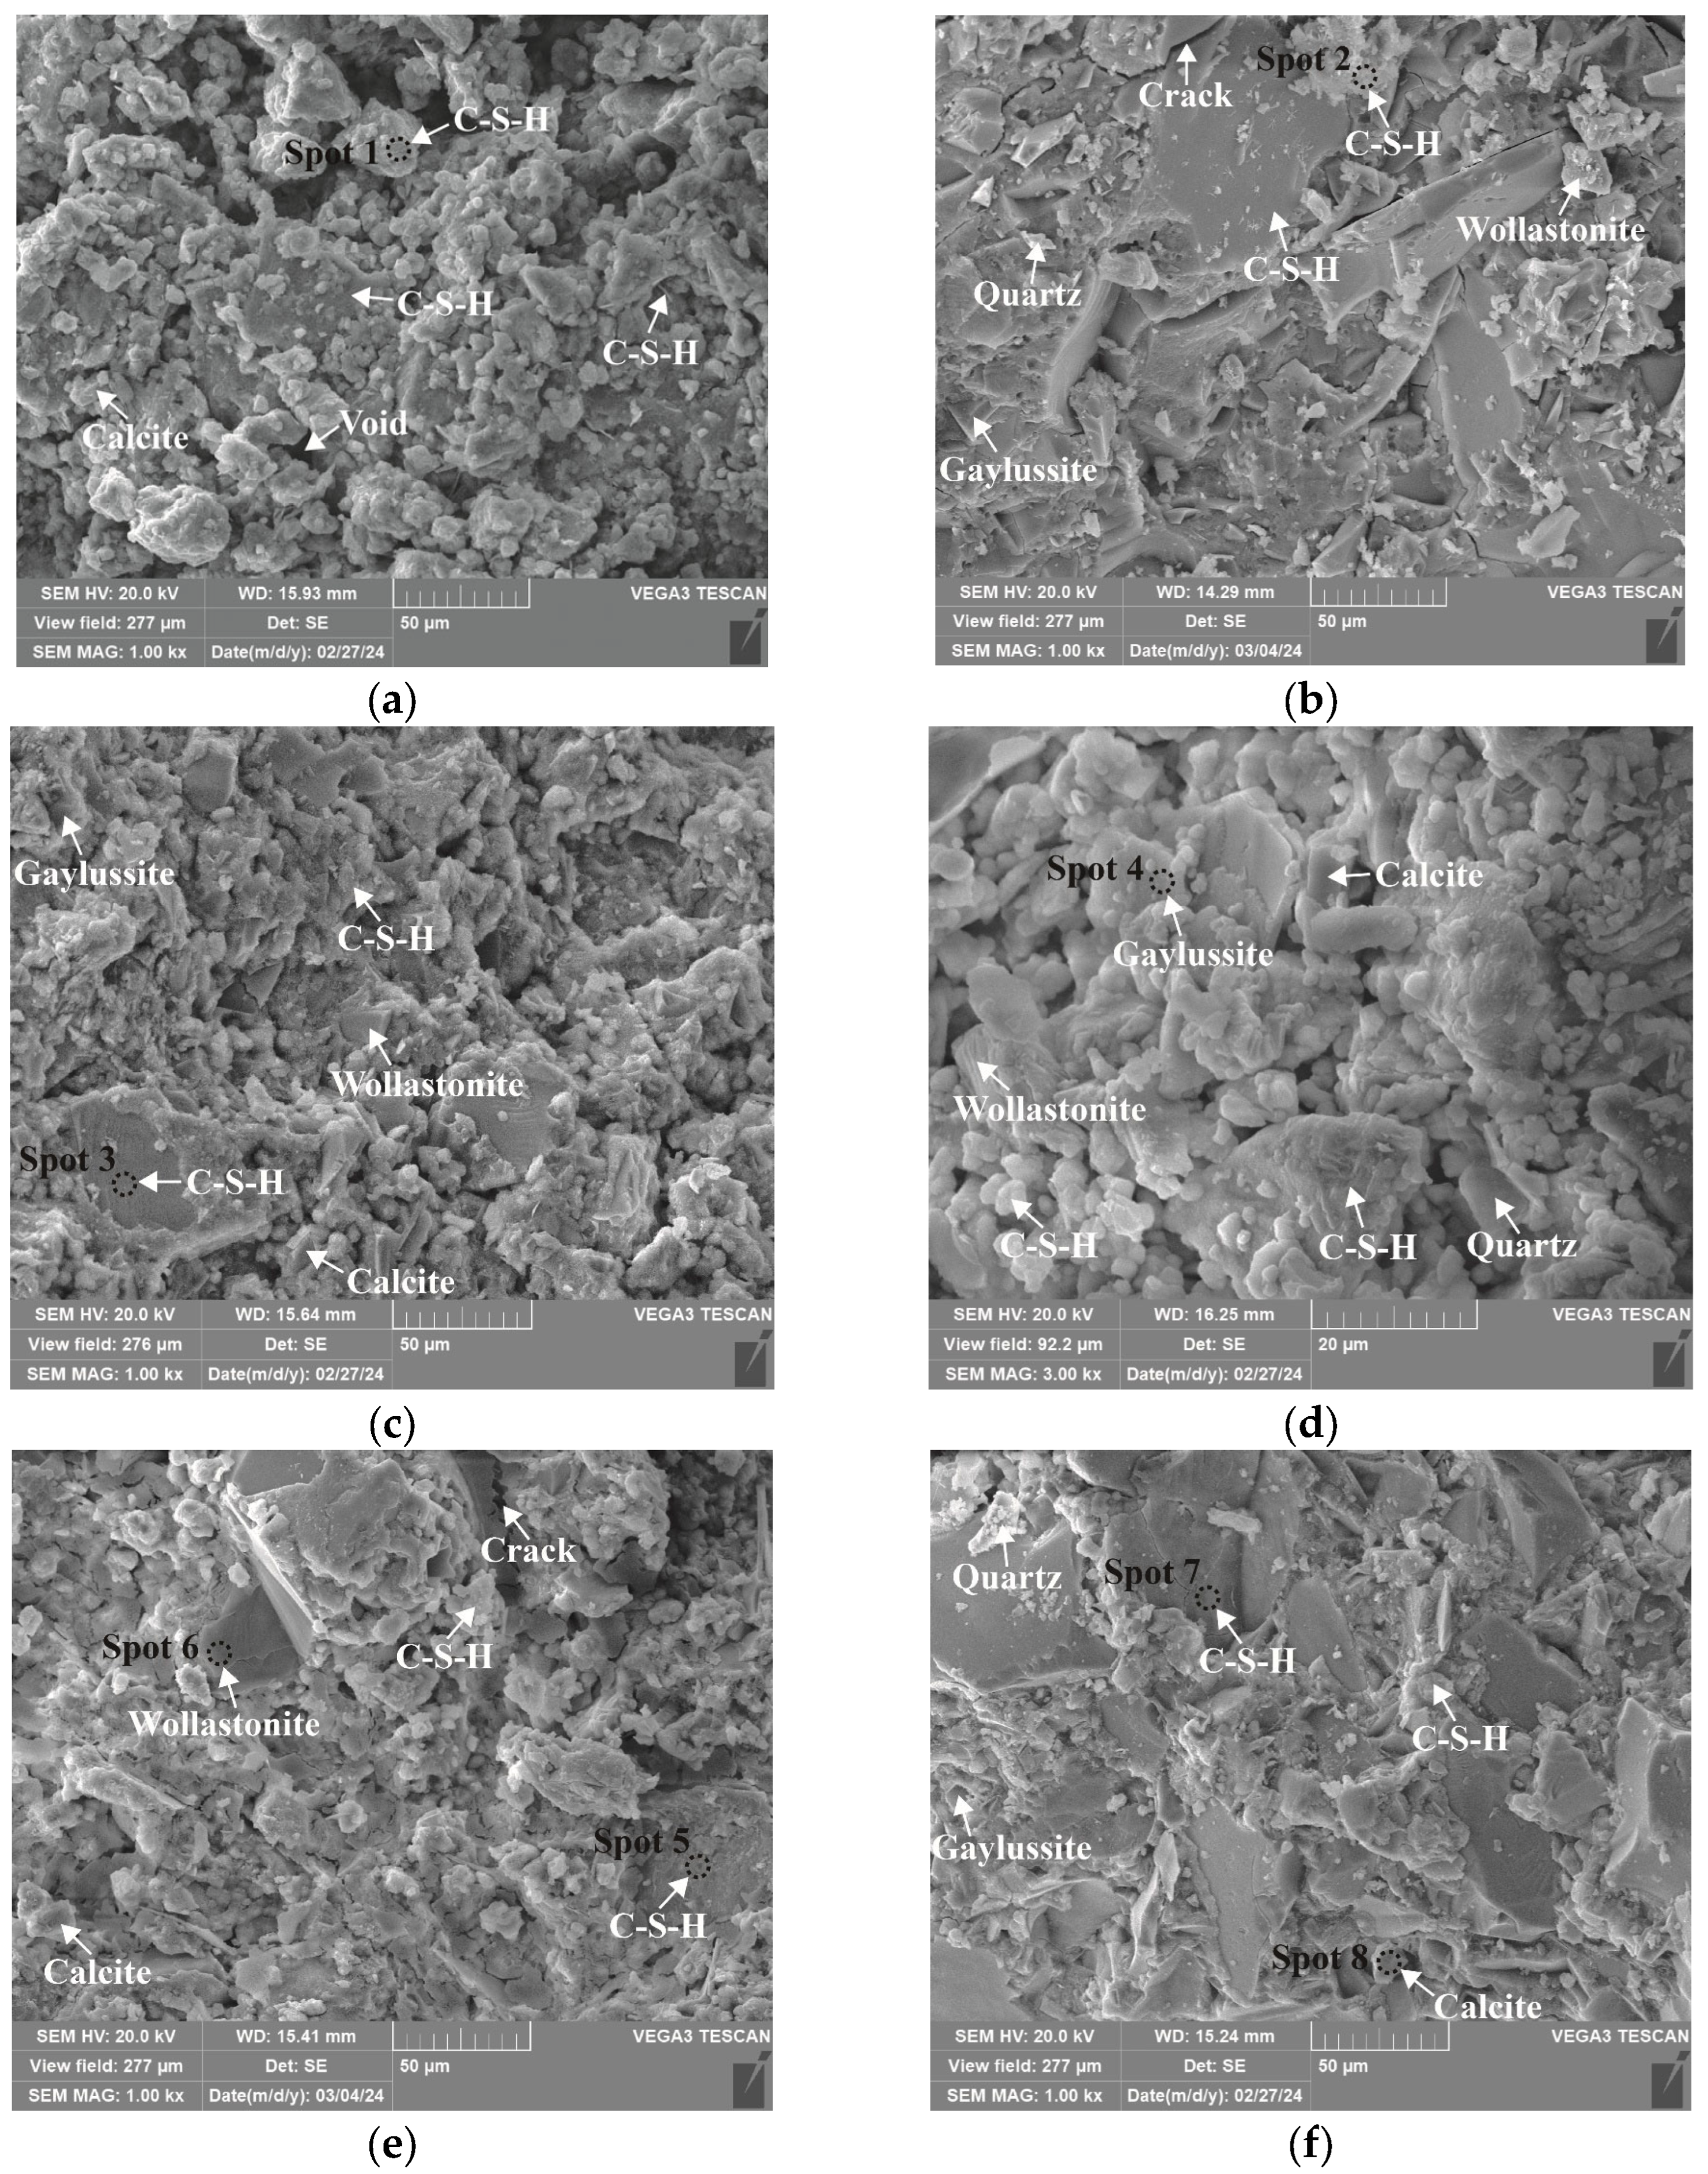
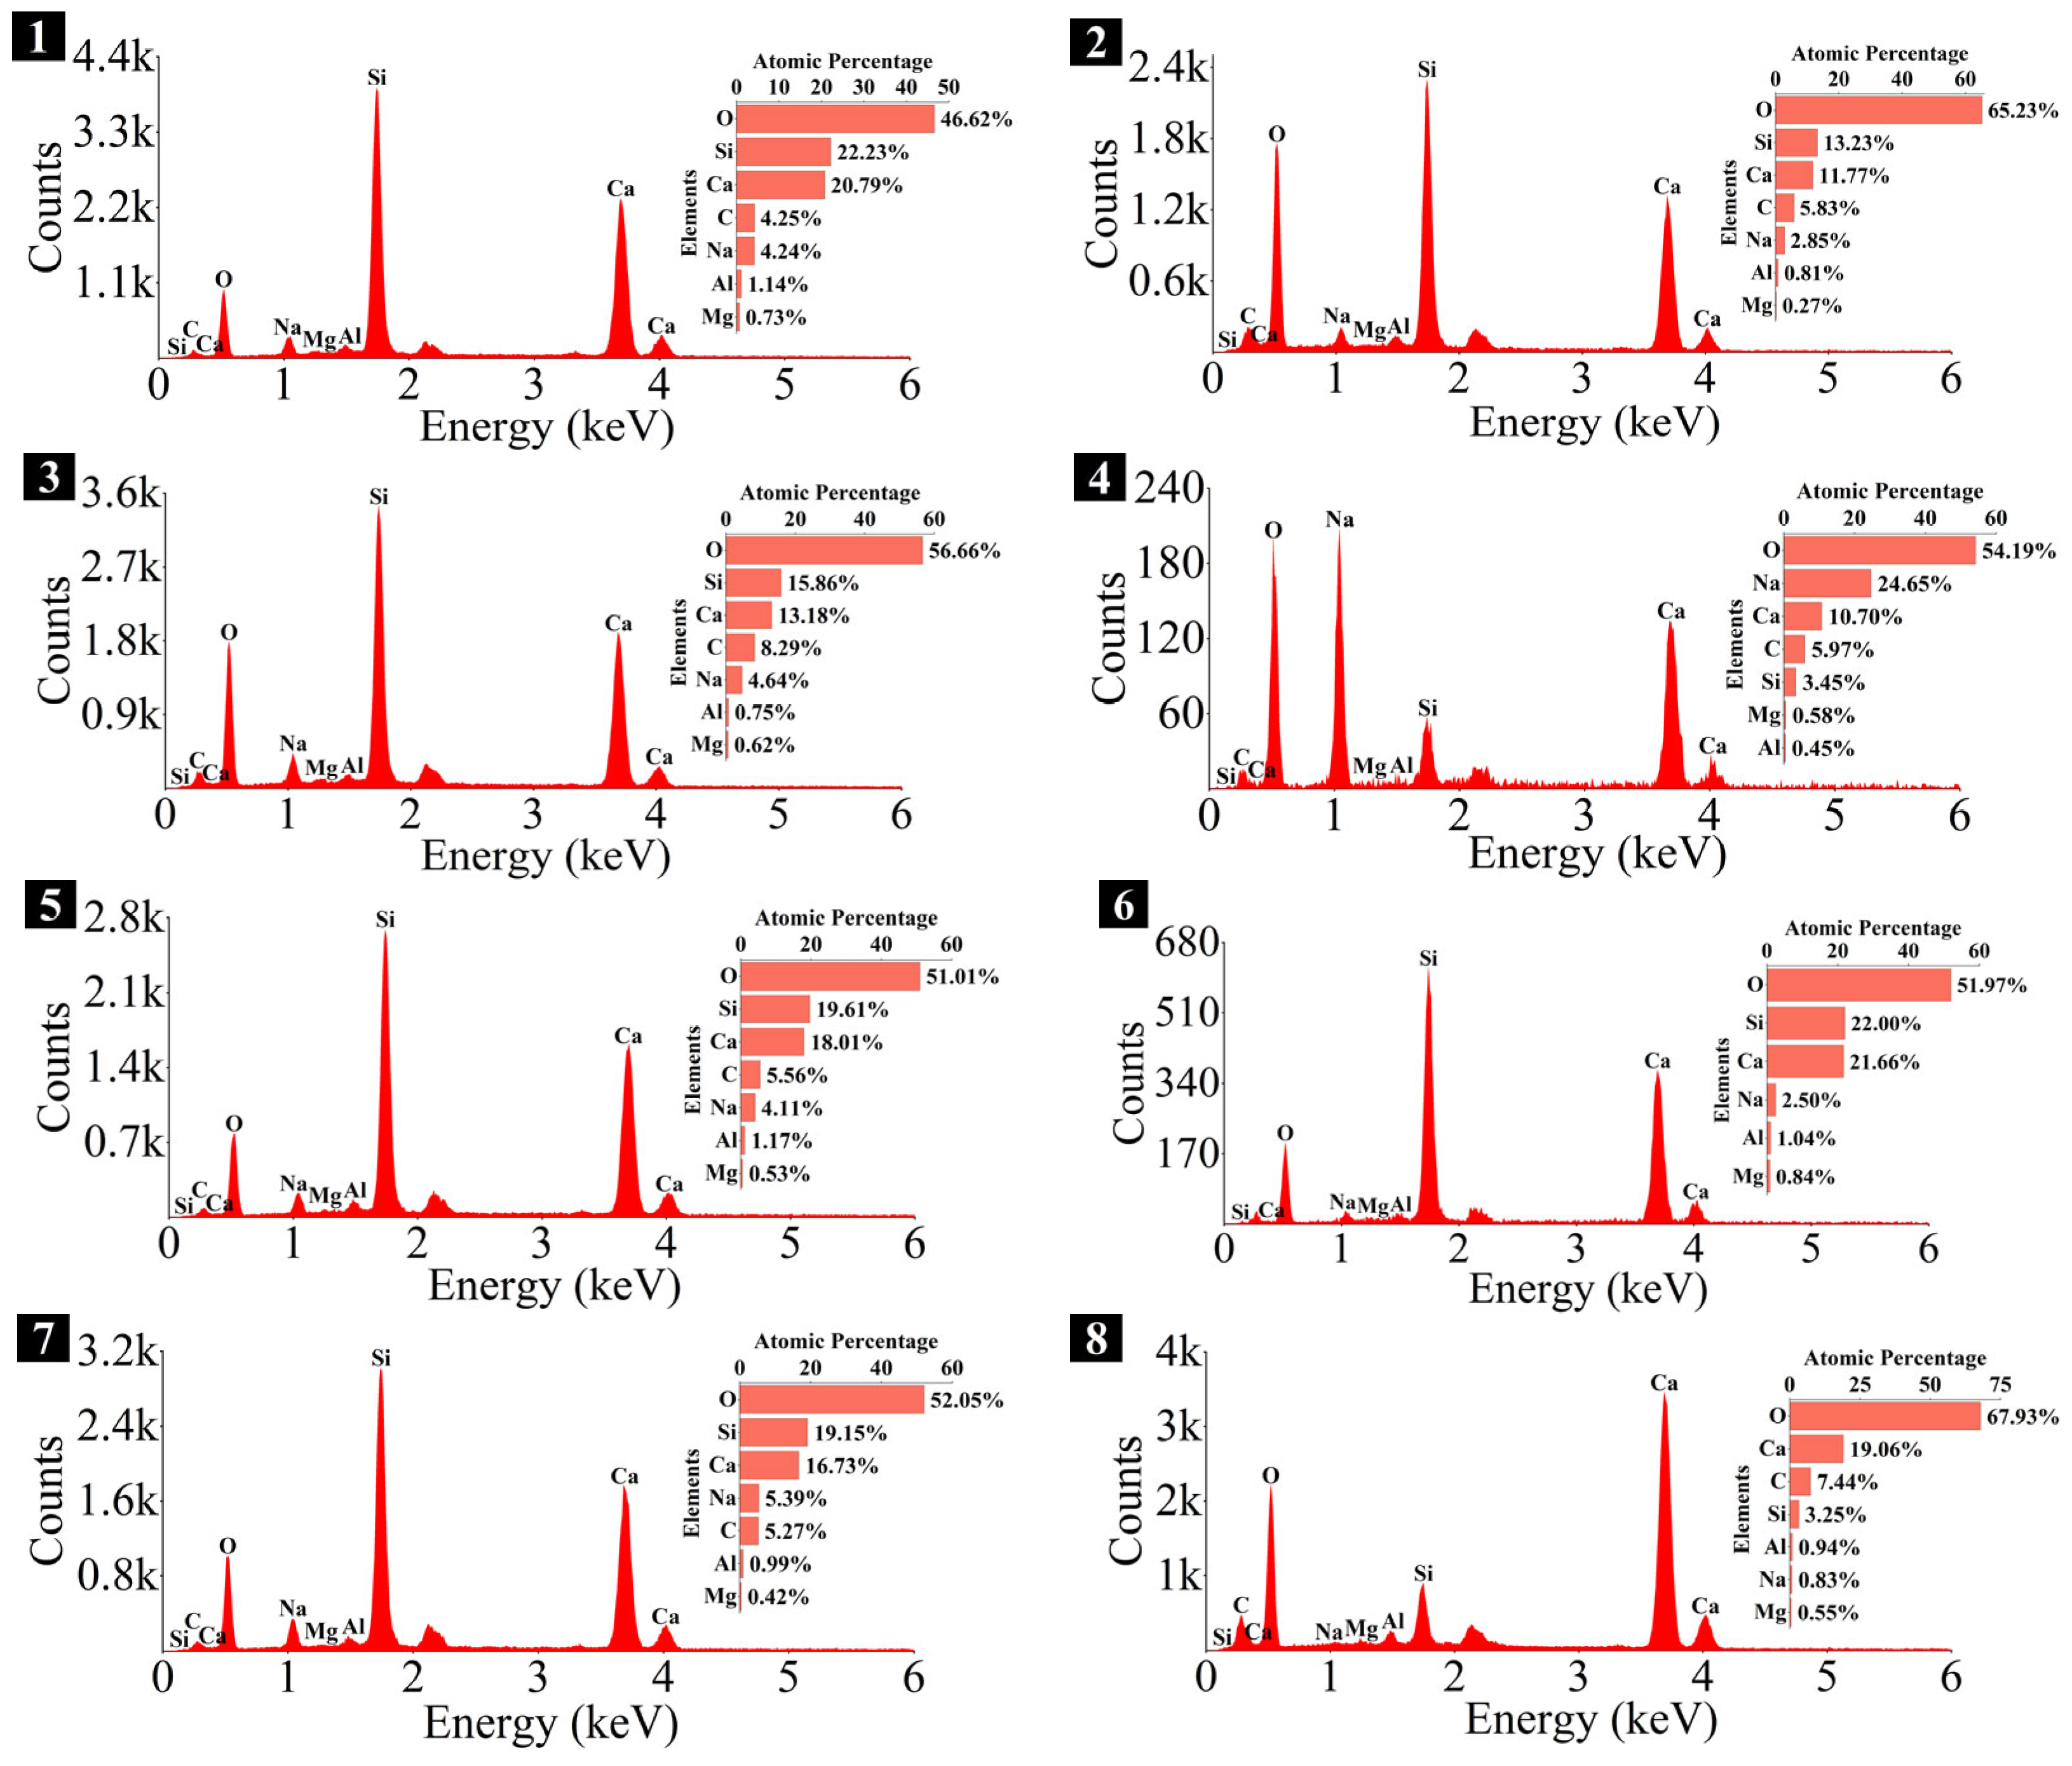
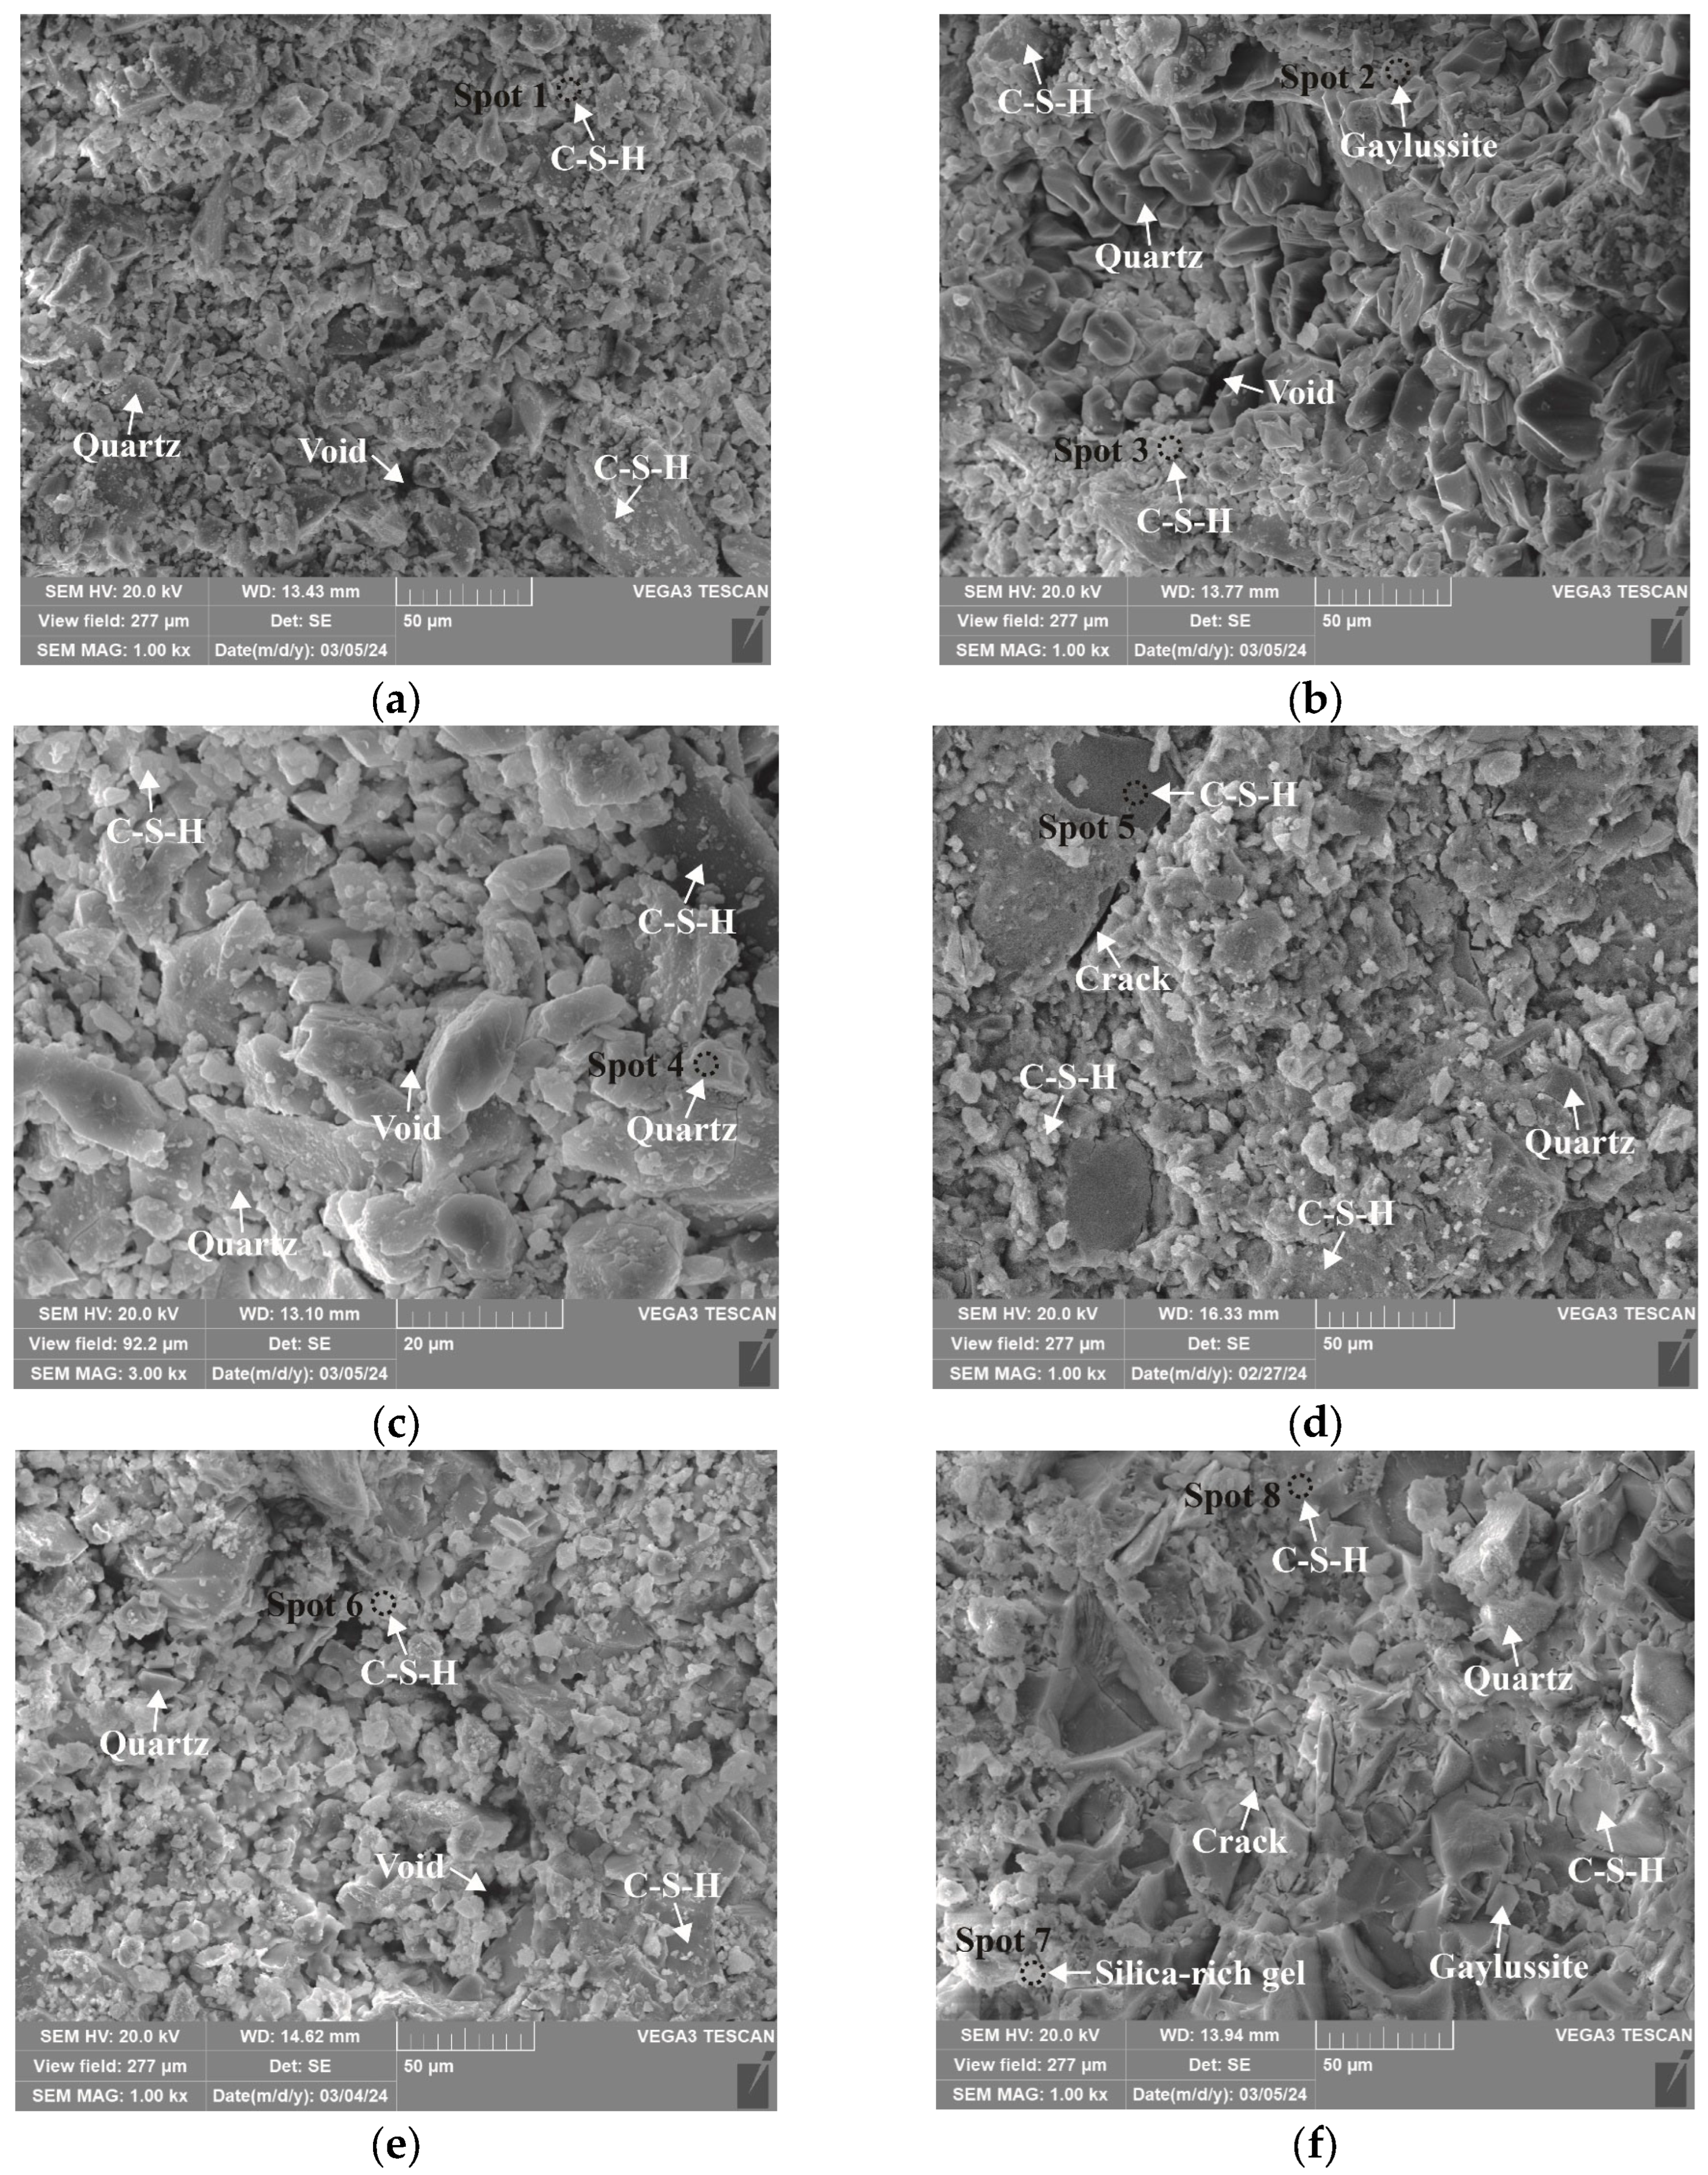
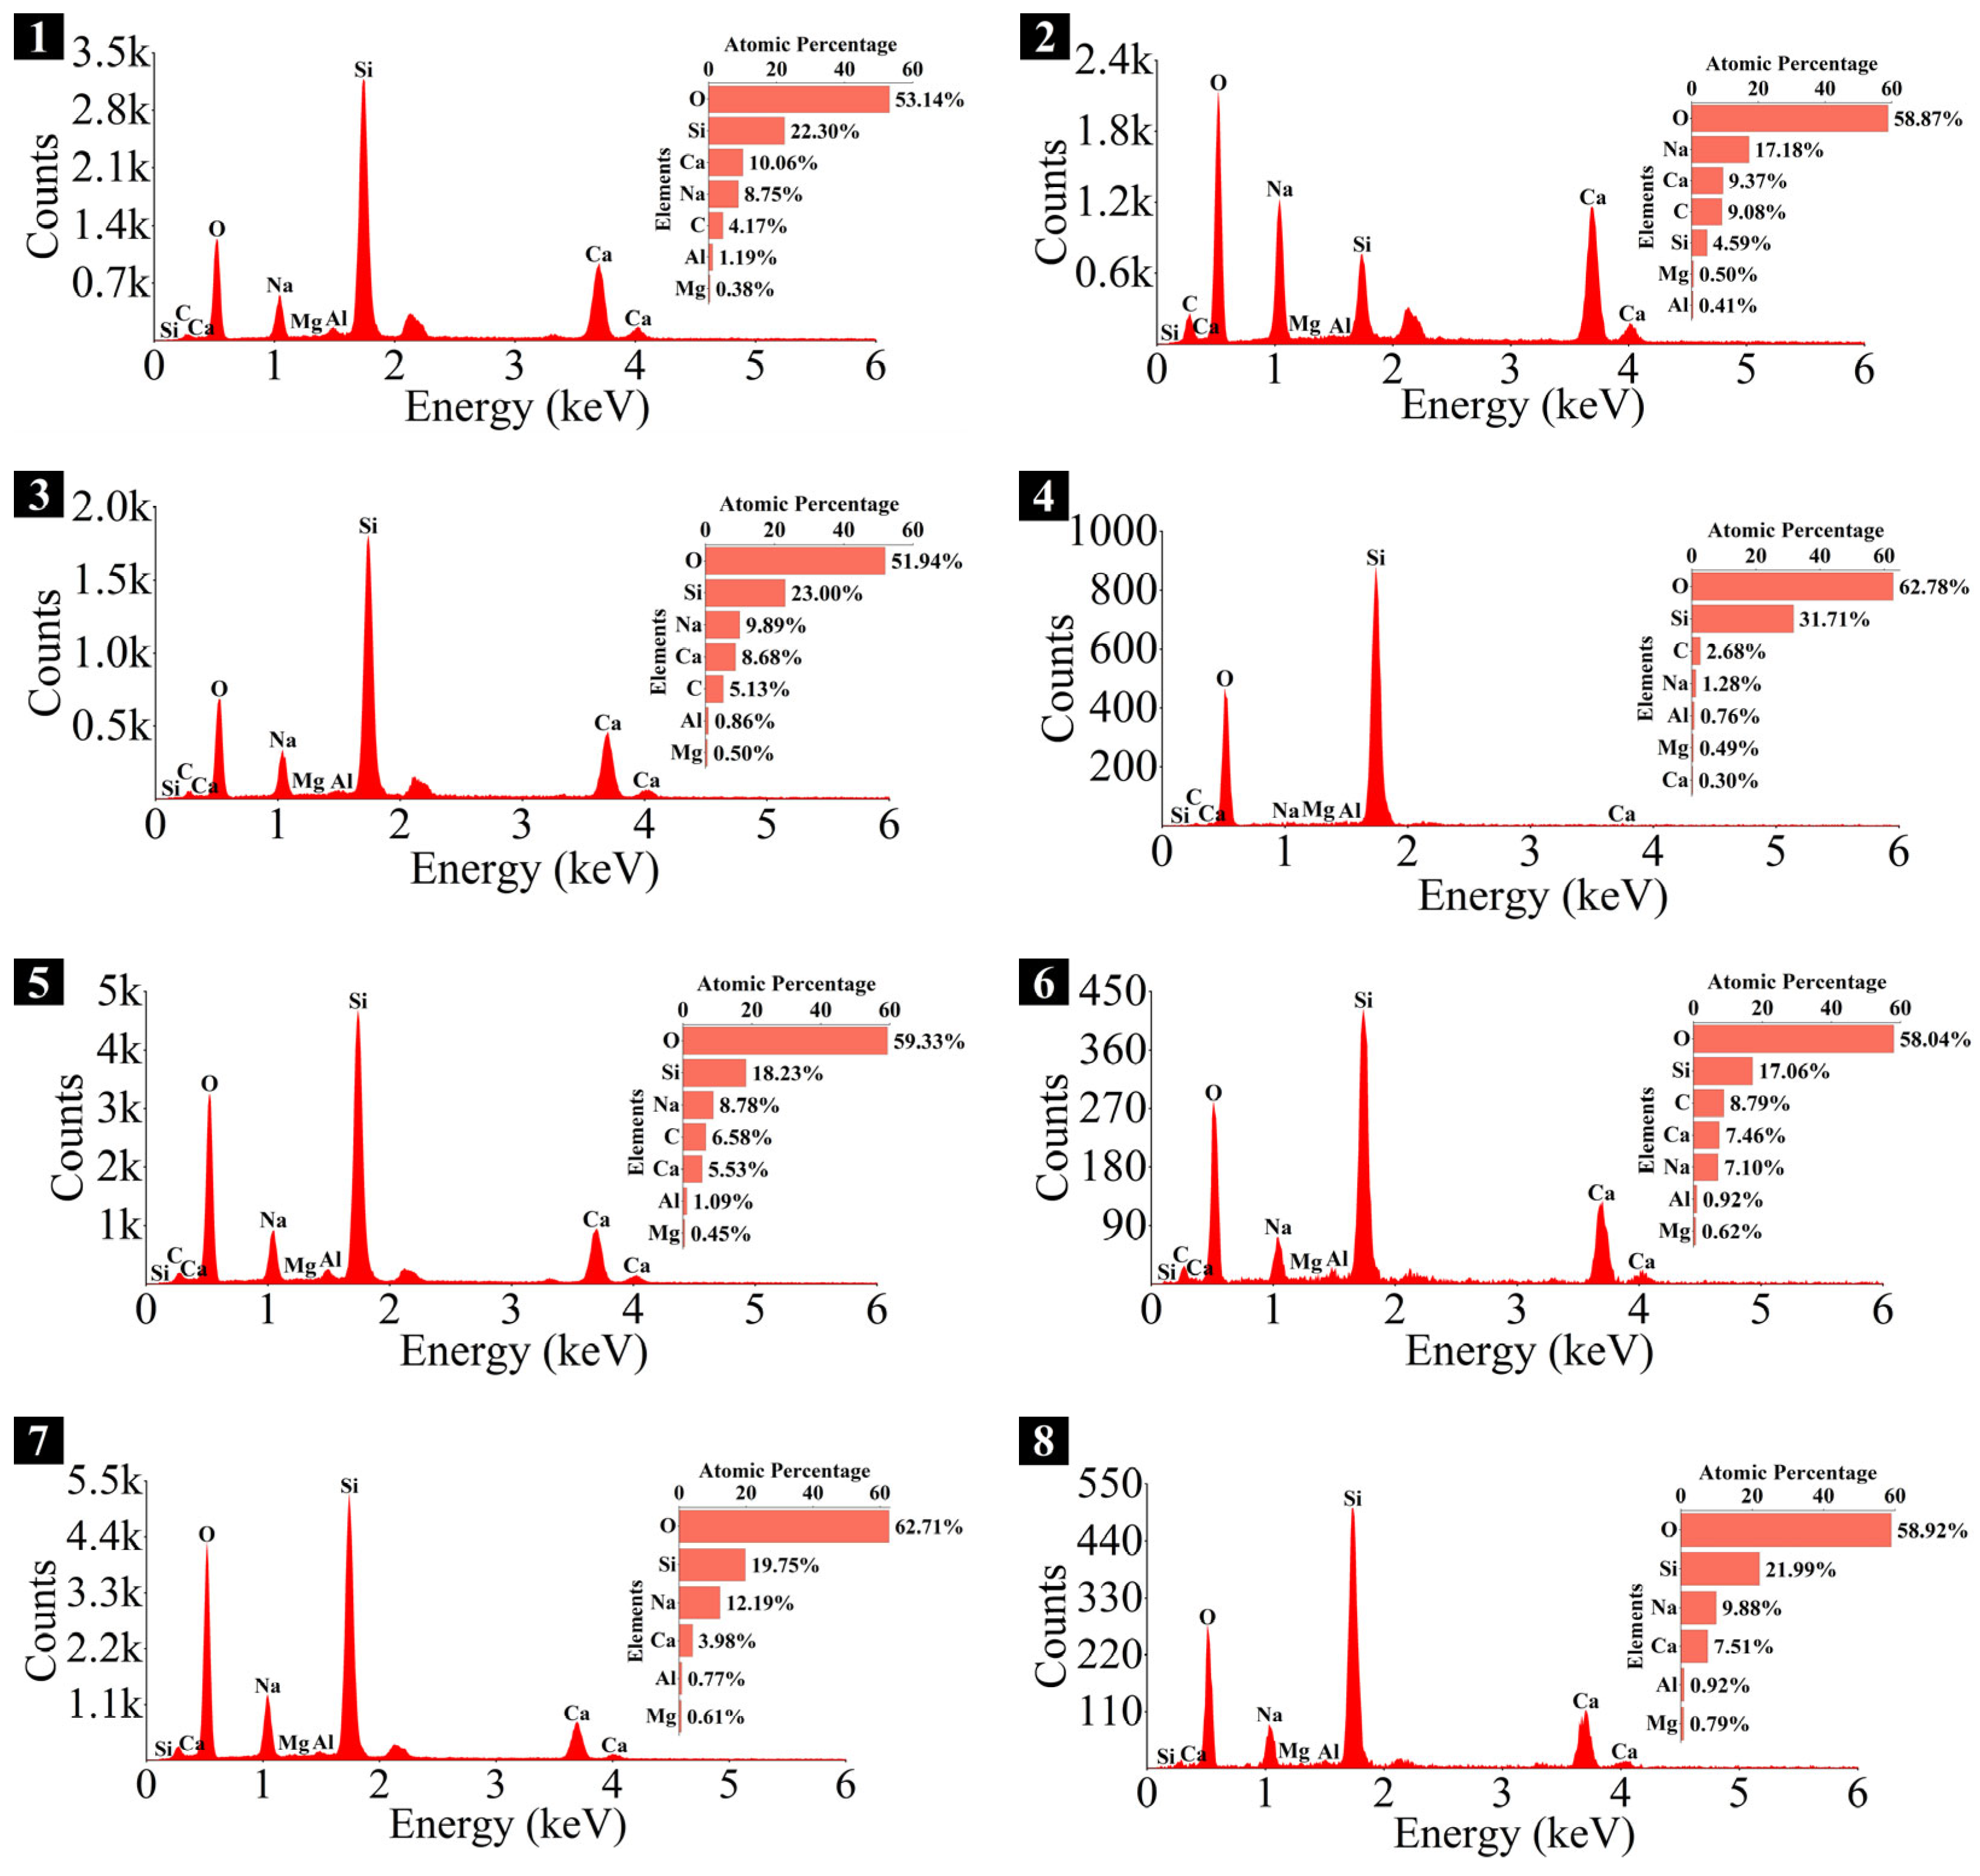
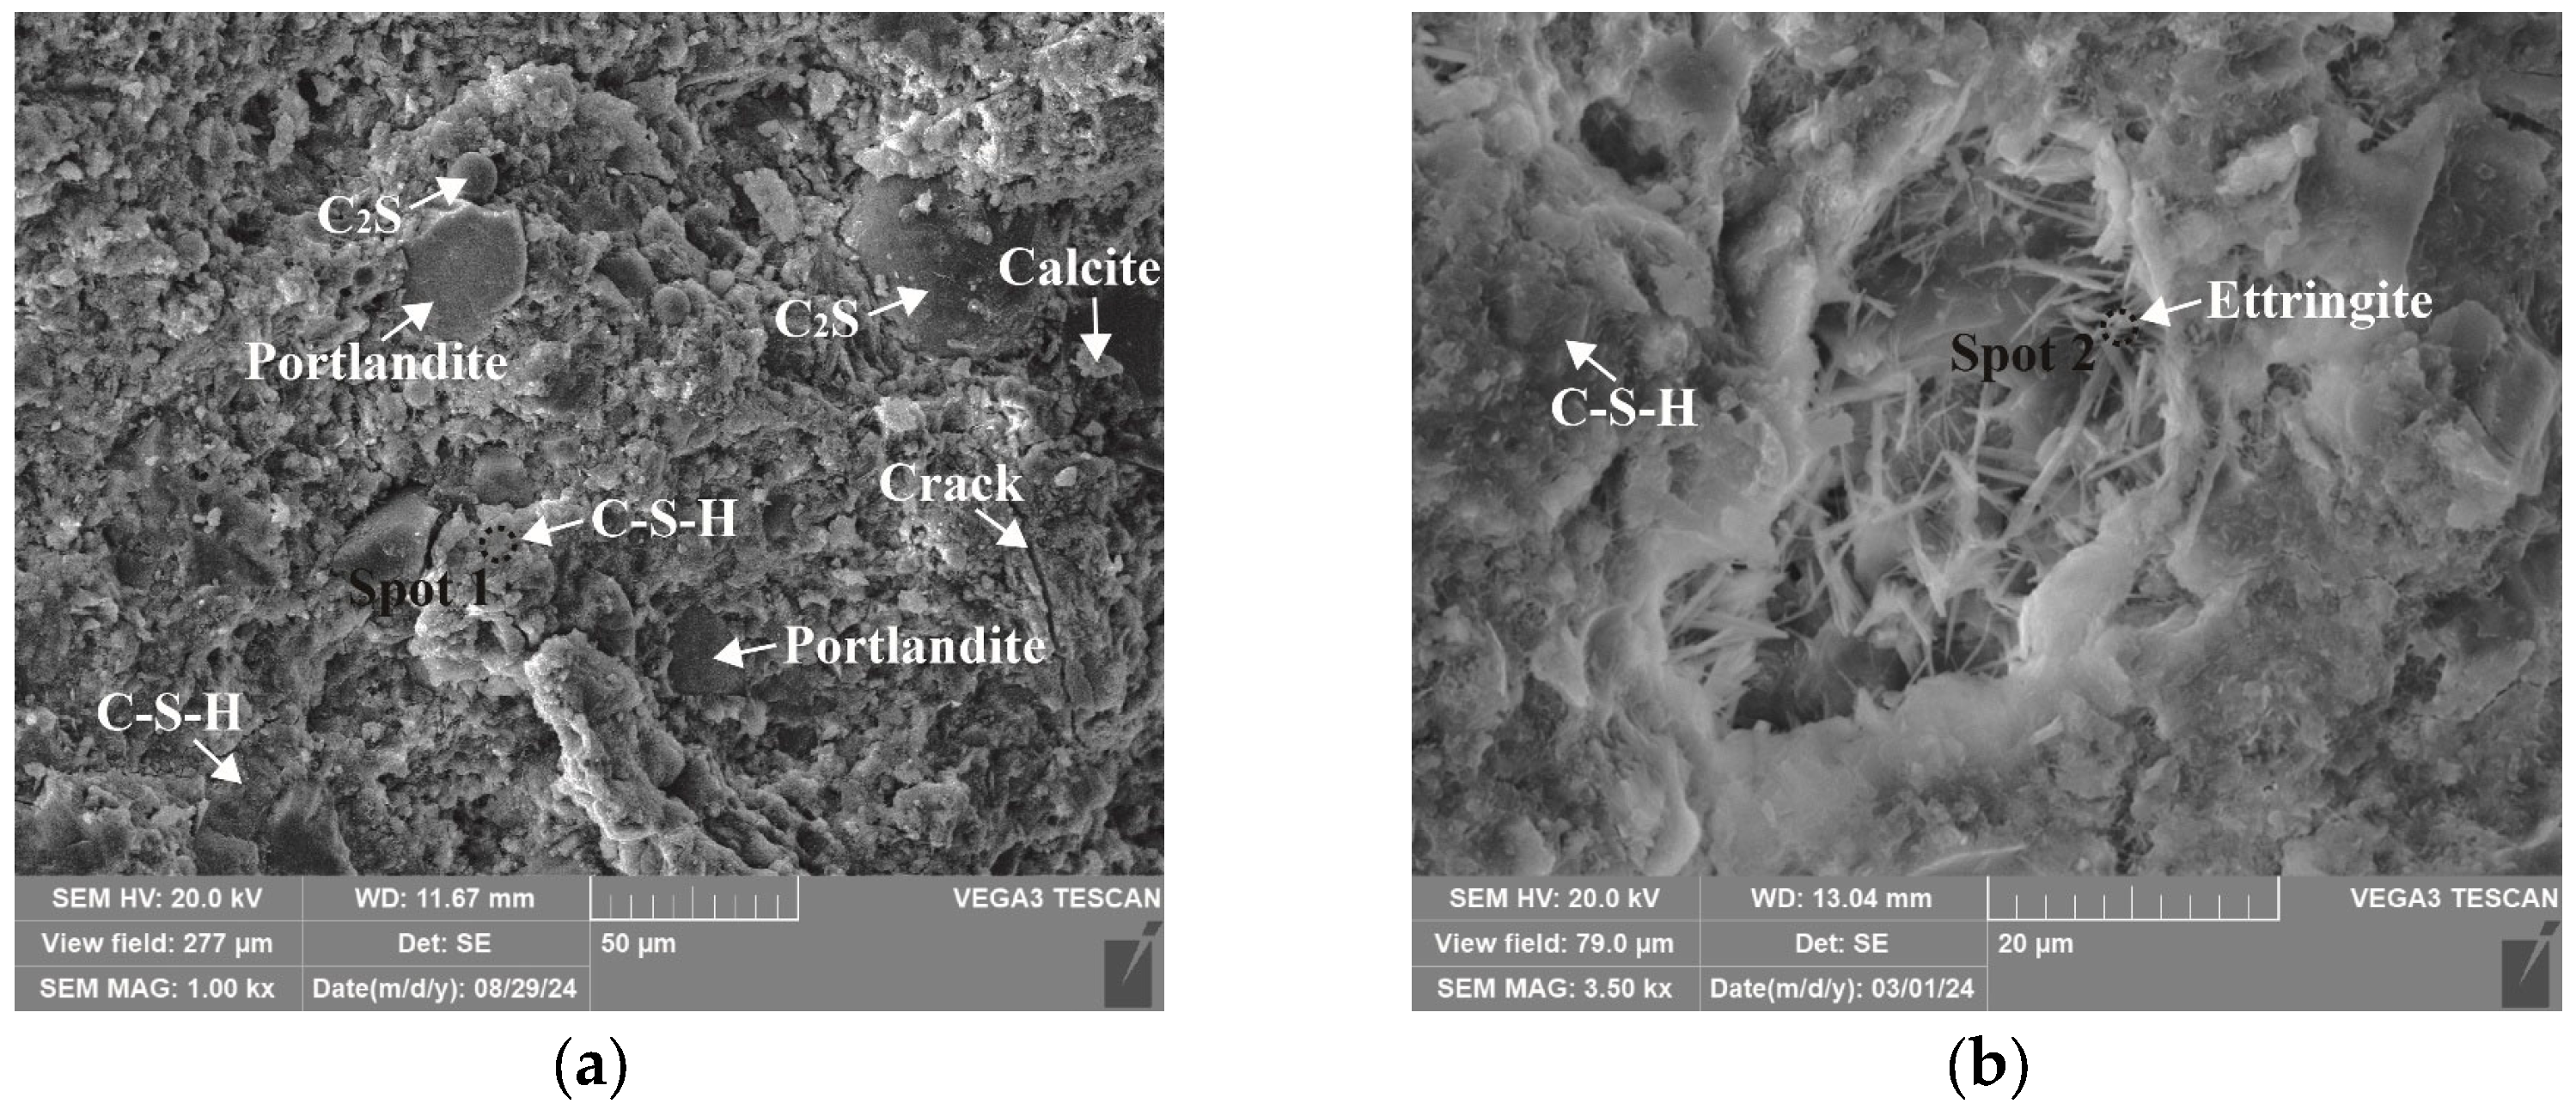
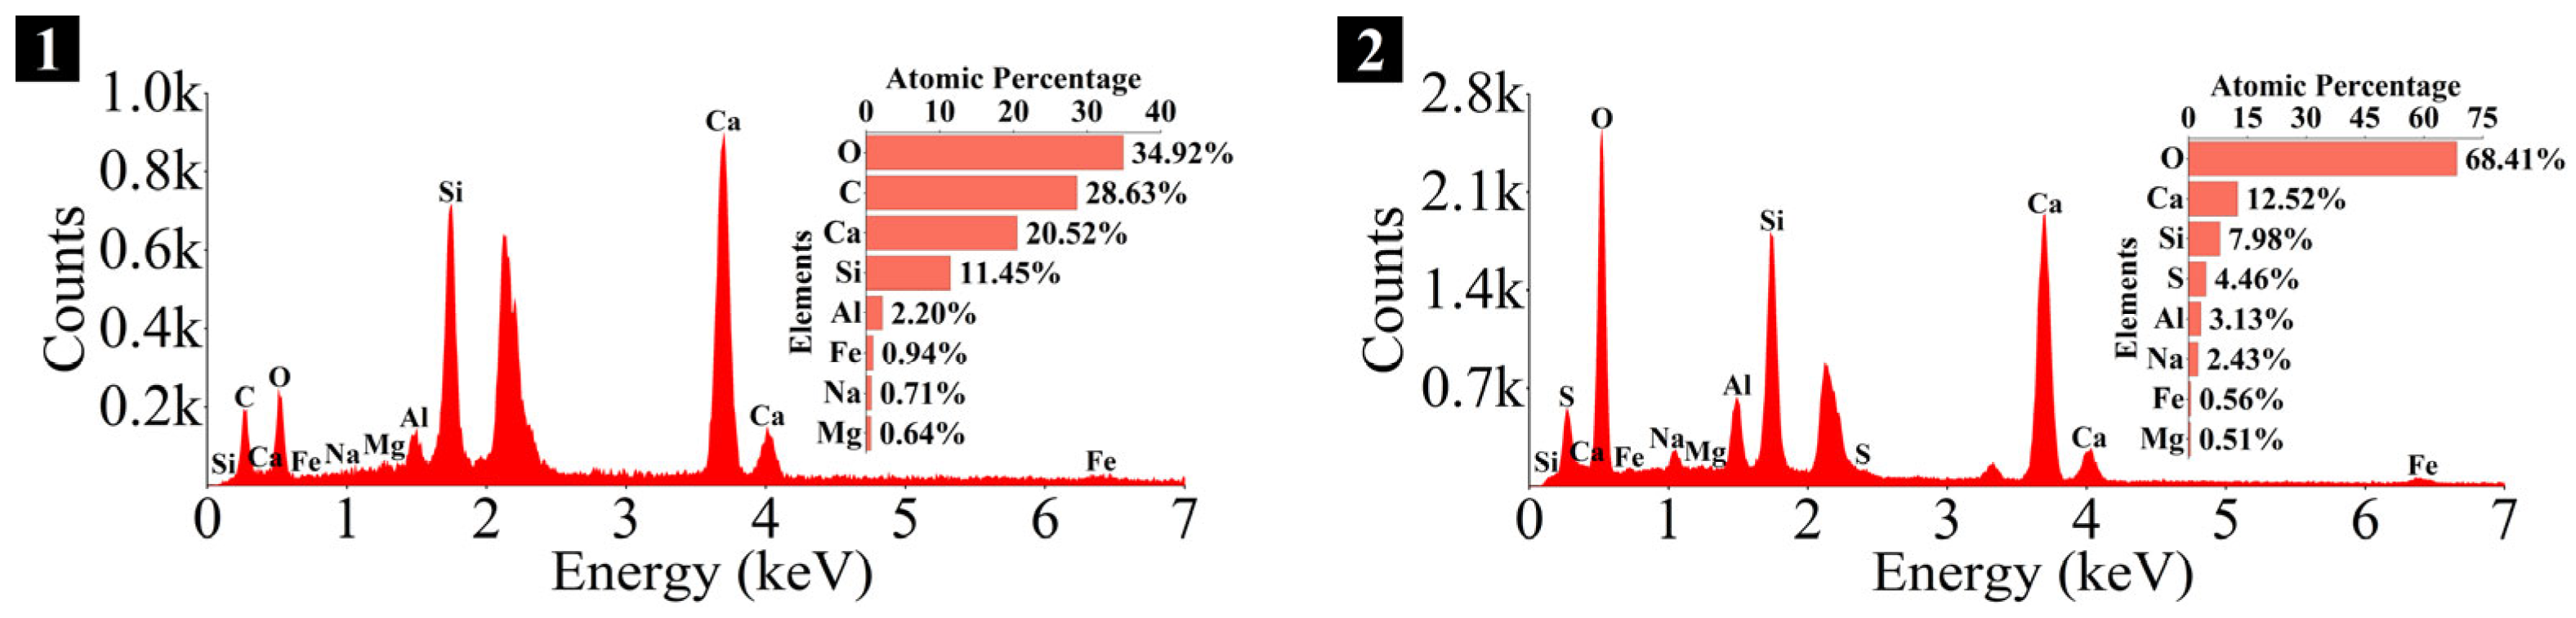
3.4. Microstructure and Phase Identification
4. Conclusions
- (1)
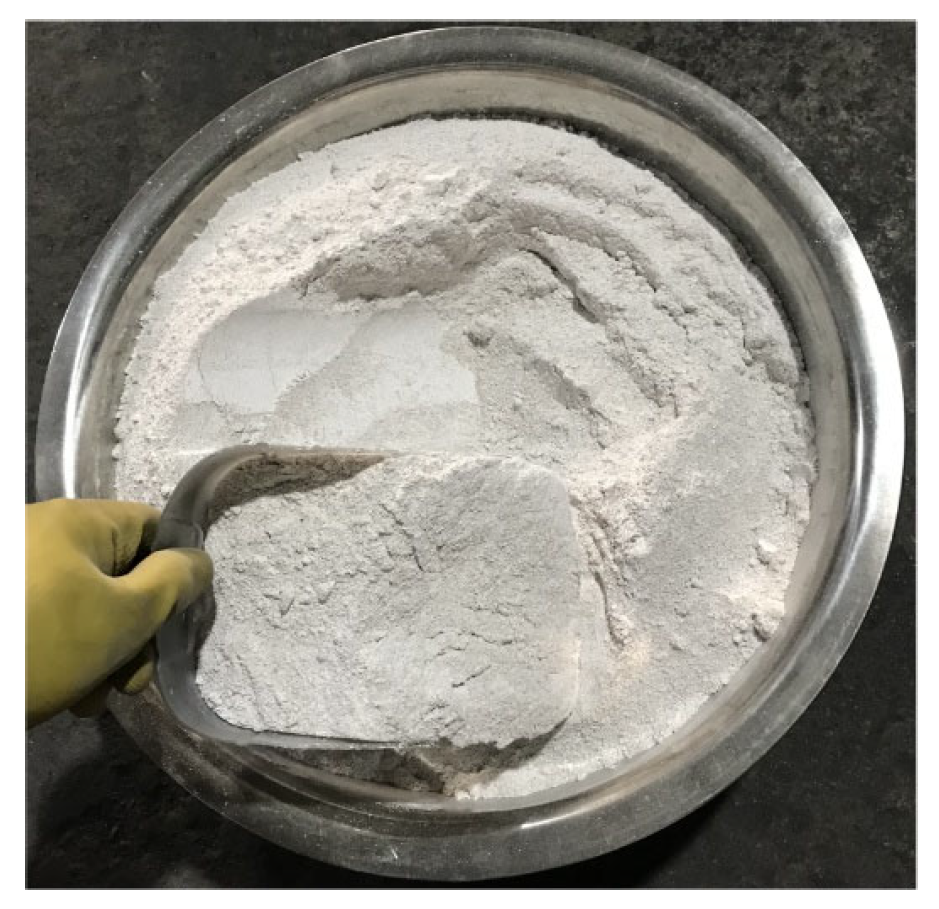
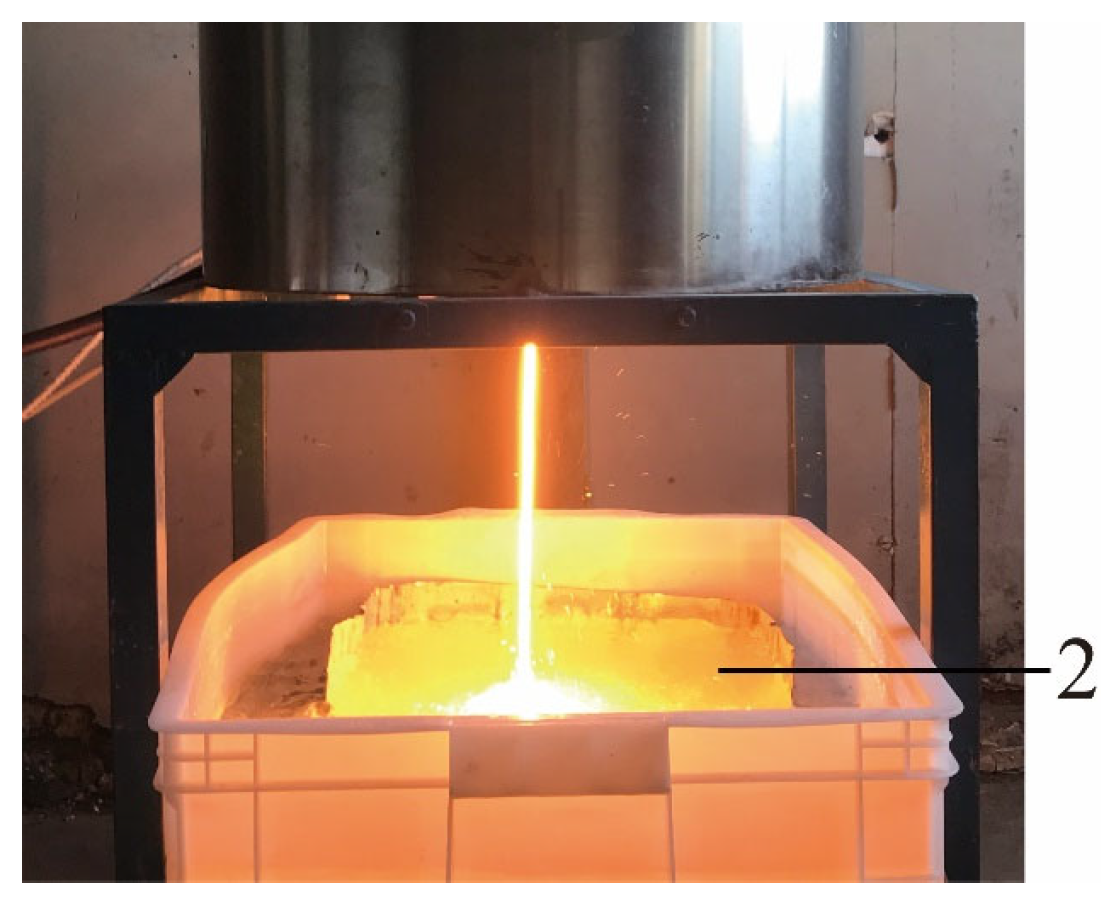
- Siliceous sand and ground calcium carbonate powder were utilized to produce SP through calcining, water quenching, and grinding, exhibiting latent hydraulic properties similar to those of slag.
- (2)
- The optimum mix ratio for Na2CO3-NaOH based AASP materials was determined to be 80% Dsc and 8% Nc (C8N2-8), with the 28-day strength reaching up to 78.95 MPa, comparable to that of AAS materials.
- (3)
- As the Dsc increased, the early-age compressive strength and strength development rate of AASP materials gradually decreased. However, the late-age strength rose initially and then decreased, due to the mixed activation with Na2CO3 and NaOH being more effective than activation by Na2CO3 or NaOH alone.
- (4)
- The variation in compressive strength with Nc was influenced by the Ca/Si ratio of SP. When the Ca/Si ratio was 1.25, 1.0, and 0.75, the early-age strengths first rose and then decreased, while the late-age strengths increased steadily with the Nc increasing from 2% to 8%. However, when the Ca/Si ratio was 0.5 and 0.25, the corresponding pastes showed a continuous increase in both early-age and late-age strengths as Nc increased from 4% to 8%.
- (5)
- With the decrease in the Ca/Si ratio, the early-age compressive strength diminished accordingly. However, its impact on the late-age compressive strength was related to Nc. When the Nc ranged from 4% to 6%, the trend in late-age strength mirrored that in early-age strength. As the Nc further increased to 8%, the late-age strengths of the 0.5 M and 0.25 M surpassed that of the 0.75 M, due to the improved polymerization degree of C-S-H gel and the formation of silica-rich gel.
- (6)
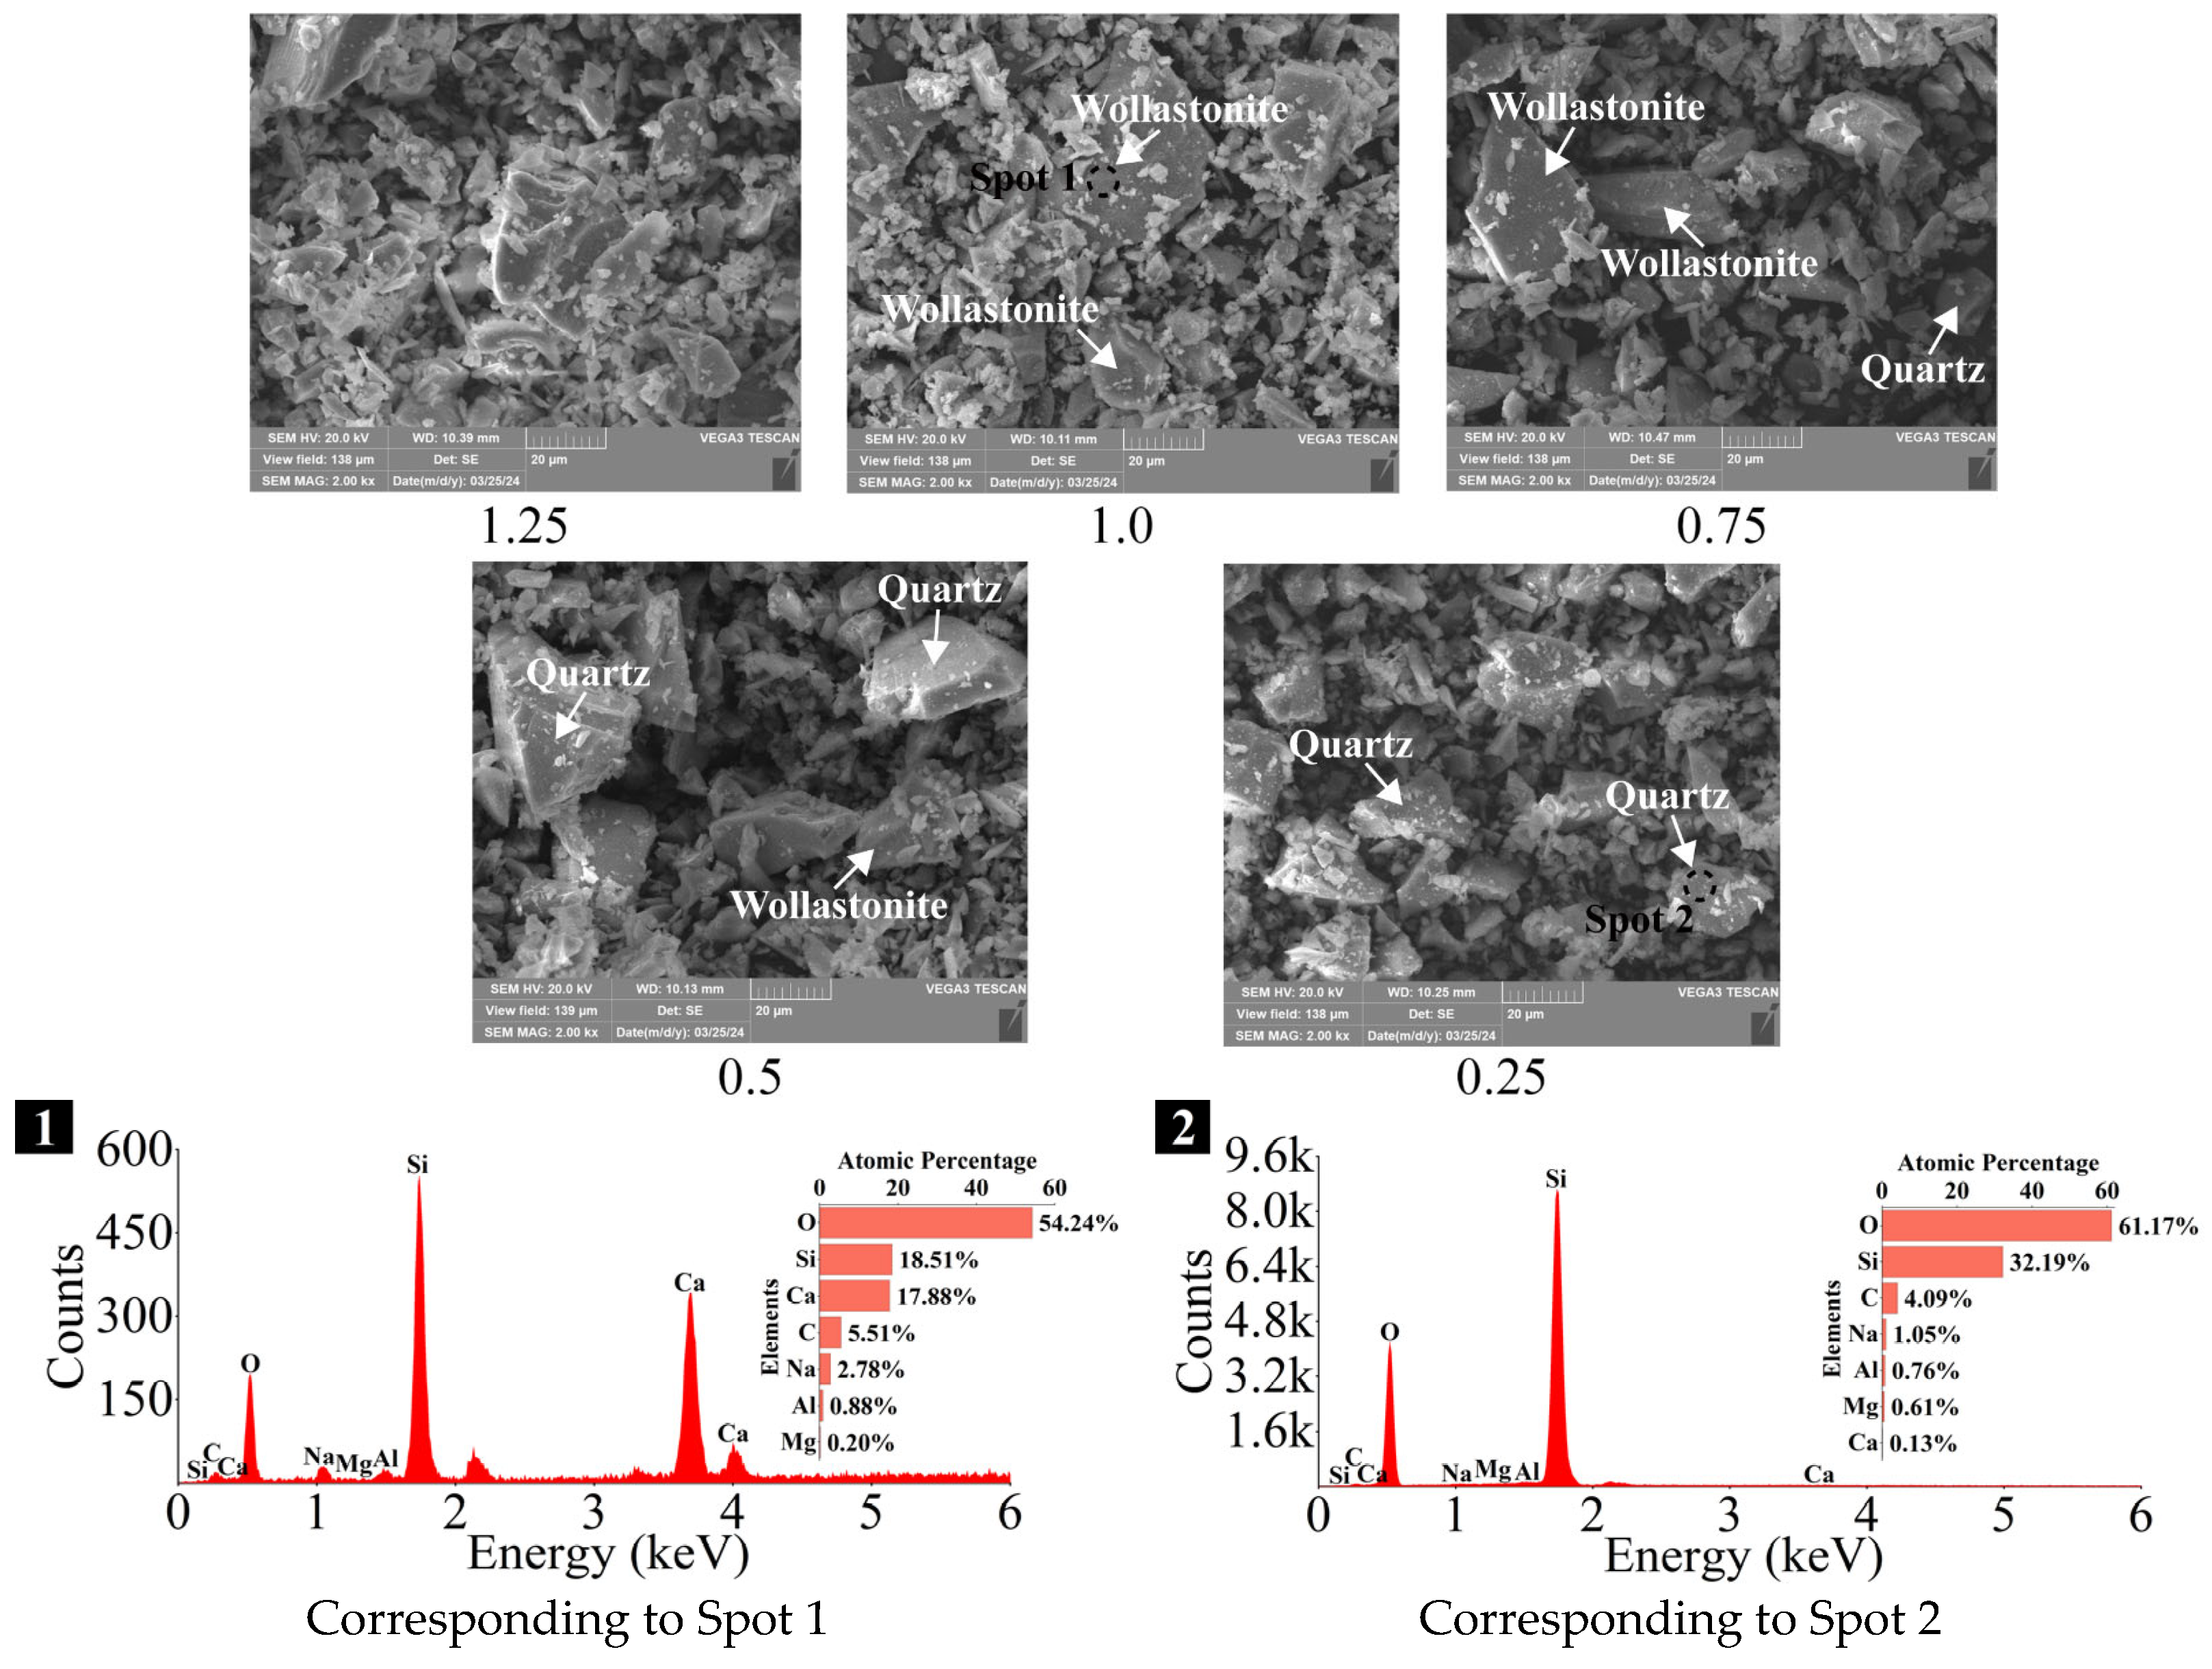
- Microscopic analyses revealed that the primary hydration product of AASP materials was C-S-H gel. With the reduction in the Ca/Si ratio of SP, the generation of C-S-H gel decreased, while its polymerization degree and alkali adsorption capacity increased.
Author Contributions
Funding
Institutional Review Board Statement
Informed Consent Statement
Data Availability Statement
Conflicts of Interest
Abbreviations
| AASP | Alkali-activated slag-like powder |
| AAS | Alkali-activated slag |
| AAMs | Alkali-activated materials |
| SP | Slag-like powder |
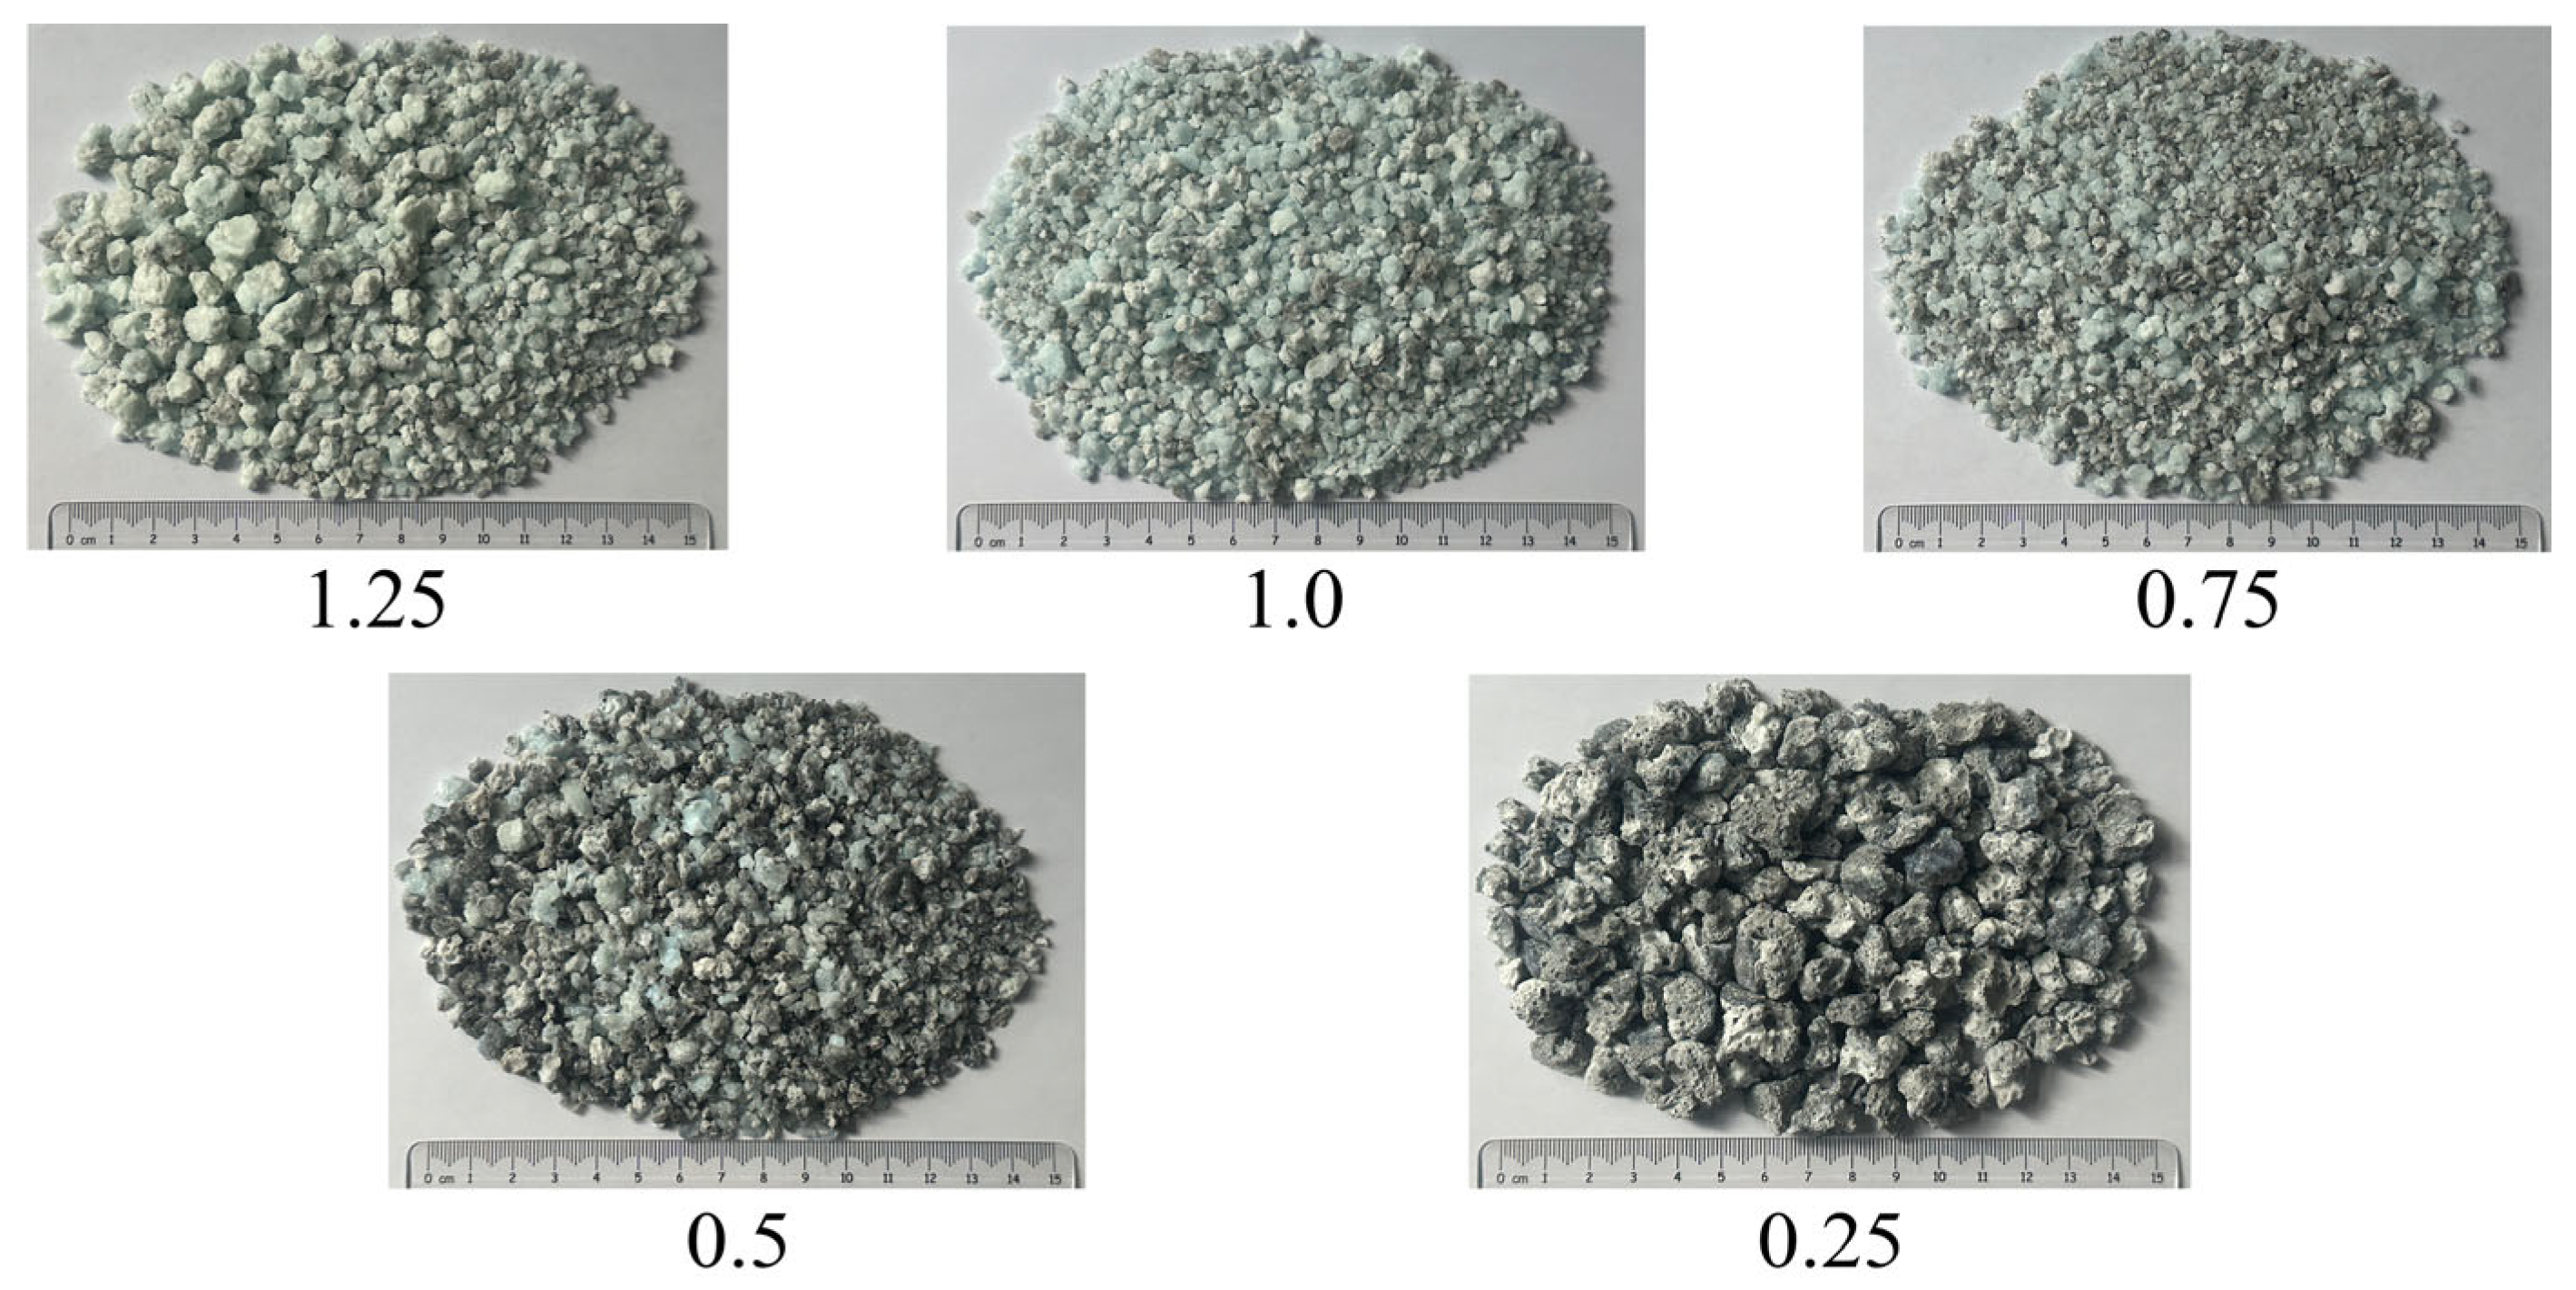
| 1.25 SP | SP with a Ca/Si ratio of 1.25 |
| 1.25 M | AASP materials produced from 1.25 SP |
| MK | Metakaolin |
| HCFA | Class C fly ash |
| LCFA | Class F fly ash |
| OPC | Ordinary Portland cement |
| Dsc | Dosage of Na2CO3 |
| Nc | Na2O content |
| LSS | Liquid sodium silicate |
| C-S-H | Calcium silicate hydrate |
| XRD | X-ray diffraction |
| FT-IR | Fourier transform infrared |
| SEM-EDS | Scanning electron microscopy with energy dispersive spectroscopy |
References
- Da, B.; Chen, Y.; Yu, H.; Ma, H.; Chen, D.; Wu, Z.; Liu, J.; Li, Y. Preparation technology, mechanical properties and durability of coral aggregate seawater concrete in the island-reef environment. J. Clean. Prod. 2022, 339, 130572. [Google Scholar] [CrossRef]
- Sun, Z.; Li, Y.; Su, L.; Niu, D.; Luo, D.; He, W.; Xie, S. Investigation of electrical resistivity for fiber-reinforced coral aggregate concrete. Constr. Build. Mater. 2024, 414, 135011. [Google Scholar] [CrossRef]
- Lyu, B.; Wang, A.; Zhang, Z.; Liu, K.; Xu, H.; Shi, L.; Sun, D. Coral aggregate concrete: Numerical description of physical, chemical and morphological properties of coral aggregate. Cem. Concr. Compos. 2019, 100, 25–34. [Google Scholar] [CrossRef]
- Wang, F.; Sun, Y.; Xue, X.; Wang, N.; Zhou, J.; Hua, J. Mechanical properties of modified coral aggregate seawater sea-sand concrete: Experimental study and constitutive model. Case Stud. Constr. Mater. 2023, 18, e02095. [Google Scholar] [CrossRef]
- Wei, J.; Chen, Z.; Liu, J.; Liang, J.; Shi, C. Review on the characteristics and multi-factor model between pore structure with compressive strength of coral aggregate. Constr. Build. Mater. 2023, 370, 130326. [Google Scholar] [CrossRef]
- Li, L.; Jia, N.; Yu, H. Research and development of box stone-filled guardrail with low cost for mountain highway. Highway 2013, 1, 255–259. [Google Scholar]
- van Wyk, P.R.; Croucamp, L. Evaluation of rock types for concrete aggregate suitability for the construction of a gravimeter vault and access road at the Matjiesfontein Geodesy Observatory site near Matjiesfontein, South Africa. J. S. Afr. Inst. Civ. Eng. 2014, 56, 30–36. [Google Scholar]
- Xin, Z. Design of mix proportions for rural cement pavement based on local conditions and materials. Technol. Wind. 2018, 4, 107. [Google Scholar] [CrossRef]
- Application of soil block without burning process and calcium silicate panels as building wall in mountainous area. In Proceedings of the3rd International Conference on Construction and Building Engineering (ICONBUILD), Palembang, Indonesia, 14–17 August 2017; Volume 1903.
- Su, W.; Liu, J.; Liu, L.; Chen, Z.; Zhang, S.; Ruan, H.; Yang, W.; Shi, C. Internal curing of fine coral aggregate in cement mortars with low water-to-cement ratio: Difference in freshwater and seawater. Cem. Concr. Compos. 2024, 150, 105572. [Google Scholar] [CrossRef]
- Wongkvanklom, A.; Posi, P.; Bangsai, C.; Kasemsiri, P.; Foytong, P.; Rukzon, S.; Chindaprasirt, P. Utilization of seawater in high calcium fly ash alkali-activated paste cured at ambient temperature. Adv. Concr. Constr. 2024, 18, 369–378. [Google Scholar] [CrossRef]
- Lao, J.-C.; Huang, B.-T.; Xu, L.-Y.; Khan, M.; Fang, Y.; Dai, J.-G. Seawater sea-sand Engineered Geopolymer Composites (EGC) with high strength and high ductility. Cem. Concr. Compos. 2023, 138, 104998. [Google Scholar] [CrossRef]
- Wei, J.; Xu, J.; Xue, J.; Zhao, J.; Chen, Z. Effect of replacing freshwater river-sand with seawater sea-sand on dynamic compressive mechanical properties of concrete. Constr. Build. Mater. 2024, 419, 135473. [Google Scholar] [CrossRef]
- Ming, Y.; Liang, Q.; Chen, X. Insights on the microstructure and physical properties of coral aggregates at the pore scale: From experiments to numerical simulations. Constr. Build. Mater. 2024, 451, 138711. [Google Scholar] [CrossRef]
- Wang, X.; Wang, A.; Zhang, Z.; Dai, J.-G.; Liu, K.; Chu, Y.; Guan, Y.; Sun, D. Enhancing the performance of alkali-activated material based coral concrete through microbubble aeration clean technology. Compos. Part B Eng. 2023, 252, 110519. [Google Scholar] [CrossRef]
- Özbay, E.; Erdemir, M.; Durmuş, H.İ. Utilization and efficiency of ground granulated blast furnace slag on concrete properties—A review. Constr. Build. Mater. 2016, 105, 423–434. [Google Scholar] [CrossRef]
- Assi, L.N.; Carter, K.; Deaver, E.; Ziehl, P. Review of availability of source materials for geopolymer/sustainable concrete. J. Clean. Prod. 2020, 263, 121477. [Google Scholar] [CrossRef]
- Gruskovnjak, A.; Lothenbach, B.; Winnefeld, F.; Figi, R.; Ko, S.-C.; Adler, M.; Mäder, U. Hydration mechanisms of super sulphated slag cement. Cem. Concr. Res. 2008, 38, 983–992. [Google Scholar] [CrossRef]
- Sakulich, A.R.; Anderson, E.; Schauer, C.L.; Barsoum, M.W. Influence of Si:Al ratio on the microstructural and mechanical properties of a fine-limestone aggregate alkali-activated slag concrete. Mater. Struct. 2009, 43, 1025–1035. [Google Scholar] [CrossRef]
- Haha, M.B.; LE Saout, G.; Winnefeld, F.; Lothenbach, B. Influence of activator type on hydration kinetics, hydrate assemblage and microstructural development of alkali activated blast-furnace slags. Cem. Concr. Res. 2011, 41, 301–310. [Google Scholar] [CrossRef]
- Mohamed, O.A.; Najm, O.; Zuaiter, H.A. Setting time, sulfuric acid resistance, and strength development of alkali-activated mortar with slag & fly ash binders. Results Eng. 2023, 21, 101711. [Google Scholar] [CrossRef]
- Yip, C.K.; Lukey, G.C.; Provis, J.L.; van Deventer, J.S. Effect of calcium silicate sources on geopolymerisation. Cem. Concr. Res. 2008, 38, 554–564. [Google Scholar] [CrossRef]
- van Deventer, J.; Provis, J.; Duxson, P.; Lukey, G. Reaction mechanisms in the geopolymeric conversion of inorganic waste to useful products. J. Hazard. Mater. 2007, 139, 506–513. [Google Scholar] [CrossRef] [PubMed]
- Picker, A.; Nicoleau, L.; Nonat, A.; Labbez, C.; Cölfen, H. Influence of polymers on the nucleation of calcium silicate hydrates. Cem. Concr. Res. 2023, 174, 107329. [Google Scholar] [CrossRef]
- Lothenbach, B.; Nonat, A. Calcium silicate hydrates: Solid and liquid phase composition. Cem. Concr. Res. 2015, 78, 57–70. [Google Scholar] [CrossRef]
- Deschner, F.; Winnefeld, F.; Lothenbach, B.; Seufert, S.; Schwesig, P.; Dittrich, S.; Goetz-Neunhoeffer, F.; Neubauer, J. Hydration of Portland cement with high replacement by siliceous fly ash. Cem. Concr. Res. 2012, 42, 1389–1400. [Google Scholar] [CrossRef]
- Shehata, N.; Mohamed, O.; Sayed, E.T.; Abdelkareem, M.A.; Olabi, A. Geopolymer concrete as green building materials: Recent applications, sustainable development and circular economy potentials. Sci. Total Environ. 2022, 836, 155577. [Google Scholar] [CrossRef]
- Singh, B.; Ishwarya, G.; Gupta, M.; Bhattacharyya, S. Geopolymer concrete: A review of some recent developments. Constr. Build. Mater. 2015, 85, 78–90. [Google Scholar] [CrossRef]
- Yang, B.; Jang, J.G. Environmentally benign production of one-part alkali-activated slag with calcined oyster shell as an activator. Constr. Build. Mater. 2020, 257, 119552. [Google Scholar] [CrossRef]
- Herrmann, A.; Koenig, A.; Dehn, F. Structural concrete based on alkali-activated binders: Terminology, reaction mechanisms, mix designs and performance. Struct. Concr. 2017, 19, 918–929. [Google Scholar] [CrossRef]
- Provis, J.L.; Palomo, A.; Shi, C. Advances in understanding alkali-activated materials. Cem. Concr. Res. 2015, 78, 110–125. [Google Scholar] [CrossRef]
- Juenger, M.; Winnefeld, F.; Provis, J.; Ideker, J. Advances in alternative cementitious binders. Cem. Concr. Res. 2011, 41, 1232–1243. [Google Scholar] [CrossRef]
- Shi, C.; Qu, B.; Provis, J.L. Recent progress in low-carbon binders. Cem. Concr. Res. 2019, 122, 227–250. [Google Scholar] [CrossRef]
- Lemougna, P.N.; Nzeukou, A.; Aziwo, B.; Tchamba, A.; Wang, K.-T.; Melo, U.C.; Cui, X.-M. Effect of slag on the improvement of setting time and compressive strength of low reactive volcanic ash geopolymers synthetized at room temperature. Mater. Chem. Phys. 2020, 239, 122077. [Google Scholar] [CrossRef]
- Xie, T.; Visintin, P.; Zhao, X.; Gravina, R. Mix design and mechanical properties of geopolymer and alkali activated concrete: Review of the state-of-the-art and the development of a new unified approach. Constr. Build. Mater. 2020, 256, 119380. [Google Scholar] [CrossRef]
- Lee, N.; Lee, H. Setting and mechanical properties of alkali-activated fly ash/slag concrete manufactured at room temperature. Constr. Build. Mater. 2013, 47, 1201–1209. [Google Scholar] [CrossRef]
- Bai, T.; Song, Z.-G.; Wu, Y.-G.; Hu, X.-D.; Bai, H. Influence of steel slag on the mechanical properties and curing time of metakaolin geopolymer. Ceram. Int. 2018, 44, 15706–15713. [Google Scholar] [CrossRef]
- Zhu, C.; Wan, Y.; Wang, L.; Ye, Y.; Yu, H.; Yang, J. Strength characteristics and microstructure analysis of alkali-activated slag-fly ash cementitious material. Materials 2022, 15, 6169. [Google Scholar] [CrossRef]
- Tu, W.; Zhang, M. Behaviour of alkali-activated concrete at elevated temperatures: A critical review. Cem. Concr. Compos. 2023, 138, 104961. [Google Scholar] [CrossRef]
- Aziz, I.H.; Abdullah, M.M.A.B.; Heah, C.-Y.; Liew, Y.-M. Behaviour changes of ground granulated blast furnace slag geopolymers at high temperature. Adv. Cem. Res. 2020, 32, 465–475. [Google Scholar] [CrossRef]
- Hassan, A.; Arif, M.; Shariq, M. Mechanical behaviour and microstructural investigation of geopolymer concrete after exposure to elevated temperatures. Arab. J. Sci. Eng. 2019, 45, 3843–3861. [Google Scholar] [CrossRef]
- Aldawsari, S.; Kampmann, R.; Harnisch, J.; Rohde, C. Setting time, microstructure, and durability properties of low calcium fly ash/slag geopolymer: A review. Materials 2022, 15, 876. [Google Scholar] [CrossRef]
- Provis, J.L.; Myers, R.J.; White, C.E.; Rose, V.; van Deventer, J.S. X-ray microtomography shows pore structure and tortuosity in alkali-activated binders. Cem. Concr. Res. 2012, 42, 855–864. [Google Scholar] [CrossRef]
- Ismail, I.; Bernal, S.A.; Provis, J.L.; Nicolas, R.S.; Brice, D.G.; Kilcullen, A.R.; Hamdan, S.; van Deventer, J.S. Influence of fly ash on the water and chloride permeability of alkali-activated slag mortars and concretes. Constr. Build. Mater. 2013, 48, 1187–1201. [Google Scholar] [CrossRef]
- Liu, W.; Liu, X.; Zhang, L.; Wan, Y.; Li, H.; Jiao, X. Rheology, mechanics, microstructure and durability of low-carbon cementitious materials based on circulating fluidized bed fly ash: A comprehensive review. Constr. Build. Mater. 2023, 411, 134688. [Google Scholar] [CrossRef]
- Kupwade-Patil, K.; Allouche, E.N. Examination of chloride-induced corrosion in reinforced geopolymer concretes. J. Mater. Civ. Eng. 2013, 25, 1465–1476. [Google Scholar] [CrossRef]
- Li, L.; Xie, J.; Zhang, B.; Feng, Y.; Yang, J. A state-of-the-art review on the setting behaviours of ground granulated blast furnace slag- and metakaolin-based alkali-activated materials. Constr. Build. Mater. 2023, 368, 130389. [Google Scholar] [CrossRef]
- Cheah, C.B.; Tan, L.E.; Ramli, M. Recent advances in slag-based binder and chemical activators derived from industrial by-products—A review. Constr. Build. Mater. 2021, 272, 121657. [Google Scholar] [CrossRef]
- Adesina, A. Influence of various additives on the early age compressive strength of sodium carbonate activated slag composites: An overview. J. Mech. Behav. Mater. 2020, 29, 106–113. [Google Scholar] [CrossRef]
- Fu, Q.; Bu, M.; Zhang, Z.; Xu, W.; Yuan, Q.; Niu, D. Hydration characteristics and microstructure of alkali-activated slag concrete: A review. Engineering 2023, 20, 162–179. [Google Scholar] [CrossRef]
- Mendes, B.C.; Pedroti, L.G.; Vieira, C.M.F.; Marvila, M.; Azevedo, A.R.; de Carvalho, J.M.F.; Ribeiro, J.C.L. Application of eco-friendly alternative activators in alkali-activated materials: A review. J. Build. Eng. 2021, 35, 102010. [Google Scholar] [CrossRef]
- Provis, J.L. Alkali-activated materials. Cem. Concr. Res. 2018, 114, 40–48. [Google Scholar] [CrossRef]
- Caijun, S.; Krivenko, P.V.; Della, R. Alkali-Activated Cements and Concretes; Chemical Industry Press: Beijing, China, 2008. [Google Scholar]
- Živica, V. Effects of type and dosage of alkaline activator and temperature on the properties of alkali-activated slag mixtures. Constr. Build. Mater. 2007, 21, 1463–1469. [Google Scholar] [CrossRef]
- Yuan, B.; Yu, Q.; Brouwers, H. Reaction kinetics, reaction products and compressive strength of ternary activators activated slag designed by Taguchi method. Mater. Des. 2015, 86, 878–886. [Google Scholar] [CrossRef]
- Li, N.; Shi, C.; Zhang, Z. Understanding the roles of activators towards setting and hardening control of alkali-activated slag cement. Compos. Part B Eng. 2019, 171, 34–45. [Google Scholar] [CrossRef]
- Jiao, Z.; Wang, Y.; Zheng, W.; Huang, W. Effect of dosage of sodium carbonate on the strength and drying shrinkage of sodium hydroxide based alkali-activated slag paste. Constr. Build. Mater. 2018, 179, 11–24. [Google Scholar] [CrossRef]
- Jiao, Z.Z. Study on Basic Mechanical Properties of Alkali-Activated Slag Cementitious Material Block Masonry; Harbin Institute of Technology: Harbin, China, 2019. (In Chinese) [Google Scholar]
- Atiş, C.D.; Bilim, C.; Çelik, Ö.; Karahan, O. Influence of activator on the strength and drying shrinkage of alkali-activated slag mortar. Constr. Build. Mater. 2009, 23, 548–555. [Google Scholar] [CrossRef]
- Jiang, T.; Liu, Z.; Tian, X.; Wu, J.; Wang, L. Review on the impact of metakaolin-based geopolymer’s reaction chemistry, nanostructure and factors on its properties. Constr. Build. Mater. 2024, 412, 134760. [Google Scholar] [CrossRef]
- Fernández-Jiménez, A.; Puertas, F.; Sobrados, I.; Sanz, J. Structure of calcium silicate hydrates formed in alkaline-activated slag: Influence of the type of alkaline activator. J. Am. Ceram. Soc. 2003, 86, 1389–1394. [Google Scholar] [CrossRef]
- Akturk, B.; Nayak, S.; Das, S.; Kizilkanat, A.B. Microstructure and strength development of sodium carbonate-activated blast furnace slags. J. Mater. Civ. Eng. 2019, 31, 04019283. [Google Scholar] [CrossRef]
- Abdalqader, A.F.; Jin, F.; Al-Tabbaa, A. Development of greener alkali-activated cement: Utilisation of sodium carbonate for activating slag and fly ash mixtures. J. Clean. Prod. 2016, 113, 66–75. [Google Scholar] [CrossRef]
- Bernal, S.A.; Provis, J.L.; Myers, R.J.; San Nicolas, R.S.; Van Deventer, J.S.J. Role of carbonates in the chemical evolution of sodium carbonate-activated slag binders. Mater. Struct. 2015, 48, 517–529. [Google Scholar] [CrossRef]
- Kovtun, M.; Kearsley, E.P.; Shekhovtsova, J. Chemical acceleration of a neutral granulated blast-furnace slag activated by sodium carbonate. Cem. Concr. Res. 2015, 72, 1–9. [Google Scholar] [CrossRef]
- Stefanini, L.; Walkley, B.; Provis, J.L. Basic oxygen furnace (BOF) slag as an additive in sodium carbonate-activated slag cements. Mater. Struct. 2024, 57, 1–14. [Google Scholar] [CrossRef]
- Cai, R.; Ye, H. Clinkerless ultra-high strength concrete based on alkali-activated slag at high temperatures. Cem. Concr. Res. 2021, 145, 106465. [Google Scholar] [CrossRef]
- Dai, X.; Ren, Q.; Aydin, S.; Yardimci, M.Y.; De Schutter, G. Accelerating the reaction process of sodium carbonate-activated slag mixtures with the incorporation of a small addition of sodium hydroxide/sodium silicate. Cem. Concr. Compos. 2023, 141, 105118. [Google Scholar] [CrossRef]
- Li, Y.; Sun, Y. Preliminary study on combined-alkali–slag paste materials. Cem. Concr. Res. 2000, 30, 963–966. [Google Scholar] [CrossRef]
- Lin, J.; He, Y.Q.; Ma, F.D. Effect of feldspar’s particle size distribution on flat glass melting. Glass Enamel 1999, 27, 21–24+35. [Google Scholar]
- Hu, Y. Mechanical and High Temperature Resistance Properties of Fly Ash Geopolymer; China University of Mining and Technology: Xuzhou, China, 2017. (In Chinese) [Google Scholar]
- GB/T 18046-2017; Ground Granulated Blast Furnace Slag Used for Cement, Mortar and Concrete. Standards Press of China: Beijing, China, 2017.
- GB/T 19587-2017; Determination of the Specific Surface Area of Solids by Gas Adsorption Using the BET Method. Standards Press of China: Beijing, China, 2017.
- He, Z. The Preparation and High Temperature Performance Research of Alkali Slag Base Geopolymer Materials; Guangxi University: Nanning, China, 2016. (In Chinese) [Google Scholar]
- JGJ/T 70-2009; Standard for Test Method of Basic Properties of Construction Mortar. China Architecture & Building Press: Beijing, China, 2009.
- Ravikumar, D.; Neithalath, N. Effects of activator characteristics on the reaction product formation in slag binders activated using alkali silicate powder and NaOH. Cem. Concr. Compos. 2012, 34, 809–818. [Google Scholar] [CrossRef]
- Huang, W.; Wang, Y.; Zhang, Y.; Zheng, W. Experimental study of high-temperature resistance of alkali-activated slag crushed aggregate mortar. J. Mater. Res. Technol. 2023, 23, 3961–3973. [Google Scholar] [CrossRef]
- Li, D.; Zheng, W.; Wang, Y. Preparation and properties of alkali-activated slag-like powder paste. J. Mater. Res. Technol. 2025, 35, 611–627. [Google Scholar] [CrossRef]
- Sun, B.; Ye, G.; de Schutter, G. A review: Reaction mechanism and strength of slag and fly ash-based alkali-activated materials. Constr. Build. Mater. 2022, 326, 126843. [Google Scholar] [CrossRef]
- Gruskovnjak, A.; Lothenbach, B.; Holzer, L.; Figi, R.; Winnefeld, F. Hydration of alkali-activated slag: Comparison with ordinary Portland cement. Adv. Cem. Res. 2006, 18, 119–128. [Google Scholar] [CrossRef]
- Zhu, Z.; Gao, Y.; Liu, J.; Li, Y.; Li, Z.; Zhu, J. Strength enhancement mechanism of slaked lime on one-part AAM prepared from sodium carbonate-activated slag. J. Mater. Civ. Eng. 2024, 36, 04024343. [Google Scholar] [CrossRef]
- Huang, W. Experiment and Analysis of High Temperature Mechanical Properties of Alkali-Activated Slag Concrete Block Masonry; Harbin Institute of Technology: Harbin, China, 2023. (In Chinese) [Google Scholar]
- Gebregziabiher, B.S.; Thomas, R.J.; Peethamparan, S. Temperature and activator effect on early-age reaction kinetics of alkali-activated slag binders. Constr. Build. Mater. 2016, 113, 783–793. [Google Scholar] [CrossRef]
- Chindaprasirt, P.; Phoo-Ngernkham, T.; Hanjitsuwan, S.; Horpibulsuk, S.; Poowancum, A.; Injorhor, B. Effect of calcium-rich compounds on setting time and strength development of alkali-activated fly ash cured at ambient temperature. Case Stud. Constr. Mater. 2018, 9, e00198. [Google Scholar] [CrossRef]
- Xiao, Y.; Aiyu, H. Analysis of the stimulation effect of sodium hydroxide and sodium silicate on slag activity. Zhejiang Constr. 2012, 29, 48–51. [Google Scholar] [CrossRef]
- Barzgar, S.; Tarik, M.; Ludwig, C.; Lothenbach, B. The effect of equilibration time on Al uptake in C-S-H. Cem. Concr. Res. 2021, 144, 106438. [Google Scholar] [CrossRef]
- Rodriguez, E.T.; Garbev, K.; Merz, D.; Black, L.; Richardson, I.G. Thermal stability of C-S-H phases and applicability of Richardson and Groves’ and Richardson C-(A)-S-H(I) models to synthetic C-S-H. Cem. Concr. Res. 2017, 93, 45–56. [Google Scholar] [CrossRef]
- Aydın, S.; Baradan, B. Effect of activator type and content on properties of alkali-activated slag mortars. Compos. Part B Eng. 2014, 57, 166–172. [Google Scholar] [CrossRef]
- Kim, T.; Olek, J. Chemical sequence and kinetics of alkali-silica reaction Part I. Experiments. J. Am. Ceram. Soc. 2014, 97, 2195–2203. [Google Scholar] [CrossRef]
- Xue, L.; Zhang, Z.; Wang, H. Early hydration kinetics and microstructure development of hybrid alkali activated cements (HAACs) at room temperature. Cem. Concr. Compos. 2021, 123, 104200. [Google Scholar] [CrossRef]
- Liao, X.; Gu, J. The relations between the alkali (sodium silicate) in basicity-slag cement and the strength. J. Shandong Build. Mater. Ind. Coll. 1990, 4, 5–11. [Google Scholar] [CrossRef]
- Yu, S.; Wang, W. Hardening mechanism of clinker-free sodium silicate slag cement. J. Chin. Ceram. Soc. 1990, 18, 104–109. [Google Scholar] [CrossRef]
- Qin, L. Study on the Structural Characteristics of Gel Products of Alkali-Activated Binders; Hunan University: Changsha, China, 2019. (In Chinese) [Google Scholar]
- Hou, X.; Kirkpatrick, R.J.; Struble, L.J.; Monteiro, P.J.M. Structural investigations of alkali silicate gels. J. Am. Ceram. Soc. 2005, 88, 943–949. [Google Scholar] [CrossRef]
- Dong, S. Study on Preparation, Performance and Mechanism of Alkali-Activated Cementitious Material Prepared from Coal-Based Synthetic Natural gas Slag; Dalian University of Technology: Dalian, China, 2022. (In Chinese) [Google Scholar]
- Bai, T.; Song, Z.; Wang, H.; Wu, Y.; Huang, W. Performance evaluation of metakaolin geopolymer modified by different solid wastes. J. Clean. Prod. 2019, 226, 114–121. [Google Scholar] [CrossRef]
- Shi, C.; Yuan, Q. Testing and Analysis Methods for Cement-Based Materials; China Construction Industry Press: Beijing, China, 2018. [Google Scholar]
- Cao, R. Reaction Mechanism and Microstructure Characteristic of Alkali-Activated Cements Incorporating Ferronickel Slag; Southeast University: Nanjing, China, 2021. (In Chinese) [Google Scholar]
- Lodeiro, I.G.; Macphee, D.; Palomo, A.; Fernández-Jiménez, A. Effect of alkalis on fresh C–S–H gels. FTIR analysis. Cem. Concr. Res. 2009, 39, 147–153. [Google Scholar] [CrossRef]
- Mollah, M.Y.A.; Yu, W.; Schennach, R.; Cocke, D.L. A Fourier transform infrared spectroscopic investigation of the early hydration of Portland cement and the influence of sodium lignosulfonate. Cem. Concr. Res. 2000, 30, 267–273. [Google Scholar] [CrossRef]
- Bo, F. Research on Properties of Alkali Slag Concrete Subjected to Elevated Temperatures; Chongqing University: Chongqing, China, 2014. (In Chinese) [Google Scholar]
- Wang, G.; Ye, Z.; Sun, T.; Mo, Z.; Wang, Z.; Ouyang, G.; He, J.; Deng, Y. Comparison of curing conditions on physical properties, mechanical strength development, and pore structures of phosphogypsum-based cold-bonded aggregates. Materials 2024, 17, 4971. [Google Scholar] [CrossRef]
- Martinez-Ramirez, S. Influence of SO2 deposition on cement mortar hydration. Cem. Concr. Res. 1999, 29, 107–111. [Google Scholar] [CrossRef]
- Torres-Carrasco, M.; del Campo, A.; de la Rubia, M.; Reyes, E.; Moragues, A.; Fernández, J. New insights in weathering analysis of anhydrous cements by using high spectral and spatial resolution Confocal Raman Microscopy. Cem. Concr. Res. 2017, 100, 119–128. [Google Scholar] [CrossRef]
- Allahverdi, A.; Pilehvar, S.; Mahinroosta, M. Influence of curing conditions on the mechanical and physical properties of chemically-activated phosphorous slag cement. Powder Technol. 2016, 288, 132–139. [Google Scholar] [CrossRef]
- García-Lodeiro, I.; Fernández-Jiménez, A.; Blanco, M.T.; Palomo, A. FTIR study of the sol–gel synthesis of cementitious gels: C–S–H and N–A–S–H. J. Sol-Gel Sci. Technol. 2007, 45, 63–72. [Google Scholar] [CrossRef]
- Yu, G.; Zhu, Z. Infrared spectra of quartz formed at different temperatures. Jilin Geol. 1984, 2, 79–81. [Google Scholar]
- Peng, W.; Liu, G. Mineral Infrared Spectroscopy Atlas; Science Press: Beijing, China, 1982. [Google Scholar]
- Abo-El-Enein, S.; Heikal, M.; Amin, M.; Negm, H. Reactivity of dealuminated kaolin and burnt kaolin using cement kiln dust or hydrated lime as activators. Constr. Build. Mater. 2013, 47, 1451–1460. [Google Scholar] [CrossRef]
- Gao, X.; Yu, Q.; Brouwers, H. Properties of alkali activated slag–fly ash blends with limestone addition. Cem. Concr. Compos. 2015, 59, 119–128. [Google Scholar] [CrossRef]
- Saloni; Parveen; Lim, Y.Y.; Pham, T.M. Influence of Portland cement on performance of fine rice husk ash geopolymer concrete: Strength and permeability properties. Constr. Build. Mater. 2021, 300, 124321. [Google Scholar] [CrossRef]
- Chen, J.J.; Thomas, J.J.; Taylor, H.F.; Jennings, H.M. Solubility and structure of calcium silicate hydrate. Cem. Concr. Res. 2004, 34, 1499–1519. [Google Scholar] [CrossRef]
- Zhang, Z.W.; Liu, Z.T.; Li, G.X. Decalcification behavior of calcium silicate hydrate with different Ca/Si ratios. J. Chin. Ceram. Soc. 2023, 51, 2924–2930. [Google Scholar] [CrossRef]
- Qian, H.; Zhang, G.; Yang, J.; Ding, Q.; Geng, C.; Hua, S. Study on effect of curing regimes on ultra-high-performance concrete by nuclear magnetic resonance spectroscopy. ACI Mater. J. 2024, 121, 115–126. [Google Scholar] [CrossRef]
- L’Hôpital, E.; Lothenbach, B.; Scrivener, K.; Kulik, D. Alkali uptake in calcium alumina silicate hydrate (C-A-S-H). Cem. Concr. Res. 2016, 85, 122–136. [Google Scholar] [CrossRef]
- Sinha, A.; Wei, J. Influences of composition and reaction conditions on molecular structure, hygroscopicity, and swelling behavior of alkali-silica reaction gels. Cem. Concr. Compos. 2024, 150, 105537. [Google Scholar] [CrossRef]
- Labbez, C.; Pochard, I.; Jönsson, B.; Nonat, A. C-S-H/solution interface: Experimental and Monte Carlo studies. Cem. Concr. Res. 2011, 41, 161–168. [Google Scholar] [CrossRef]
- Labbez, C.; Jönsson, B.; Pochard, I.; Nonat, A.; Cabane, B. Surface charge density and electrokinetic potential of highly charged minerals: Experiments and Monte Carlo simulations on calcium silicate hydrate. J. Phys. Chem. B 2006, 110, 9219–9230. [Google Scholar] [CrossRef] [PubMed]
- L’hôpital, E.; Lothenbach, B.; Le Saout, G.; Kulik, D.; Scrivener, K. Incorporation of aluminium in calcium-silicate-hydrates. Cem. Concr. Res. 2015, 75, 91–103. [Google Scholar] [CrossRef]
- Yan, Y.; Yang, S.-Y.; Miron, G.D.; Collings, I.E.; L’Hôpital, E.; Skibsted, J.; Winnefeld, F.; Scrivener, K.; Lothenbach, B. Effect of alkali hydroxide on calcium silicate hydrate (C-S-H). Cem. Concr. Res. 2022, 151, 106636. [Google Scholar] [CrossRef]
- Hong, S.-Y.; Glasser, F. Alkali binding in cement pastes Part I. The C-S-H phase. Cem. Concr. Res. 1999, 29, 1893–1903. [Google Scholar] [CrossRef]
- Keren, Z.; Lou, C.; Jin, Z. Pozzolanic reaction of soda-lime glass and its influences on composition of calcium silicate hydrate. J. Chin. Ceram. Soc. 2016, 44, 202–210. [Google Scholar] [CrossRef]
- Feng, X.X.; Feng, N.Q. Investigation of the binding forms of the alkalis in C-S-H. J. Build. Mater. 2004, 7, 1–7. [Google Scholar]
- Li, J.; Geng, G.; Myers, R.; Yu, Y.-S.; Shapiro, D.; Carraro, C.; Maboudian, R.; Monteiro, P.J. The chemistry and structure of calcium (alumino) silicate hydrate: A study by XANES, ptychographic imaging, and wide- and small-angle scattering. Cem. Concr. Res. 2019, 115, 367–378. [Google Scholar] [CrossRef]
- Thomas, J.J.; Jennings, H.M.; Allen, A.J. Relationships between composition and density of tobermorite, jennite, and nanoscale CaO-SiO2-H2O. J. Phys. Chem. C 2010, 114, 7594–7601. [Google Scholar] [CrossRef]


| Ca/Si Ratio | Siliceous Sand (g) | Ground Calcium Carbonate Powder (g) |
|---|---|---|
| 1.25 | 1000 | 1915 |
| 1.0 | 1000 | 1531 |
| 0.75 | 1000 | 1148 |
| 0.5 | 1000 | 764 |
| 0.25 | 1000 | 381 |
| Expected Ca/Si Ratio | CaO (%) | SiO2 (%) | Al2O3 (%) | Actual Ca/Si Ratio |
|---|---|---|---|---|
| 1.25 | 52.41 | 44.63 | 1.01 | 1.258 |
| 1.0 | 46.77 | 50.47 | 1.08 | 0.993 |
| 0.75 | 39.78 | 57.06 | 1.13 | 0.747 |
| 0.5 | 31.10 | 65.84 | 1.16 | 0.506 |
| 0.25 | 18.66 | 78.39 | 1.20 | 0.255 |
| Mix | SP | Na2CO3 | NaOH | Water |
|---|---|---|---|---|
| C0N10-2 | 1414.9 | 0.0 | 38.0 | 487.0 |
| C0N10-4 * | 1414.9 | 0.0 | 76.1 | 478.8 |
| C0N10-6 * | 1414.9 | 0.0 | 114.1 | 470.6 |
| C0N10-8 * | 1414.9 | 0.0 | 152.1 | 462.4 |
| C2N8-2 | 1414.9 | 7.7 | 32.0 | 488.3 |
| C2N8-4 * | 1414.9 | 15.4 | 64.0 | 481.4 |
| C2N8-6 * | 1414.9 | 23.0 | 96.0 | 474.5 |
| C2N8-8 * | 1414.9 | 30.7 | 128.0 | 467.6 |
| C8N2-2 | 1414.9 | 36.3 | 9.5 | 493.2 |
| C8N2-4 * | 1414.9 | 72.7 | 18.9 | 491.1 |
| C8N2-6 * | 1414.9 | 109.0 | 28.4 | 489.1 |
| C8N2-8 * | 1414.9 | 145.4 | 37.9 | 487.0 |
| C10N0-2 | 1414.9 | 48.4 | 0.0 | 495.2 |
| C10N0-4 * | 1414.9 | 96.8 | 0.0 | 495.2 |
| C10N0-6 * | 1414.9 | 145.1 | 0.0 | 495.2 |
| C10N0-8 * | 1414.9 | 193.5 | 0.0 | 495.2 |
| Paste | 3d | 7d | 28d |
|---|---|---|---|
| AASP materials | 7–29% | 13–52% | 69–83% |
| AAS materials [62] | 3–19% | 26–87% | 91–99% |
| LSS-activated SP materials [78] | 16–47% | 28–76% | 72–95% |
| OPC paste [78] | 42% | 68% | 78% |
| Dsc | 3d | 7d |
|---|---|---|
| 0% | 12–29% | 23–52% |
| 20% | 11–23% | 19–40% |
| 80% | 8–18% | 15–35% |
| 100% | 7–18% | 13–32% |
| Spot | Atomic Ratio | Phase Identification |
|---|---|---|
| 1 | Ca/Si = 1.44, Na/Si = 0.02 | C-S-H gel |
| 2 | Ca/Si = 11.28, O/Ca = 2.11 | Portlandite |
| 3 | Ca/Si = 1.39, Na/Si = 0.07 | C-S-H gel |
| 4 | Ca/Si = 1.33, Na/Si = 0.10 | C-S-H gel |
| 5 | Ca/Si = 1.42, Na/Si = 0.05 | C-S-H gel |
| 6 | Ca/Si = 1.35, Na/Si = 0.09 | C-S-H gel |
| Spot | Atomic Ratio | Phase Identification |
|---|---|---|
| 1 | Ca/Si = 0.94, Na/Si = 0.19 | C-S-H gel |
| 2 | Ca/Si = 0.89, Na/Si = 0.22 | C-S-H gel |
| 3 | Ca/Si = 0.83, Na/Si = 0.29 | C-S-H gel |
| 4 | Na/Ca = 2.30, O/Ca = 5.06 | Gaylussite |
| 5 | Ca/Si = 0.92, Na/Si = 0.21 | C-S-H gel |
| 6 | Ca/Si = 0.98, O/Ca = 2.40 | Wollastonite |
| 7 | Ca/Si = 0.87, Na/Si = 0.28 | C-S-H gel |
| 8 | Ca/Si = 5.86, O/Ca = 3.56 | Calcite |
| Spot | Atomic Ratio | Phase Identification |
|---|---|---|
| 1 | Ca/Si = 0.45, Na/Si = 0.39 | C-S-H gel |
| 2 | Na/Ca = 1.83, O/Ca = 6.28 | Gaylussite |
| 3 | Ca/Si = 0.38, Na/Si = 0.43 | C-S-H gel |
| 4 | Ca/Si = 0.01, O/Si = 1.98 | Quartz |
| 5 | Ca/Si = 0.30, Na/Si = 0.48 | C-S-H gel |
| 6 | Ca/Si = 0.44, Na/Si = 0.42 | C-S-H gel |
| 7 | Na/Si = 0.62, O/Si = 3.18 | Silica-rich gel |
| 8 | Ca/Si = 0.34, Na/Si = 0.45 | C-S-H gel |
| Spot | Atomic Ratio | Phase Identification |
|---|---|---|
| 1 | Ca/Si = 1.79, Na/Si = 0.06 | C-S-H gel |
| 2 | Ca/Al = 4.00, S/Al = 1.42 | Ettringite |
| Activator Type | LSS | Na2CO3 and NaOH | NaOH | OPC | |
|---|---|---|---|---|---|
| 1.25 | Ca/Si | 1.24–1.28 | 1.33–1.42 | 1.44 | Ca/Si = 1.79 Na/Si = 0.06 |
| Na/Si | 0.11–0.16 | 0.05–0.10 | 0.02 | ||
| 0.75 | Ca/Si | 0.71–0.80 | 0.83–0.92 | 0.94 | |
| Na/Si | 0.31–0.38 | 0.21–0.29 | 0.19 | ||
| 0.25 | Ca/Si | 0.22–0.28 | 0.30–0.44 | 0.45 | |
| Na/Si | 0.51–0.59 | 0.42–0.48 | 0.39 | ||
Disclaimer/Publisher’s Note: The statements, opinions and data contained in all publications are solely those of the individual author(s) and contributor(s) and not of MDPI and/or the editor(s). MDPI and/or the editor(s) disclaim responsibility for any injury to people or property resulting from any ideas, methods, instructions or products referred to in the content. |
© 2025 by the authors. Licensee MDPI, Basel, Switzerland. This article is an open access article distributed under the terms and conditions of the Creative Commons Attribution (CC BY) license (https://creativecommons.org/licenses/by/4.0/).
Share and Cite
Li, D.; Zheng, W.; Wang, Y. Strength Development and Microscopic Characterization of Slag-like Powder Materials Activated by Sodium Carbonate and Sodium Hydroxide. Materials 2025, 18, 2313. https://doi.org/10.3390/ma18102313
Li D, Zheng W, Wang Y. Strength Development and Microscopic Characterization of Slag-like Powder Materials Activated by Sodium Carbonate and Sodium Hydroxide. Materials. 2025; 18(10):2313. https://doi.org/10.3390/ma18102313
Chicago/Turabian StyleLi, Donghui, Wenzhong Zheng, and Ying Wang. 2025. "Strength Development and Microscopic Characterization of Slag-like Powder Materials Activated by Sodium Carbonate and Sodium Hydroxide" Materials 18, no. 10: 2313. https://doi.org/10.3390/ma18102313
APA StyleLi, D., Zheng, W., & Wang, Y. (2025). Strength Development and Microscopic Characterization of Slag-like Powder Materials Activated by Sodium Carbonate and Sodium Hydroxide. Materials, 18(10), 2313. https://doi.org/10.3390/ma18102313